Flutter Entertainment plc · NYSE:FLUT
Flutter Entertainment — Betfair Group — FY2013 Earnings Presentation
28 slides from Flutter Entertainment's earnings presentation, Jun 27, 2013
Slide 1: FY13 Preliminary Results
FY13 PRELIMINARY RESULTS 27 June 2013
Slide 2: Overview
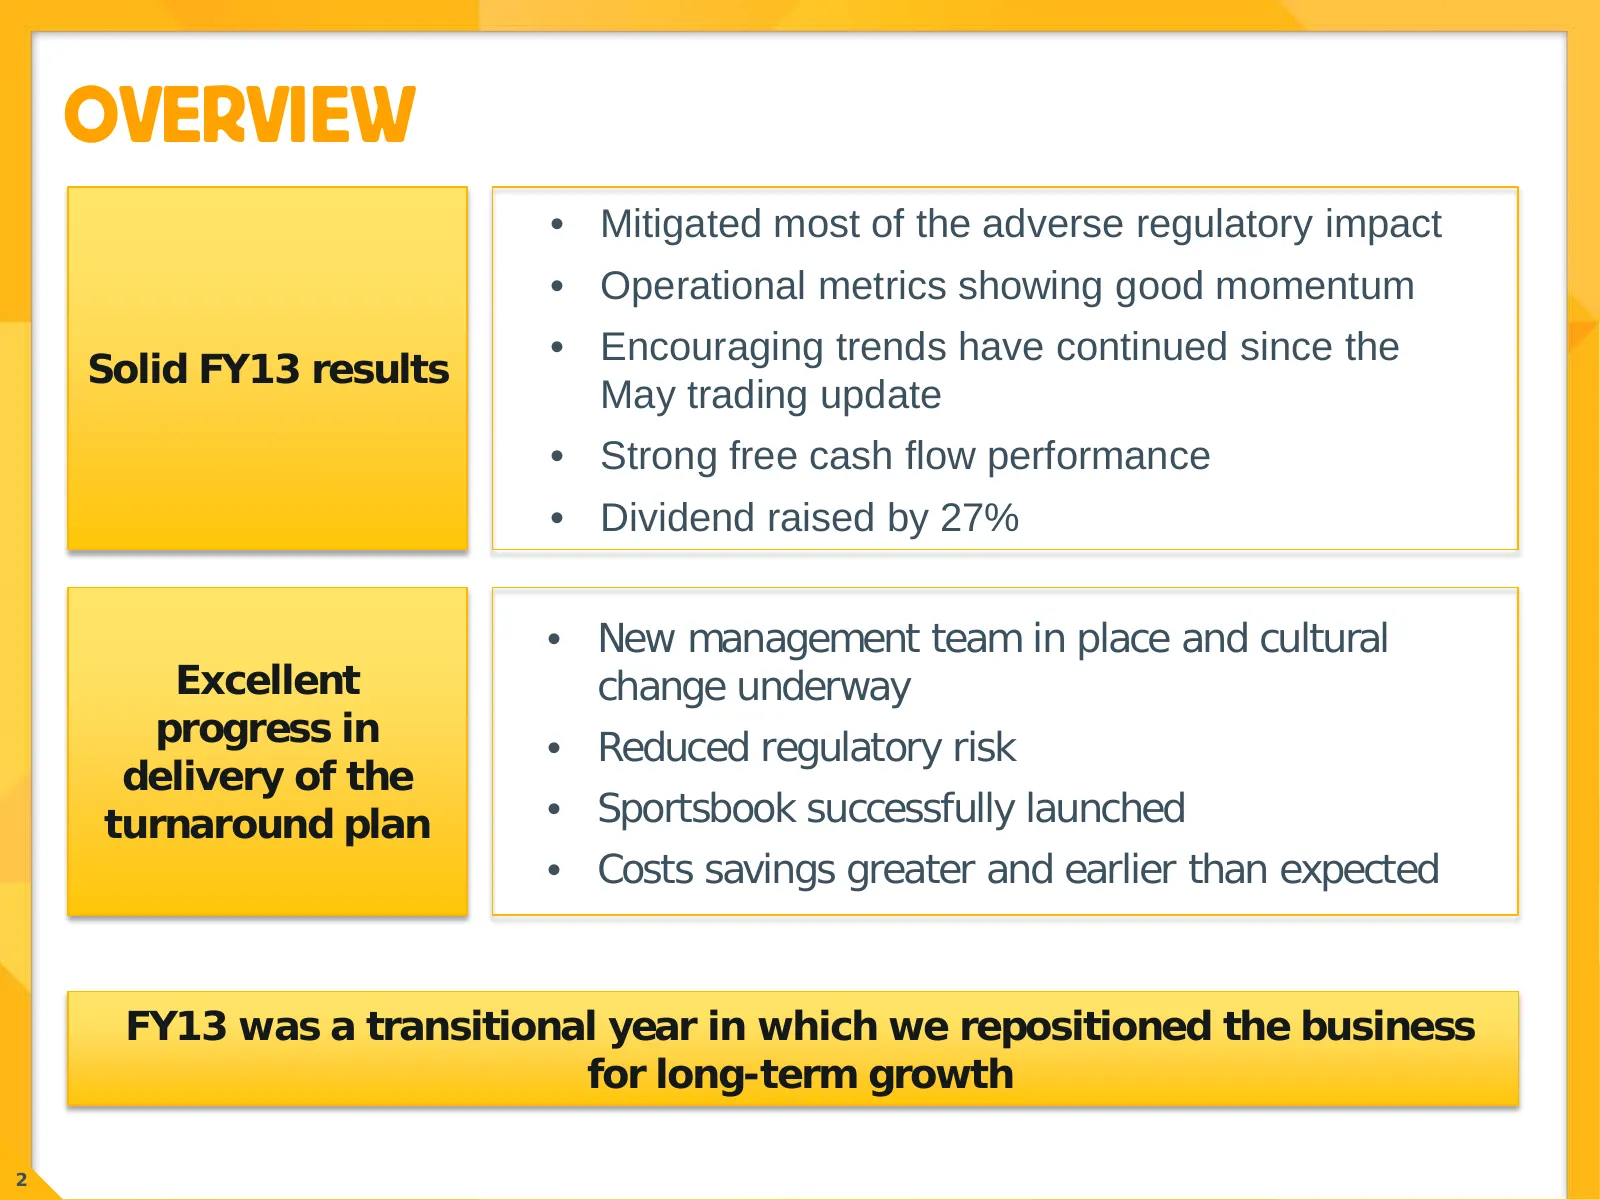
OVERVIEW • Mitigated most of the adverse regulatory impact • Operational metrics showing good momentum • Encouraging trends have continued since the Solid FY13 results May trading update • Strong free cash flow performance • Dividend raised by 27% • New management team in place and cultural Excellen

Slide 3: Financial Results
FINANCIAL RESULTS a* betfair
Slide 4: Underlying Group P&L
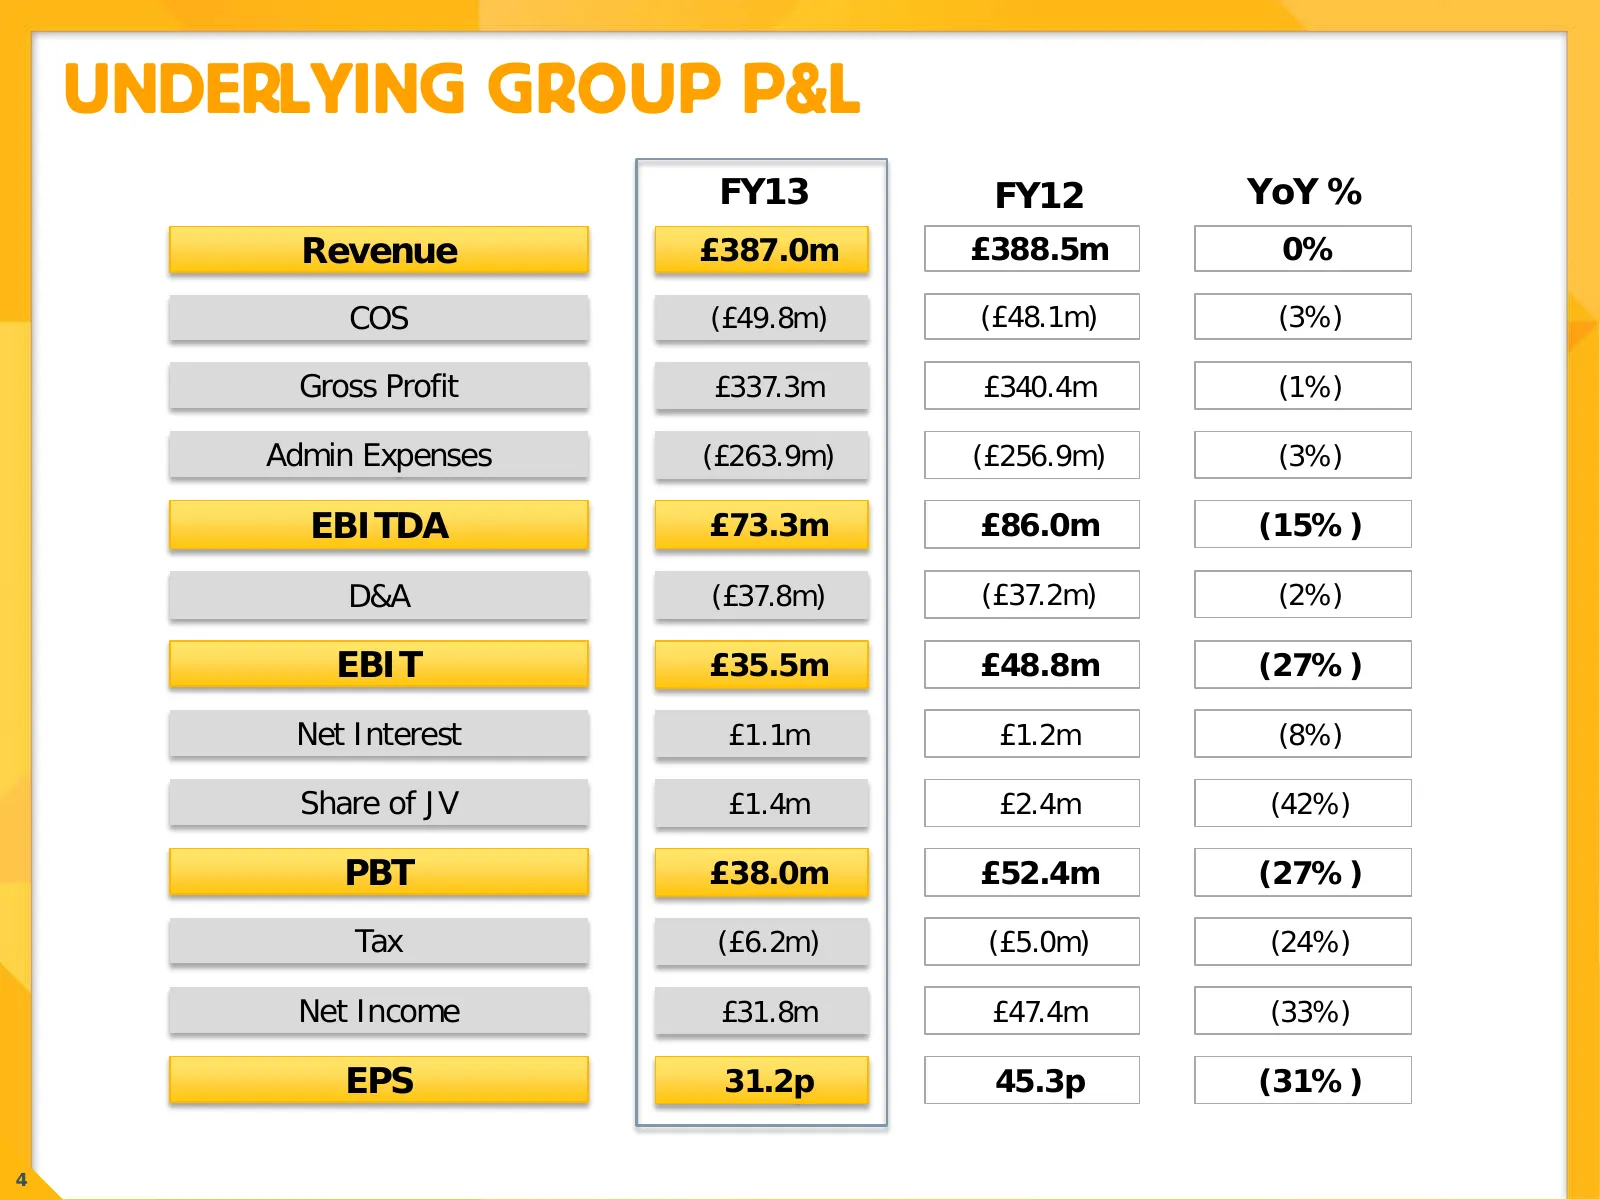
UNDERLYING GROUP P&L FY13 FY12 YoY % Revenue £387.0m £388.5m 0% COS (£49.8m) (£48.1m) (3%) Gross Profit £337.3m £340.4m (1%) Admin Expenses (£263.9m) (£256.9m) (3%) EBITDA £73.3m £86.0m (15%) D&A (£37.8m) (£37.2m) (2%) EBIT £35.5m £48.8m (27%) Net Interest £1.1m £1.2m (8%) Share of JV £1.4m £2.4m (4
Slide 5: Reported to Underlying Reconciliation
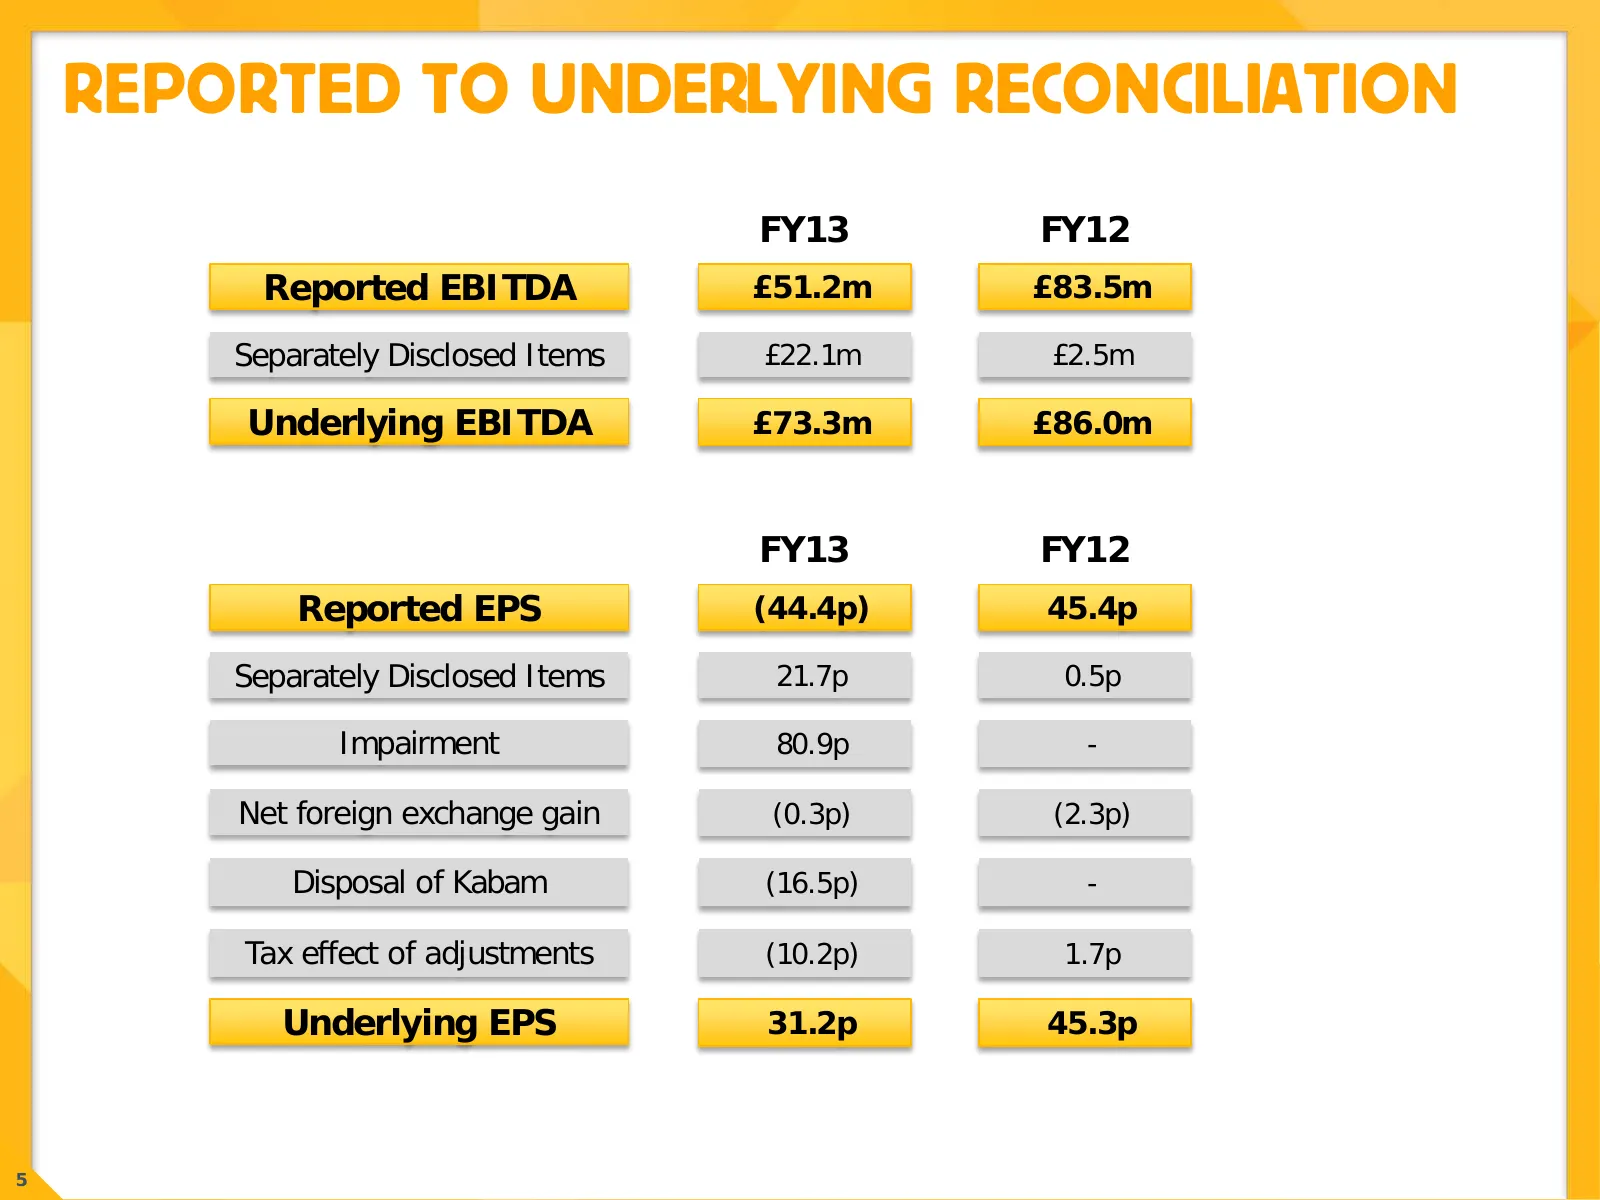
REPORTED TO UNDERLYING RECONCILIATION FY13 FY12 Reported EBITDA £51.2m £83.5m Separately Disclosed Items £22.1m £2.5m Underlying EBITDA £73.3m £86.0m FY13 FY12 Reported EPS (44.4p) 45.4p Separately Disclosed Items 21.7p 0.5p Impairment 80.9p - Net foreign exchange gain (0.3p) (2.3p) Disposal of Kaba
Slide 6: Revenue
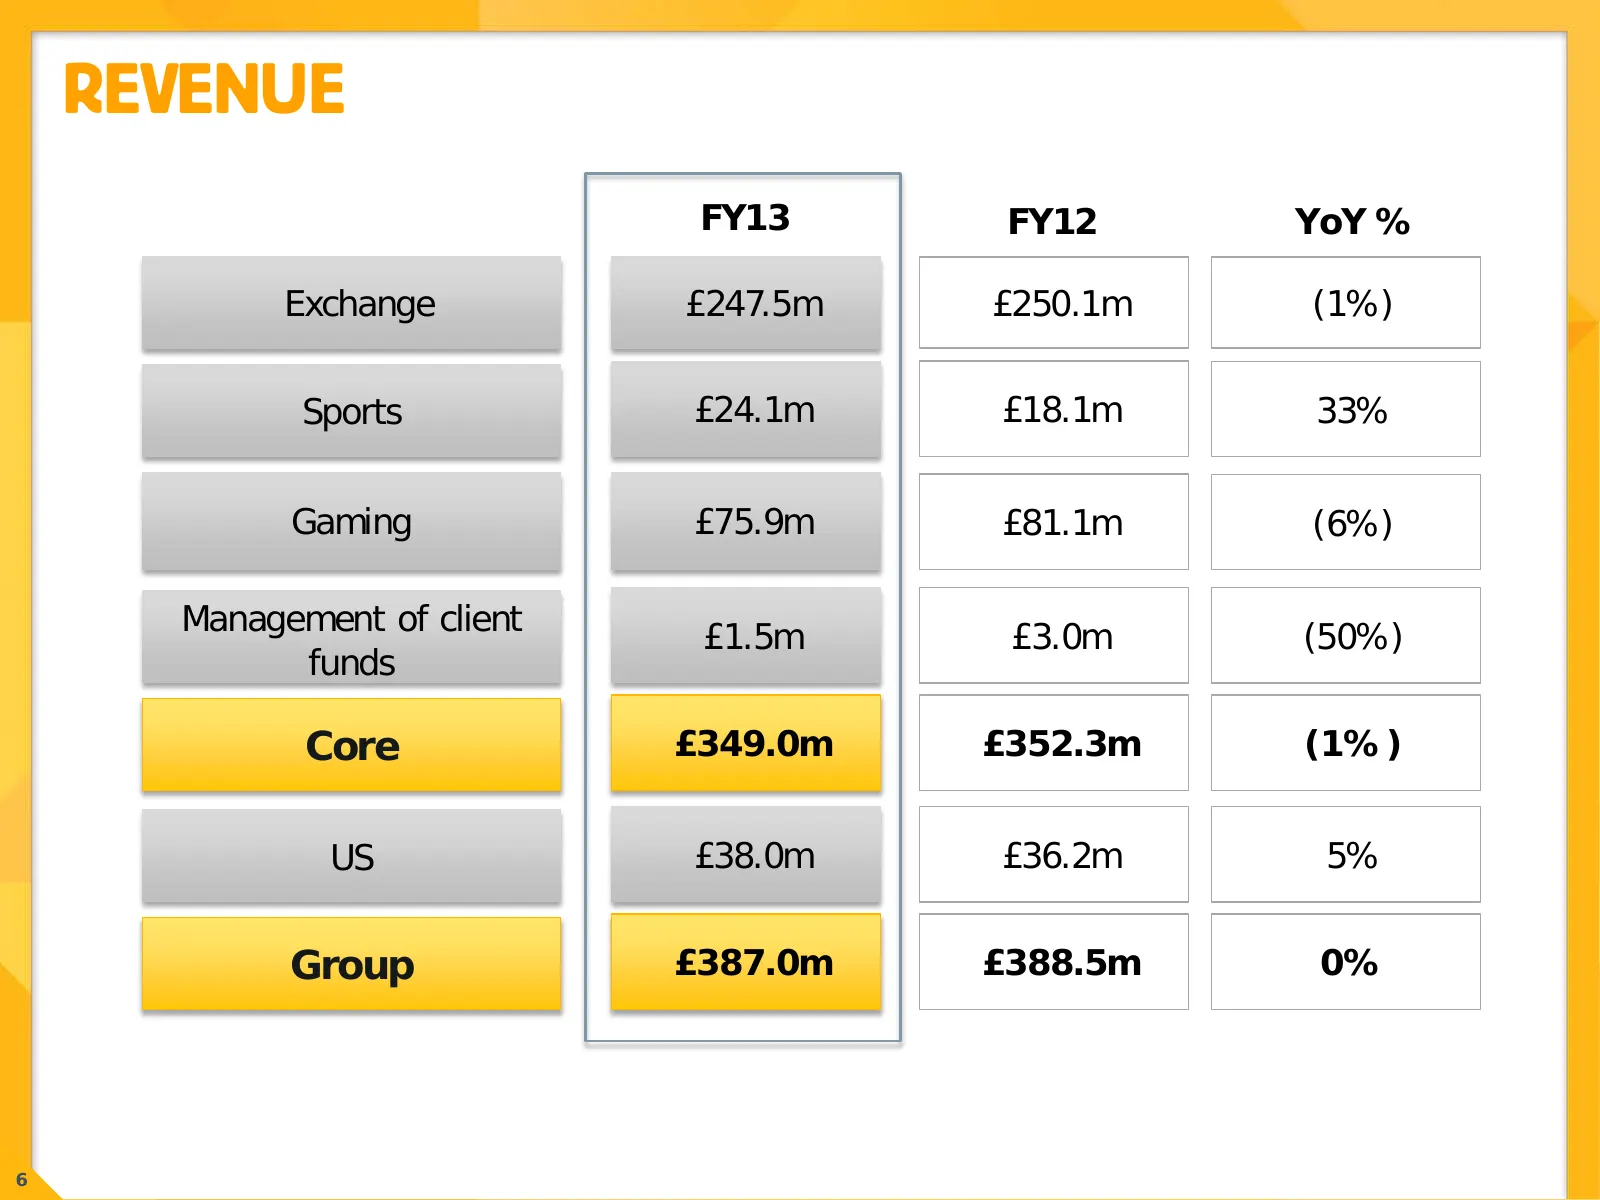
REVENUE FY13 FY12 YoY % Exchange £247.5m £250.1m (1%) Sports £24.1m £18.1m 33% Gaming £75.9m £81.1m (6%) Management of client £1.5m £3.0m (50%) funds Core £349.0m £352.3m (1%) US £38.0m £36.2m 5% Group £387.0m £388.5m 0% 6
Slide 7: FY13 Underlying Revenue Growth of 6%
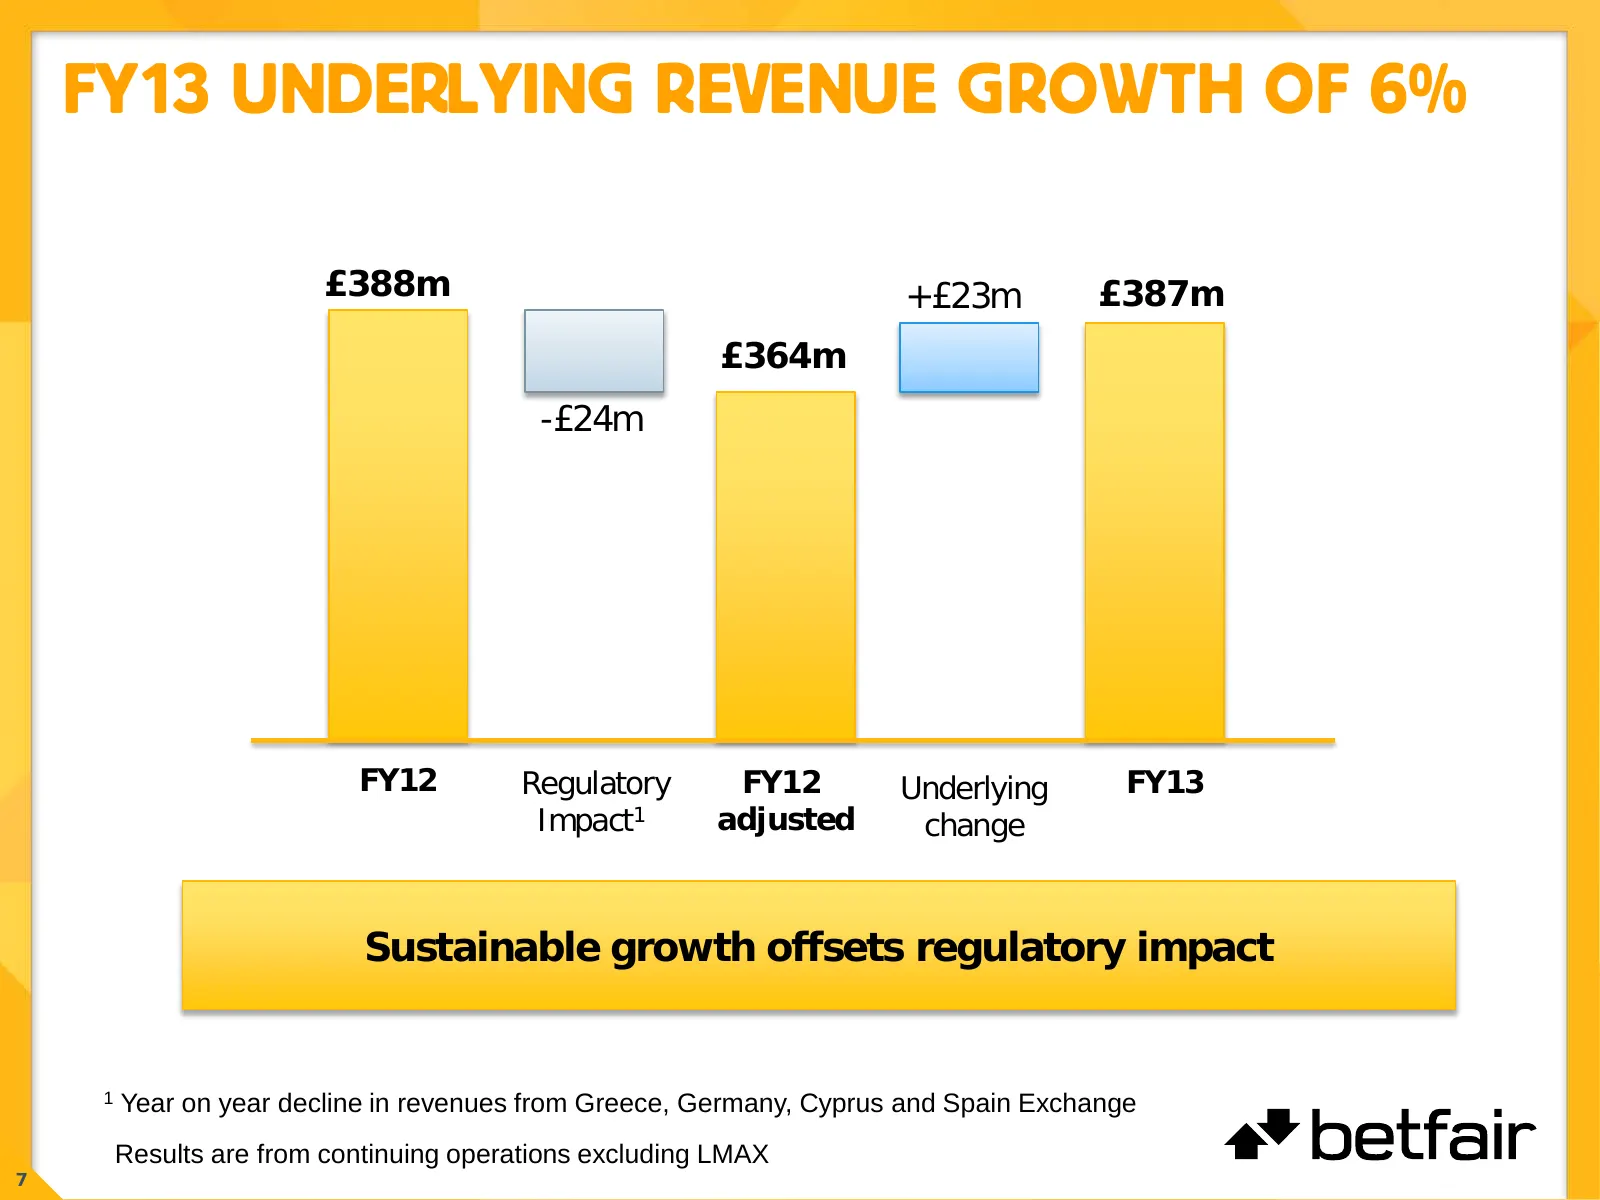
FY13 UNDERLYING REVENUE GROWTH OF 6% £388m +£23m £387m £364m -£24m FY12 Regulatory FY12 Underlying FY13 Impact1 adjusted change Sustainable growth offsets regulatory impact 1 Year on year decline in revenues from Greece, Germany, Cyprus and Spain Exchange Results are from continuing operations exclu
Slide 8: FY13 Underlying EBITDA Change
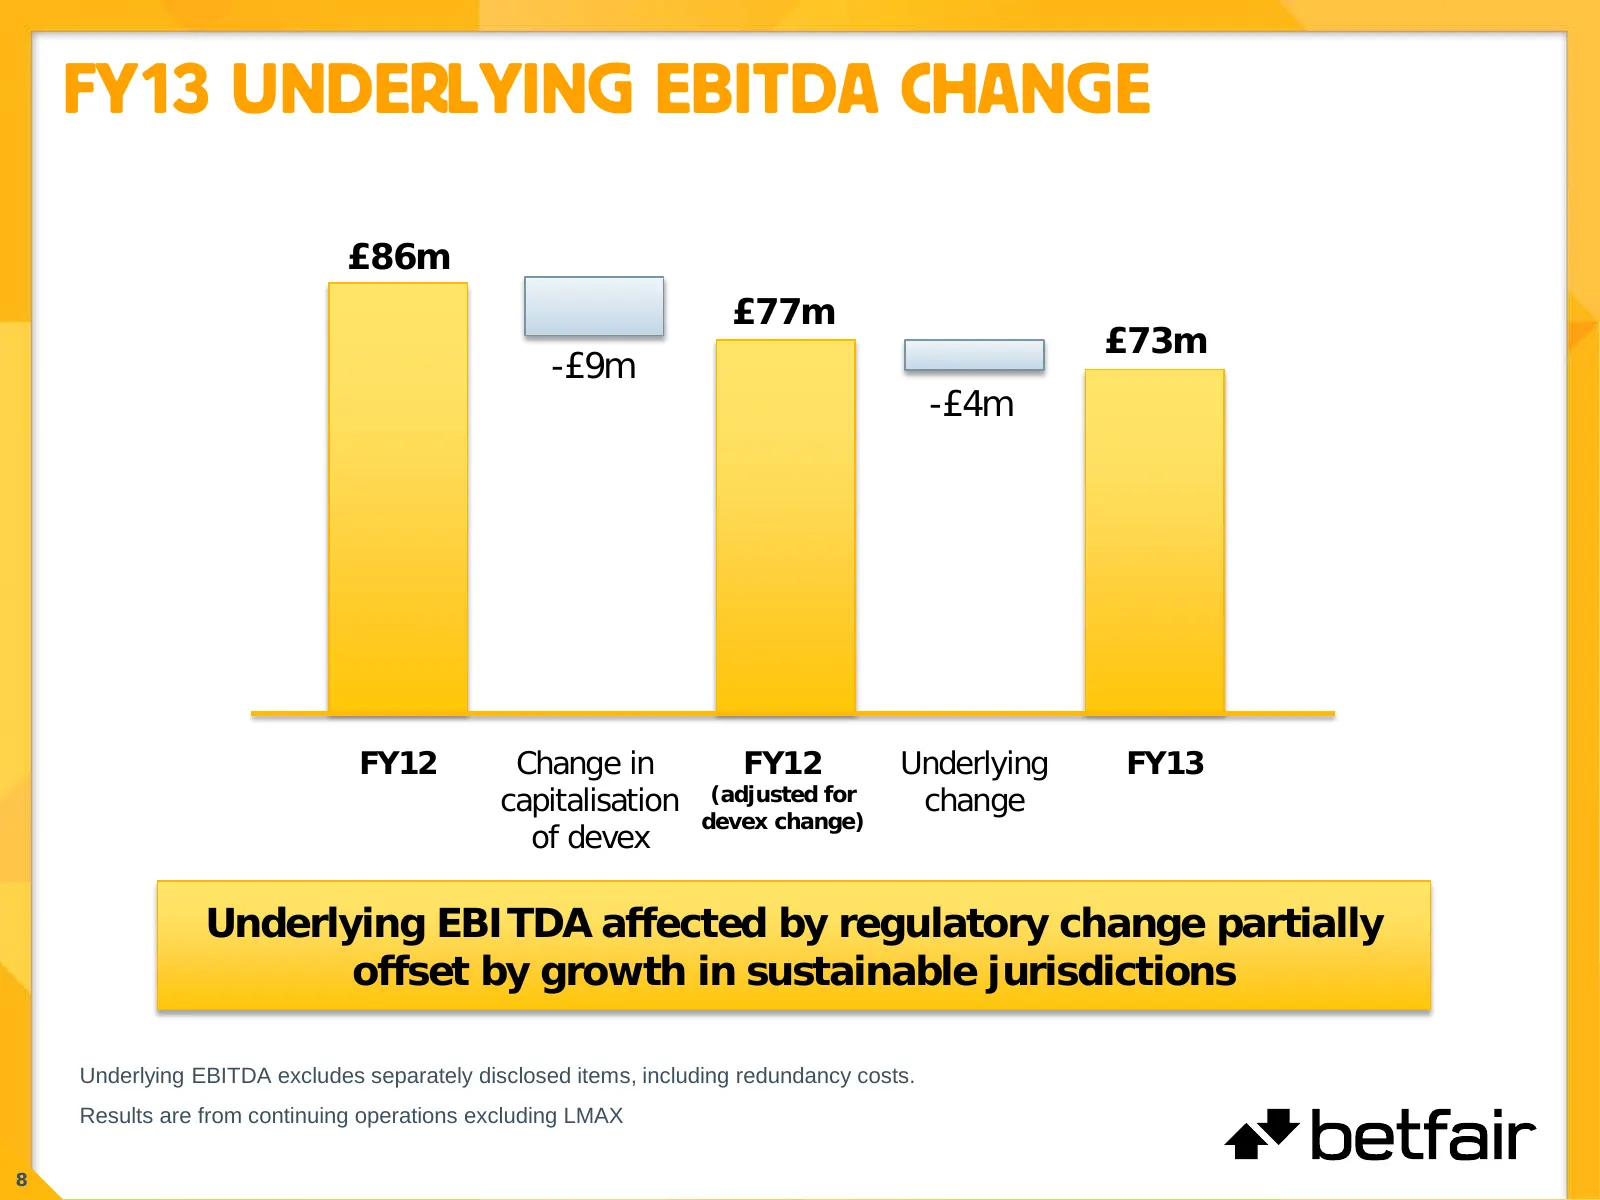
FY13 UNDERLYING EBITDA CHANGE £86m £77m £73m -£9m -£4m FY12 Change in FY12 Underlying FY13 capitalisation (adjusted for change devex change) of devex Underlying EBITDA affected by regulatory change partially offset by growth in sustainable jurisdictions Underlying EBITDA excludes separately disclose
Slide 9: Capex
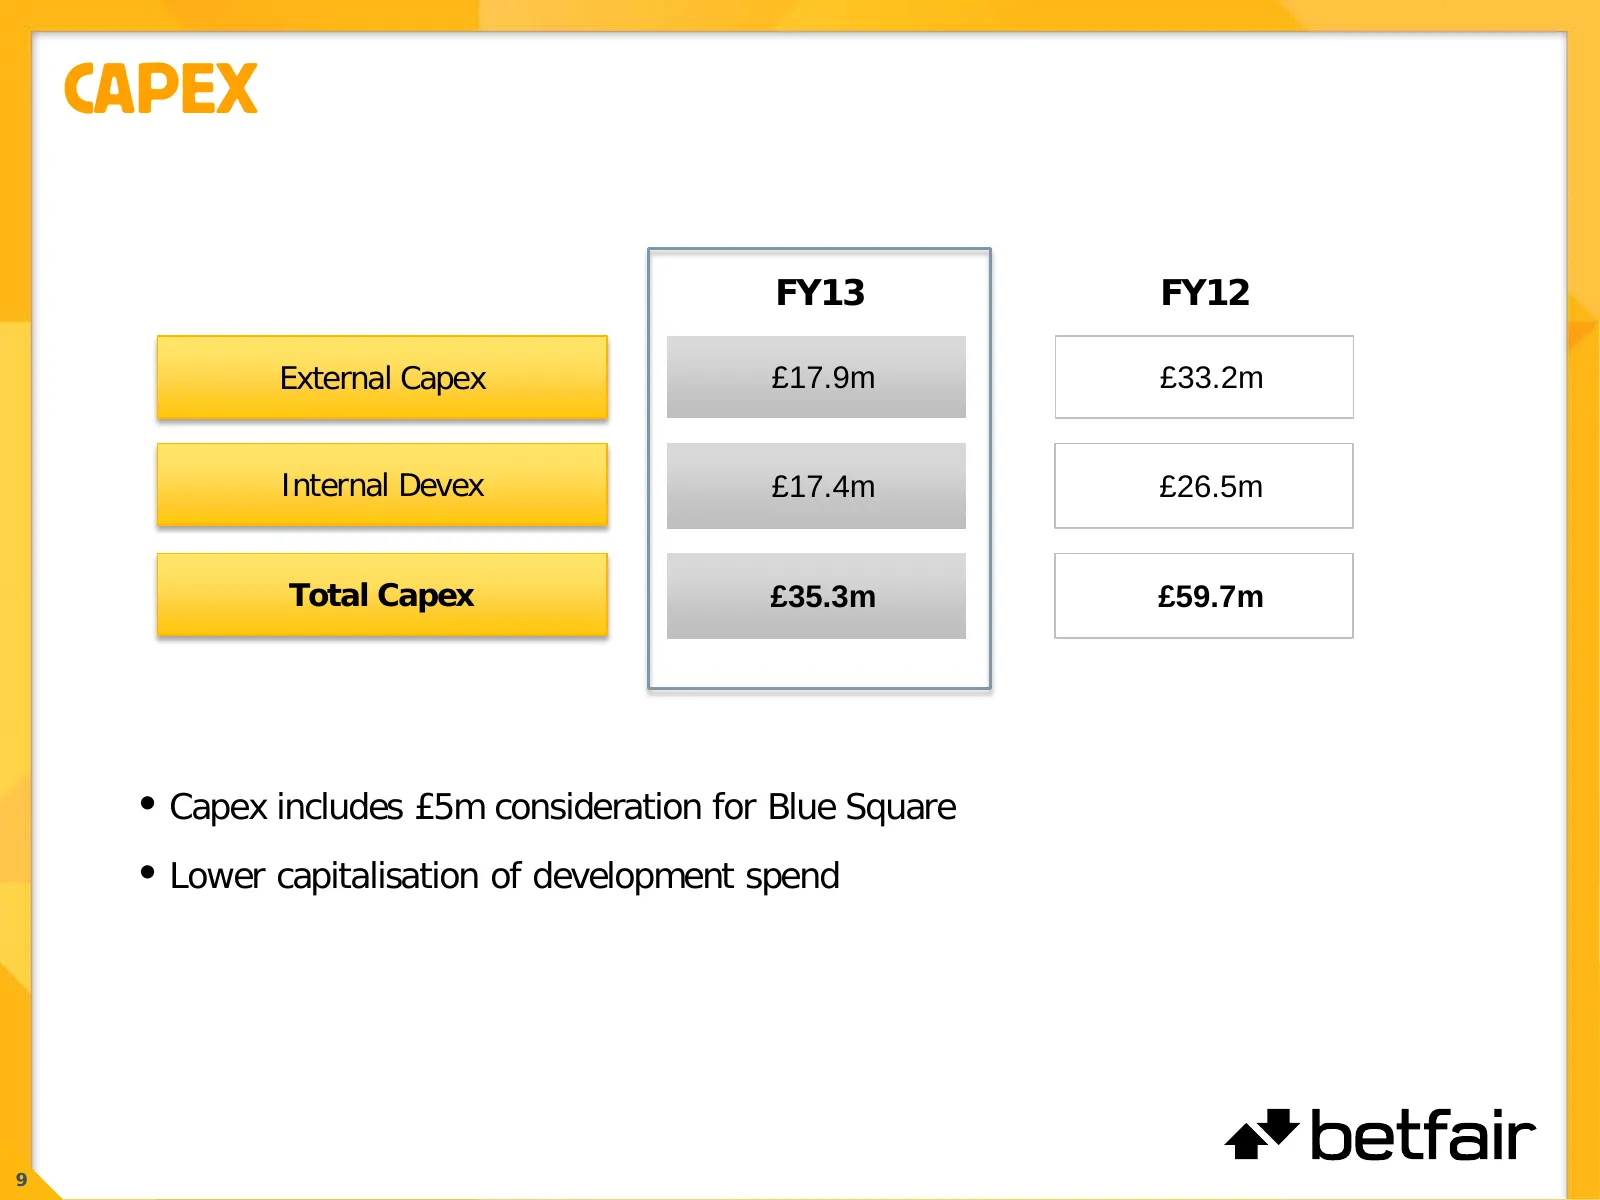
CAPEX FY13 FY12 External Capex £17.9m £33.2m Internal Devex £17.4m £26.5m Total Capex £35.3m £59.7m • Capex includes £5m consideration for Blue Square • Lower capitalisation of development spend 9
Slide 10: Cash Flow
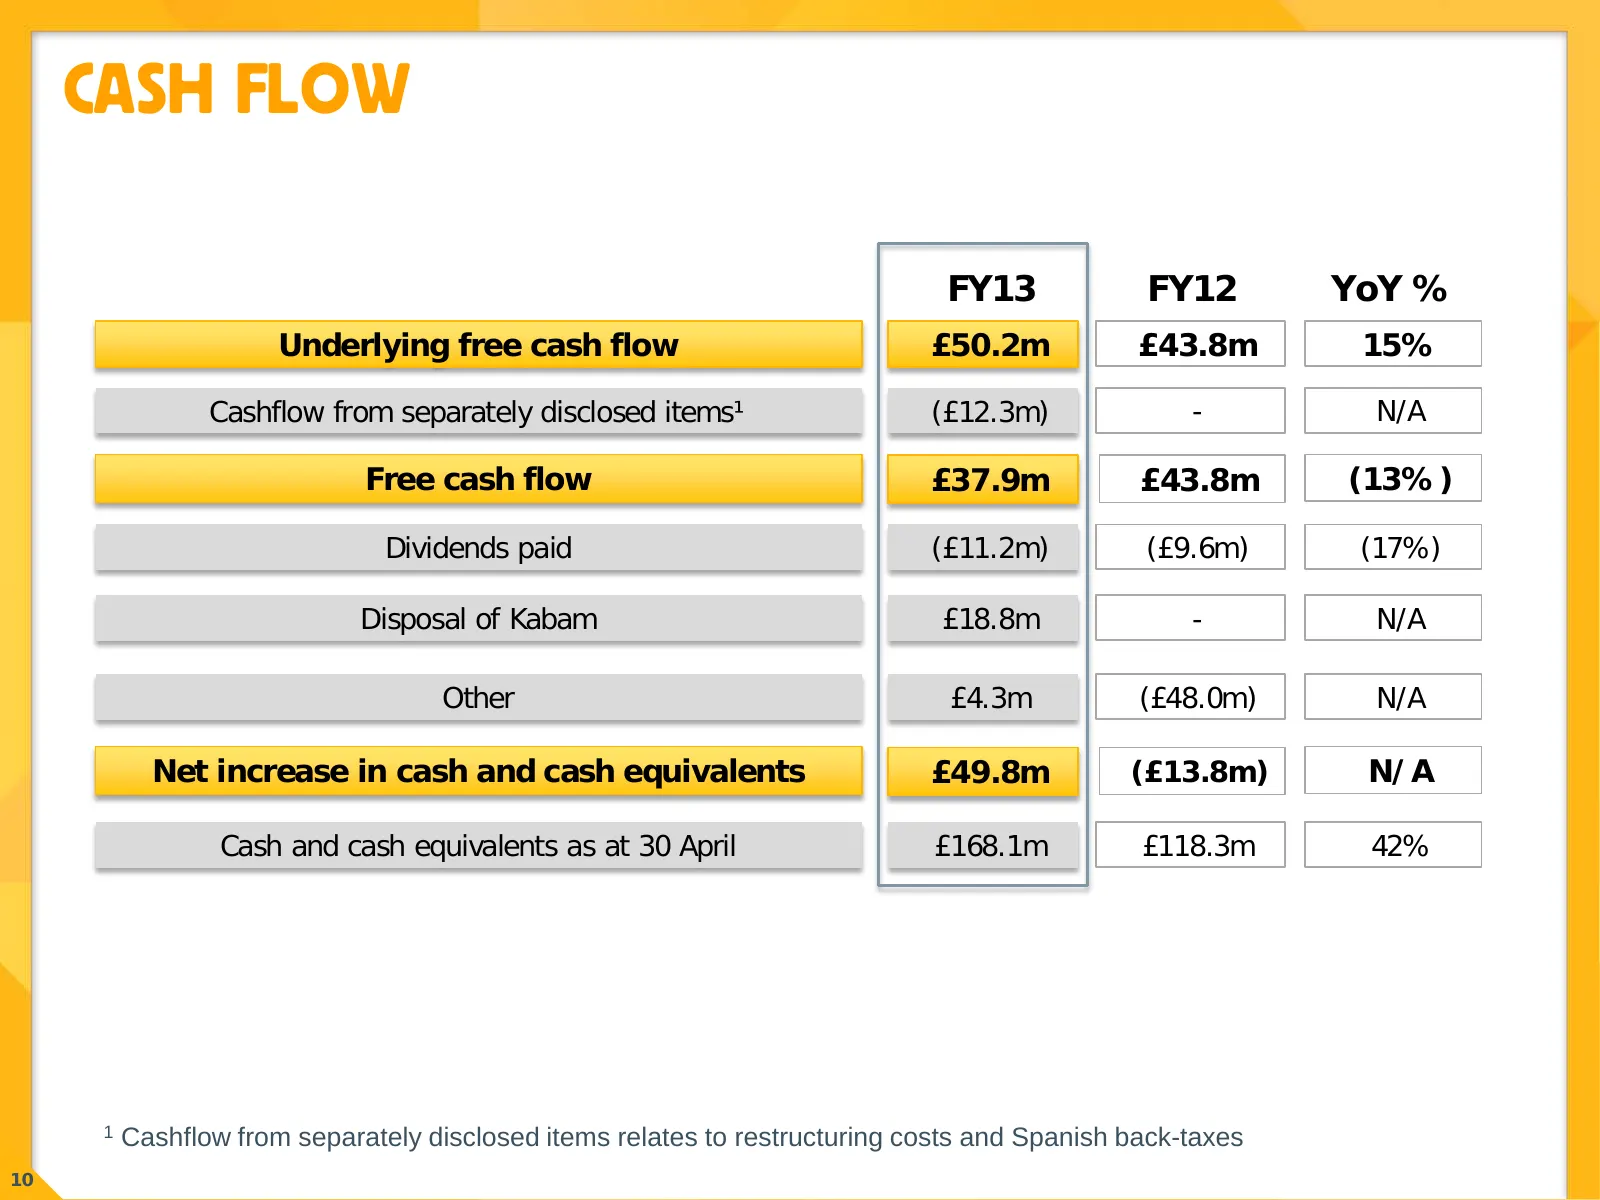
CASH FLOW FY13 FY12 YoY % Underlying free cash flow £50.2m £43.8m 15% Cashflow from separately disclosed items¹ (£12.3m) - N/A Free cash flow £37.9m £43.8m (13%) Dividends paid (£11.2m) (£9.6m) (17%) Disposal of Kabam £18.8m - N/A Other £4.3m (£48.0m) N/A Net increase in cash and cash equivalents £4
Slide 11: Financial Summary
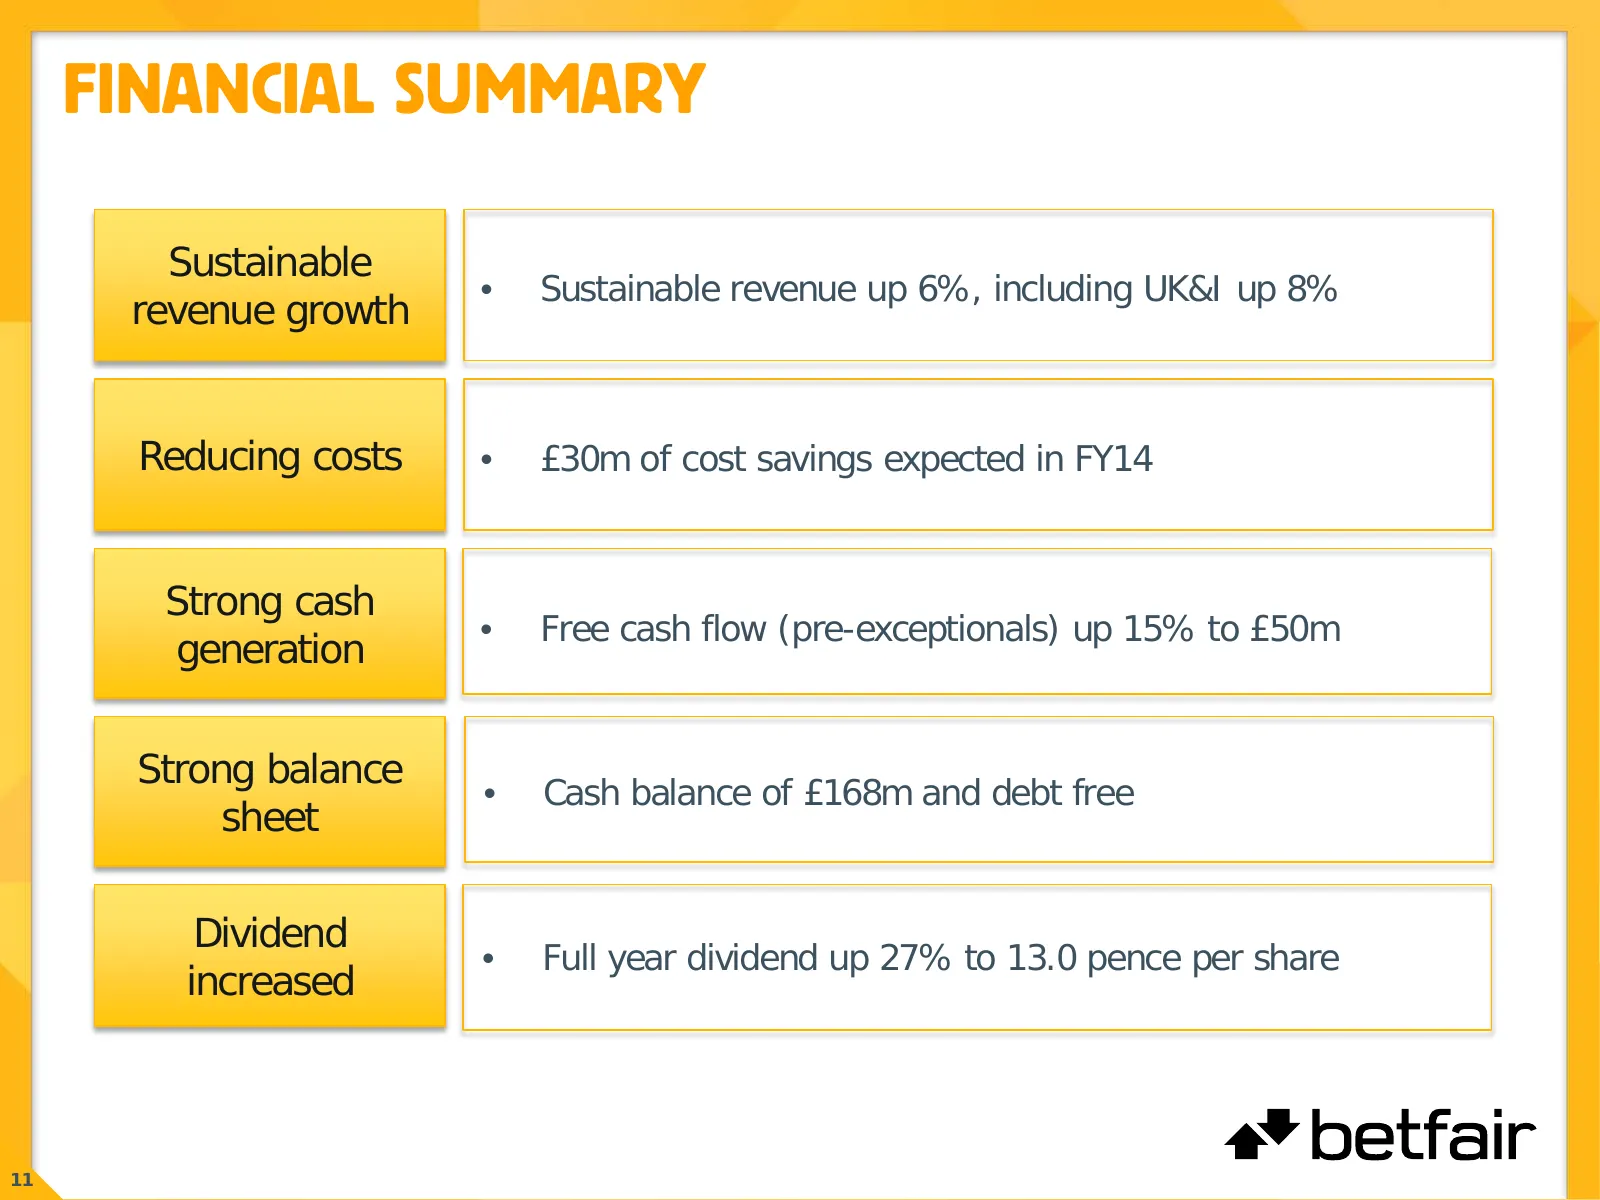
FINANCIAL SUMMARY Sustainable • Sustainable revenue up 6%, including UK&I up 8% revenue growth Reducing costs • £30m of cost savings expected in FY14 Strong cash • Free cash flow (pre-exceptionals) up 15% to £50m generation Strong balance • Cash balance of £168m and debt free sheet Dividend • Full y

Slide 12: Business Review
BUSINESS REVIEW a* betfair
Slide 13: Progress Against Our Plan
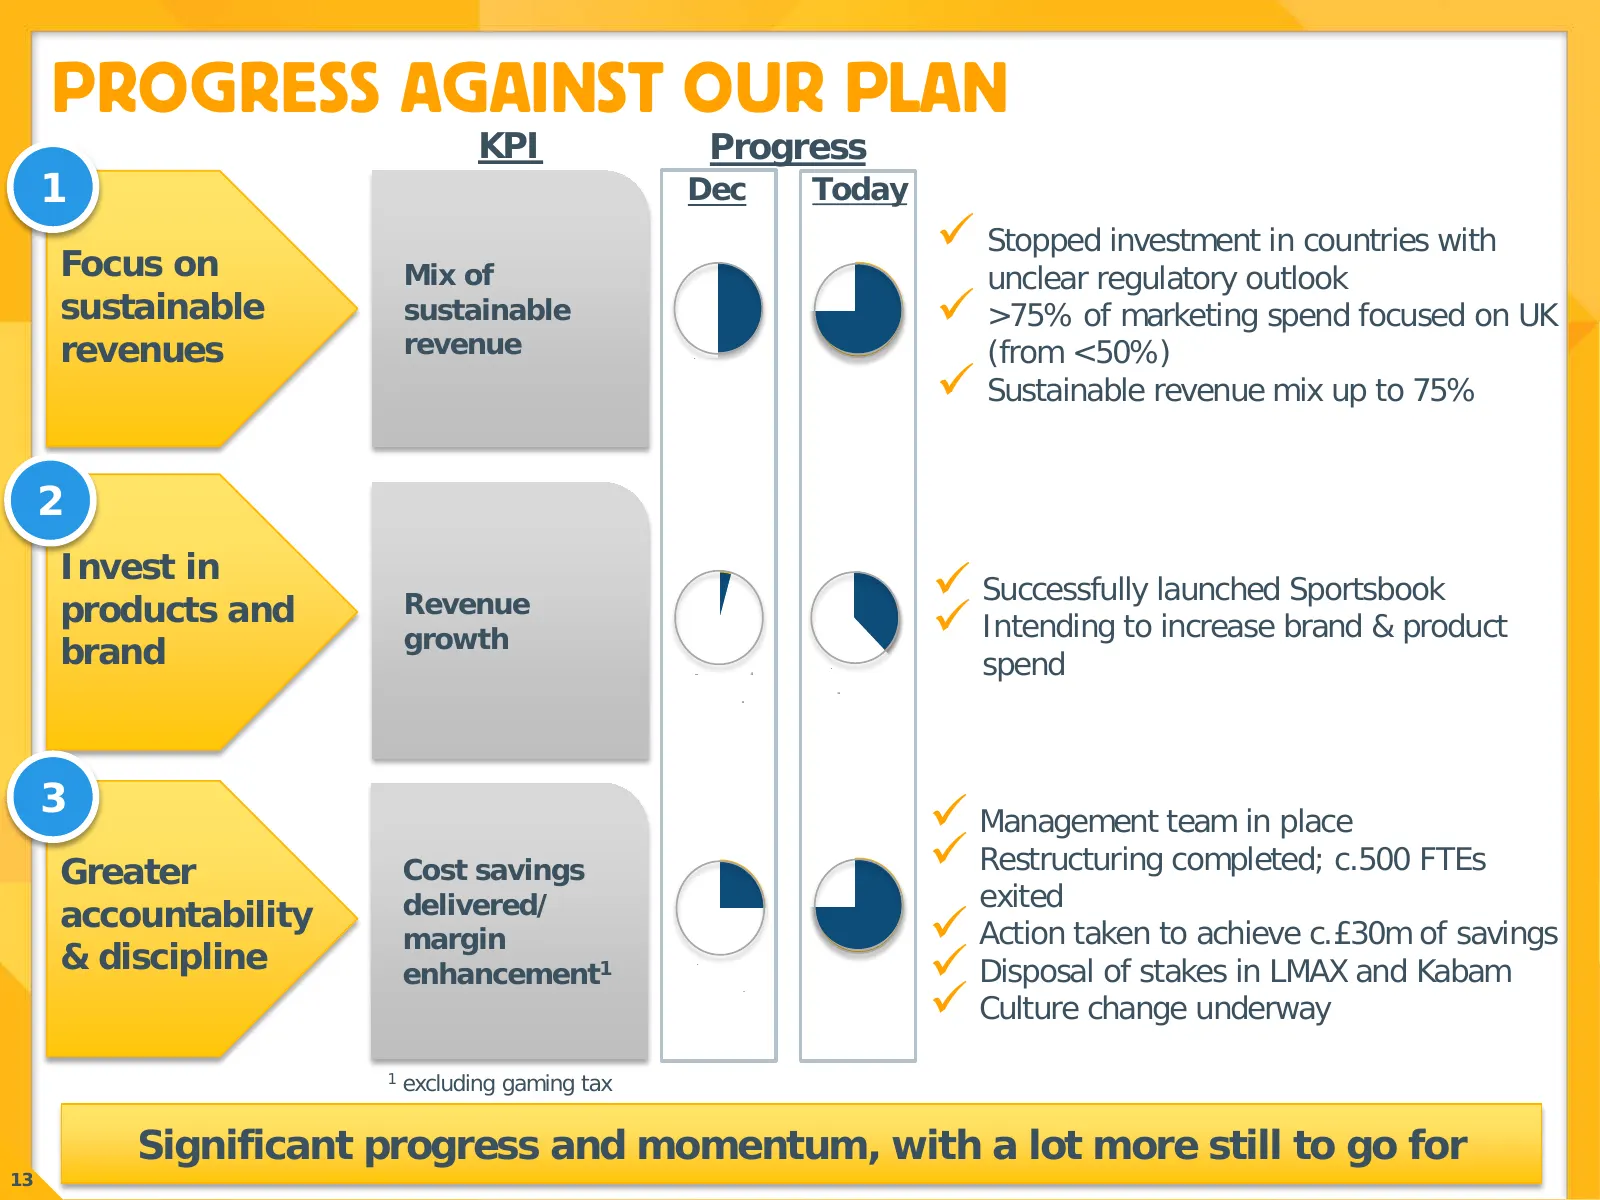
PROGRESS AGAINST OUR PLAN KPI Progress 1 Dec Today Stopped investment in countries with Focus on Mix of unclear regulatory outlook sustainable sustainable >75% of marketing spend focused on UK revenues revenue (from <50%) Sustainable revenue mix up to 75% 2 Invest in products and Revenue Suc
Slide 14: Exchange
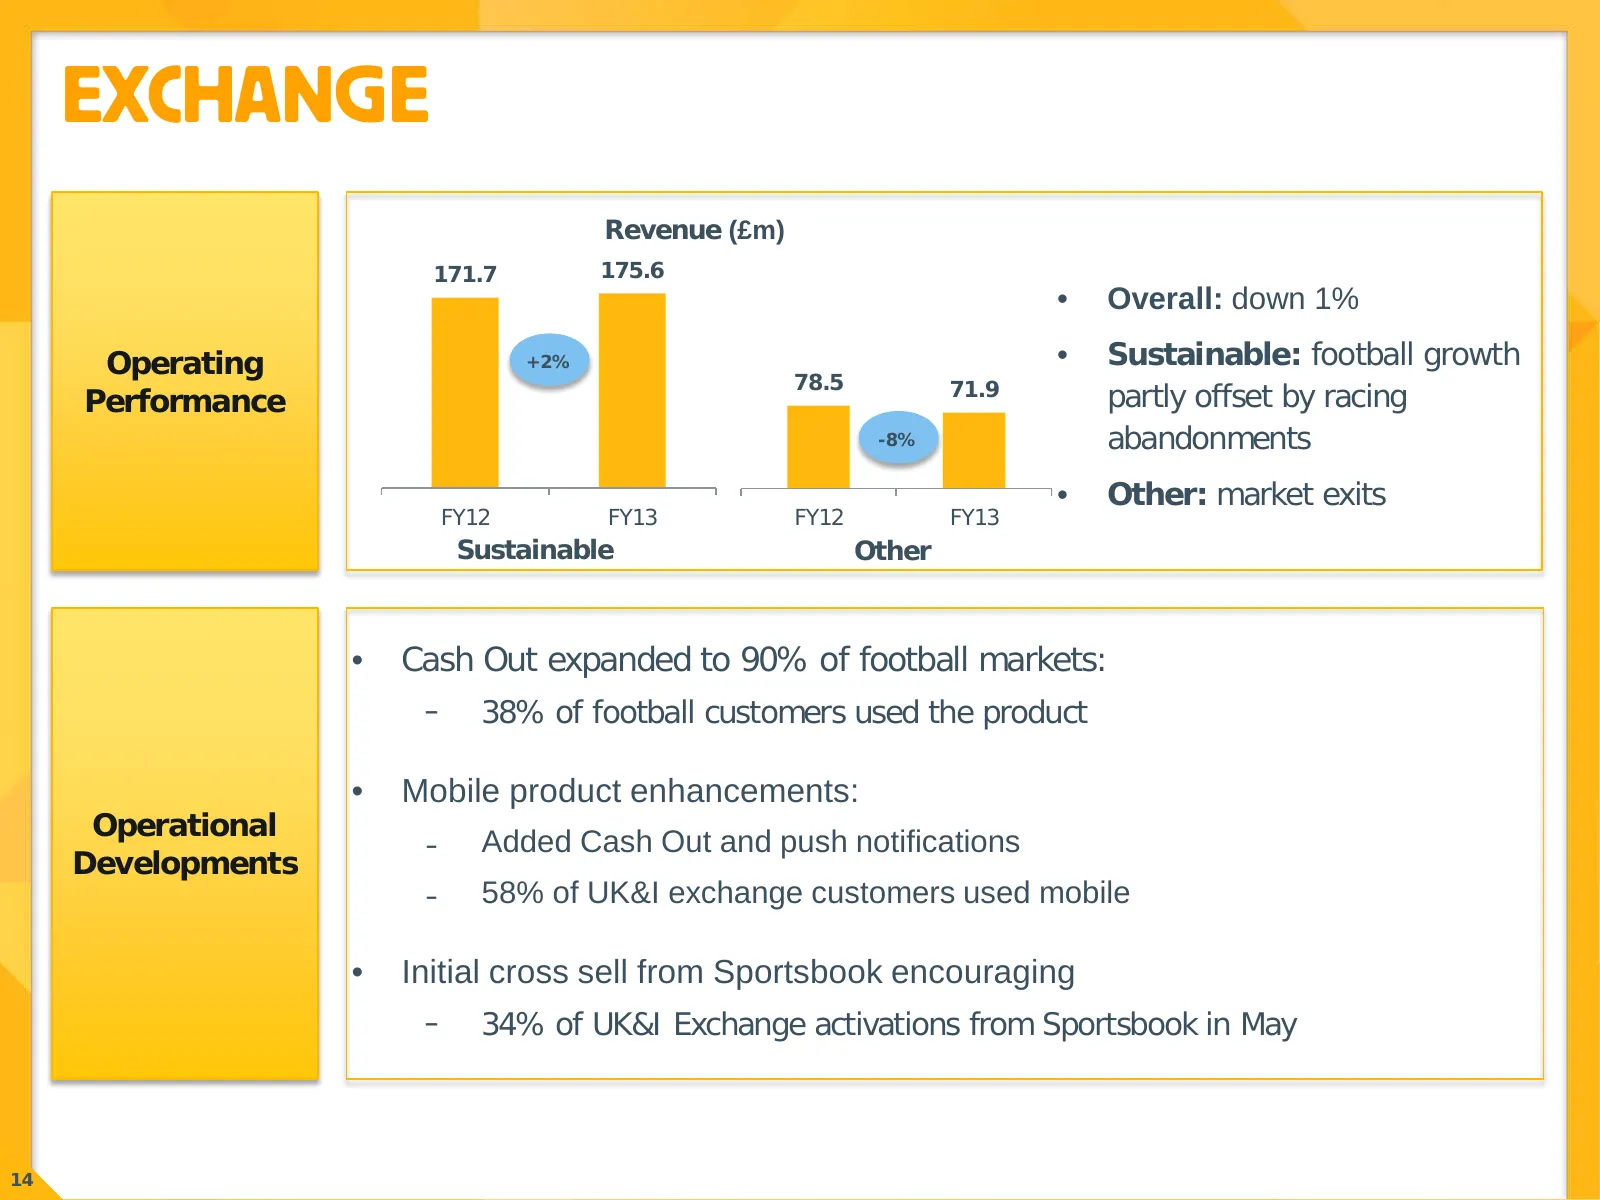
EXCHANGE Revenue (£m) 171.7 175.6 x 180.0 • Overall: down 1% Operating +2% • Sustainable: football growth 78.5 71.9 Performance partly offset by racing -8% abandonments x 0.0 • Other: market exits FY12 FY13 FY12 FY13 Sustainable Other • Cash Out expanded to 90% of football markets: ̵ 38% of football
Slide 15: Sports
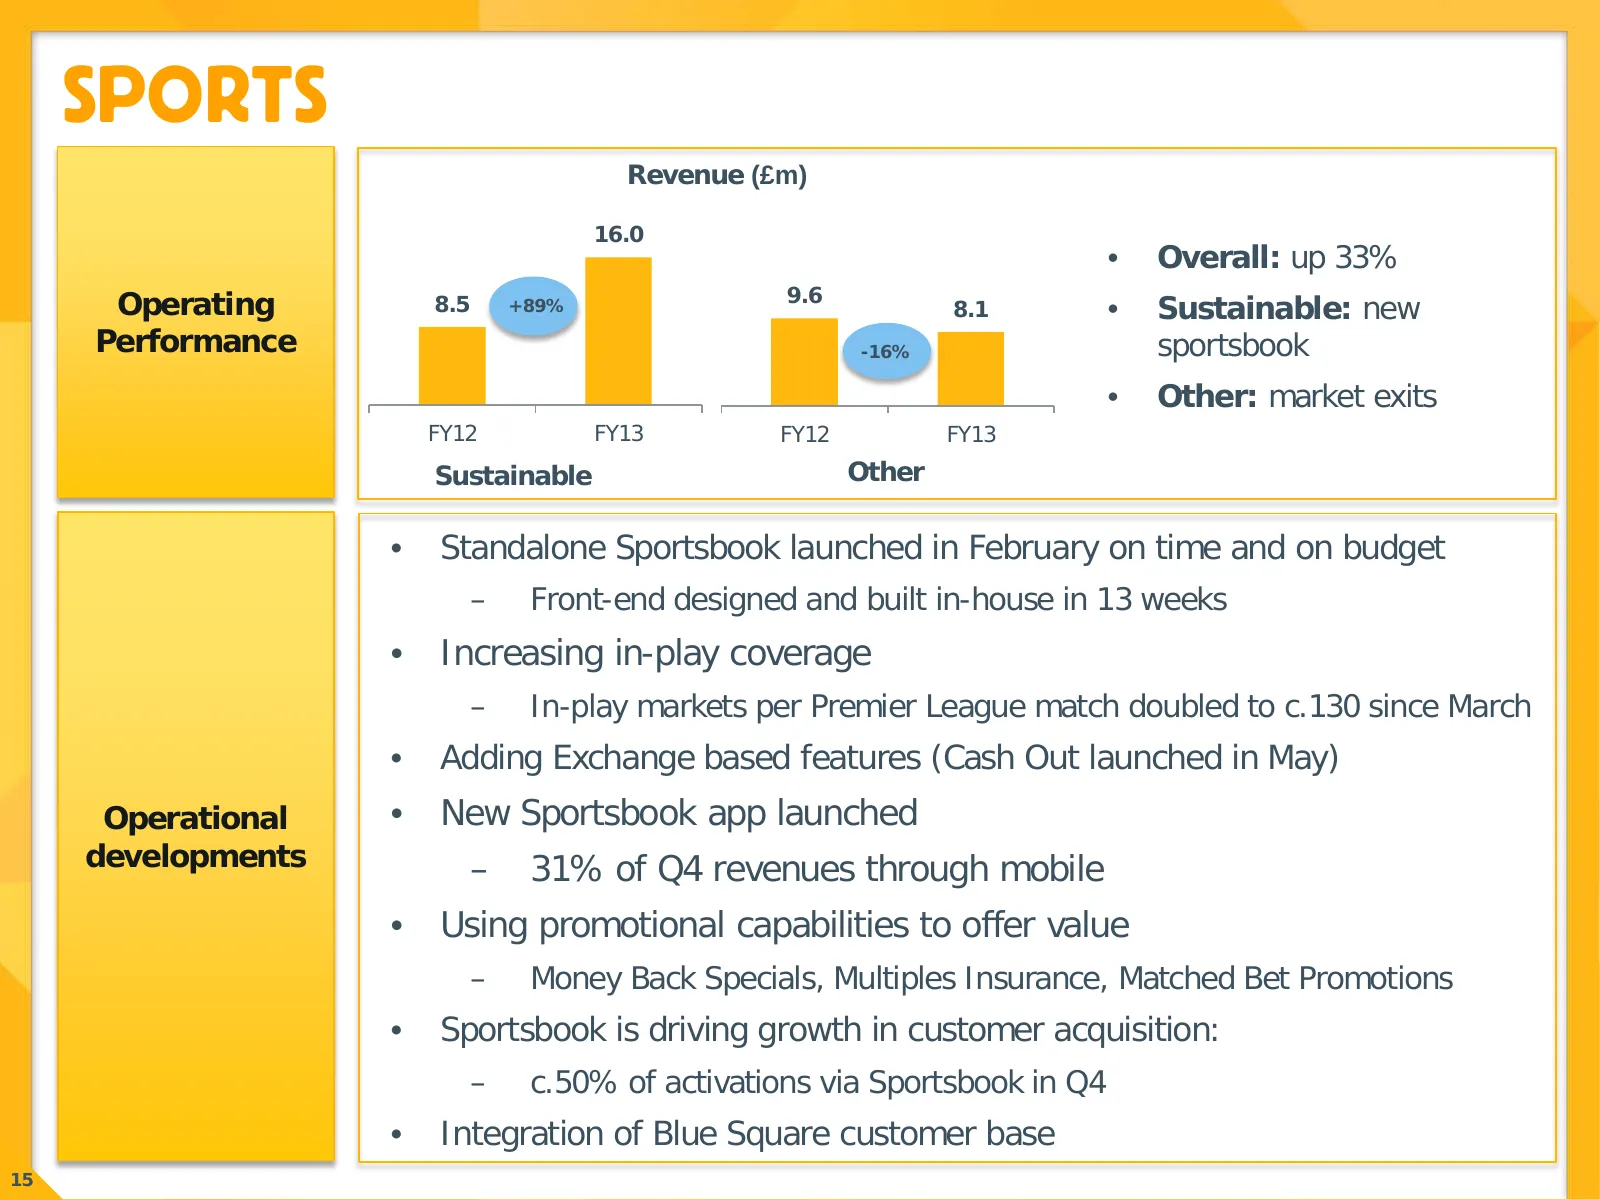
SPORTS Revenue (£m) 16.0 x x • Overall: up 33% 9.6 Operating x 8.5 +89% x 8.1 • Sustainable: new Performance x x -16% sportsbook x x • Other: market exits FY12 FY13 FY12 FY13 Sustainable Other • Standalone Sportsbook launched in February on time and on budget – Front-end designed and built in-house

Slide 16: Merchandising
MERCHANDISING Promotions increase player activity and retention 16
Slide 17: Sportsbook Driving Acquisition
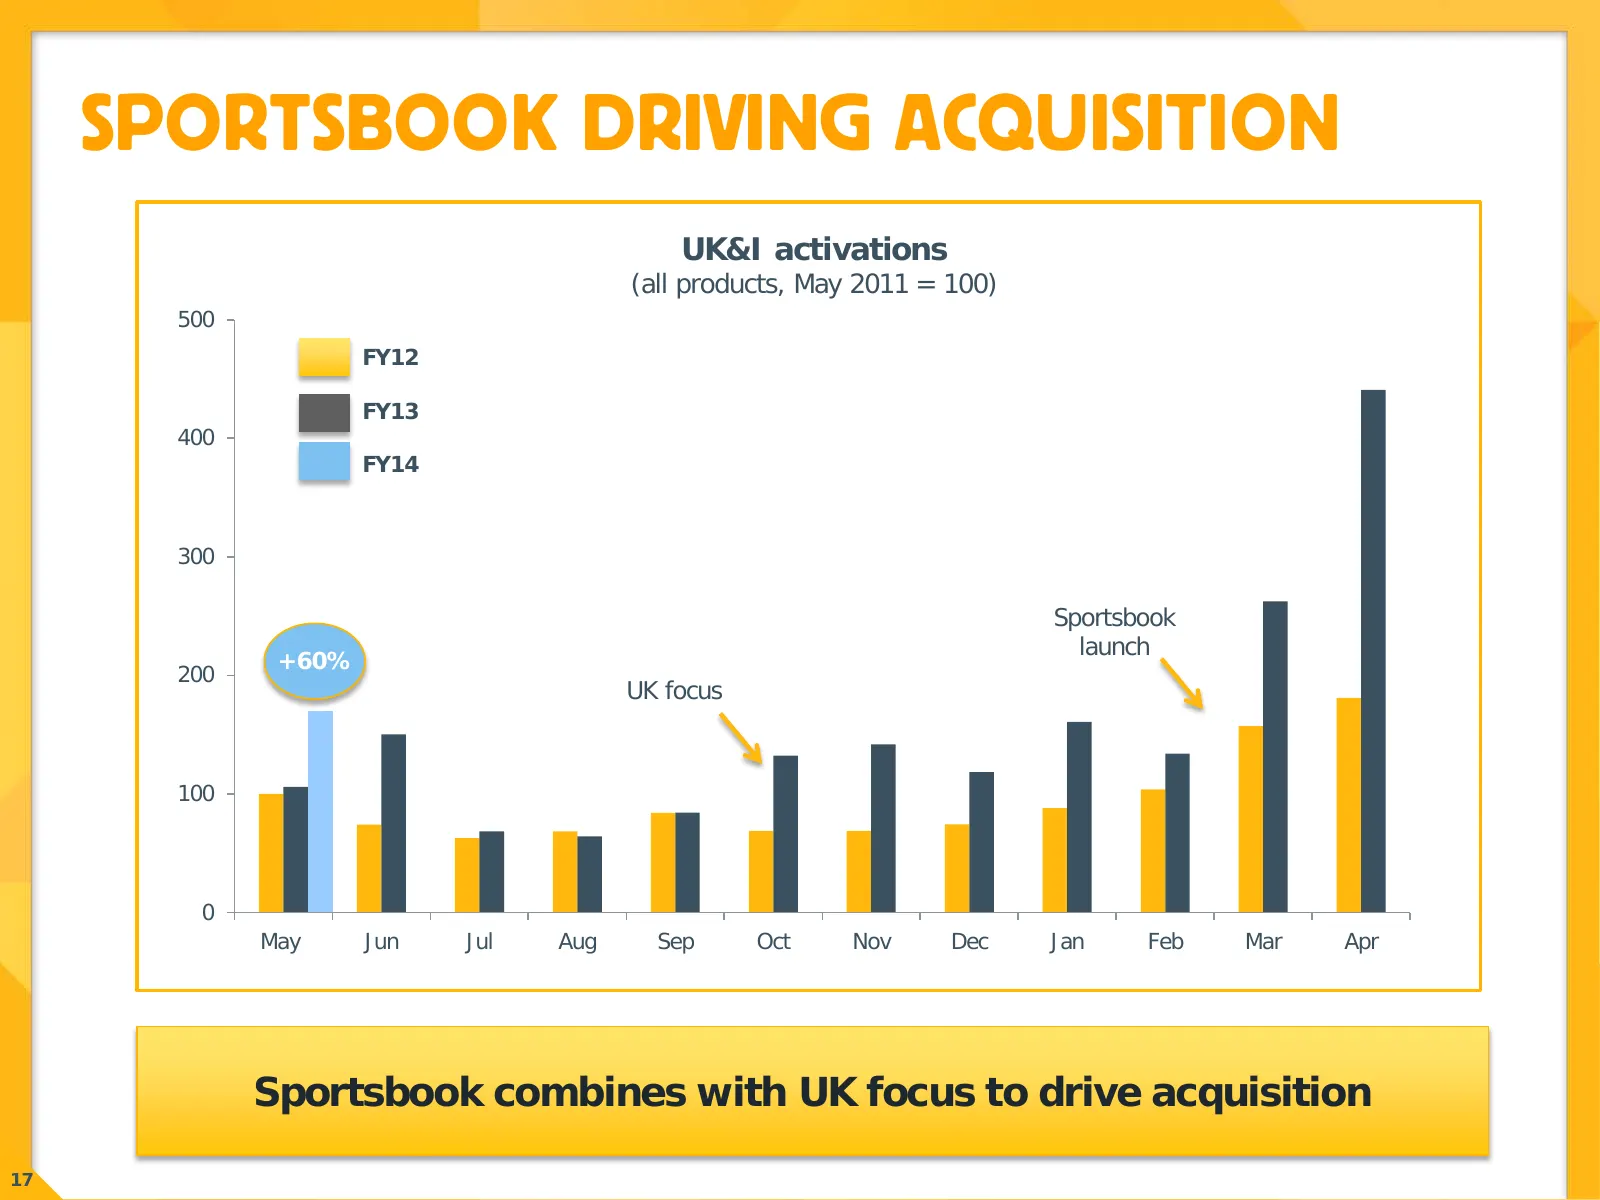
SPORTSBOOK DRIVING ACQUISITION UK&I activations (all products, May 2011 = 100) 500 FY12 FY13 400 FY14 300 Sportsbook launch +60% 200 UK focus 100 0 May Jun Jul Aug Sep Oct Nov Dec Jan Feb Mar Apr Sportsbook combines with UK focus to drive acquisition 17
Slide 18: UK Customer Base Returns to Growth
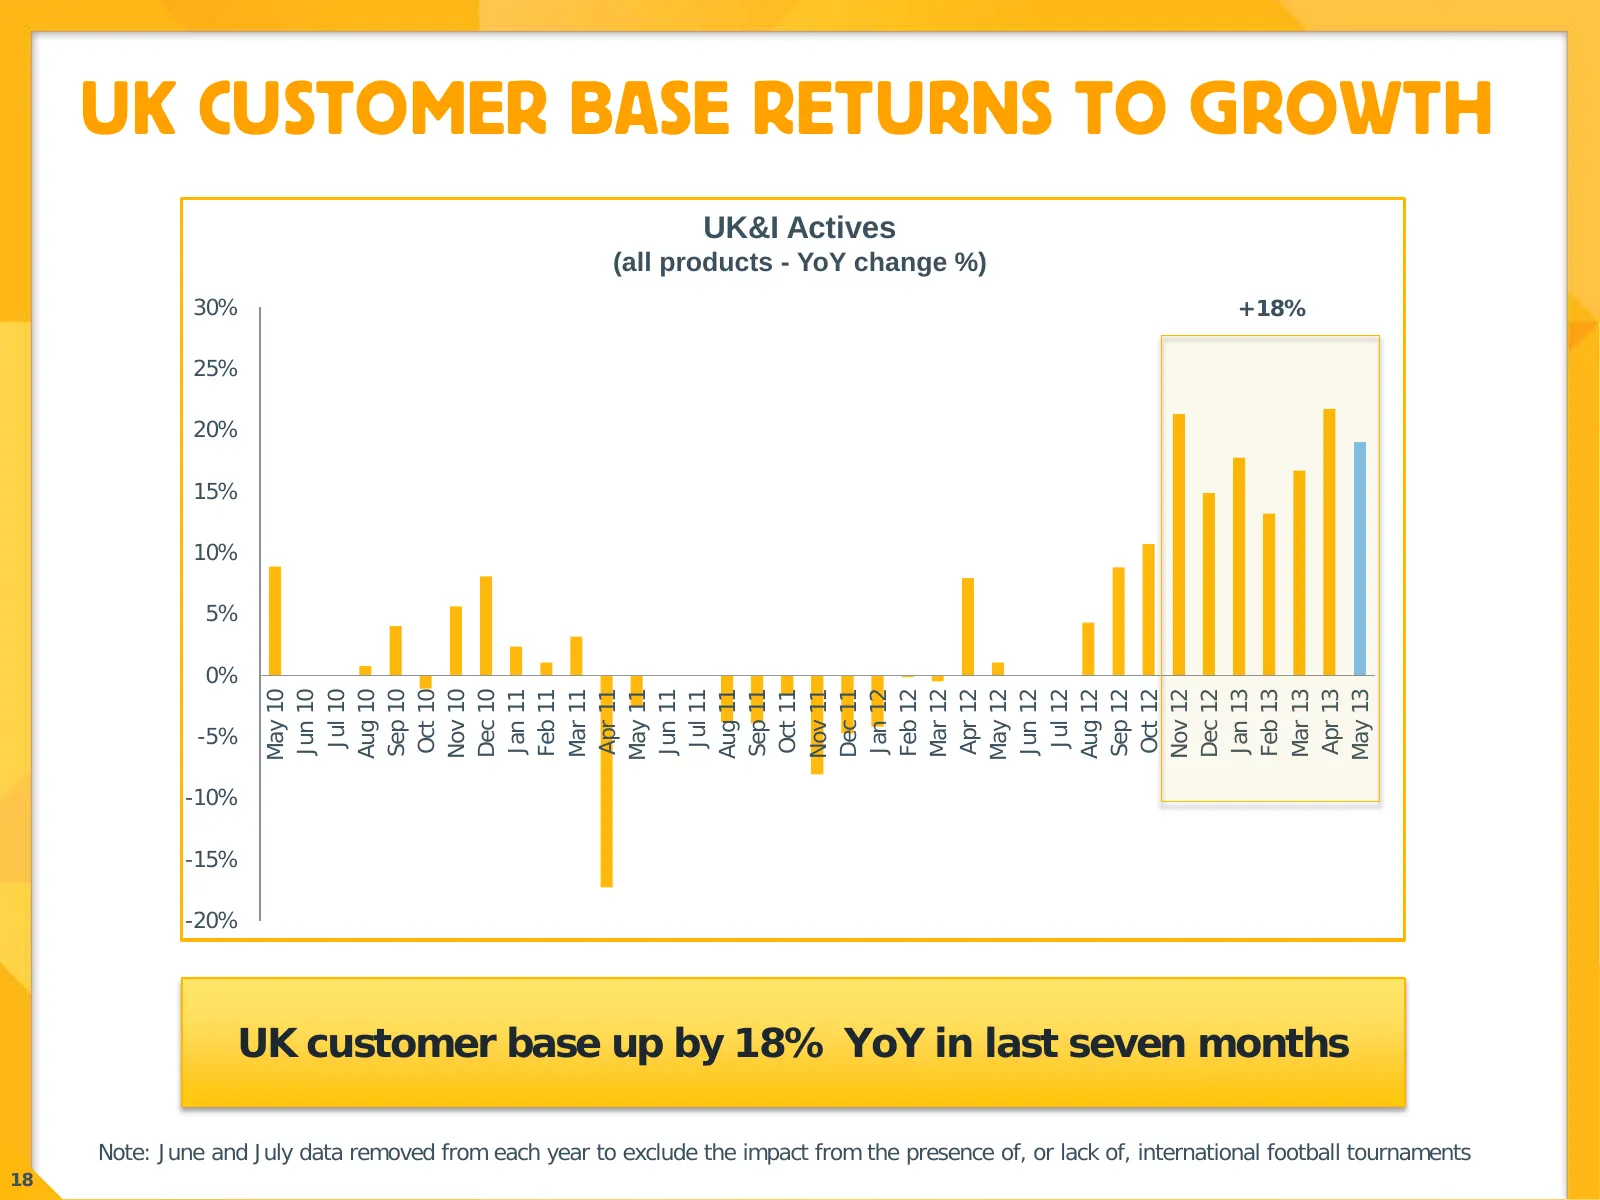
UK CUSTOMER BASE RETURNS TO GROWTH UK&I Actives (all products - YoY change %) 30% +18% 25% 20% 15% 10% 5% 0% Mar 11 Mar 12 Jul 10 Apr 11 Jul 11 Apr 12 Mar 13 Jul 12 Apr 13 May 10 Sep 10 Oct 10 Nov 10 Feb 11 Sep 11 Oct 11 Nov 11 Feb 12 May 12 Sep 12 Oct 12 Nov 12 Feb 13 May 13 Jun 10 Aug 10 May 11 Ju
Slide 19: Gaming
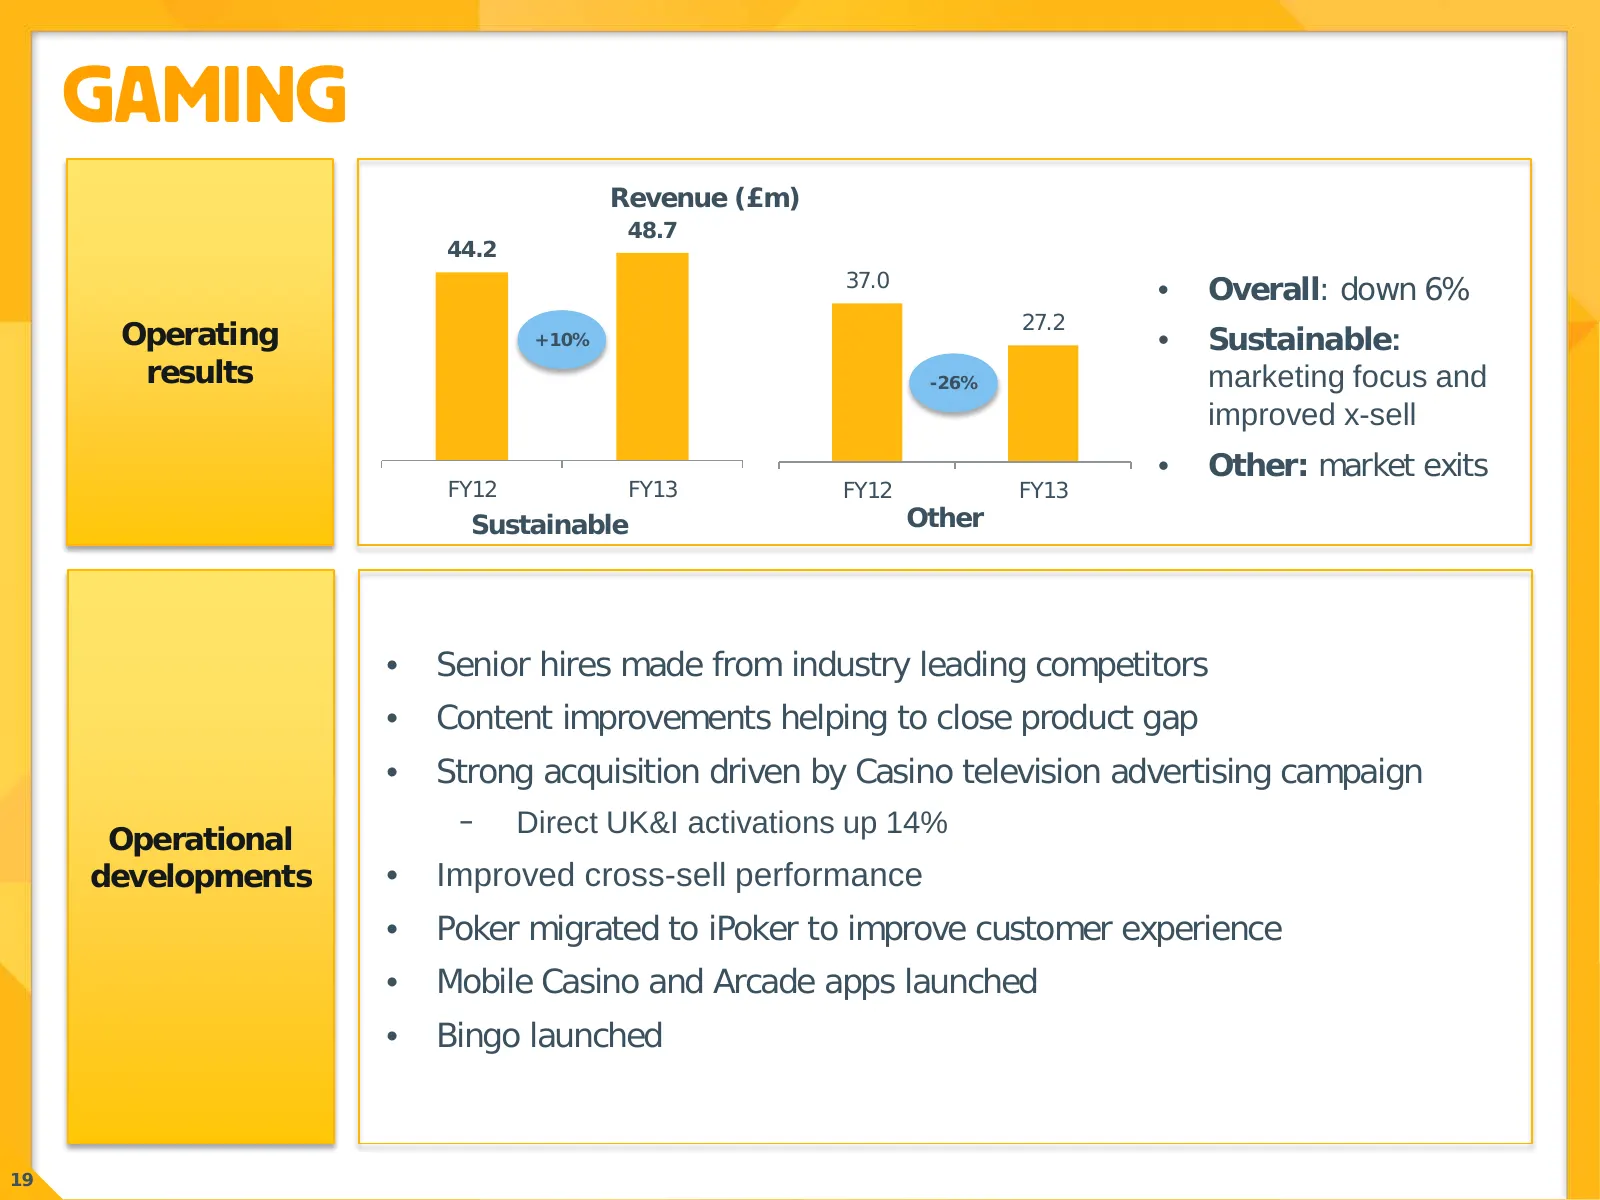
GAMING Revenue (£m) 48.7 x 44.2 x 37.0 • Overall: down 6% 27.2 Operating +10% • Sustainable: results -26% marketing focus and improved x-sell x x • Other: market exits FY12 FY13 FY12 FY13 Sustainable Other • Senior hires made from industry leading competitors • Content improvements helping to close
Slide 20: Increasing Customer Engagement
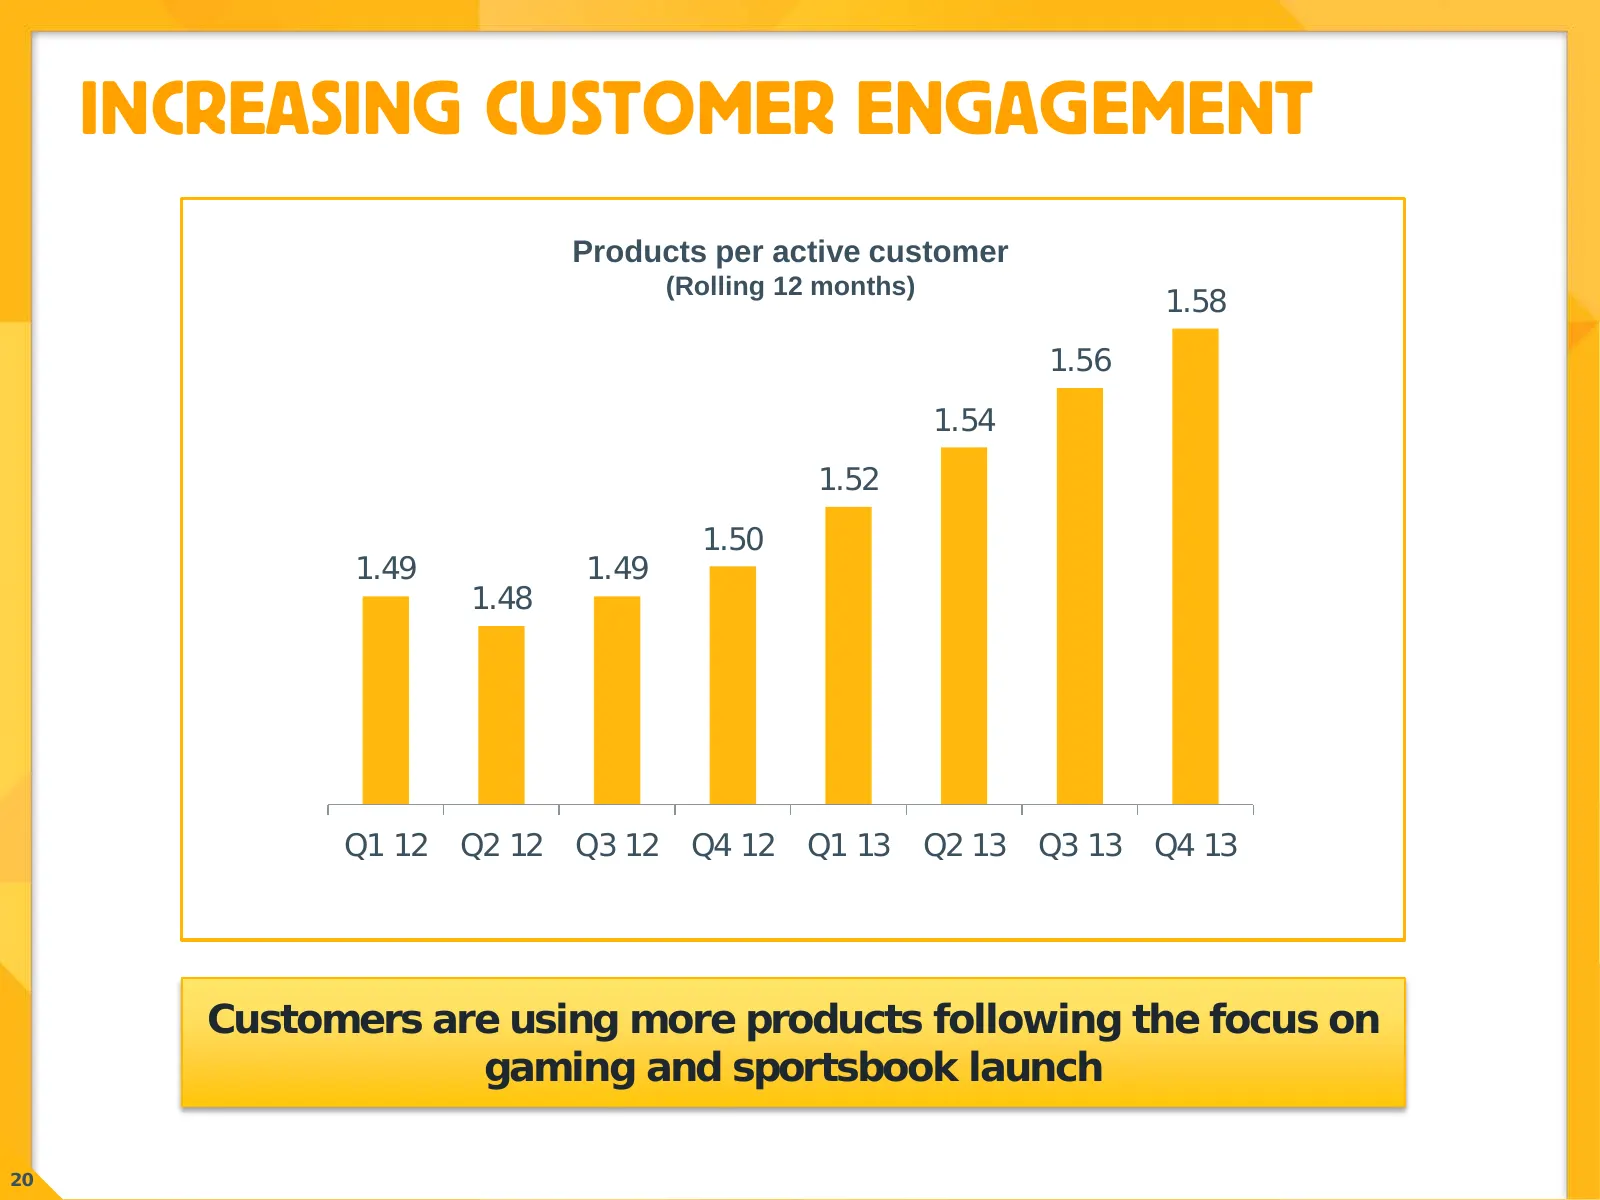
INCREASING CUSTOMER ENGAGEMENT Products per active customer (Rolling 12 months) 1.58 1.56 1.54 1.52 1.50 1.49 1.49 1.48 Q1 12 Q2 12 Q3 12 Q4 12 Q1 13 Q2 13 Q3 13 Q4 13 Customers are using more products following the focus on gaming and sportsbook launch 20
Slide 21: Mobile Growth
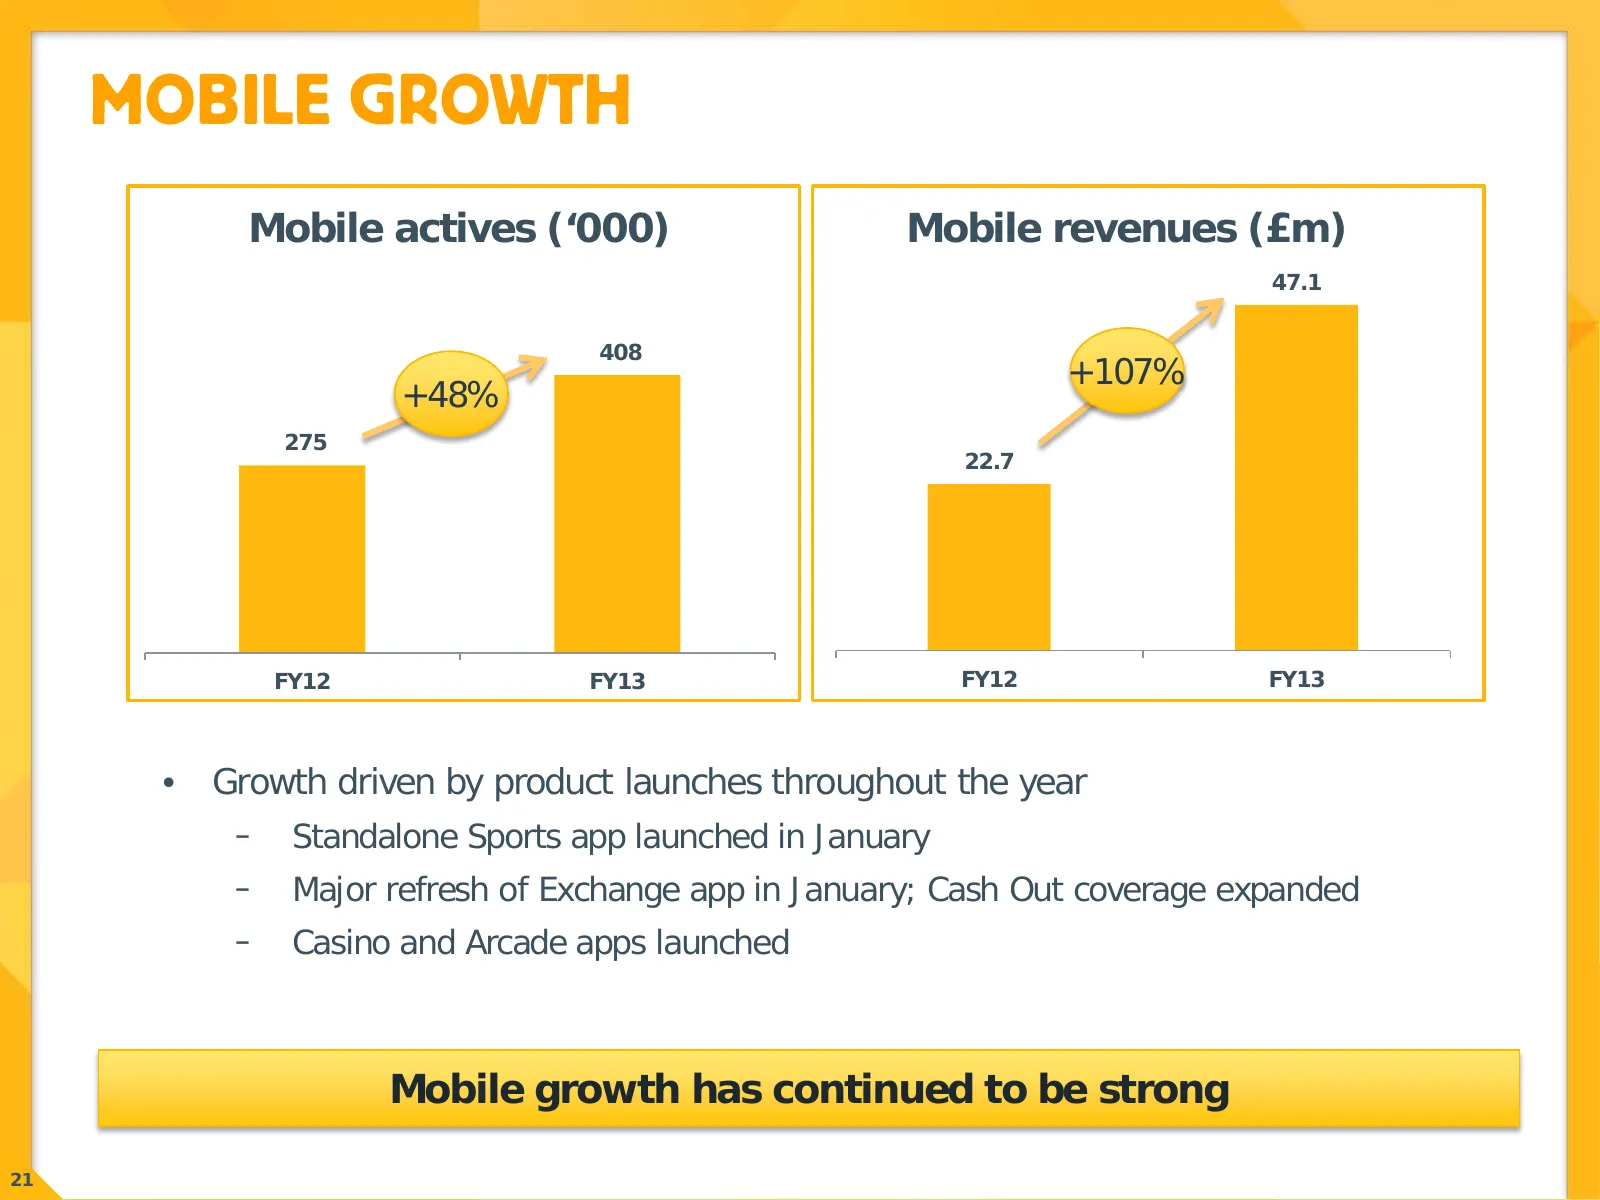
MOBILE GROWTH Mobile actives (‘000) Mobile revenues (£m) 47.1 408 +107% +48% 275 22.7 FY12 FY13 FY12 FY13 • Growth driven by product launches throughout the year ̵ Standalone Sports app launched in January ̵ Major refresh of Exchange app in January; Cash Out coverage expanded ̵ Casino and Arcade app
Slide 22: Betfair US
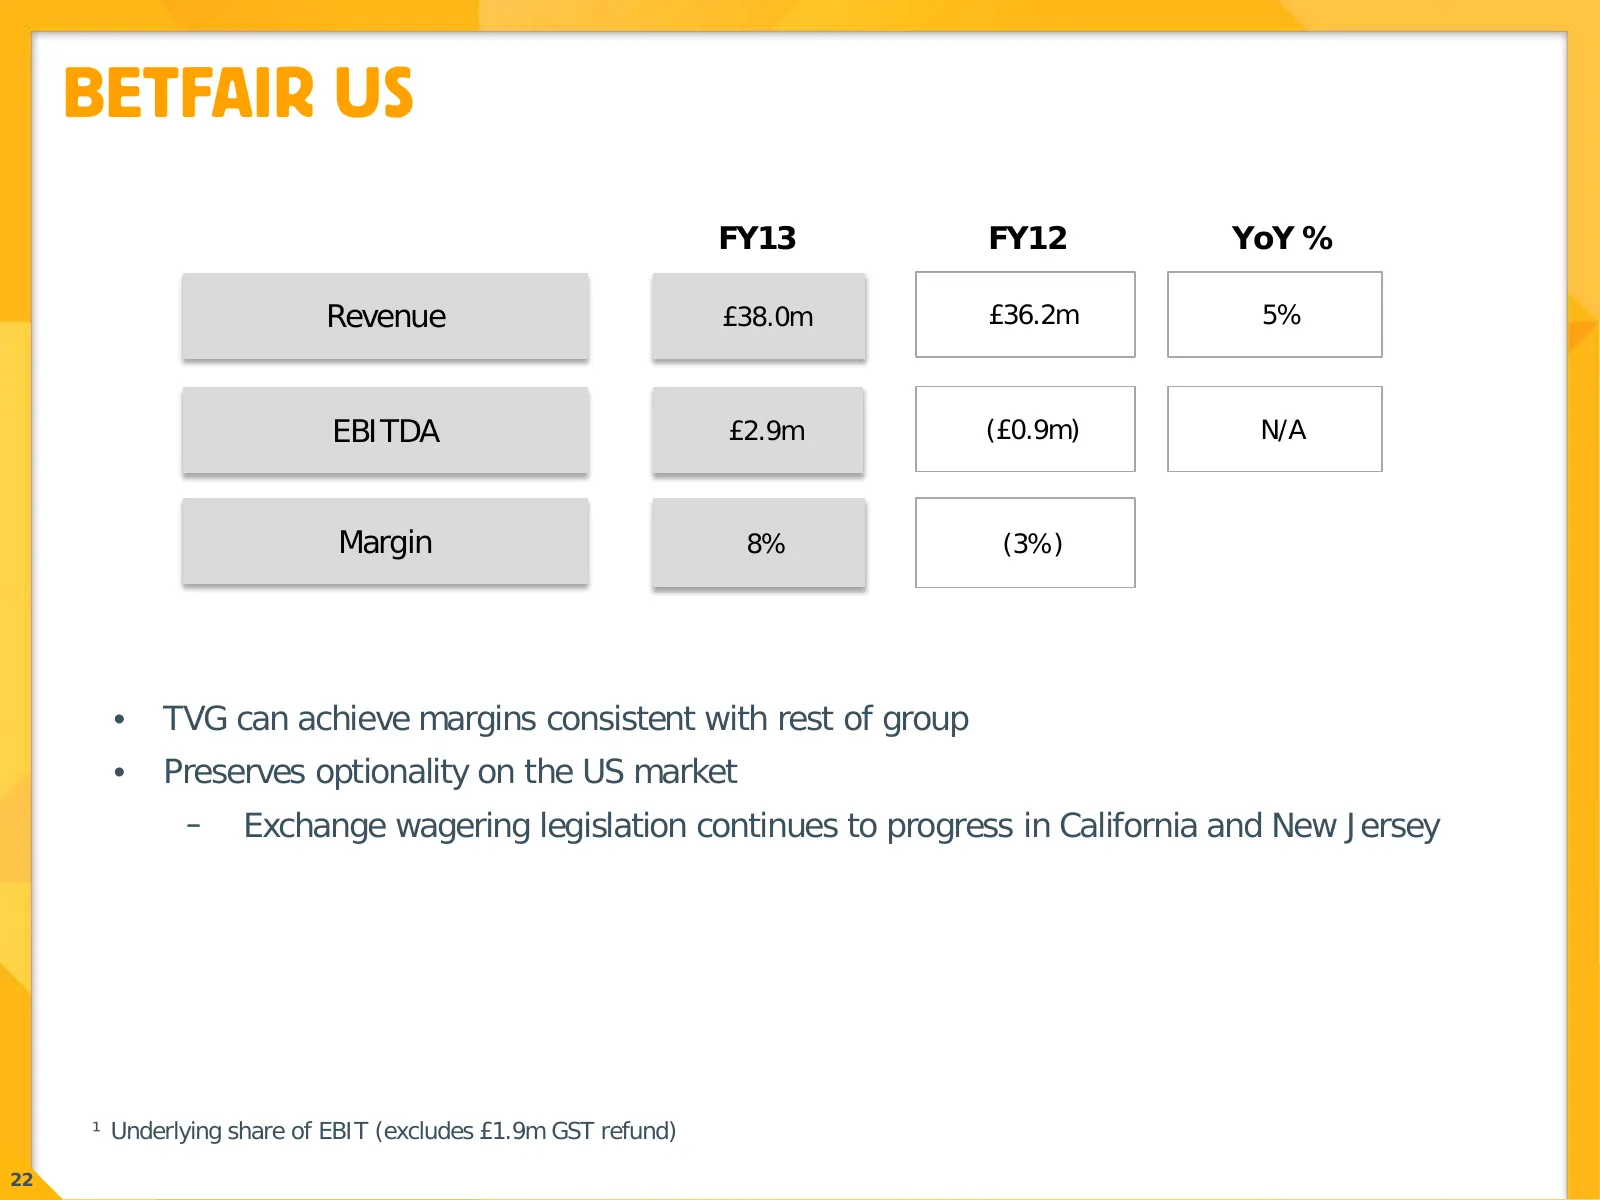
BETFAIR US FY13 FY12 YoY % Revenue £38.0m £36.2m 5% EBITDA £2.9m (£0.9m) N/A Margin 8% (3%) • TVG can achieve margins consistent with rest of group • Preserves optionality on the US market ̵ Exchange wagering legislation continues to progress in California and New Jersey ¹ Underlying share of EBIT (
Slide 23: Outlook
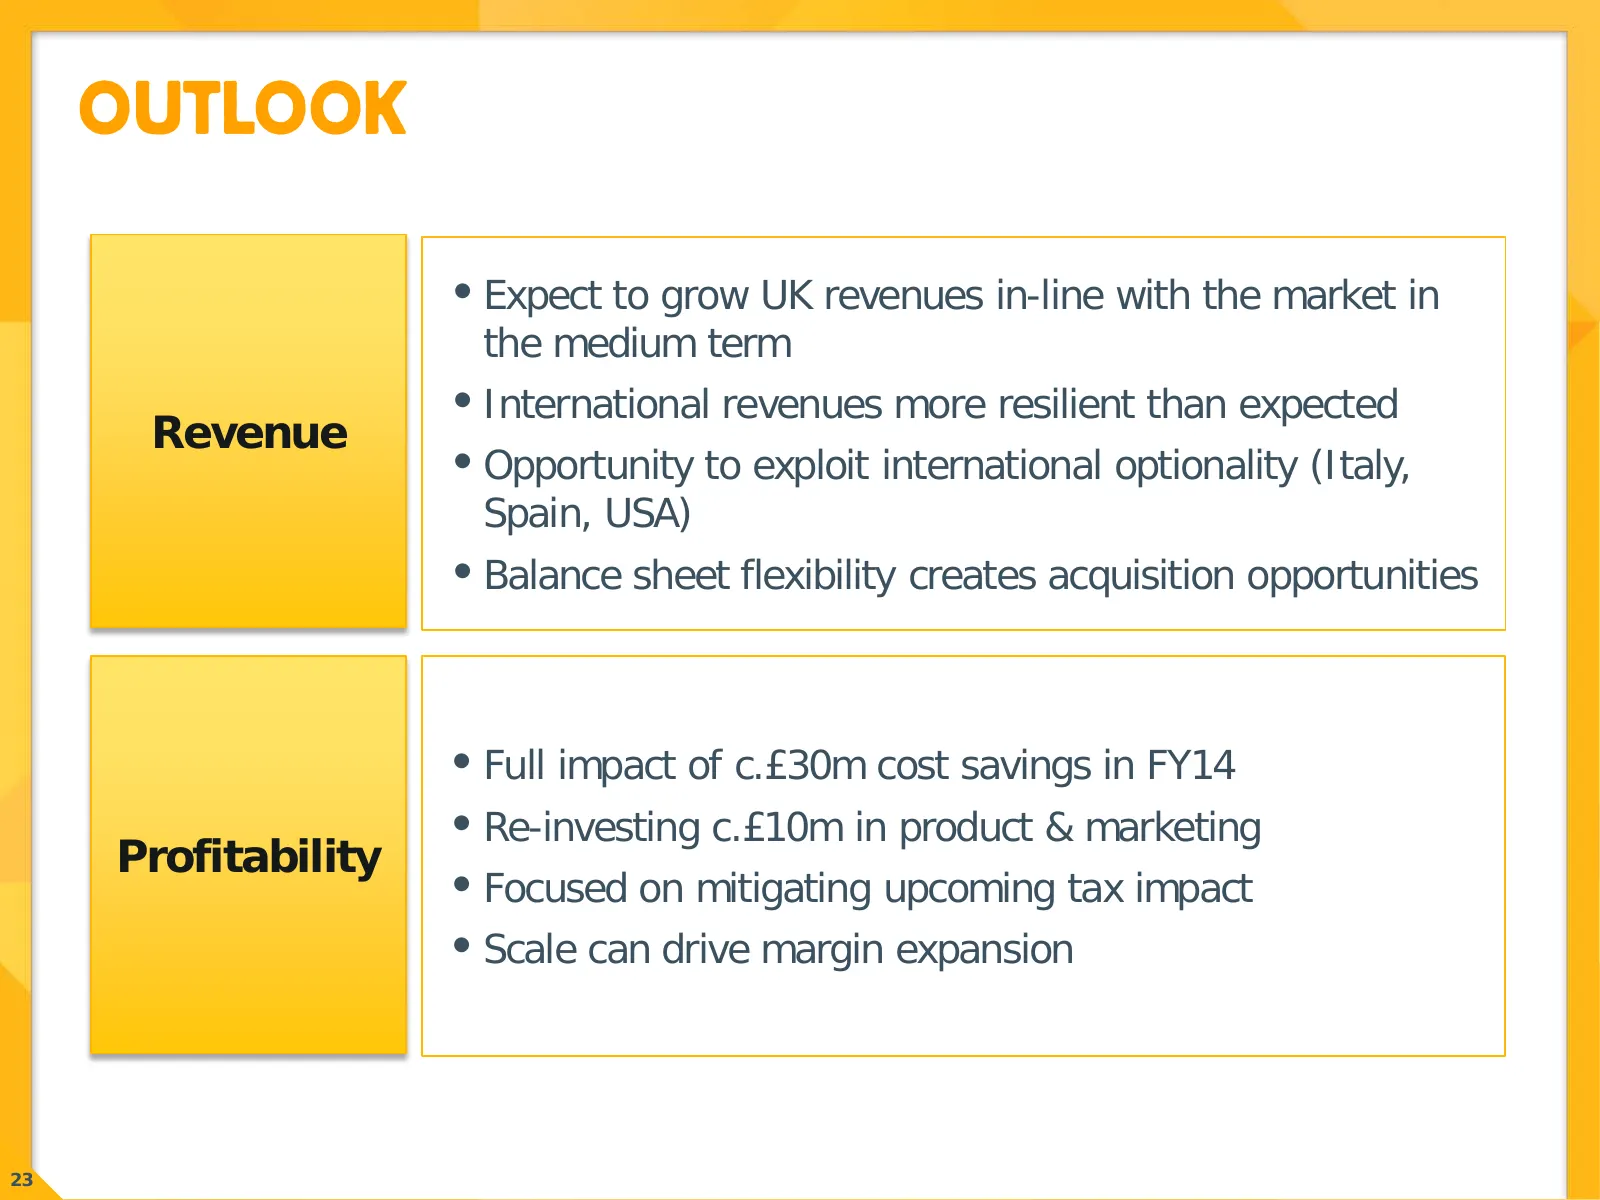
OUTLOOK • Expect to grow UK revenues in-line with the market in the medium term • International revenues more resilient than expected Revenue • Opportunity to exploit international optionality (Italy, Spain, USA) • Balance sheet flexibility creates acquisition opportunities • Full impact of c.£30m c
Slide 24: Summary
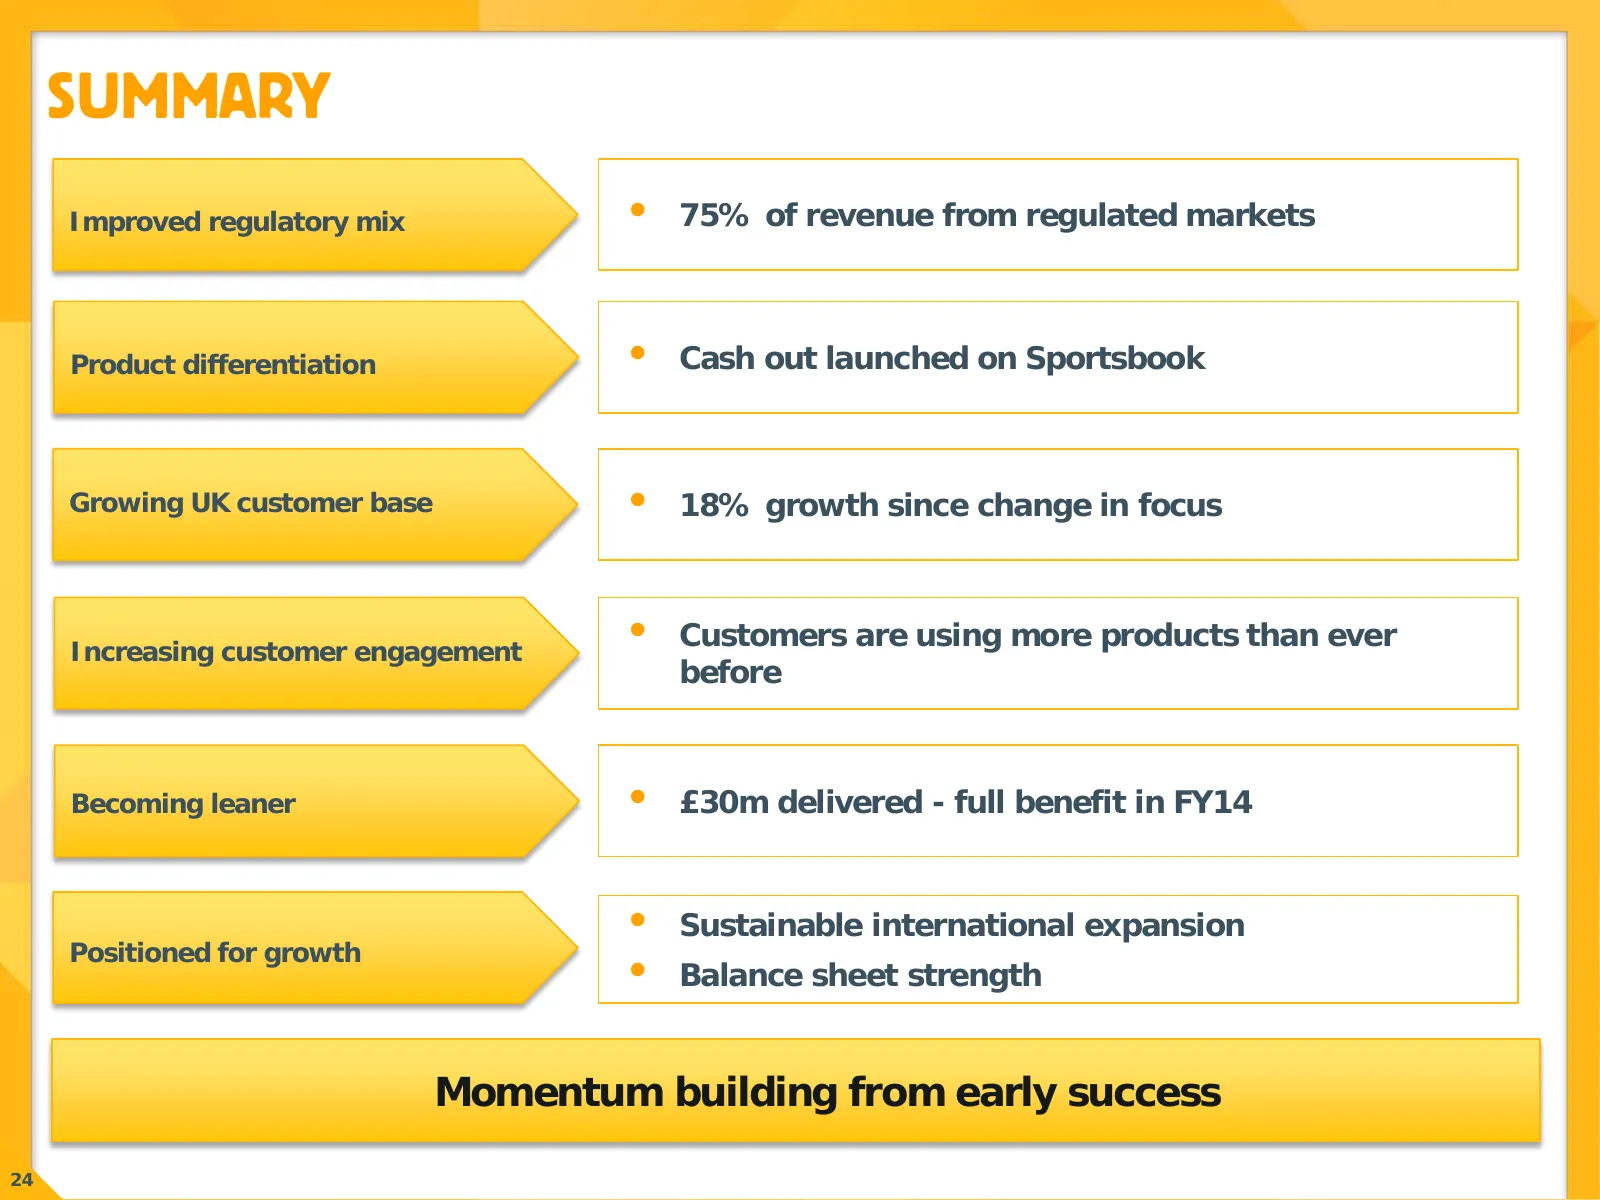
SUMMARY Improved regulatory mix • 75% of revenue from regulated markets Product differentiation • Cash out launched on Sportsbook Growing UK customer base • 18% growth since change in focus Increasing customer engagement • Customers are using more products than ever before Becoming leaner • £30m del

Slide 25: Appendix
APPENDIX 25
Slide 26: Group P&L
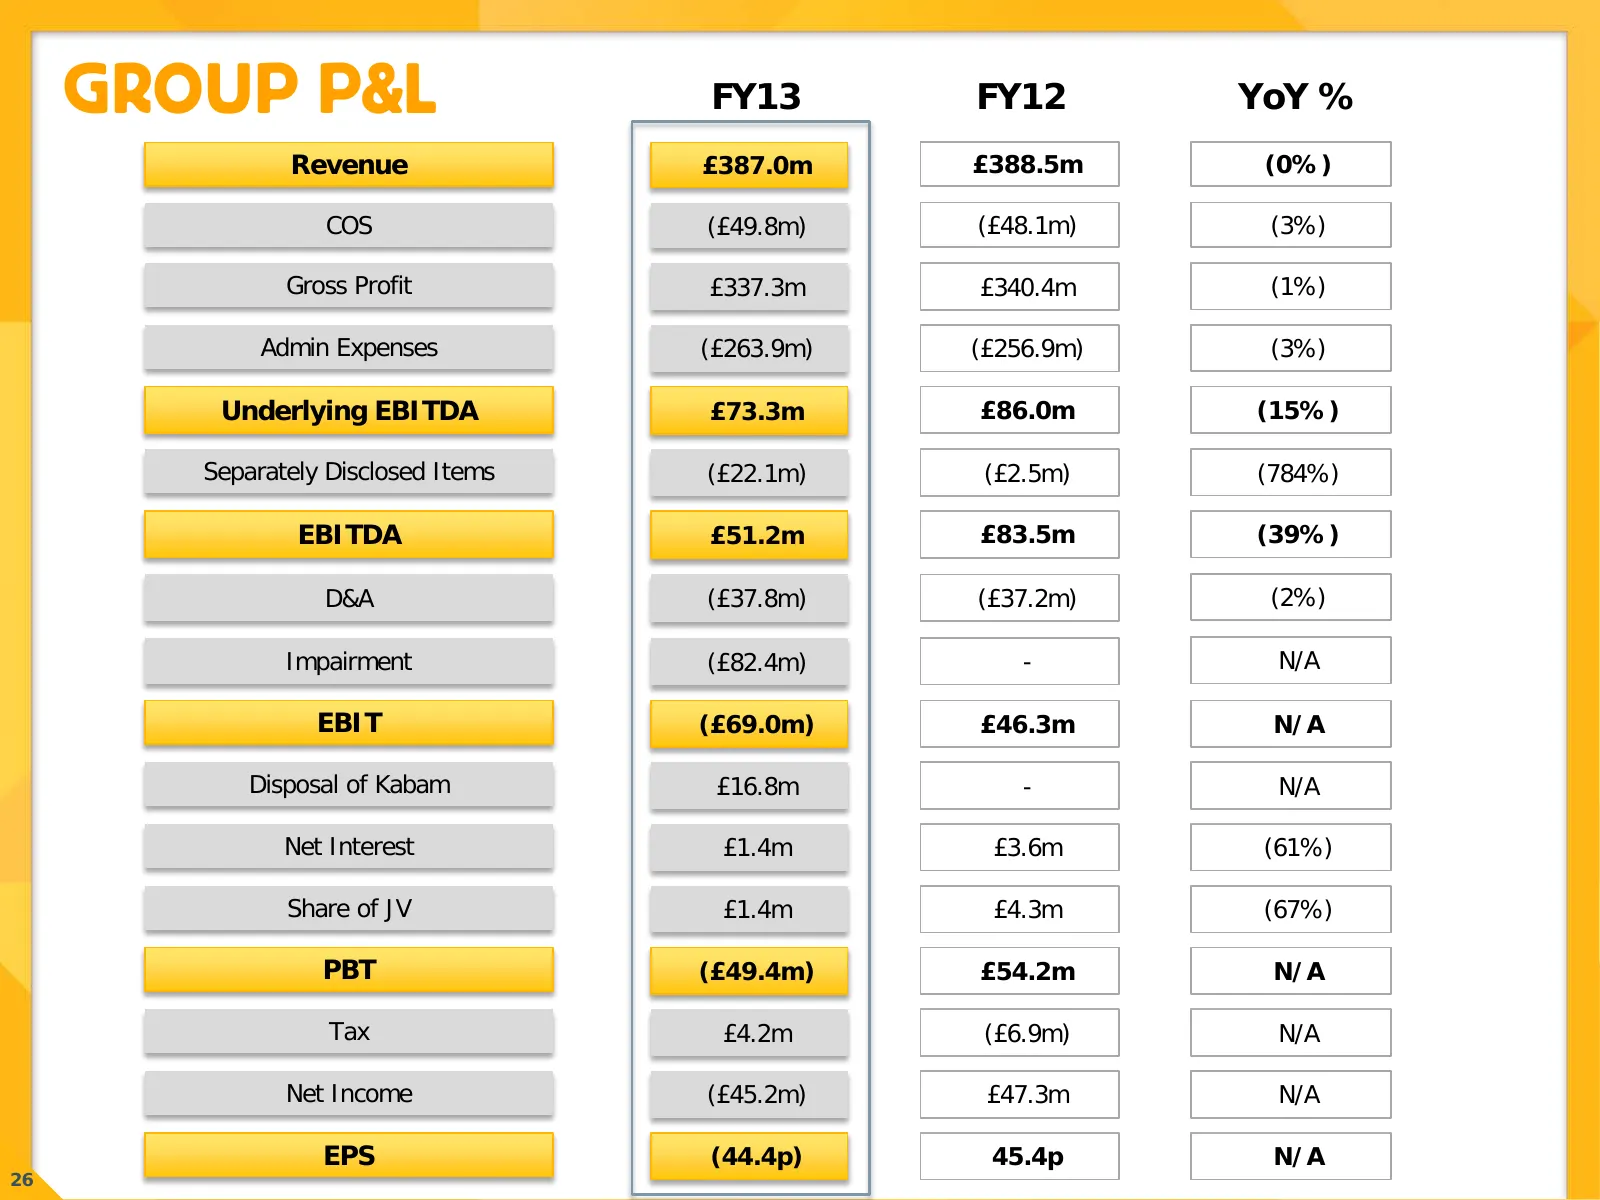
GROUP P&L FY13 FY12 YoY % Revenue £387.0m £388.5m (0%) COS (£49.8m) (£48.1m) (3%) Gross Profit £337.3m £340.4m (1%) Admin Expenses (£263.9m) (£256.9m) (3%) Underlying EBITDA £73.3m £86.0m (15%) Separately Disclosed Items (£22.1m) (£2.5m) (784%) EBITDA £51.2m £83.5m (39%) D&A (£37.8m) (£37.2m) (2%) I
Slide 27: FY12 Restated
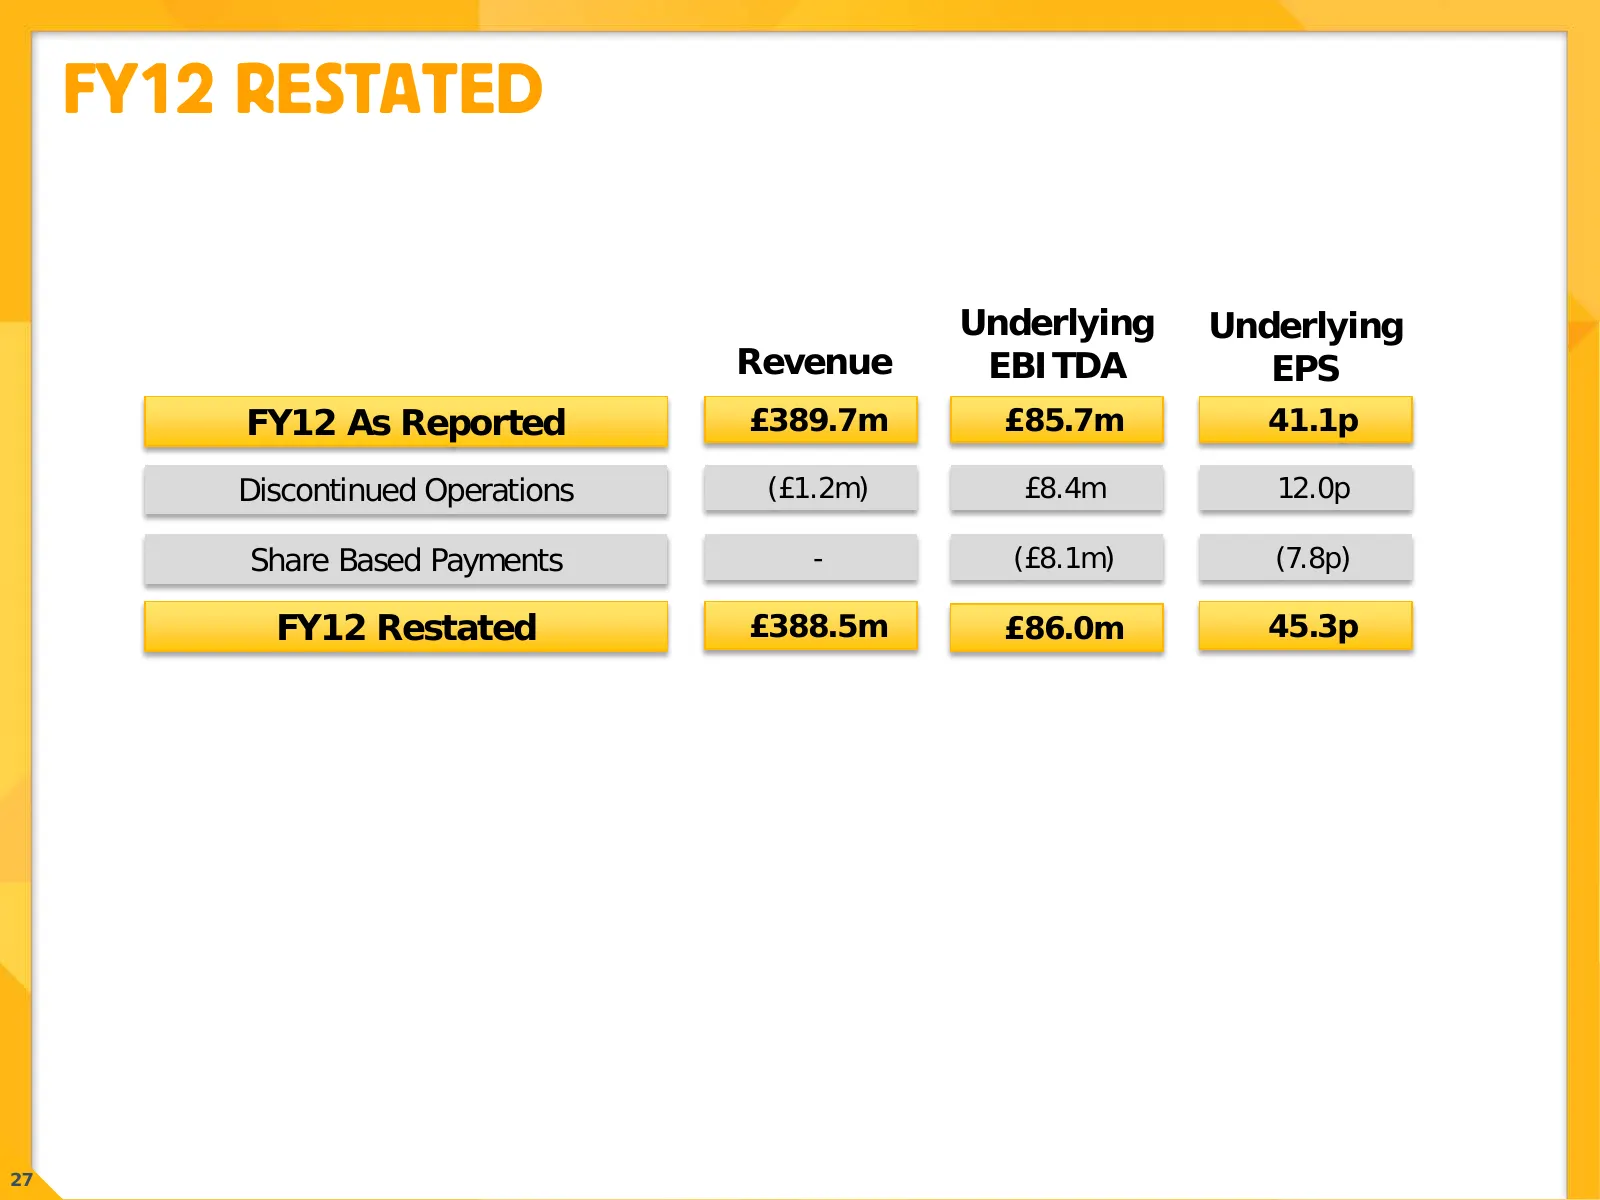
FY12 RESTATED Underlying Underlying Revenue EBITDA EPS FY12 As Reported £389.7m £85.7m 41.1p Discontinued Operations (£1.2m) £8.4m 12.0p Share Based Payments - (£8.1m) (7.8p) FY12 Restated £388.5m £86.0m 45.3p 27
Slide 28: KPIs
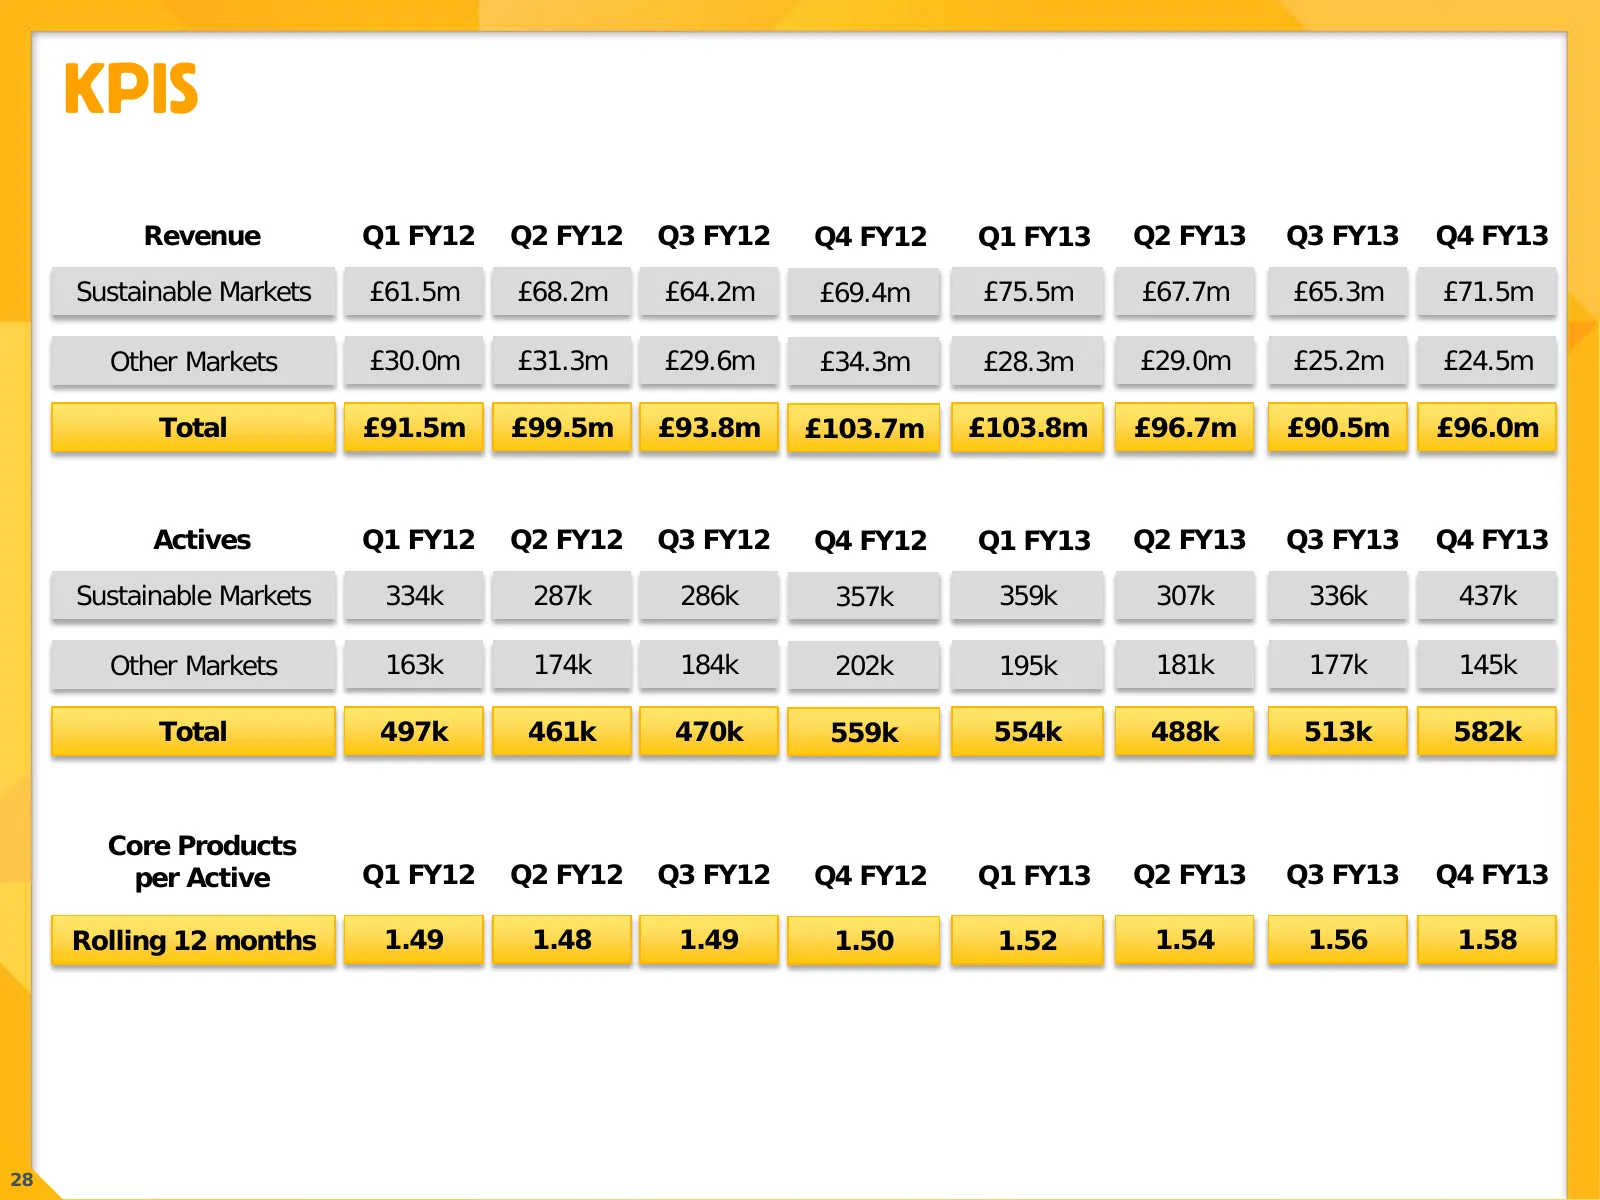
KPIS Revenue Q1 FY12 Q2 FY12 Q3 FY12 Q4 FY12 Q1 FY13 Q2 FY13 Q3 FY13 Q4 FY13 Sustainable Markets £61.5m £68.2m £64.2m £69.4m £75.5m £67.7m £65.3m £71.5m Other Markets £30.0m £31.3m £29.6m £34.3m £28.3m £29.0m £25.2m £24.5m Total £91.5m £99.5m £93.8m £103.7m £103.8m £96.7m £90.5m £96.0m Actives Q1 FY
Source: Internet Archive copy of flutter.com
More decks from Flutter Entertainment plc
 Q3 2026 Earnings Presentation15 slides · Nov 4, 2026
 Q2 2026 Earnings Presentation14 slides · Aug 5, 2026
 Investor Day (September 2024)152 slides · Sep 25, 2024
 Q2 2024 Earnings Presentation20 slides · Aug 13, 2024
 Q1 2024 Earnings Presentation20 slides · May 14, 2024
 FY2023 Earnings Presentation36 slides · Mar 26, 2024