Tiger Brands Limited · JSE:TBS
Tiger Brands — H1 2009 Earnings Presentation
68 slides from Tiger Brands's earnings presentation, March 2009
Slide 1: Investor Presentation: Group results and interim dividend declaration
Investing for growth INVESTOR PRESENTATION Group results and interim dividend declaration for the six months ended March 2009 1
Slide 2: Agenda
AGENDA ¾ CORPORATE STRATEGY ¾ BUSINESS PERFORMANCE OVERVIEW ¾ SALIENT FEATURES ¾ FINANCIAL ANALYSIS ¾ SEGMENTAL PERFORMANCE ¾ OUTLOOK Adding value to life 2
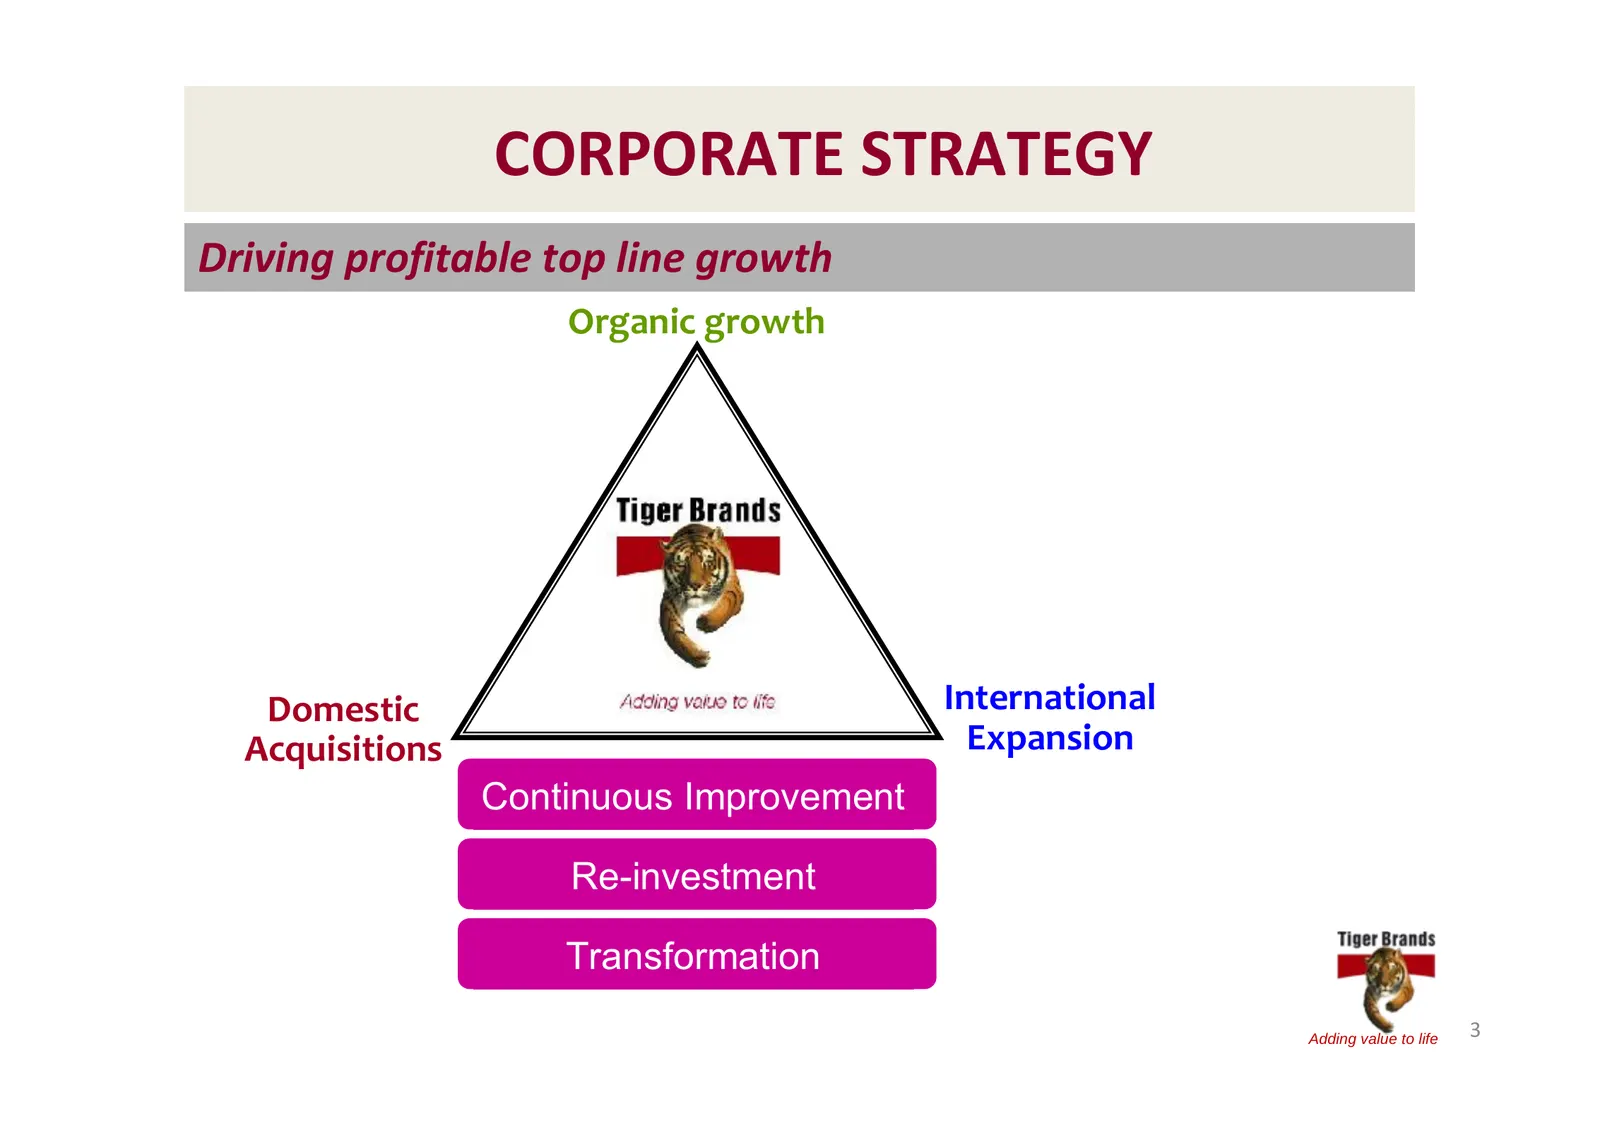
Slide 3: Corporate Strategy
CORPORATE STRATEGY Driving profitable top line growth Organic growth Domestic International Acquisitions Expansion Continuous Improvement Re-investment Transformation Adding value to life 3
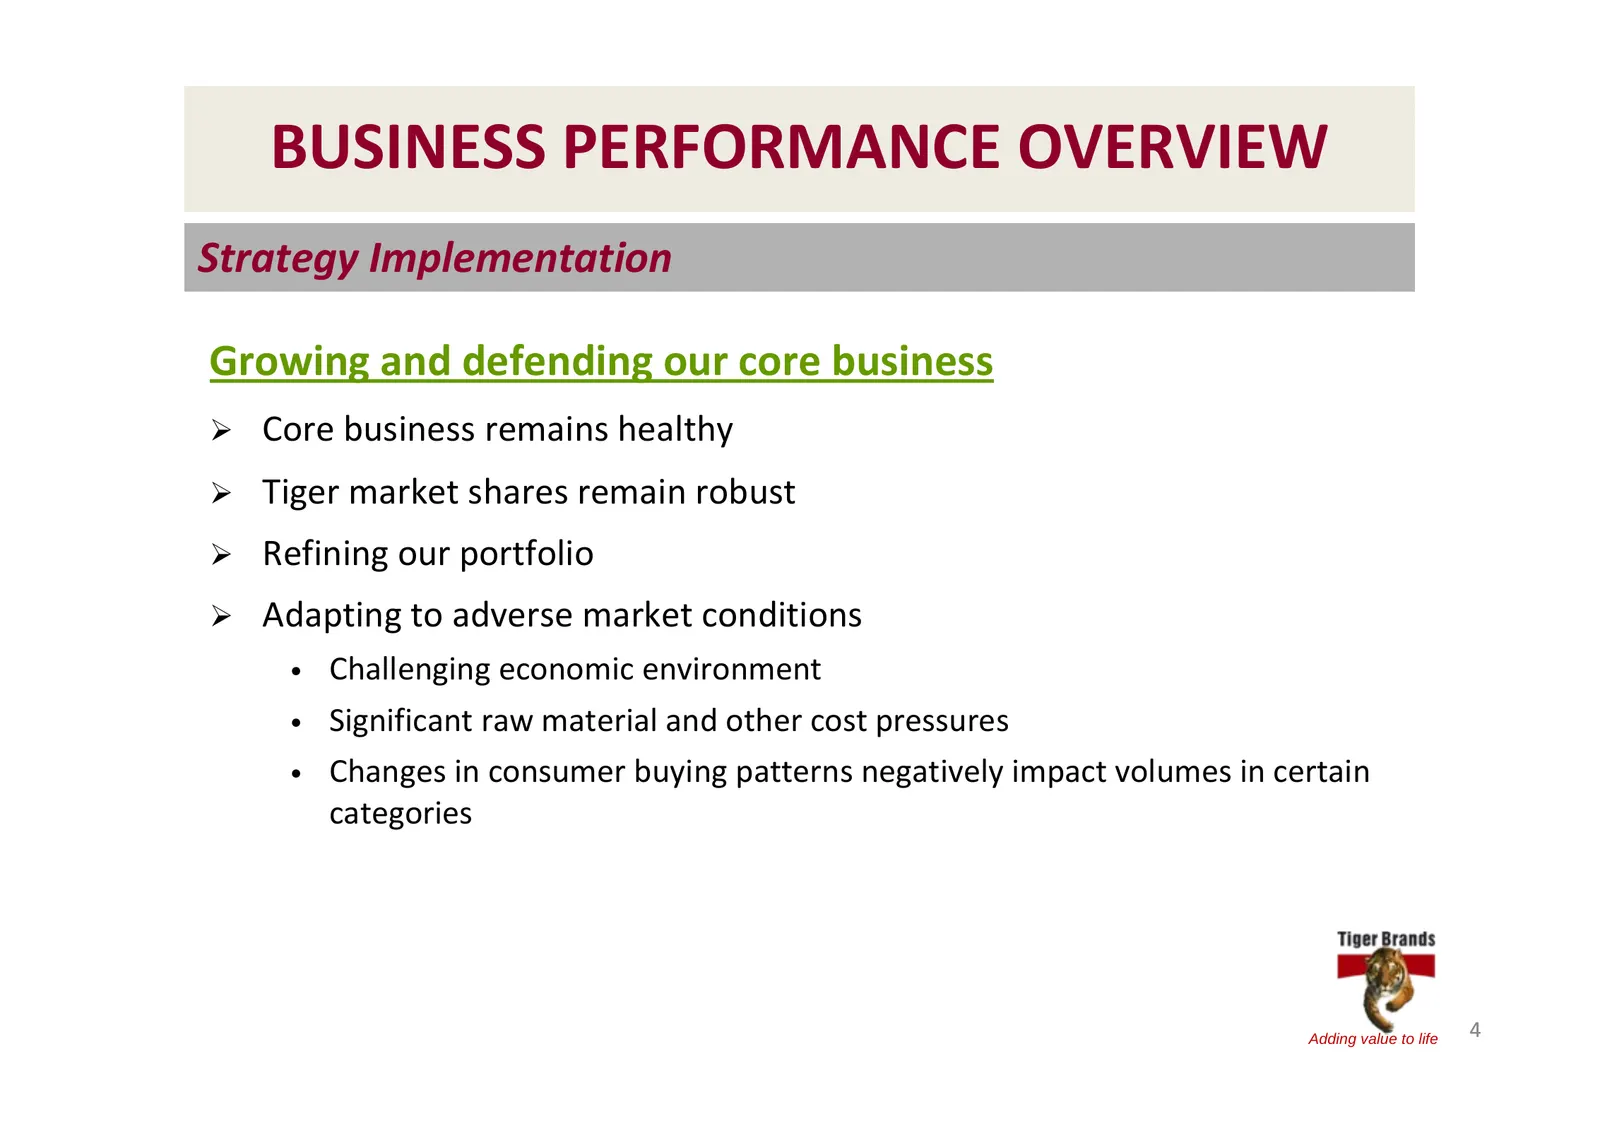
Slide 4: Business Performance Overview: Growing and defending our core business
BUSINESS PERFORMANCE OVERVIEW Strategy Implementation Growing and defending our core business ¾ Core business remains healthy ¾ Tiger market shares remain robust ¾ Refining our portfolio ¾ Adapting to adverse market conditions • Challenging economic environment • Significant raw material and other c
Slide 5: Domestic Acquisitions/Disposals
BUSINESS PERFORMANCE OVERVIEW Strategy Implementation Domestic Acquisitions/Disposals ¾ Disposal of Sea Harvest on track ¾ Unsuccessful attempt to acquire AVI Limited ¾ Continuing to search for local acquisitions Adding value to life 5
Slide 6: International Expansion
BUSINESS PERFORMANCE OVERVIEW Strategy implementation International Expansion ¾ Bedding down recent acquisitions in East & Central Africa • Haco Industries (Kenya) • Chococam (Cameroon) ¾ Actively seeking further acquisitions ¾ Driving TBI exports Adding value to life 6
Slide 7: Strategy Implementation: Enablers
BUSINESS PERFORMANCE OVERVIEW Strategy implementation Enablers Continuous improvement Investing in Capex and our People Further 10% BEE deal to be announced during F2009 Adding value to life 7
Slide 8: Business Performance Overview: Great Brands Great People
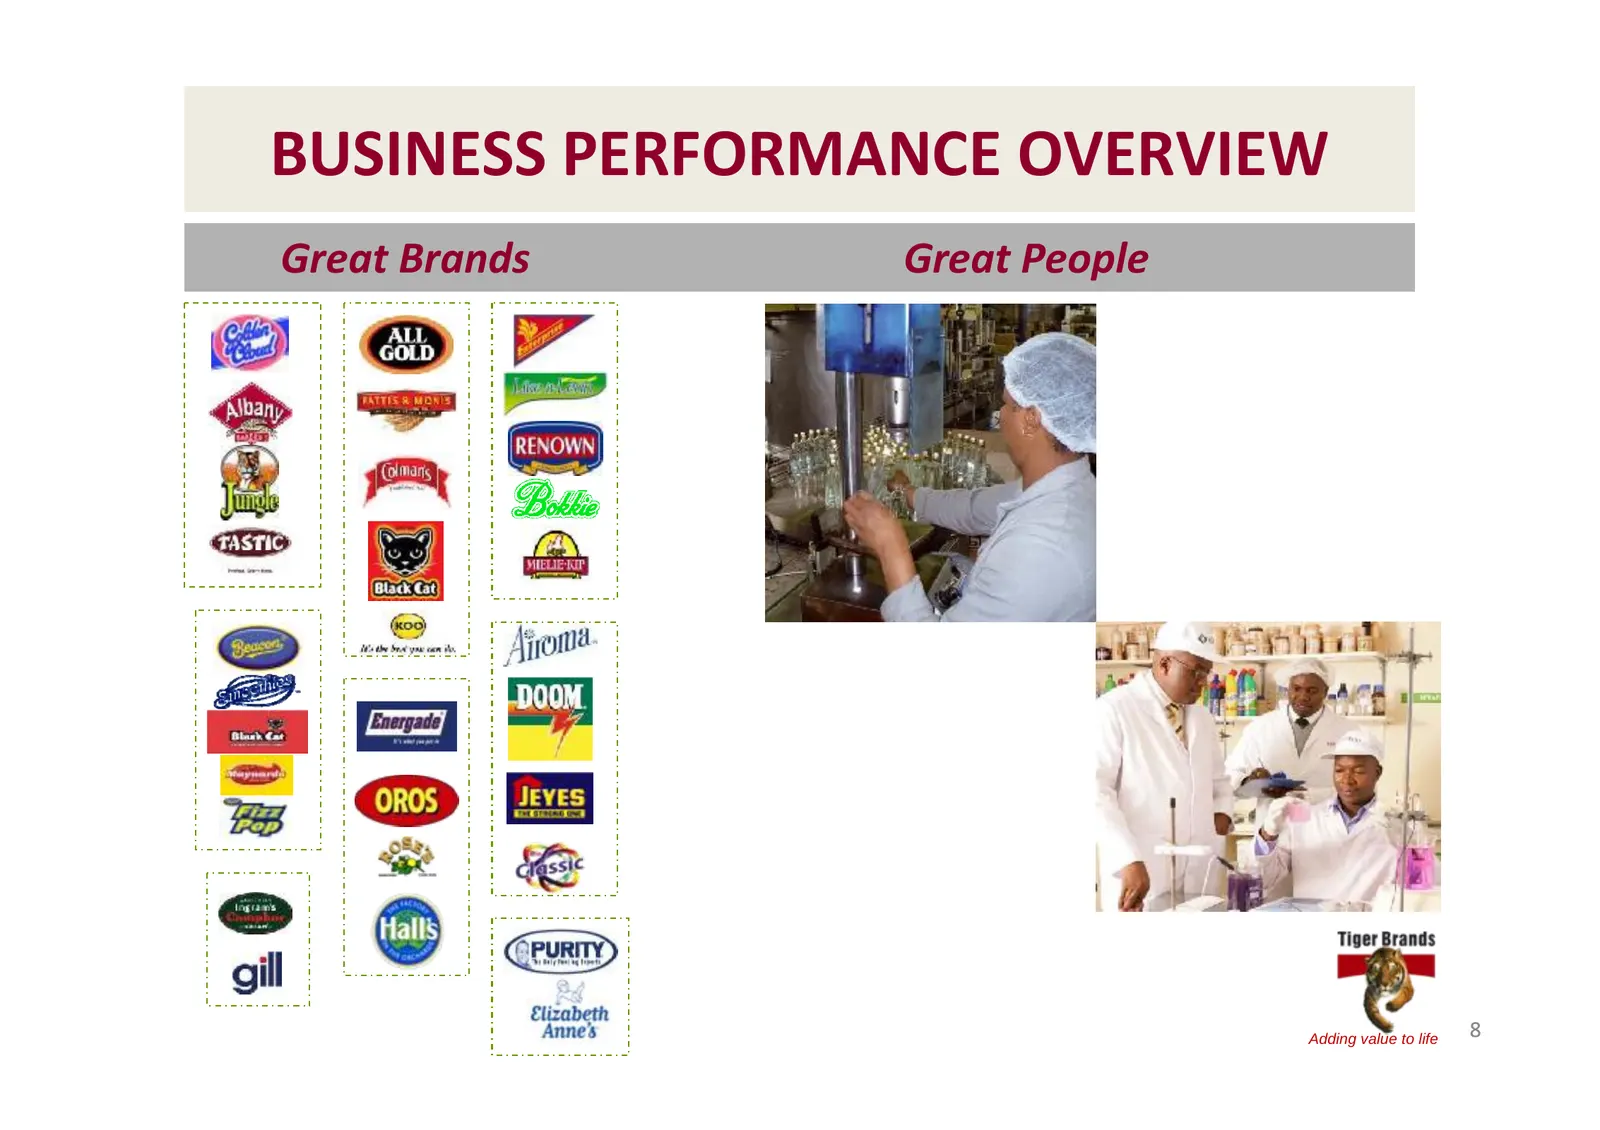
BUSINESS PERFORMANCE OVERVIEW Great Brands Great People Adding value to life 8
Slide 9: Salient Features
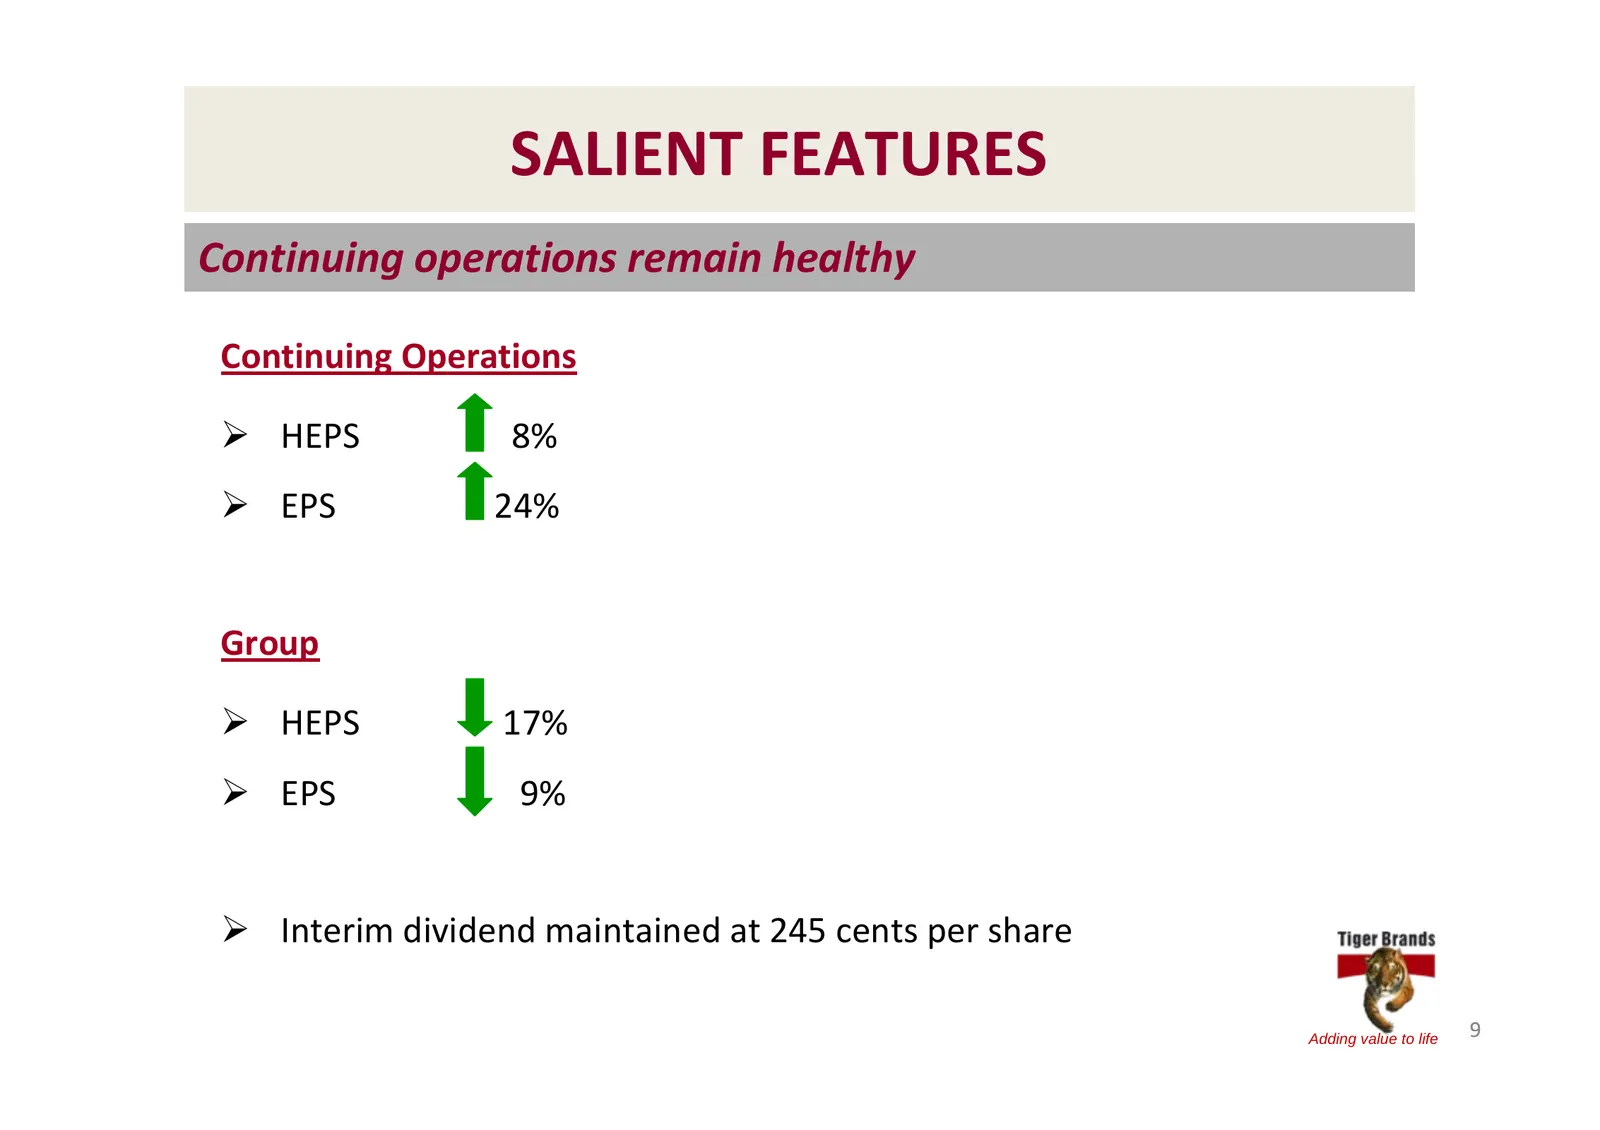
SALIENT FEATURES Continuing operations remain healthy Continuing Operations ¾ HEPS 8% ¾ EPS 24% Group ¾ HEPS 17% ¾ EPS 9% ¾ Interim dividend maintained at 245 cents per share Adding value to life 9
Slide 10: Financial Analysis: Michael Fleming, CFO
FINANCIAL ANALYSIS Michael Fleming CFO Adding value to life 10
Slide 11: Income Statement to March 2009
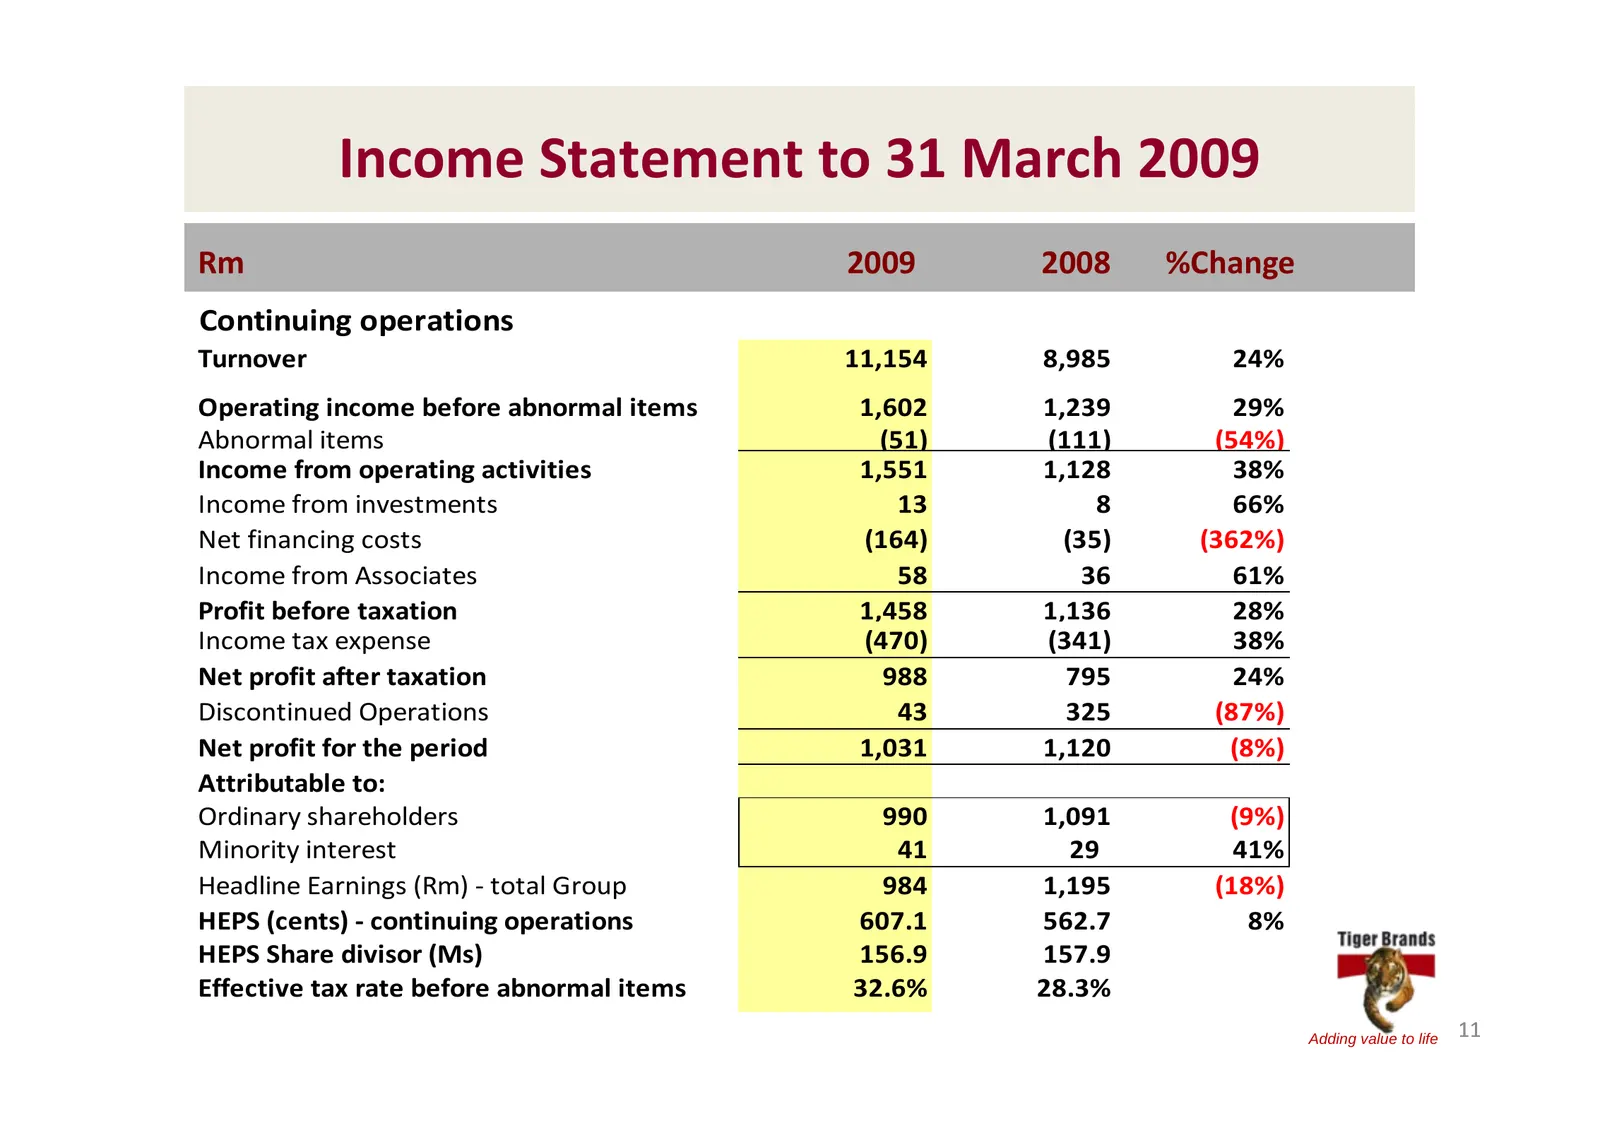
Income Statement to 31 March 2009 Rm 2009 2008 %Change Continuing operations Turnover 11,154 8,985 24% Operating income before abnormal items 1,602 1,239 29% Abnormal items (51) (111) (54%) Income from operating activities 1,551 1,128 38% Income from investments 13 8 66% Net financing costs (164) (3
Slide 12: Turnover growth by operating segment
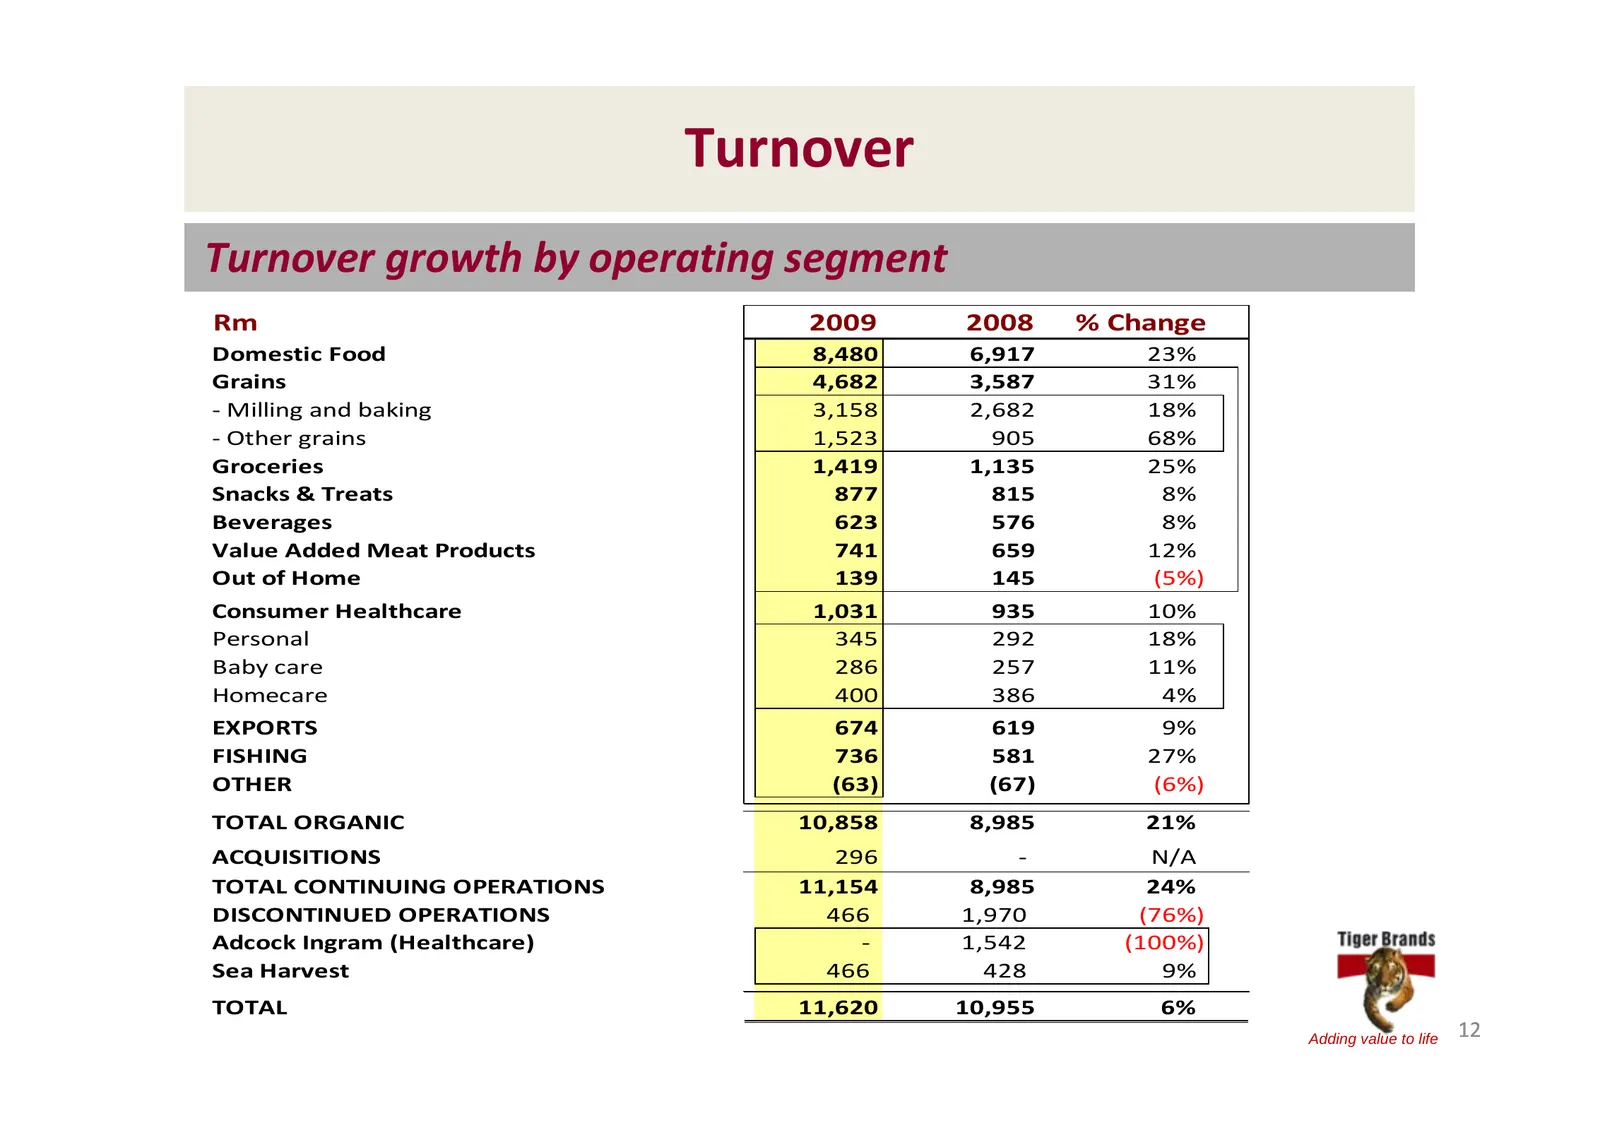
Turnover Turnover growth by operating segment Rm 2009 2008 % Change Domestic Food 8,480 6,917 23% Grains 4,682 3,587 31% ‐ Milling and baking 3,158 2,682 18% ‐ Other grains 1,523 905 68% Groceries 1,419 1,135 25% Snacks & Treats 877 815 8% Beverages 623 576 8% Value Added Meat Products 741 659 12% O
Slide 13: Income Statement to March 2009
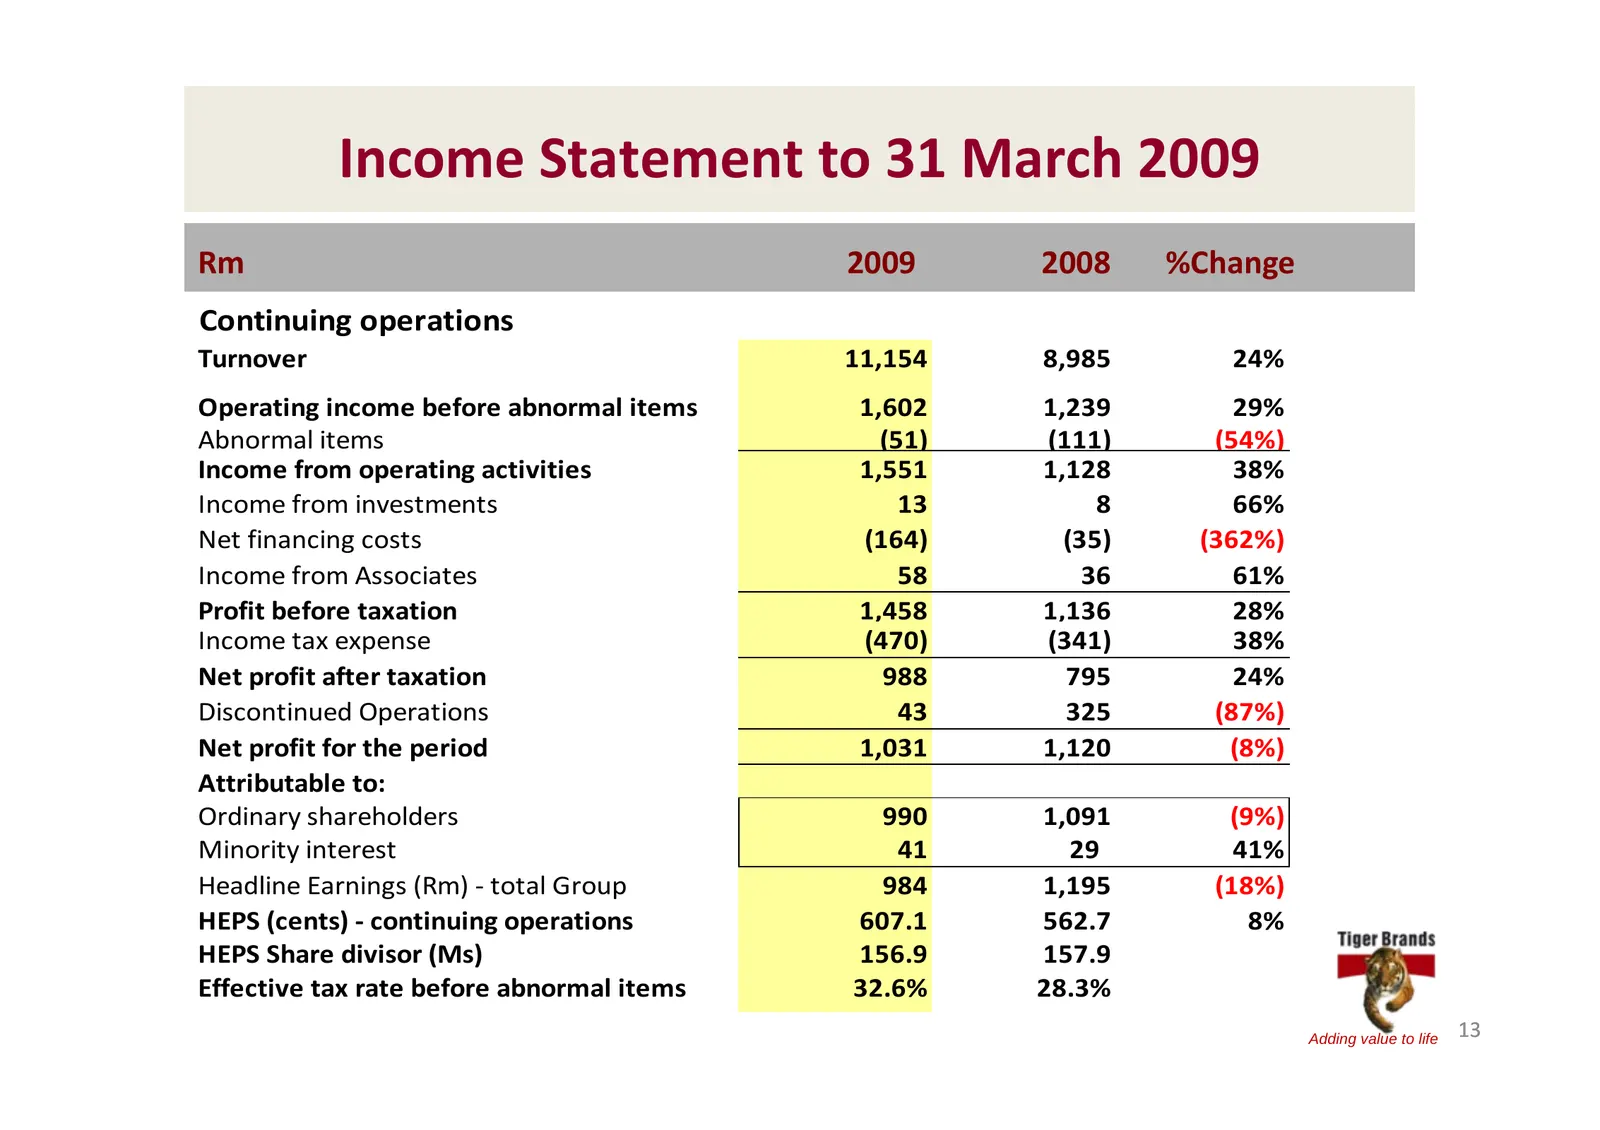
Income Statement to 31 March 2009 Rm 2009 2008 %Change Continuing operations Turnover 11,154 8,985 24% Operating income before abnormal items 1,602 1,239 29% Abnormal items (51) (111) (54%) Income from operating activities 1,551 1,128 38% Income from investments 13 8 66% Net financing costs (164) (3
Slide 14: Operating income before abnormal items
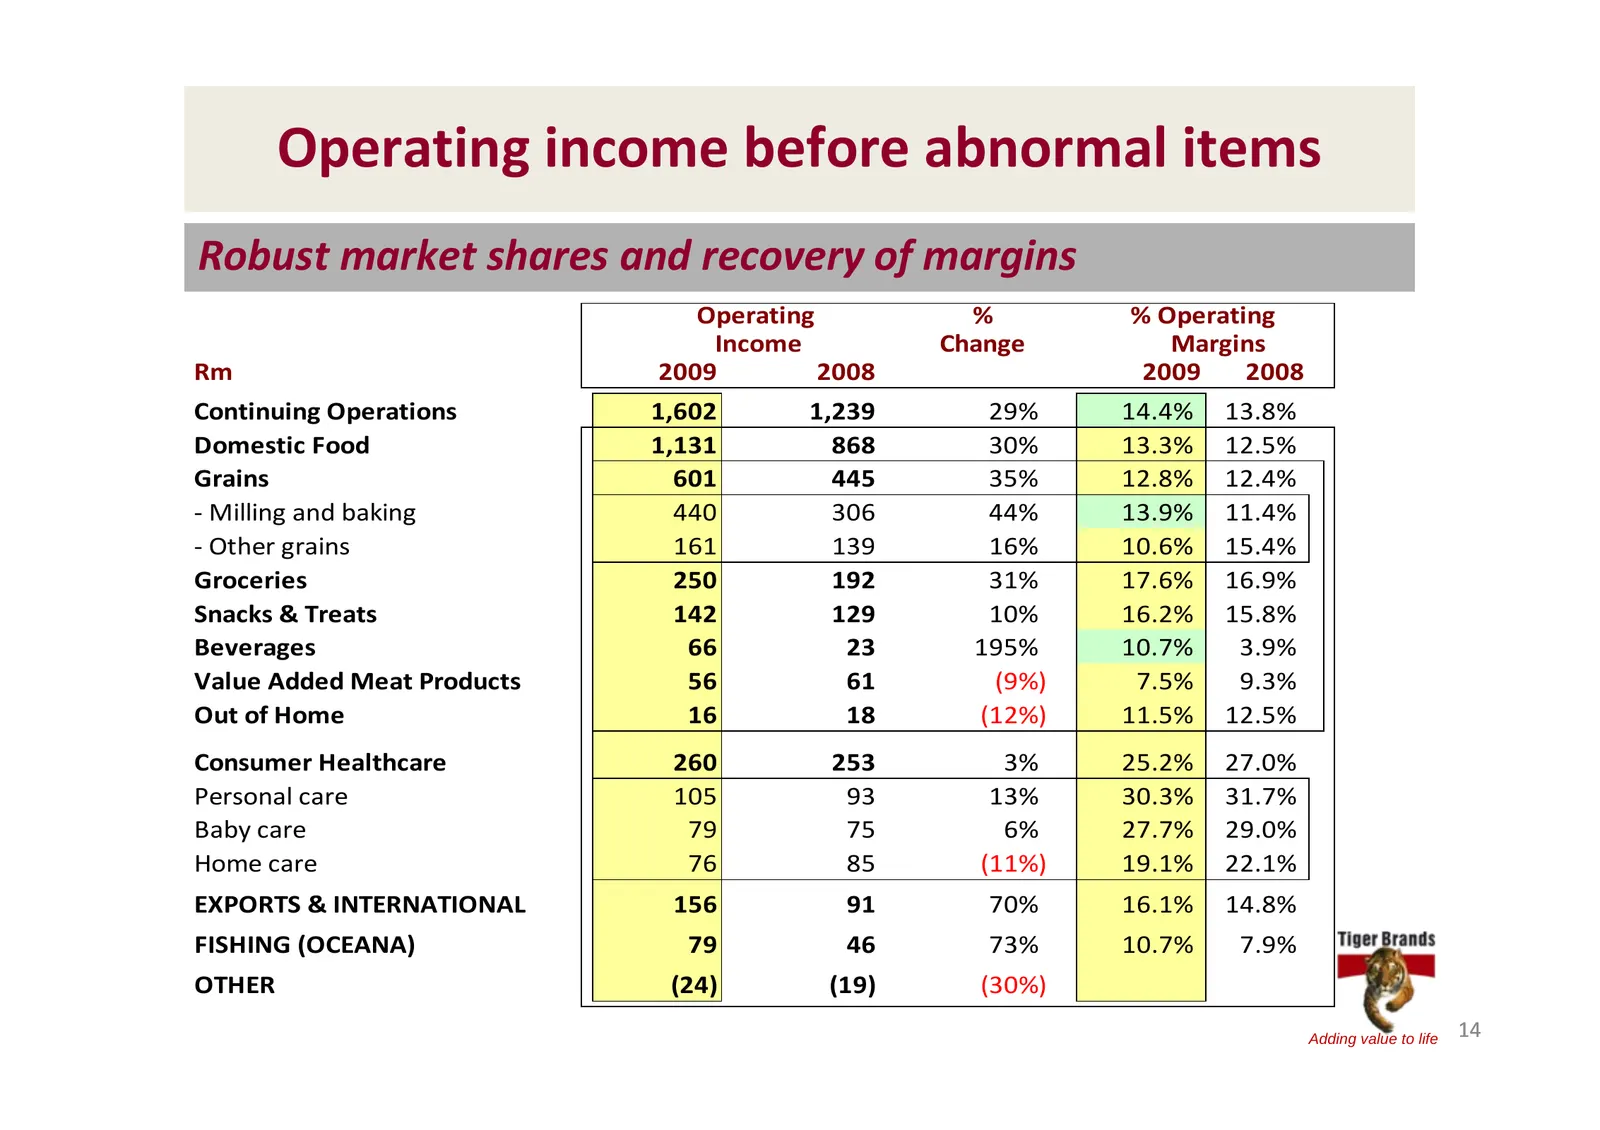
Operating income before abnormal items Robust market shares and recovery of margins Operating % % Operating Income Change Margins Rm 2009 2008 2009 2008 Continuing Operations 1,602 1,239 29% 14.4% 13.8% Domestic Food 1,131 868 30% 13.3% 12.5% Grains 601 445 35% 12.8% 12.4% ‐ Milling and baking 440 3
Slide 15: Abnormal Items
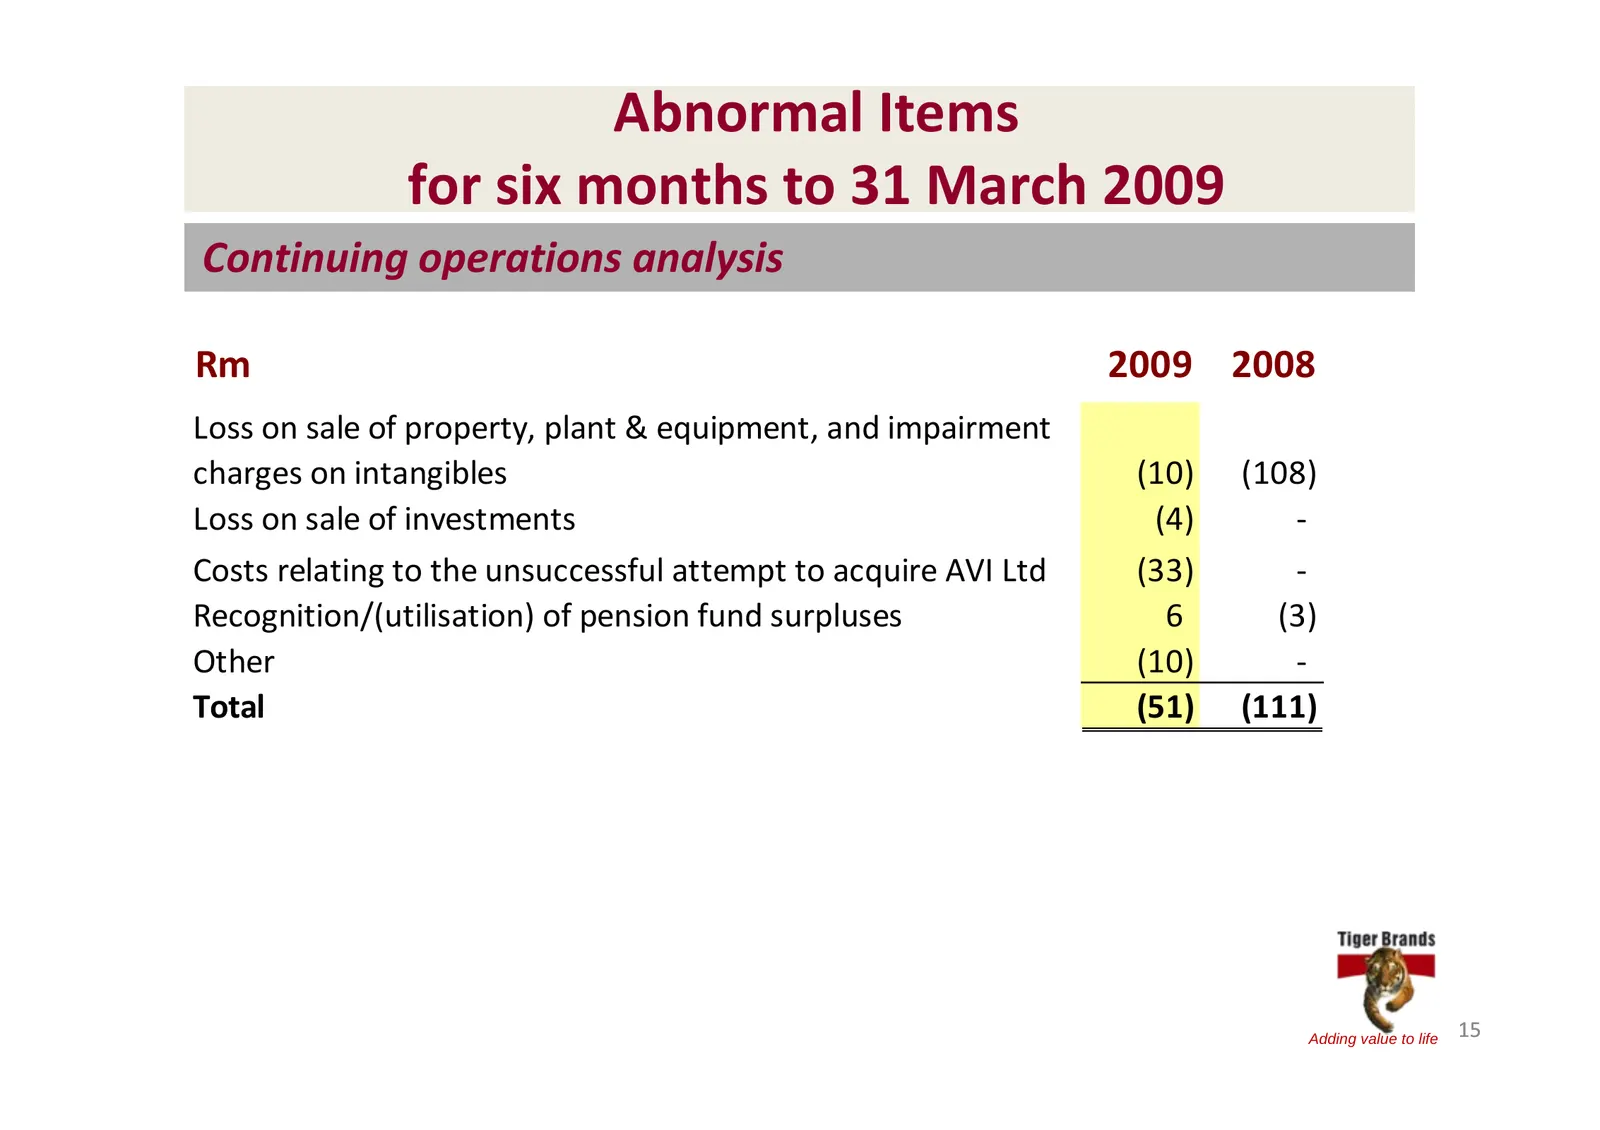
Abnormal Items for six months to 31 March 2009 Continuing operations analysis Rm 2009 2008 Loss on sale of property, plant & equipment, and impairment charges on intangibles (10) (108) Loss on sale of investments (4) ‐ Costs relating to the unsuccessful attempt to acquire AVI Ltd (33) ‐ Recognition/
Slide 16: Segmental Analysis of HEPS
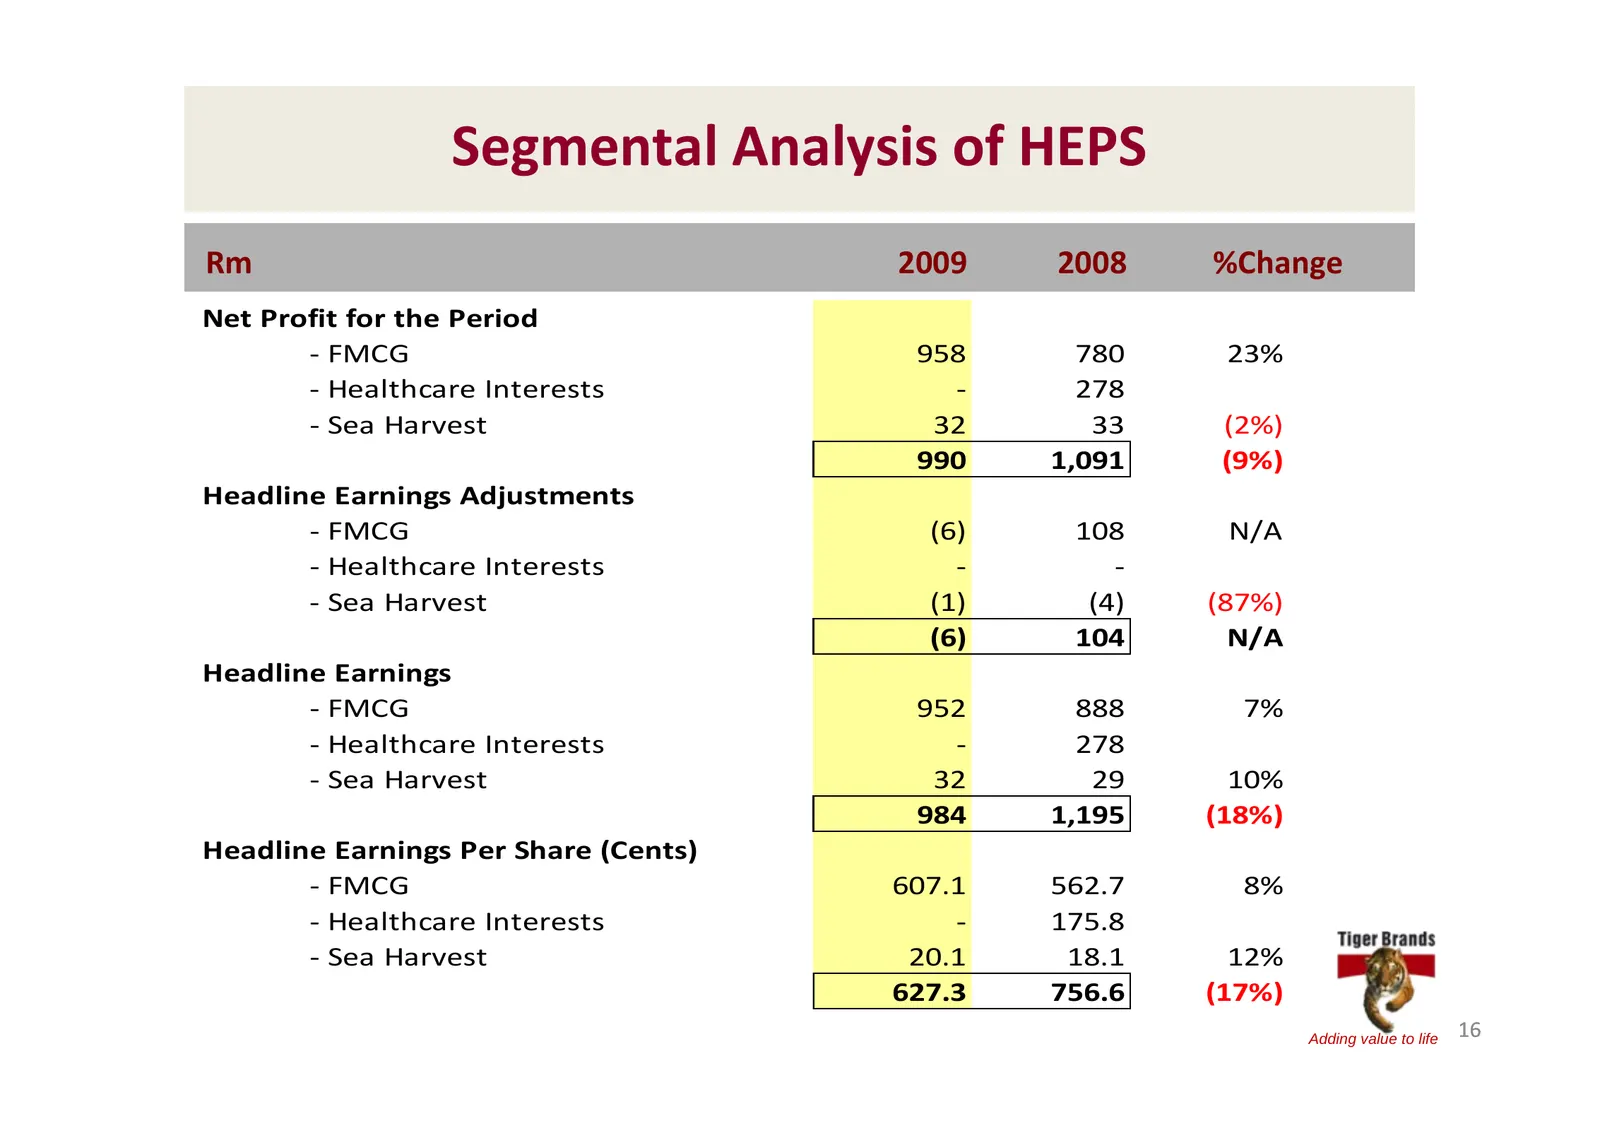
Segmental Analysis of HEPS Rm 2009 2008 %Change Net Profit for the Period ‐ FMCG 958 780 23% ‐ Healthcare Interests ‐ 278 ‐ Sea Harvest 32 33 (2%) 990 1,091 (9%) Headline Earnings Adjustments ‐ FMCG (6) 108 N/A ‐ Healthcare Interests ‐ ‐ ‐ Sea Harvest (1) (4) (87%) (6) 104 N/A Headline Earnings ‐ FM
Slide 17: Normalised HEPS Reconciliation
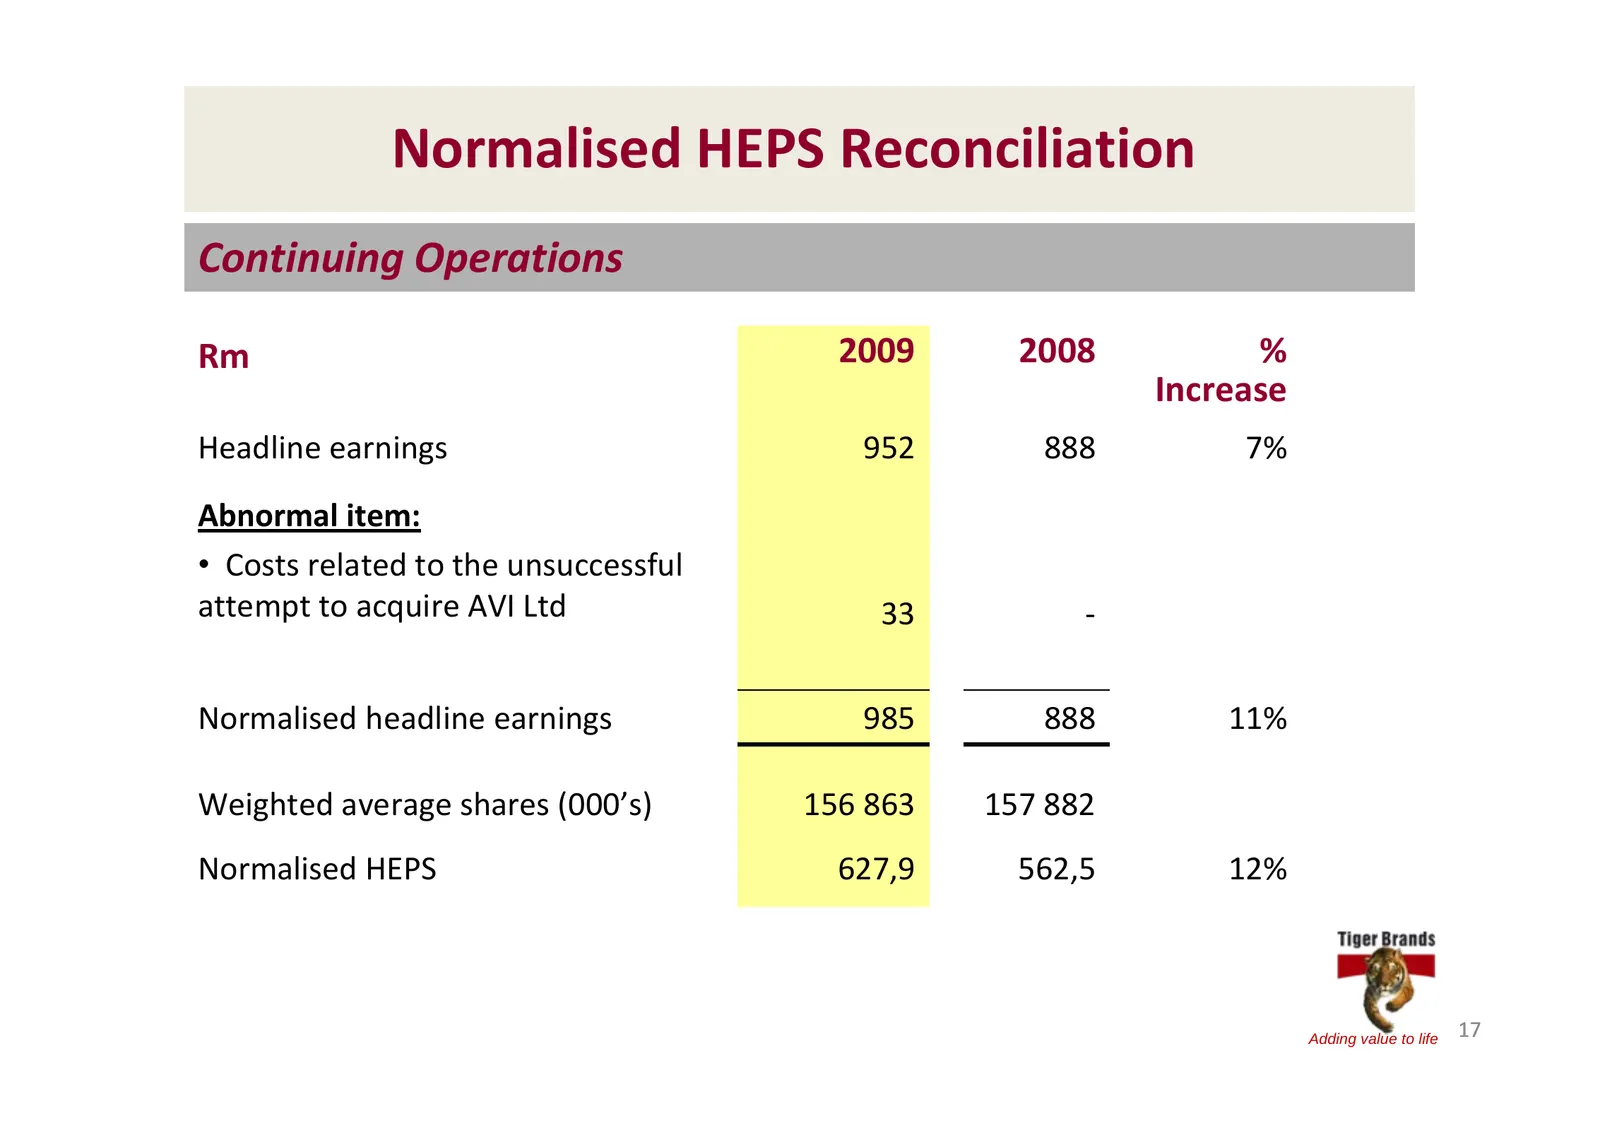
Normalised HEPS Reconciliation Continuing Operations Rm 2009 2008 % Increase Headline earnings 952 888 7% Abnormal item: • Costs related to the unsuccessful attempt to acquire AVI Ltd 33 ‐ Normalised headline earnings 985 888 11% Weighted average shares (000’s) 156 863 157 882 Normalised HEPS 627,9
Slide 18: Key Financial Ratios
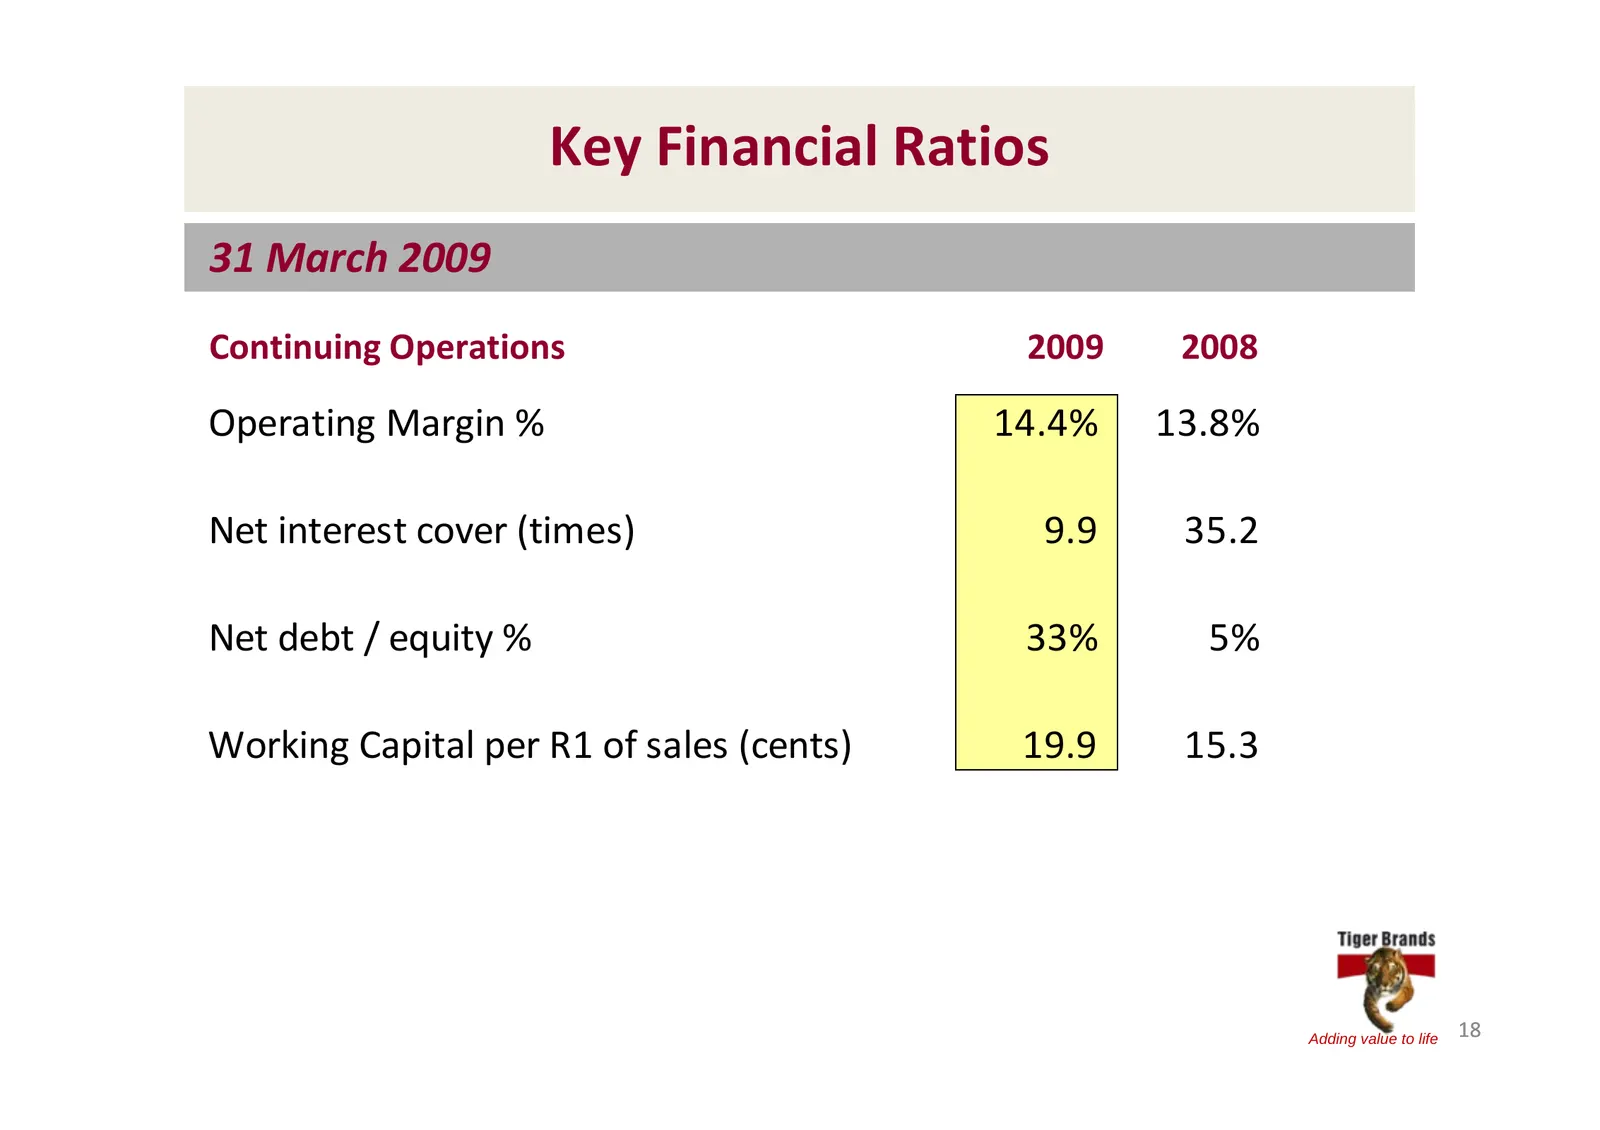
Key Financial Ratios 31 March 2009 Continuing Operations 2009 2008 Operating Margin % 14.4% 13.8% Net interest cover (times) 9.9 35.2 Net debt / equity % 33% 5% Working Capital per R1 of sales (cents) 19.9 15.3 Adding value to life 18
Slide 19: Group Balance Sheet
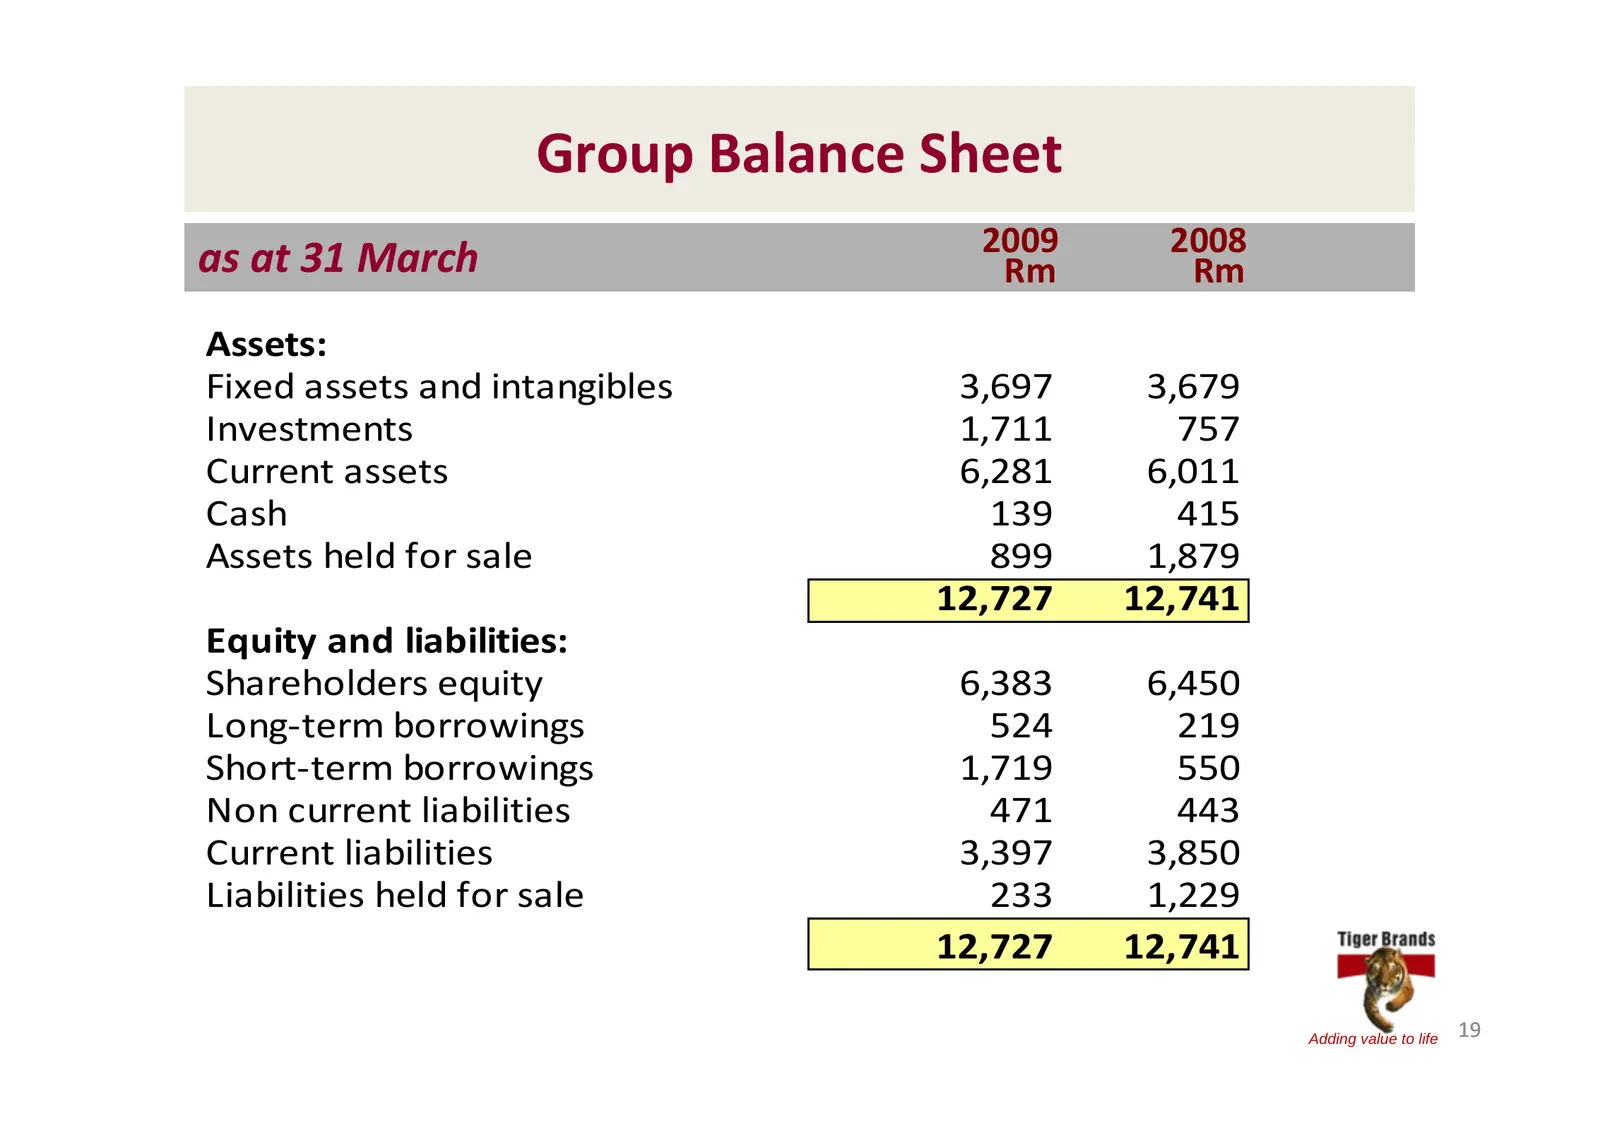
Group Balance Sheet 2009 2008 as at 31 March Rm Rm Assets: Fixed assets and intangibles 3,697 3,679 Investments 1,711 757 Current assets 6,281 6,011 Cash 139 415 Assets held for sale 899 1,879 12,727 12,741 Equity and liabilities: Shareholders equity 6,383 6,450 Long‐term borrowings 524 219 Short‐te
Slide 20: Cash Movement to March
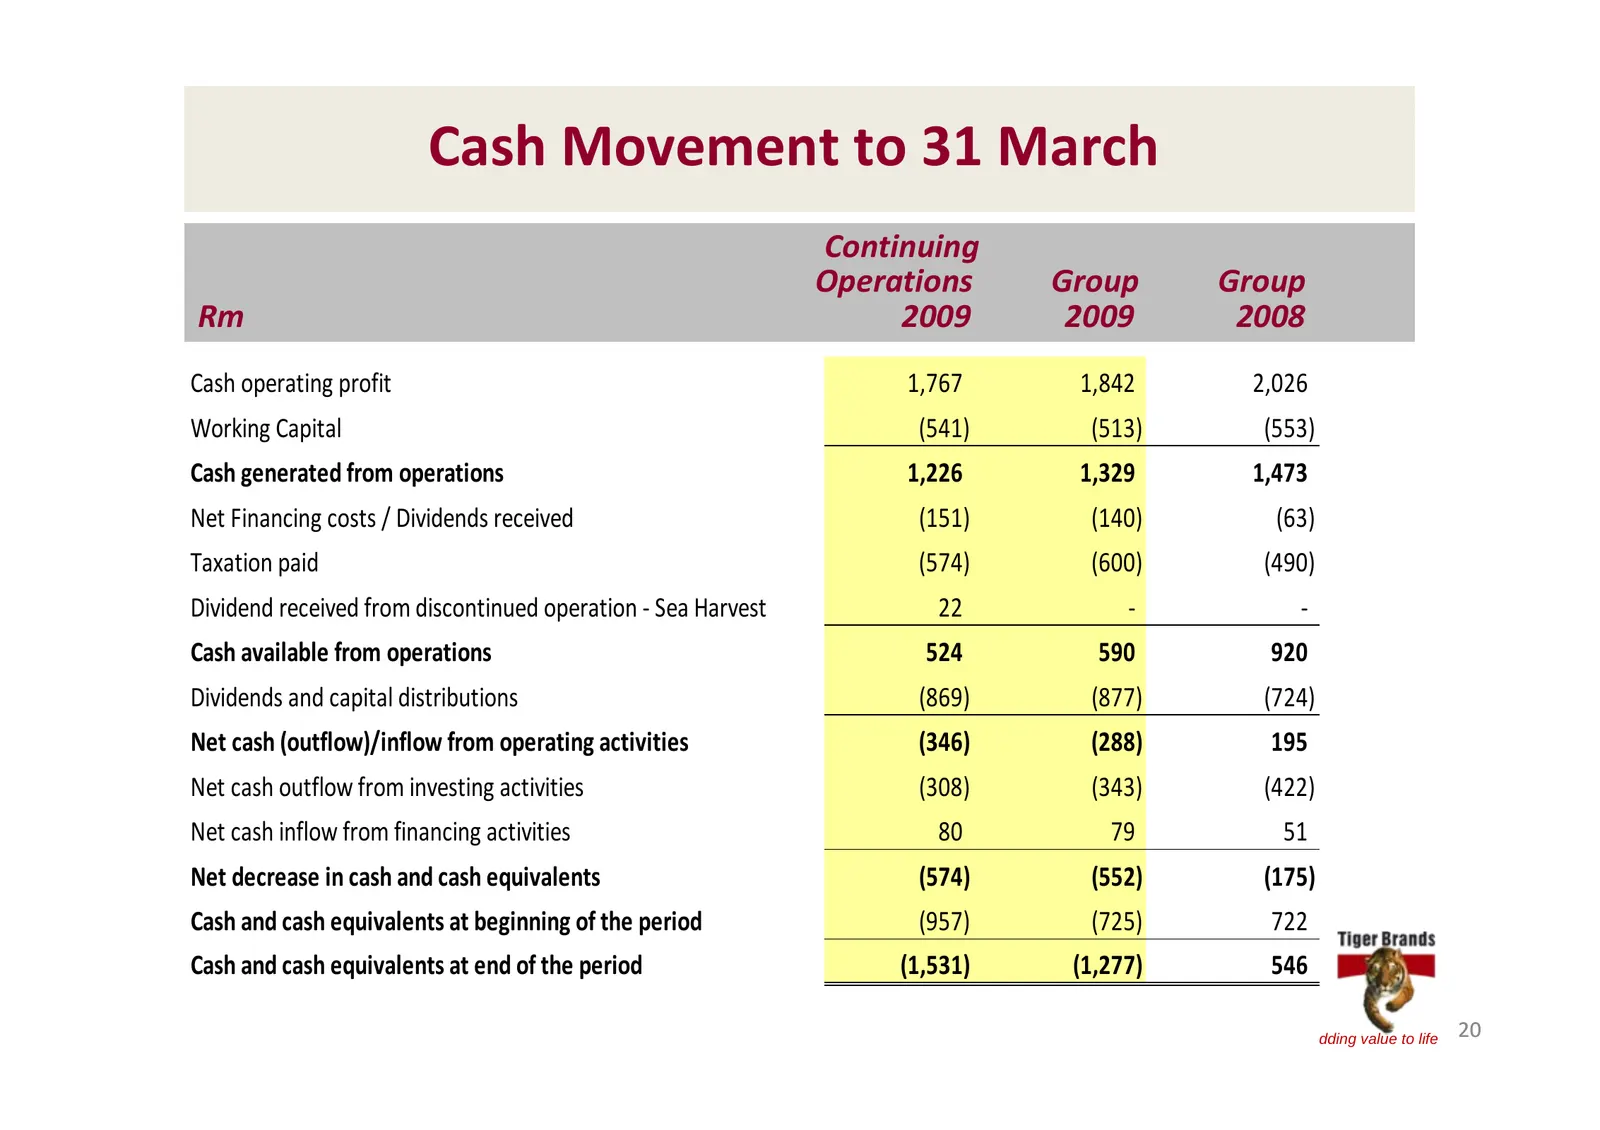
Cash Movement to 31 March Continuing Operations Group Group Rm 2009 2009 2008 Cash operating profit 1,767 1,842 2,026 Working Capital (541) (513) (553) Cash generated from operations 1,226 1,329 1,473 Net Financing costs / Dividends received (151) (140) (63) Taxation paid (574) (600) (490) Dividend
Slide 21: Capital Expenditure & Commitments
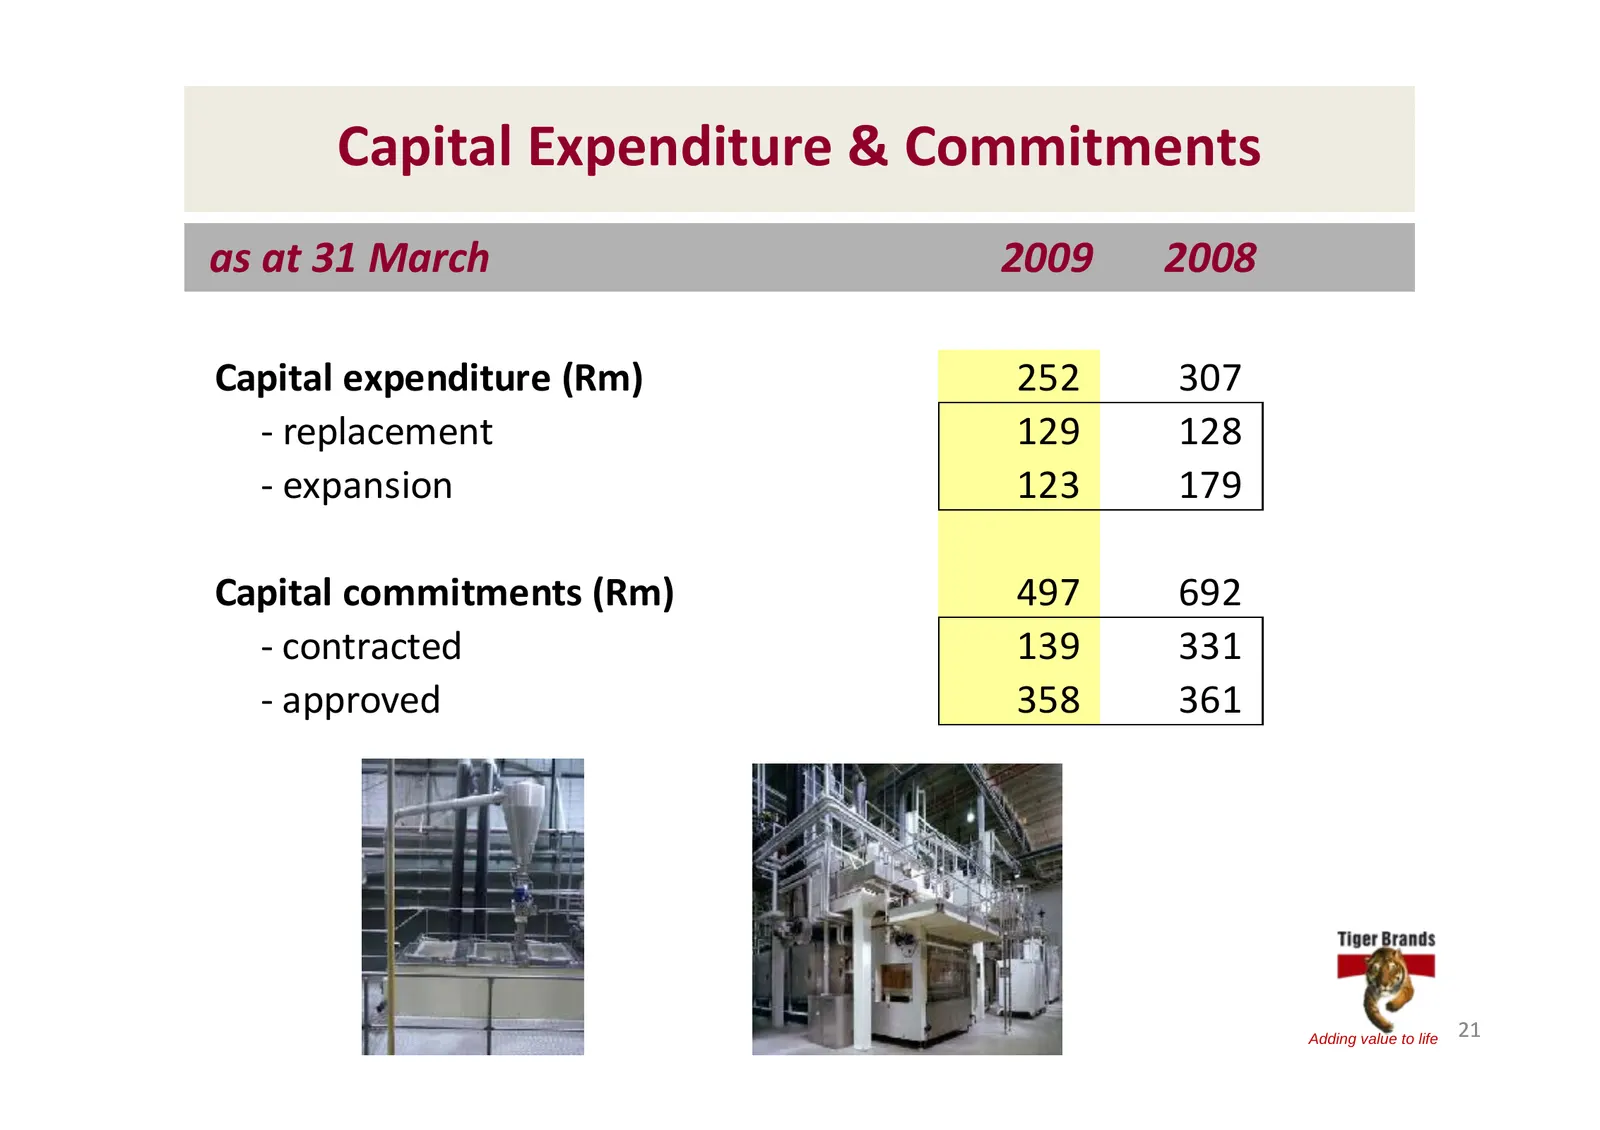
Capital Expenditure & Commitments as at 31 March 2009 2008 Capital expenditure (Rm) 252 307 ‐ replacement 129 128 ‐ expansion 123 179 Capital commitments (Rm) 497 692 ‐ contracted 139 331 ‐ approved 358 361 Adding value to life 21
Slide 22: Financials Summary
Financials Summary ¾ Solid operating results/margins achieved in most businesses ¾ Robust market shares ¾ Tiger continues to invest in core brands ¾ Strong balance sheet and cashflow from operations ¾ Defensive portfolio in tough times Adding value to life 22
Slide 23: Grains: Operational Performance, Thabi Segoale
GRAINS Operational Performance Thabi Segoale Managing Executive Adding value to life 23
Slide 24: Grains: Profitability recovers despite softer volumes
Grains Profitability recovers despite softer volumes Performance Highlights Key performance drivers ¾ EBIT +35% ¾ Management of costs ¾ Margins recovering vs FY08 ¾ Improved conversion efficiencies ¾ Declining raw material costs Key challenge ¾ Volumes marginally lower (vs. inflated H1 08 base) Addi
Slide 25: Maize Milling
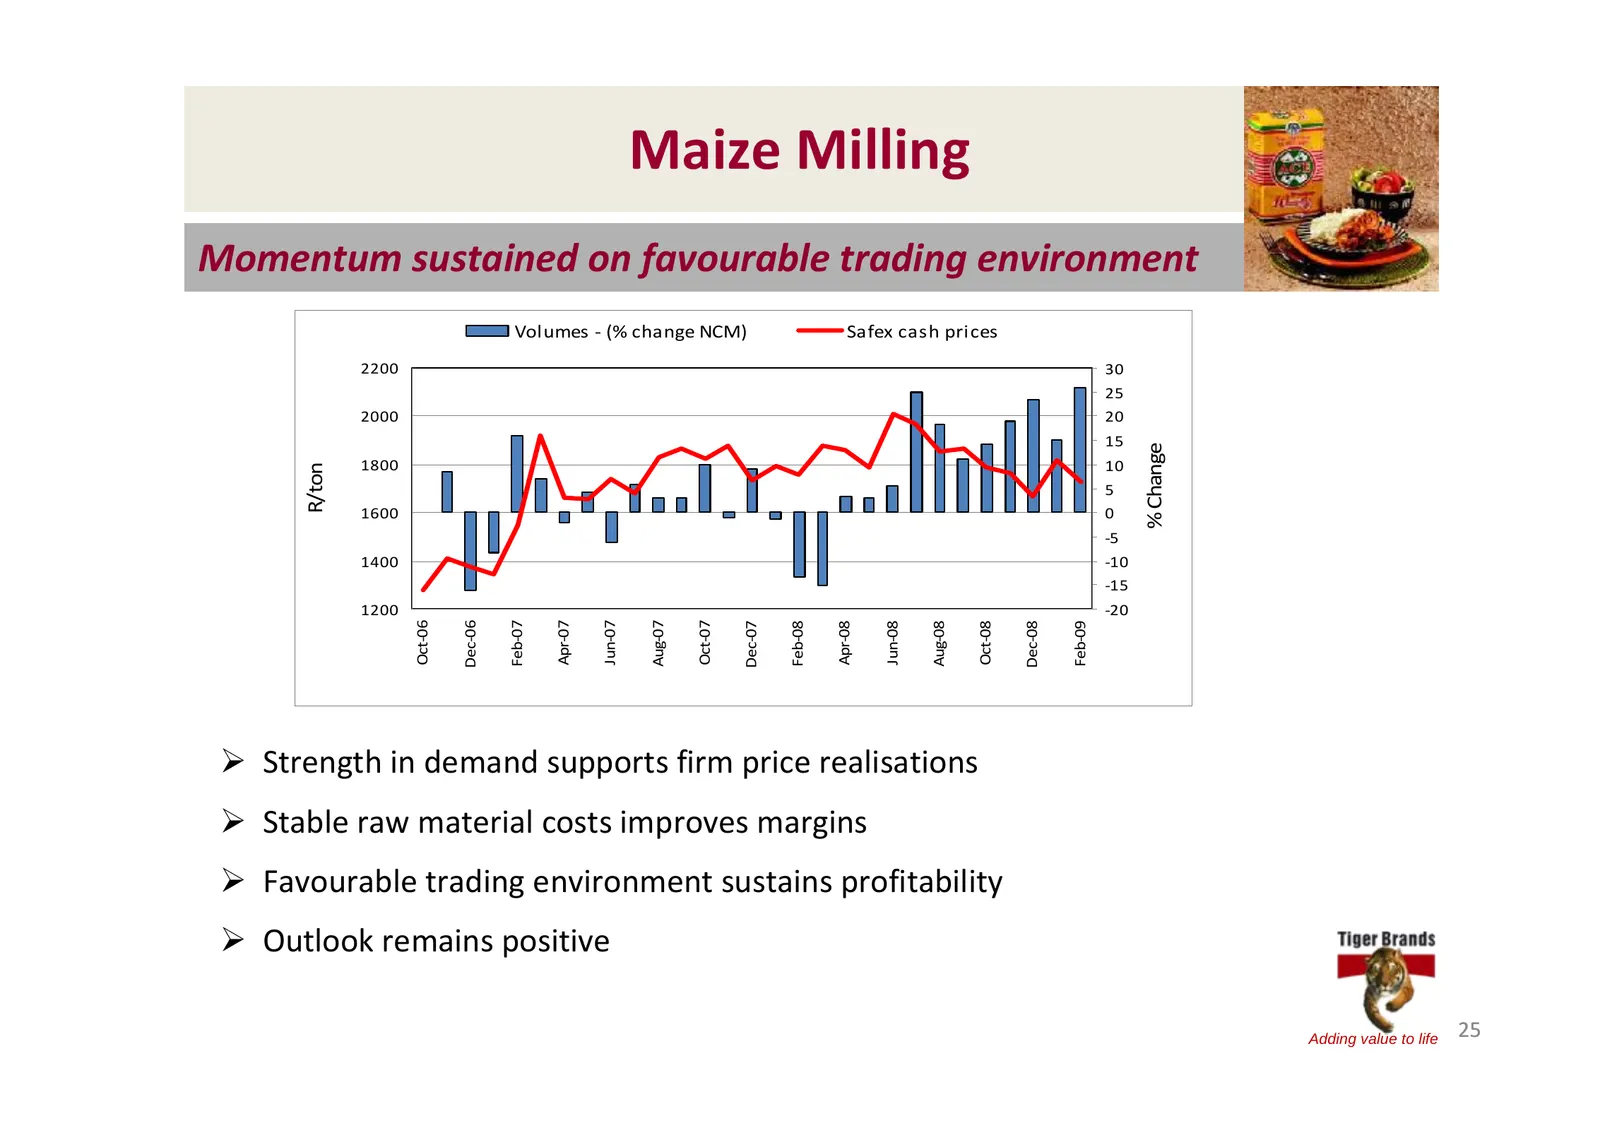
Maize Milling Momentum sustained on favourable trading environment Volumes ‐ (% change NCM) Safex cash prices 2200 30 25 2000 20 15 % Change 1800 10 R/ton 5 1600 0 ‐5 1400 ‐10 ‐15 1200 ‐20 Oct‐06 Dec‐06 Feb‐07 Apr‐07 Jun‐07 Aug‐07 Oct‐07 Dec‐07 Feb‐08 Apr‐08 Jun‐08 Aug‐08 Oct‐08 Dec‐08 Feb‐09 ¾ Stre
Slide 26: Wheat Milling & Baking
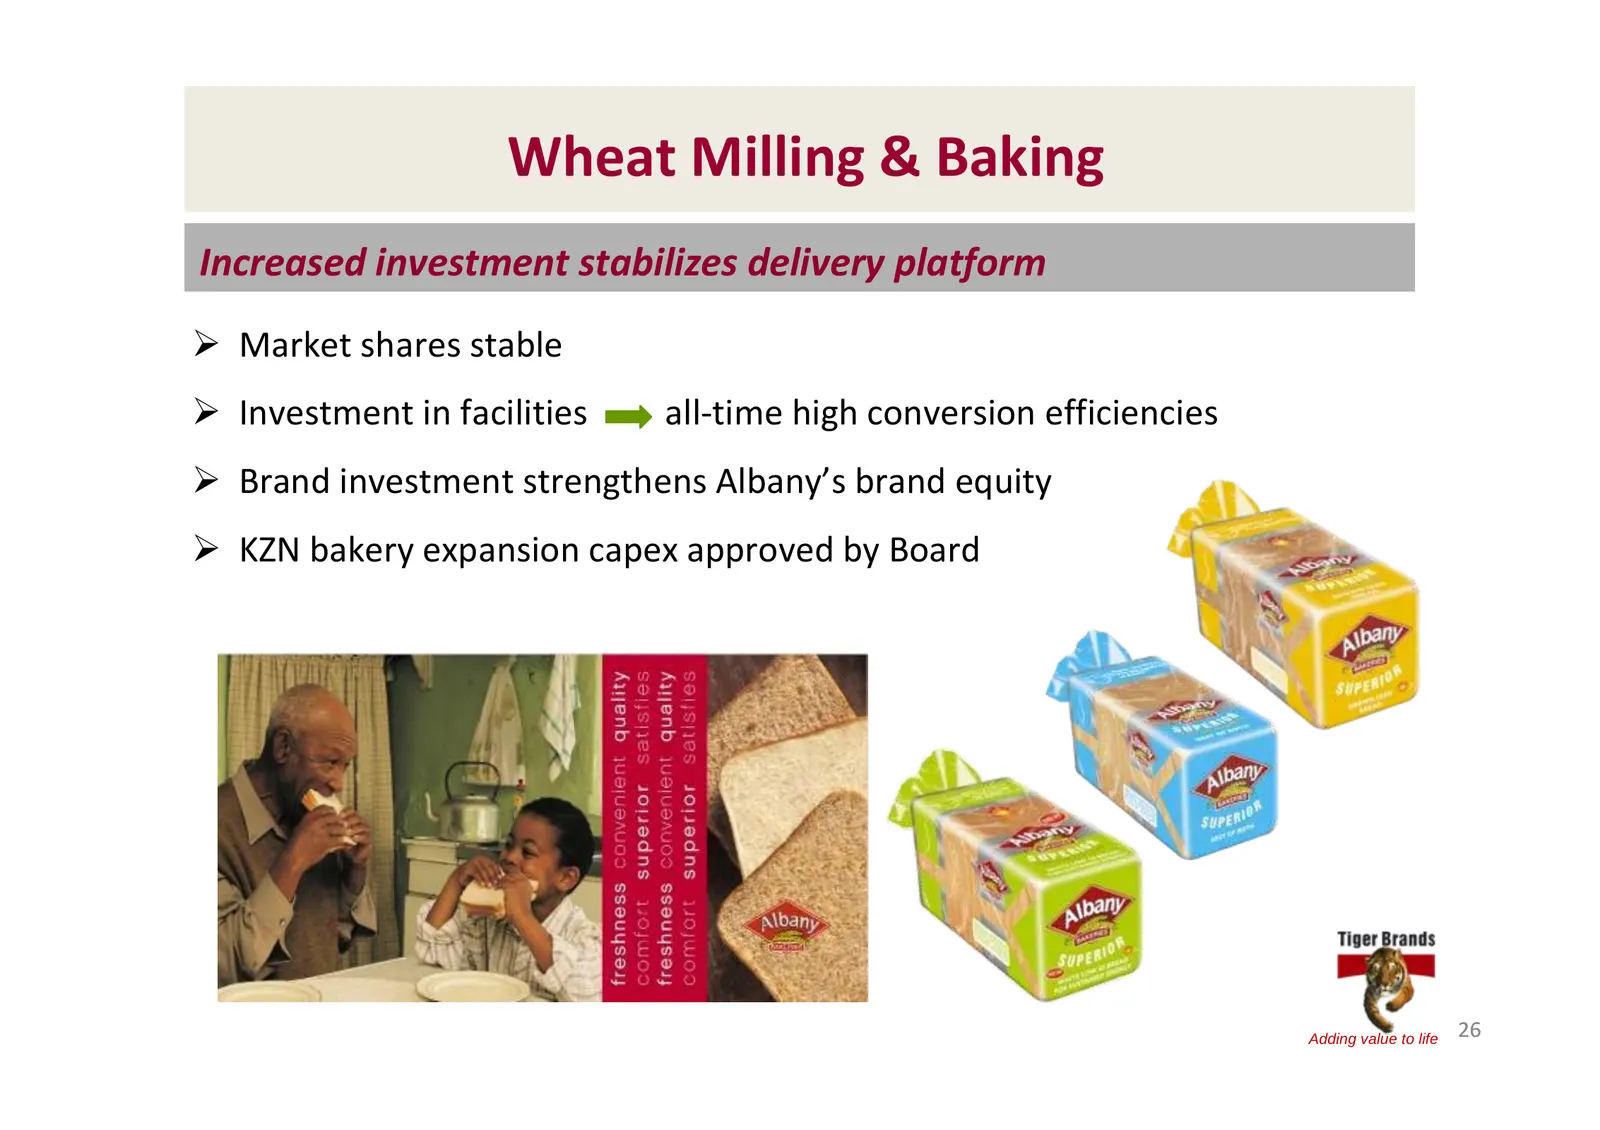
Wheat Milling & Baking Increased investment stabilizes delivery platform ¾ Market shares stable ¾ Investment in facilities all‐time high conversion efficiencies ¾ Brand investment strengthens Albany’s brand equity ¾ KZN bakery expansion capex approved by Board Adding value to life 26
Slide 27: Tastic Rice: High inflation impacts rice volumes
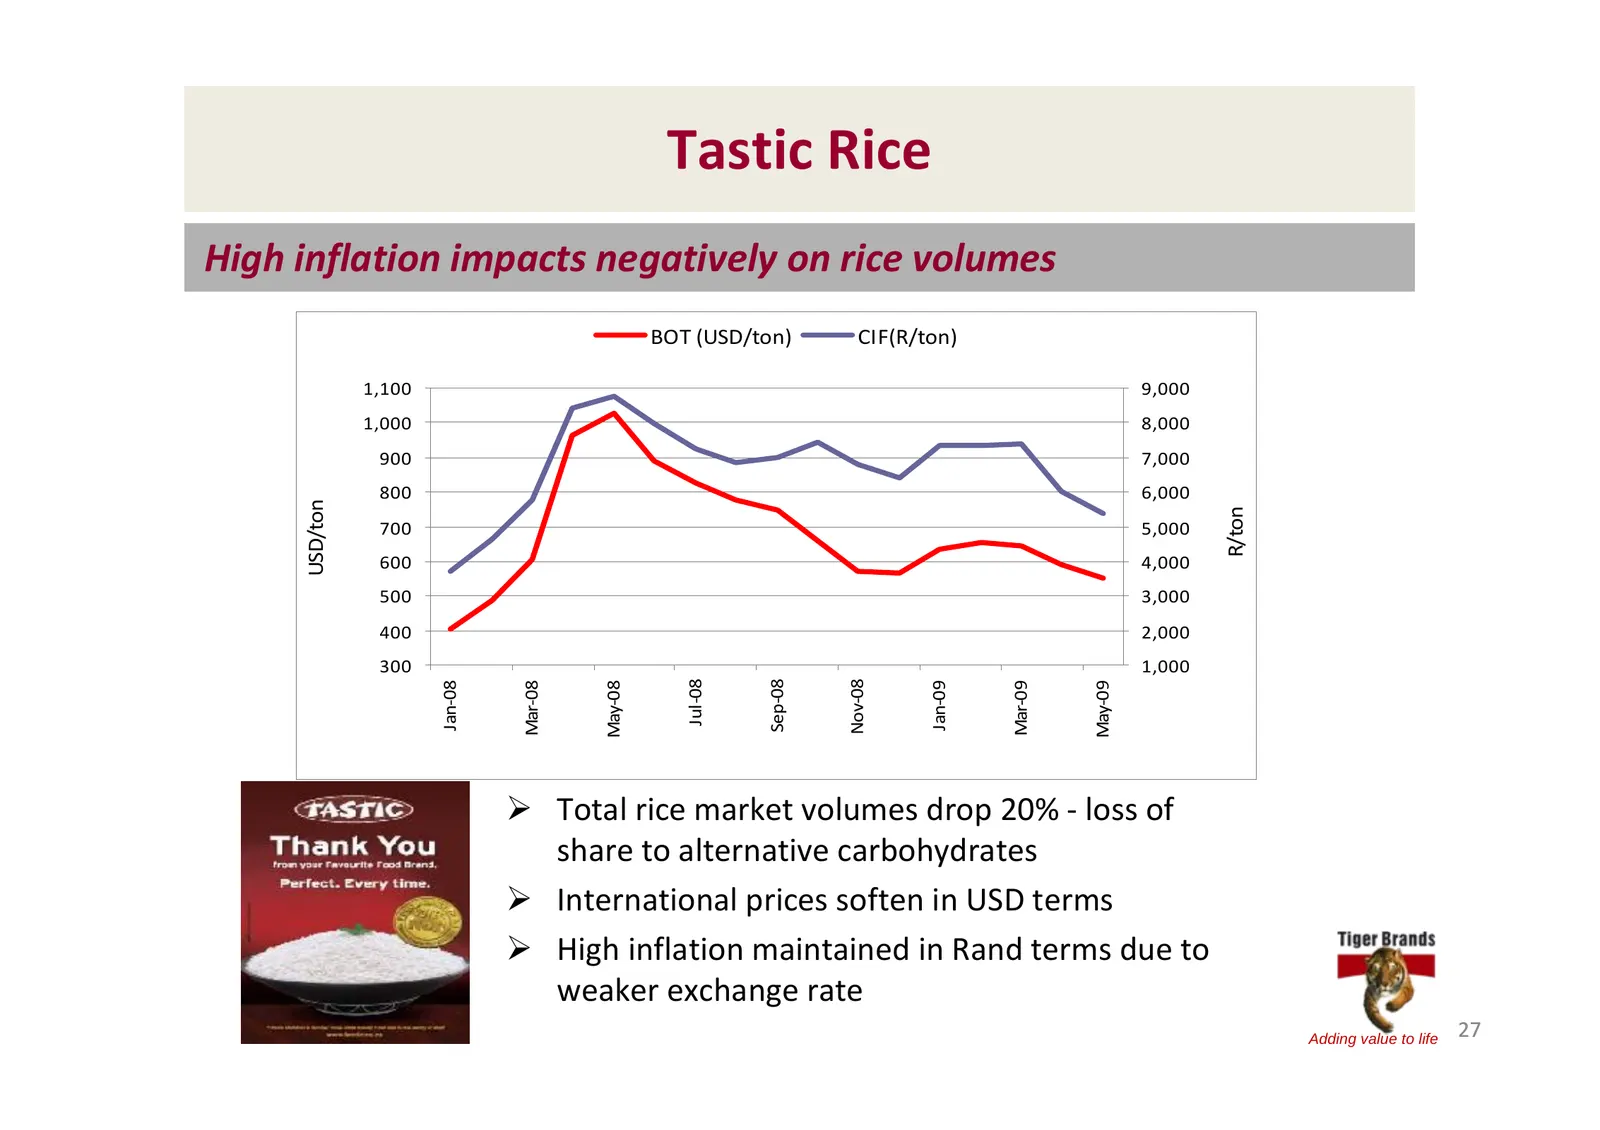
Tastic Rice High inflation impacts negatively on rice volumes BOT (USD/ton) CIF(R/ton) 1,100 9,000 1,000 8,000 900 7,000 800 6,000 USD/ton R/ton 700 5,000 600 4,000 500 3,000 400 2,000 300 1,000 Jul‐08 Sep‐08 Nov‐08 Jan‐08 Mar‐08 May‐08 Jan‐09 Mar‐09 May‐09 ¾ Total rice market volumes drop 20% ‐ los
Slide 28: Tastic Rice
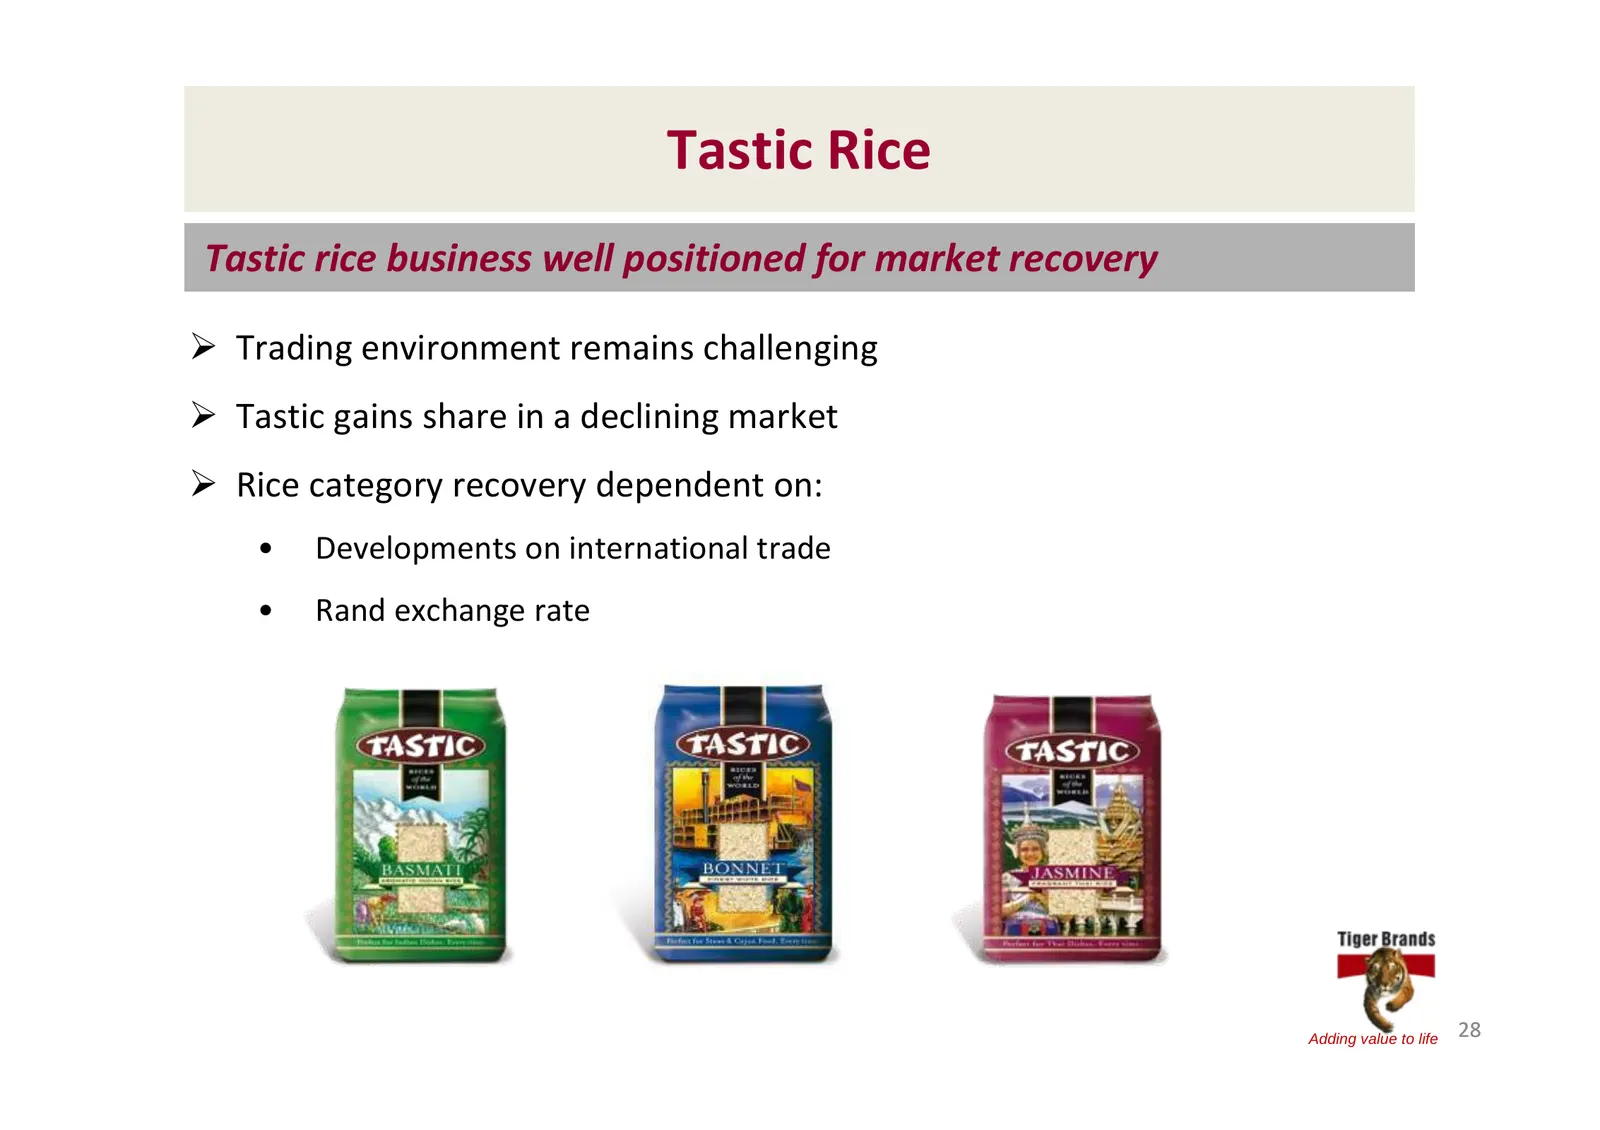
Tastic Rice Tastic rice business well positioned for market recovery ¾ Trading environment remains challenging ¾ Tastic gains share in a declining market ¾ Rice category recovery dependent on: • Developments on international trade • Rand exchange rate Adding value to life 28
Slide 29: Breakfast Cereals
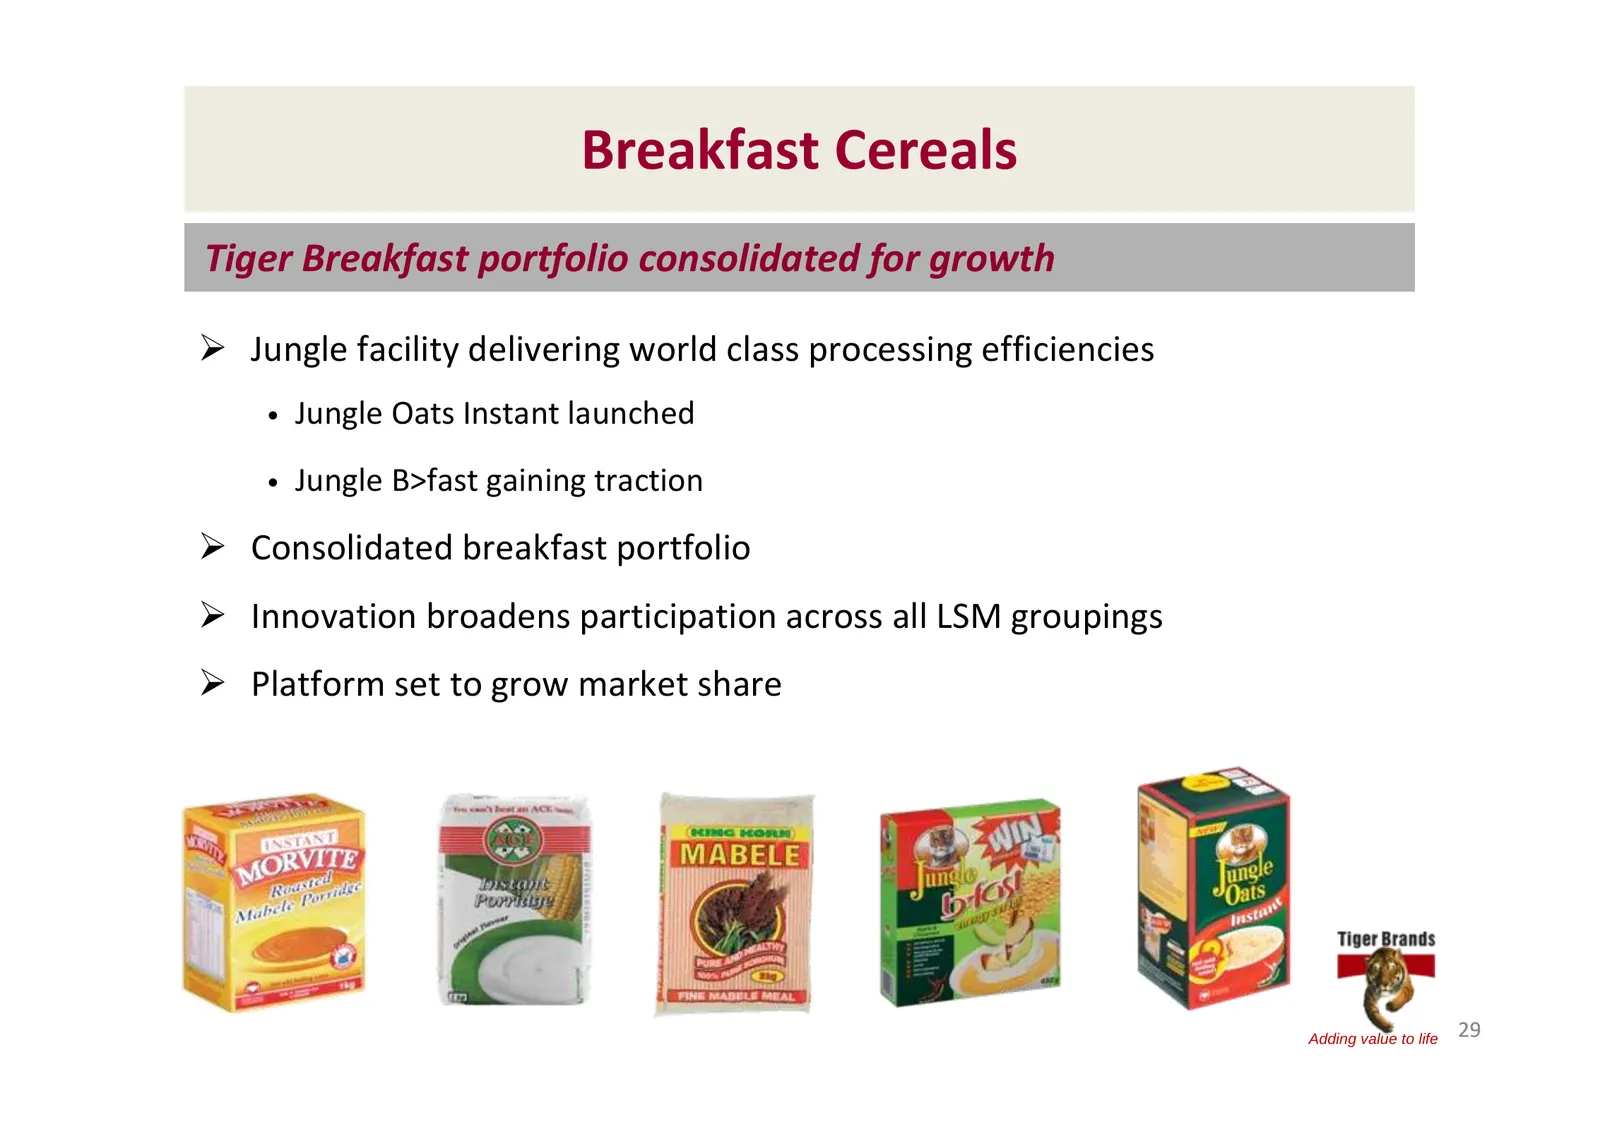
Breakfast Cereals Tiger Breakfast portfolio consolidated for growth ¾ Jungle facility delivering world class processing efficiencies • Jungle Oats Instant launched • Jungle B>fast gaining traction ¾ Consolidated breakfast portfolio ¾ Innovation broadens participation across all LSM groupings ¾ Platf
Slide 30: Grains: Key focus areas
Grains Key focus areas to sustain margin recovery ¾ Drive for profitable volume recovery of core business ¾ Sustained superior manufacturing efficiencies ¾ Sound raw material procurement strategies ¾ Continued investment in: • Facilities • Brands Adding value to life 30
Slide 31: Consumer Brands: Operational Performance, Neil Brimacombe
CONSUMER BRANDS Operational Performance Neil Brimacombe Executive Director Adding value to life 31
Slide 32: Groceries
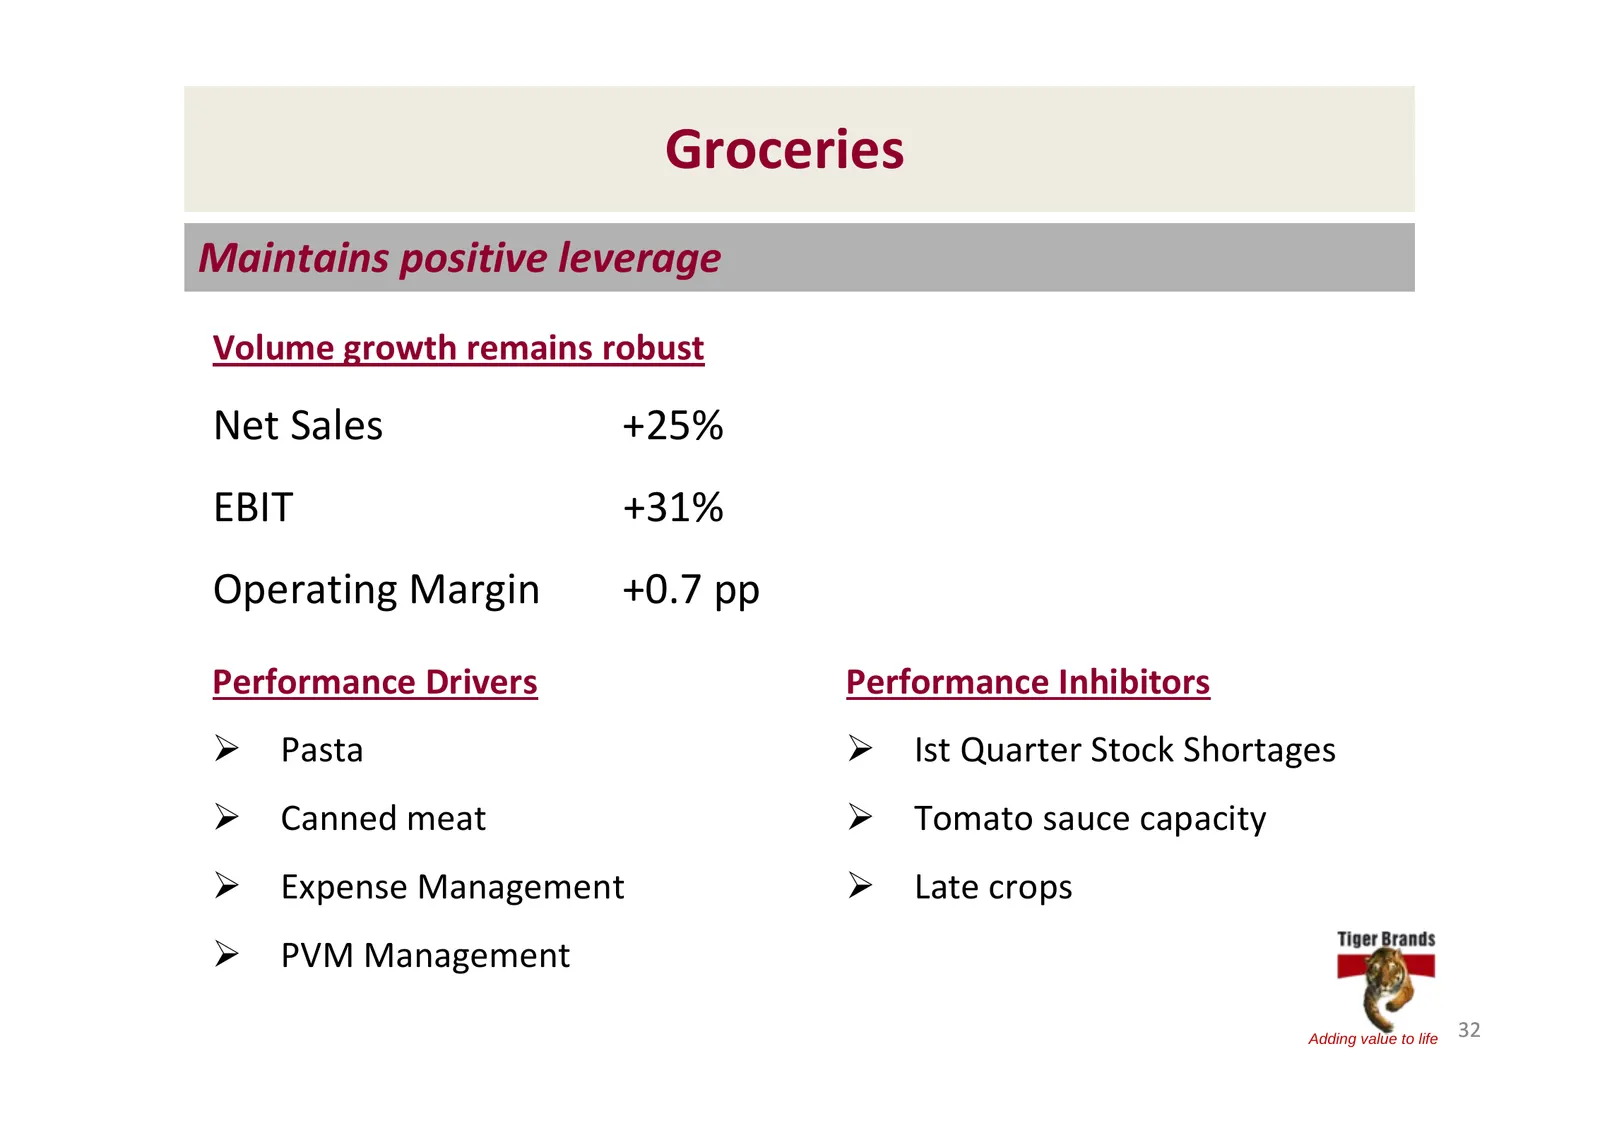
Groceries Maintains positive leverage Volume growth remains robust Net Sales +25% EBIT +31% Operating Margin +0.7 pp Performance Drivers Performance Inhibitors ¾ Pasta ¾ Ist Quarter Stock Shortages ¾ Canned meat ¾ Tomato sauce capacity ¾ Expense Management ¾ Late crops ¾ PVM Management Adding value
Slide 33: Groceries: Positive volume growth
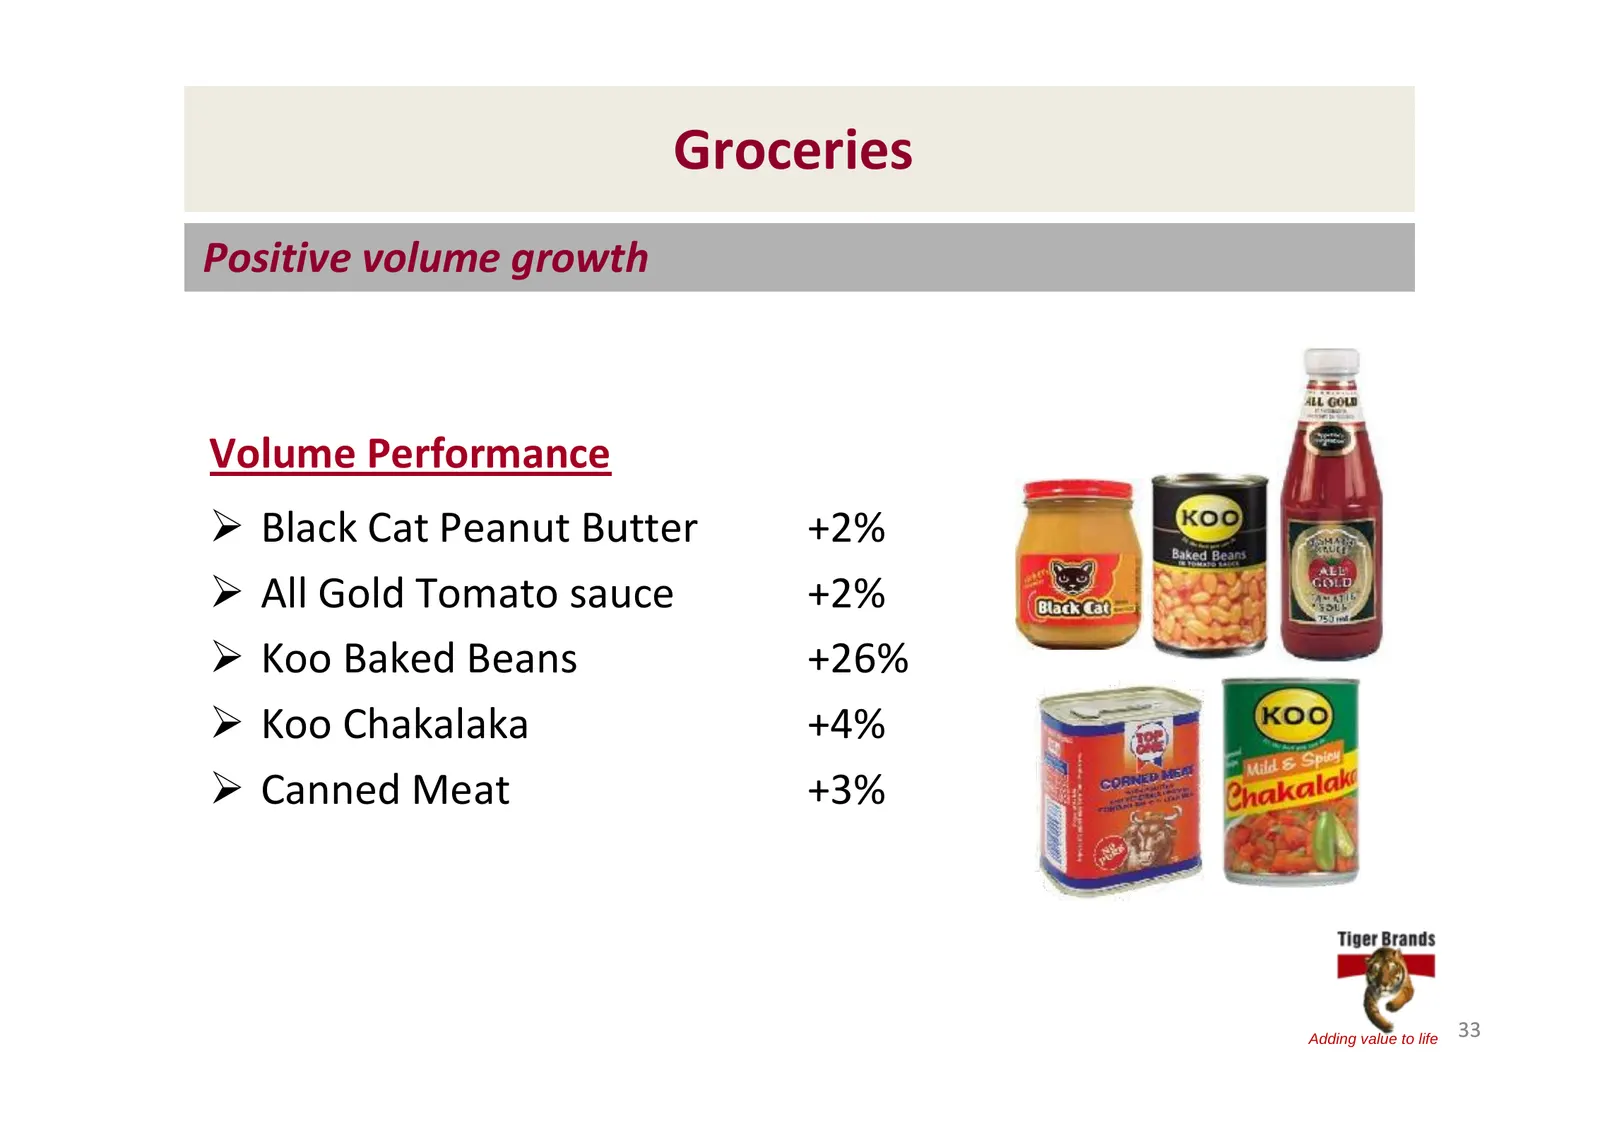
Groceries Positive volume growth Volume Performance ¾ Black Cat Peanut Butter +2% ¾ All Gold Tomato sauce +2% ¾ Koo Baked Beans +26% ¾ Koo Chakalaka +4% ¾ Canned Meat +3% Adding value to life 33
Slide 34: Market Share
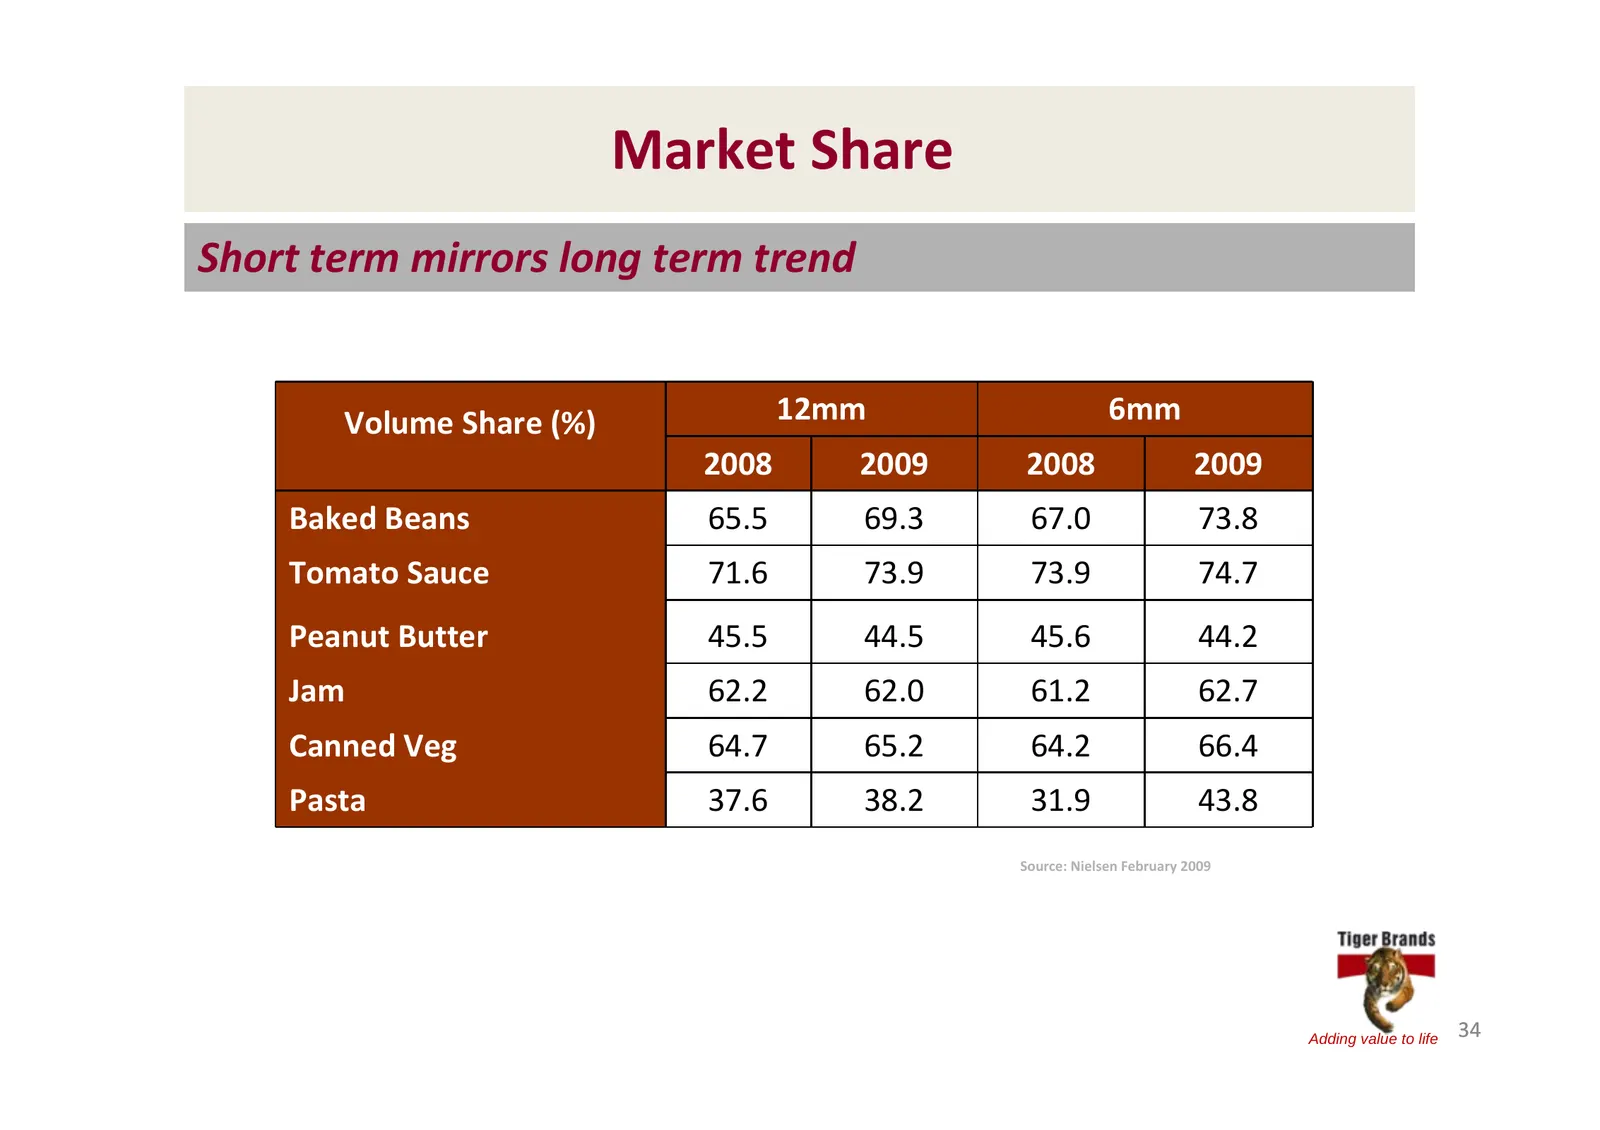
Market Share Short term mirrors long term trend Volume Share (%) 12mm 6mm 2008 2009 2008 2009 Baked Beans 65.5 69.3 67.0 73.8 Tomato Sauce 71.6 73.9 73.9 74.7 Peanut Butter 45.5 44.5 45.6 44.2 Jam 62.2 62.0 61.2 62.7 Canned Veg 64.7 65.2 64.2 66.4 Pasta 37.6 38.2 31.9 43.8 Source: Nielsen February 2
Slide 35: ALL GOLD Facility Investment
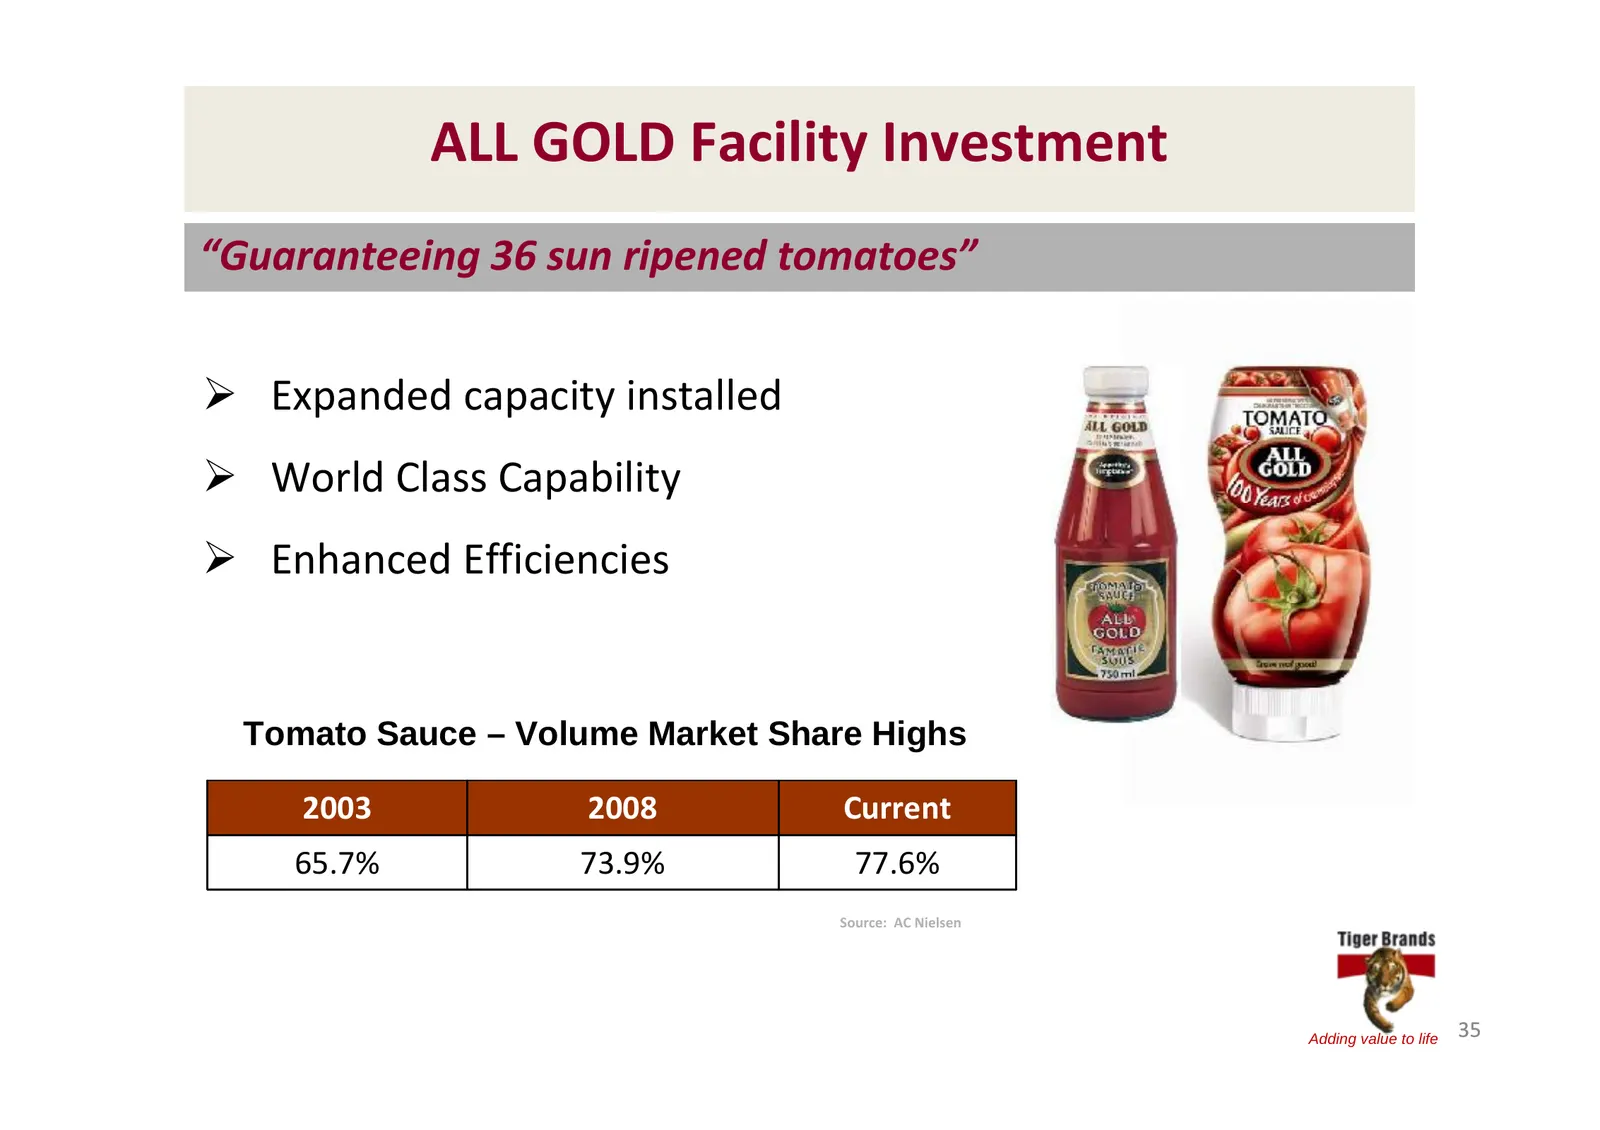
ALL GOLD Facility Investment “Guaranteeing 36 sun ripened tomatoes” ¾ Expanded capacity installed ¾ World Class Capability ¾ Enhanced Efficiencies Tomato Sauce – Volume Market Share Highs 2003 2008 Current 65.7% 73.9% 77.6% Source: AC Nielsen Adding value to life 35
Slide 36: Margin Expanding Innovation: Tomato Paste
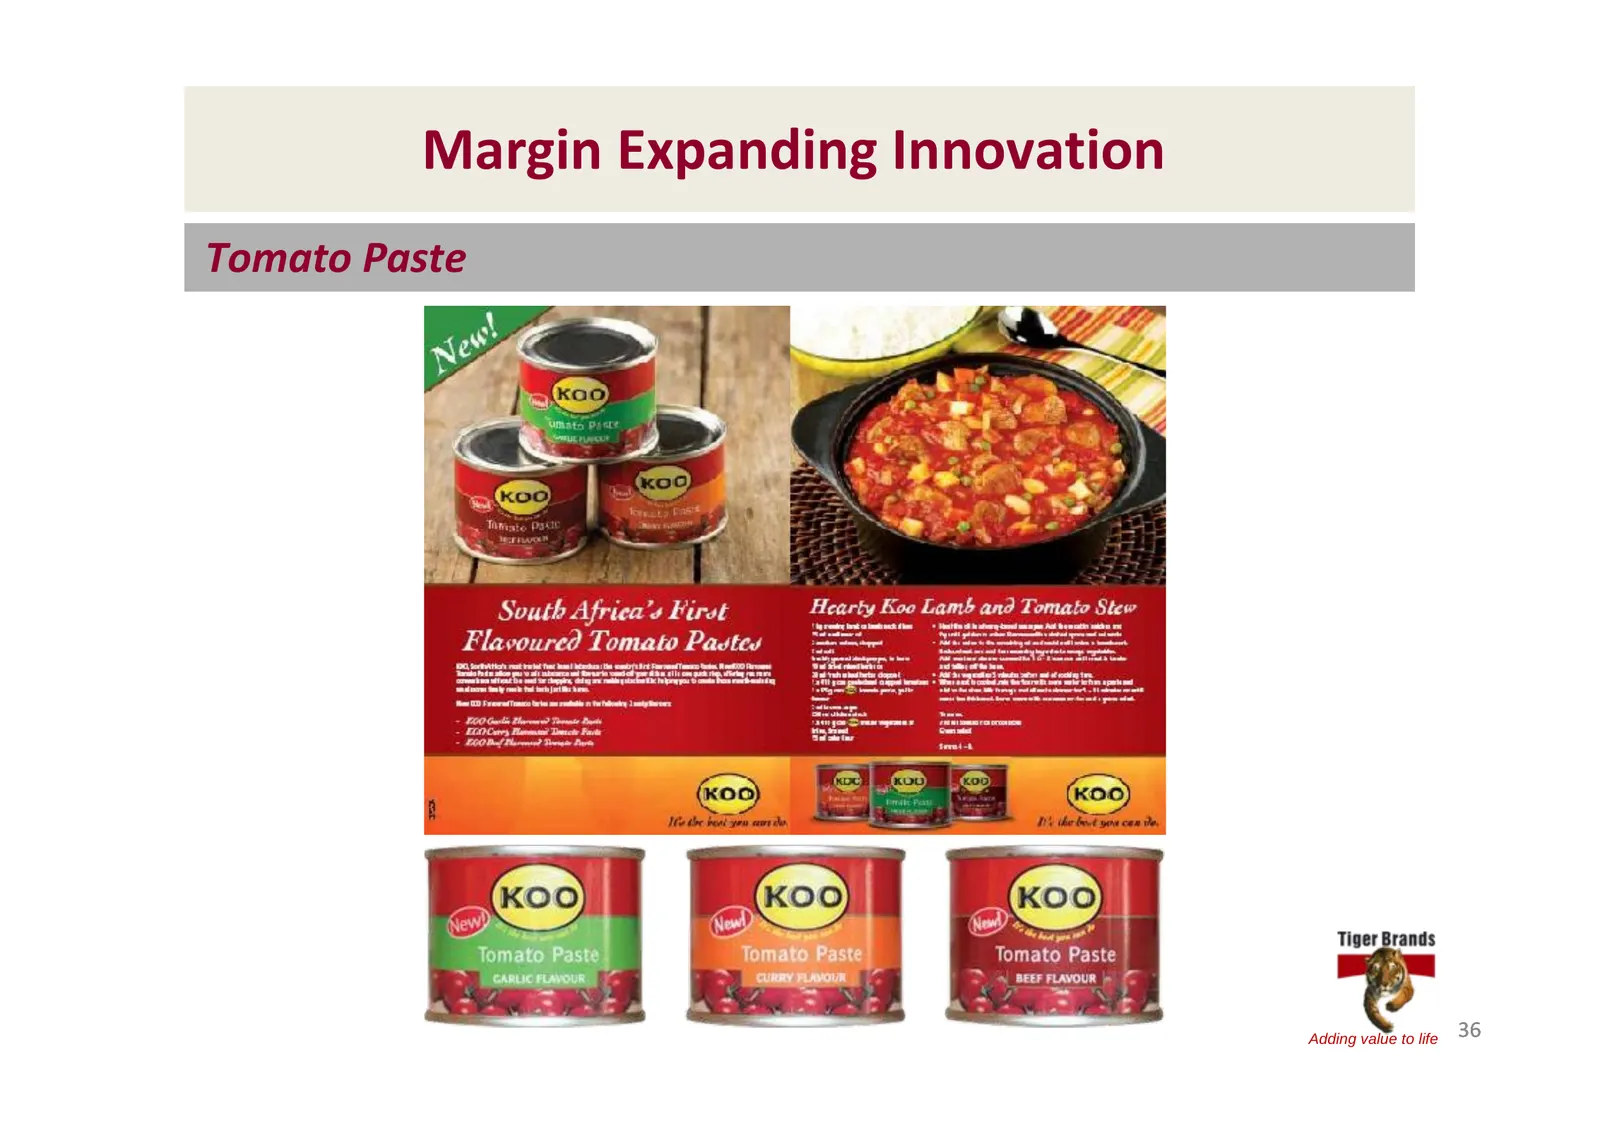
Margin Expanding Innovation Tomato Paste Adding value to life 36
Slide 37: Innovation & Renovation: ALL GOLD Packs
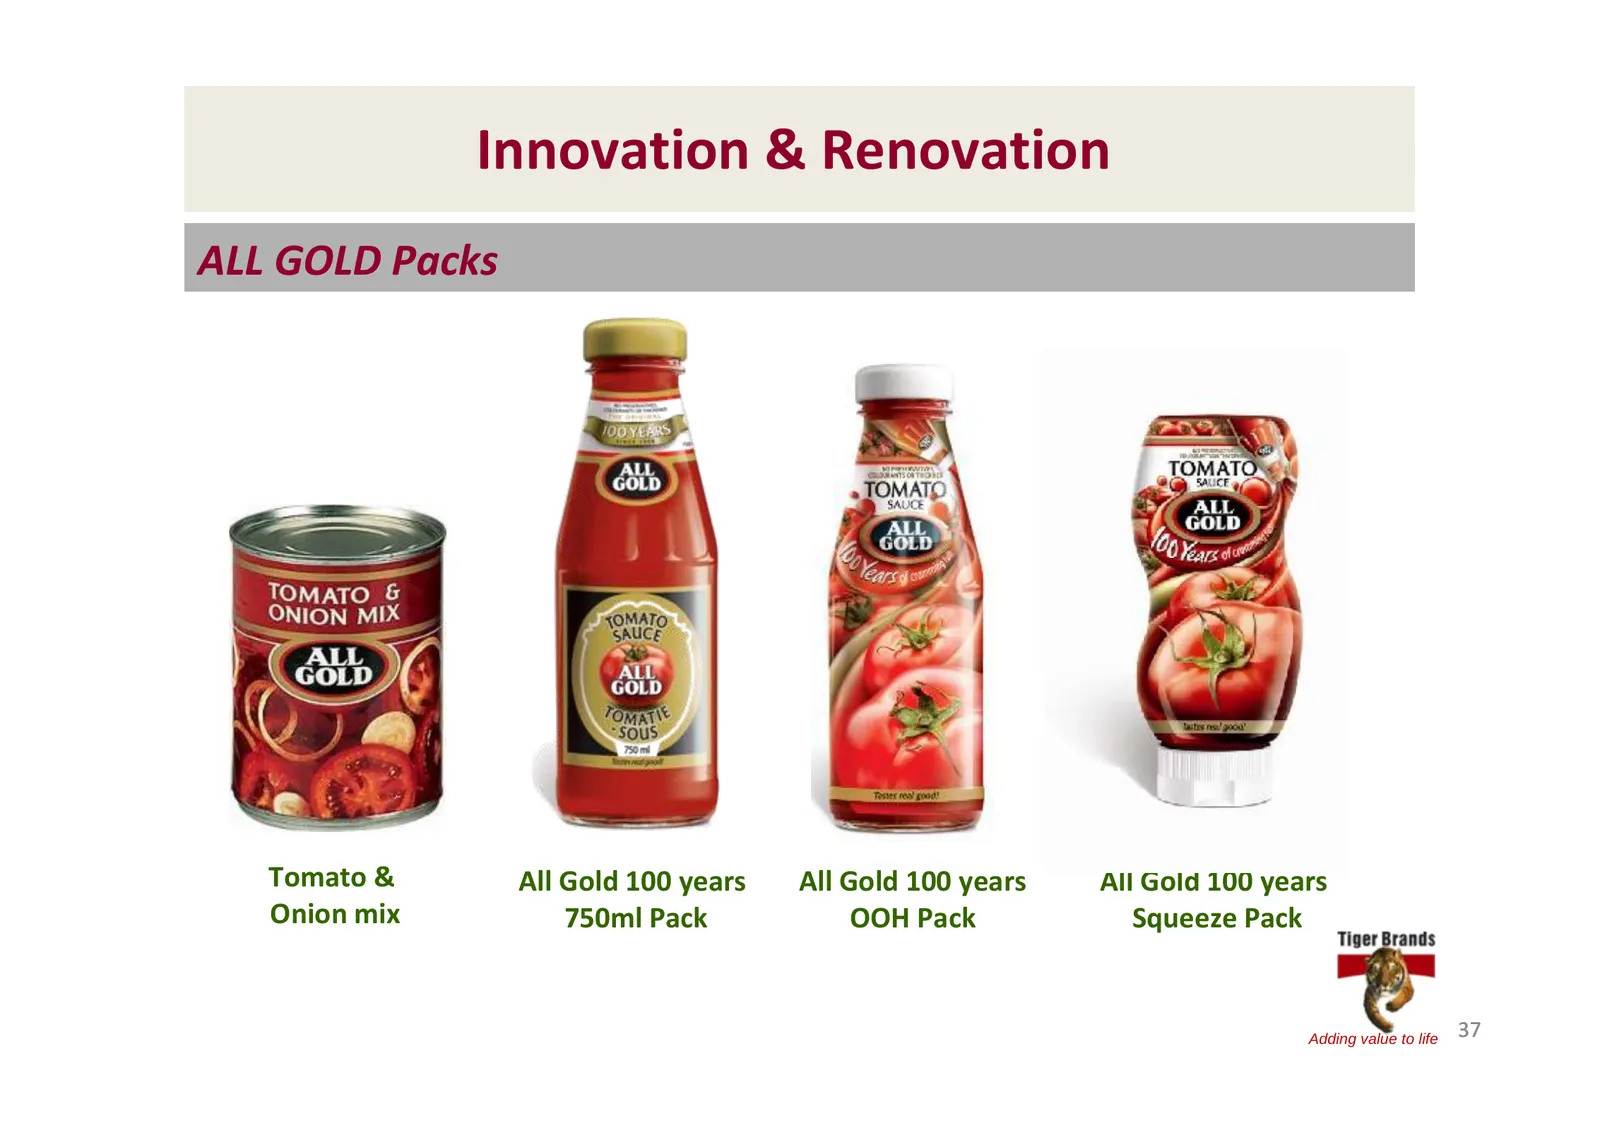
Innovation & Renovation ALL GOLD Packs Tomato & All Gold 100 years All Gold 100 years All Gold 100 years Onion mix 750ml Pack OOH Pack Squeeze Pack Adding value to life 37
Slide 38: Innovation & Renovation: ALL GOLD years execution
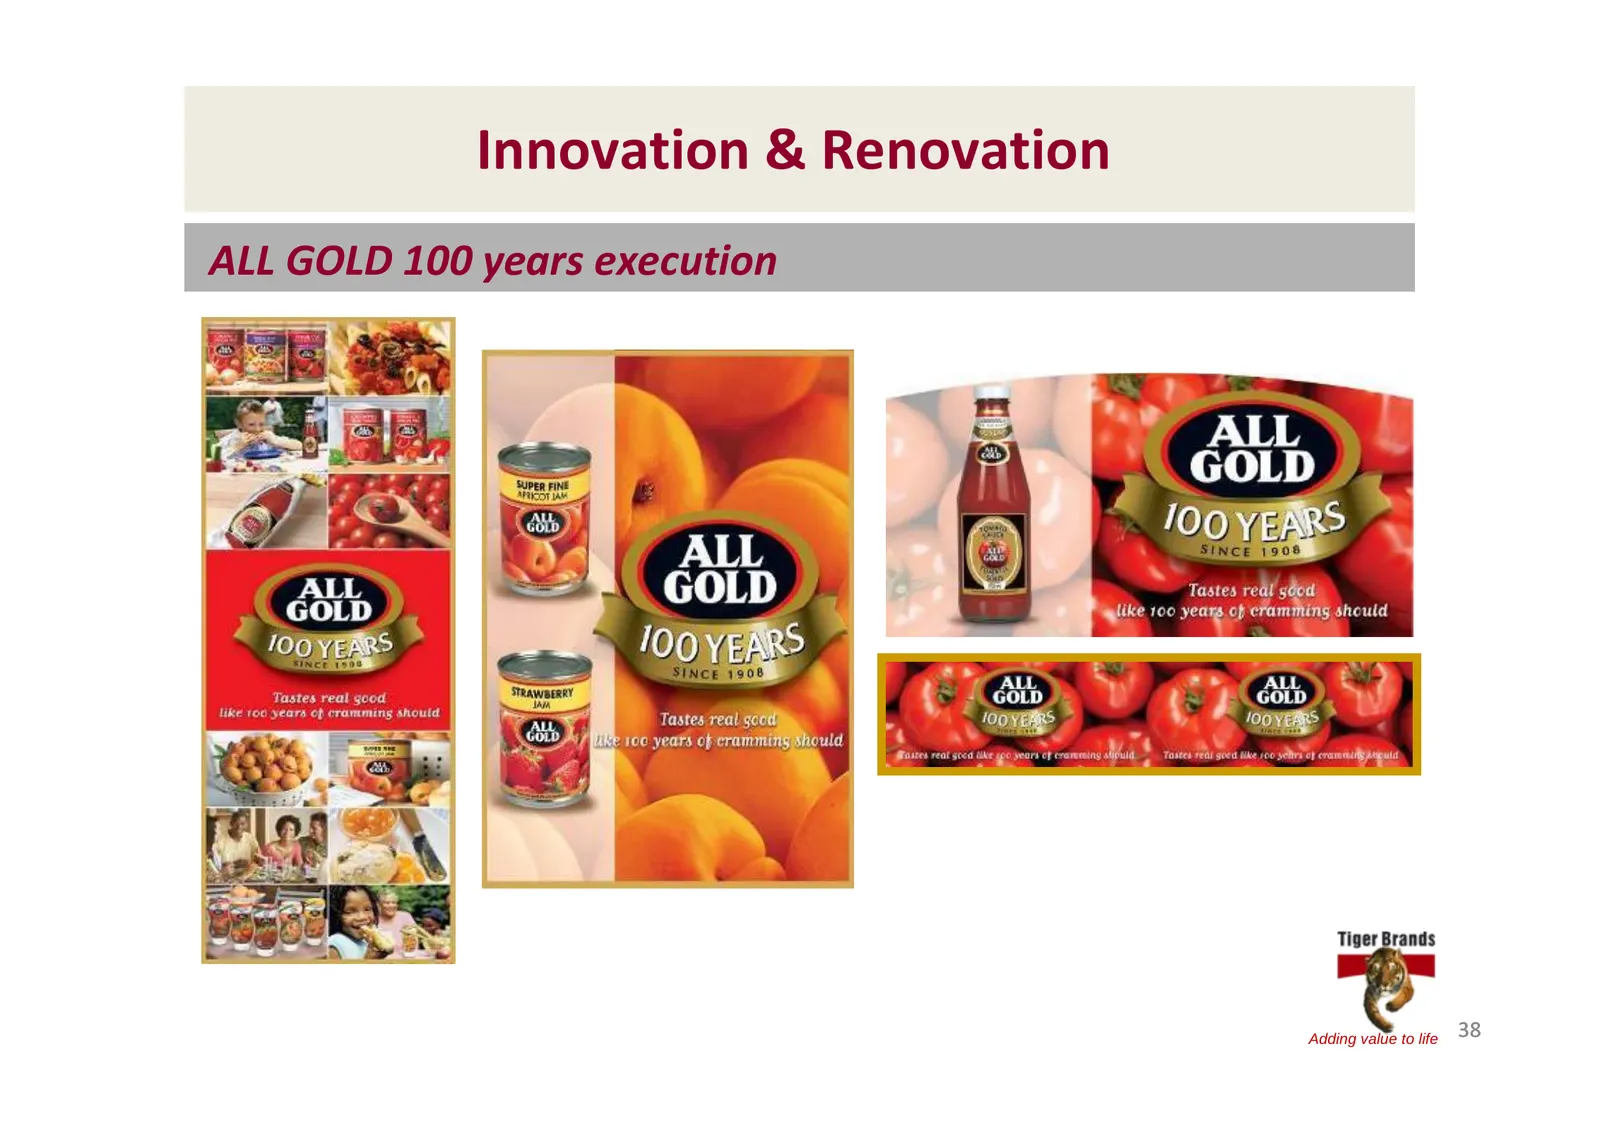
Innovation & Renovation ALL GOLD 100 years execution Adding value to life 38
Slide 39: Snacks & Treats: Consumers curtail snacking
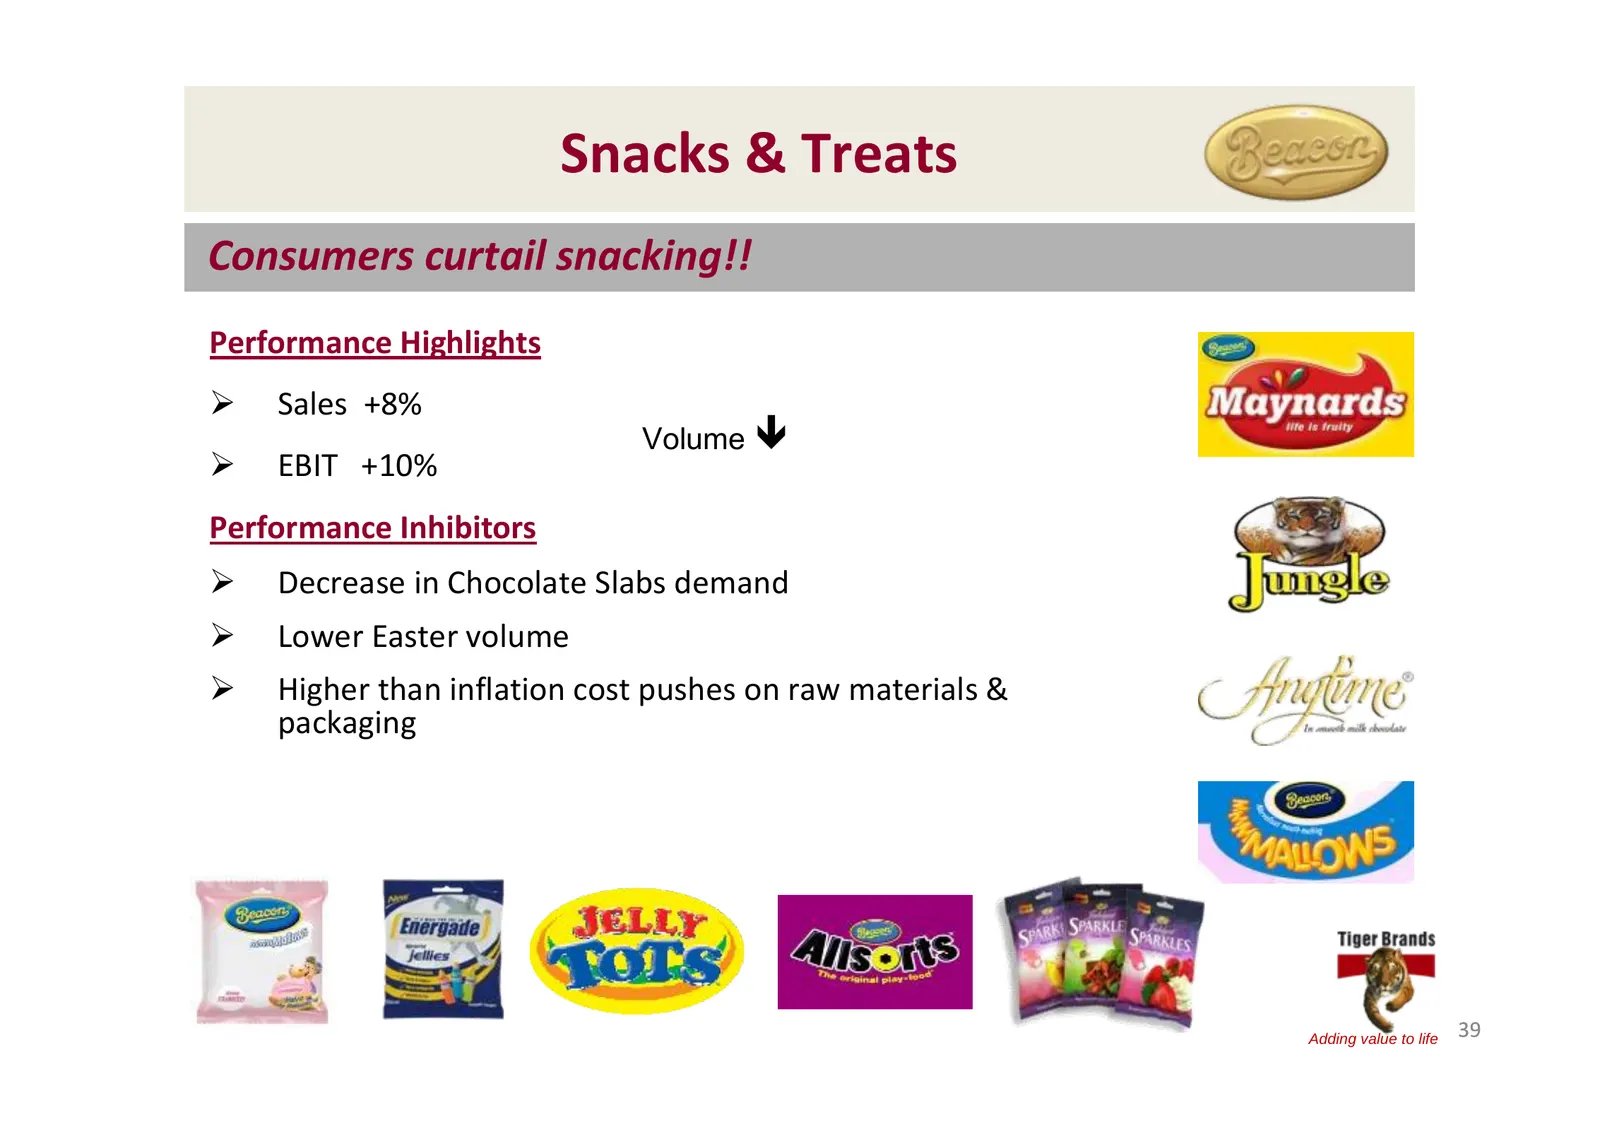
Snacks & Treats Consumers curtail snacking!! Performance Highlights ¾ Sales +8% Volume Ð ¾ EBIT +10% Performance Inhibitors ¾ Decrease in Chocolate Slabs demand ¾ Lower Easter volume ¾ Higher than inflation cost pushes on raw materials & packaging Adding value to life 39
Slide 40: Snacks & Treats: Value share performance
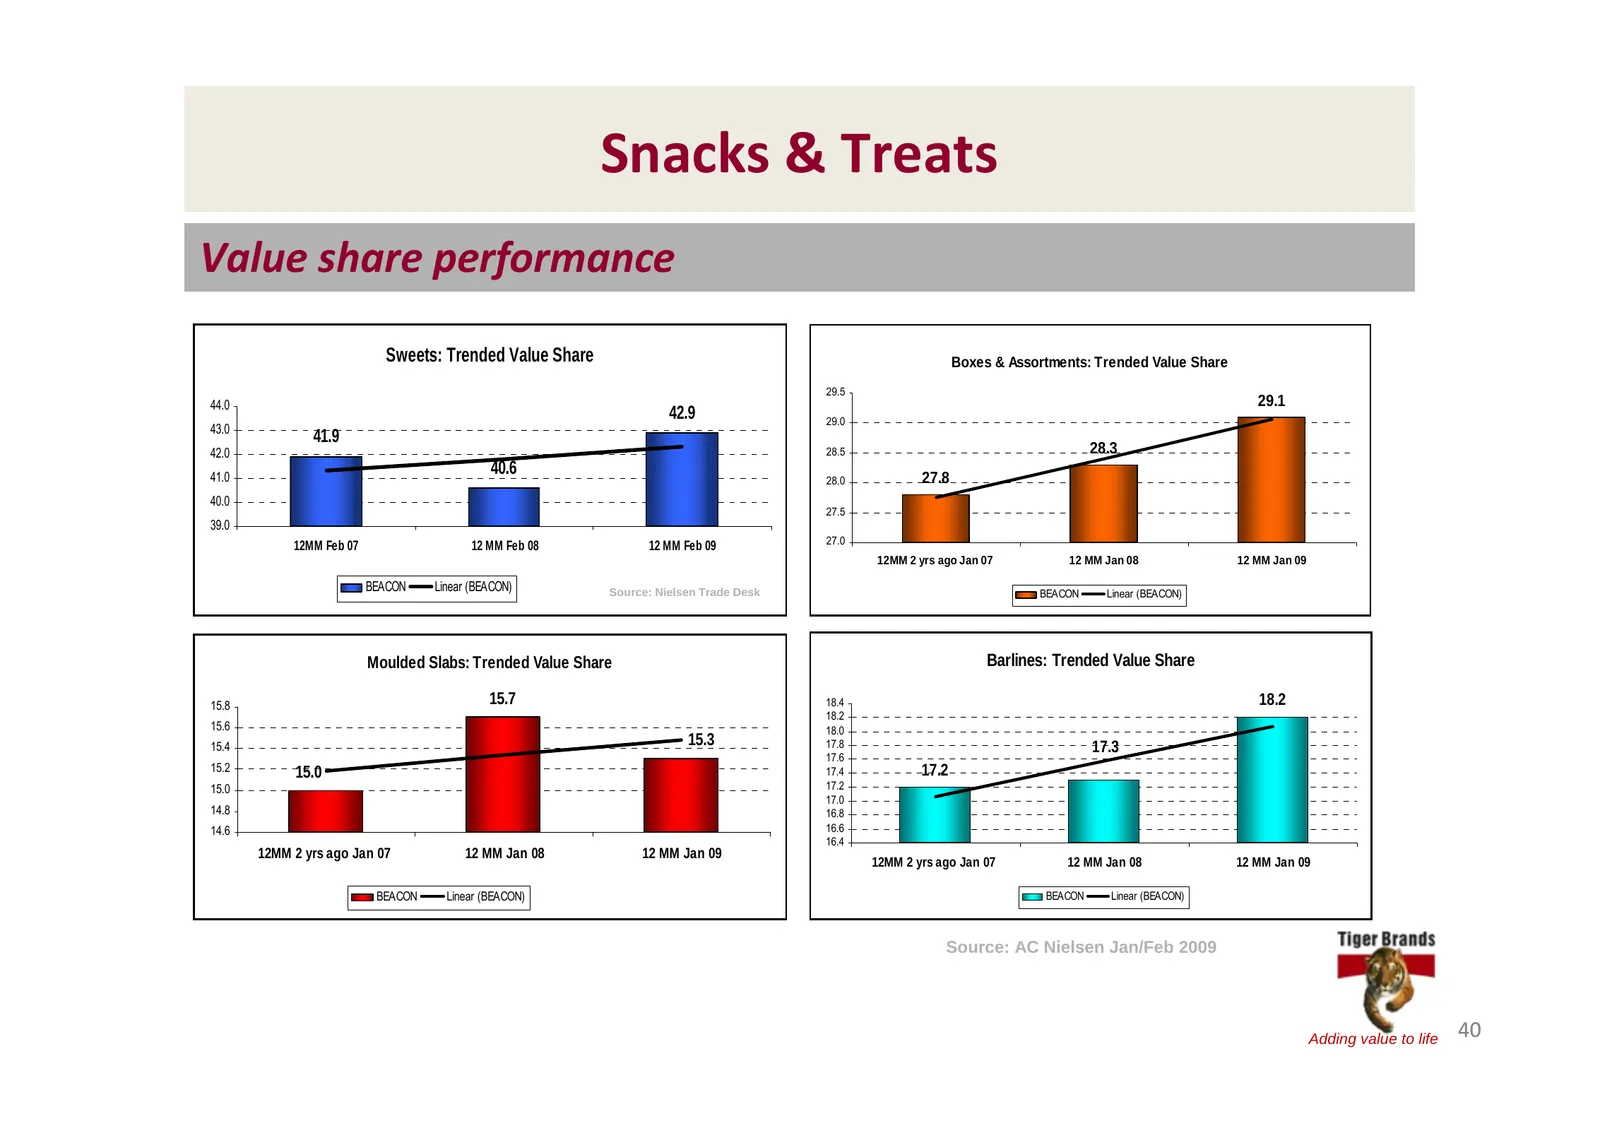
Snacks & Treats Value share performance Sweets: Trended Value Share Boxes & Assortments: Trended Value Share 29.5 44.0 29.1 42.9 29.0 43.0 41.9 42.0 28.5 28.3 41.0 40.6 27.8 28.0 40.0 27.5 39.0 12MM Feb 07 12 MM Feb 08 12 MM Feb 09 27.0 12MM 2 yrs ago Jan 07 12 MM Jan 08 12 MM Jan 09 BEACON Linear (
Slide 41: Managing the Downturn
Managing the Downturn Key Management initiatives ¾ Stringent Cost / Expense Management ¾ Relevant Innovation / small pack sizes ¾ Focus on the “economic engine” – Candy Adding value to life 41
Slide 42: Snacks & Treats: Innovation
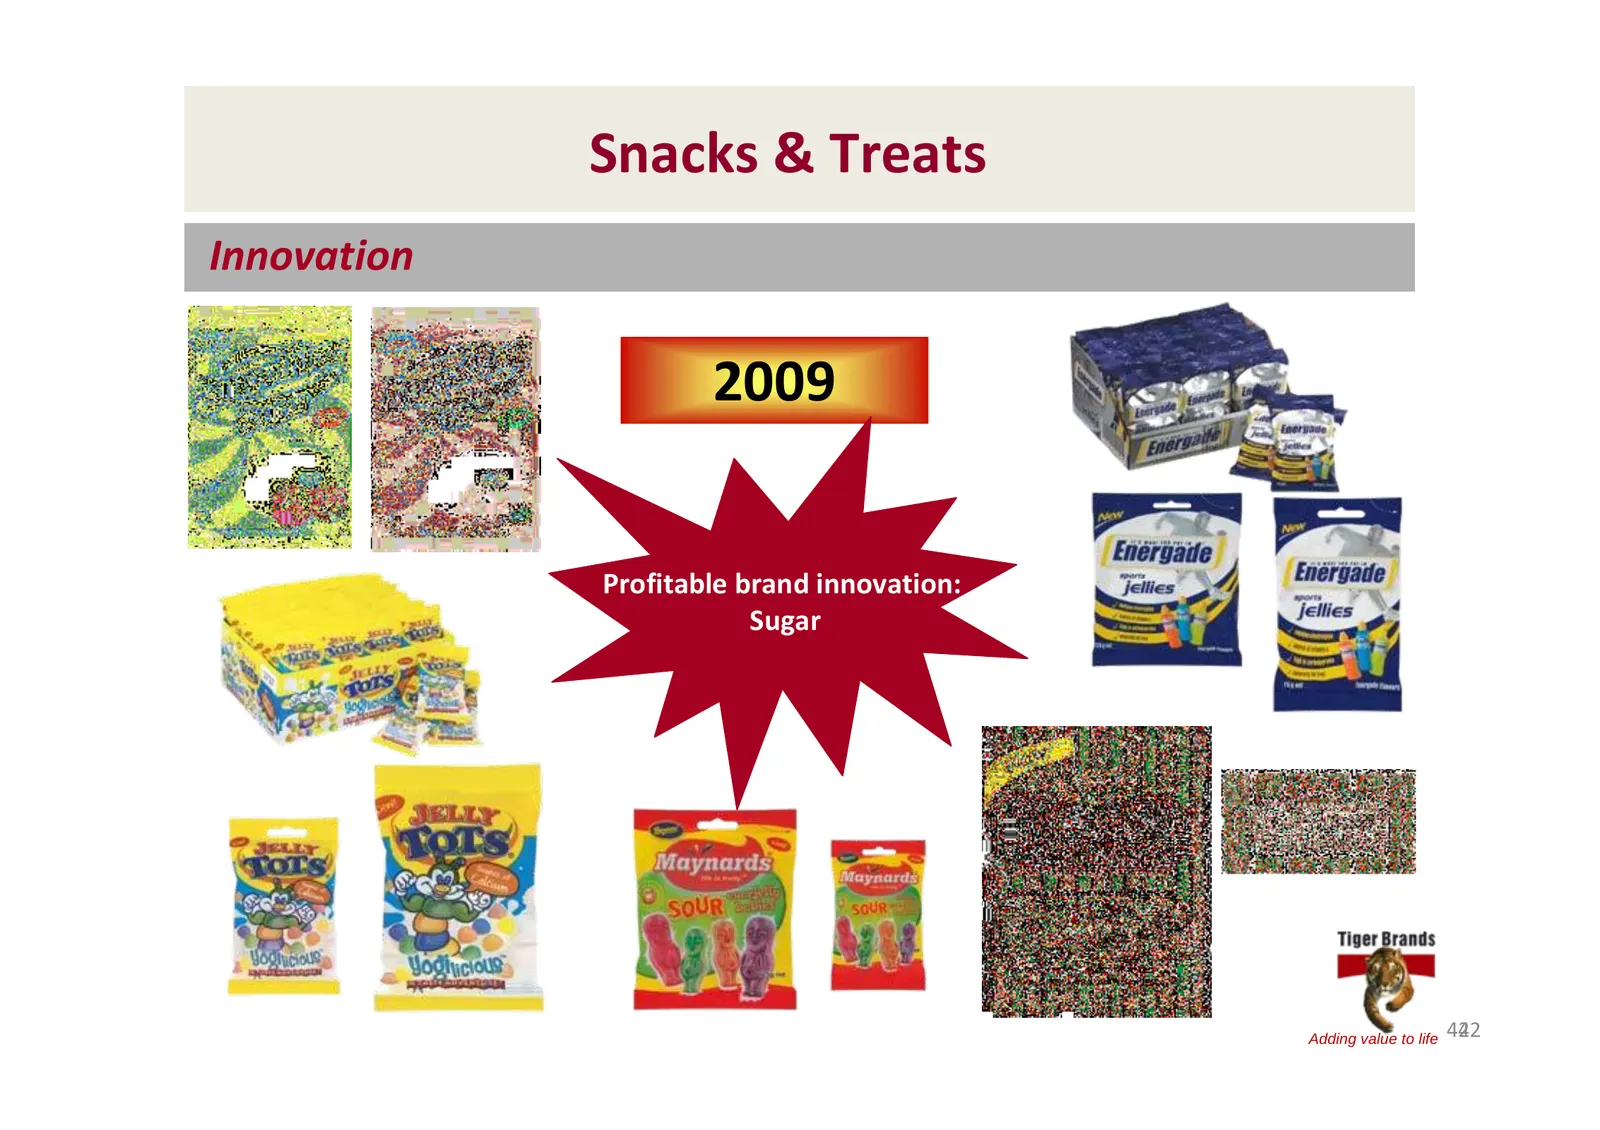
Snacks & Treats Innovation 2009 Profitable brand innovation: Sugar Adding value to life 42 42
Slide 43: Snacks & Treats: Current Innovation
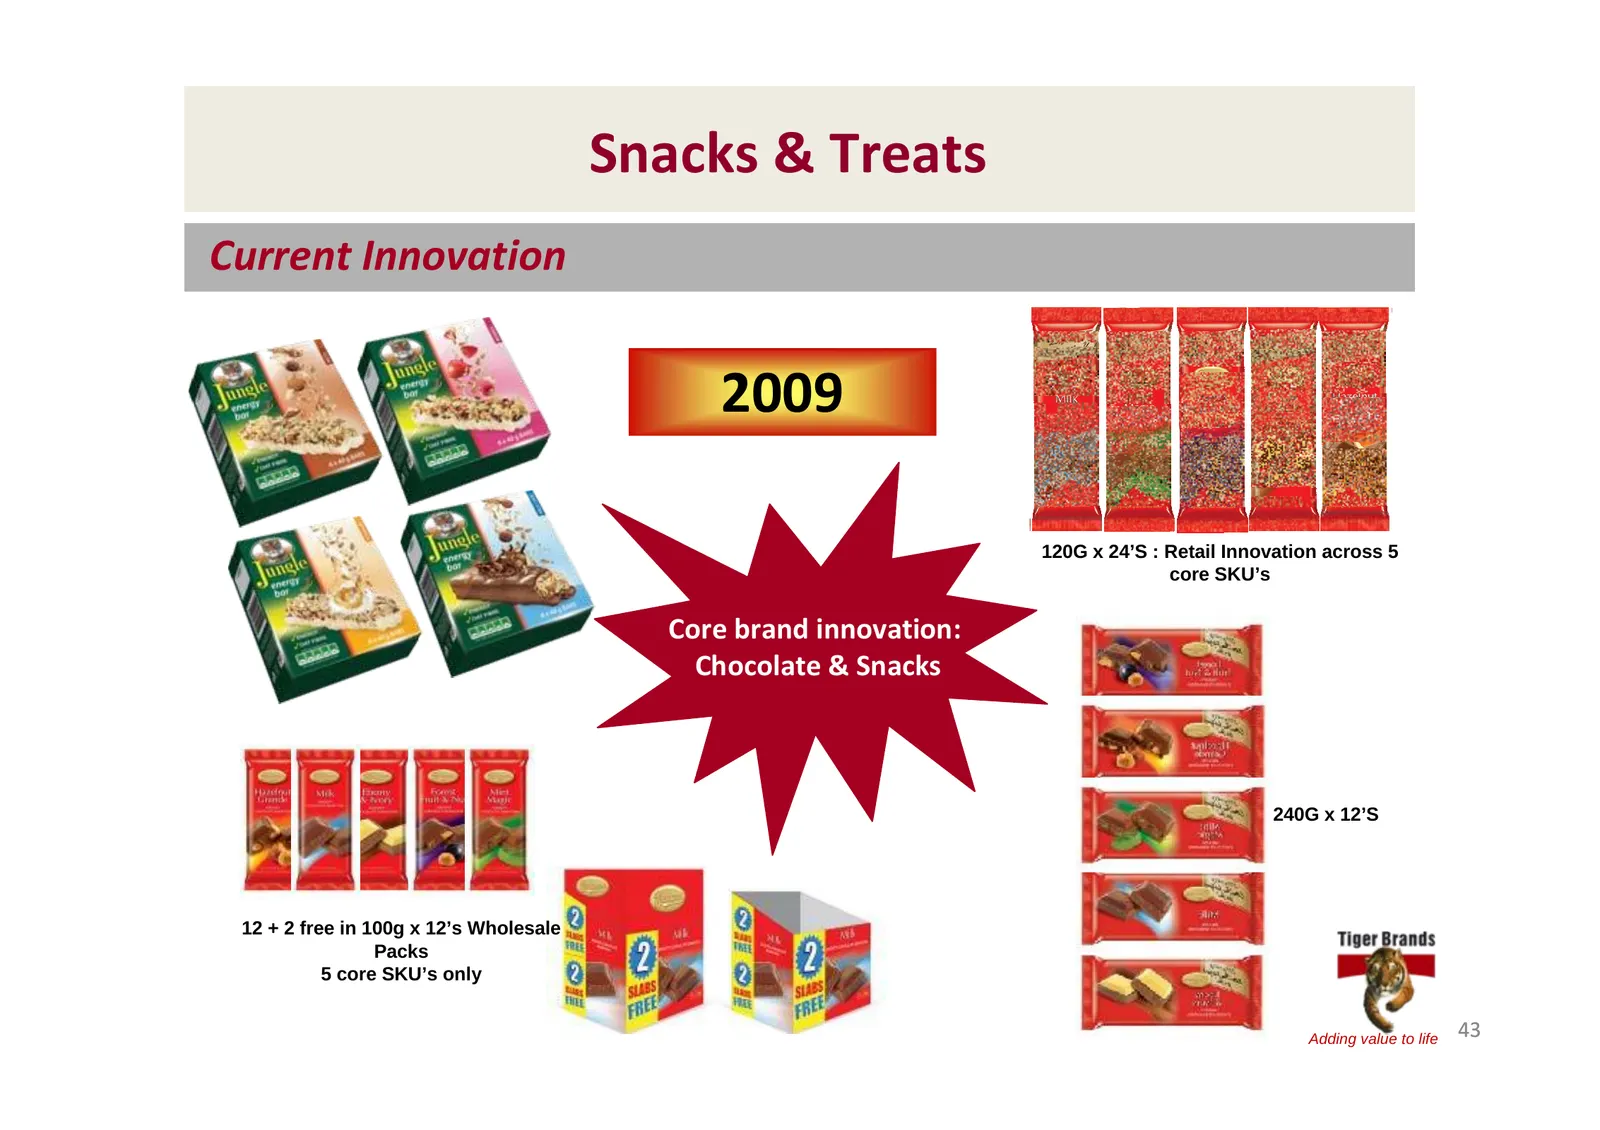
Snacks & Treats Current Innovation 2009 120G x 24’S : Retail Innovation across 5 core SKU’s Core brand innovation: Chocolate & Snacks 240G x 12’S 12 + 2 free in 100g x 12’s Wholesale Packs 5 core SKU’s only Adding value to life 43
Slide 44: Beverages: Business model optimisation and cost reduction
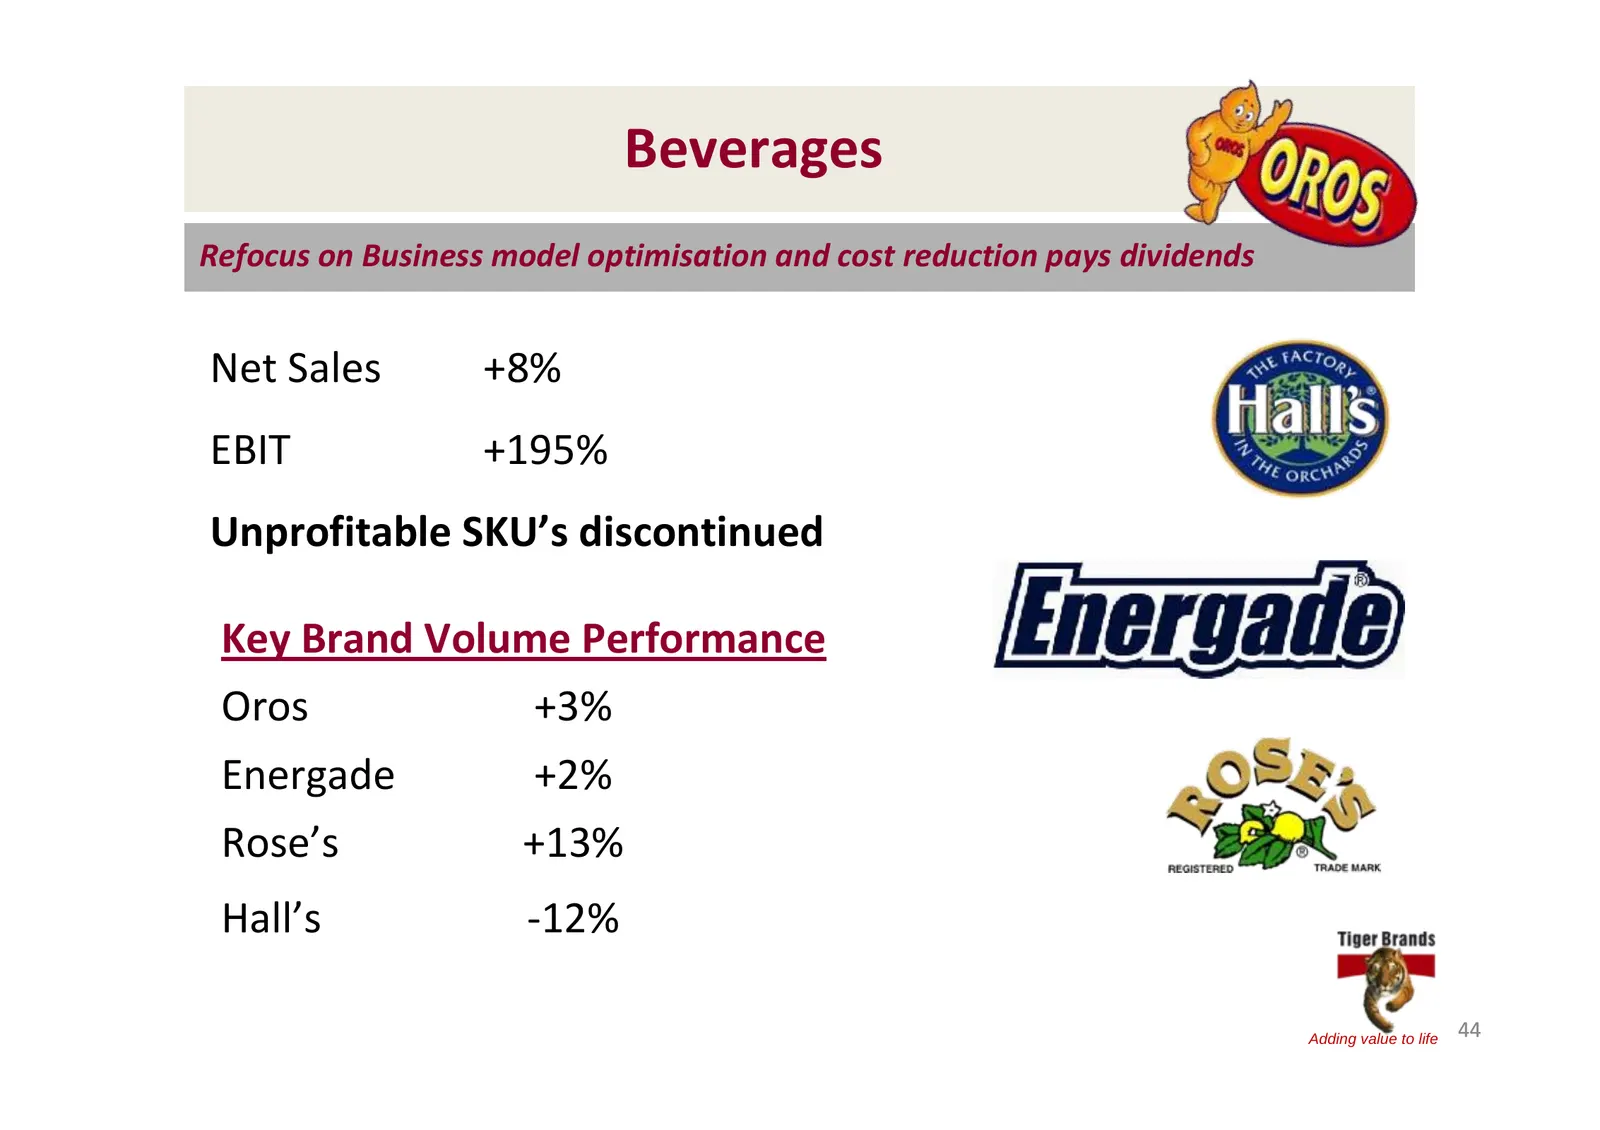
Beverages Refocus on Business model optimisation and cost reduction pays dividends Net Sales +8% EBIT +195% Unprofitable SKU’s discontinued Key Brand Volume Performance Oros +3% Energade +2% Rose’s +13% Hall’s ‐12% Adding value to life 44
Slide 45: Beverages: Recovery, a systematic approach
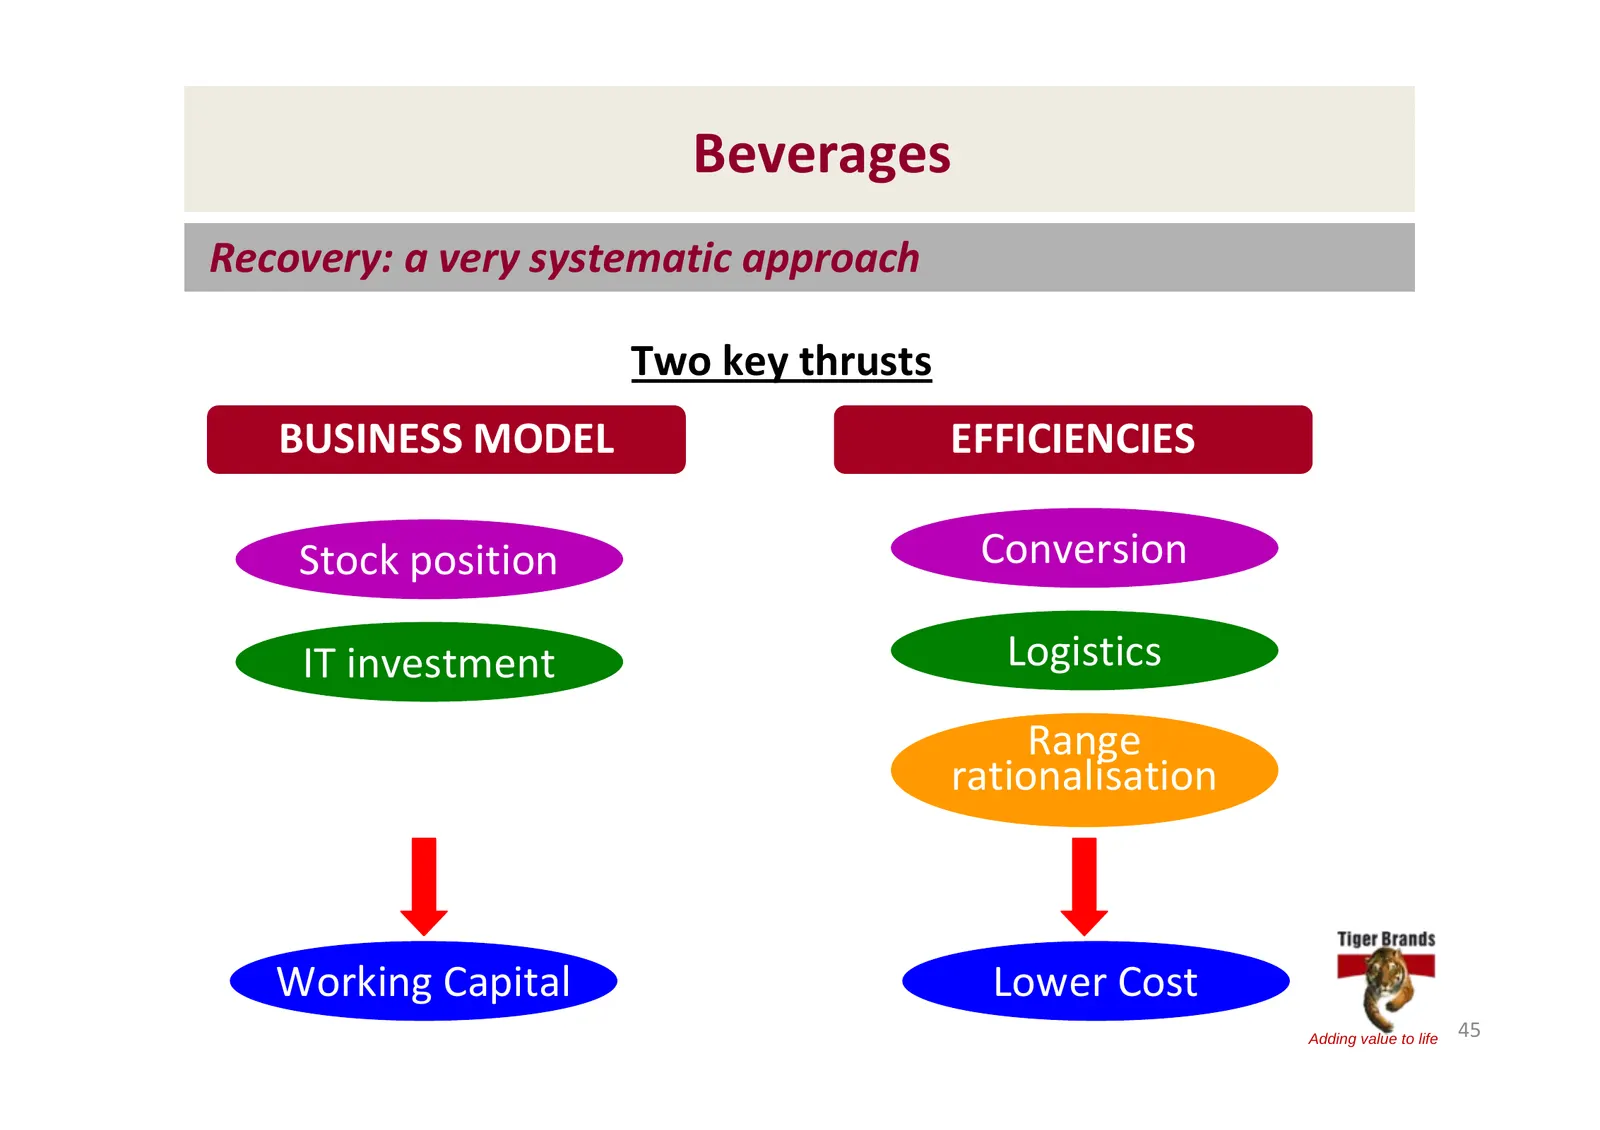
Beverages Recovery: a very systematic approach Two key thrusts BUSINESS MODEL EFFICIENCIES Stock position Conversion IT investment Logistics Range rationalisation Working Capital Lower Cost Adding value to life 45
Slide 46: Beverages: Getting back on track
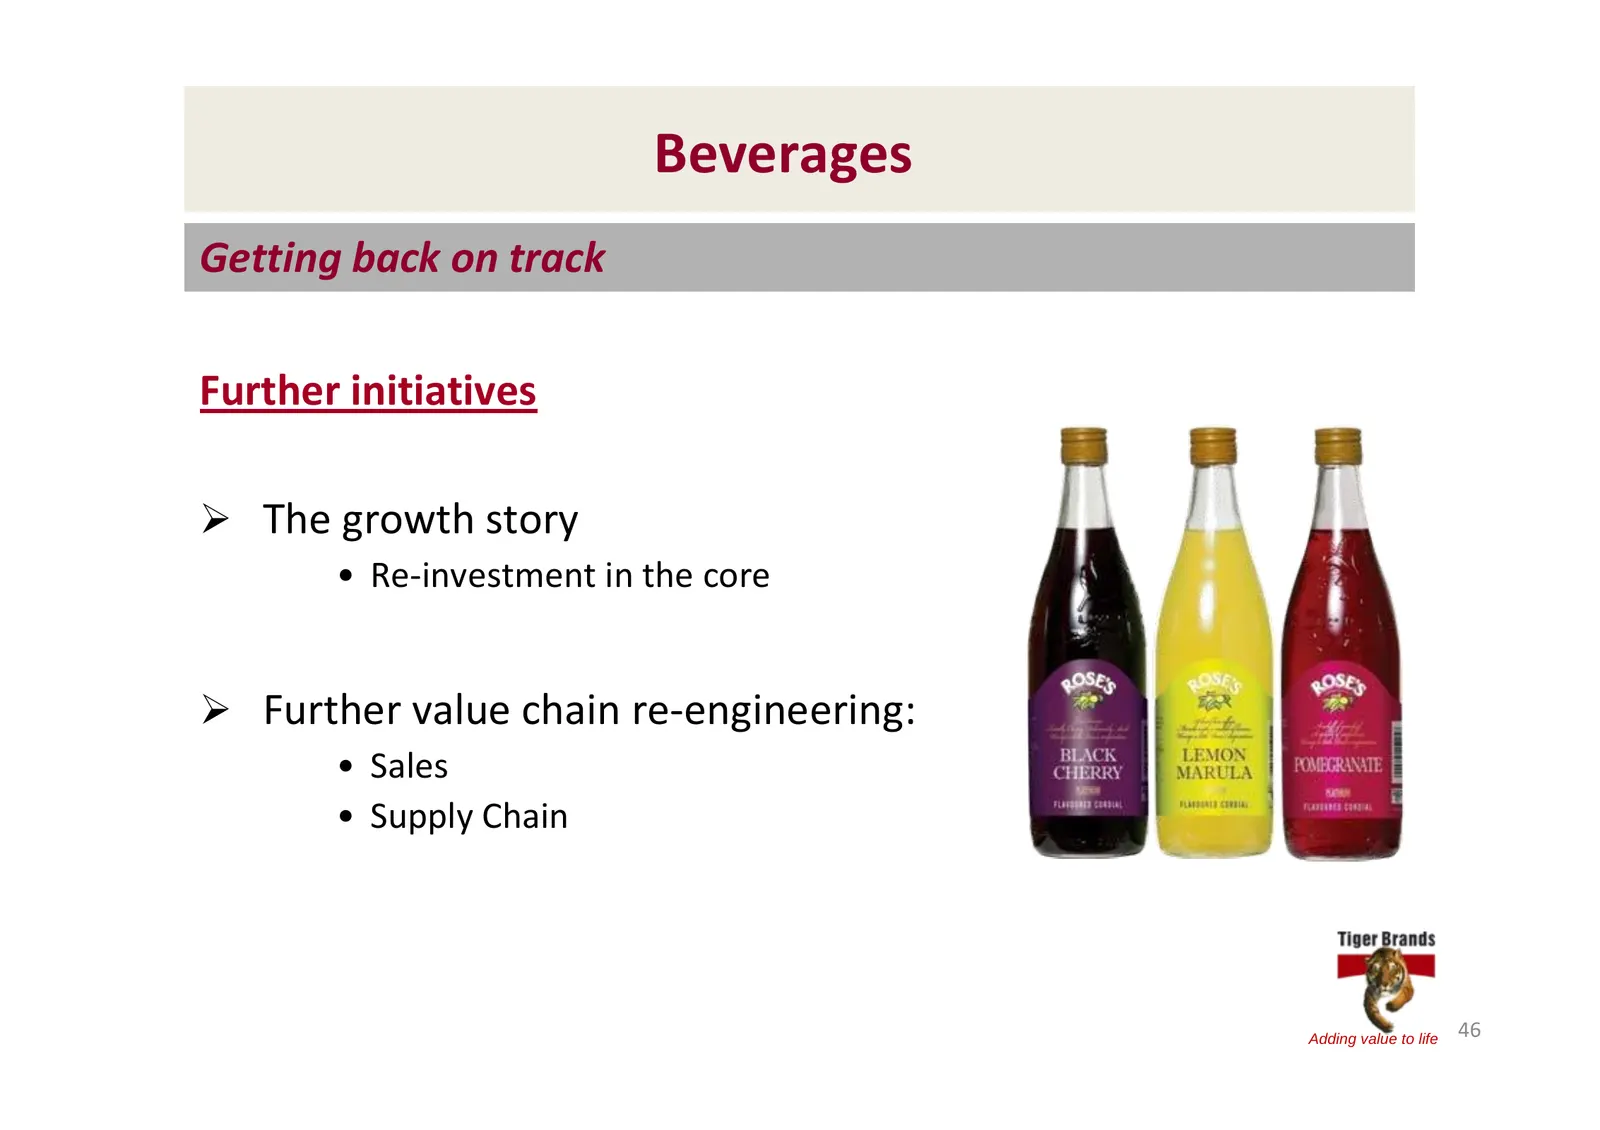
Beverages Getting back on track Further initiatives ¾ The growth story • Re‐investment in the core ¾ Further value chain re‐engineering: • Sales • Supply Chain Adding value to life 46
Slide 47: Value Added Meat Products: Volume pressure
Value Added Meat Products Margins recovering BUT significant volume pressure! ¾ Volume ‐12% ¾ Net Sales +12% ¾ EBIT ‐9% ¾ Significant levels of downtrading as consumers opt for “VALUE” ¾ Increased brand investment vs PY Adding value to life 47
Slide 48: Value Added Meat Products: Margin restoration
Value Added Meat Products A focus on margin restoration Management initiatives ¾ Price point management ¾ Overhead reduction at short interval ¾ Value Re‐engineering Adding value to life 48
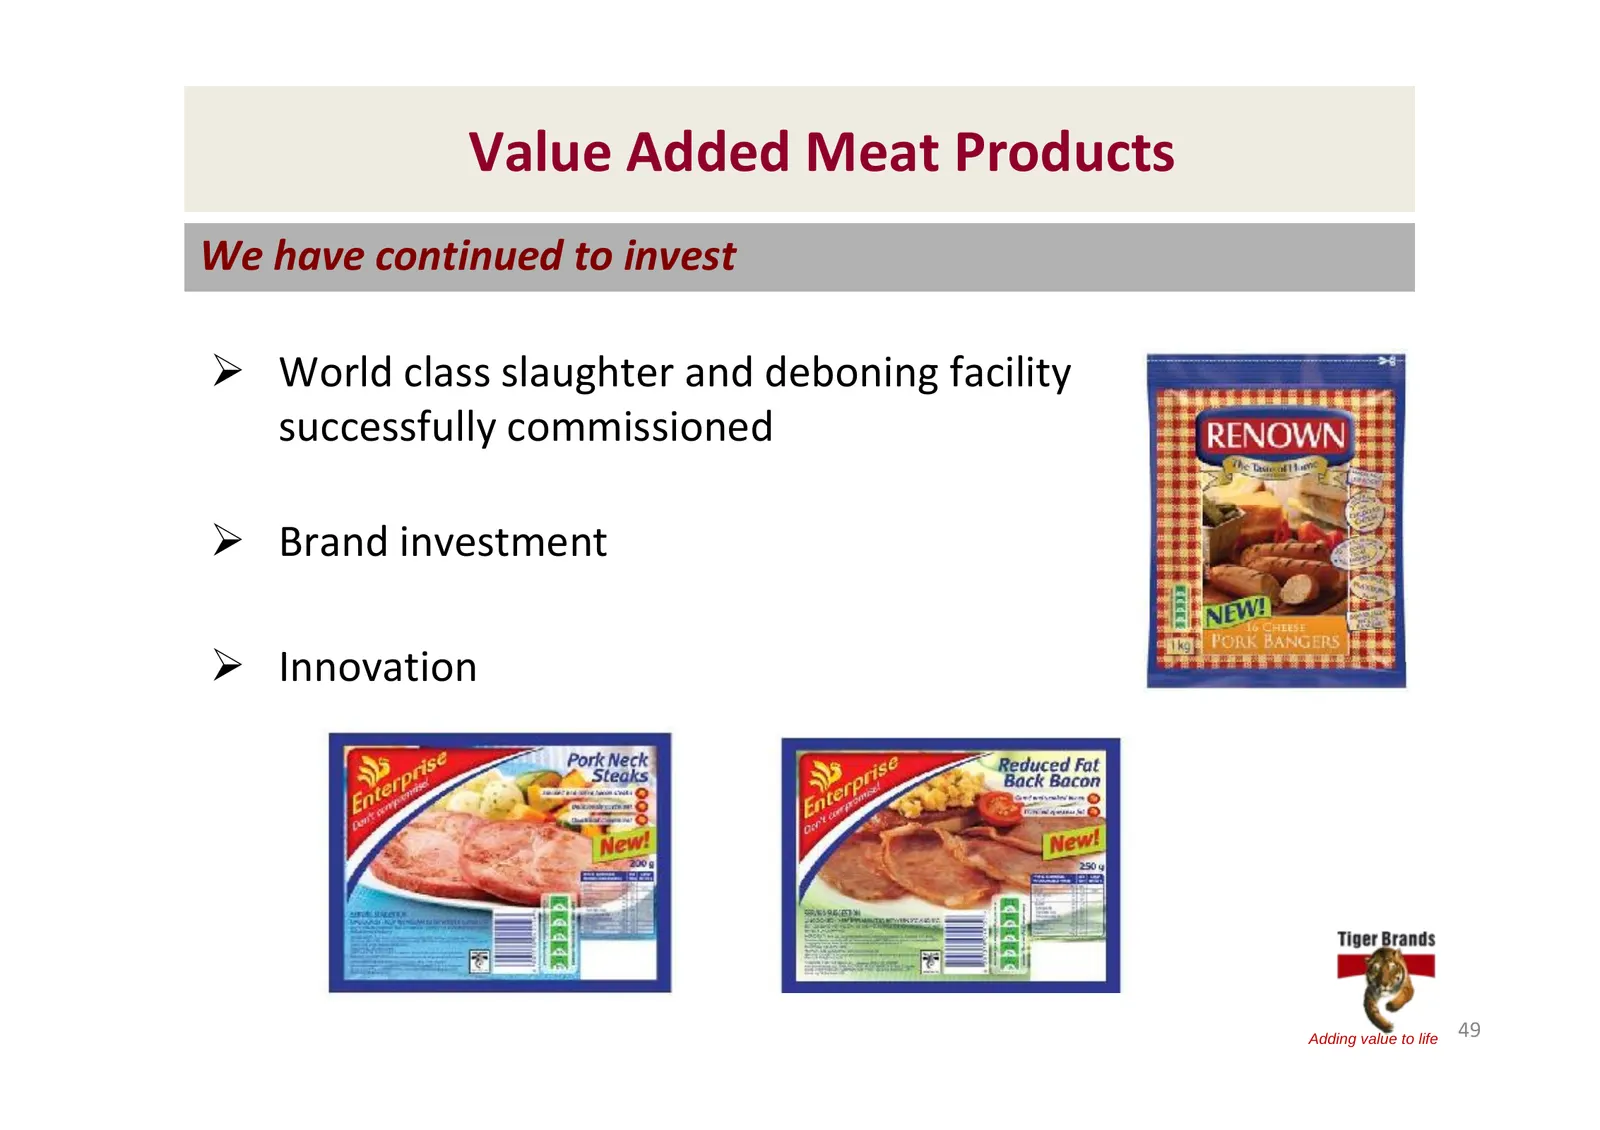
Slide 49: Value Added Meat Products: Continued investment
Value Added Meat Products We have continued to invest ¾ World class slaughter and deboning facility successfully commissioned ¾ Brand investment ¾ Innovation Adding value to life 49
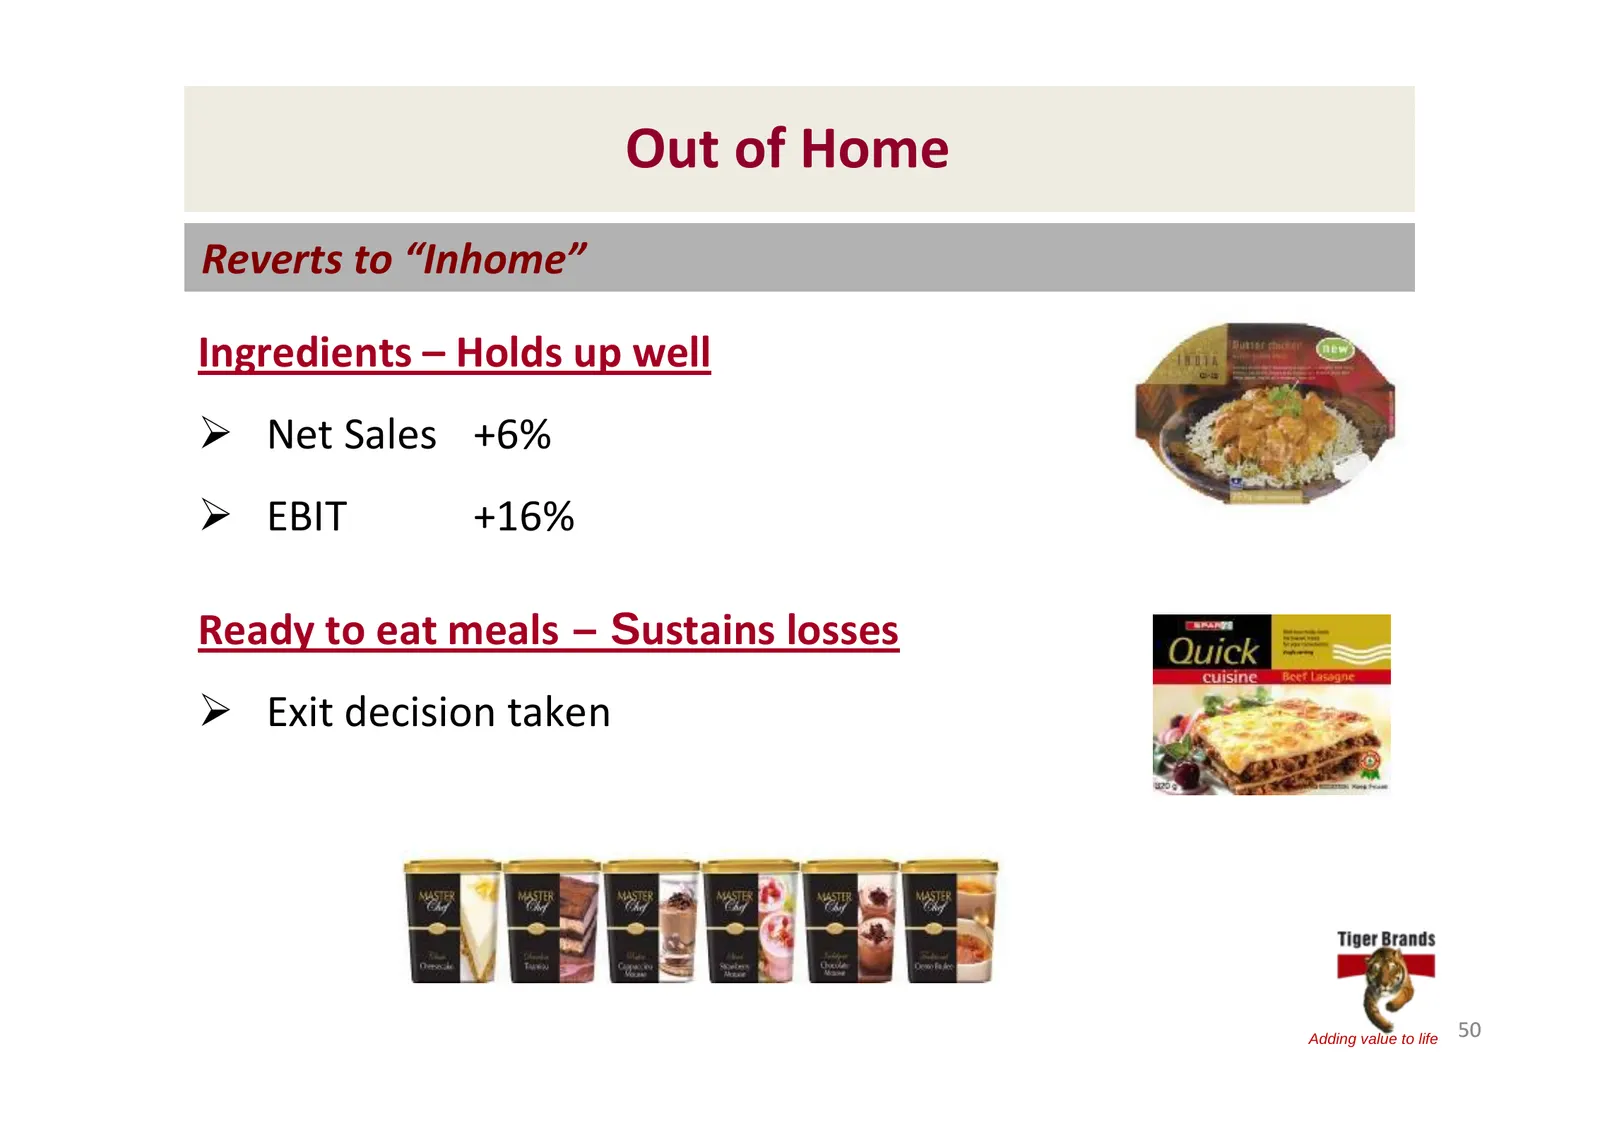
Slide 50: Out of Home
Out of Home Reverts to “Inhome” Ingredients – Holds up well ¾ Net Sales +6% ¾ EBIT +16% Ready to eat meals – Sustains losses ¾ Exit decision taken Adding value to life 50
Slide 51: Consumer Healthcare: Tough times in the short term
Consumer Healthcare “Tough times in the short term” Key Themes ¾ Poor Pest Season ¾ Consumer spending constrained ‐ Market Declines ¾ Margin Compression * Personal Care and Well‐Being * Co‐Pack Margin ¾ Baby Nutrition ‐ Slower growth but remains Positive with EBIT expansion & market share gains Addi
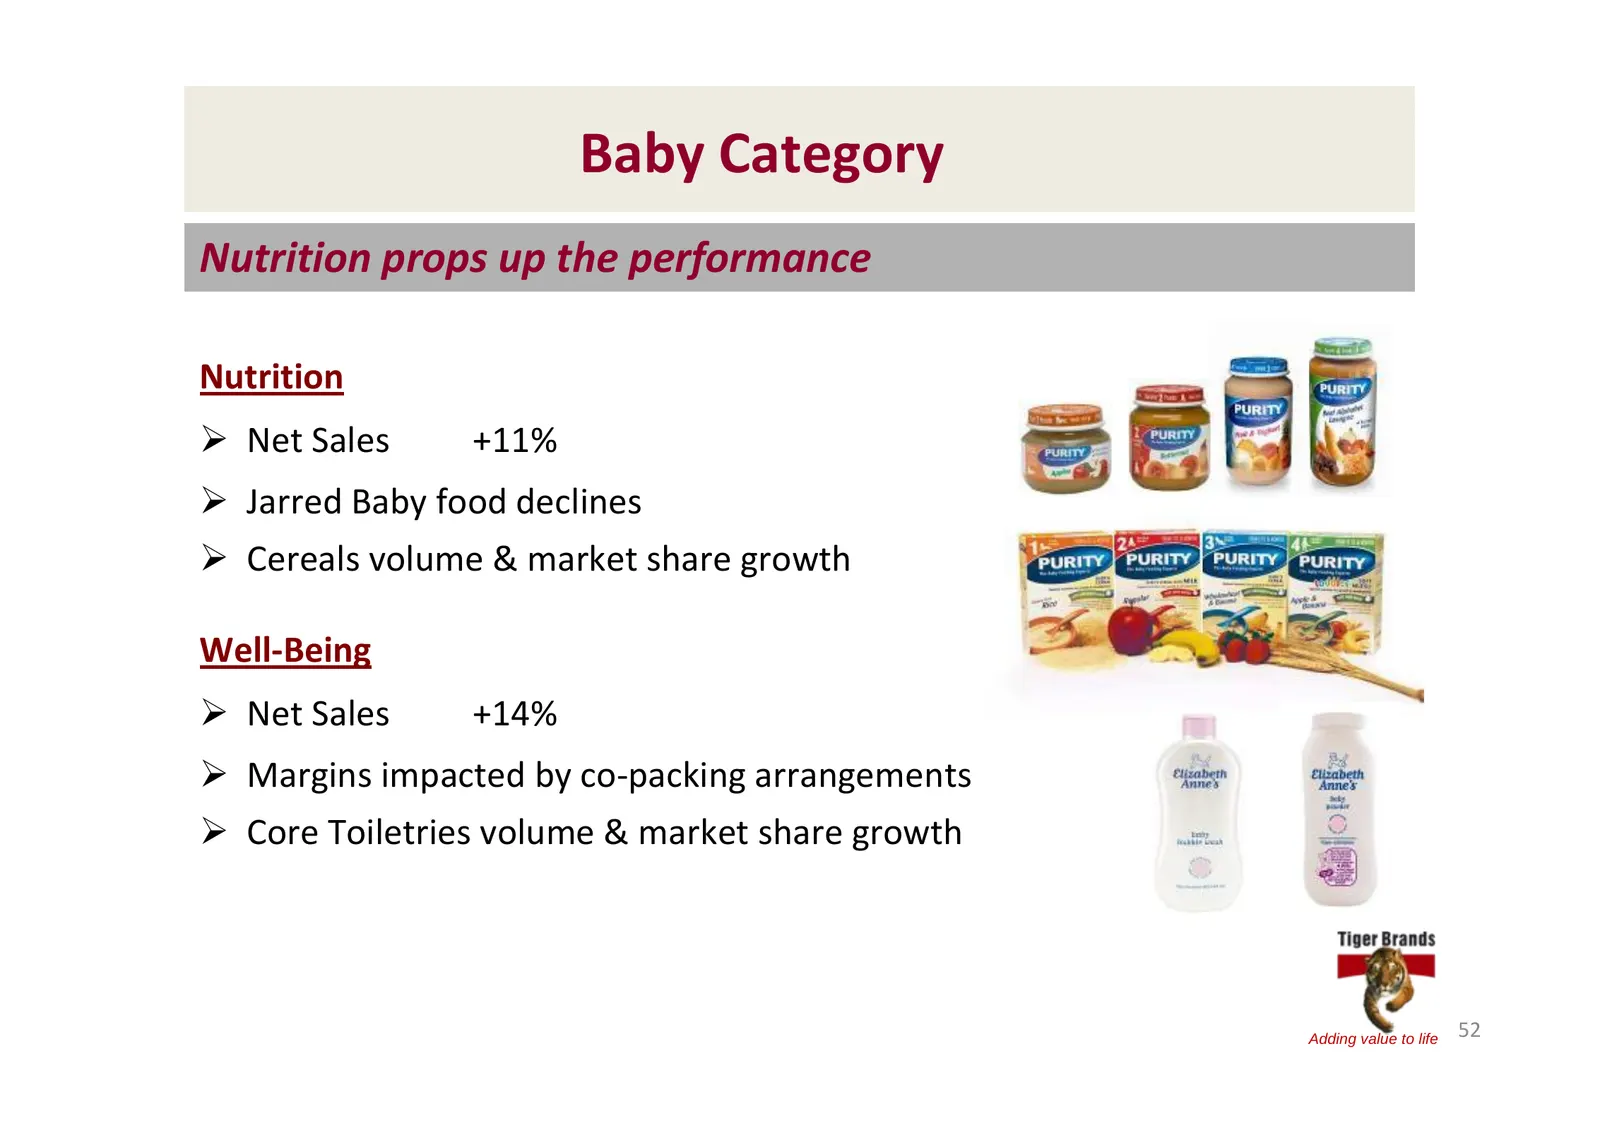
Slide 52: Baby Category
Baby Category Nutrition props up the performance Nutrition ¾ Net Sales +11% ¾ Jarred Baby food declines ¾ Cereals volume & market share growth Well‐Being ¾ Net Sales +14% ¾ Margins impacted by co‐packing arrangements ¾ Core Toiletries volume & market share growth Adding value to life 52
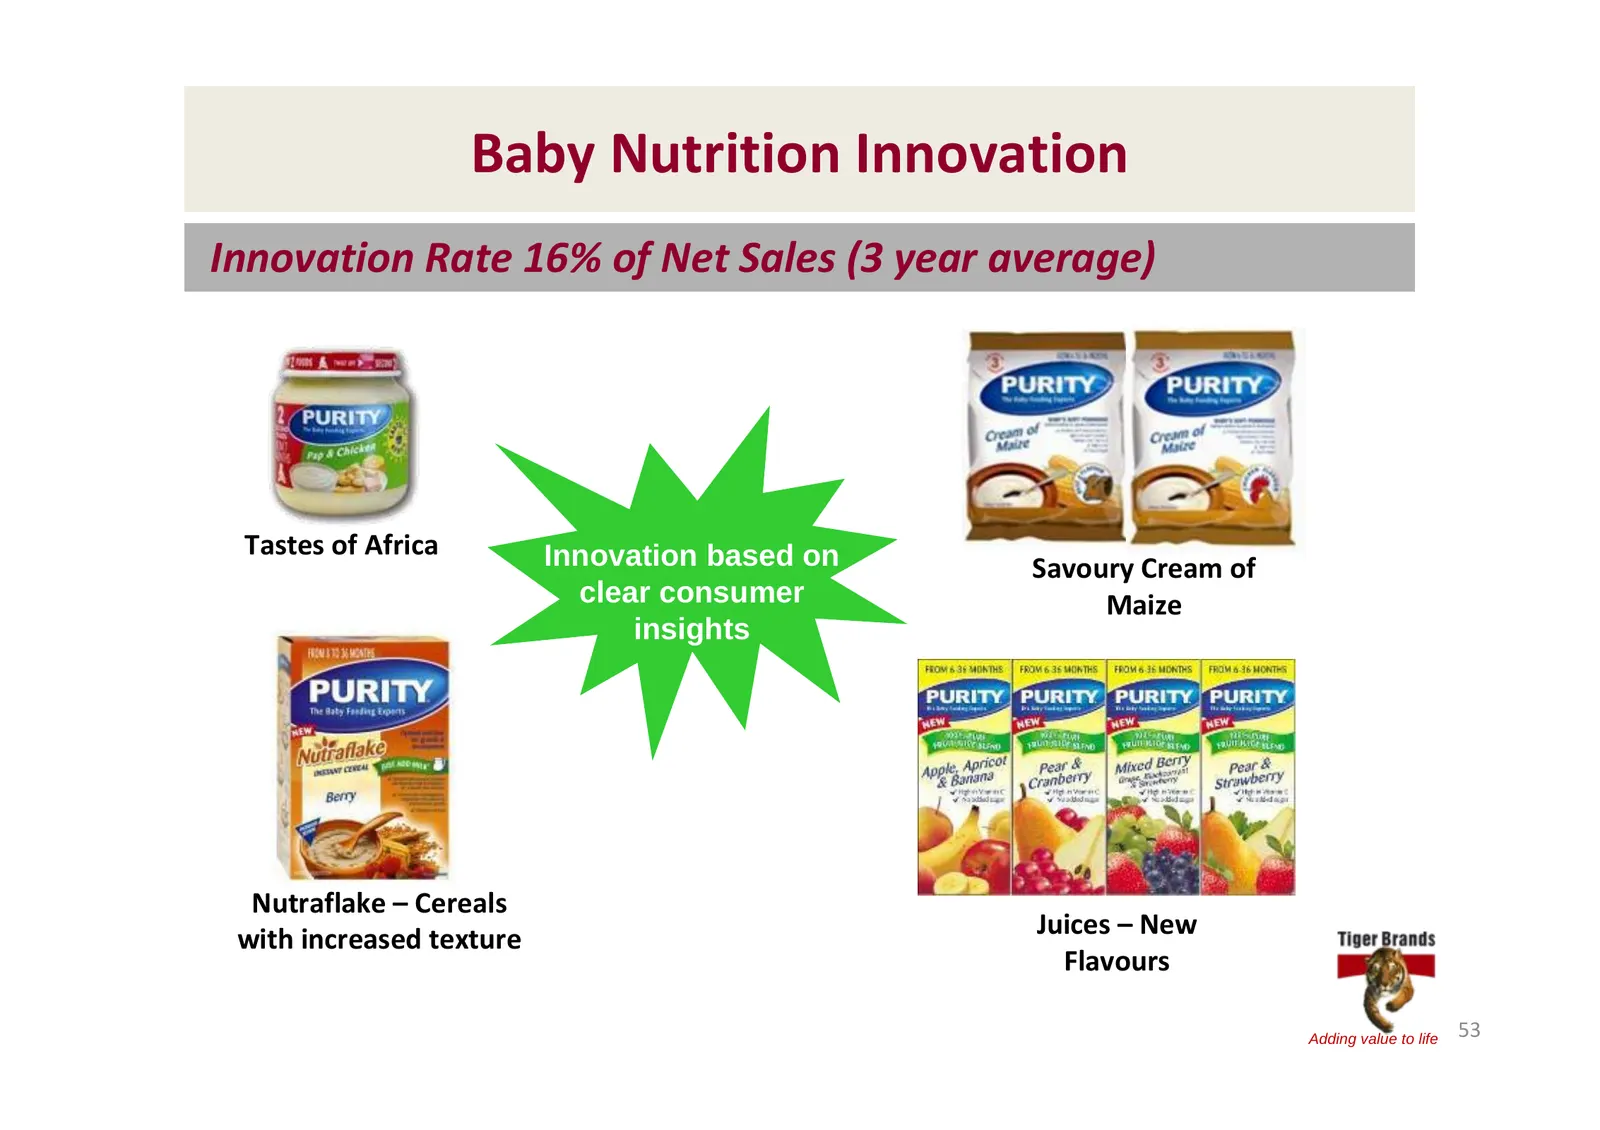
Slide 53: Baby Nutrition Innovation
Baby Nutrition Innovation Innovation Rate 16% of Net Sales (3 year average) Tastes of Africa Innovation based on Savoury Cream of clear consumer Maize insights Nutraflake – Cereals with increased texture Juices – New Flavours Adding value to life 53
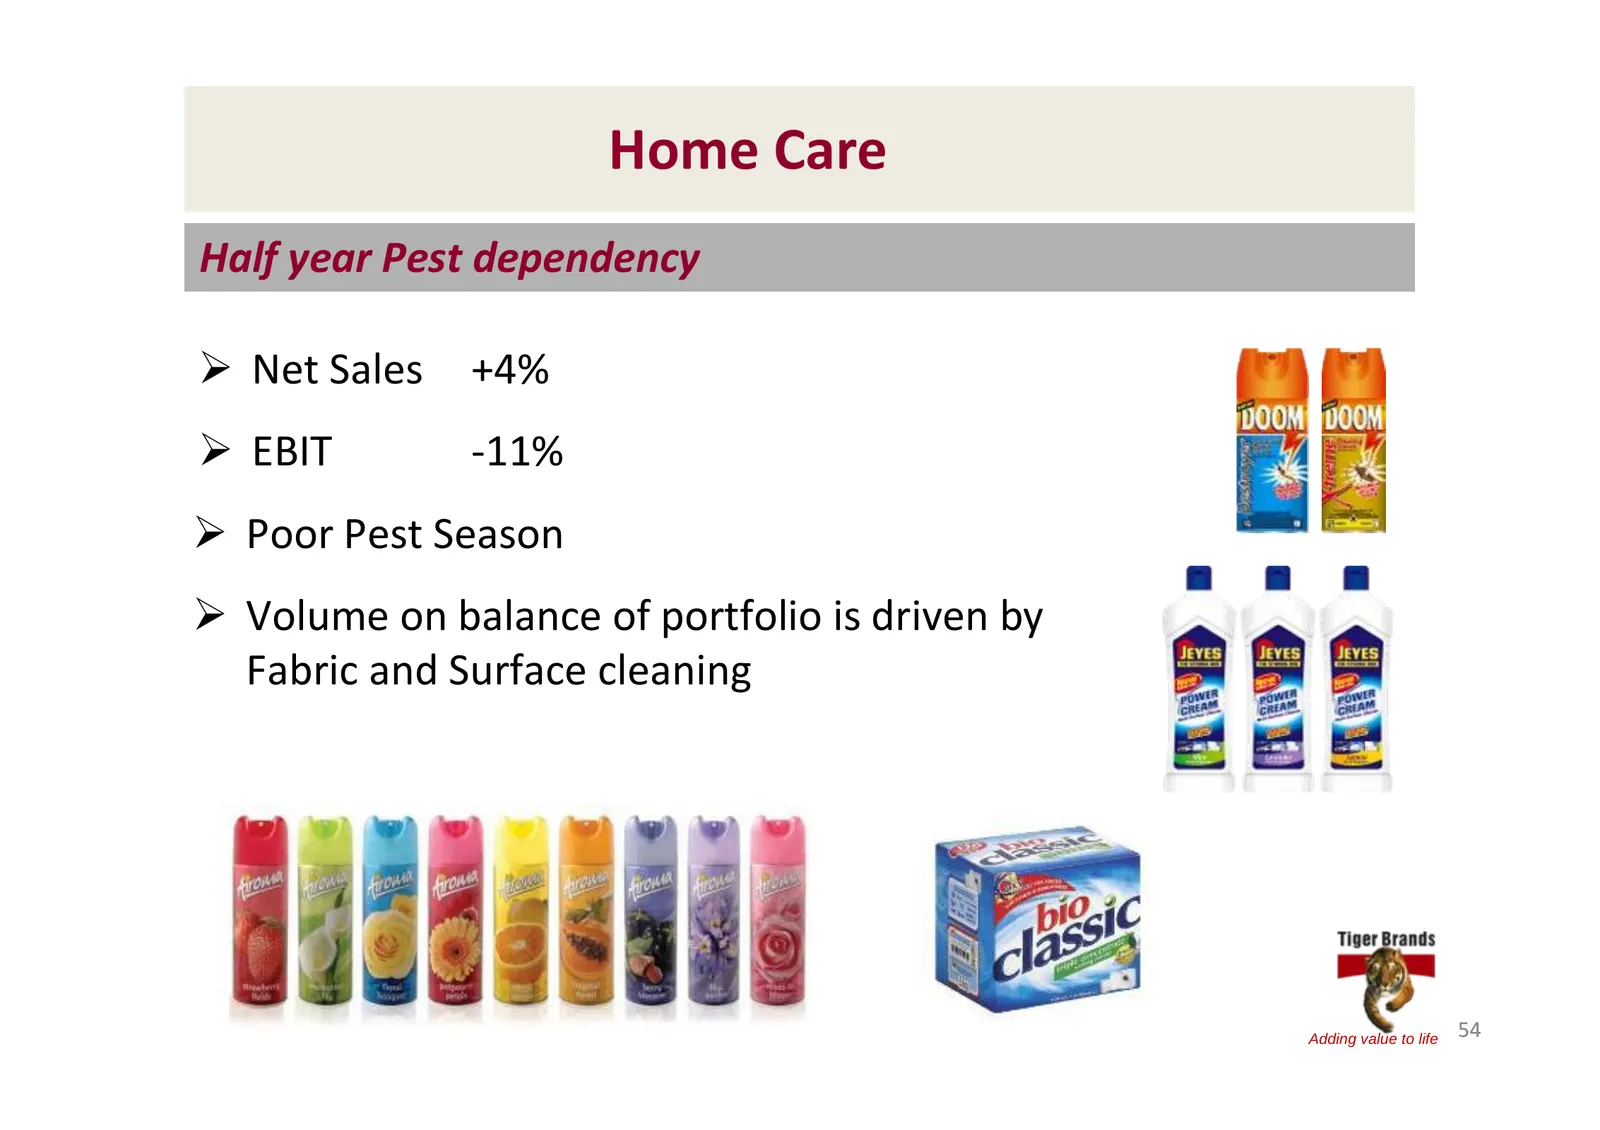
Slide 54: Home Care
Home Care Half year Pest dependency ¾ Net Sales +4% ¾ EBIT ‐11% ¾ Poor Pest Season ¾ Volume on balance of portfolio is driven by Fabric and Surface cleaning Adding value to life 54
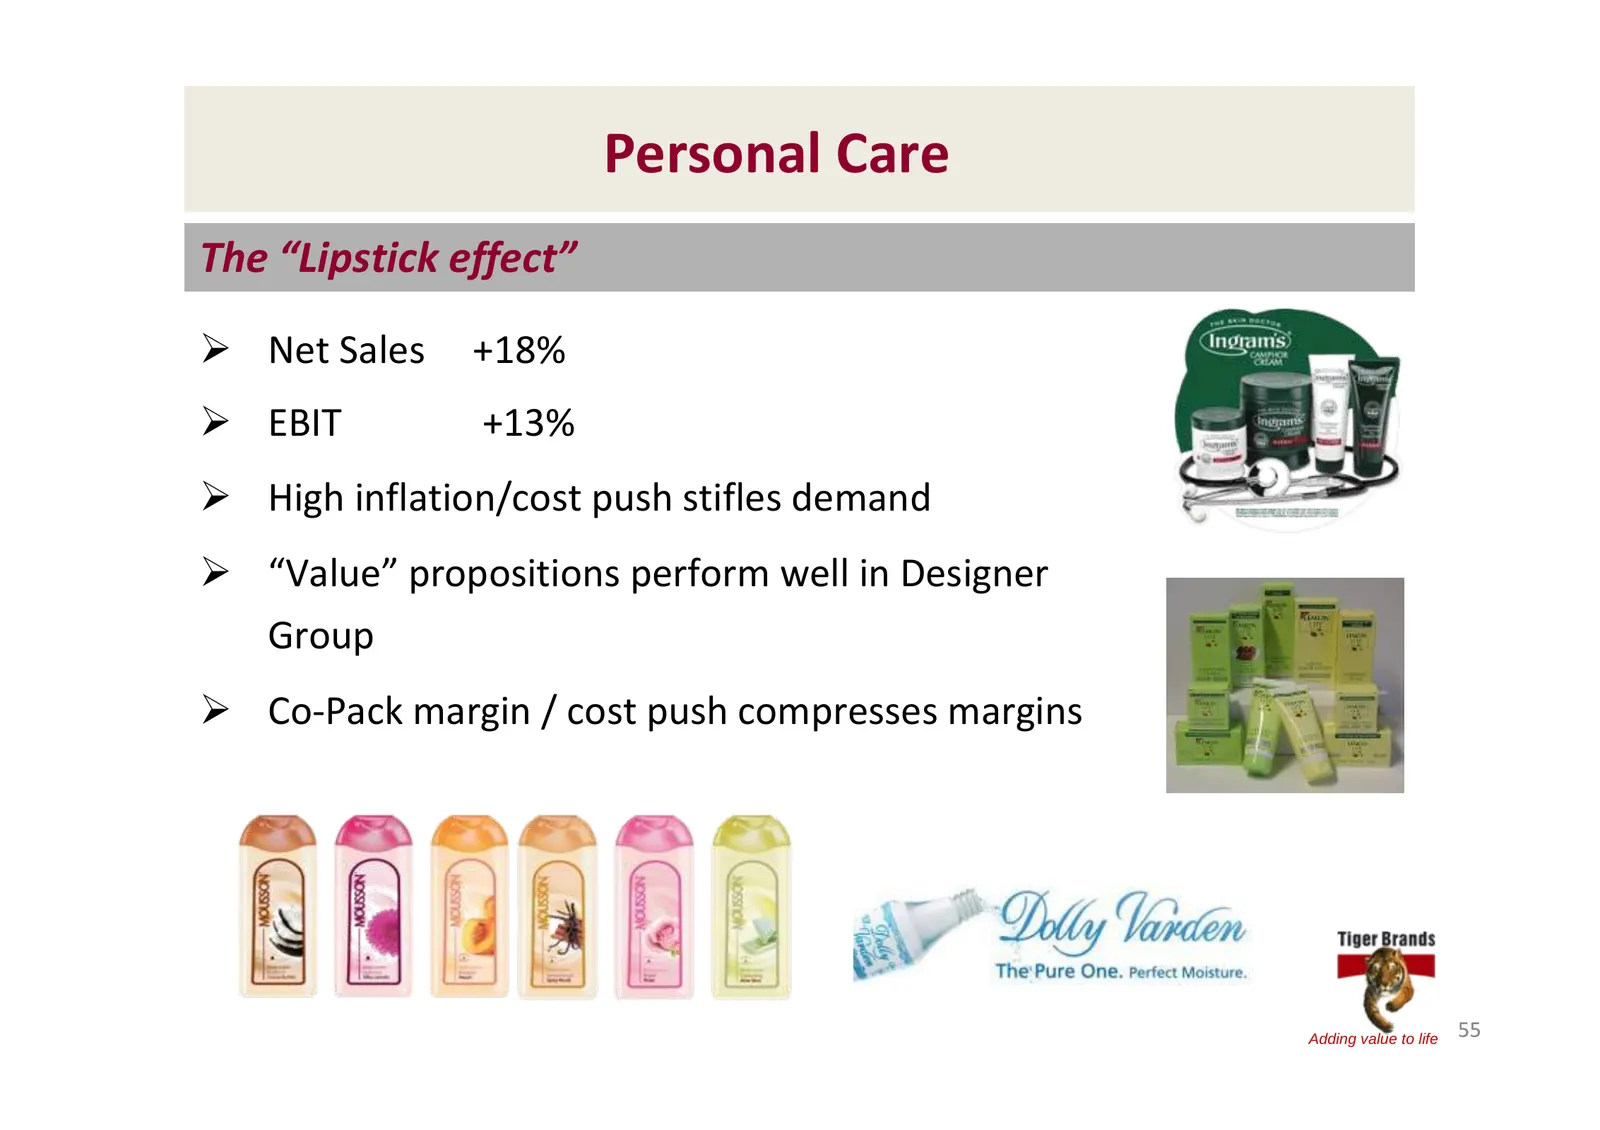
Slide 55: Personal Care
Personal Care The “Lipstick effect” ¾ Net Sales +18% ¾ EBIT +13% ¾ High inflation/cost push stifles demand ¾ “Value” propositions perform well in Designer Group ¾ Co‐Pack margin / cost push compresses margins Adding value to life 55
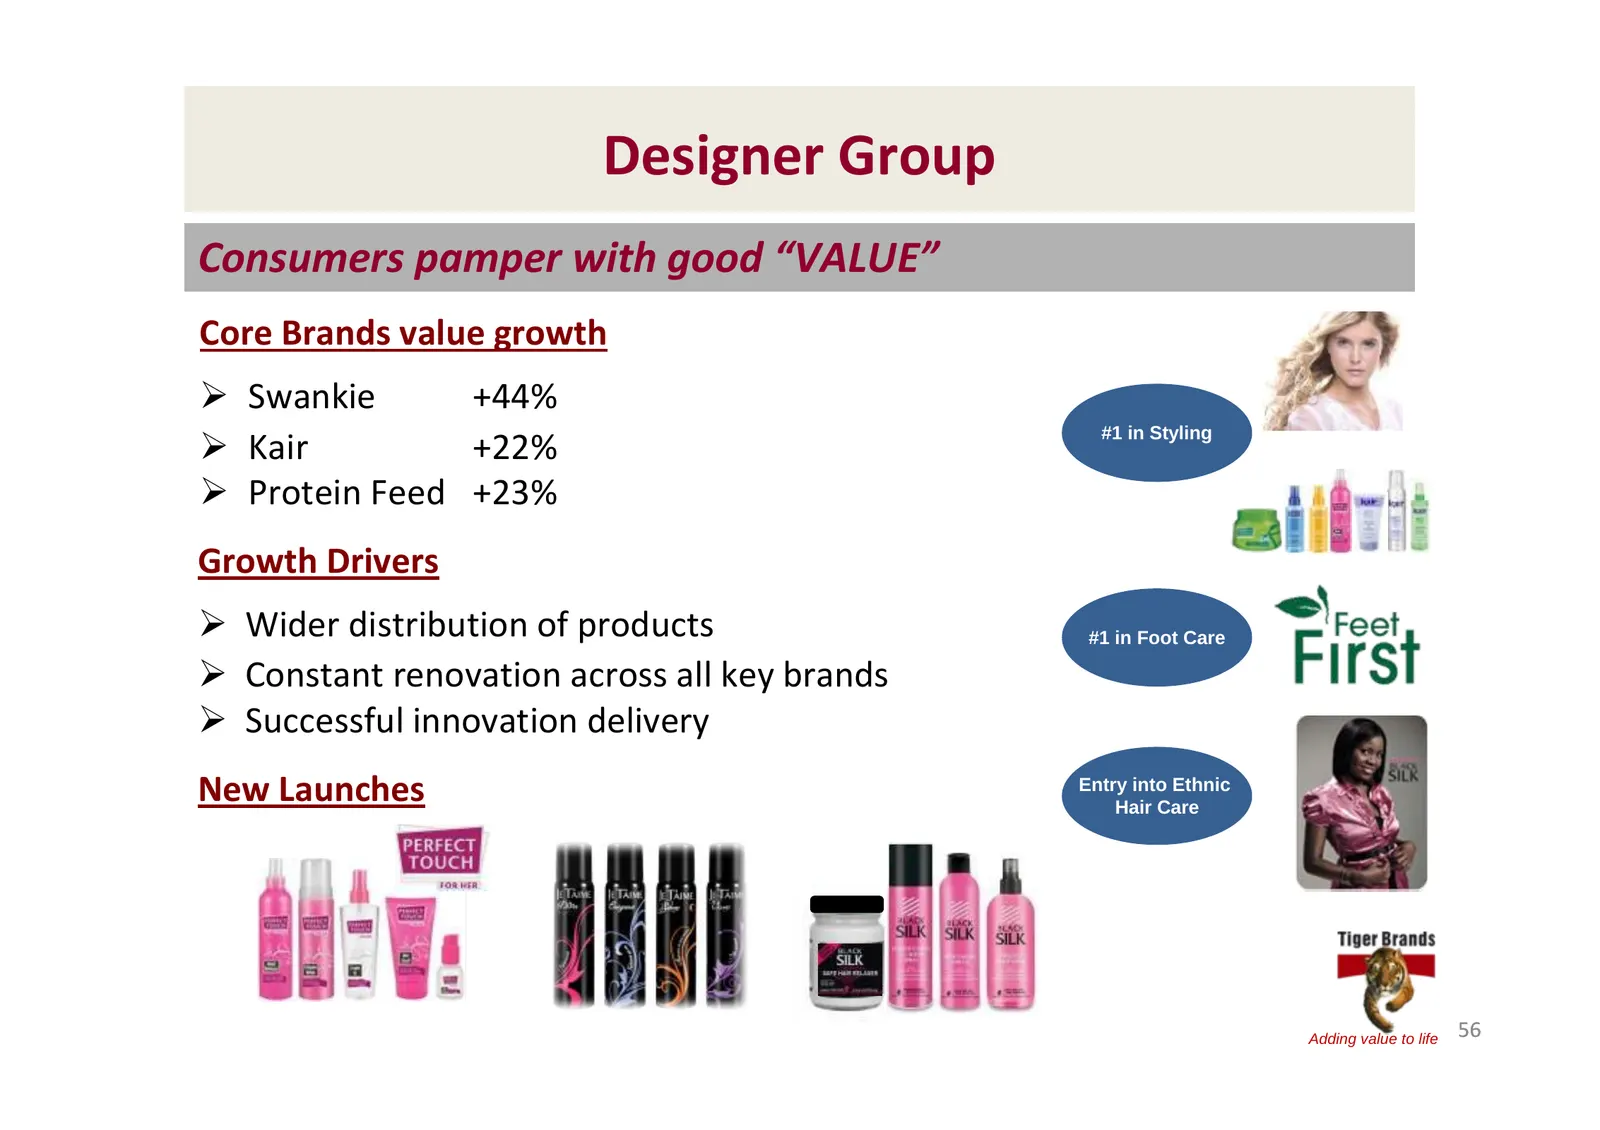
Slide 56: Designer Group
Designer Group Consumers pamper with good “VALUE” Core Brands value growth ¾ Swankie +44% ¾ Kair #1 in Styling +22% ¾ Protein Feed +23% Growth Drivers ¾ Wider distribution of products #1 in Foot Care ¾ Constant renovation across all key brands ¾ Successful innovation delivery New Launches Entry into
Slide 57: L&AF: World markets slow down
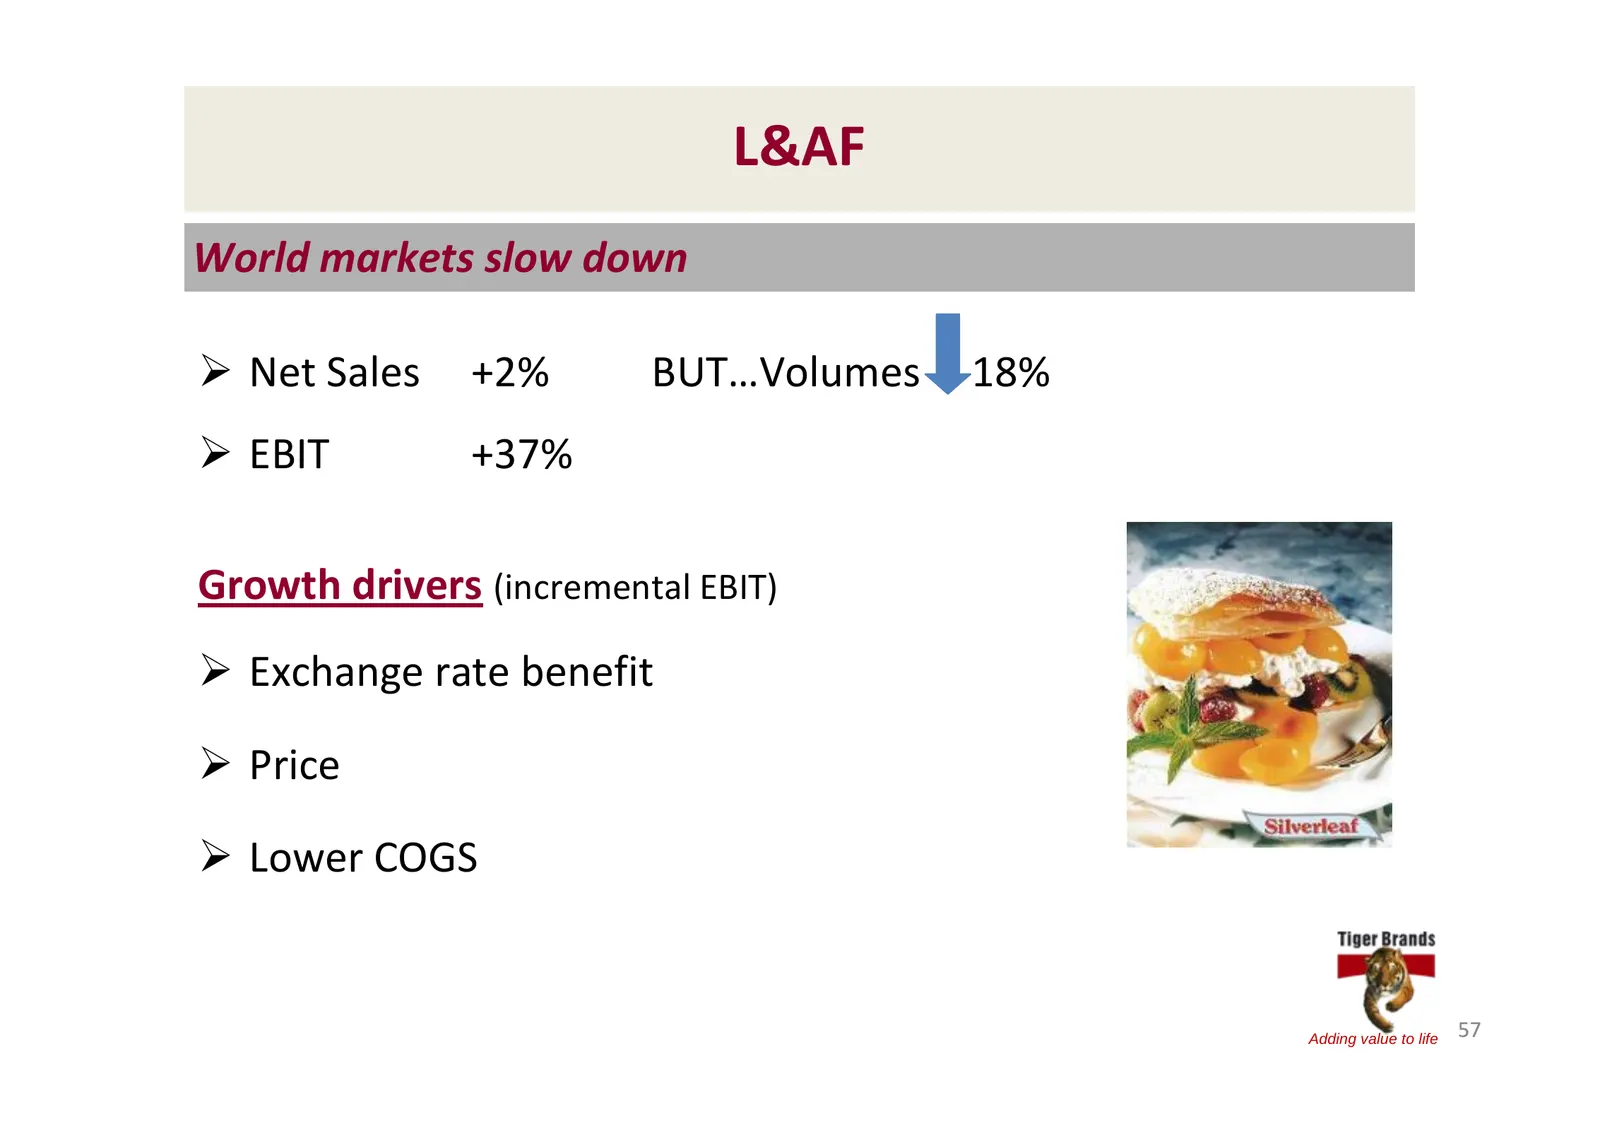
L&AF World markets slow down ¾ Net Sales +2% BUT…Volumes 18% ¾ EBIT +37% Growth drivers (incremental EBIT) ¾ Exchange rate benefit ¾ Price ¾ Lower COGS Adding value to life 57
Slide 58: L&AF cont...
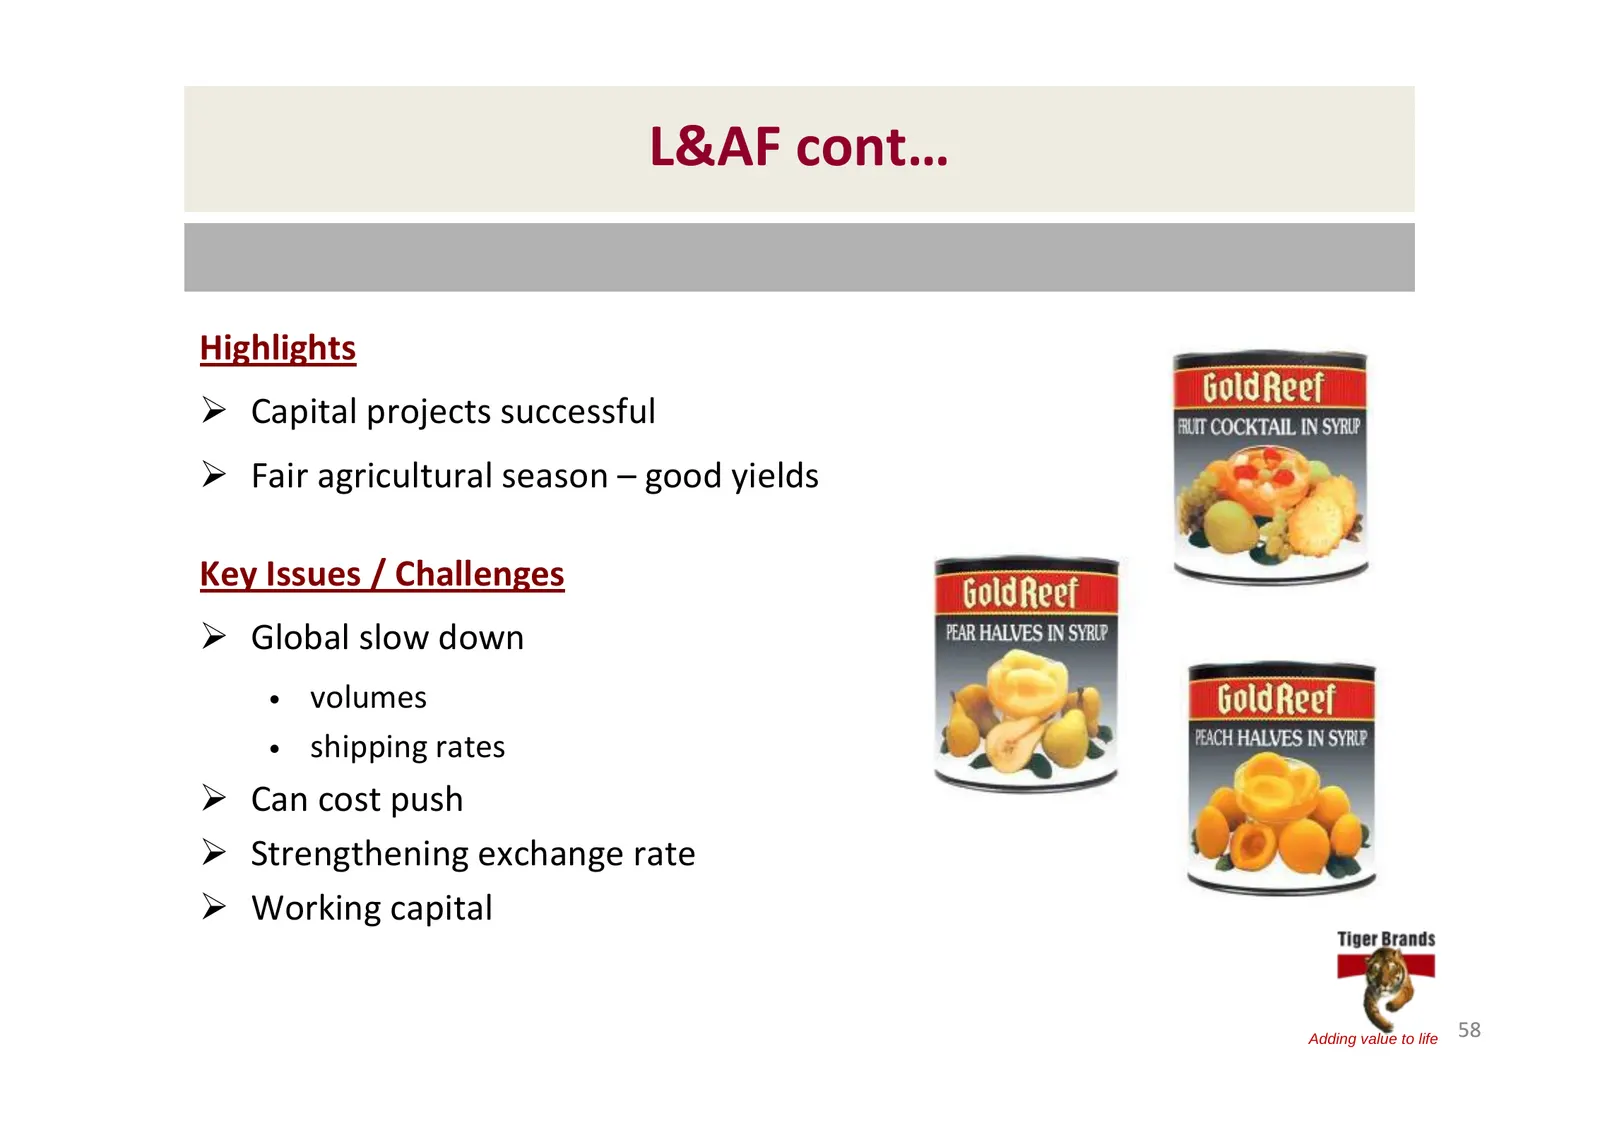
L&AF cont… Highlights ¾ Capital projects successful ¾ Fair agricultural season – good yields Key Issues / Challenges ¾ Global slow down • volumes • shipping rates ¾ Can cost push ¾ Strengthening exchange rate ¾ Working capital Adding value to life 58
Slide 59: Fishing: Oceana produces excellent results
Fishing Oceana produces excellent results ¾ Oceana results published on 7 May 2009 ¾ HEPS +59% ¾ Growth and improved profitability driven by: • Canned fish/Horse Mackerel • Higher export realisations • Diversified portfolio ¾ Good horse mackerel and pilchard catch rates ¾ Alternative sourcing in pla
Slide 60: Sea Harvest: Discontinued Operation
Sea Harvest Discontinued Operation ¾ Net Sales +9% ¾ EBIT +20% ¾ Sale of Tiger’s 73.16% interest in Sea Harvest to Brimstone Consortium • Consideration R541m and price escalations from 1 October 2008 • PWC confirmed sale terms fair to Tiger shareholders • Competition Tribunal approval on 25 March 20
Slide 61: Tiger Brands International: Operational Performance, Peter Matlare
Tiger Brands International Operational Performance Peter Matlare CEO Adding value to life 61
Slide 62: Tiger Brands International: Our Priority Zones
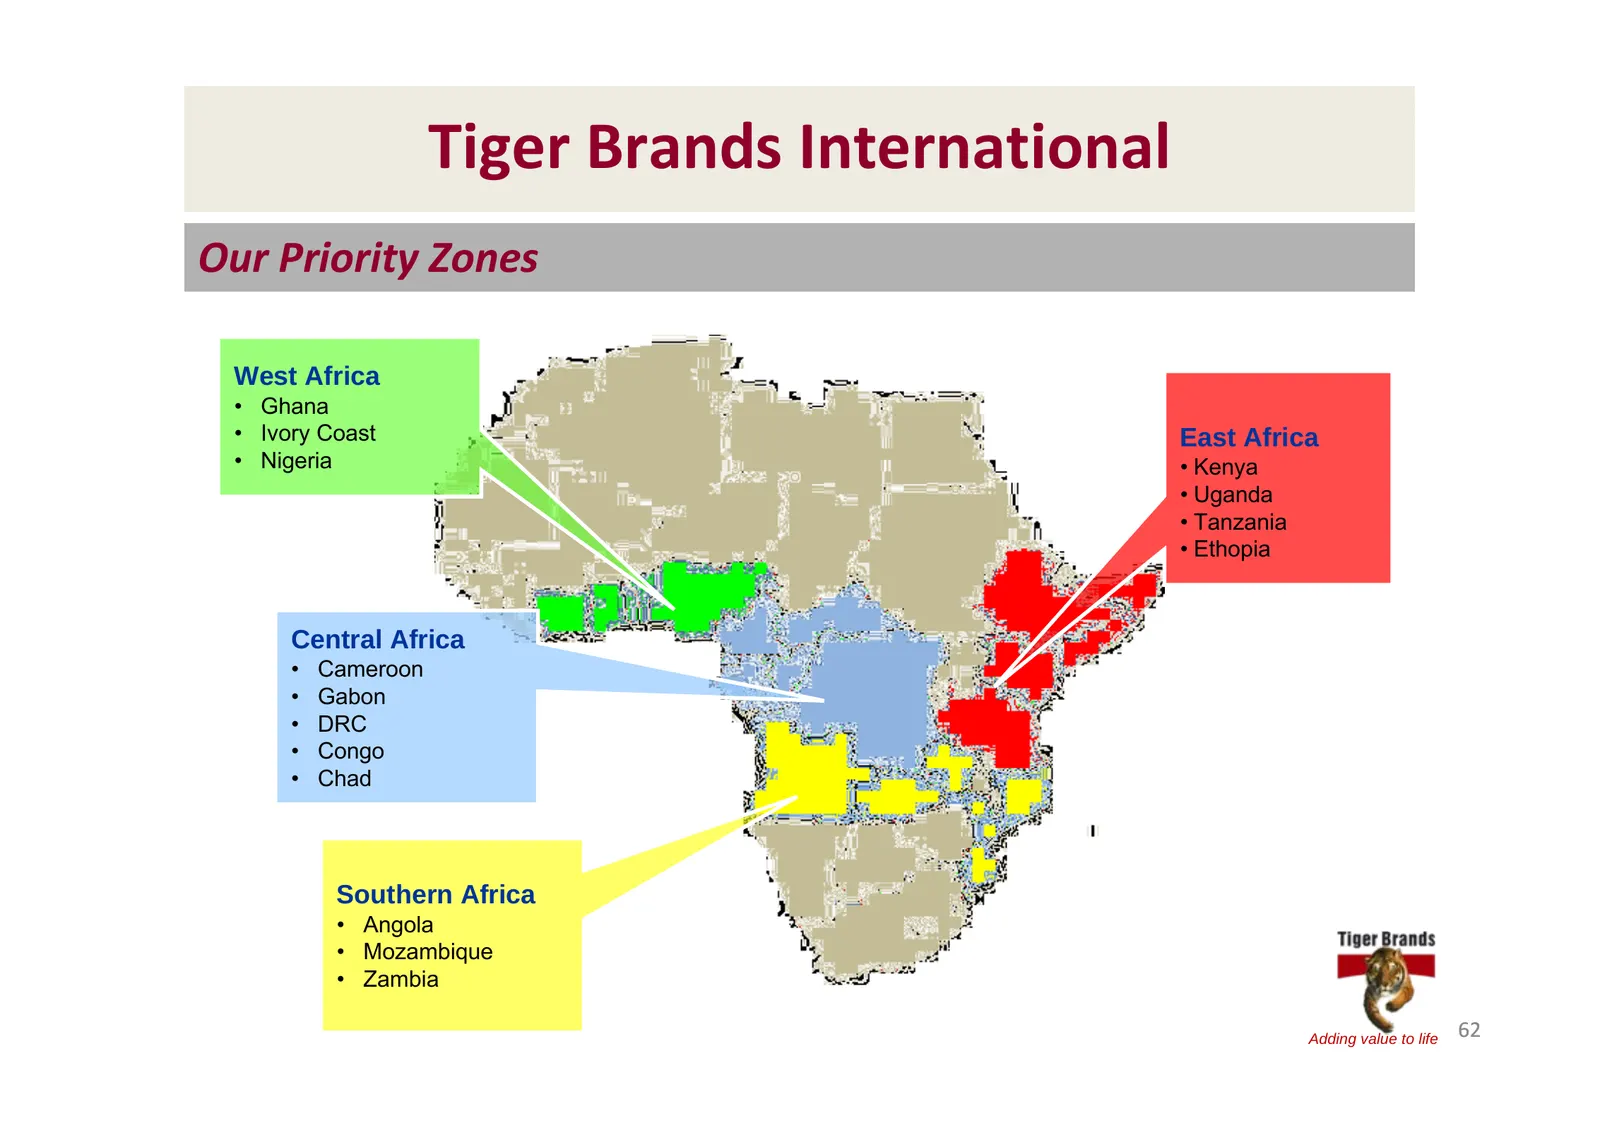
Tiger Brands International Our Priority Zones West Africa • Ghana • Ivory Coast East Africa • Nigeria • Kenya • Uganda • Tanzania • Ethopia Central Africa • Cameroon • Gabon • DRC • Congo • Chad Southern Africa • Angola • Mozambique • Zambia Adding value to life 62
Slide 63: Tiger Brands International: Key indicators
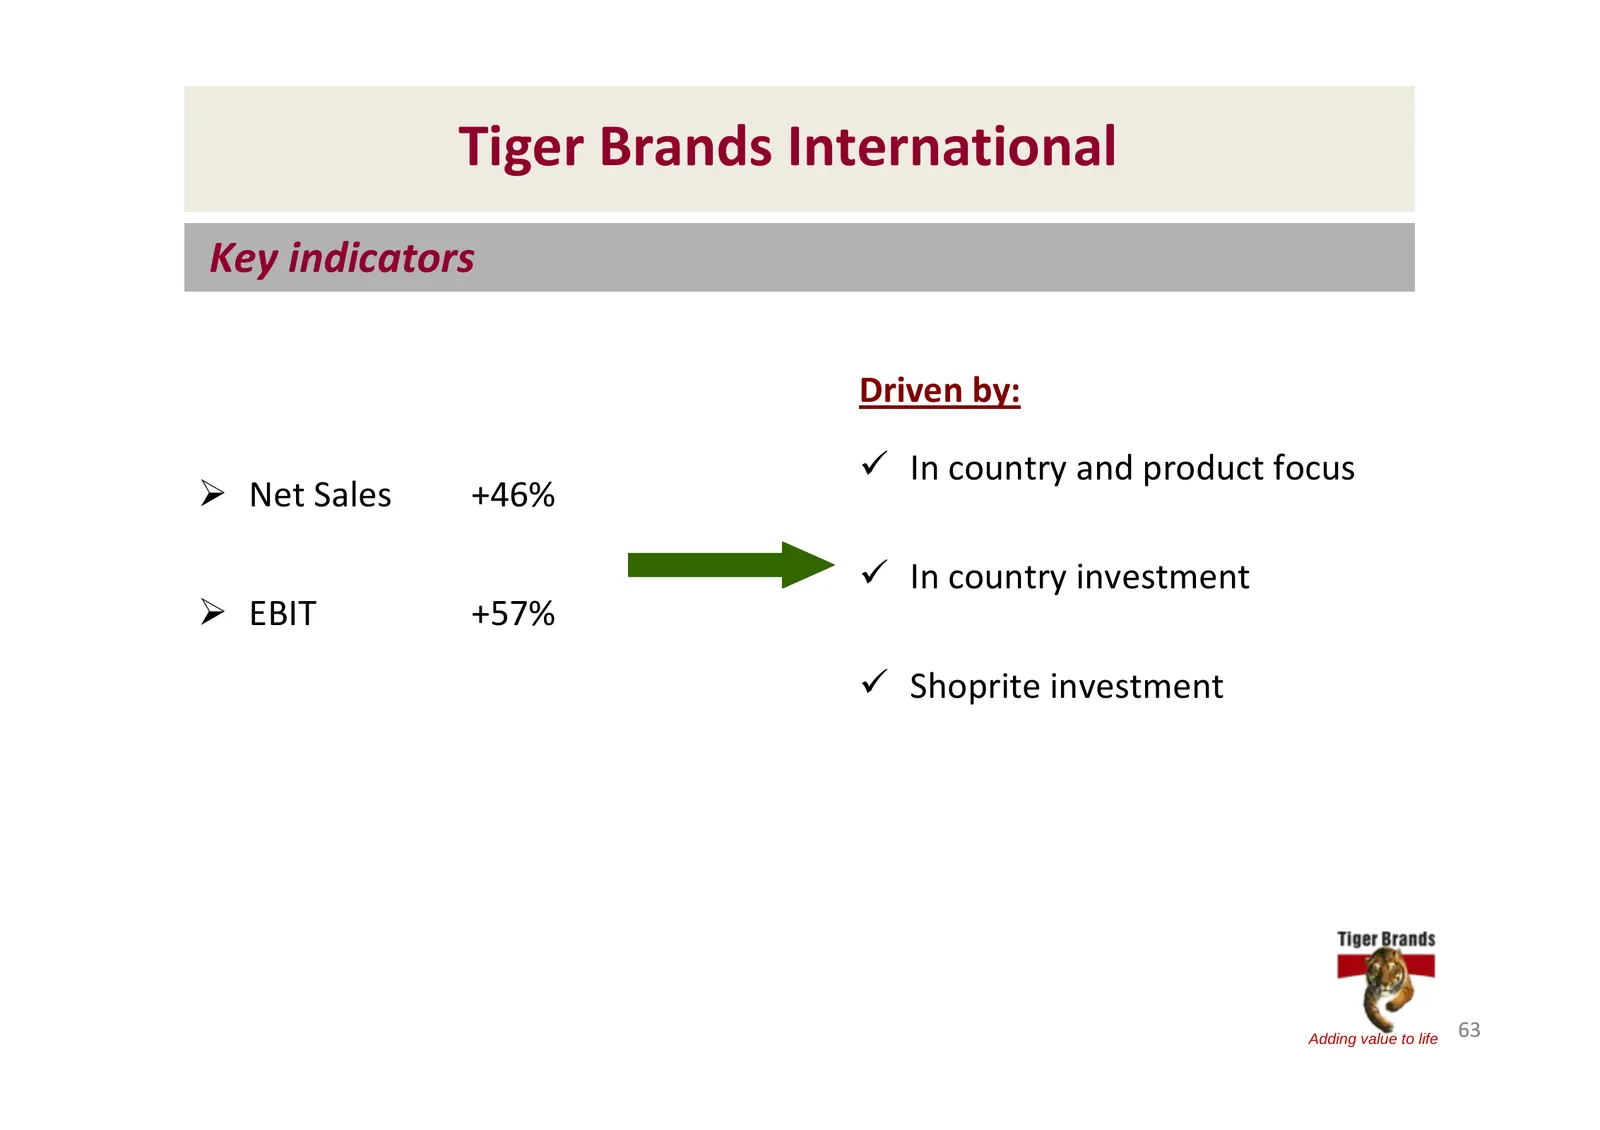
Tiger Brands International Key indicators Driven by: 9 In country and product focus ¾ Net Sales +46% 9 In country investment ¾ EBIT +57% 9 Shoprite investment Adding value to life 63
Slide 64: Tiger Brands International: Country specific indicators
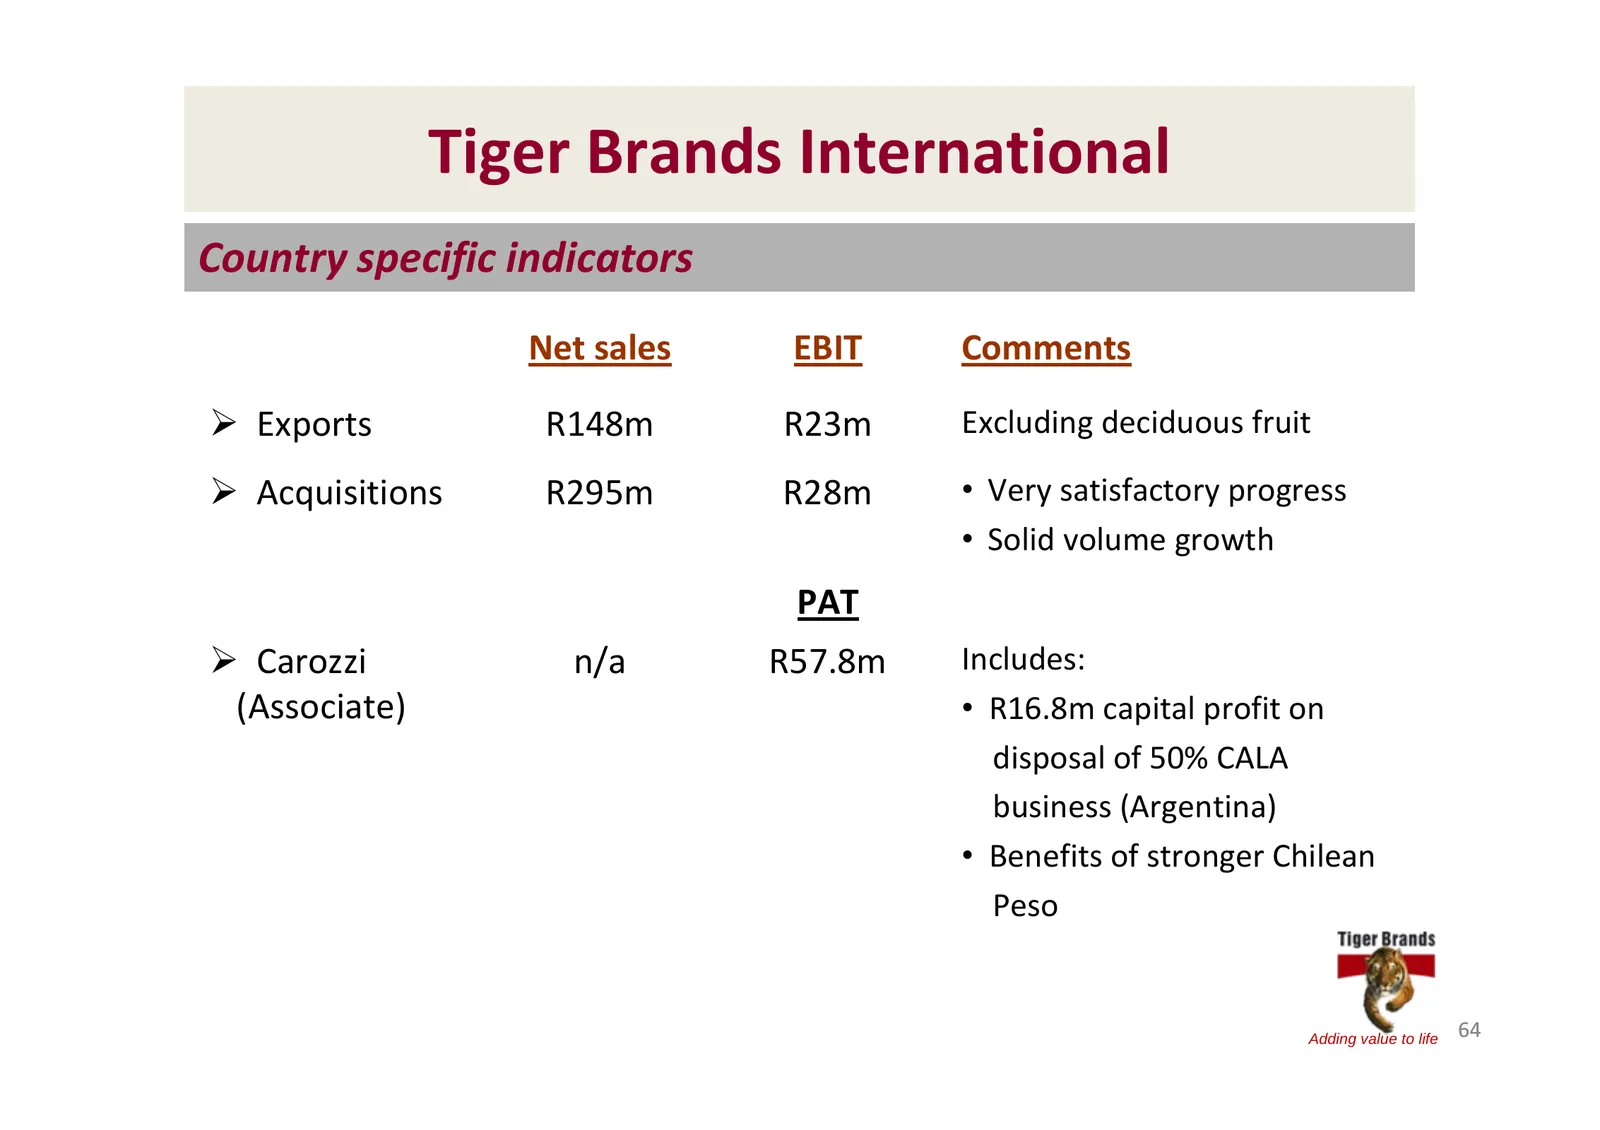
Tiger Brands International Country specific indicators Net sales EBIT Comments ¾ Exports R148m R23m Excluding deciduous fruit ¾ Acquisitions R295m R28m • Very satisfactory progress • Solid volume growth PAT ¾ Carozzi n/a R57.8m Includes: (Associate) • R16.8m capital profit on disposal of 50% CALA bu
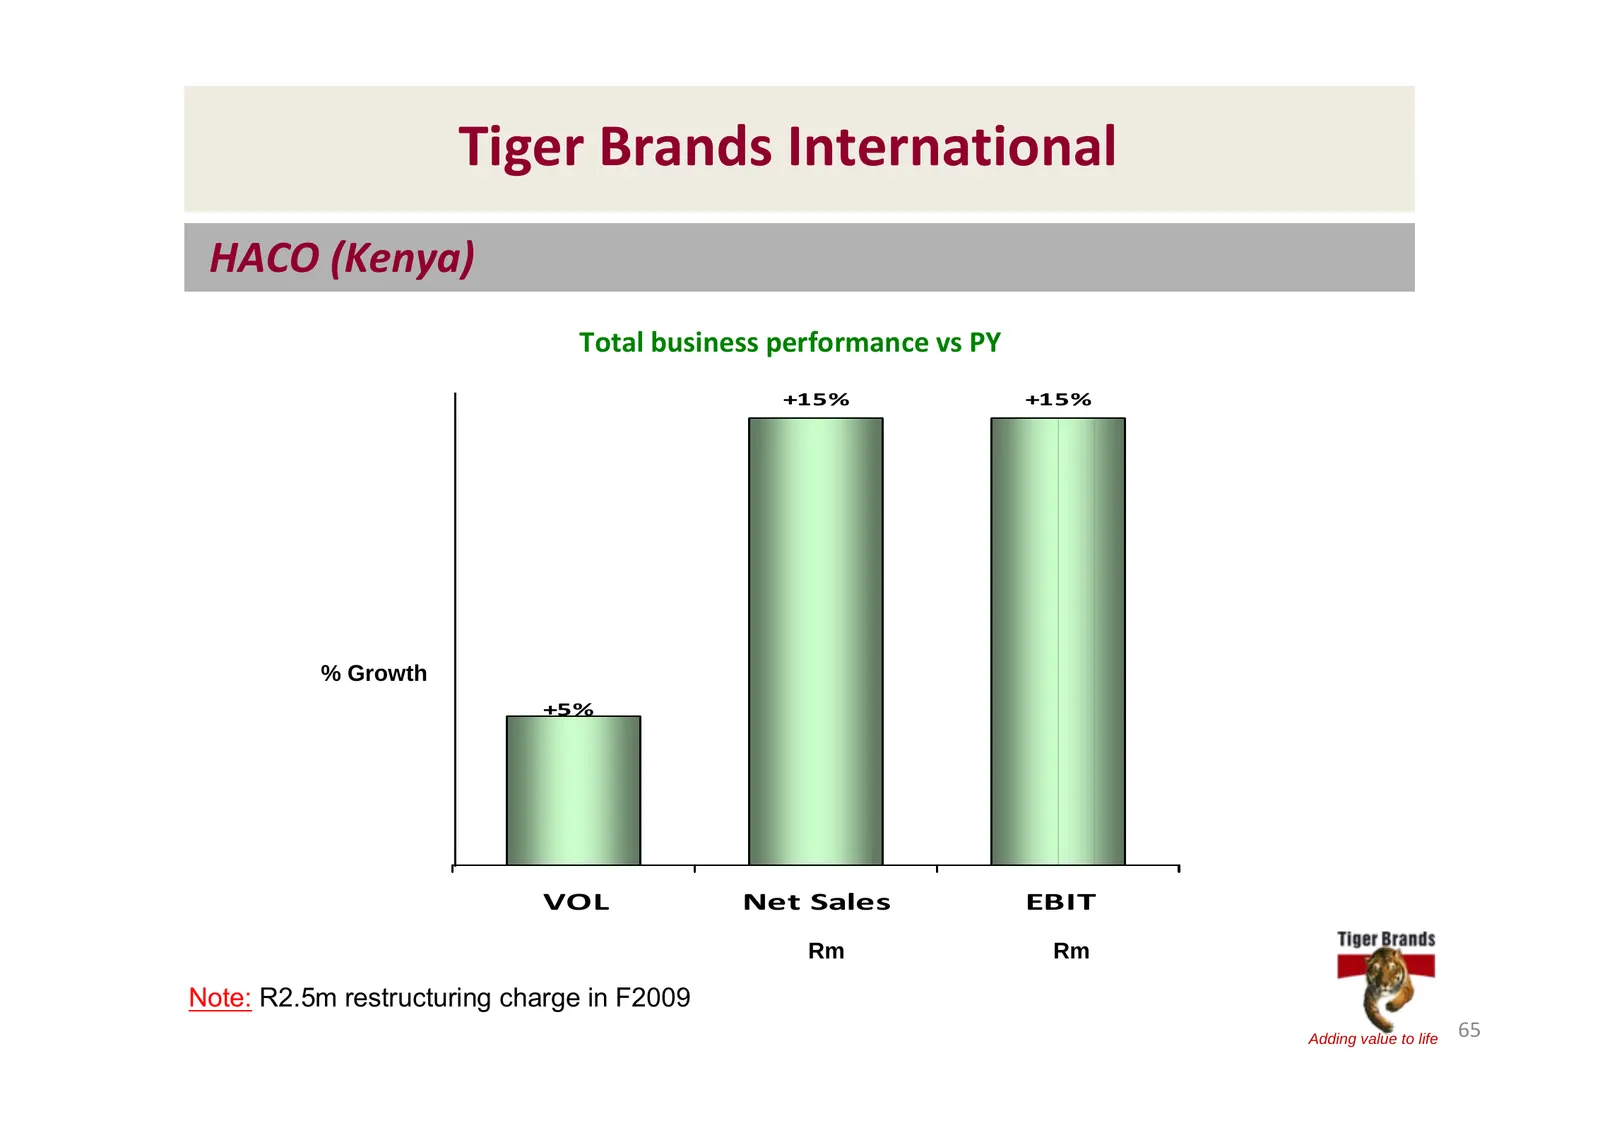
Slide 65: Tiger Brands International: HACO (Kenya)
Tiger Brands International HACO (Kenya) Total business performance vs PY +15% +15% % Growth +5% VOL Net Sales EBIT Rm Rm Note: R2.5m restructuring charge in F2009 Adding value to life 65
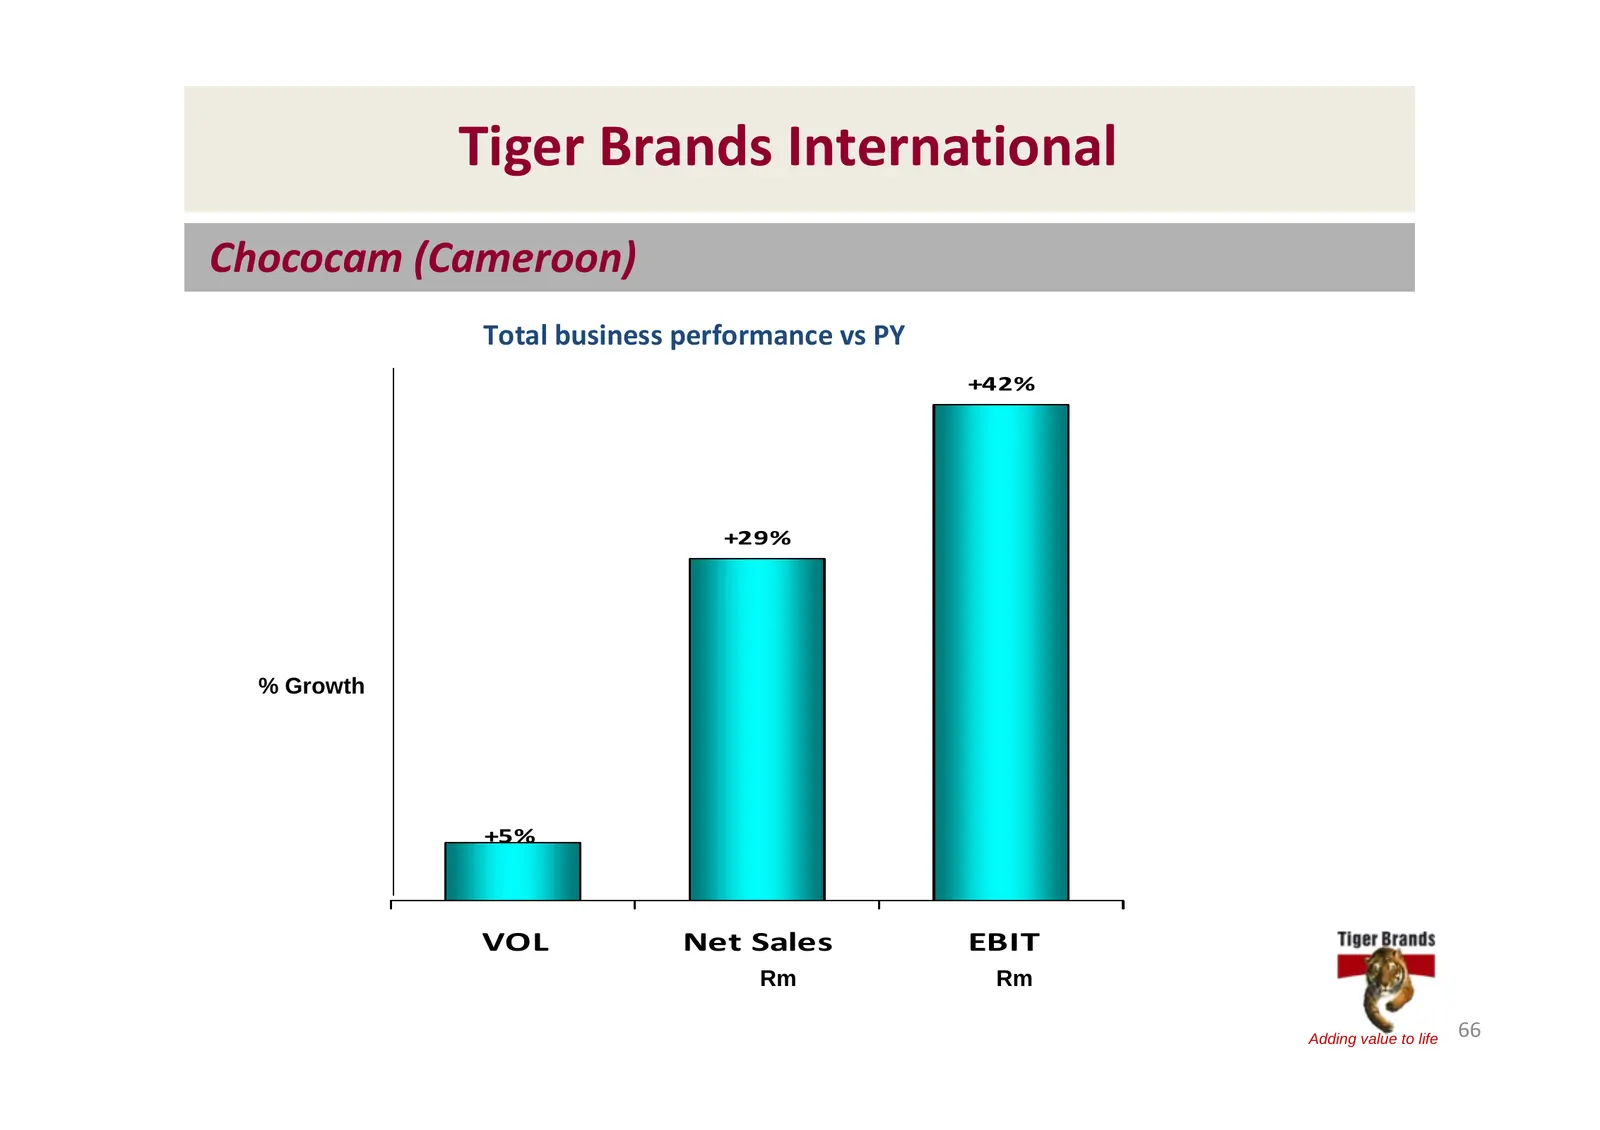
Slide 66: Tiger Brands International: Chococam (Cameroon)
Tiger Brands International Chococam (Cameroon) Total business performance vs PY +42% +29% % Growth +5% VOL Net Sales EBIT Rm Rm Adding value to life 66
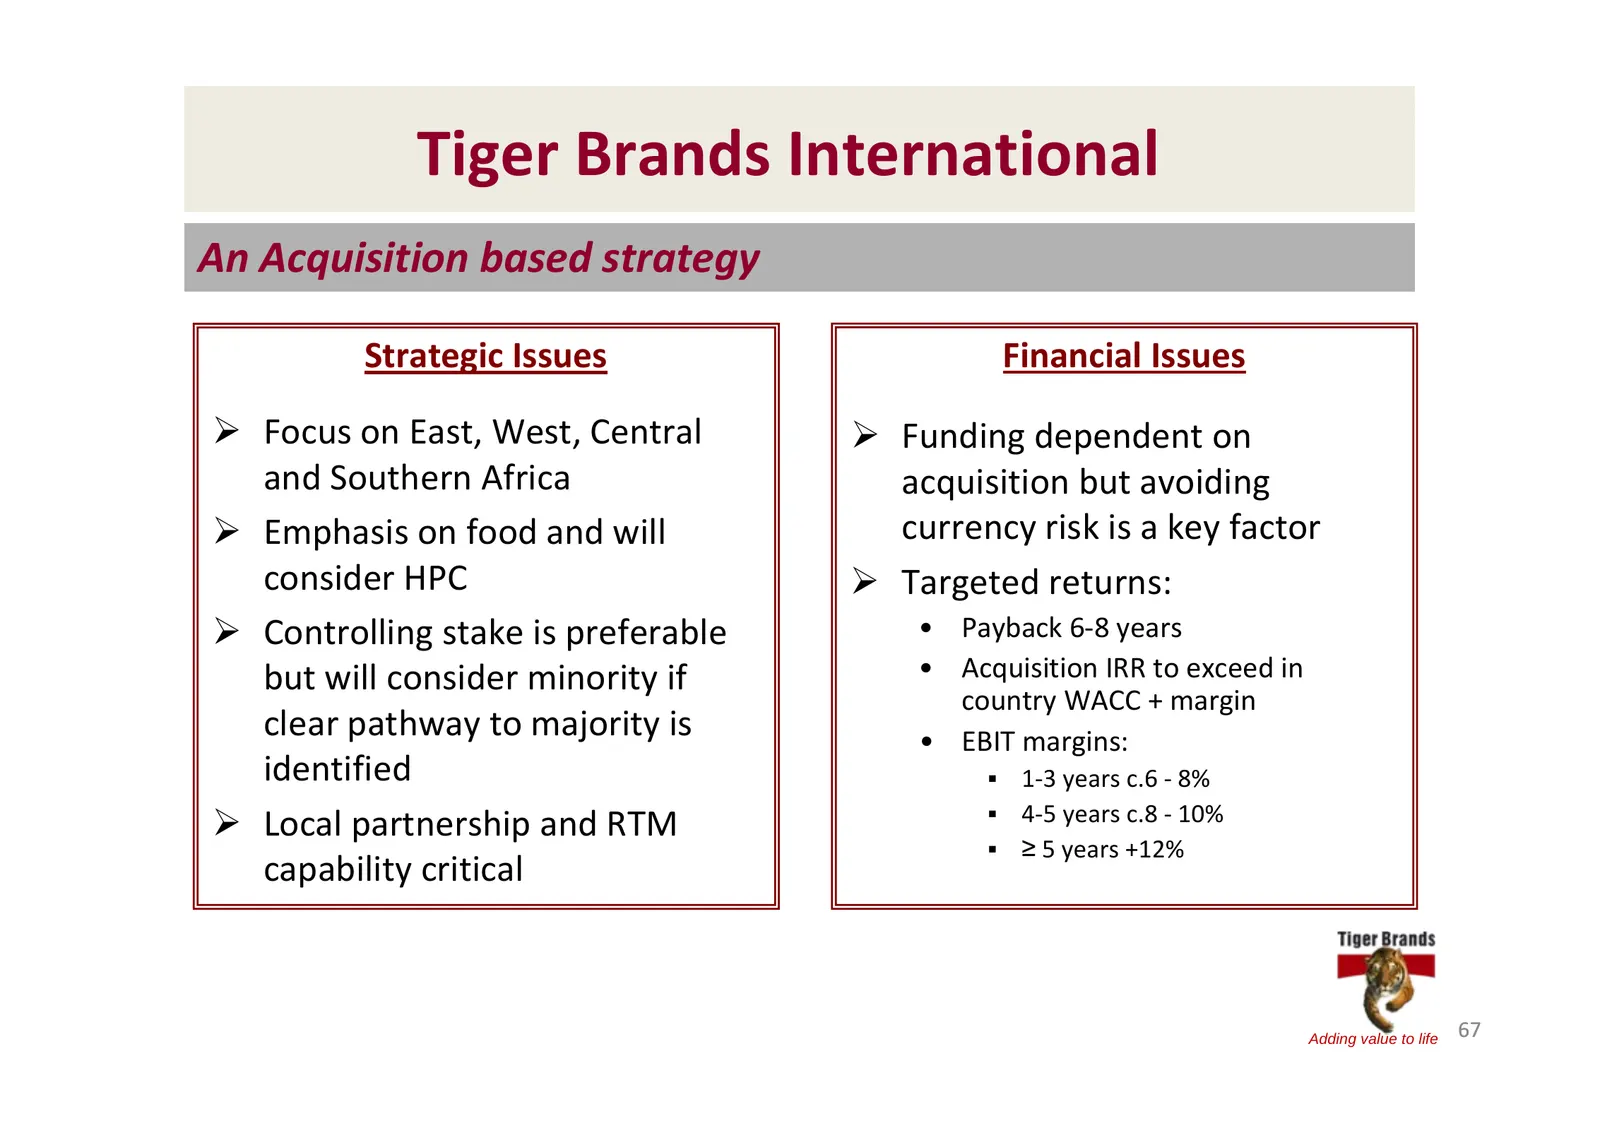
Slide 67: Tiger Brands International: An Acquisition based strategy
Tiger Brands International An Acquisition based strategy Strategic Issues Financial Issues ¾ Focus on East, West, Central ¾ Funding dependent on and Southern Africa acquisition but avoiding ¾ Emphasis on food and will currency risk is a key factor consider HPC ¾ Targeted returns: ¾ Controlling stake
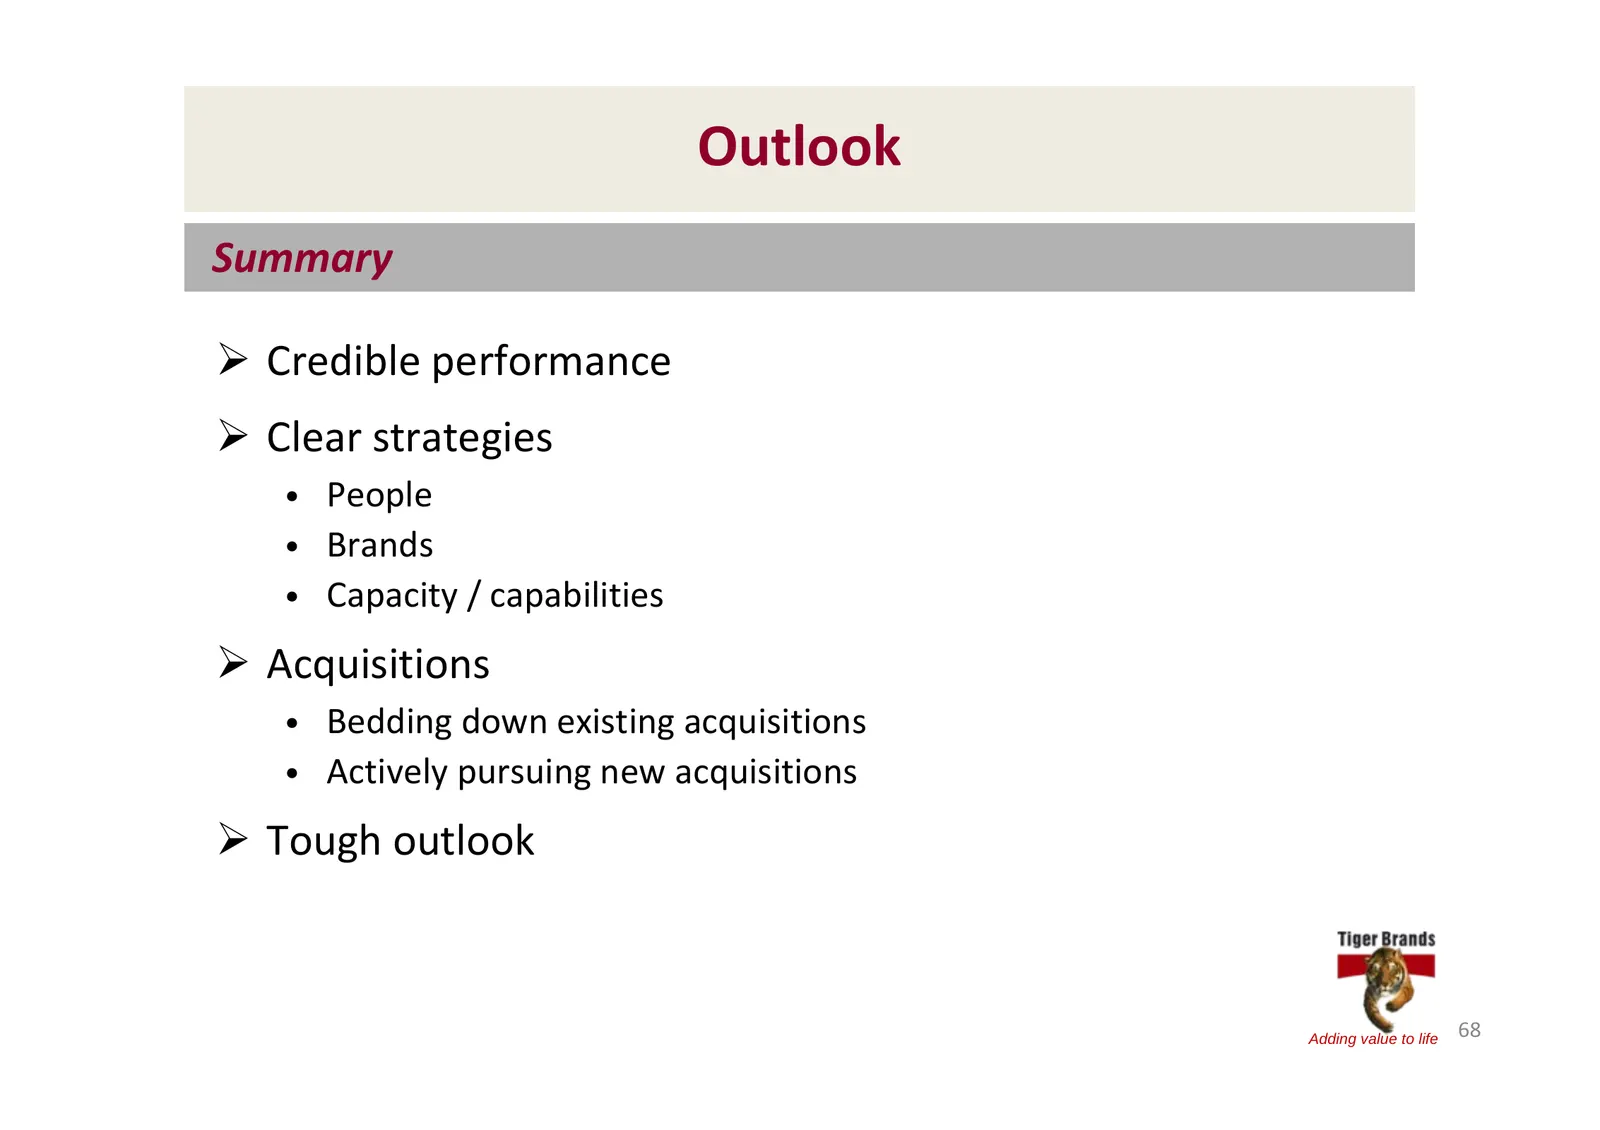
Slide 68: Outlook: Summary
Outlook Summary ¾ Credible performance ¾ Clear strategies • People • Brands • Capacity / capabilities ¾ Acquisitions • Bedding down existing acquisitions • Actively pursuing new acquisitions ¾ Tough outlook Adding value to life 68
Source: Internet Archive copy of tigerbrands.com
More decks from Tiger Brands Limited
 H1 2026 Earnings Presentation37 slides · Jun 1, 2026
 H1 2026 Earnings Presentation38 slides · Jun 1, 2026
 FY2025 Earnings Presentation38 slides · Nov 26, 2025
 H1 2025 Earnings Presentation43 slides · May 28, 2025
 H1 FY2024 Earnings Presentation38 slides · May 27, 2024
 FY2023 Earnings Presentation45 slides · Dec 1, 2023