Communityone Bancorp — FNB United — Southeast Super-Community Banking Conference (February 2007)
48 slides from Communityone Bancorp's conference presentation, Feb 9, 2007

Slide 1: FNB United Corp. Southeast Super-Community Banking Conference
Exhibit 99.1 FNB FNB UNITED UNITED CORP CORP Southeast Super-Community Southeast Super-Community Banking Conference Banking Conference Atlanta, Georgia Atlanta, Georgia February 14, 2007 February 14, 2007 Yes You Can ® Yes We Can ®

Slide 2: Forward-Looking Statements
Forward-Looking Statements FNB United Corp. has made forward-looking statements in the accompanying presentation materials that are subject to risks and uncertainties. These statements are based on the beliefs and assumptions of the management of FNB United Corp., and on the information available to

Slide 3: Overview
Overview • About FNB United • Business Strategy – Earnings and Growth Opportunities • Financial Highlights • Investor Opportunity • Summary

Slide 4: About FNB United Corp.
About F NB U NITED C ORP . Yes You Can ® Yes We Can ®

Slide 5: About FNB United
About FNB UNITED FNBN NASDAQ Symbol: Asheboro, North Carolina Headquarters: 43 Banking Offices 31 Communities 17 Counties Locations: $1.4 Billion Deposits: $1.3 Billion Loans: $1.8 Billion Assets: th Largest Financial Service Company in North Carolina

Slide 6: FNB United Acquisitions
FNB United Acquisitions Offices Assets $680 MM $151 MM $25MM $134MM $126 MM Integrity Financial Inc. (three banks) United Financial Inc. Dover Mortgage Rowan Bank Richmond Savings Bank May 2006 November 2005 February 2003 August 2002 April 2000
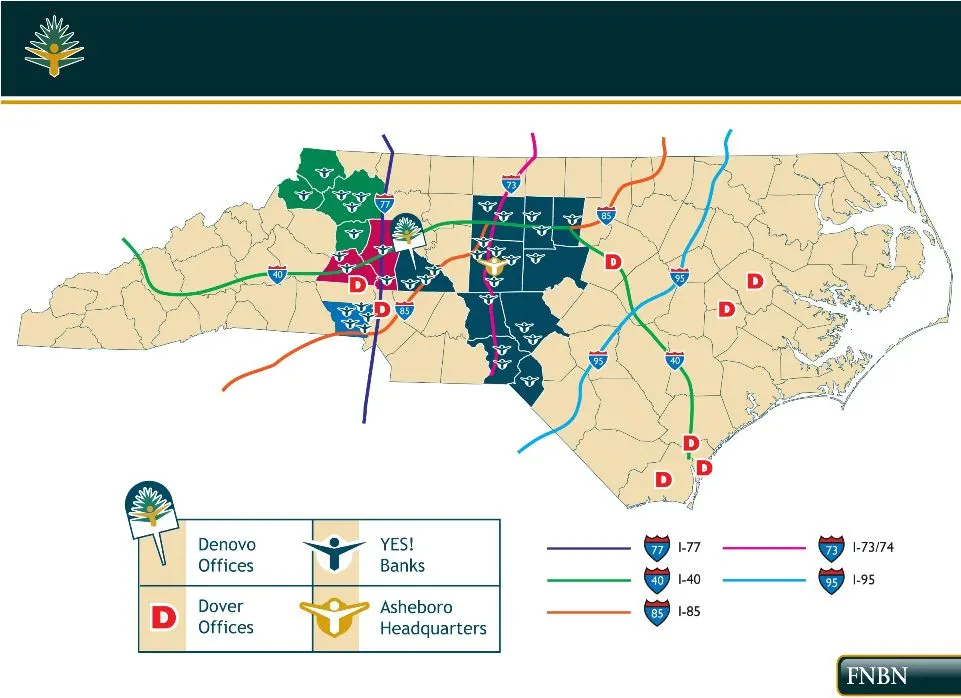
Slide 7: De Novo Offices
Denovo O YES! Offices Banks Dover Asheboro. Offices Headquarters

Slide 8: Experienced Management Team
About FNB UNITED Experienced Management Team Yes You Can ® Yes We Can ®
Slide 9: Experienced Management Team
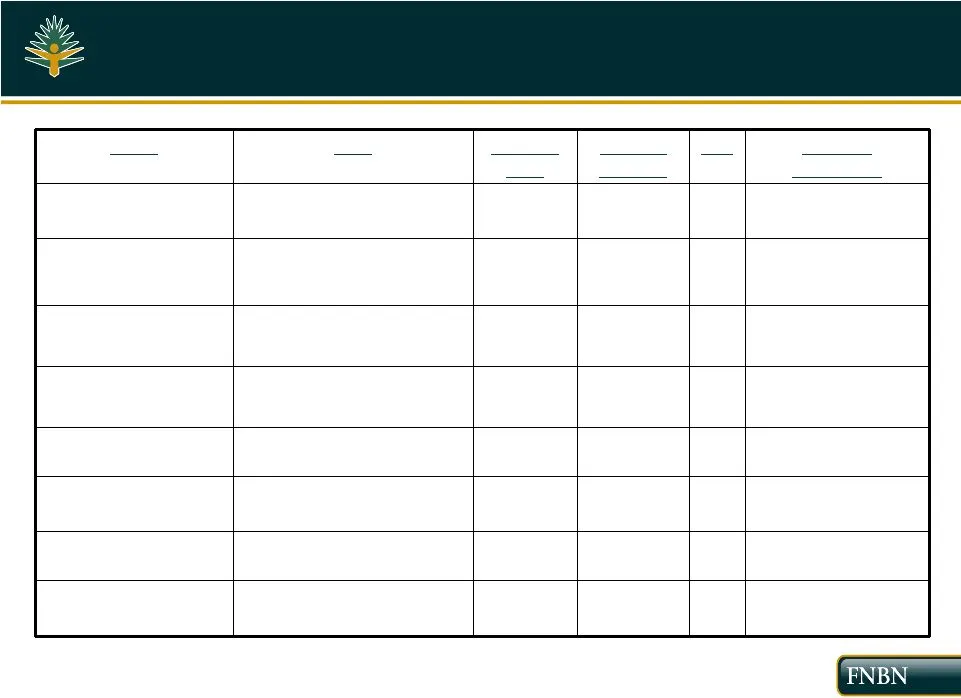
Experienced Management Team MainStreet, FCTR, Southern National Bk <1 Treasurer Bob B. Doby Wachovia SVP Chief Lending Ofc Eddie A. Causey Bank of America, WesBanco SVP Chief Wealth Mgt Timothy A. Britt Planters NB, Bank of Candor SVP, Chief Credit Ofc William S. Bruton Wachovia EVP - Chief Banking

Slide 10: Business Strategy – Earnings and Growth Opportunities
Yes You Can ® Yes We Can ® Business Strategy – Earnings and Growth Opportunities Yes You Can ® Yes We Can ®

Slide 11: Core Strategies
Core Strategies • Improve Asset Quality • Resume Financial Performance at Pre-Merger Levels • Complete Integration of - Acquisitions • Growth Strategy Increase Penetration of - Current Markets DeNovo Offices Increase Core Deposits • Continue to Build Performance/Service Culture • “ Yes ” ® Branding

Slide 12: Asset Quality
Asset Quality 0.33% 102.99% 1.14% 1.10% 2003 0.47% 139.53% 1.12% 0.80% 2004 0.22% 164.49% 1.25% 0.76% 2005 0.18% 111.77% 1.28% 1.15% Q3- 2006 0.14% Net Charge Offs Average Loans 143.67% Loan Loss Reserve Nonperforming Loans 1.22% Loan Loss Reserve Total Loans Held for Investment 0.85% Nonperforming

Slide 13: Improving Financial Performance
Improving Financial Performance • Revenue enhancement Investment Portfolio Restructuring Loan Sale Business Initiatives • Expense reduction initiatives

Slide 14: Investment Portfolio Restructuring
Improving Financial Performance Investment Portfolio Restructuring • Accomplished at end of Third Quarter • Sold $123 million securities – yielding 4.59% • Incurred $358 thousand after tax charge • Reinvested proceeds – At market yields of 5.25 – 5.50% 2-4 year final life or 2-4 year average life

Slide 15: Loan Sale
Improving Financial Performance th Quarter 2006 Loan Sale • Sold $10 Million Loans, which included $6 M in non-accruing loans $4 M in higher risk accruing loans • Recognized $123K gain on loan sale

Slide 16: Revenue Enhancement
Improving Financial Performance Revenue Enhancement • Depository Services • Discipline in Fee Collection - / - Waivers • Wealth Management – new to Integrity Market • Lending Fees • Mortgage Banking

Slide 17: Expense Reduction Initiatives
Improving Financial Performance Expense Reduction Initiatives • F NB U NITED – A Proven Integrator • Credit Quality • Charter Merger – Cultural Improvement/ Eliminated Operational Duplications • Review of Staffing Models • Economies of Scale – Complete Integration

Slide 18: Growth Strategy
Growth Strategy • Increase Penetration of - Current Markets Attractive New Markets & Customer Base • De Novo Offices Two Offices opened in 2006 (Greensboro - Salisbury) Property acquired (Cornelius – Pinehurst - Greensboro) • Integrated Wealth Management/Mortgage Services
Slide 19: Market Growth Potential
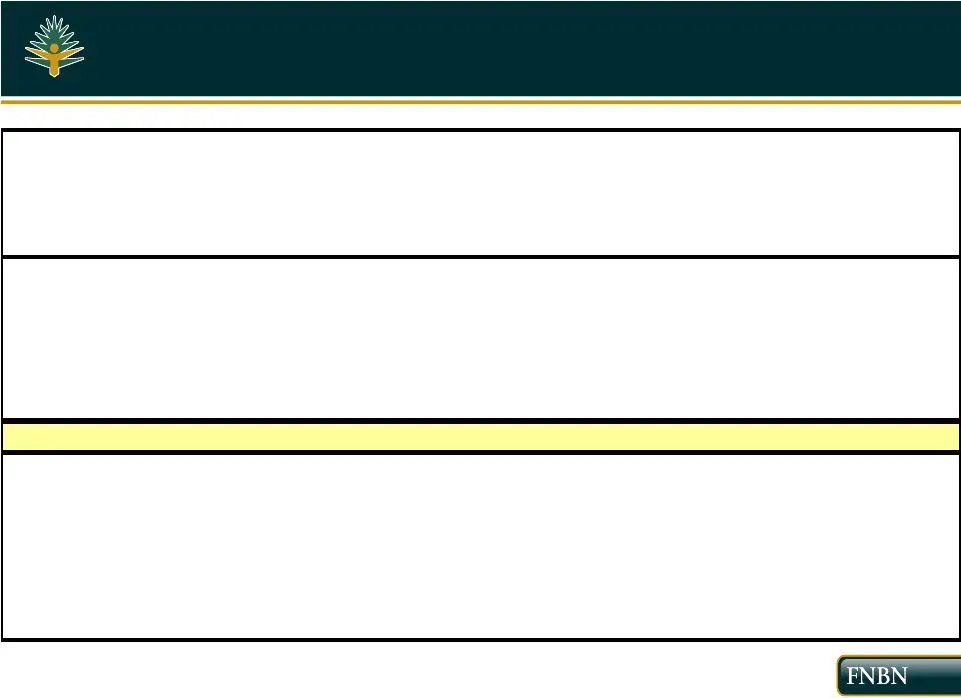
Market Growth Potential Total Total Counties Deposit Market with Branch in Market Share #1 Market Rank Institution Count ($000) (%) Share Wachovia 5,713,394 $ 21.85% BB&T 4,374,447 $ 16.73% SunTrust Bank 2,450,667 $ 9.37% Bank of America 2,218,636 $ 8.48% Orange, Chatham FNB United Corp. (NC) 1,406,

Slide 20: Market Growth Potential
Market Growth Potential $50,467 $50,773 $52,959 $47,468 $51,284 $47,859 $46,684 Median Household Income 7.86% 14.60% 4.68% 2.68% 14.93% 5.10% 6.06% Projected Population Change (2006-2010) 16.31% 16.91% 18.64% 16.53% 17.36% 13.37% 15.68% Projected HH Income Change (2006-2010) 451,061 $37,170 GUILFORD
Slide 21: Market Growth Potential: Contiguous Counties / Future Markets
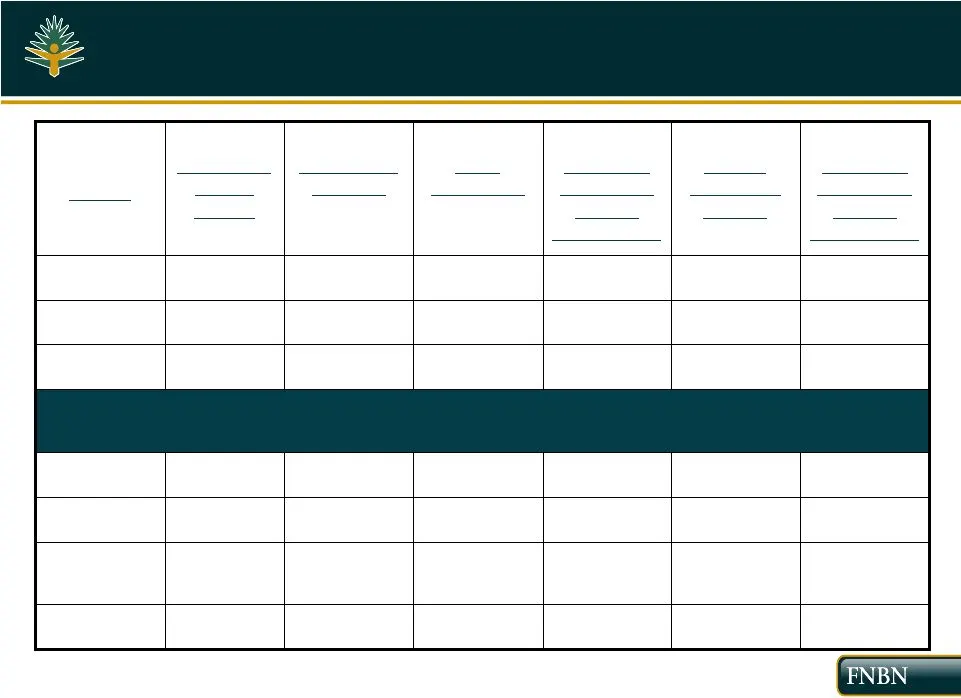
Market Growth Potential Contiguous Counties / Future Markets Under Consideration $61,904 $63,277 $48,352 $56,310 $44,441 $44,794 $52,190 Median Household Income 27.77% 13.45% 9.74% 13.93% 3.11% 4.11% 3.28% Projected Population Change (2006-2010) 16.97% 20.26% 11.81% 16.64% 13.49% 13.29% 17.58% Proje

Slide 22: Core Deposit Emphasis
Core Deposit Emphasis • Checking Promotions – over 21,200 New Accounts • Business DDAs • Cash Management – Remote Deposit Capture – Integrated Wire Module • Non-Profit and Governmental

Slide 23: Our Culture
Our Culture • Participative and Positive • Team Oriented • Performance • Service • Training
Slide 24: Participative and Positive
Participative and Positive YES! Branding First National is the YES! Bank. It is plainly stated in our Yes you can ® —Yes we can ® trademarks. It is reflected in the design of our logo and corporate mascot, Jack. And it is repeated in our customer service programs, company spirit campaigns and market

Slide 25: Performance Culture
Performance Culture Performance Compensation for STAKEHOLDERS ™ • Maximize long-term value of - organization • Team orientation - universal participation • Coaching and communication • Educational program • Pay for team(s) success and performance
Slide 26: First National Culture
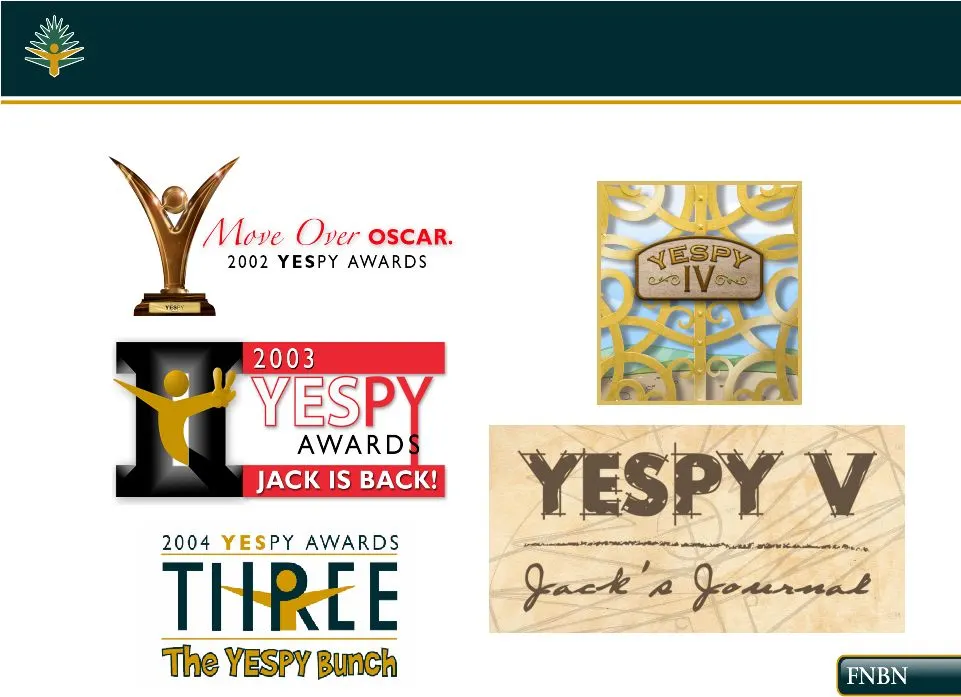
First National Culture Fun and Friendly Yes! Bank Fun and Friendly Yes! Bank

Slide 27: Financial Highlights
Yes You Can ® Yes We Can ® Financial Highlights Yes You Can ® Yes We Can ®
Slide 28: Total Assets
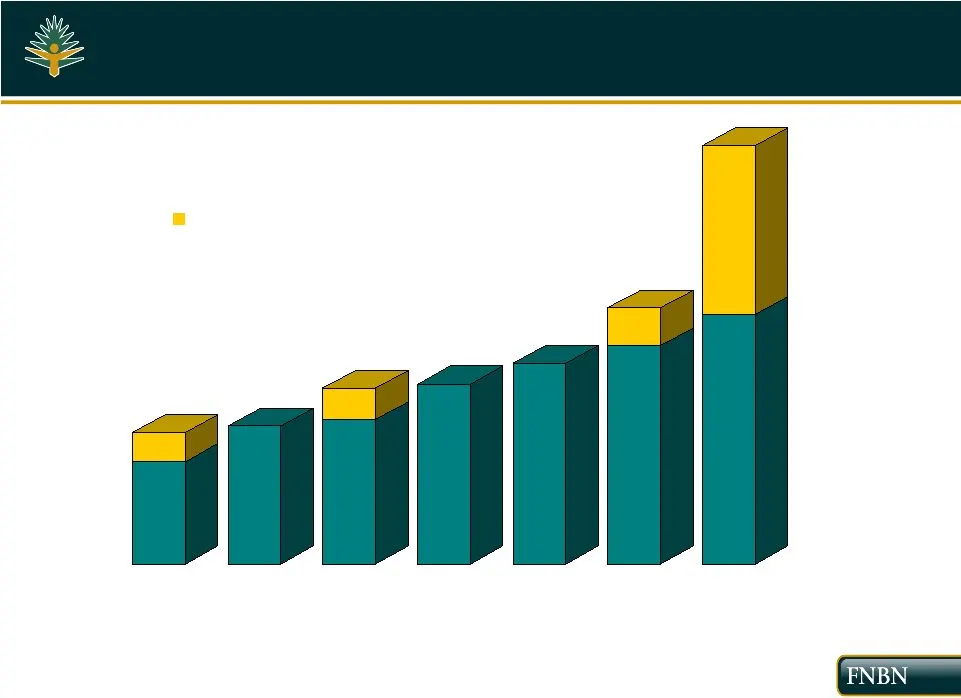
Total Assets $566 $594 $755 $773 $863 $1,102 $1,818 (In Millions) Acquired Assets 2004 2005 2002 2003 2000 2001 2006
Slide 29: Loan Growth
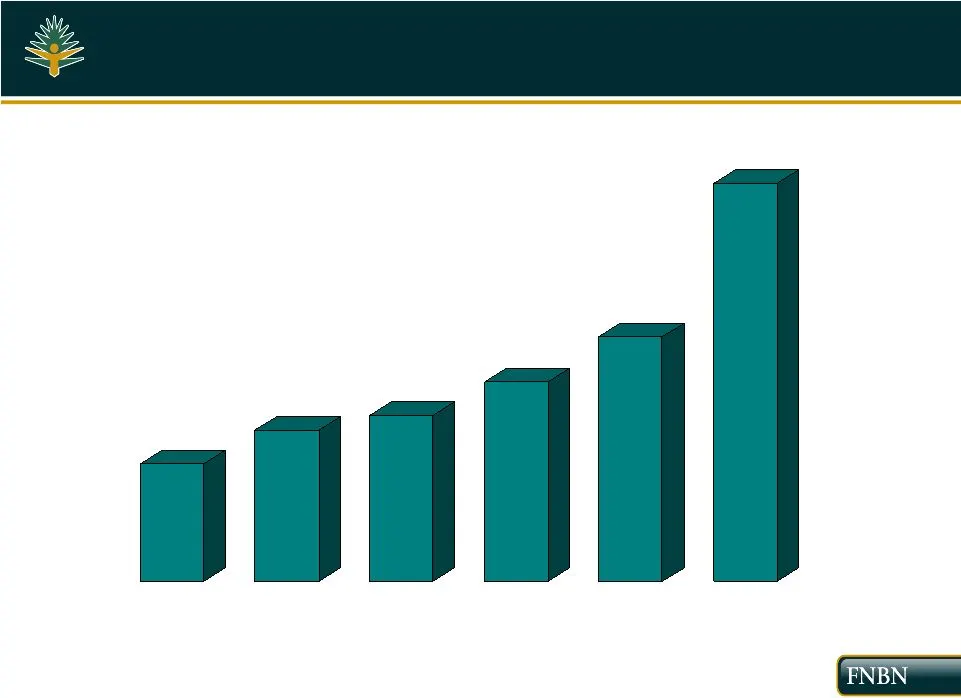
Loan Growth $392 $502 $552 $665 $813 $1,323 2001 2002 2003 2004 2005 2006 unaudited (In Millions)
Slide 30: Loan Portfolio Mix
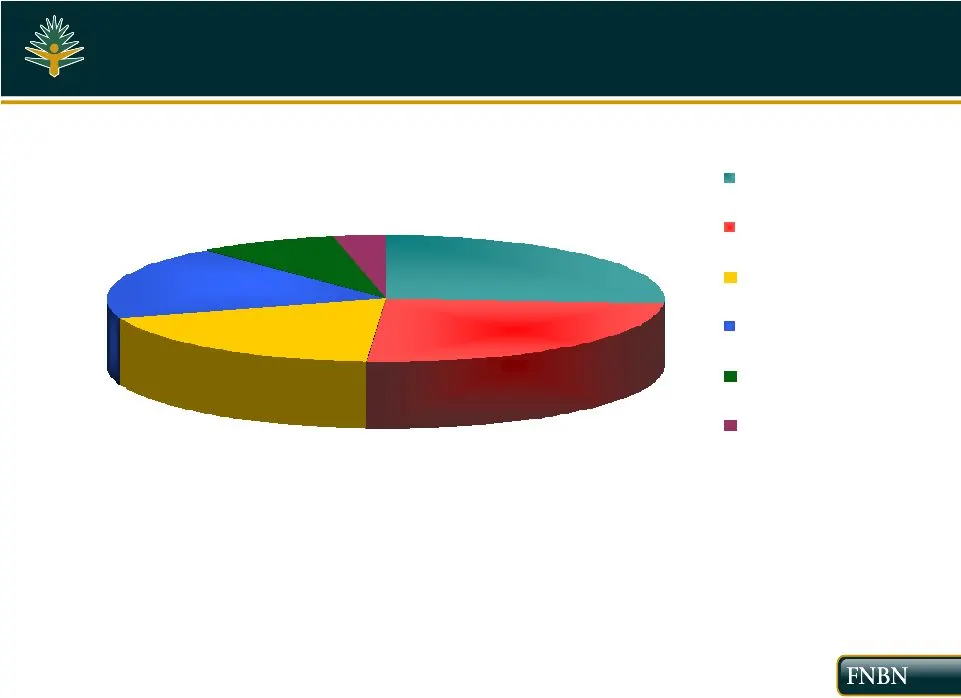
Loan Portfolio Mix 8% 3% 19% 25% 19% 26% Commercial/Industrial Commercial Real Estate RE Construction and Development Residential Real Estate Home Equity Line Consumer Loans held for investment: $1,302 Million Approximately 72% secured by real estate Variable rate loans account for approximately 64%
Slide 31: Deposit Growth
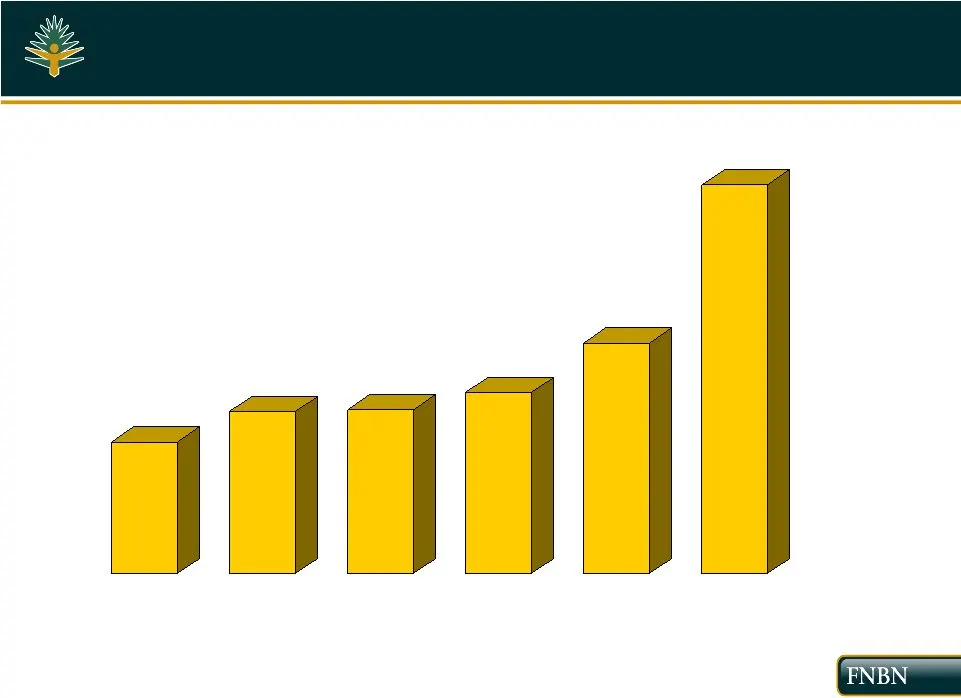
Deposit Growth $480 $592 $598 $660 $842 $1,421 2001 2002 2003 2004 2005 2006 (In Millions) unaudited
Slide 32: Funding Mix
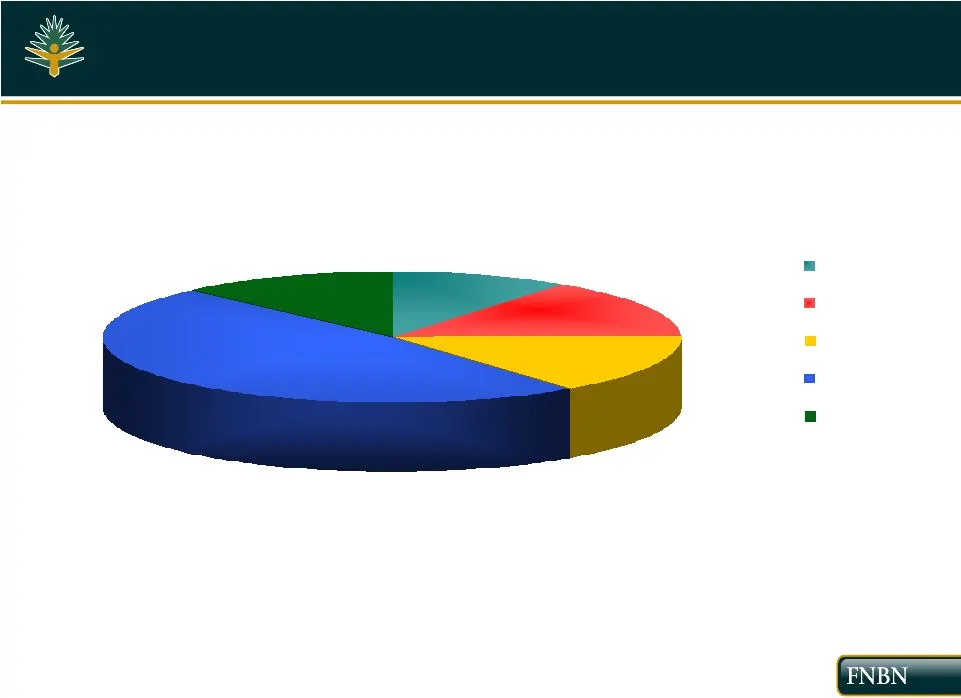
Funding Mix Funding Sources December 31, 2006 12% 10% 15% 15% 48% DDA Now/Savings IMMA CD/IRA Borrowings
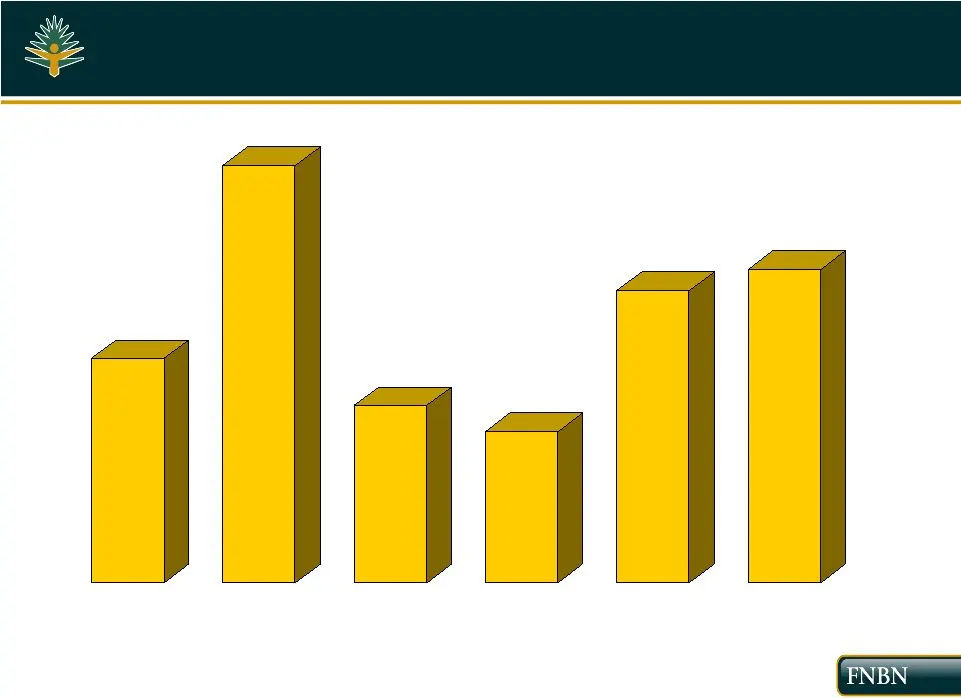
Slide 33: Efficiency Ratio
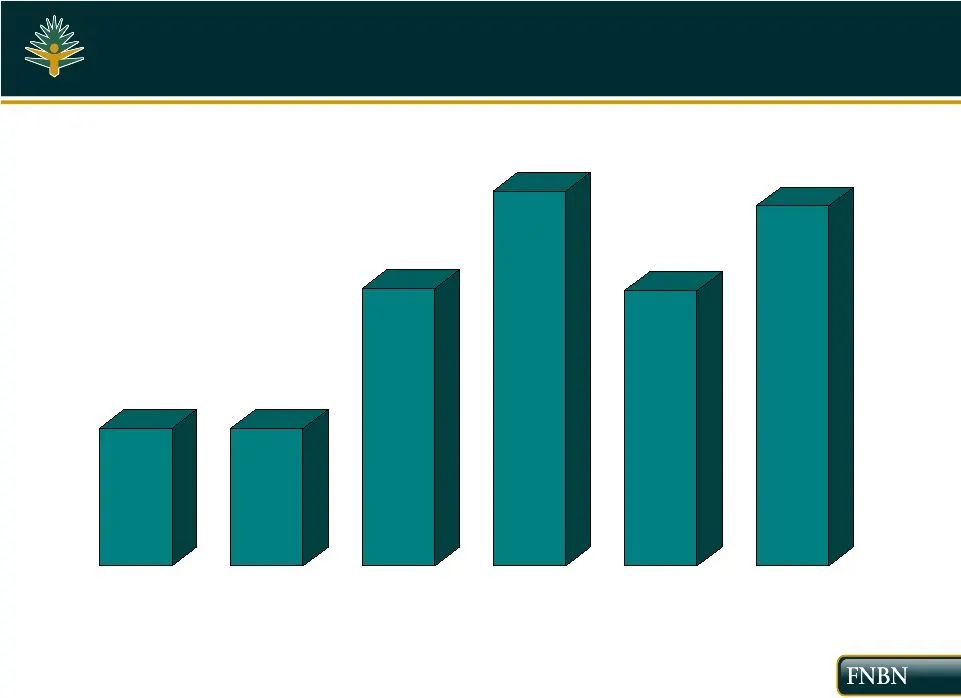
Efficiency Ratio 57.29% 57.26% 62.62% 66.38% 62.55% 65.79% 2001 2002 2003 2004 2005 2006 unaudited
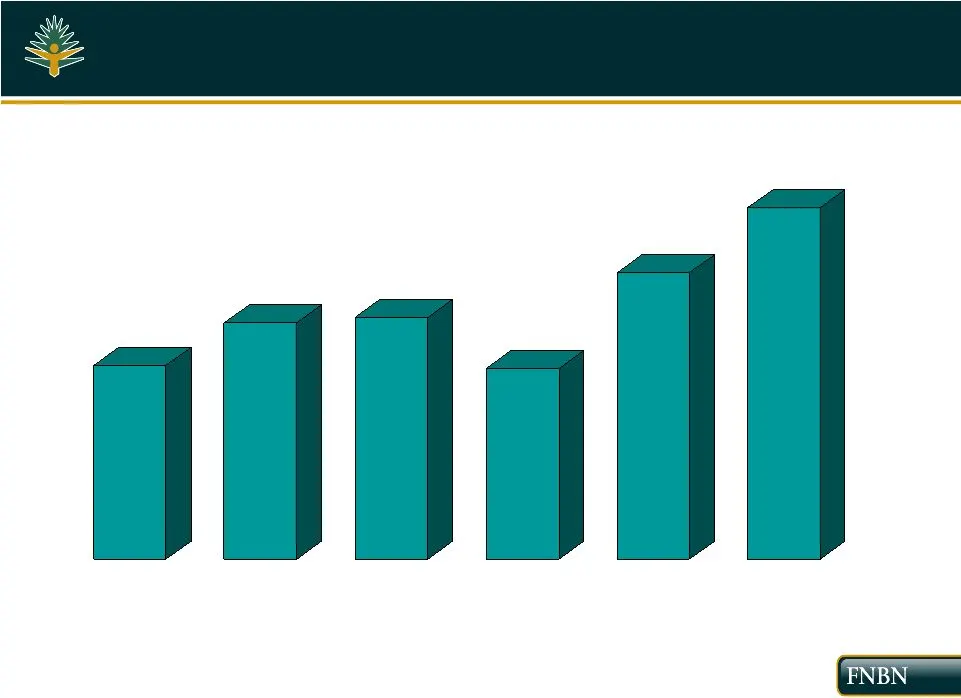
Slide 34: Net Interest Margin
Net Interest Margin 4.03% 4.40% 3.94% 3.89% 4.16% 4.20% 2001 2002 2003 2004 2005 2006 unaudited
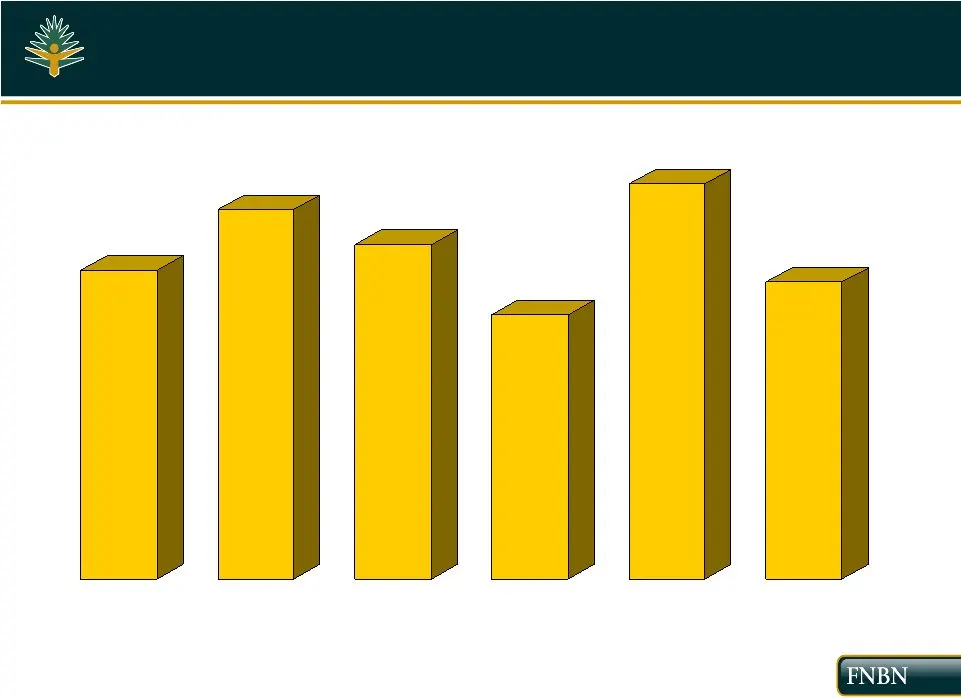
Slide 35: Net Income
Net Income $6,728 $8,200 $8,400 $6,598 $9,937 $12,187 2001 2002 2003 2004 2005 2006 unaudited
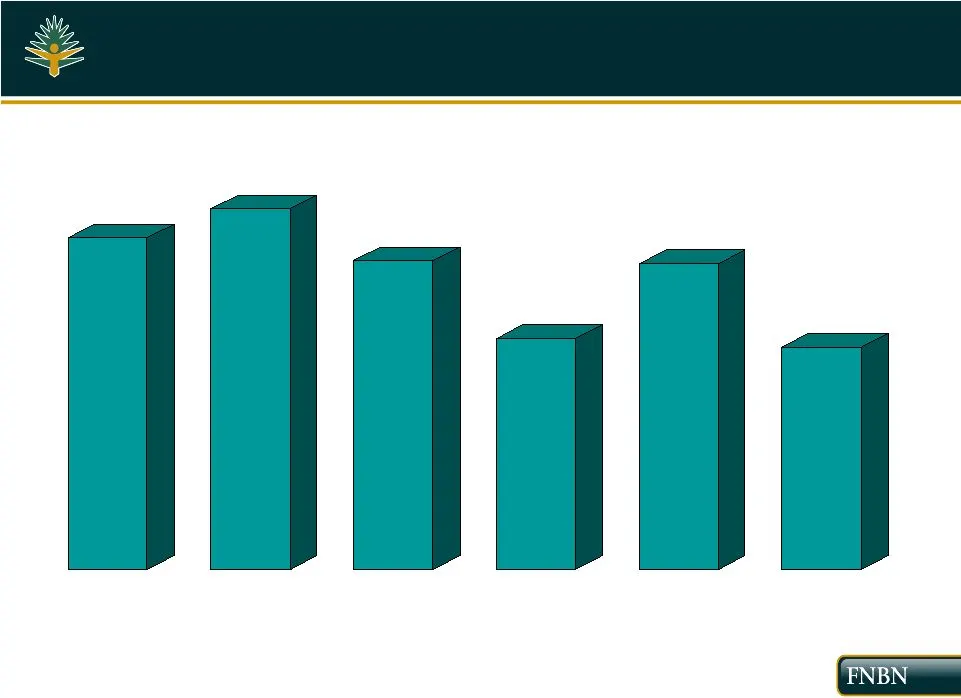
Slide 36: Earnings Per Share
Earnings Per Share $1.32 $1.58 $1.43 $1.13 $1.69 $1.27 2001 2002 2003 2004 2005 2006 unaudited
Slide 37: Return On Assets
Return On Assets 1.15% 1.25% 1.07% 0.80% 1.06% 0.77% 2001 2002 2003 2004 2005 2006 unaudited
Slide 38: Return On Equity
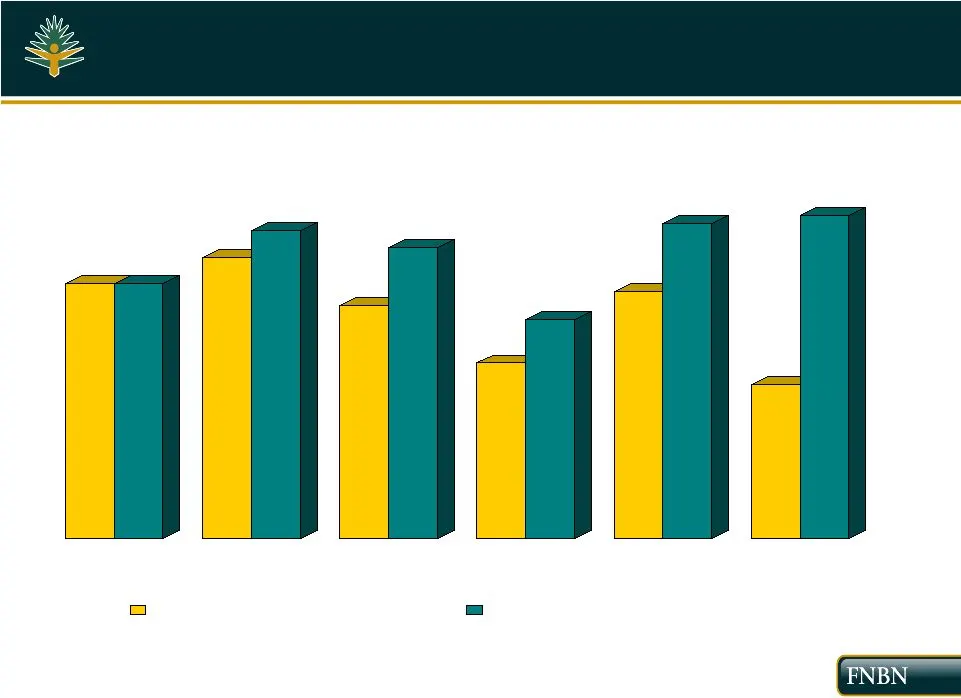
Return On Equity unaudited 11.63% 11.63% 12.82% 14.05% 10.66% 13.29% 8.00% 10.00% 11.25% 14.36% 7.01% 14.73% 2001 2002 2003 2004 2005 2006 Return on Equity Return on Tangible Equity
Slide 39: Dividend History
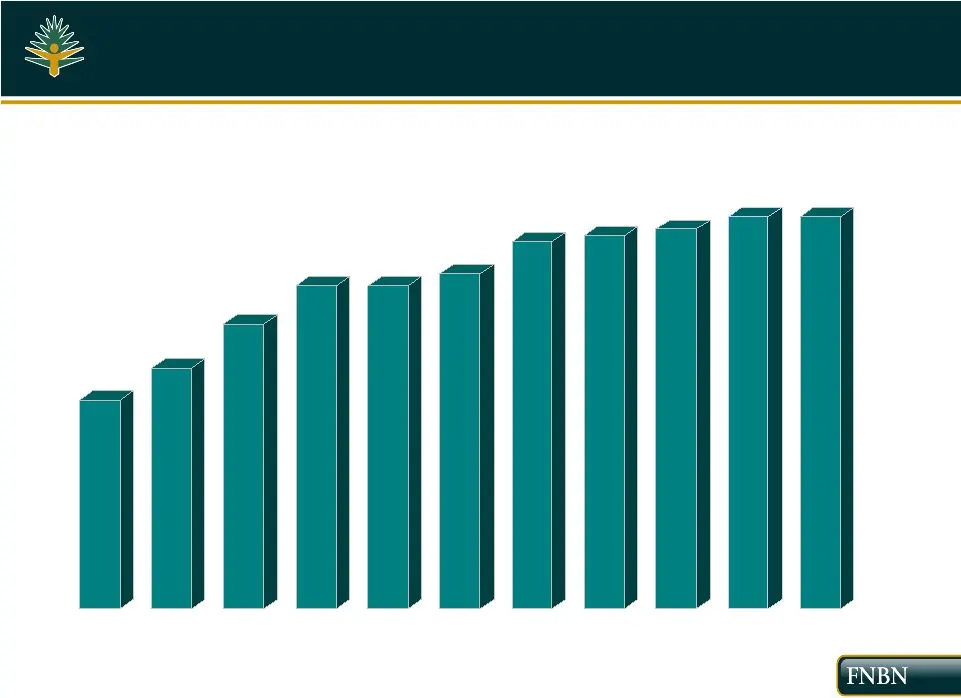
Dividend History $0.33 $0.38 $0.45 $0.51 $0.51 $0.53 $0.58 $0.59 $0.60 $0.62 $0.62 1996 1997 1998 1999 2000 2001 2002 2003 2004 2005 2006

Slide 40: Shareholder Opportunity
Yes You Can ® Yes We Can ® Shareholder Opportunity Yes You Can ® Yes We Can ®

Slide 41: Investor Opportunity
Investor Opportunity • Strong Dividend Yield • Trade at Discount to Peers • Historical Strong Performance • Attractive Value
Slide 42: Investor Opportunity
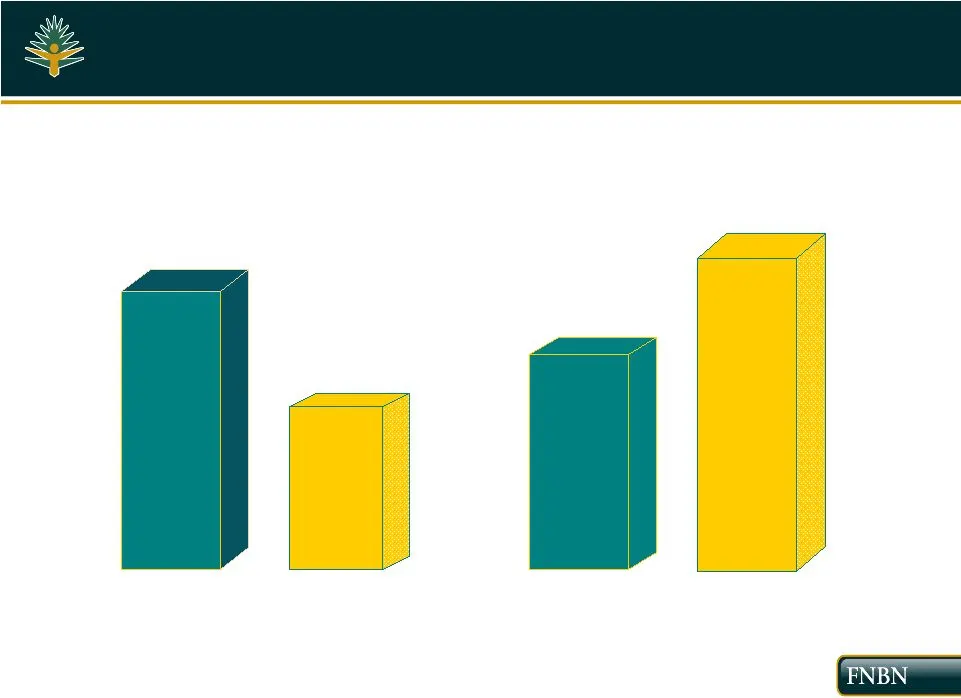
Investor Opportunity 13.9 16.5 3.46 1.91 Current Dividend Yield (%) Price / LTM EPS (X) FNB United Corp . FNB United Corp. Peer Group* Peer Group* *SNL Data - Nationwide Banks between $1.5 Billion and $2.5 billion as of 1/31/2007
Slide 43: Investor Opportunity
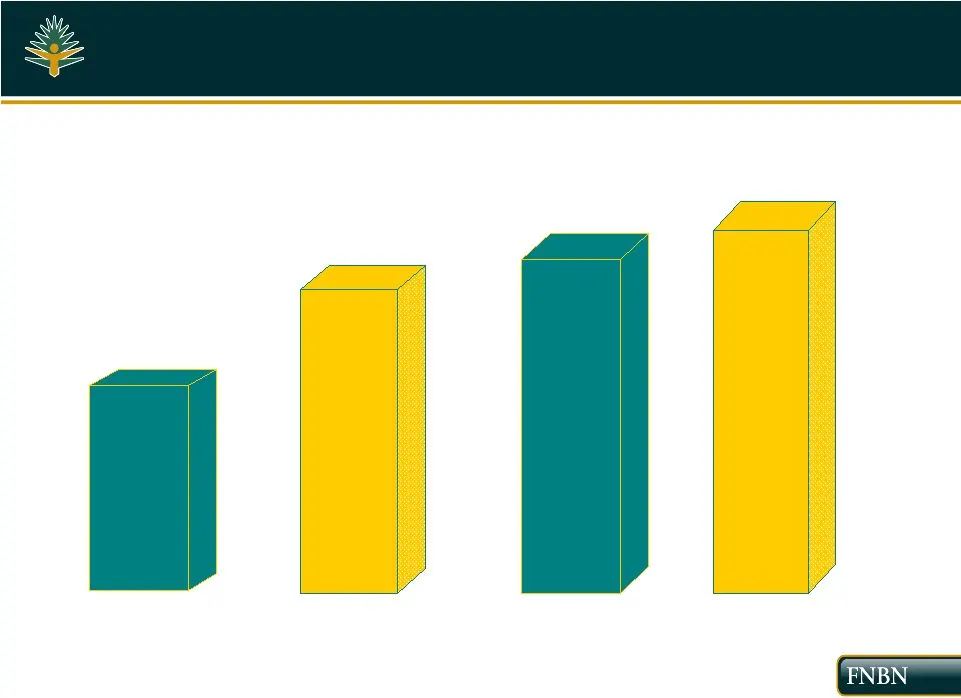
Investor Opportunity 218.0 263.5 93.8 199.4 Price / Book (%) Price / Tangible Book (%) FNB United Corp . FNB United Corp. *SNL Data - Nationwide Banks between $1.5 Billion and $2.5 billion as of 1/31/2007 Peer Group* Peer Group*
Slide 44: Attractive Value
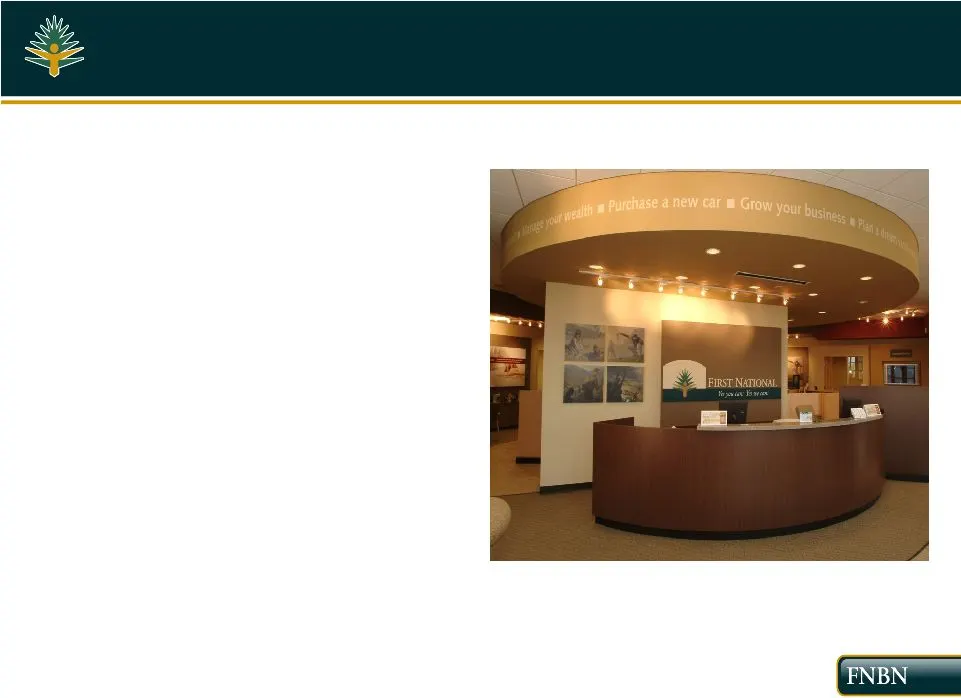
Attractive Value • Current Price $17.34 • Book Value $ 18.49 • Tangible Book $ 7.96 • P/E Ratio (TTM) 13.9x • Price / Book 0.94x • Price / Tangible Book 2.18x • Market Cap $194.7M (as of 1/31/07)

Slide 45: Goals over the next three years include:
Goals over the next three years include: • Annual earnings per share growth: 7.5 - 10% • Annual loan growth: 10 - 12% • Non - interest income: 25% of revenues • Efficiency ratio: 60 - 63% Position ourselves as a Preeminent Community Bank in Southeast U. S.

Slide 46: Summary
Yes You Can ® Yes We Can ® Summary Yes You Can ® Yes We Can ®

Slide 47: Summary
Summary • Growing Company in Good Markets • Proven Integrator • Experienced Management Team • Focused on Performance Improvement • Compelling Investment Opportunity

Slide 48: Contact Information
Contact Information Michael C. Miller Chairman and President mmiller@MyYesBank.com FNB United Corp. First National Bank and Trust Company 150 S. Fayetteville Street PO Box 1328 Asheboro, NC 27204 336.626.8300 Yes You Can ® Yes We Can ®
Source: SEC EDGAR · 8-K filed Feb 9, 2007
More decks from Communityone Bancorp
 Merger or Acquisition (February 2016)25 slides · Feb 8, 2016
 Q4 2015 Earnings Presentation22 slides · Jan 29, 2016
 Q3 2015 Earnings Presentation17 slides · Oct 30, 2015
 Q2 2015 Earnings Presentation17 slides · Jul 30, 2015
 Q1 2015 Earnings Presentation17 slides · Apr 30, 2015
 Investor Presentation (March 2015)18 slides · Mar 5, 2015