Ares Commercial Real Estate Corporation · NYSE:ACRE
Ares Commercial Real Estate — Q3 2020 Earnings Presentation
14 slides from Ares Commercial Real Estate's earnings presentation, Oct 29, 2020
Slide 1: Third Quarter 2020 Earnings Presentation
Exhibit 99.2 Third Quarter 2020 Earnings Presentation
Slide 2: Important Notice
Important Notice Statements included herein may constitute "forward-looking statements" within the meaning of the Private Securities Litigation Reform Act of 1995 and Section 21E of the Securities Exchange Act of 1934, as amended, which may relate to future events or the future performance or financ
Slide 3: Third Quarter 2020 Results
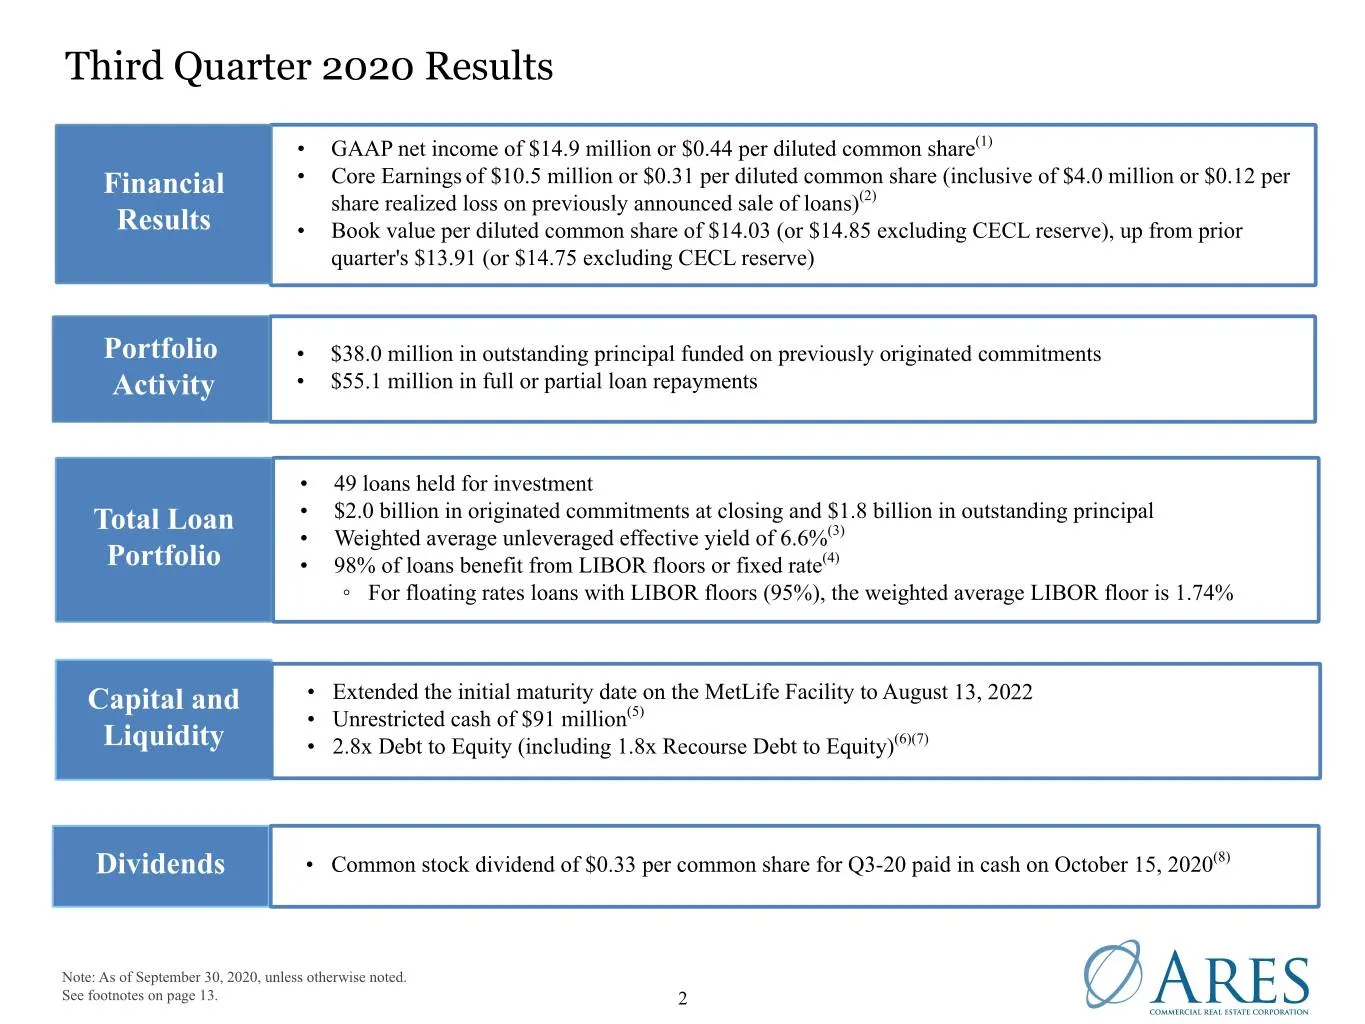
Third Quarter 2020 Results • GAAP net income of $14.9 million or $0.44 per diluted common share(1) Financial • Core Earnings of $10.5 million or $0.31 per diluted common share (inclusive of $4.0 million or $0.12 per share realized loss on previously announced sale of loans)(2) Results • Book value p
Slide 4: Total Loans Held for Investment Portfolio Key Statistics
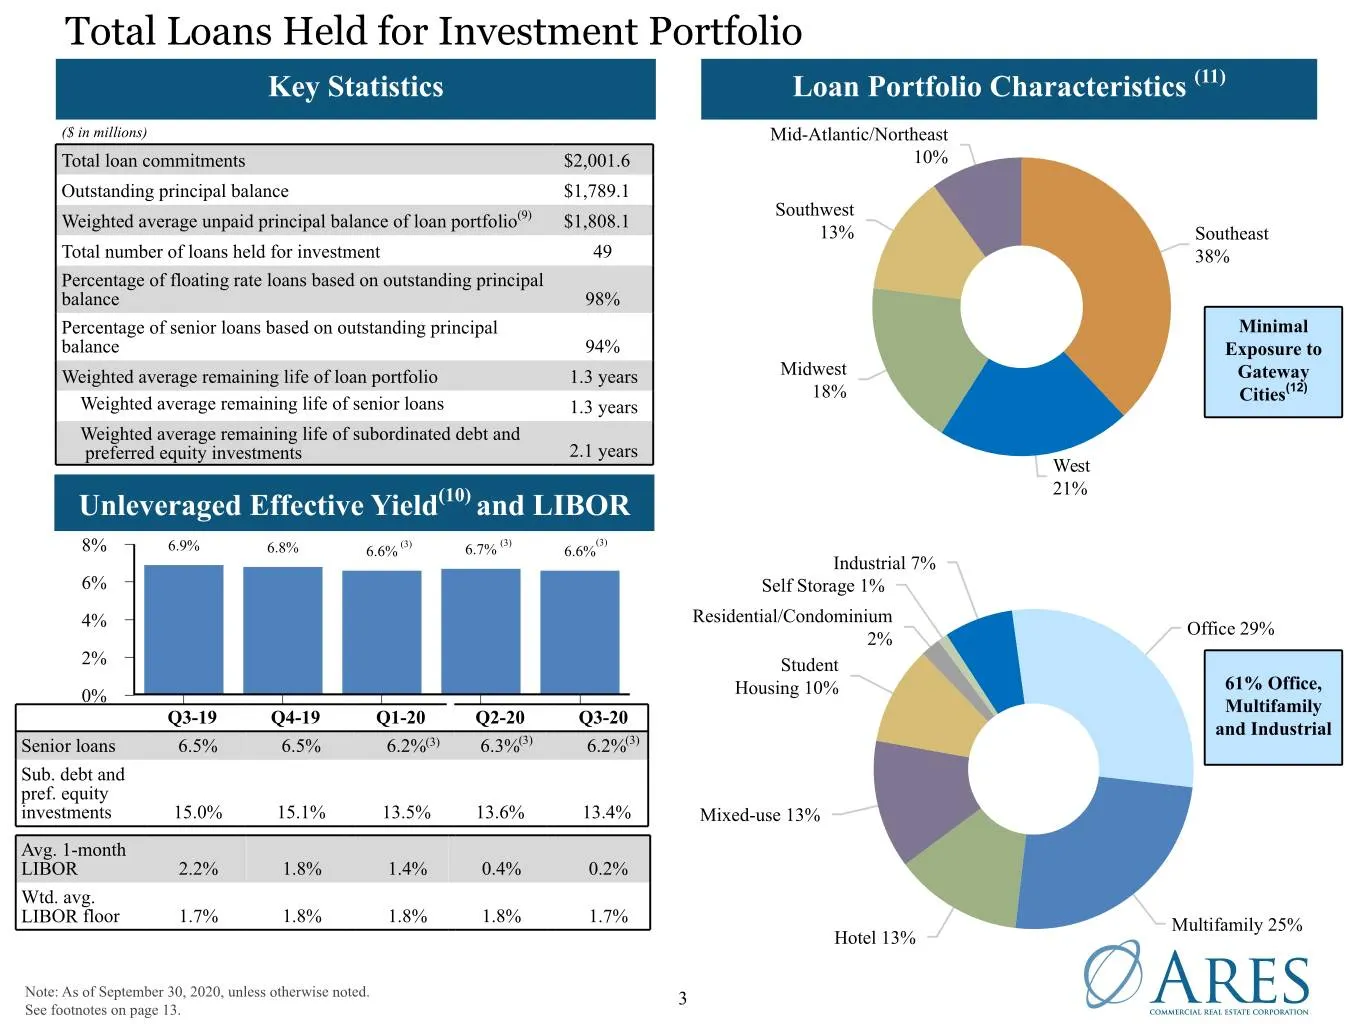
Total Loans Held for Investment Portfolio Key Statistics Loan Portfolio Characteristics (11) ($ in millions) Mid-Atlantic/Northeast Total loan commitments $2,001.6 10% Outstanding principal balance $1,789.1 Southwest Weighted average unpaid principal balance of loan portfolio(9) $1,808.1 13% Southea
Slide 5: Financing Sources Overview
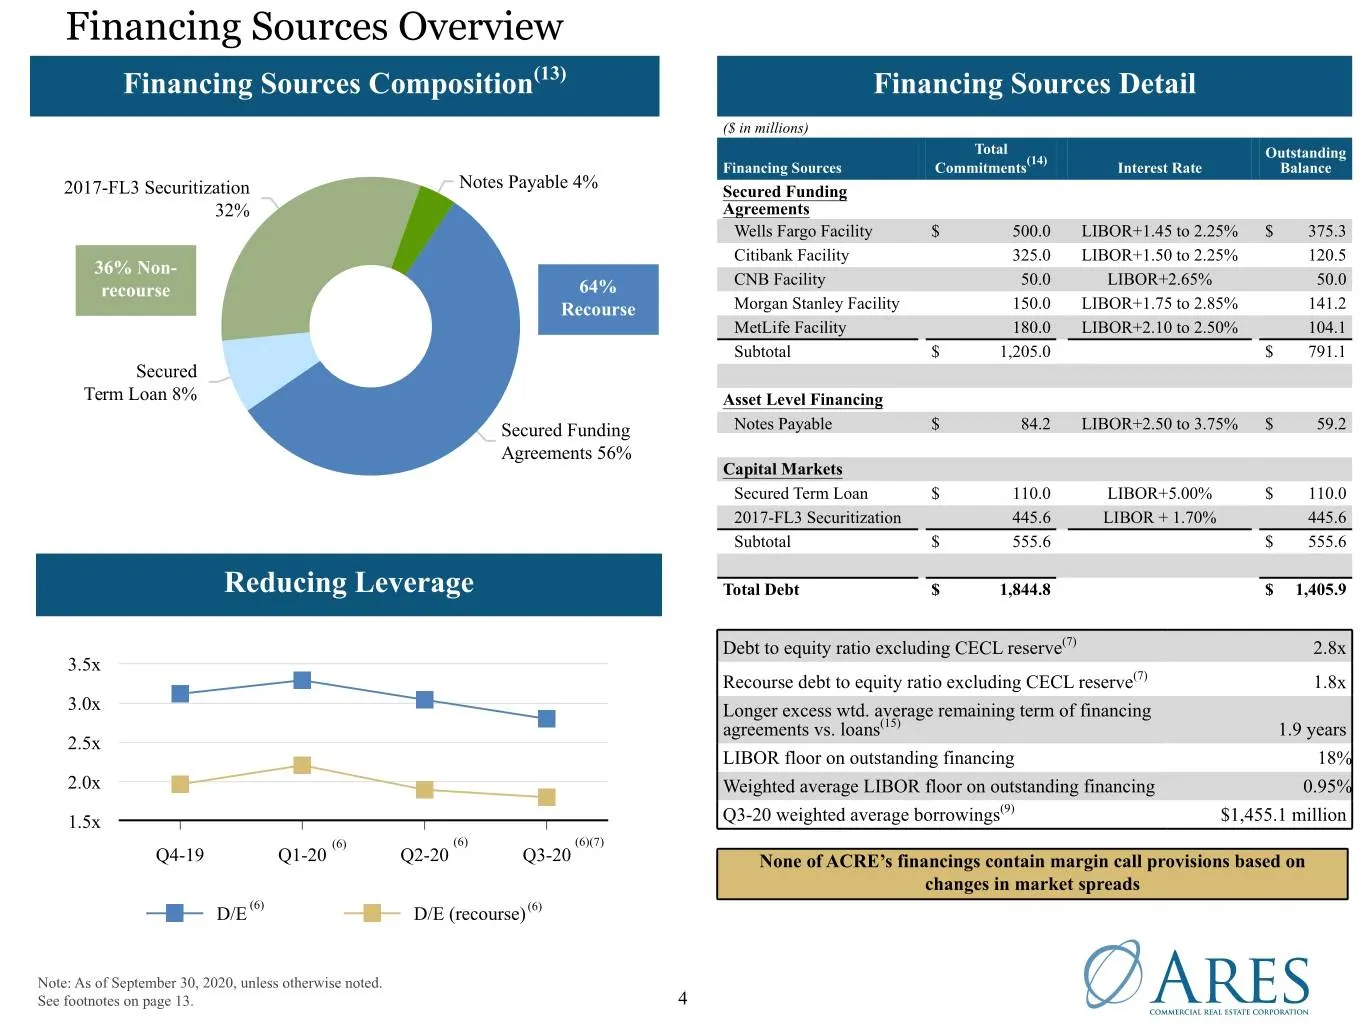
Financing Sources Overview Financing Sources Composition(13) Financing Sources Detail ($ in millions) Total (14) Outstanding Financing Sources Commitments Interest Rate Balance Notes Payable 4% 2017-FL3 Securitization Secured Funding 32% Agreements Wells Fargo Facility $ 500.0 LIBOR+1.45 to 2.25% $
Slide 6: Current Expected Credit Losses
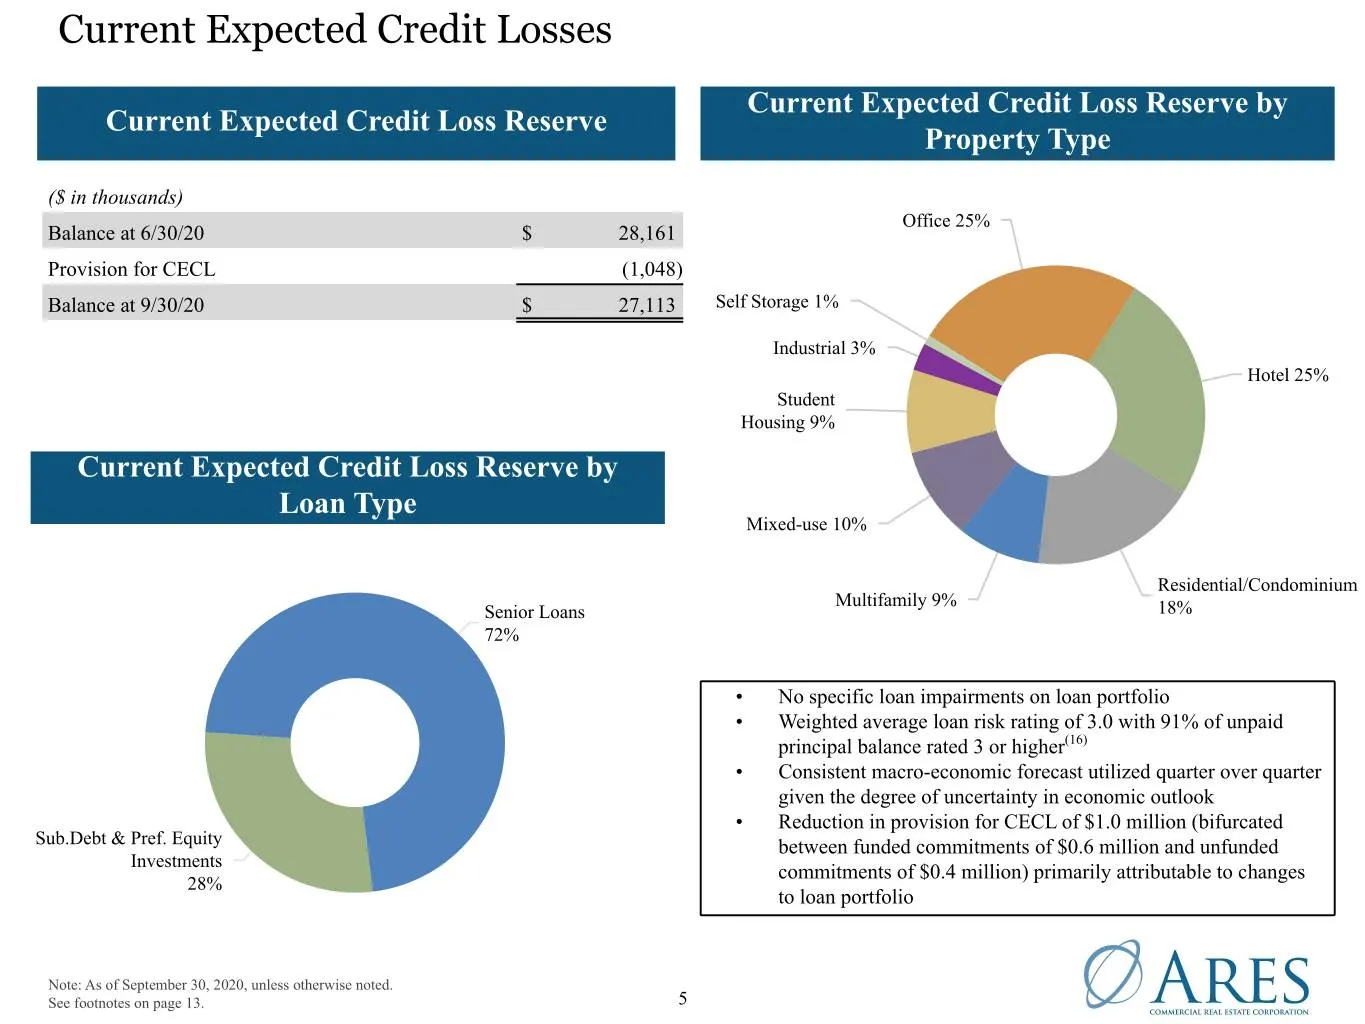
Current Expected Credit Losses Current Expected Credit Loss Reserve by Current Expected Credit Loss Reserve Property Type ($ in thousands) Office 25% Balance at 6/30/20 $ 28,161 Provision for CECL (1,048) Balance at 9/30/20 $ 27,113 Self Storage 1% Industrial 3% Hotel 25% Student Housing 9% Current
Slide 7: Appendix
Appendix O ARES
Slide 8: Loans Held for Investment Portfolio Details
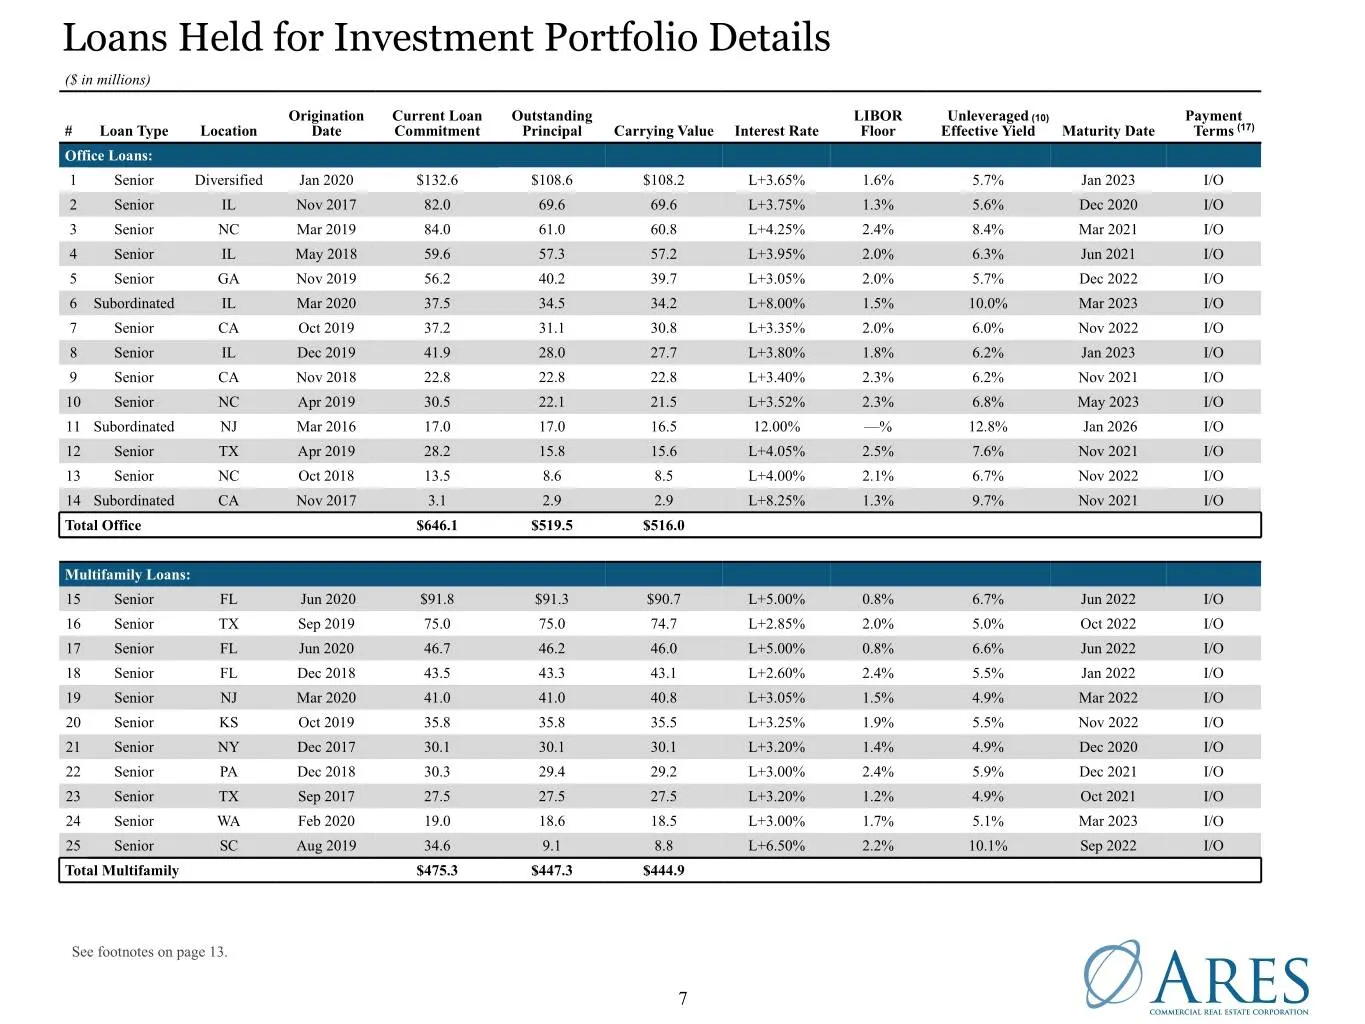
Loans Held for Investment Portfolio Details ($ in millions) Origination Current Loan Outstanding LIBOR Unleveraged (10) Payment # Loan Type Location Date Commitment Principal Carrying Value Interest Rate Floor Effective Yield Maturity Date Terms (17) Office Loans: 1 Senior Diversified Jan 2020 $132.
Slide 9: Loans Held for Investment Portfolio Details
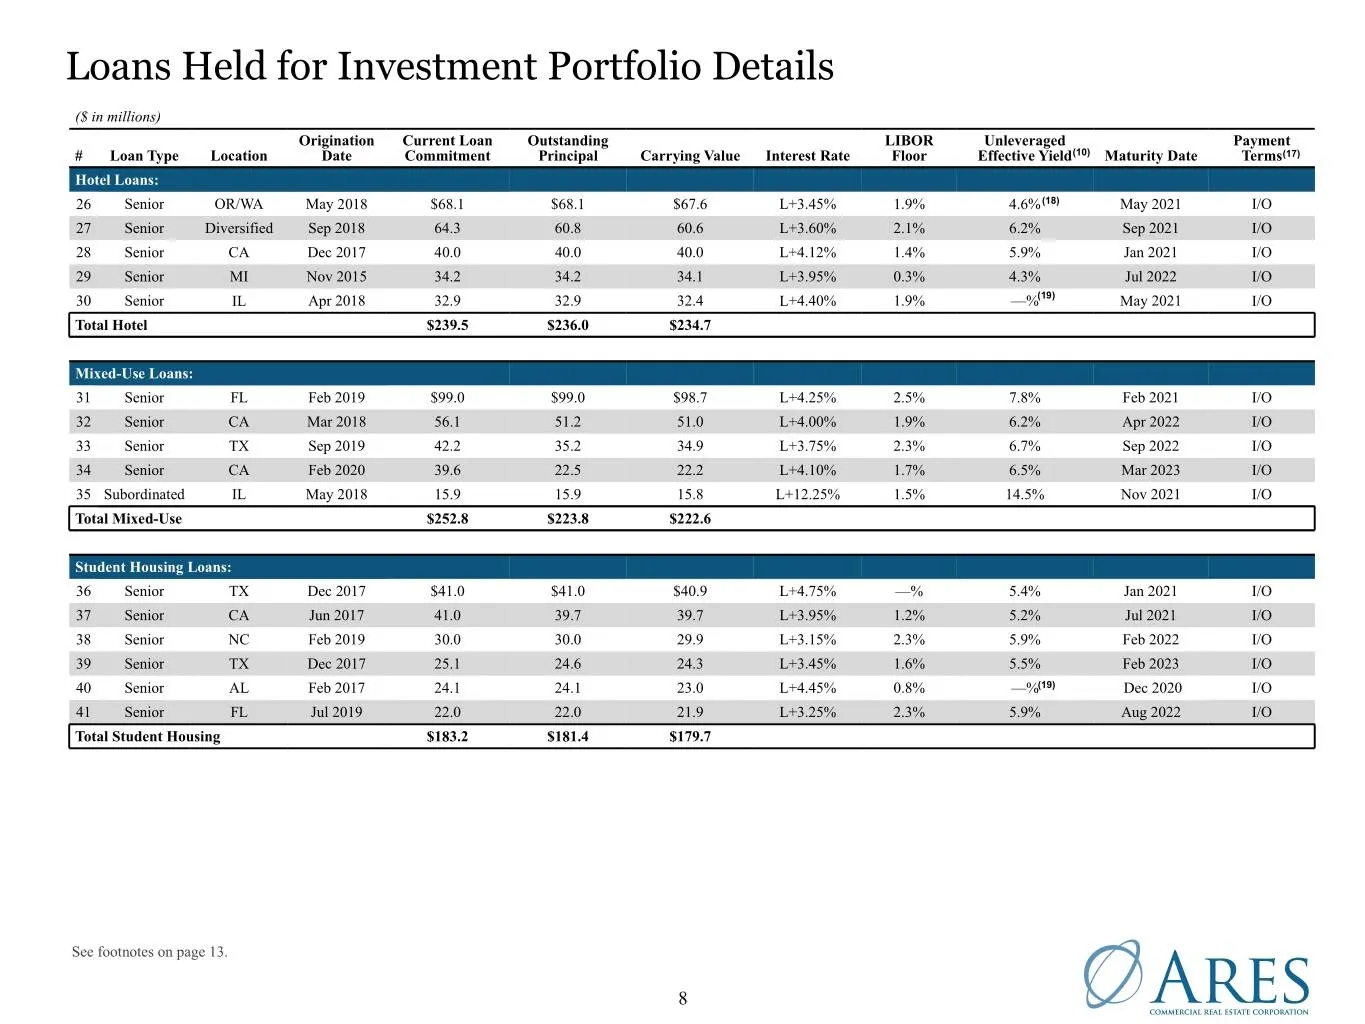
Loans Held for Investment Portfolio Details ($ in millions) Origination Current Loan Outstanding LIBOR Unleveraged Payment # Loan Type Location Date Commitment Principal Carrying Value Interest Rate Floor Effective Yield(10) Maturity Date Terms(17) Hotel Loans: 26 Senior OR/WA May 2018 $68.1 $68.1 $
Slide 10: Loans Held for Investment Portfolio Details
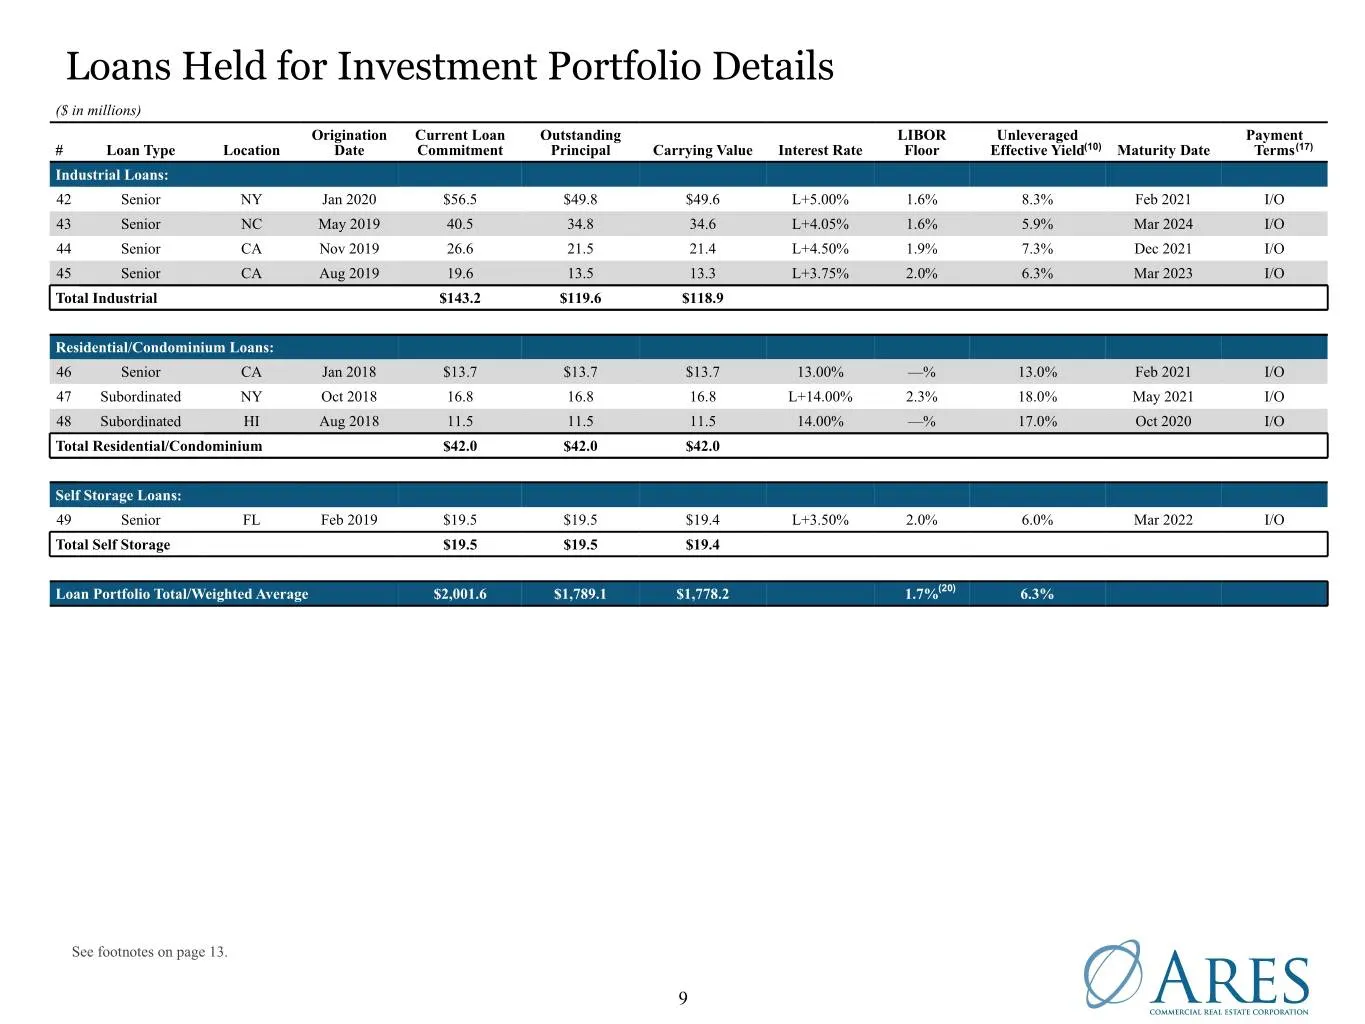
Loans Held for Investment Portfolio Details ($ in millions) Origination Current Loan Outstanding LIBOR Unleveraged Payment # Loan Type Location Date Commitment Principal Carrying Value Interest Rate Floor Effective Yield(10) Maturity Date Terms(17) Industrial Loans: 42 Senior NY Jan 2020 $56.5 $49.8
Slide 11: Consolidated Balance Sheets
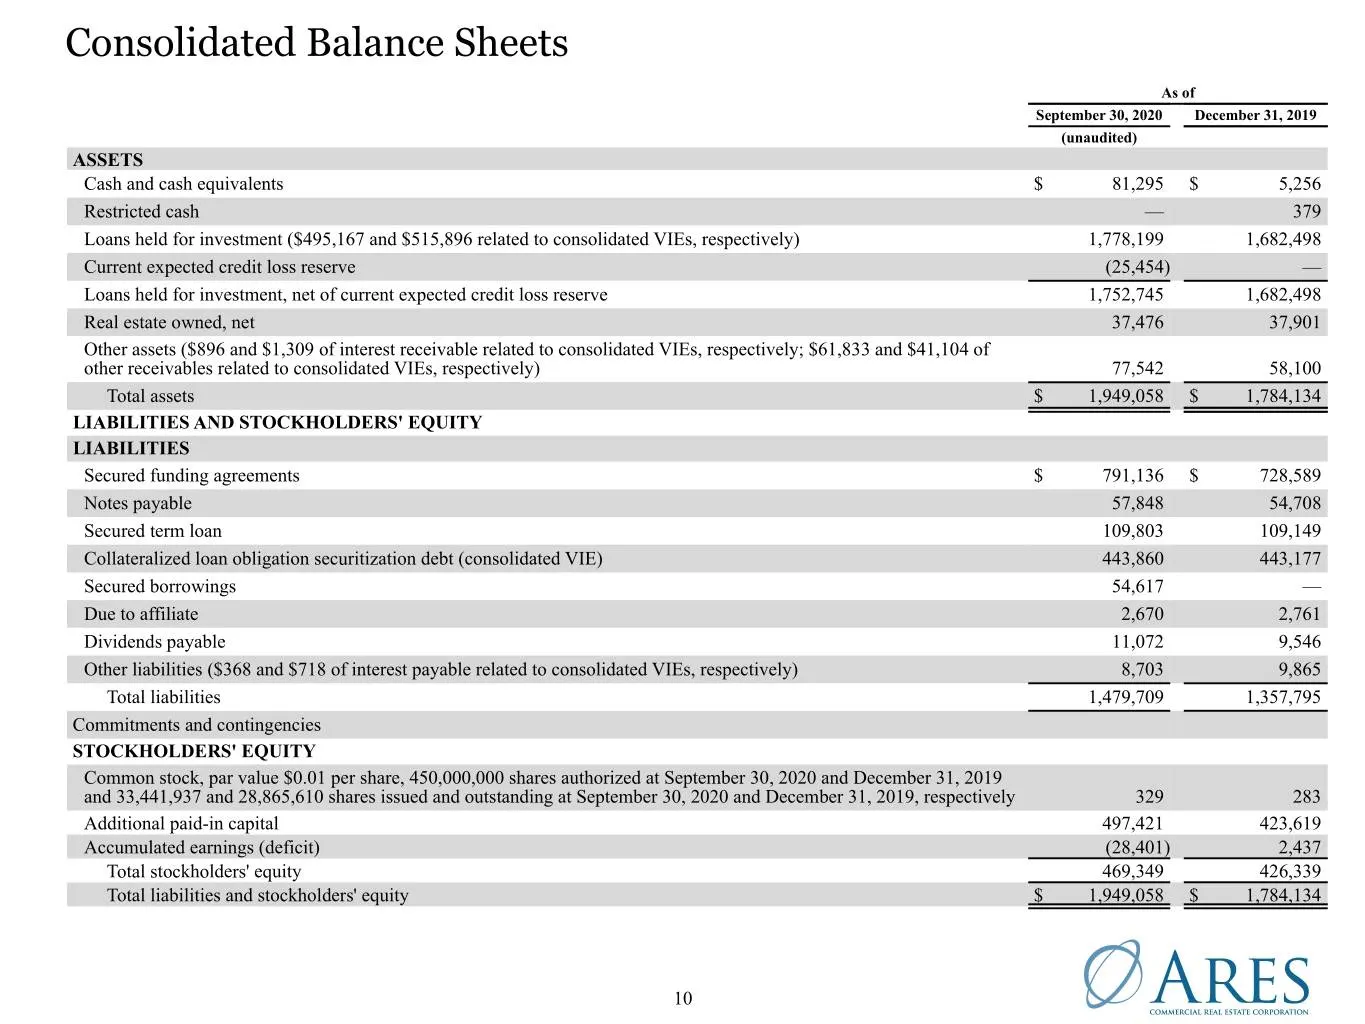
Consolidated Balance Sheets As of September 30, 2020 December 31, 2019 (unaudited) ASSETS Cash and cash equivalents $ 81,295 $ 5,256 Restricted cash — 379 Loans held for investment ($495,167 and $515,896 related to consolidated VIEs, respectively) 1,778,199 1,682,498 Current expected credit loss res
Slide 12: Consolidated Statements of Operations
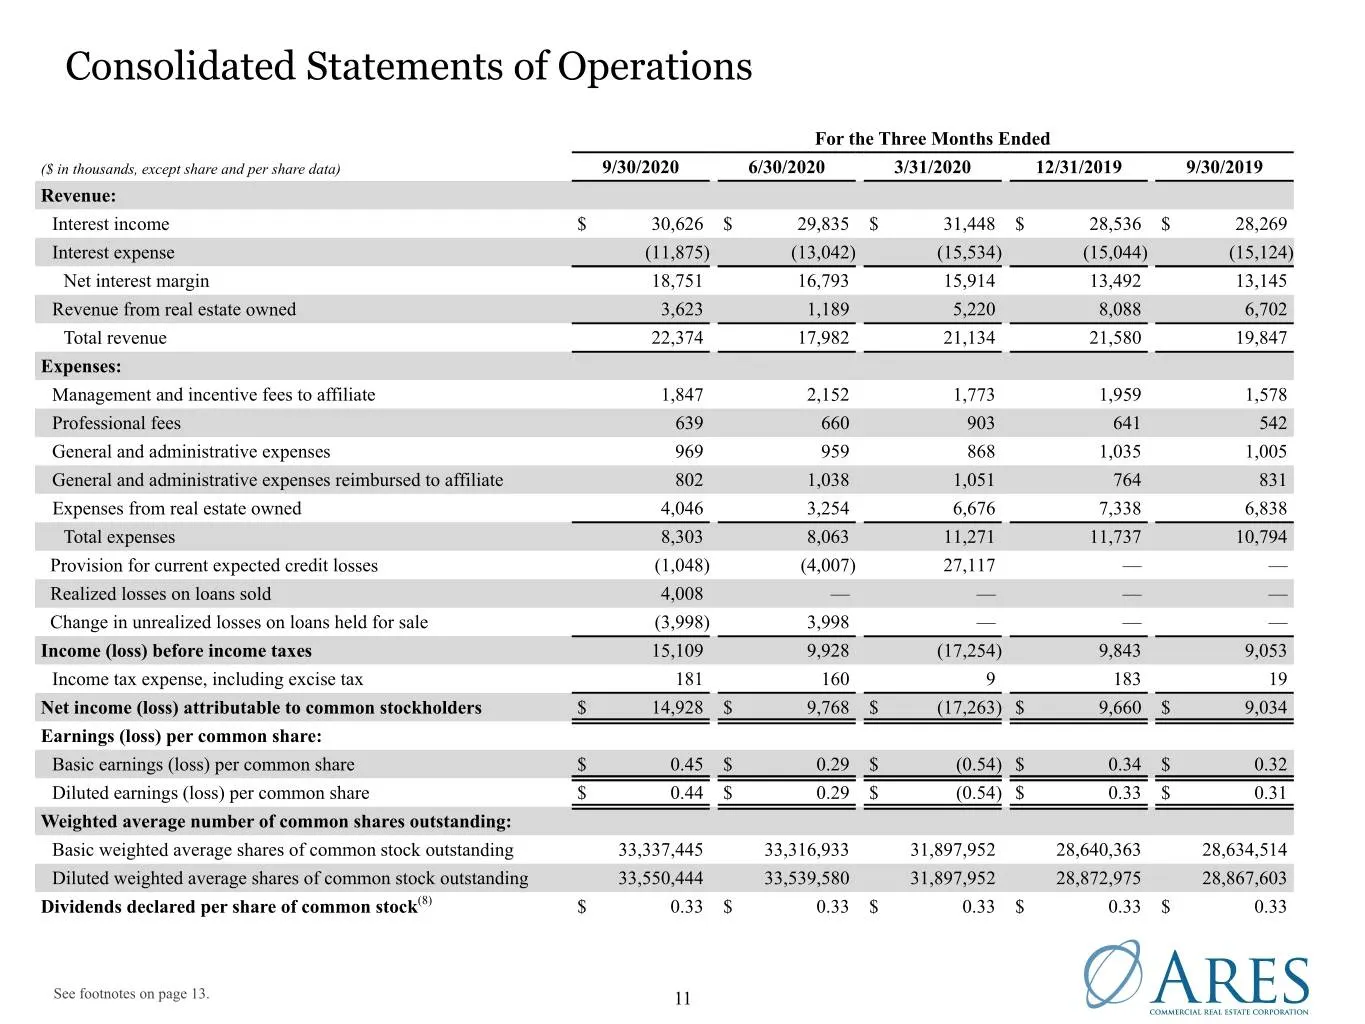
Consolidated Statements of Operations For the Three Months Ended ($ in thousands, except share and per share data) 9/30/2020 6/30/2020 3/31/2020 12/31/2019 9/30/2019 Revenue: Interest income $ 30,626 $ 29,835 $ 31,448 $ 28,536 $ 28,269 Interest expense (11,875) (13,042) (15,534) (15,044) (15,124) Ne
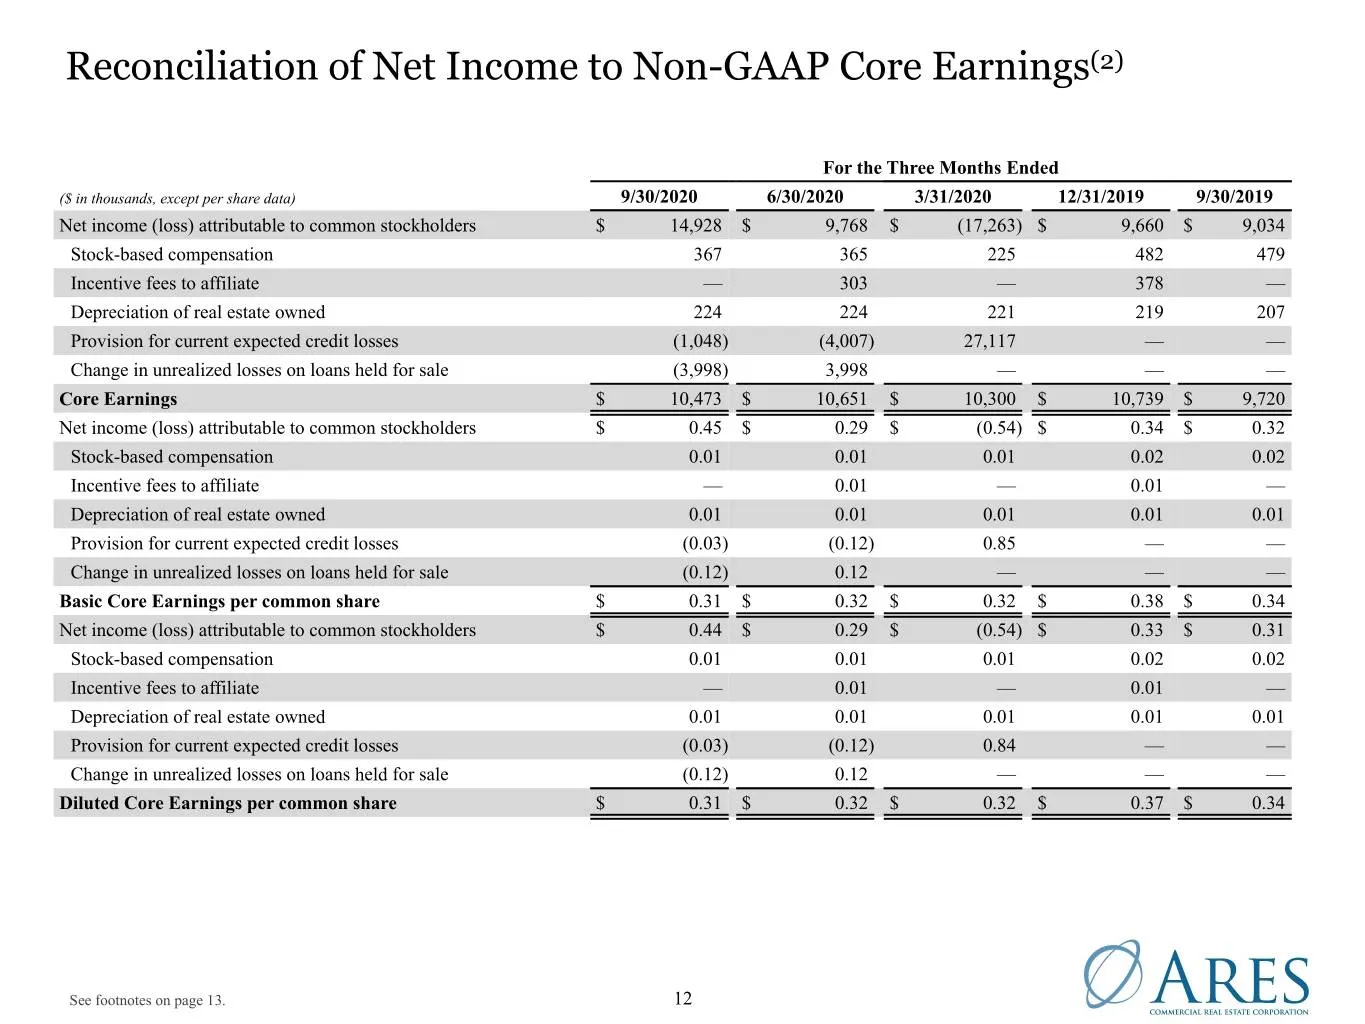
Slide 13: Reconciliation of Net Income to Non-GAAP Core Earnings
Reconciliation of Net Income to Non-GAAP Core Earnings(2) For the Three Months Ended ($ in thousands, except per share data) 9/30/2020 6/30/2020 3/31/2020 12/31/2019 9/30/2019 Net income (loss) attributable to common stockholders $ 14,928 $ 9,768 $ (17,263) $ 9,660 $ 9,034 Stock-based compensation 3
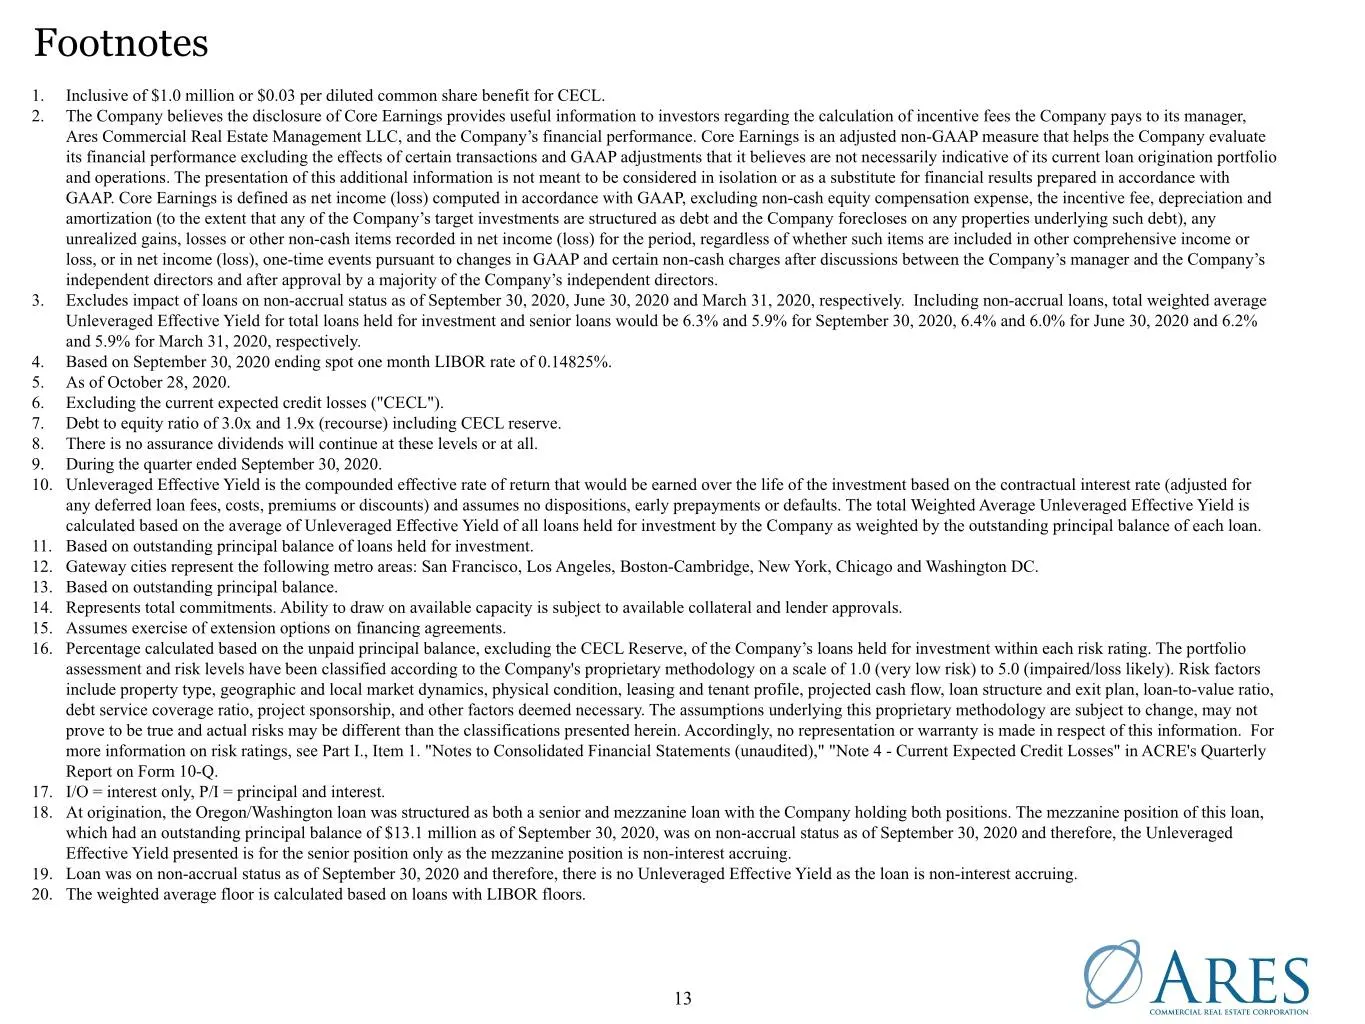
Slide 14: Footnotes
Footnotes 1. Inclusive of $1.0 million or $0.03 per diluted common share benefit for CECL. 2. The Company believes the disclosure of Core Earnings provides useful information to investors regarding the calculation of incentive fees the Company pays to its manager, Ares Commercial Real Estate Managem
Source: SEC EDGAR · 8-K filed Oct 29, 2020
More decks from Ares Commercial Real Estate Corporation
 Q3 2026 Earnings Presentation25 slides · Nov 6, 2026
 Q2 2026 Earnings Presentation24 slides · Aug 4, 2026
 Q1 2026 Earnings Presentation24 slides · May 7, 2026
 Q4 2025 Earnings Presentation23 slides · Feb 10, 2026
 Q4 2025 Earnings Presentation23 slides · Feb 10, 2026
 Q3 2025 Earnings Presentation23 slides · Nov 7, 2025