TIER REIT — Investor Presentation (February 2018)
30 slides from TIER REIT's investor presentation, Feb 26, 2018
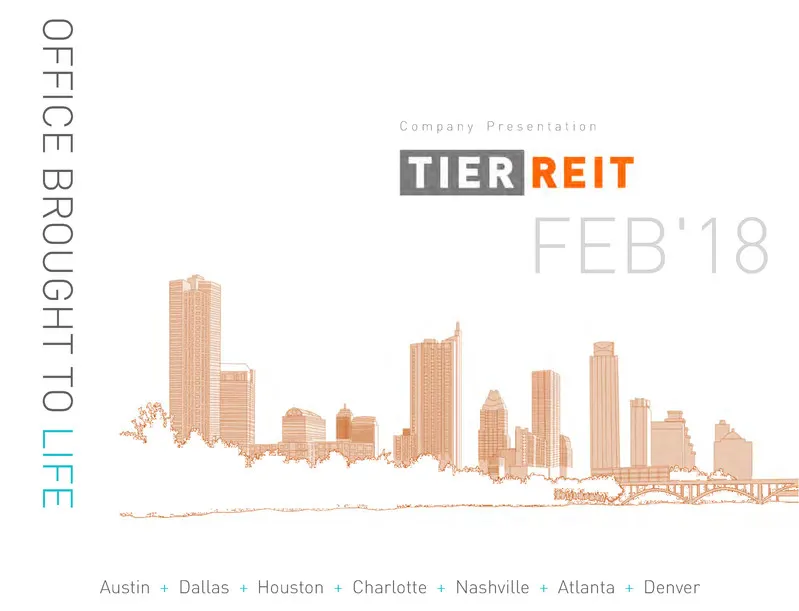
Slide 1: Company Presentation Feb'18
Austin + Dallas + Houston + Charlotte + Nashville + Atlanta + Denver OFFICE B ROUGHT TO LIF E C o m p a n y P r e s e n t a t i o n FEB'18
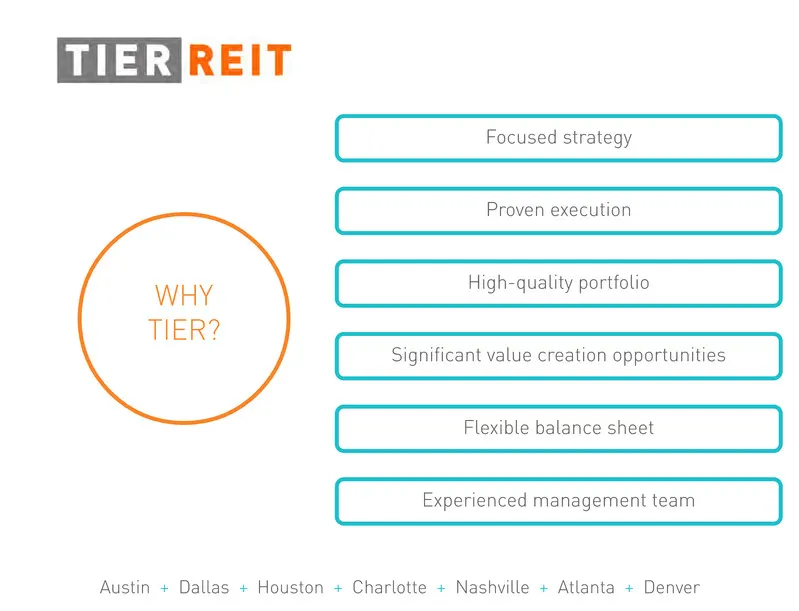
Slide 2: Why TIER?
High-quality portfolio Proven execution Flexible balance sheet Significant value creation opportunities Experienced management team WHY TIER? Focused strategy Austin + Dallas + Houston + Charlotte + Nashville + Atlanta + Denver
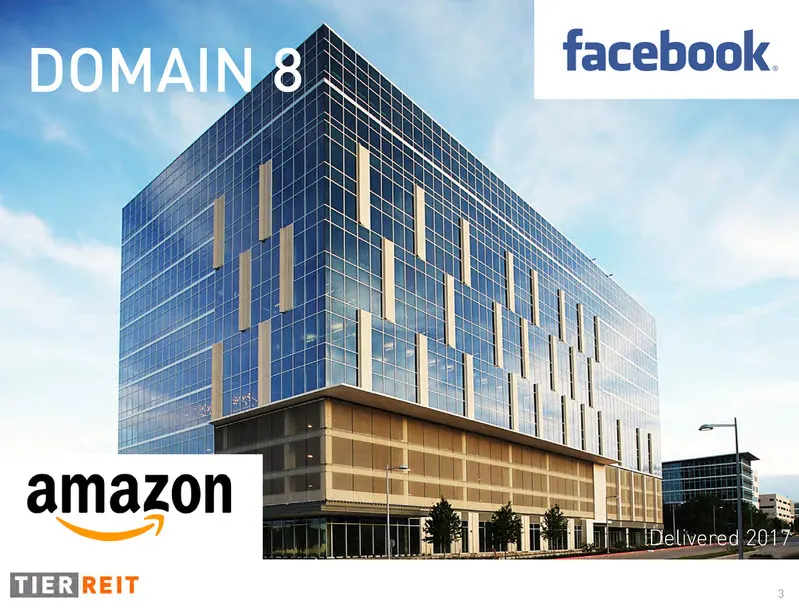
Slide 3: facebook
facebook amazon Sa GOEIREIT
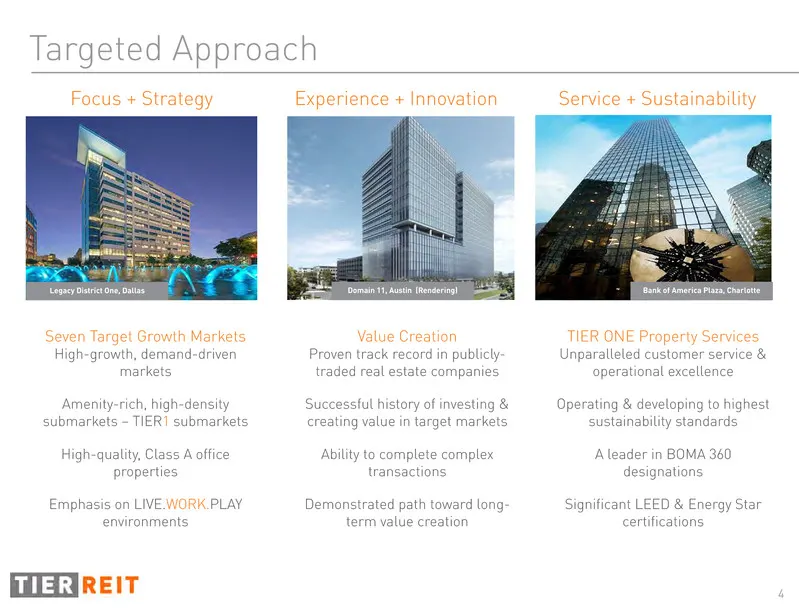
Slide 4: Focus + Strategy: Targeted Approach
4 Service + Sustainability Value Creation Proven track record in publicly- traded real estate companies Successful history of investing & creating value in target markets Ability to complete complex transactions Demonstrated path toward long- term value creation Seven Target Growth Markets High-grow
Slide 5: Seven Target Growth Markets
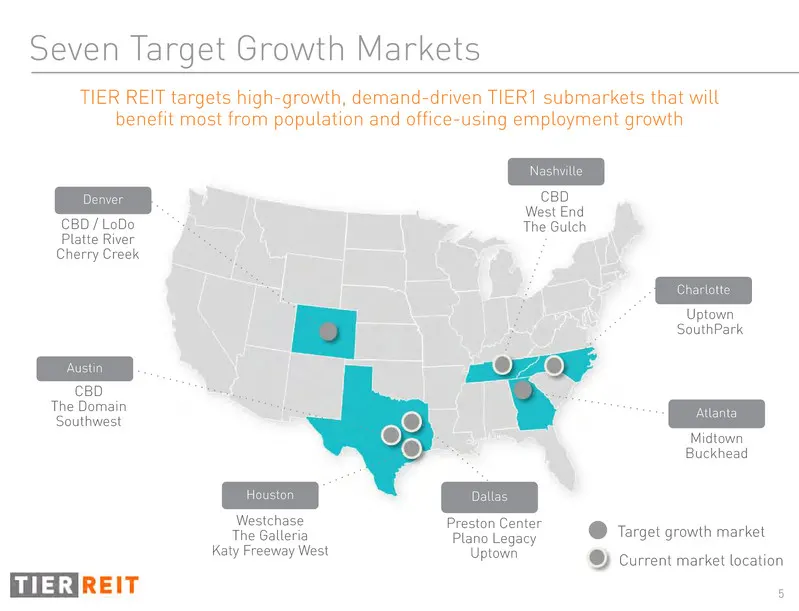
5 Seven Target Growth Markets TIER REIT targets high-growth, demand-driven TIER1 submarkets that will benefit most from population and office-using employment growth Denver Houston Austin Atlanta Nashville Dallas Charlotte CBD The Domain Southwest Westchase The Galleria Katy Freeway West Uptown Sout
Slide 6: High-Quality Portfolio
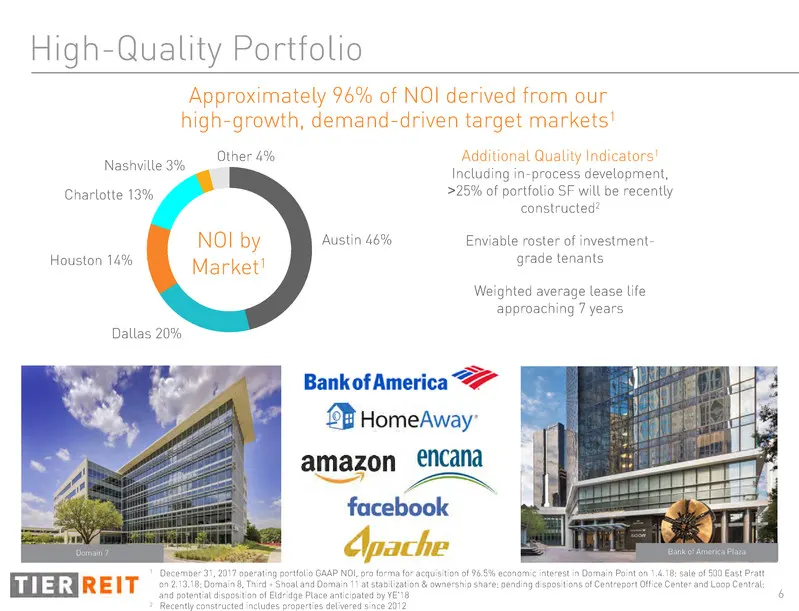
6 Approximately 96% of NOI derived from our high-growth, demand-driven target markets1 High-Quality Portfolio Additional Quality Indicators1 Including in-process development, >25% of portfolio SF will be recently constructed2 Enviable roster of investment- grade tenants Weighted average lease life a
Slide 7: Acquired 2015
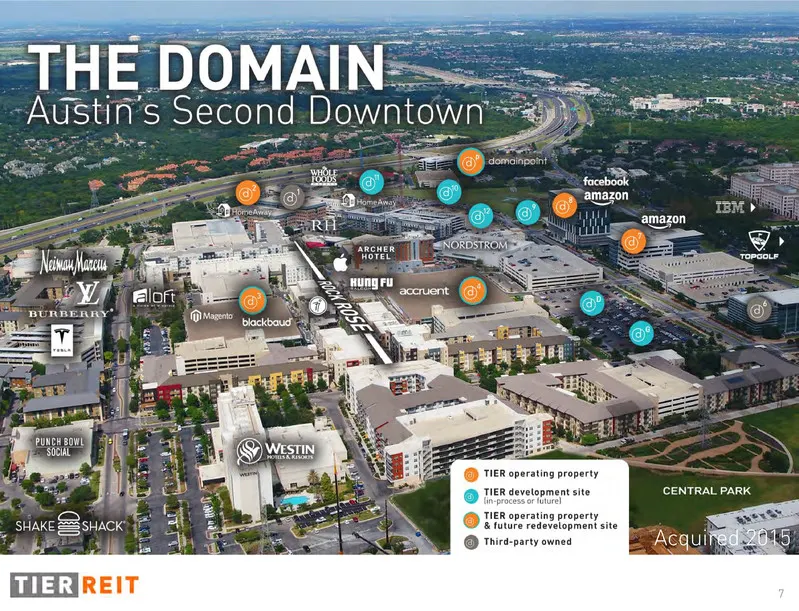
7 Acquired 2015
Slide 8: Domain Development Results
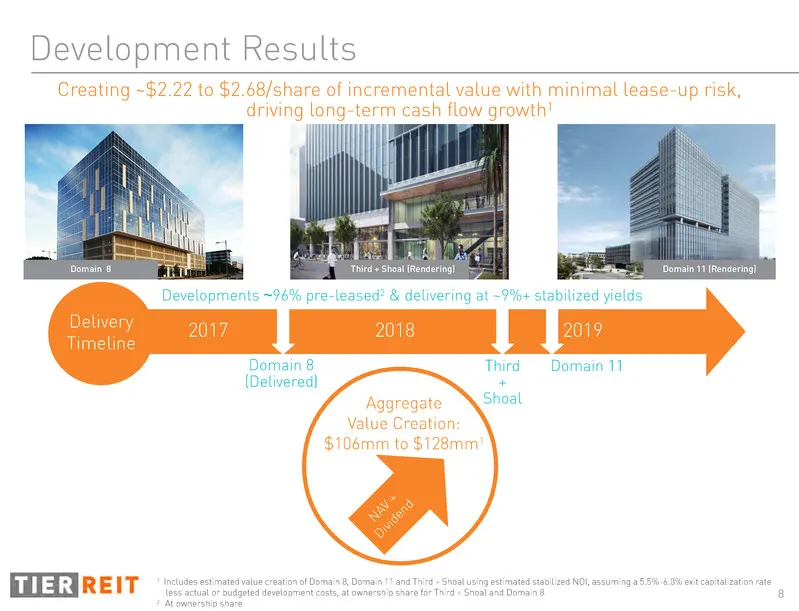
8 Domain 8 Development Results Domain 11 (Rendering) Aggregate Value Creation: $106mm to $128mm1 Third + Shoal (Rendering) Creating ~$2.22 to $2.68/share of incremental value with minimal lease-up risk, driving long-term cash flow growth1 1 Includes estimated value creation of Domain 8, Domain 11 an
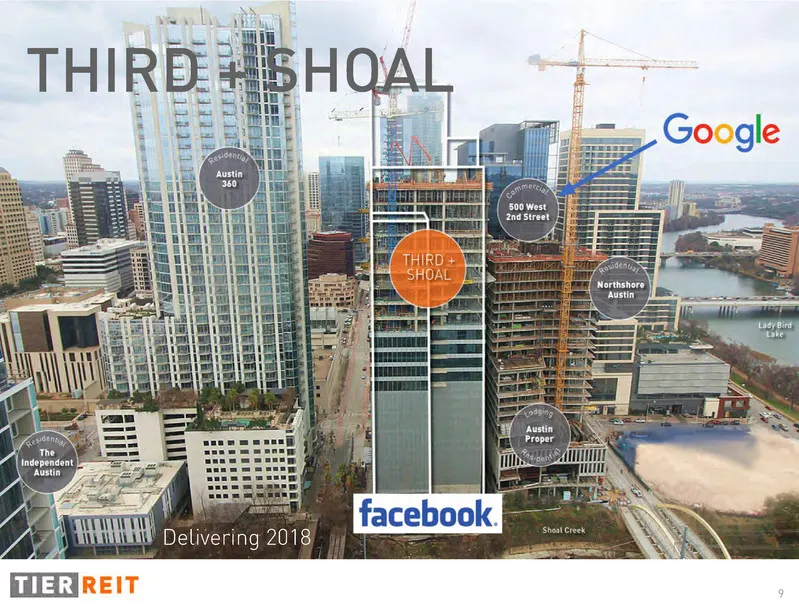
Slide 9: Delivering 2018 Third + Shoal
9 Delivering 2018 THIRD + SHOAL
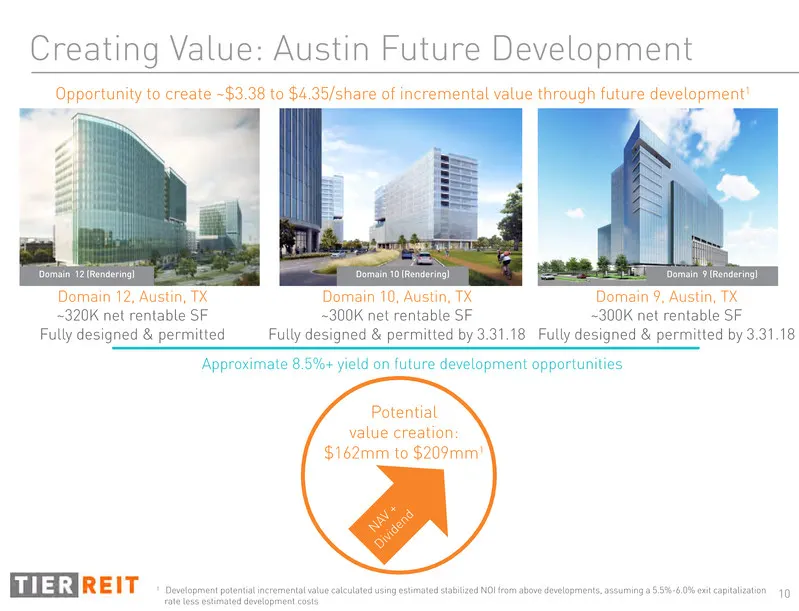
Slide 10: Creating Value: Austin Future Development
10 Domain 12 (Rendering) Creating Value: Austin Future Development Domain 12, Austin, TX ~320K net rentable SF Fully designed & permitted Domain 10, Austin, TX ~300K net rentable SF Fully designed & permitted by 3.31.18 1 Development potential incremental value calculated using estimated stabilized
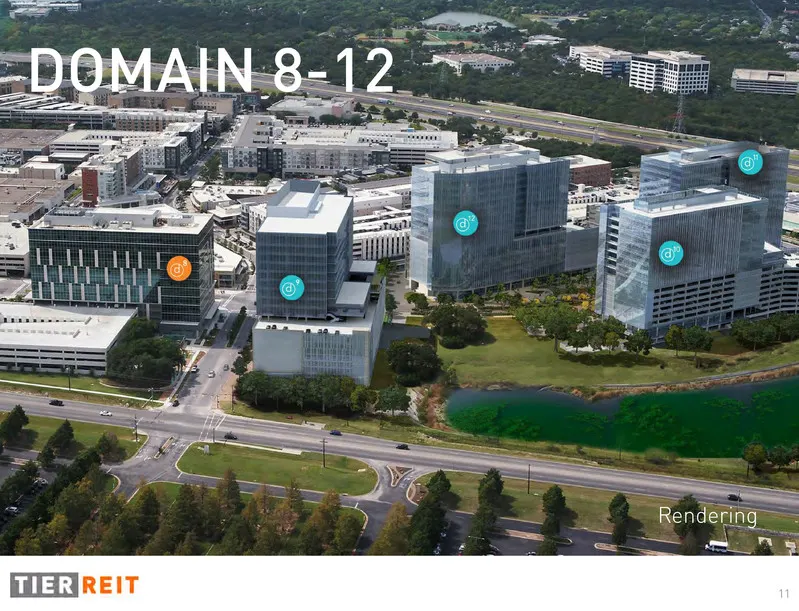
Slide 11: Domain 8-12 Rendering
11 Rendering DOMAIN 8-12
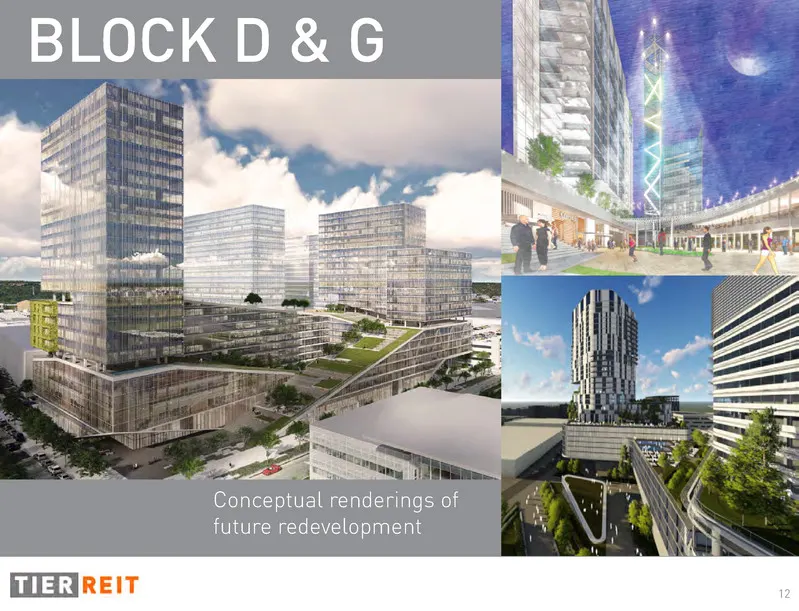
Slide 12: Block D & G
12 BLOCK D & G Conceptual renderings of future redevelopment
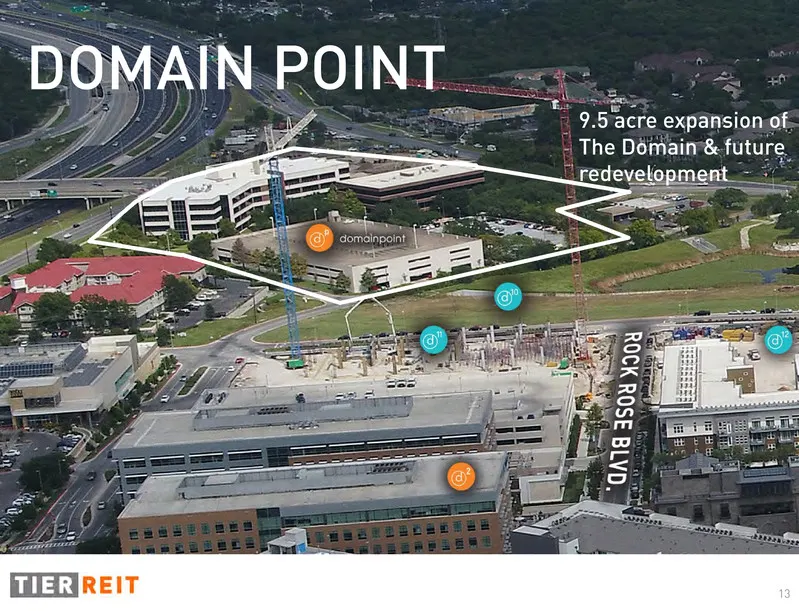
Slide 13: Domain Point
13 DOMAIN POINT 9.5 acre expansion of The Domain & future redevelopment
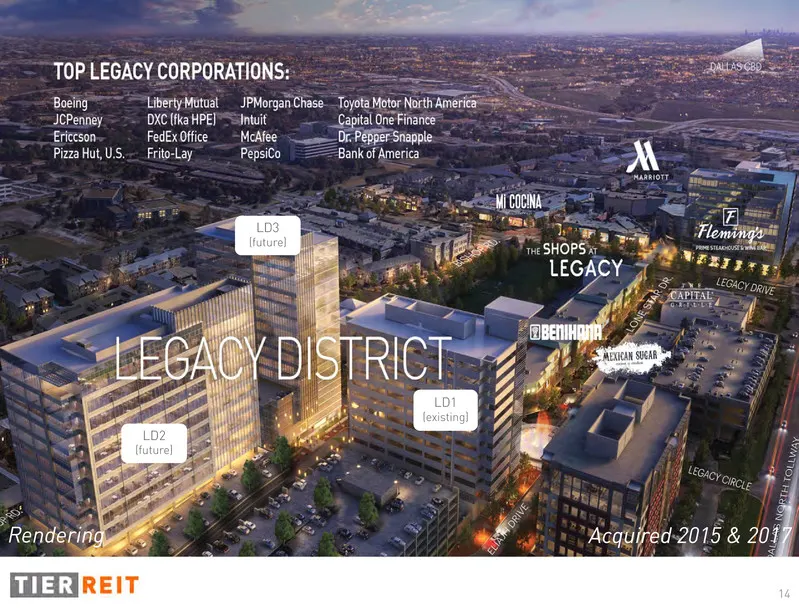
Slide 14: Legacy District Acquired 2015 & 2017
14 Acquired 2015 & 2017Rendering LD2 (future) LD1 (existing) LD3 (future)
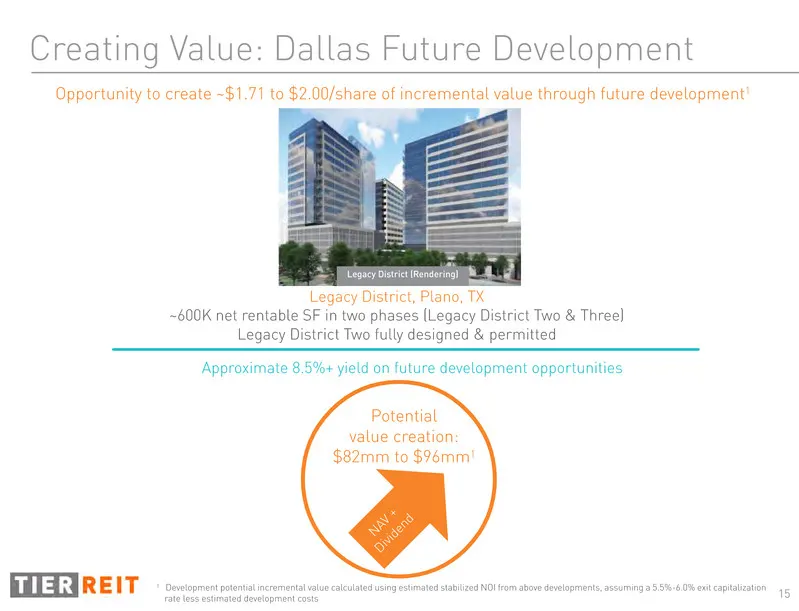
Slide 15: Creating Value: Dallas Future Development
15 Creating Value: Dallas Future Development Legacy District, Plano, TX ~600K net rentable SF in two phases (Legacy District Two & Three) Legacy District Two fully designed & permitted 1 Development potential incremental value calculated using estimated stabilized NOI from above developments, assumi
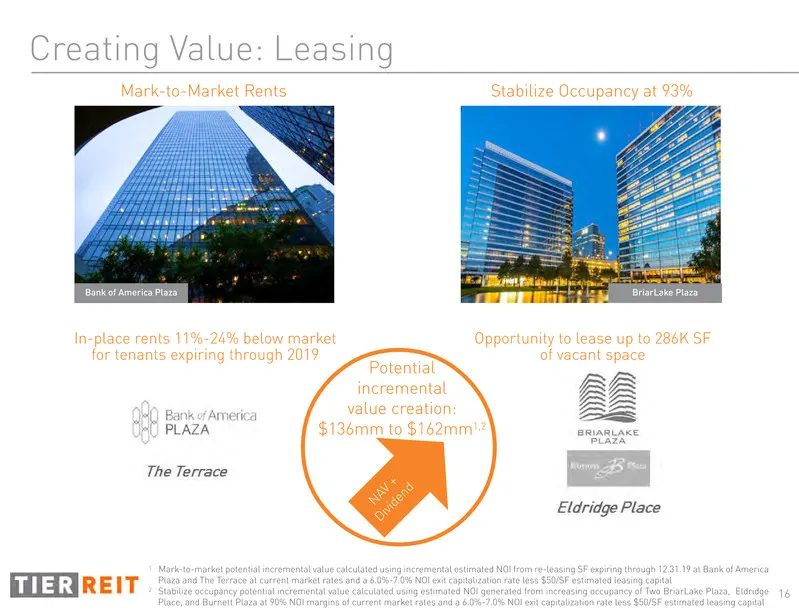
Slide 16: Creating Value: Leasing
16 Creating Value: Leasing Mark-to-Market Rents Stabilize Occupancy at 93% In-place rents 11%-24% below market for tenants expiring through 2019 Opportunity to lease up to 286K SF of vacant space 1 Mark-to-market potential incremental value calculated using incremental estimated NOI from re-leasing
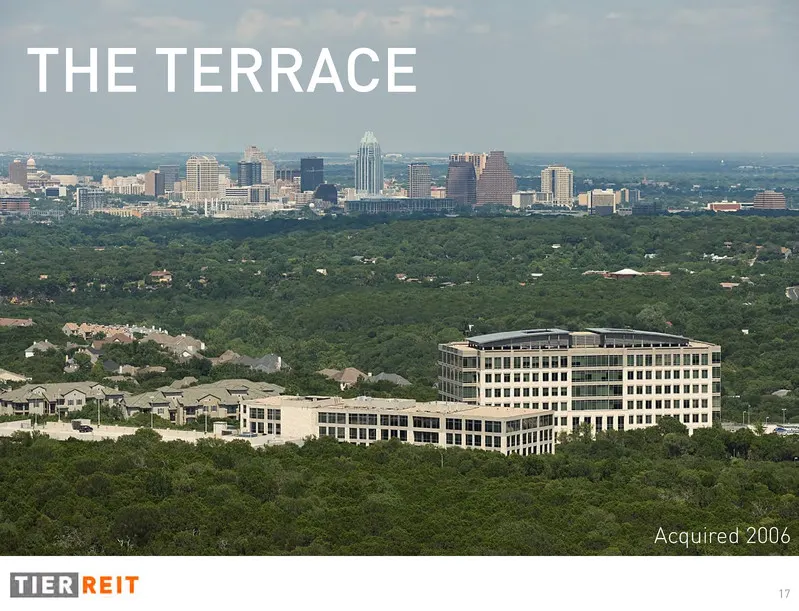
Slide 17: The Terrace Acquired 2006
17 Acquired 2006 THE TERRACE
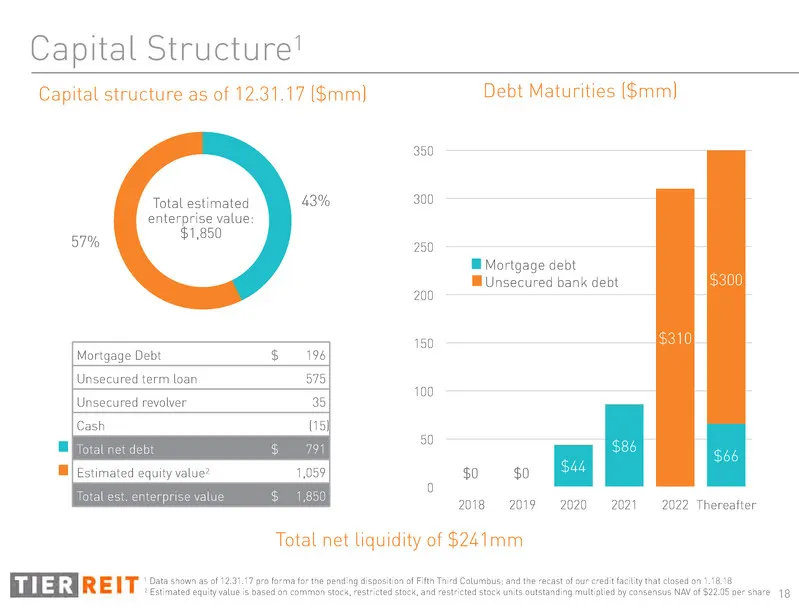
Slide 18: Capital Structure and Debt Maturities
18 350 300 250 200 150 100 50 0 2018 2019 2020 2021 2022 Thereafter $44 $86 $66 $310 $300 1 Data shown as of 12.31.17 pro forma for the pending disposition of Fifth Third Columbus; and the recast of our credit facility that closed on 1.18.18 2 Estimated equity value is based on common stock, restric
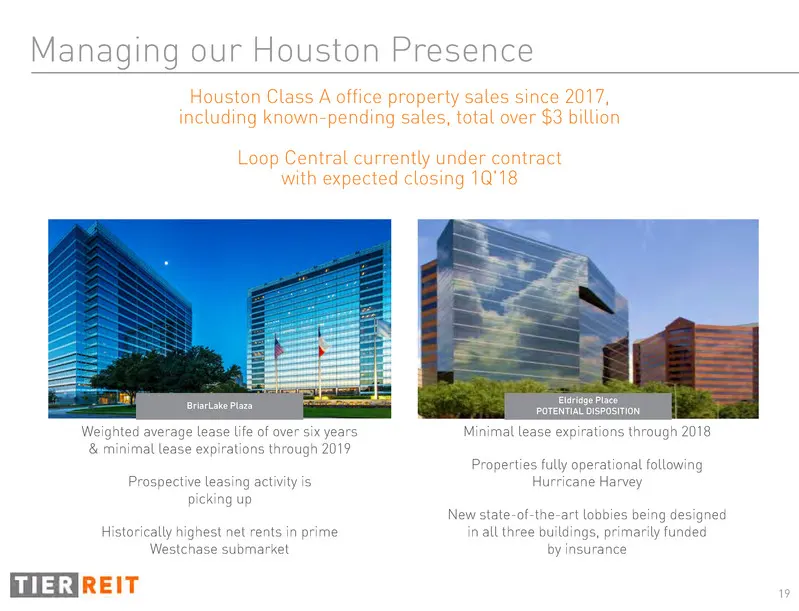
Slide 19: Managing our Houston Presence
19 Managing our Houston Presence Houston Class A office property sales since 2017, including known-pending sales, total over $3 billion Loop Central currently under contract with expected closing 1Q'18 Eldridge Place POTENTIAL DISPOSITIONBriarLake Plaza Minimal lease expirations through 2018 Propert
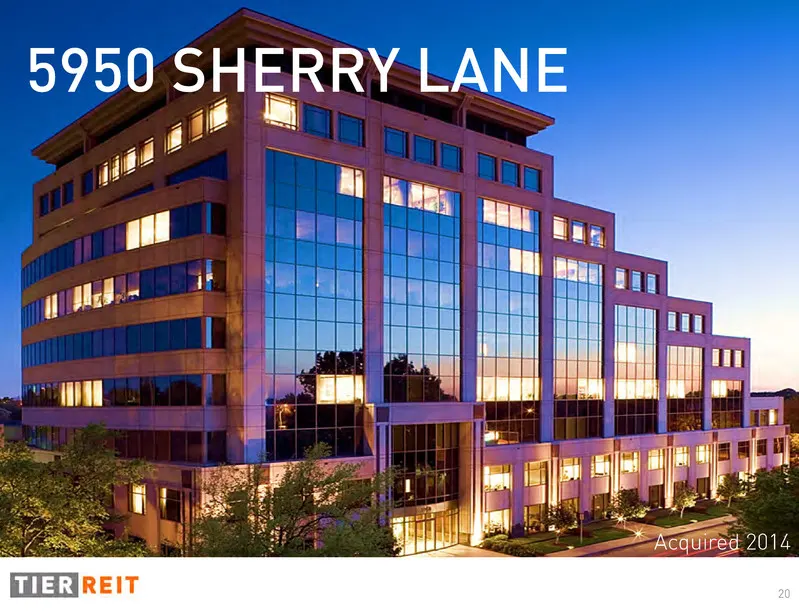
Slide 20: 5950 Sherry Lane Acquired 2014
20 Acquired 2014 5950 SHERRY LANE
Slide 21: Experienced Management Team
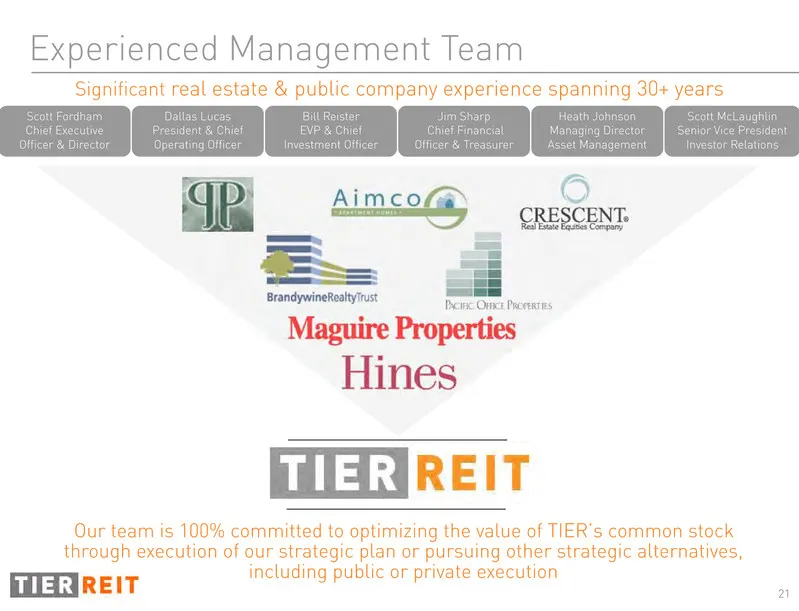
21 Experienced Management Team Significant real estate & public company experience spanning 30+ years Jim Sharp Chief Financial Officer & Treasurer Bill Reister EVP & Chief Investment Officer Heath Johnson Managing Director Asset Management Dallas Lucas President & Chief Operating Officer Scott Ford
Slide 22: Delivering 2018 Third + Shoal
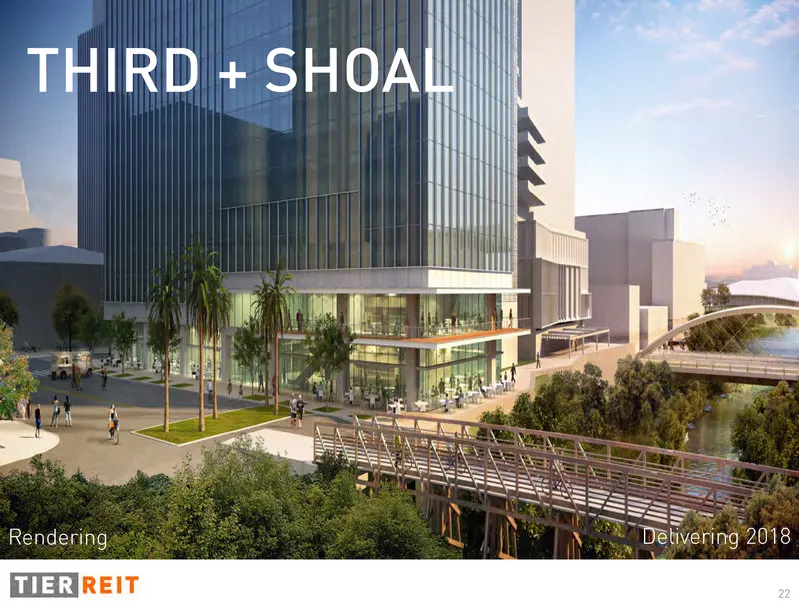
22 Delivering 2018Rendering THIRD + SHOAL
Slide 23: Austin market snapshot
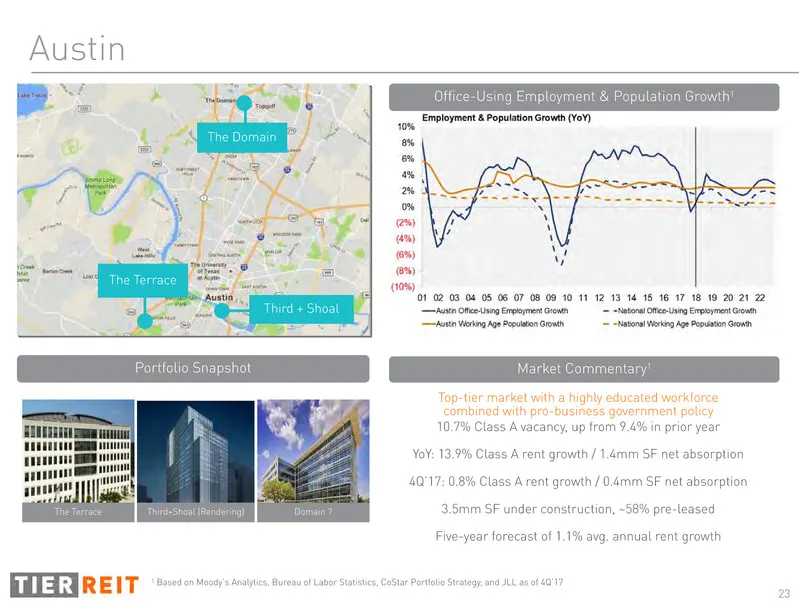
23 Top-tier market with a highly educated workforce combined with pro-business government policy 10.7% Class A vacancy, up from 9.4% in prior year YoY: 13.9% Class A rent growth / 1.4mm SF net absorption 4Q’17: 0.8% Class A rent growth / 0.4mm SF net absorption 3.5mm SF under construction, ~58% pre-
Slide 24: Dallas-Fort Worth market snapshot
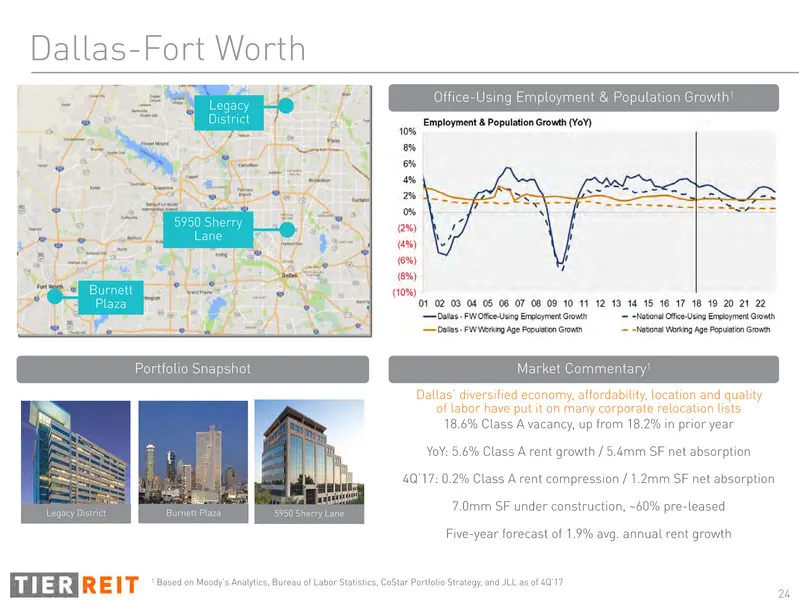
24 Dallas’ diversified economy, affordability, location and quality of labor have put it on many corporate relocation lists 18.6% Class A vacancy, up from 18.2% in prior year YoY: 5.6% Class A rent growth / 5.4mm SF net absorption 4Q’17: 0.2% Class A rent compression / 1.2mm SF net absorption 7.0mm
Slide 25: Houston market snapshot
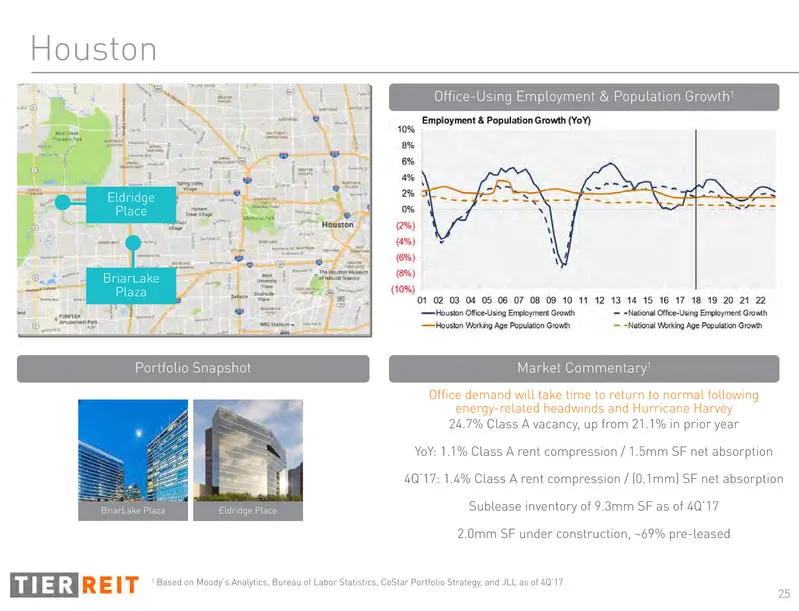
25 Houston Office demand will take time to return to normal following energy-related headwinds and Hurricane Harvey 24.7% Class A vacancy, up from 21.1% in prior year YoY: 1.1% Class A rent compression / 1.5mm SF net absorption 4Q’17: 1.4% Class A rent compression / (0.1mm) SF net absorption Subleas
Slide 26: Charlotte market snapshot
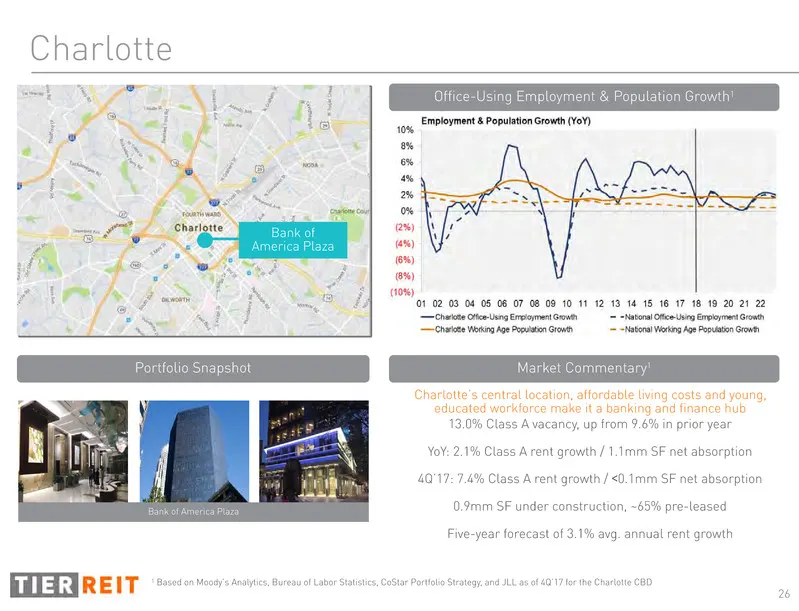
26 Charlotte’s central location, affordable living costs and young, educated workforce make it a banking and finance hub 13.0% Class A vacancy, up from 9.6% in prior year YoY: 2.1% Class A rent growth / 1.1mm SF net absorption 4Q’17: 7.4% Class A rent growth / <0.1mm SF net absorption 0.9mm SF under
Slide 27: Nashville market snapshot
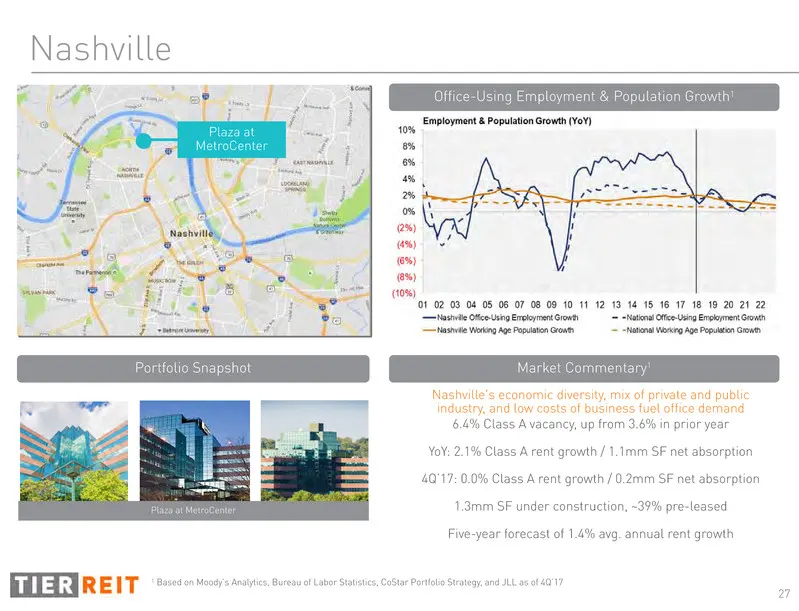
27 Nashville Office-Using Employment & Population Growth1 Nashville's economic diversity, mix of private and public industry, and low costs of business fuel office demand 6.4% Class A vacancy, up from 3.6% in prior year YoY: 2.1% Class A rent growth / 1.1mm SF net absorption 4Q’17: 0.0% Class A rent
Slide 28: Forward-Looking Statements
Forward-Looking Statements This presentation contains forward-looking statements, including discussion and analysis of the financial condition of us and our subsidiaries and other matters. These forward-looking statements are not historical facts but are the intent, belief or current expectations of

Slide 29
Slide 30: Investment Rationale
High-quality portfolio Proven execution Significant value creation opportunities INVESTMENT RATIONALE Flexible balance sheet Focused strategy Experienced management team ir@tierreit.com www.tierreit.com 972.483.2400 Austin + Dallas + Houston + Charlotte + Nashville + Atlanta + Denver
Source: SEC EDGAR · 8-K filed Feb 26, 2018
More decks from TIER REIT Inc
 Merger or Acquisition (June 2019)27 slides · Jun 4, 2019
 Merger or Acquisition (March 2019)18 slides · Mar 25, 2019
 Merger or Acquisition (March 2019)19 slides · Mar 25, 2019
 Investor Presentation (March 2019)30 slides · Mar 4, 2019
 Investor Presentation (February 2019)28 slides · Feb 19, 2019
 Investor Presentation (November 2018)28 slides · Nov 5, 2018