Seche Environnement SA · EURONEXT:SCHP
Seche Environnement SA — Investor Day (December 2019)
113 slides from Seche Environnement SA's investor day presentation, Dec 17, 2019
Slide 1: Investor Day December 17, 2019
Investor Day December 17, 2019
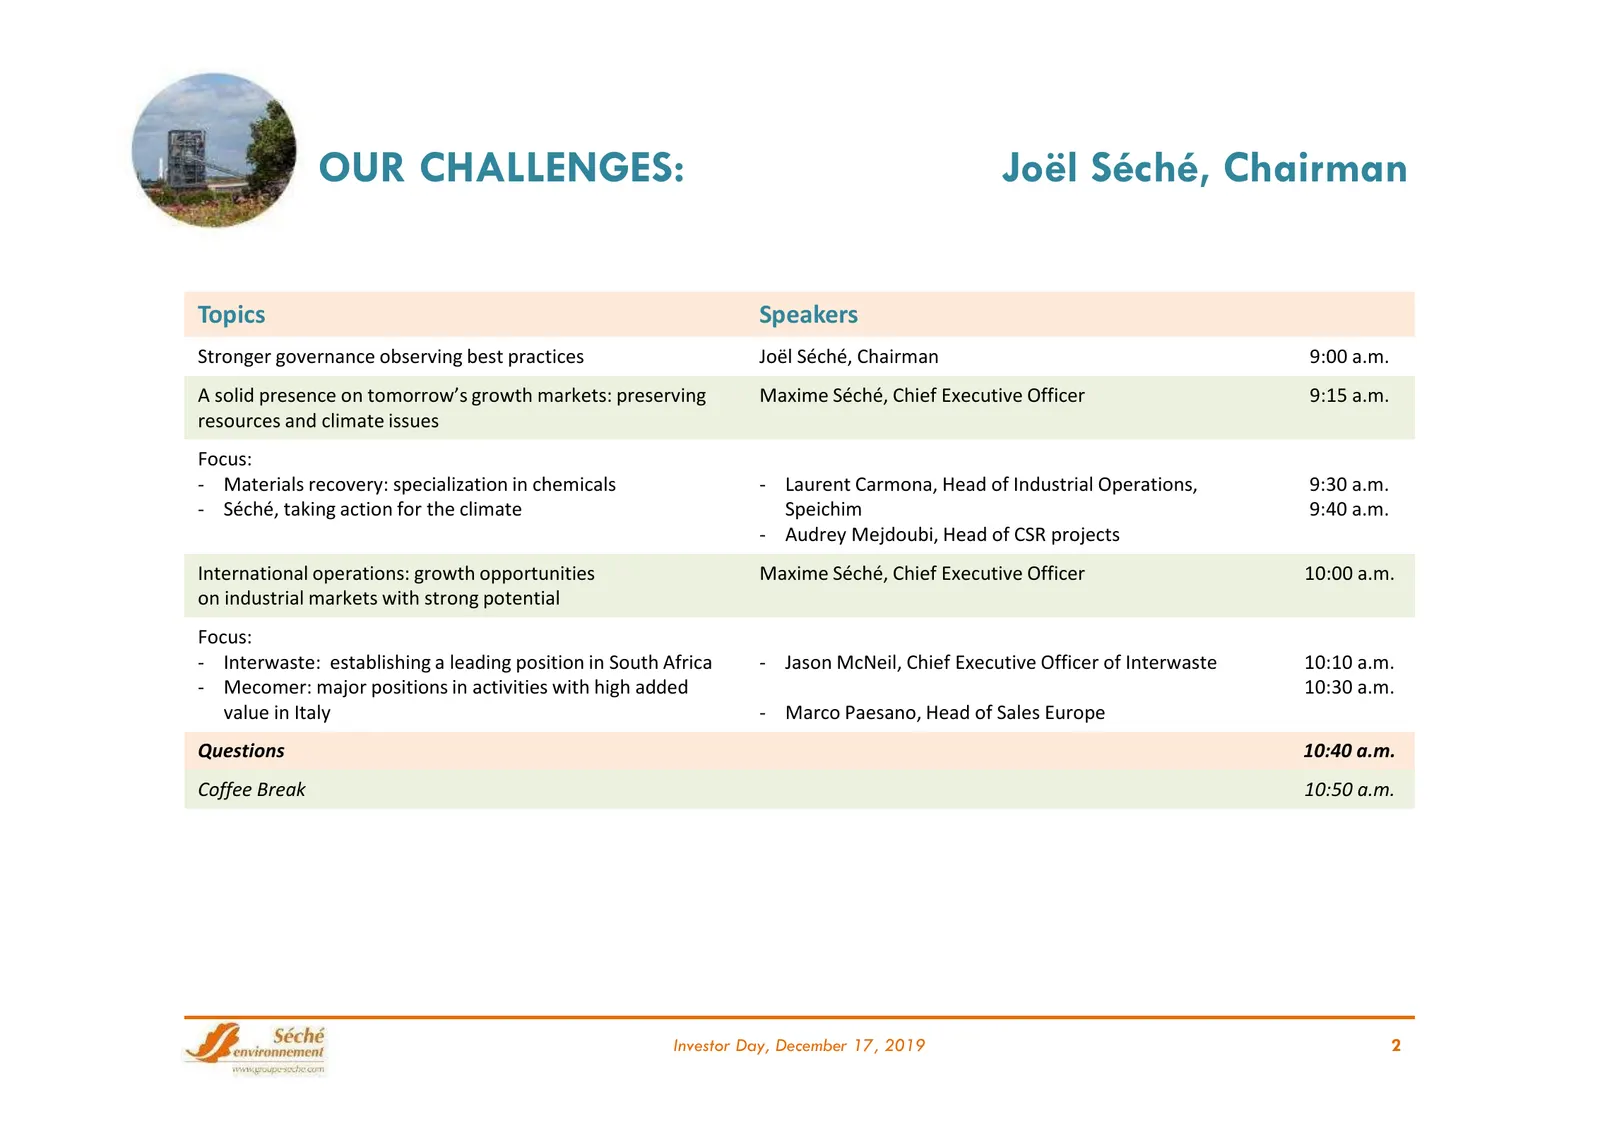
Slide 2: Our Challenges: Joël Séché, Chairman
OUR CHALLENGES: Joël Séché, Chairman Topics Speakers Stronger governance observing best practices Joël Séché, Chairman 9:00 a.m. A solid presence on tomorrow’s growth markets: preserving Maxime Séché, Chief Executive Officer 9:15 a.m. resources and climate issues Focus: - Materials recovery: special
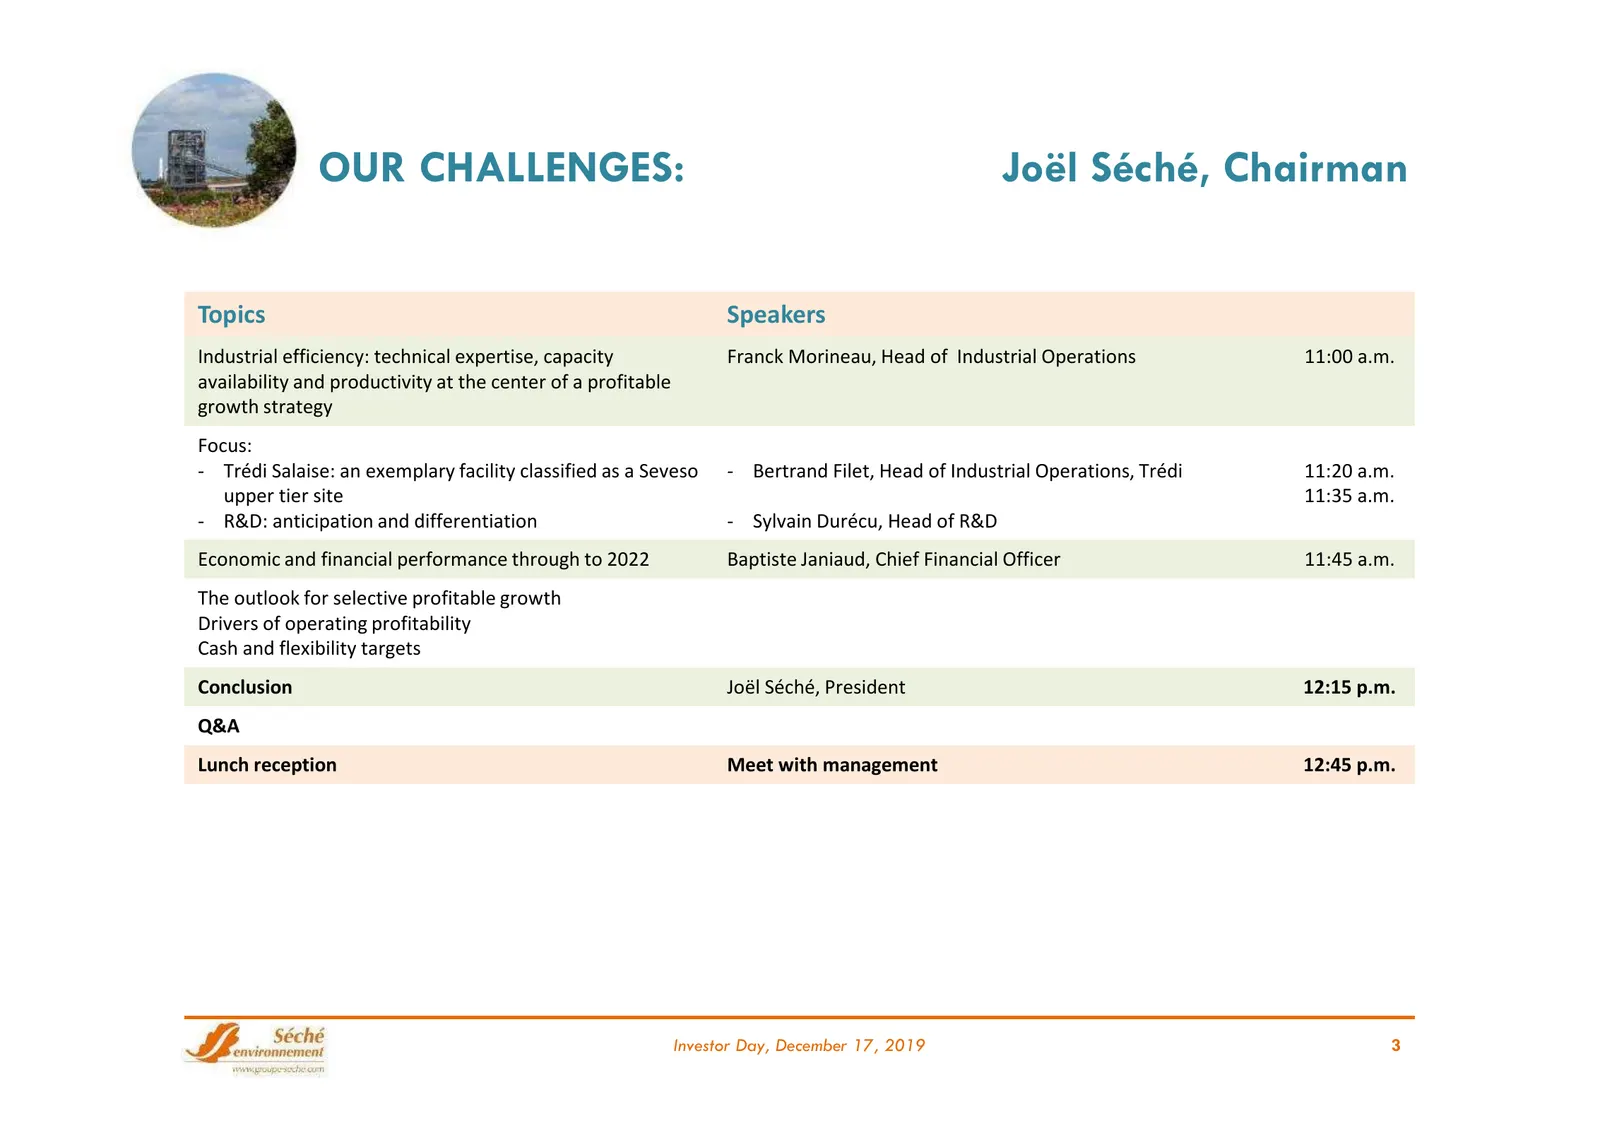
Slide 3: Our Challenges: Joël Séché, Chairman
OUR CHALLENGES: Joël Séché, Chairman Topics Speakers Industrial efficiency: technical expertise, capacity Franck Morineau, Head of Industrial Operations 11:00 a.m. availability and productivity at the center of a profitable growth strategy Focus: - Trédi Salaise: an exemplary facility classified as
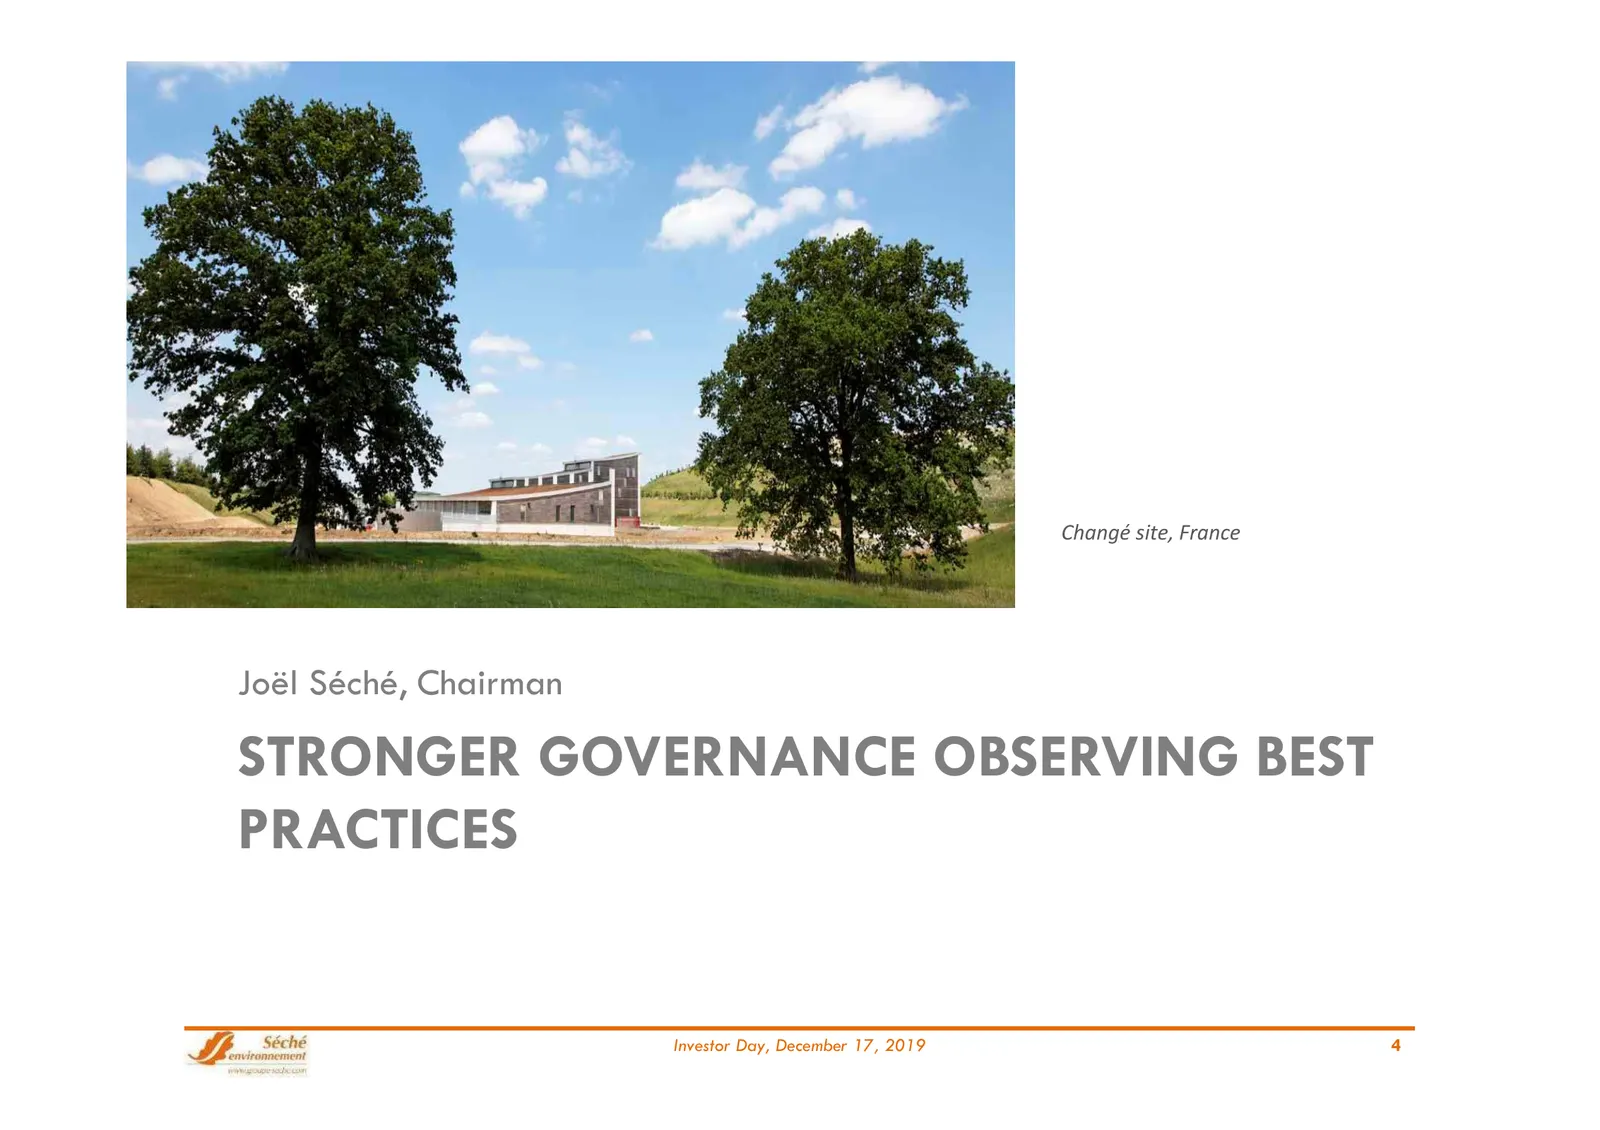
Slide 4: Stronger Governance Observing Best Practices
Changé site, France Joël Séché, Chairman STRONGER GOVERNANCE OBSERVING BEST PRACTICES Investor Day, December 17, 2019 4
Slide 5: A Strong, Committed, Stable Family Control Structure
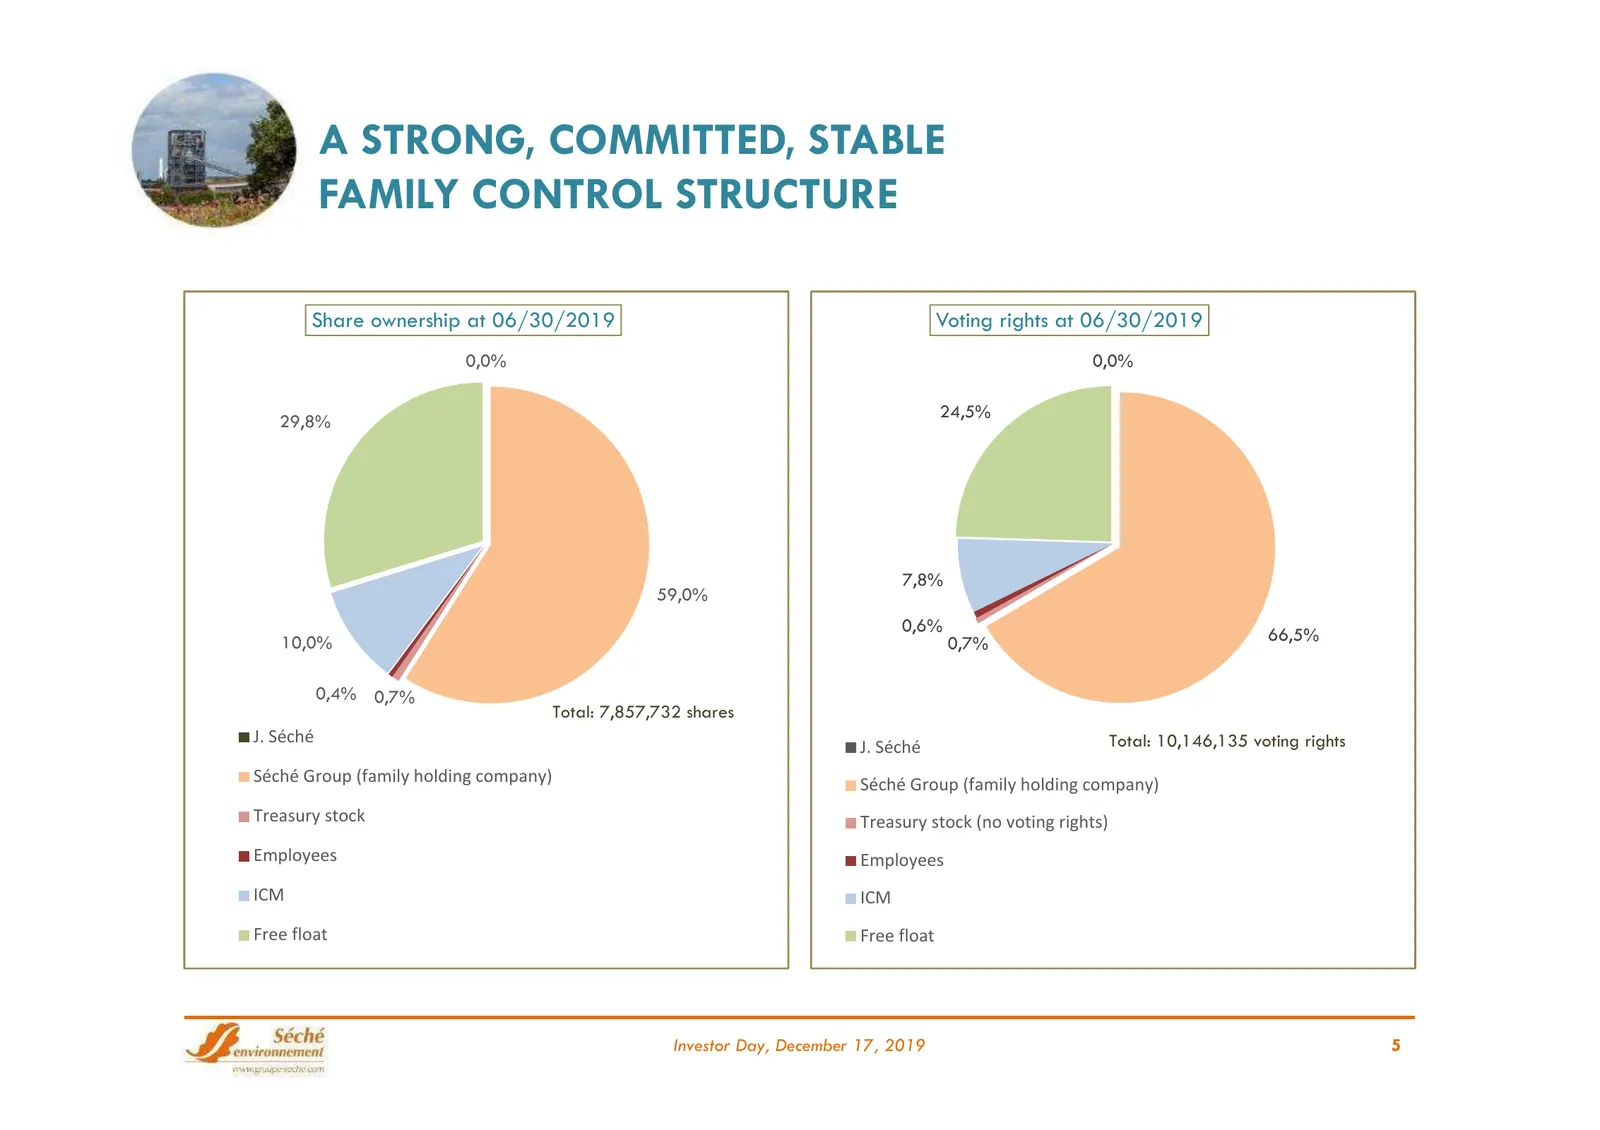
A STRONG, COMMITTED, STABLE FAMILY CONTROL STRUCTURE Share ownership at 06/30/2019 Voting rights at 06/30/2019 0,0% 0,0% 24,5% 29,8% 7,8% 59,0% 0,6% 66,5% 10,0% 0,7% 0,4% 0,7% Total: 7,857,732 shares J. Séché Total: 10,146,135 voting rights J. Séché Séché Group (family holding company) Séché Group (
Slide 6: Governance observing best practices
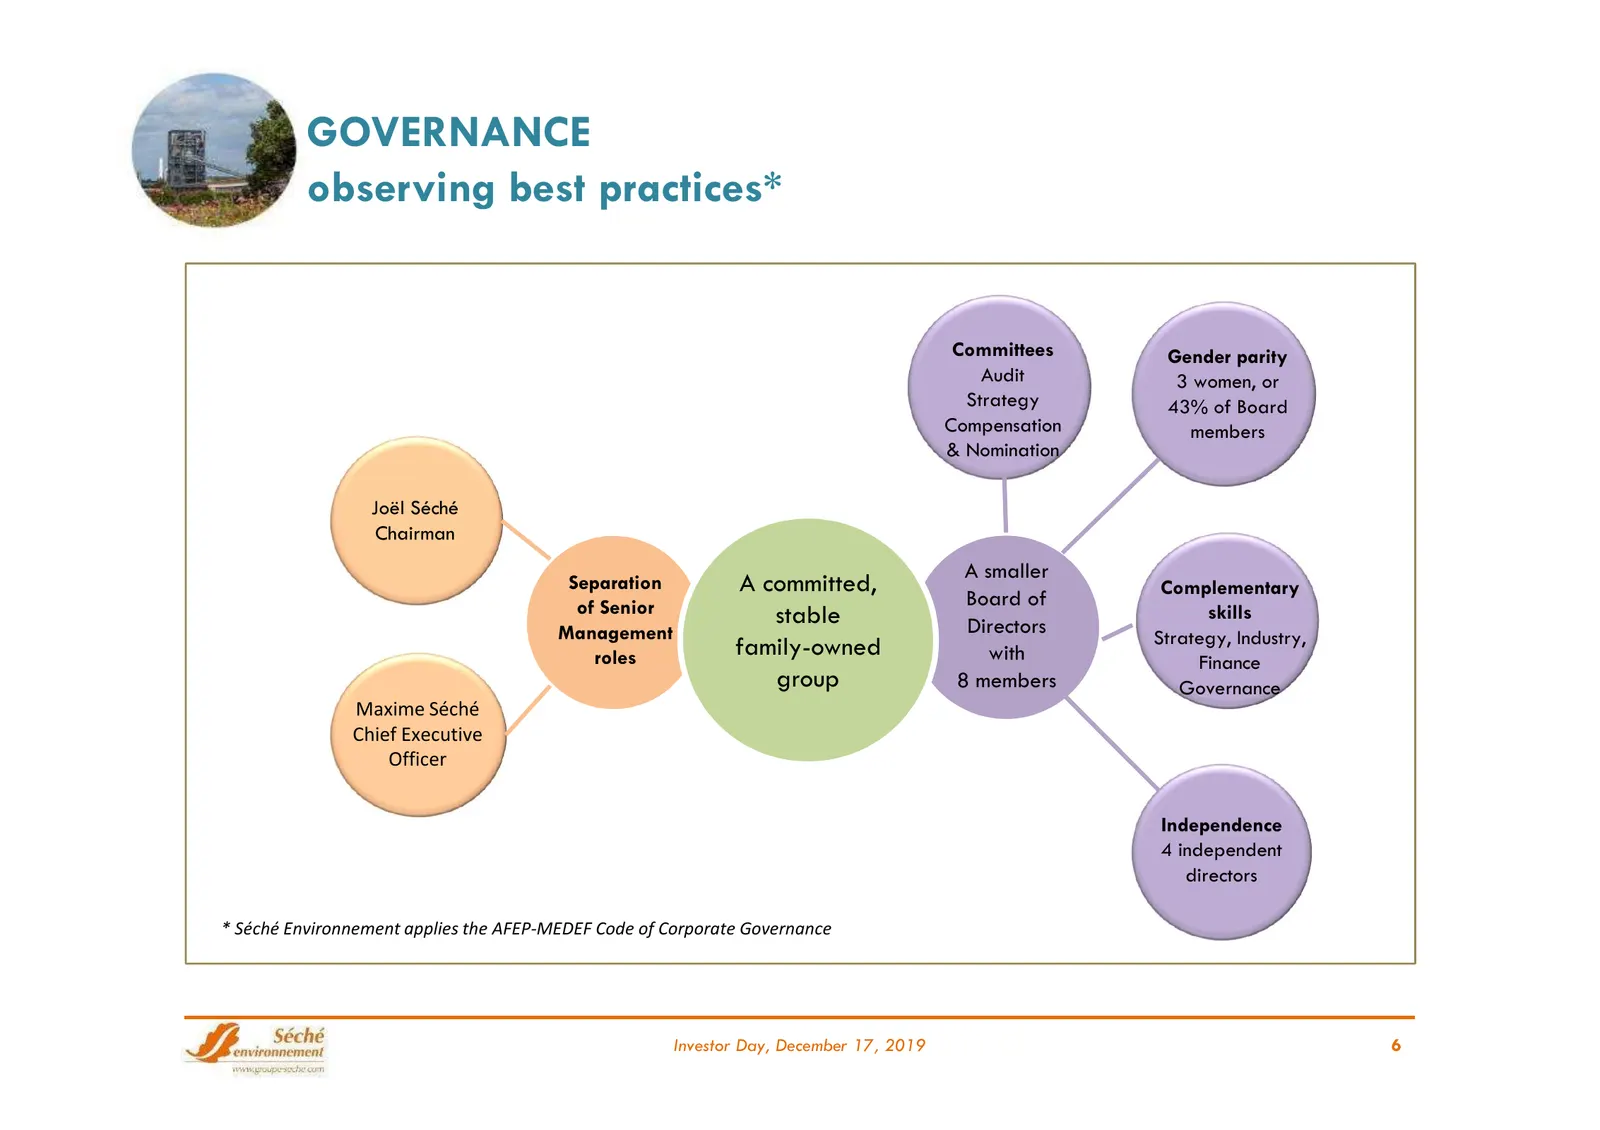
GOVERNANCE observing best practices* Committees Gender parity Audit 3 women, or Strategy 43% of Board Compensation members & Nomination Joël Séché Chairman A smaller Separation A committed, Complementary of Senior Board of stable Directors skills Management Strategy, Industry, roles family-owned wit
Slide 7: A Relevant Growth Strategy
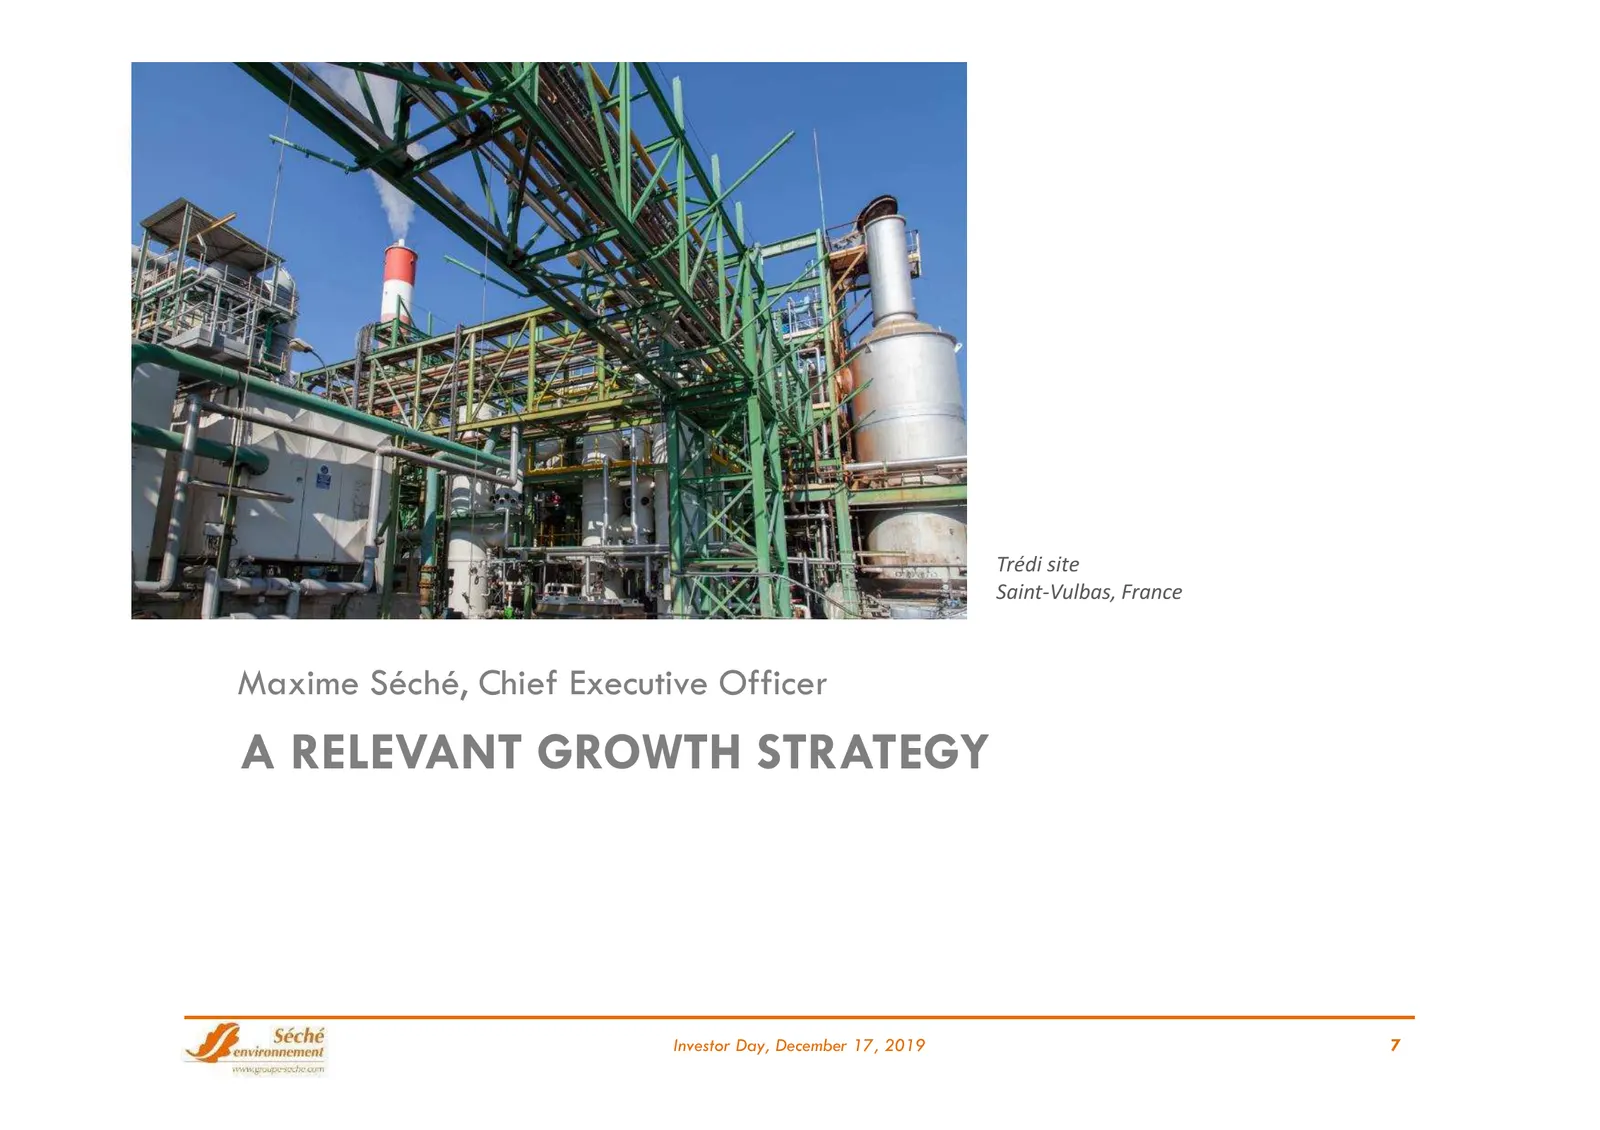
Trédi site Saint-Vulbas, France Maxime Séché, Chief Executive Officer A RELEVANT GROWTH STRATEGY Investor Day, December 17, 2019 7
Slide 8: 2018-2020 Strategic Plan: Promises Kept
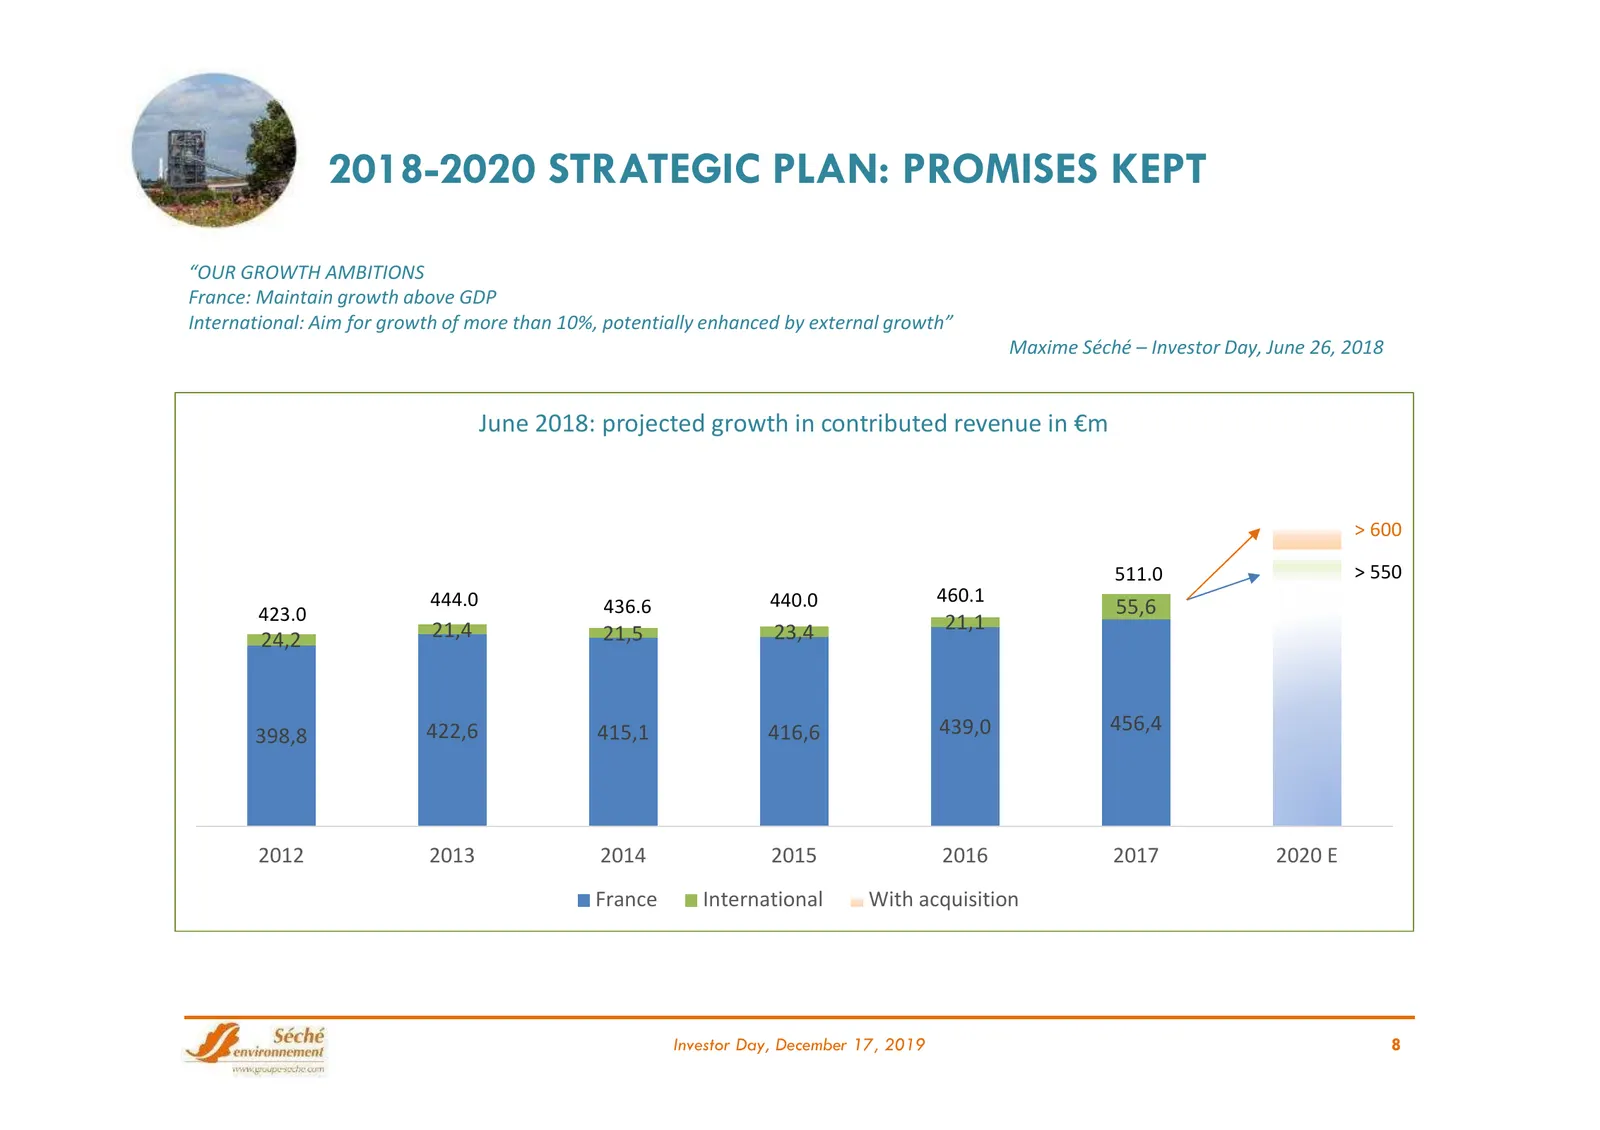
2018-2020 STRATEGIC PLAN: PROMISES KEPT “OUR GROWTH AMBITIONS France: Maintain growth above GDP International: Aim for growth of more than 10%, potentially enhanced by external growth” Maxime Séché – Investor Day, June 26, 2018 June 2018: projected growth in contributed revenue in €m > 600 511.0 > 5
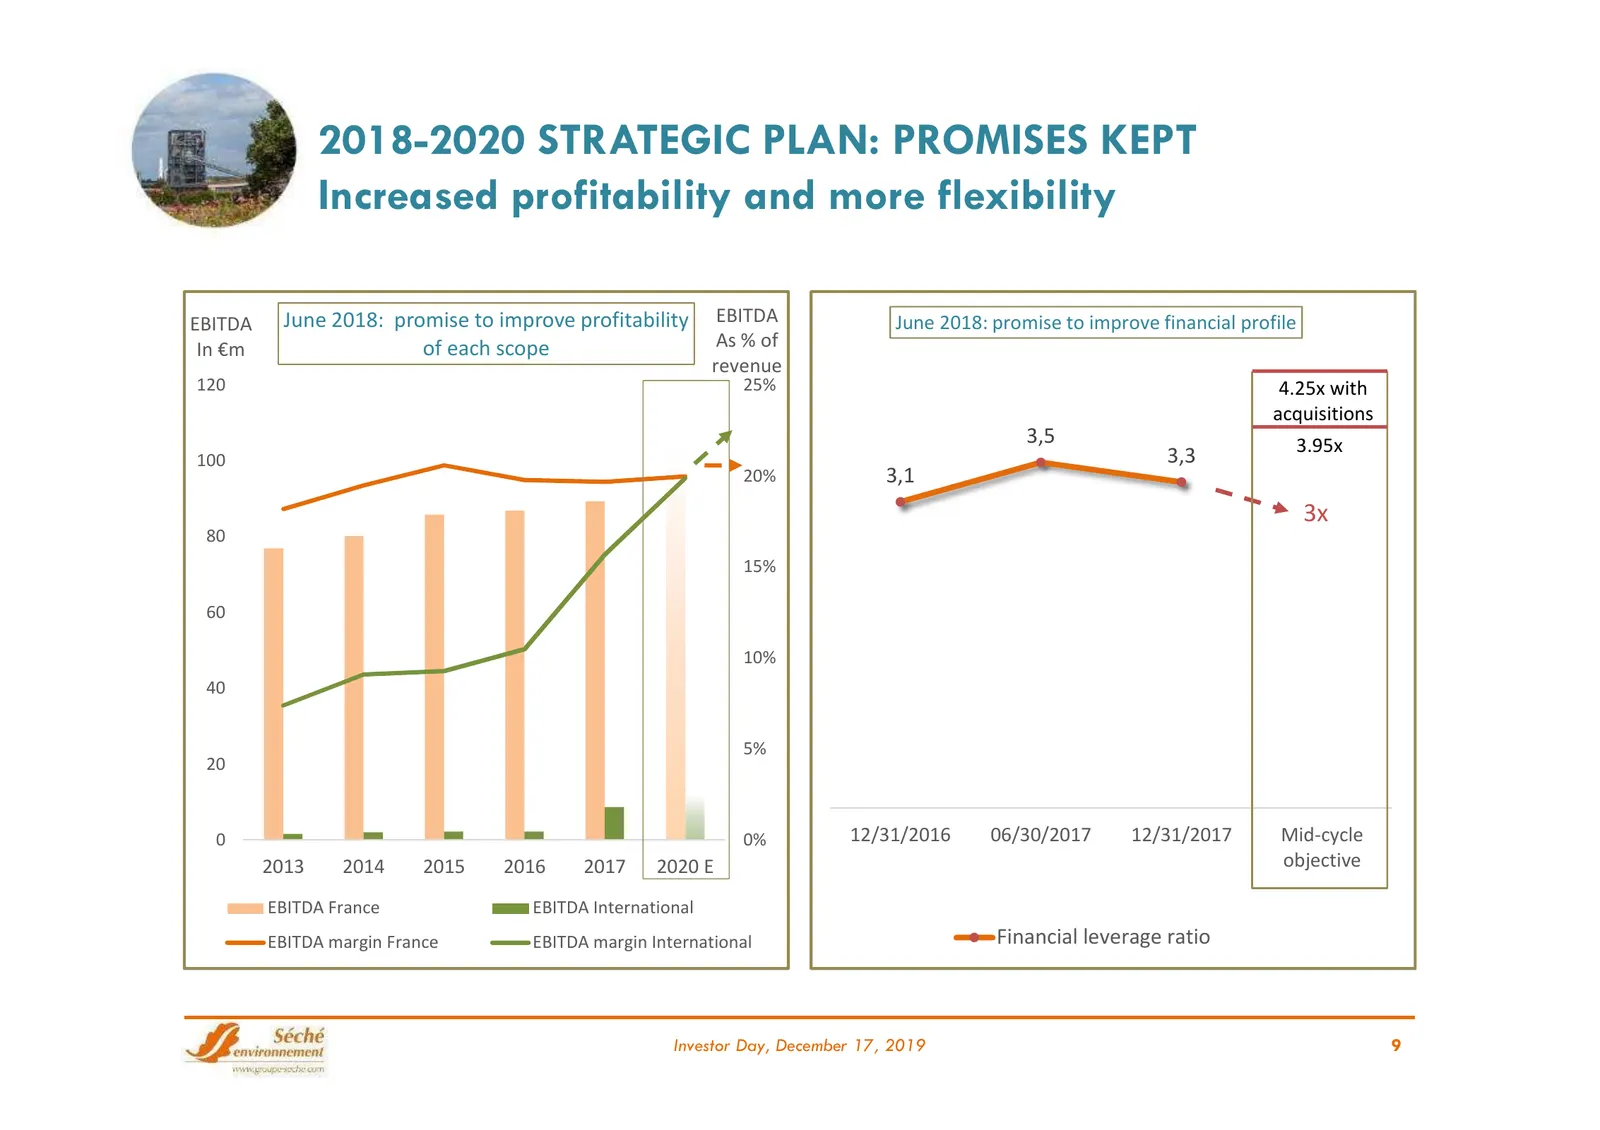
Slide 9: 2018-2020 Strategic Plan: Increased profitability and flexibility
2018-2020 STRATEGIC PLAN: PROMISES KEPT Increased profitability and more flexibility EBITDA June 2018: promise to improve profitability EBITDA June 2018: promise to improve financial profile In €m of each scope As % of revenue 120 25% 4.25x with acquisitions 3,5 3.95x 100 3,3 20% 3,1 3x 80 15% 60 10
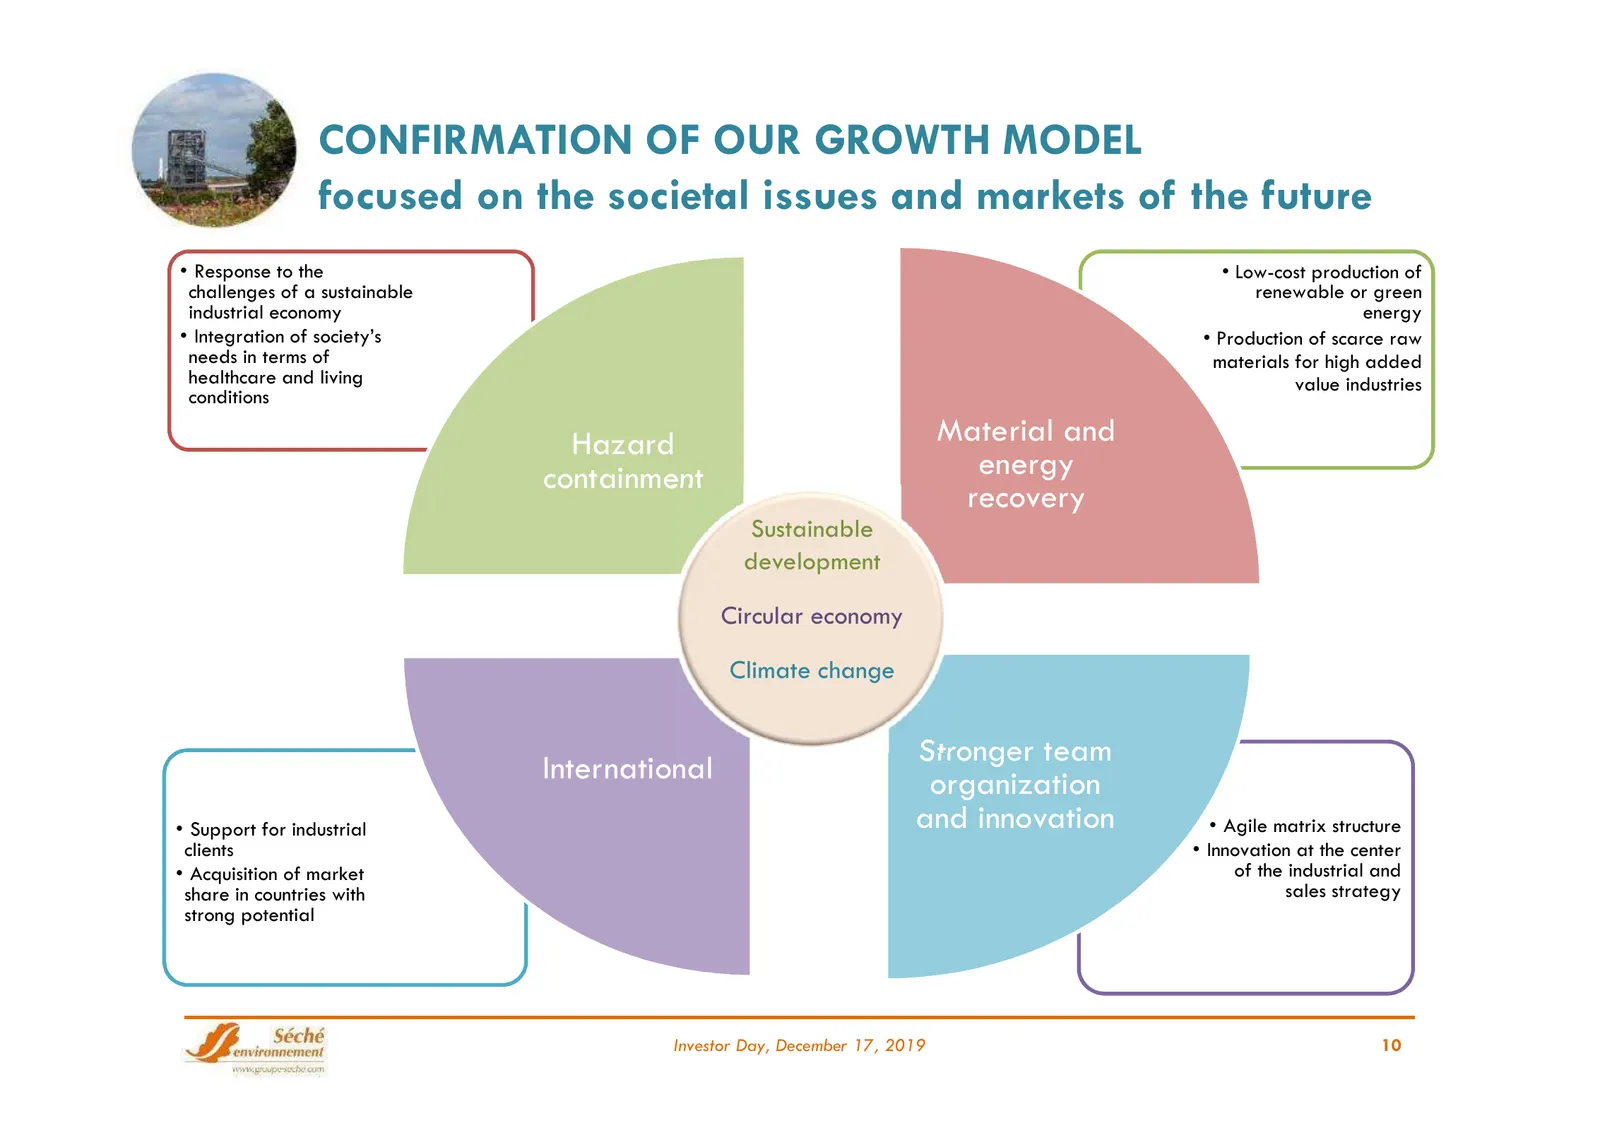
Slide 10: Confirmation of our growth model
CONFIRMATION OF OUR GROWTH MODEL focused on the societal issues and markets of the future • Response to the • Low-cost production of challenges of a sustainable renewable or green industrial economy energy • Integration of society’s • Production of scarce raw needs in terms of materials for high add
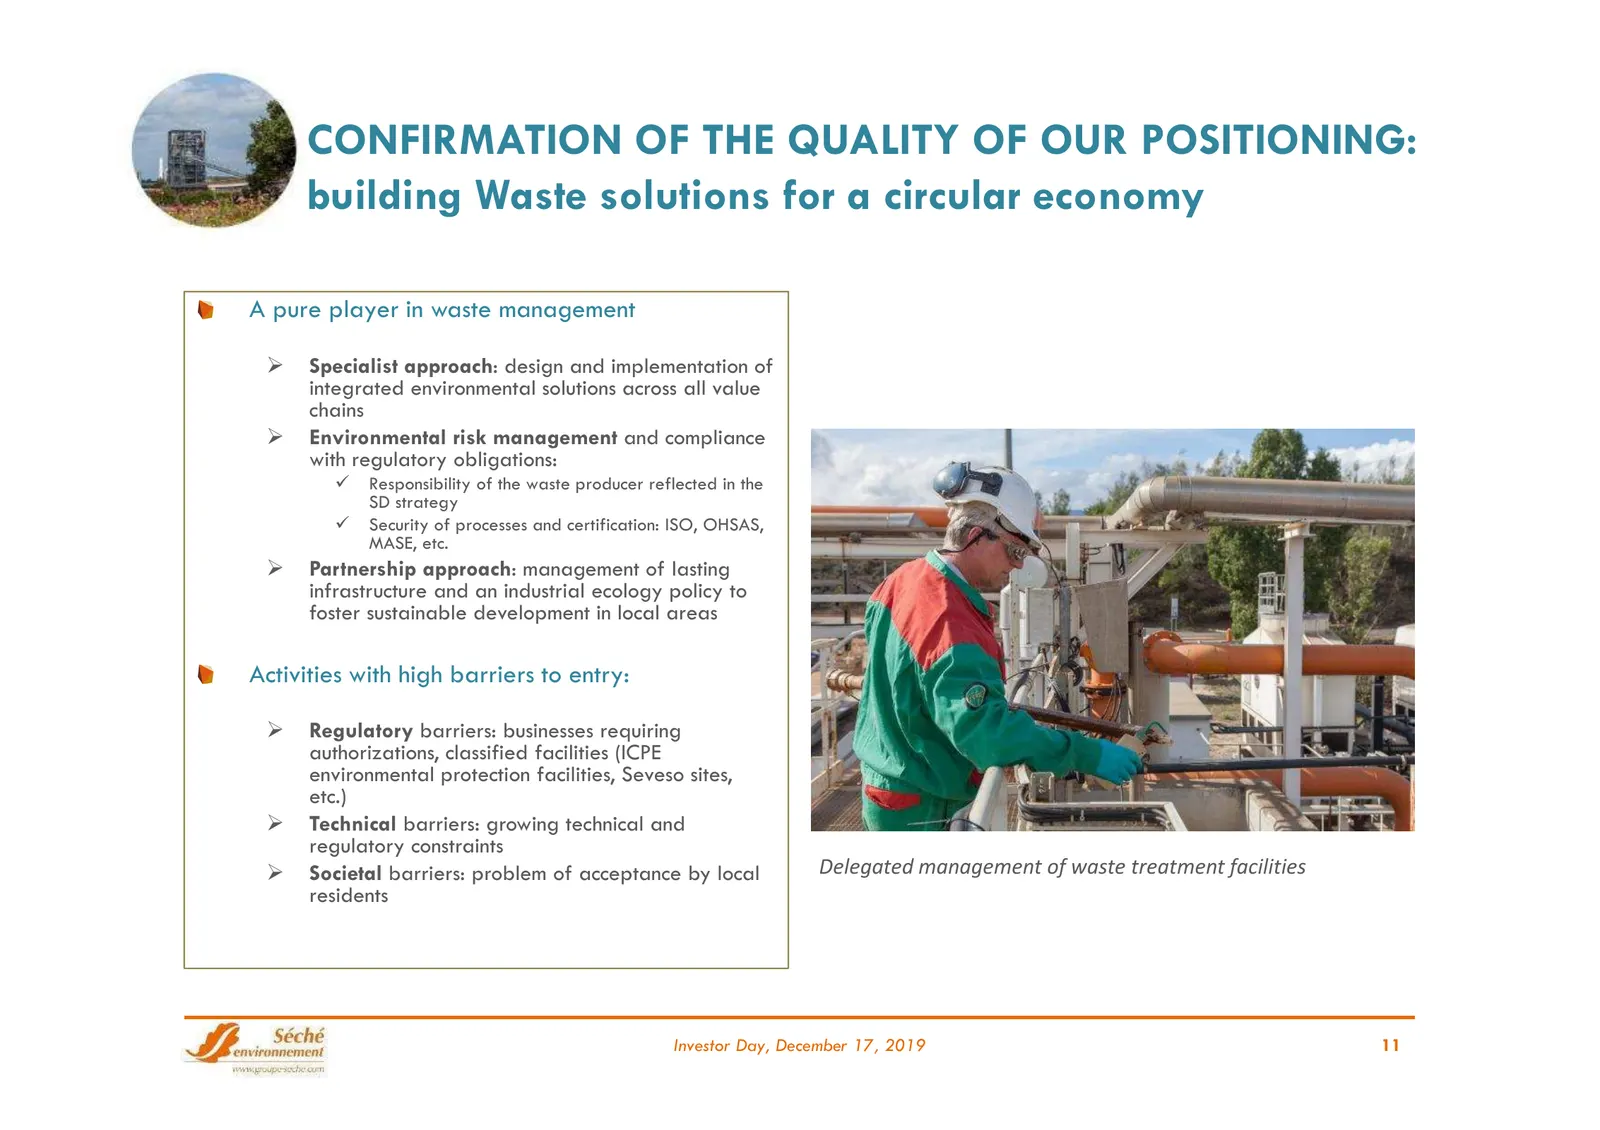
Slide 11: Confirmation of the quality of our positioning
CONFIRMATION OF THE QUALITY OF OUR POSITIONING: building Waste solutions for a circular economy A pure player in waste management Specialist approach: design and implementation of integrated environmental solutions across all value chains Environmental risk management and compliance with regulat
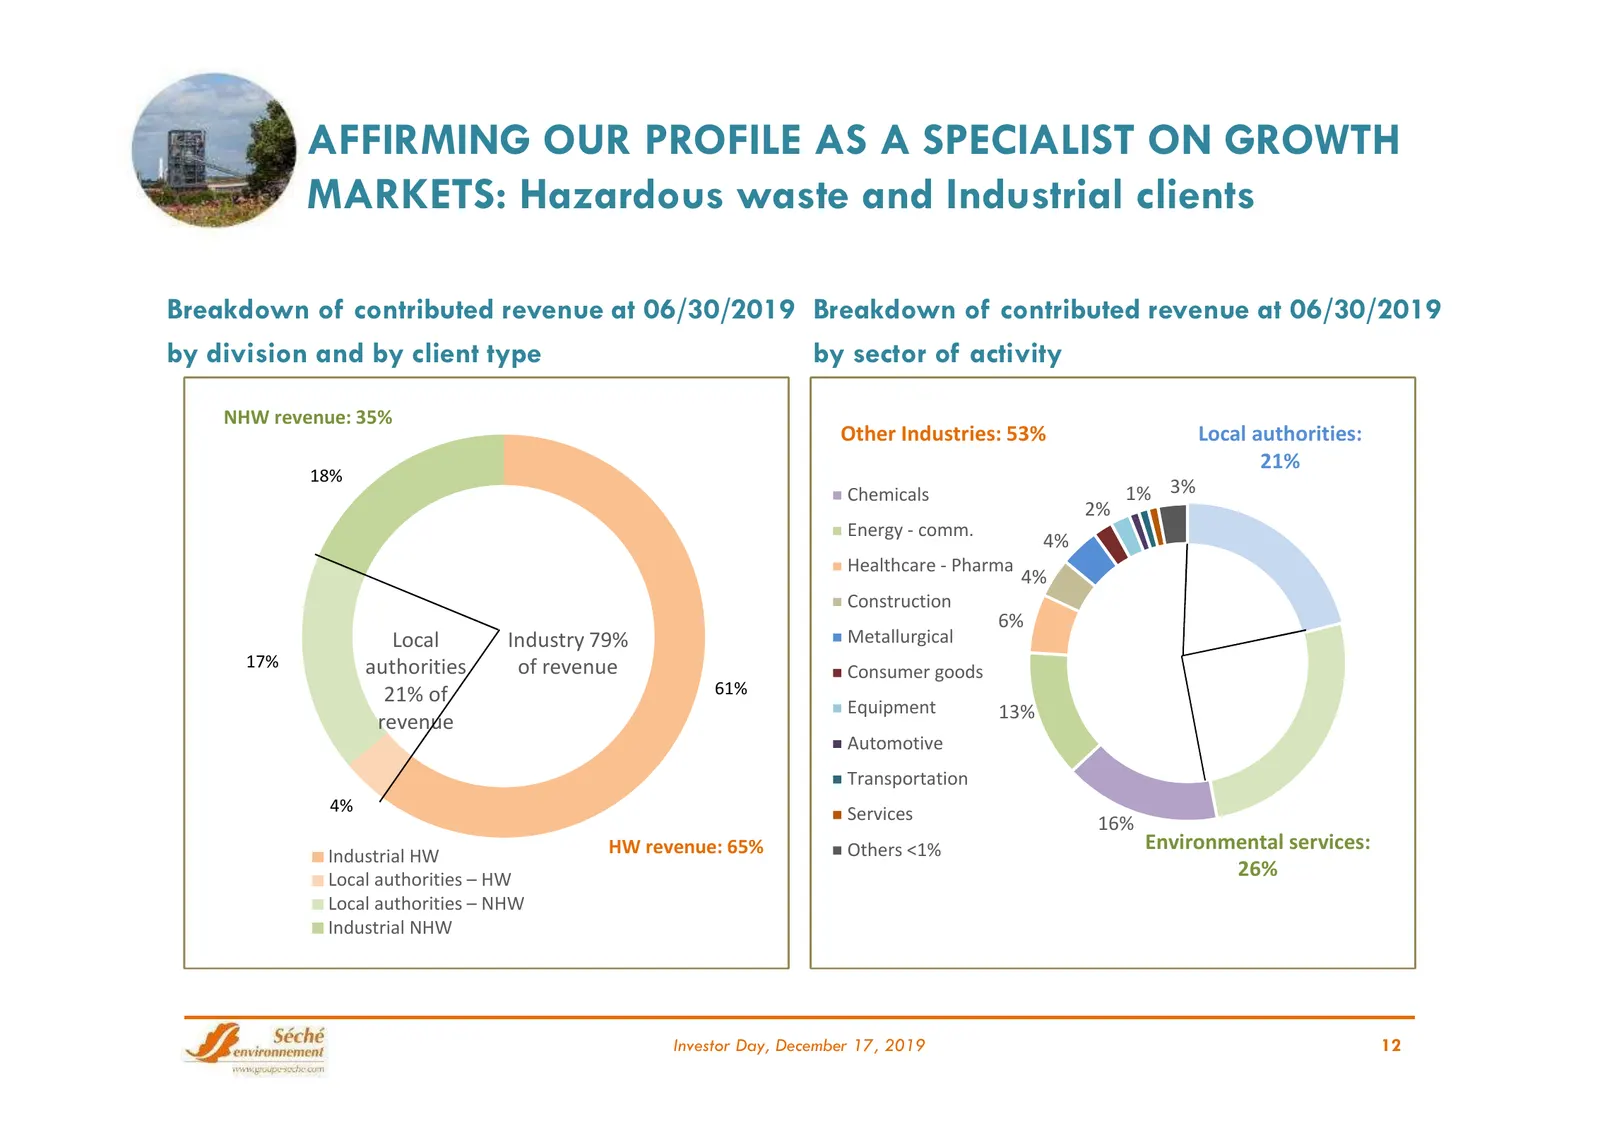
Slide 12: Specialist on growth markets: hazardous waste and industrial clients
AFFIRMING OUR PROFILE AS A SPECIALIST ON GROWTH MARKETS: Hazardous waste and Industrial clients Breakdown of contributed revenue at 06/30/2019 Breakdown of contributed revenue at 06/30/2019 by division and by client type by sector of activity NHW revenue: 35% Other Industries: 53% Local authorities:
Slide 13: Focus: Specialization in chemicals and technical waste recovery
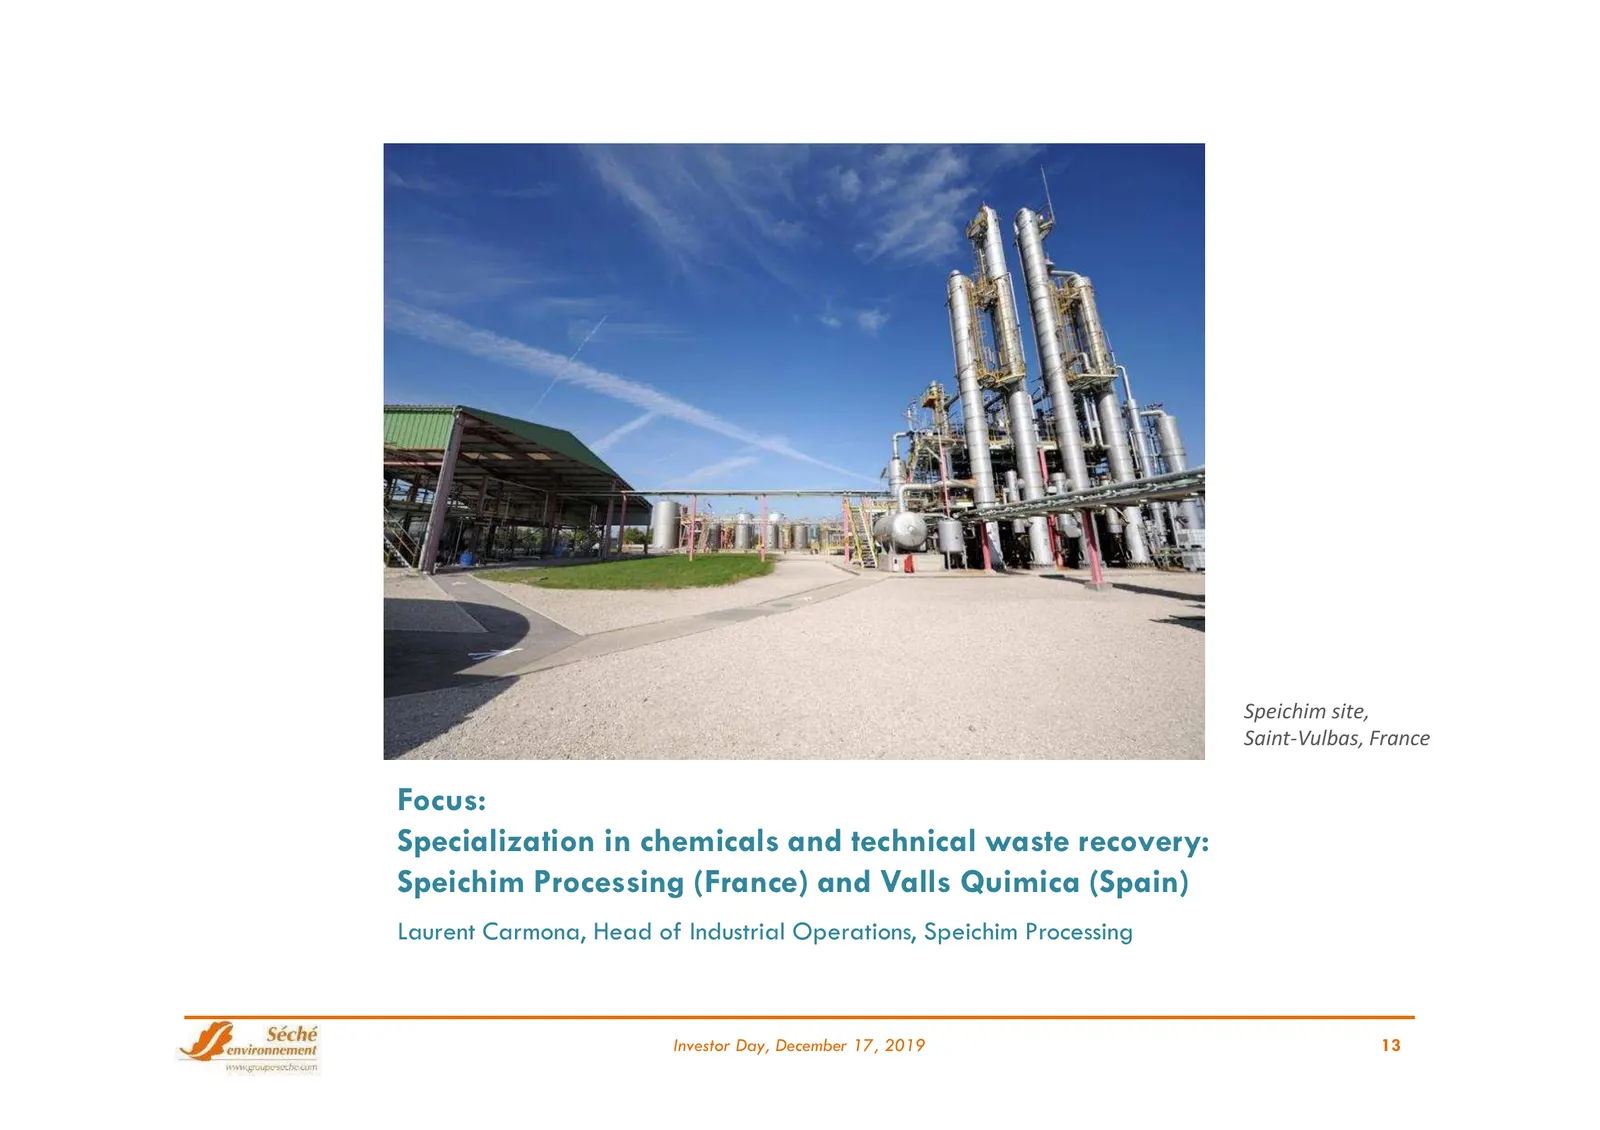
Speichim site, Saint-Vulbas, France Focus: Specialization in chemicals and technical waste recovery: Speichim Processing (France) and Valls Quimica (Spain) Laurent Carmona, Head of Industrial Operations, Speichim Processing Investor Day, December 17, 2019 13
Slide 14: Chemical Waste Recovery at Séché Environnement group
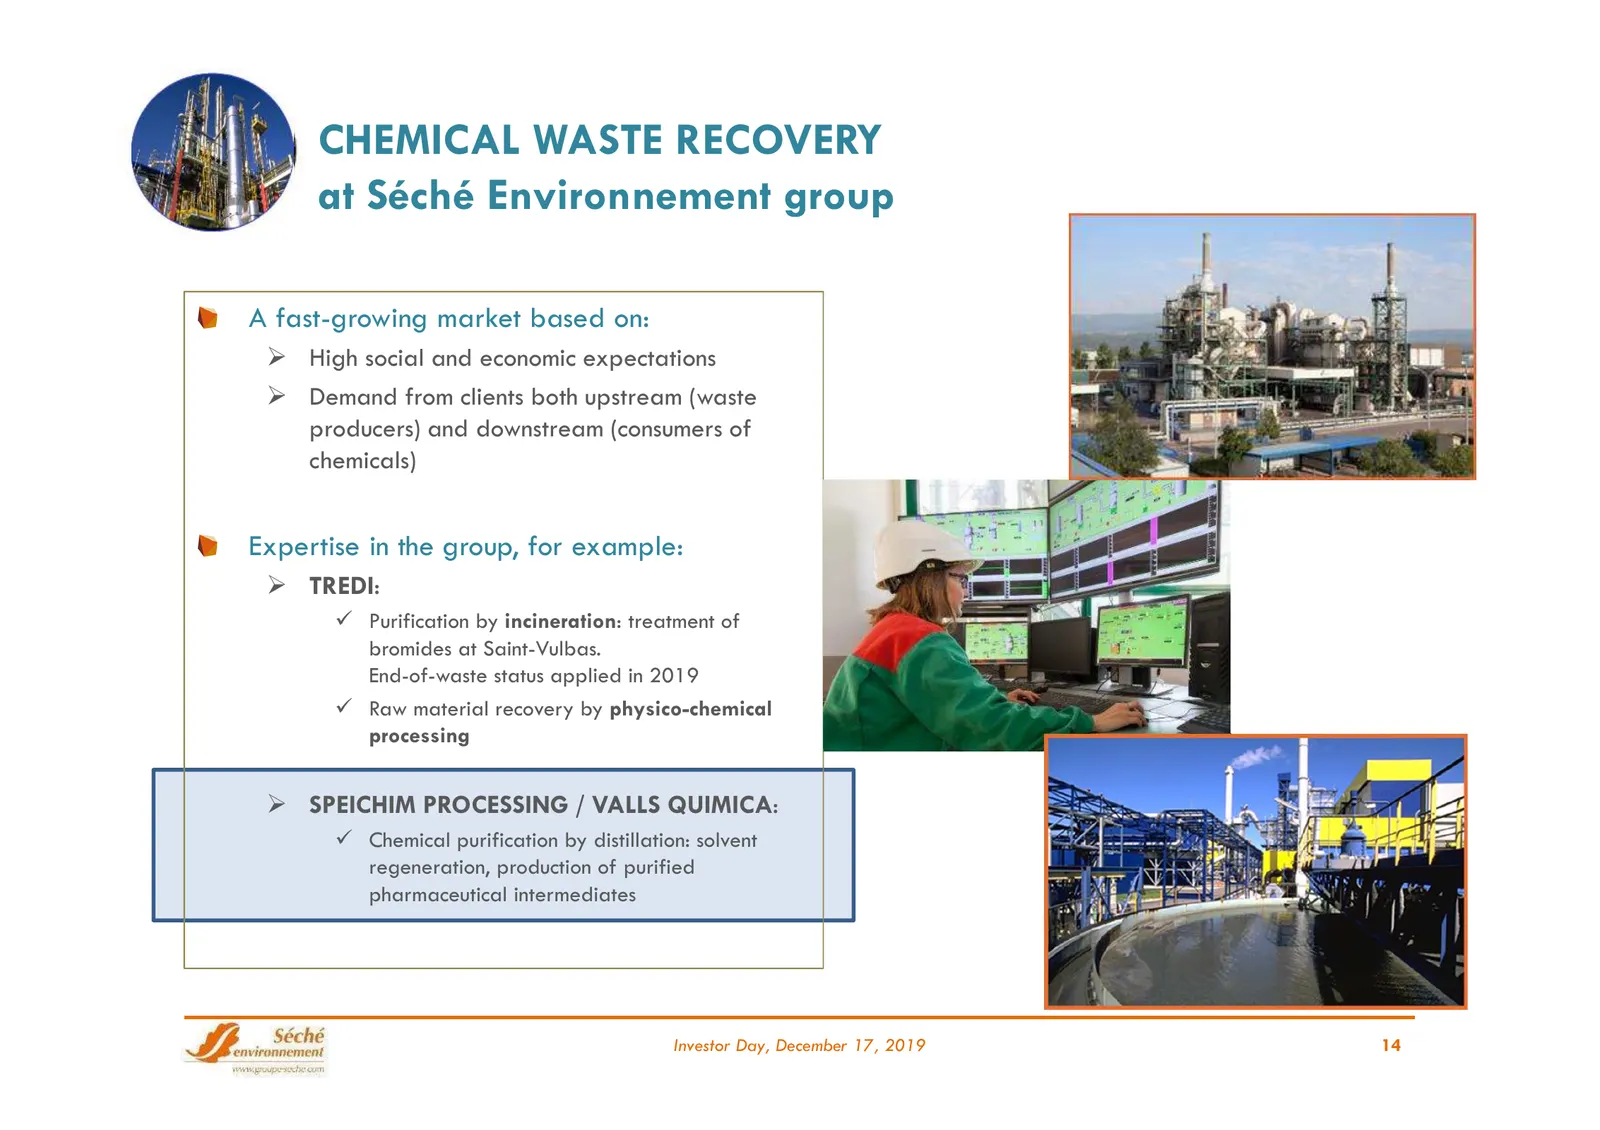
CHEMICAL WASTE RECOVERY at Séché Environnement group A fast-growing market based on: High social and economic expectations Demand from clients both upstream (waste producers) and downstream (consumers of chemicals) Expertise in the group, for example: TREDI: Purification by incineration: tre
Slide 15: Speichim Processing and Valls Quimica: purification by distillation
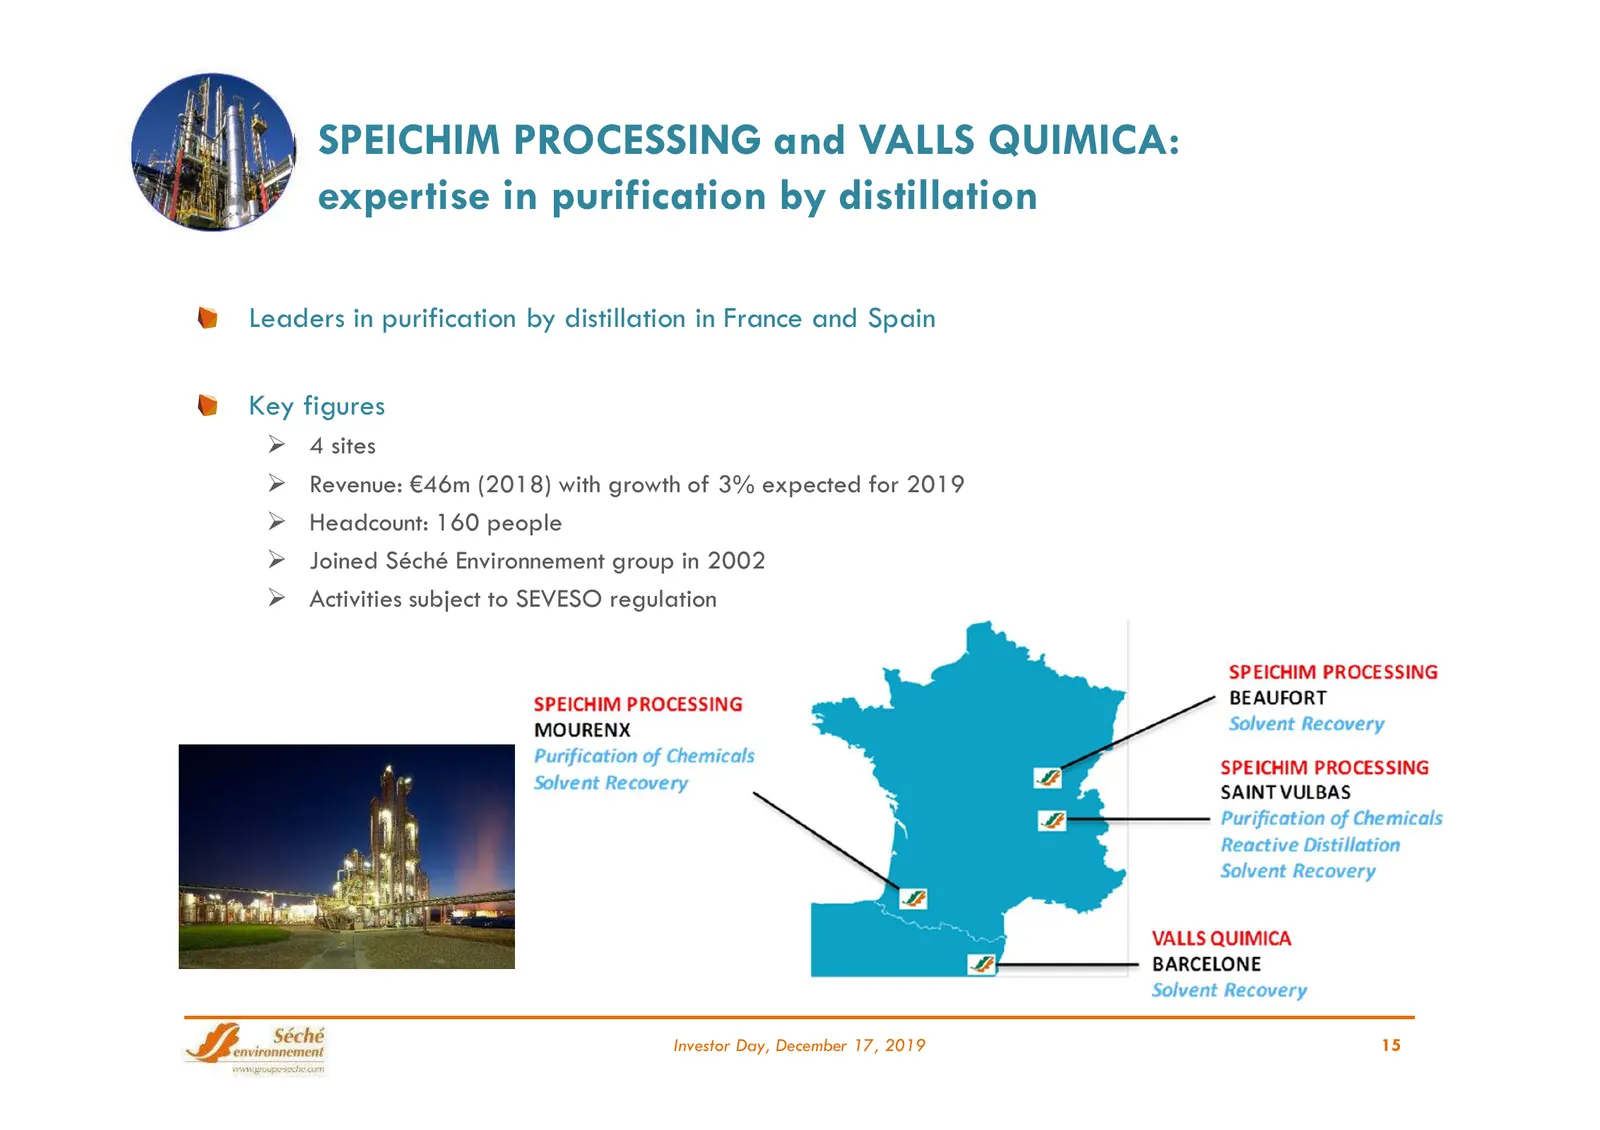
SPEICHIM PROCESSING and VALLS QUIMICA: expertise in purification by distillation Leaders in purification by distillation in France and Spain Key figures 4 sites Revenue: €46m (2018) with growth of 3% expected for 2019 Headcount: 160 people Joined Séché Environnement group in 2002 Activitie
Slide 16: Company History: from engineering to production
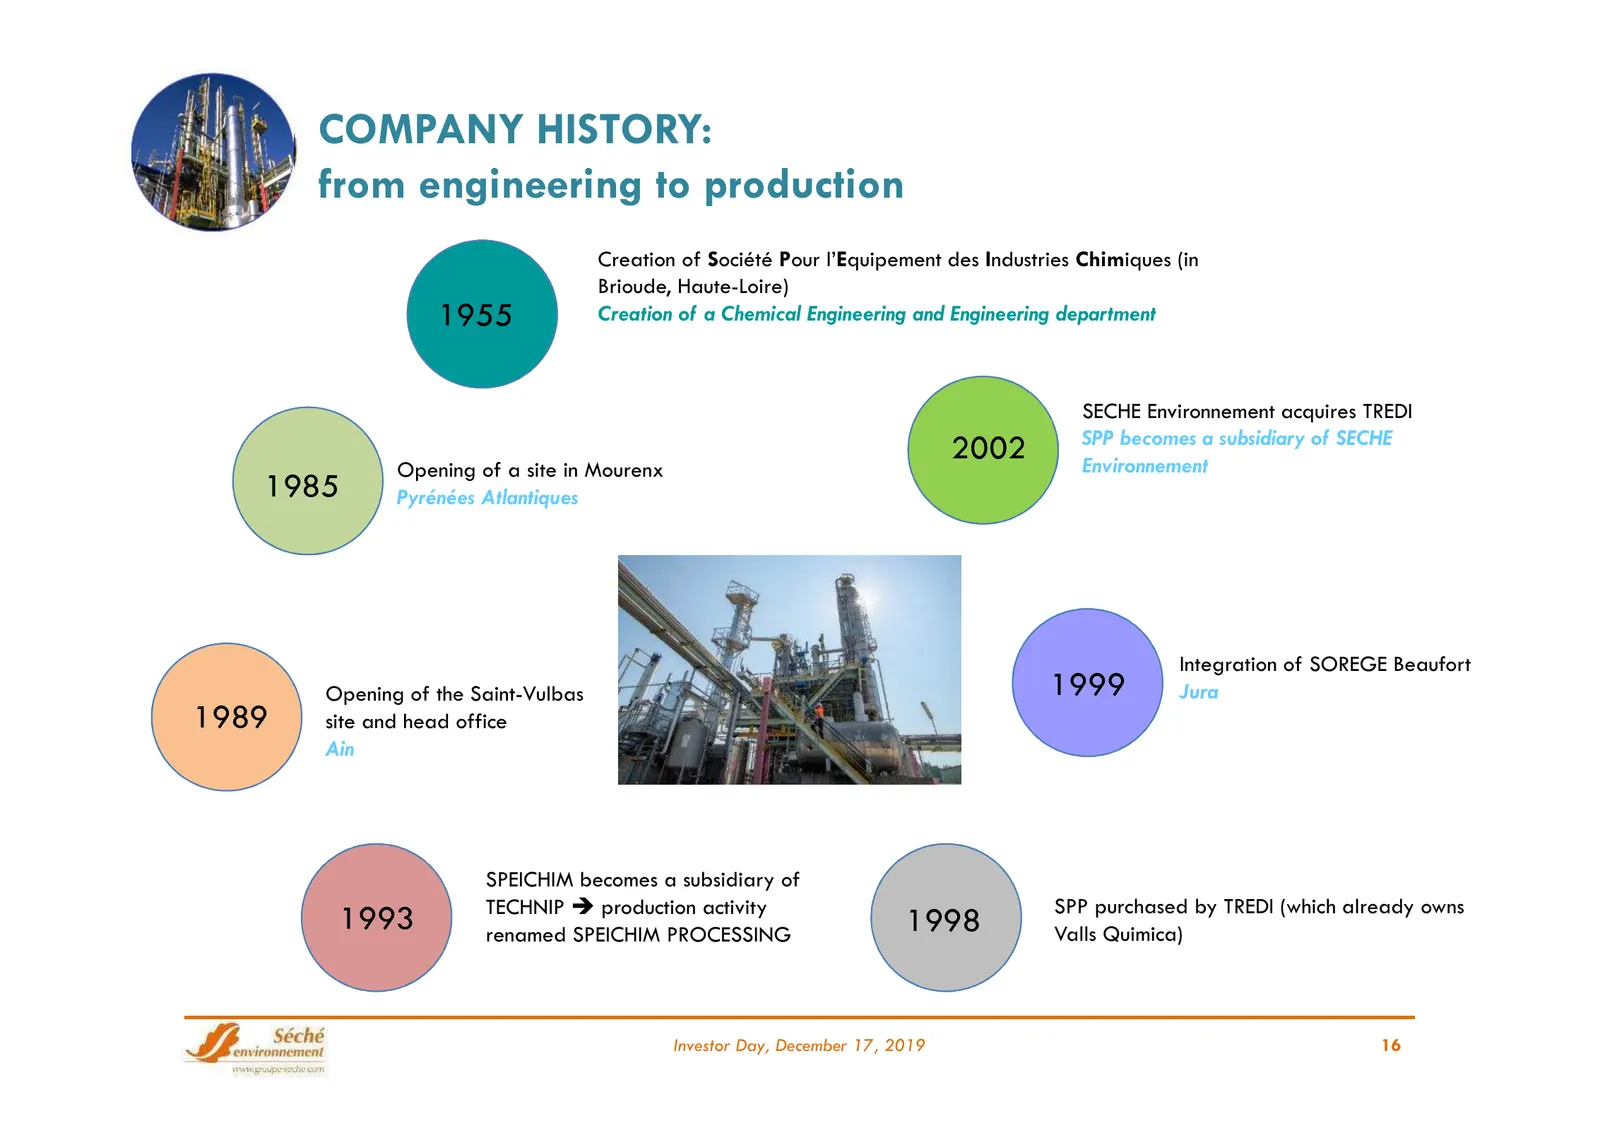
COMPANY HISTORY: from engineering to production Creation of Société Pour l’Equipement des Industries Chimiques (in Brioude, Haute-Loire) 1955 Creation of a Chemical Engineering and Engineering department SECHE Environnement acquires TREDI SPP becomes a subsidiary of SECHE 2002 Environnement Opening
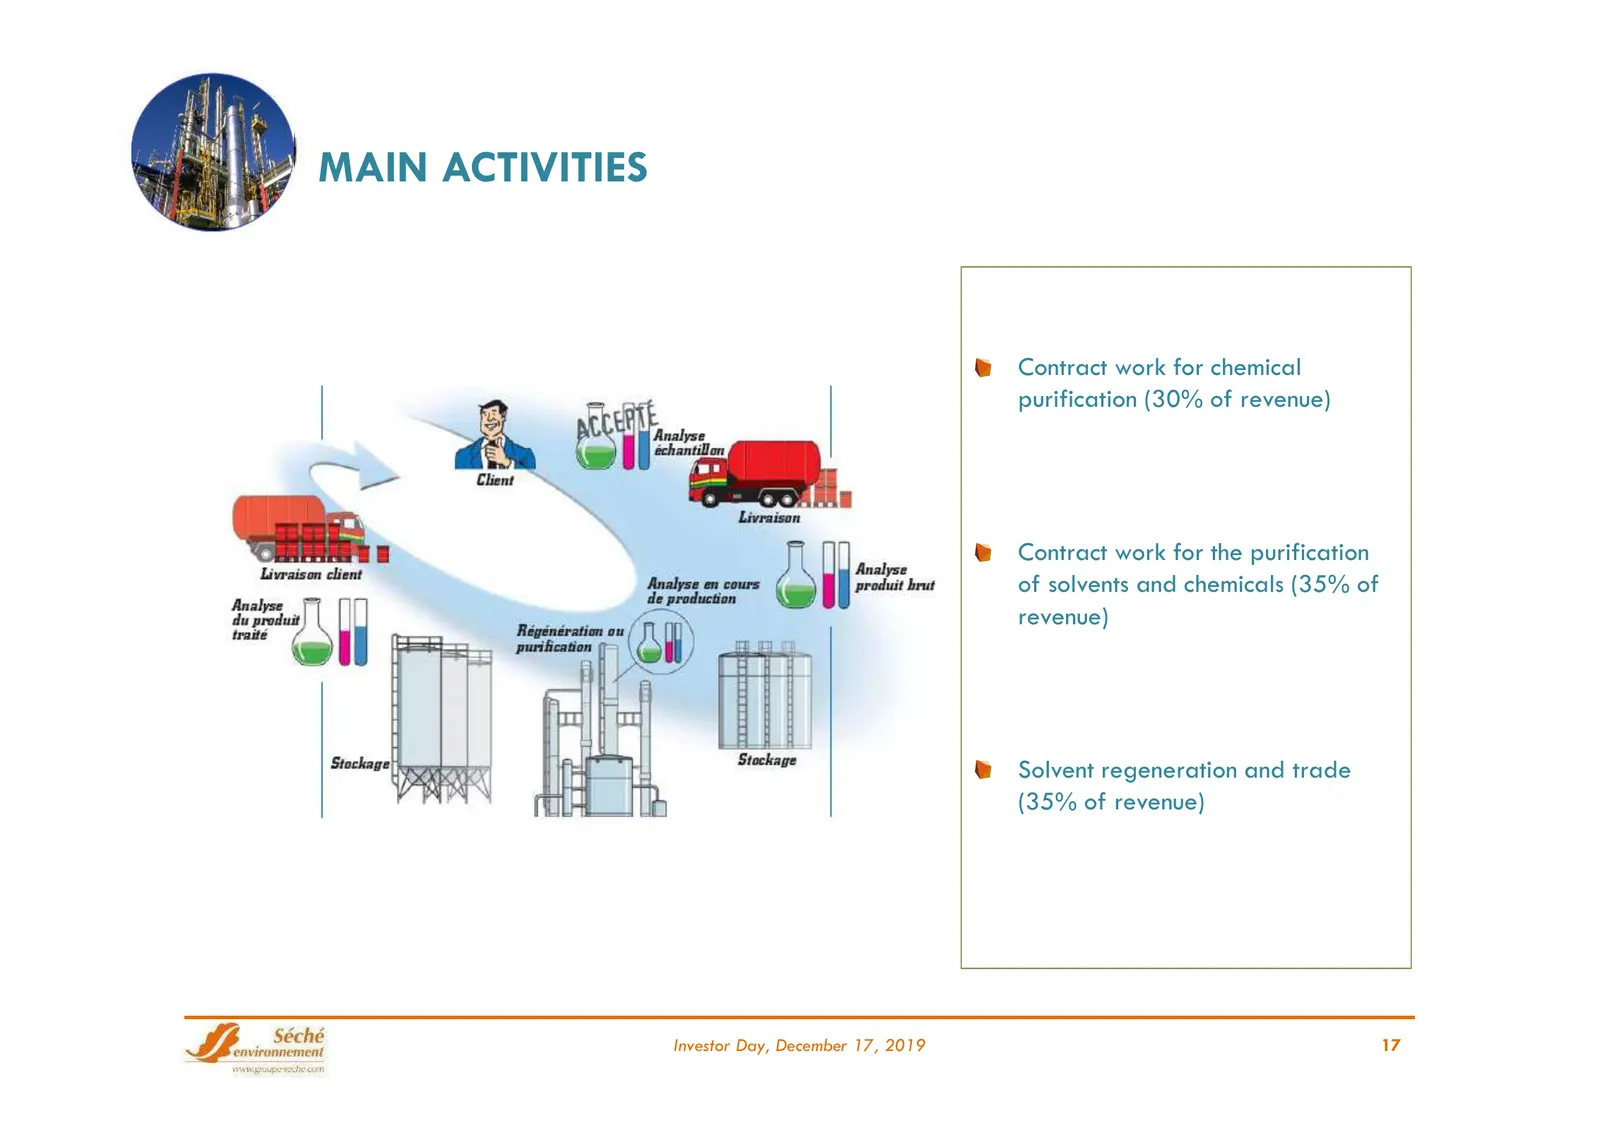
Slide 17: Main Activities
MAIN ACTIVITIES Contract work for chemical purification (30% of revenue) Contract work for the purification of solvents and chemicals (35% of revenue) Solvent regeneration and trade (35% of revenue) Investor Day, December 17, 2019 17
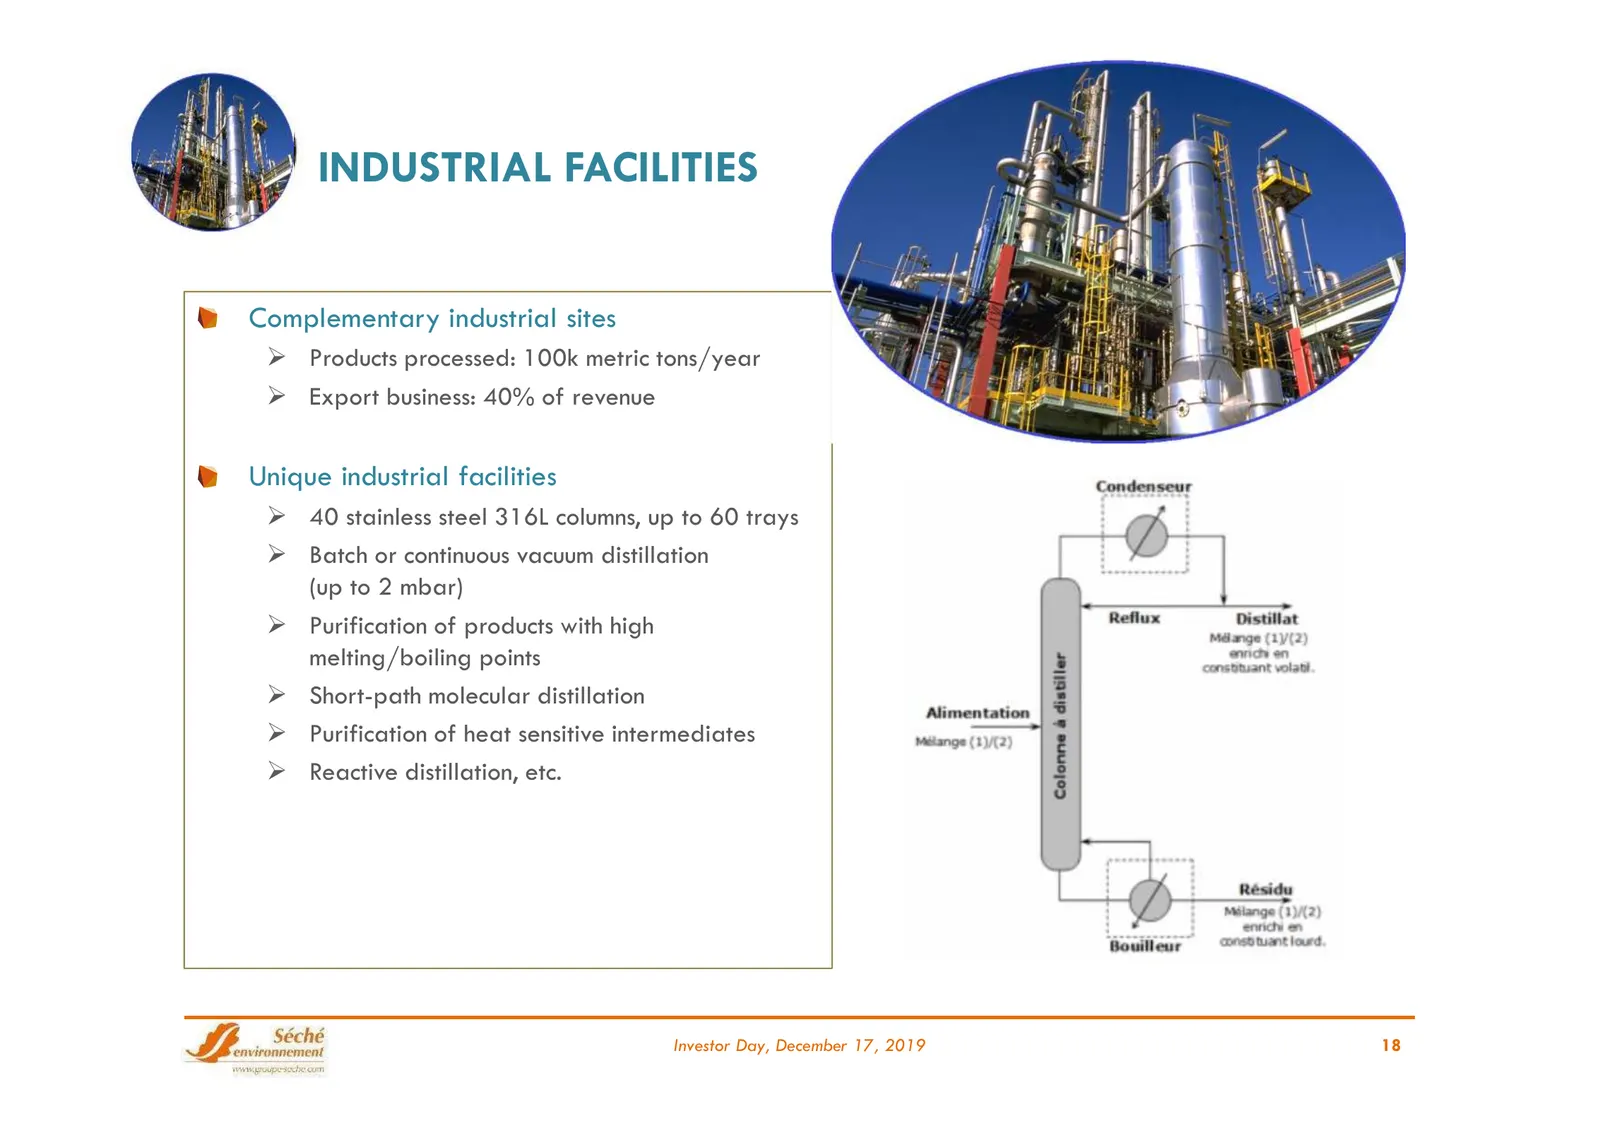
Slide 18: Industrial Facilities
INDUSTRIAL FACILITIES Complementary industrial sites Products processed: 100k metric tons/year Export business: 40% of revenue Unique industrial facilities 40 stainless steel 316L columns, up to 60 trays Batch or continuous vacuum distillation (up to 2 mbar) Purification of products with h
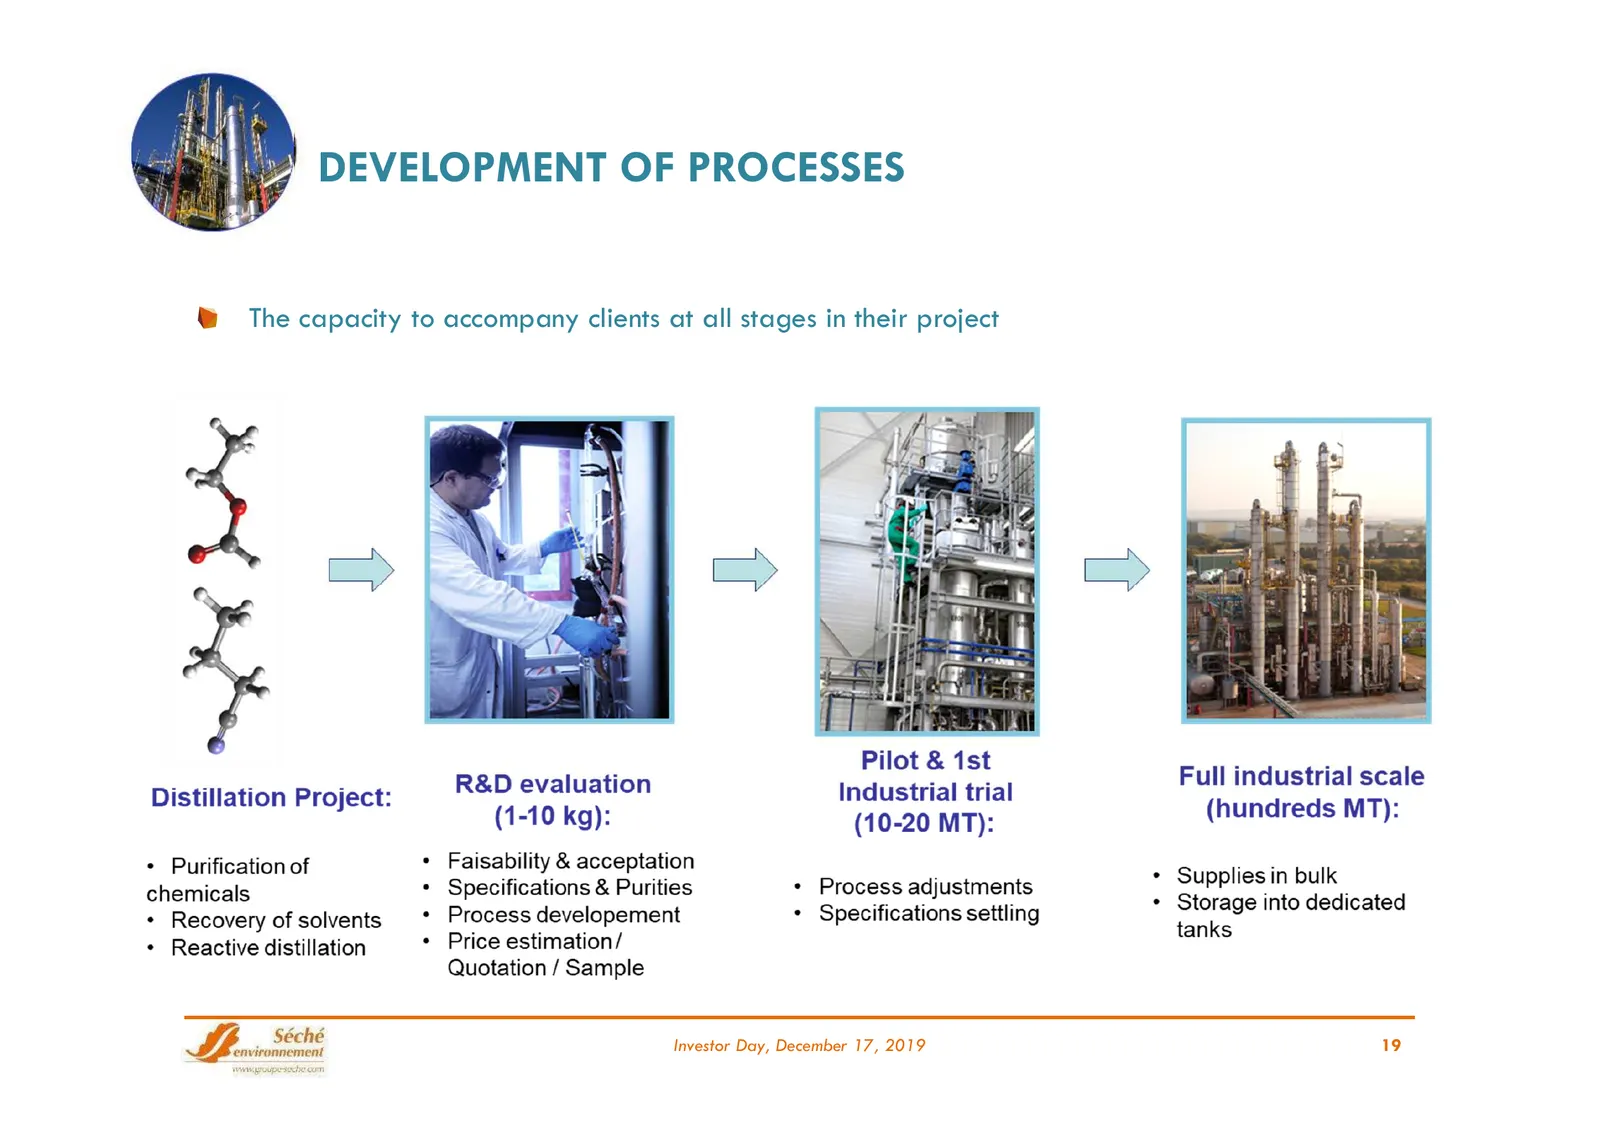
Slide 19: Development of Processes
DEVELOPMENT OF PROCESSES The capacity to accompany clients at all stages in their project Investor Day, December 17, 2019 19
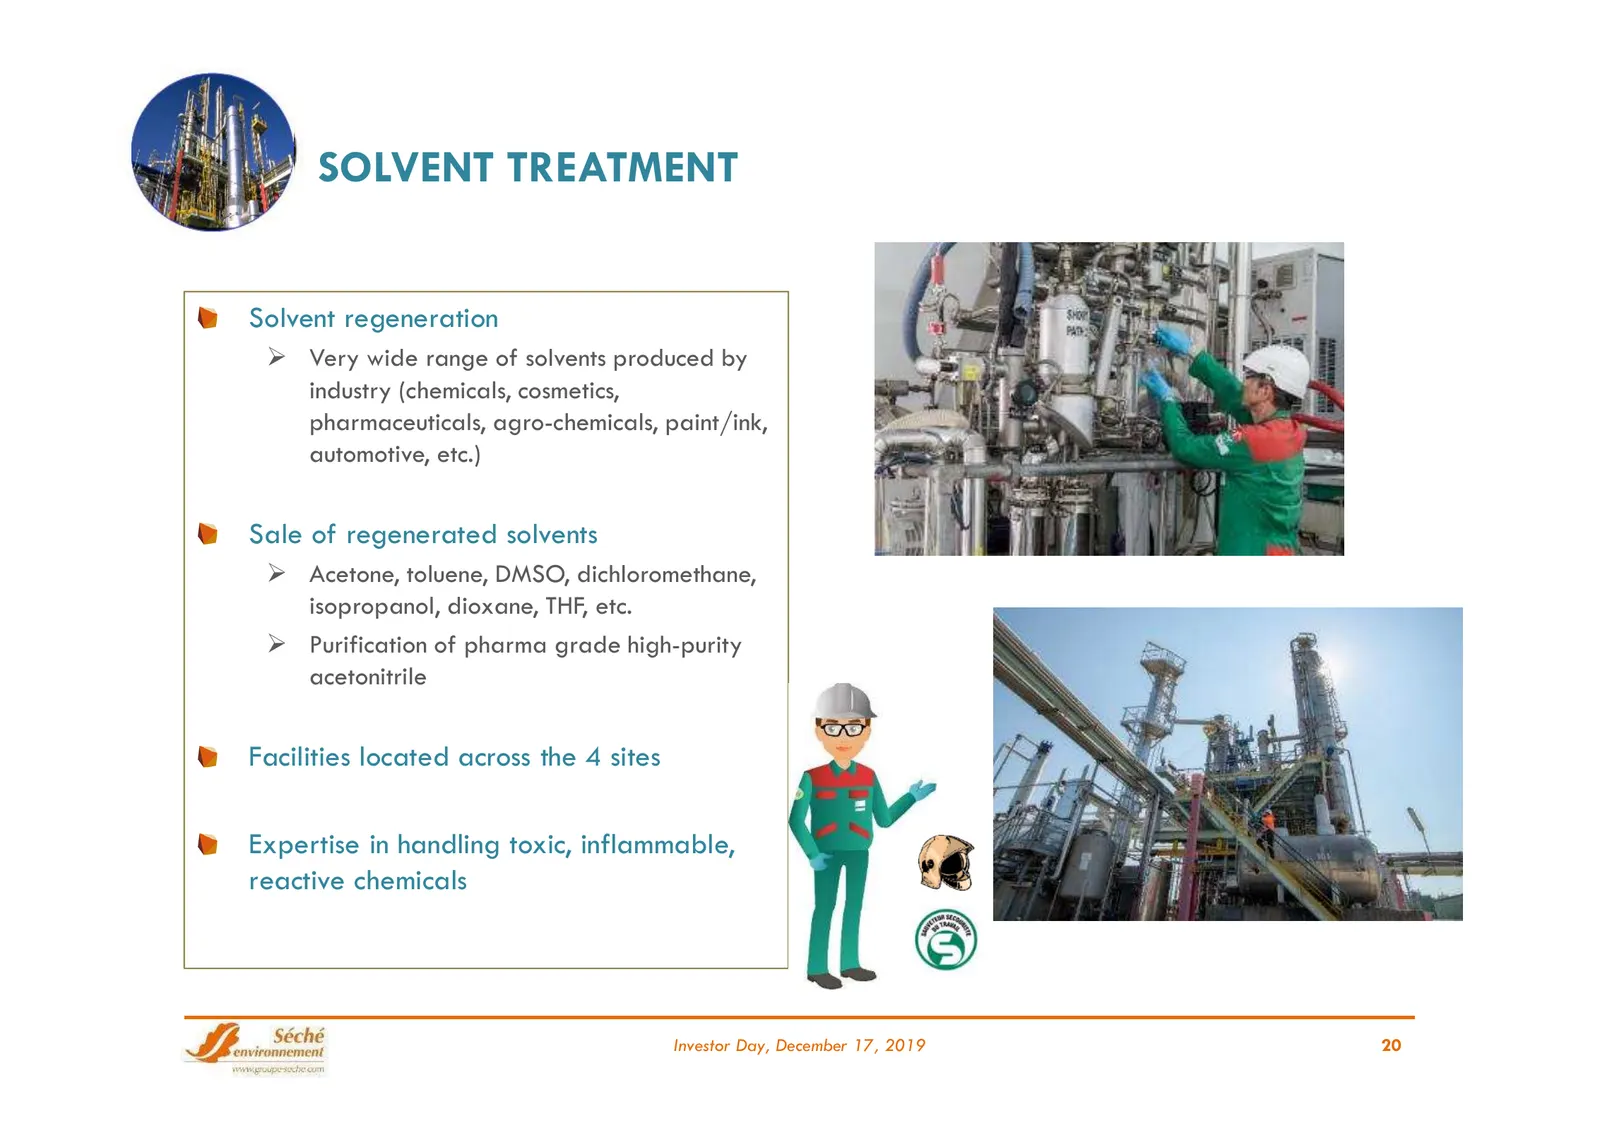
Slide 20: Solvent Treatment
SOLVENT TREATMENT Solvent regeneration Very wide range of solvents produced by industry (chemicals, cosmetics, pharmaceuticals, agro-chemicals, paint/ink, automotive, etc.) Sale of regenerated solvents Acetone, toluene, DMSO, dichloromethane, isopropanol, dioxane, THF, etc. Purification of pha
Slide 21: Chemical Purification
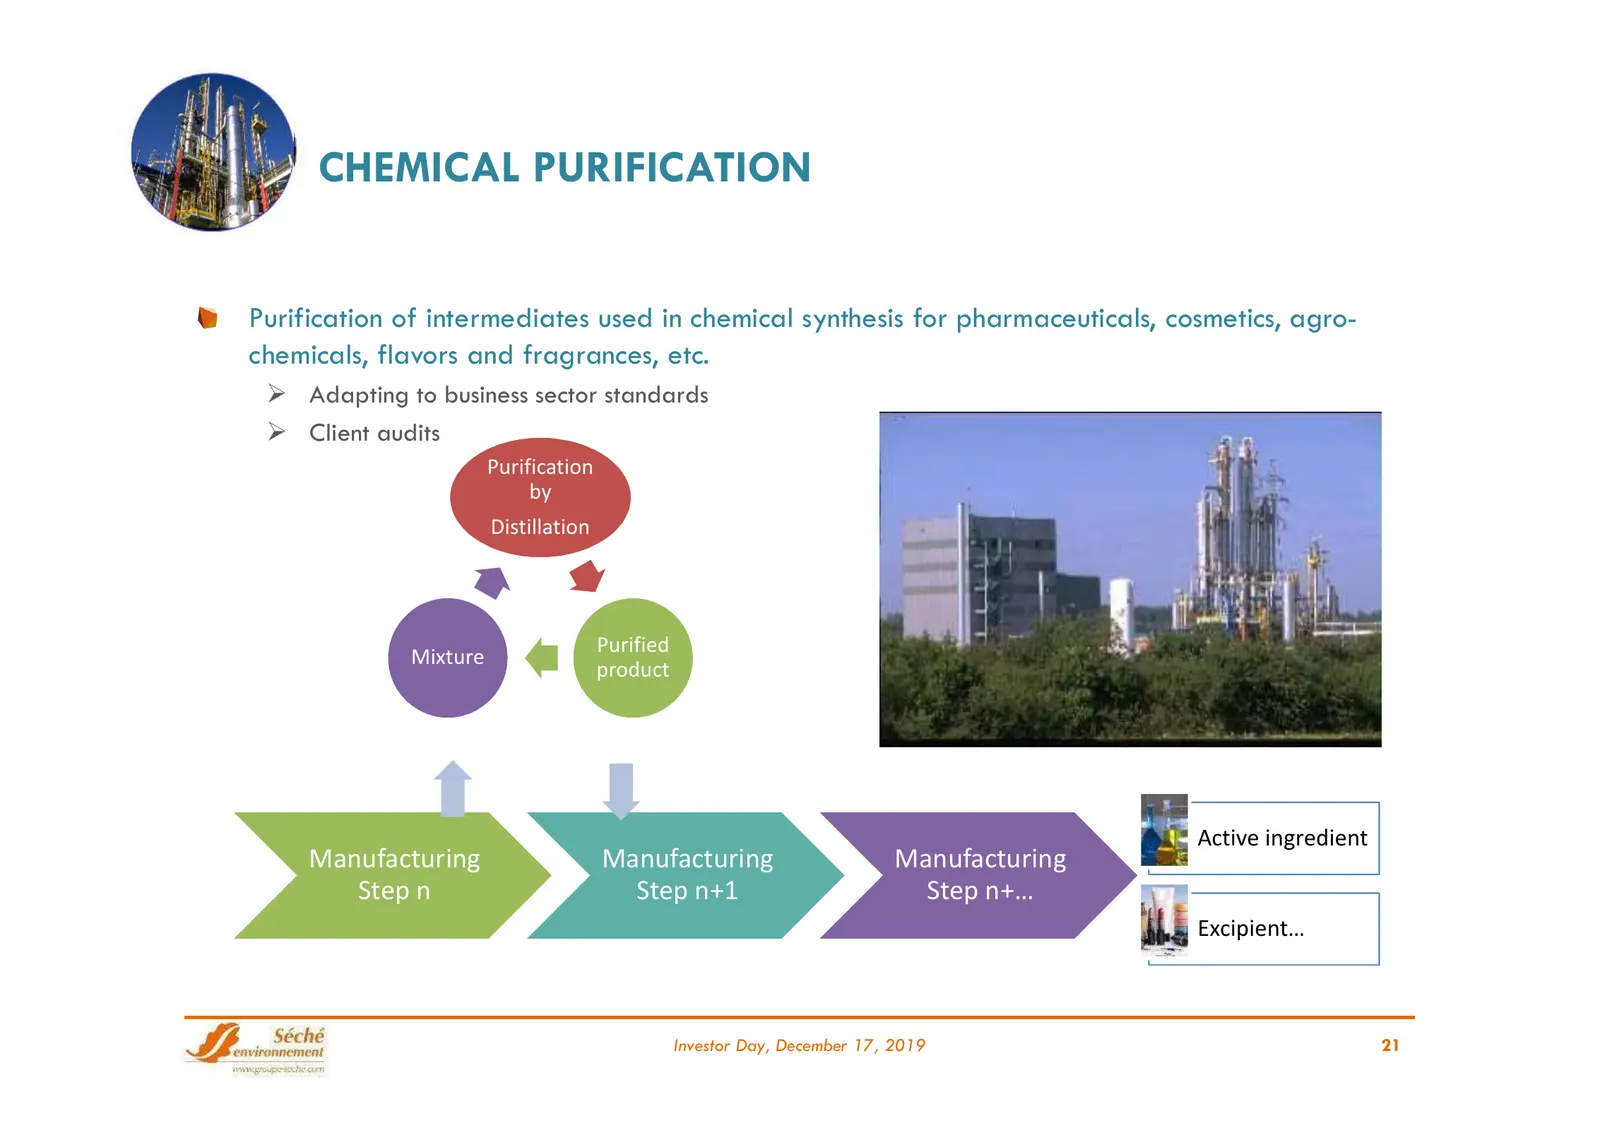
CHEMICAL PURIFICATION Purification of intermediates used in chemical synthesis for pharmaceuticals, cosmetics, agro- chemicals, flavors and fragrances, etc. Adapting to business sector standards Client audits Purification by Distillation Purified Mixture product Active ingredient Manufacturing M
Slide 22: Types of Clients: A Diverse Client Portfolio
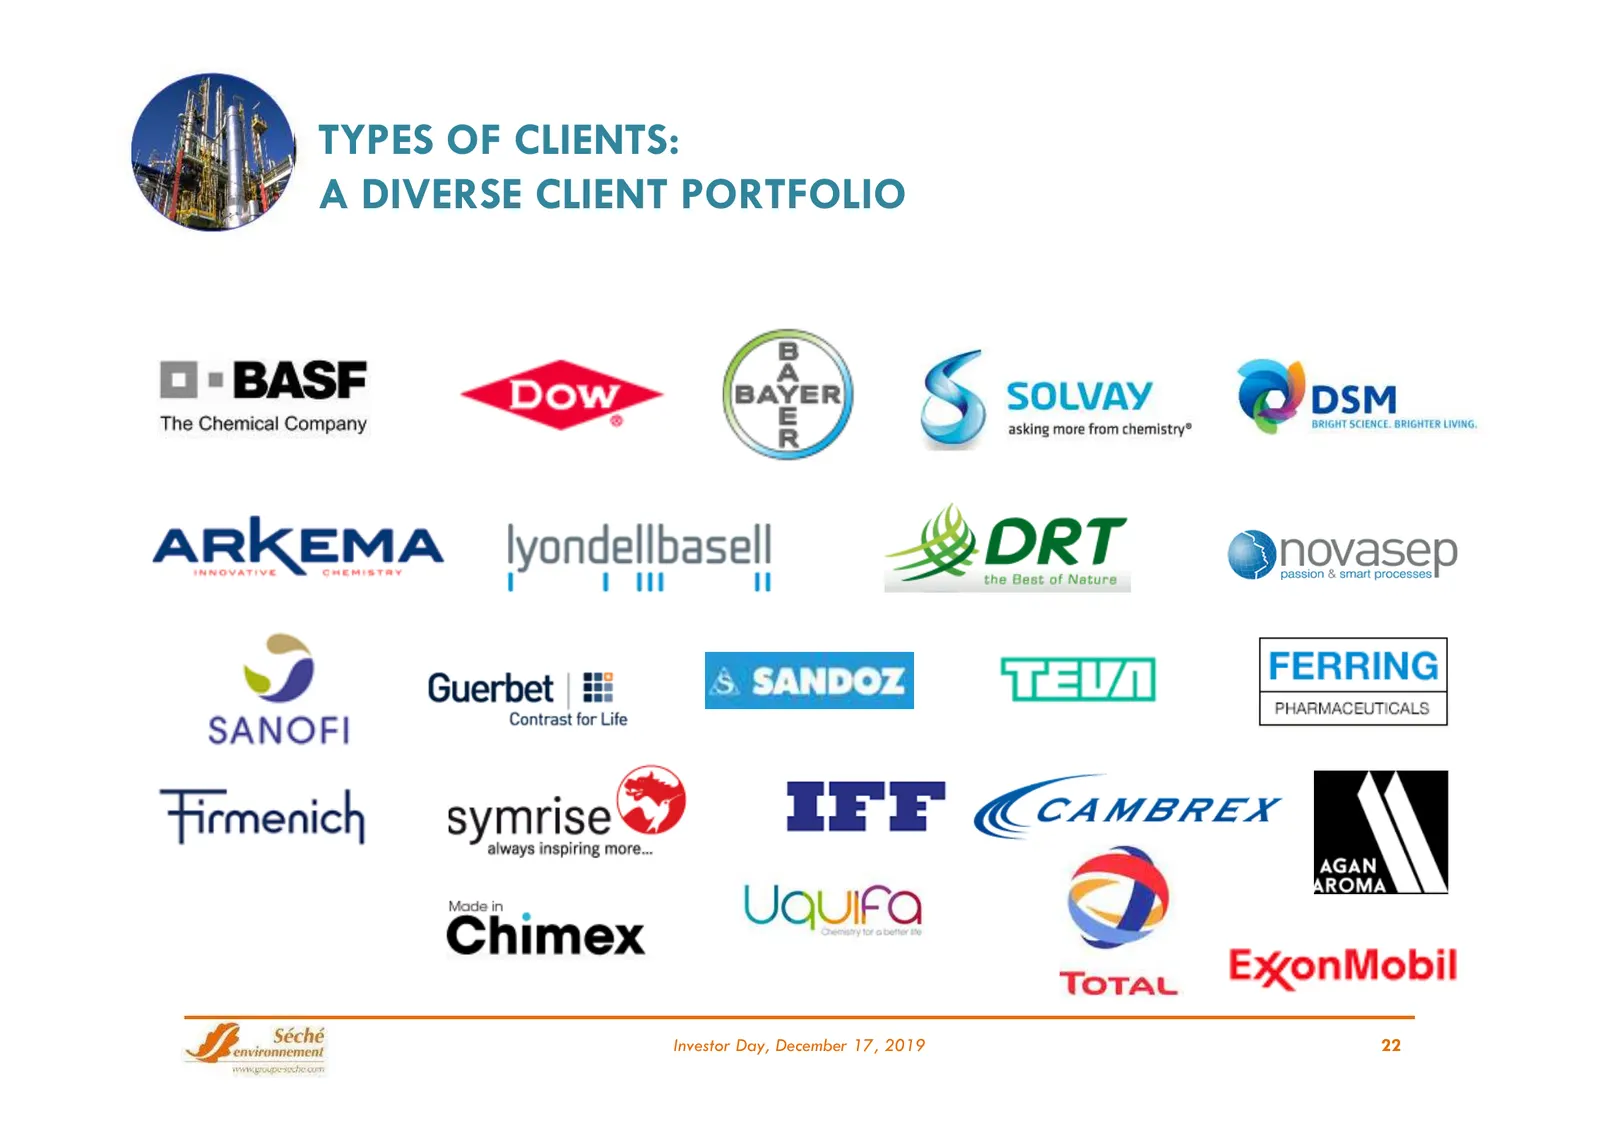
TYPES OF CLIENTS: A DIVERSE CLIENT PORTFOLIO Investor Day, December 17, 2019 22
Slide 23: Market Trends – Challenges / Strategy
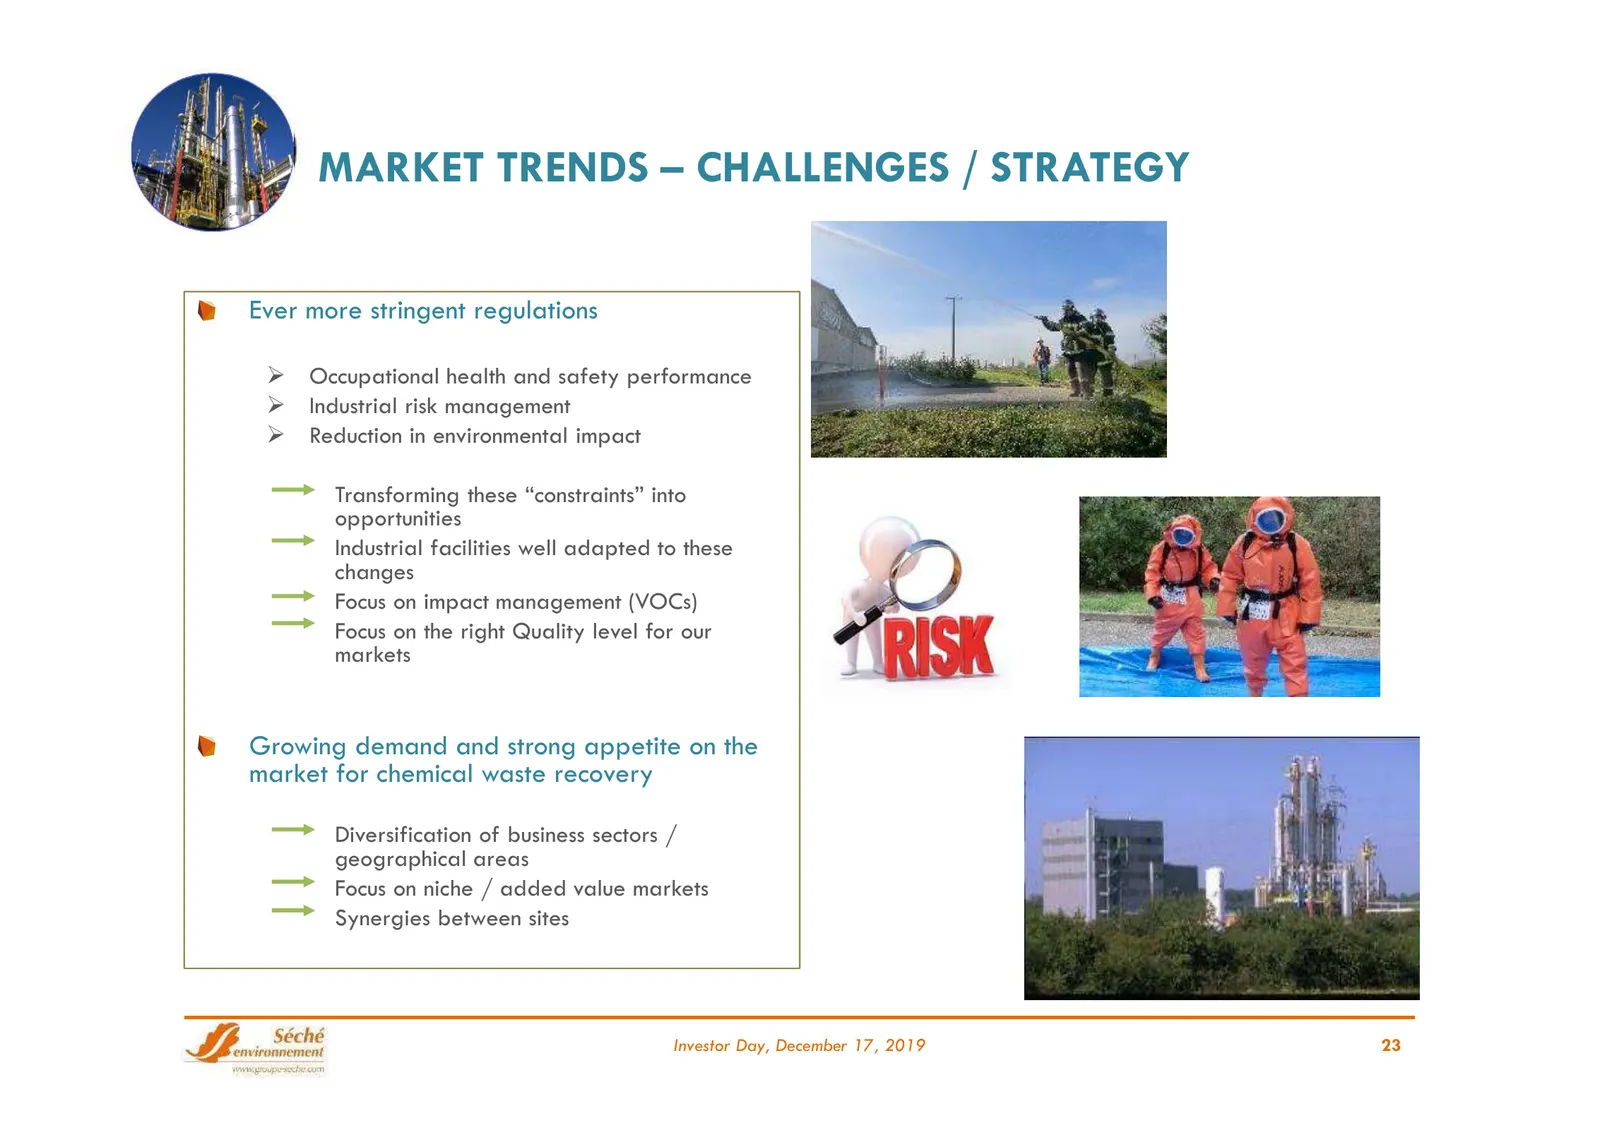
MARKET TRENDS – CHALLENGES / STRATEGY Ever more stringent regulations Occupational health and safety performance Industrial risk management Reduction in environmental impact Transforming these “constraints” into opportunities Industrial facilities well adapted to these changes Focus on impact
Slide 24: Market Trends – Challenges / Strategy
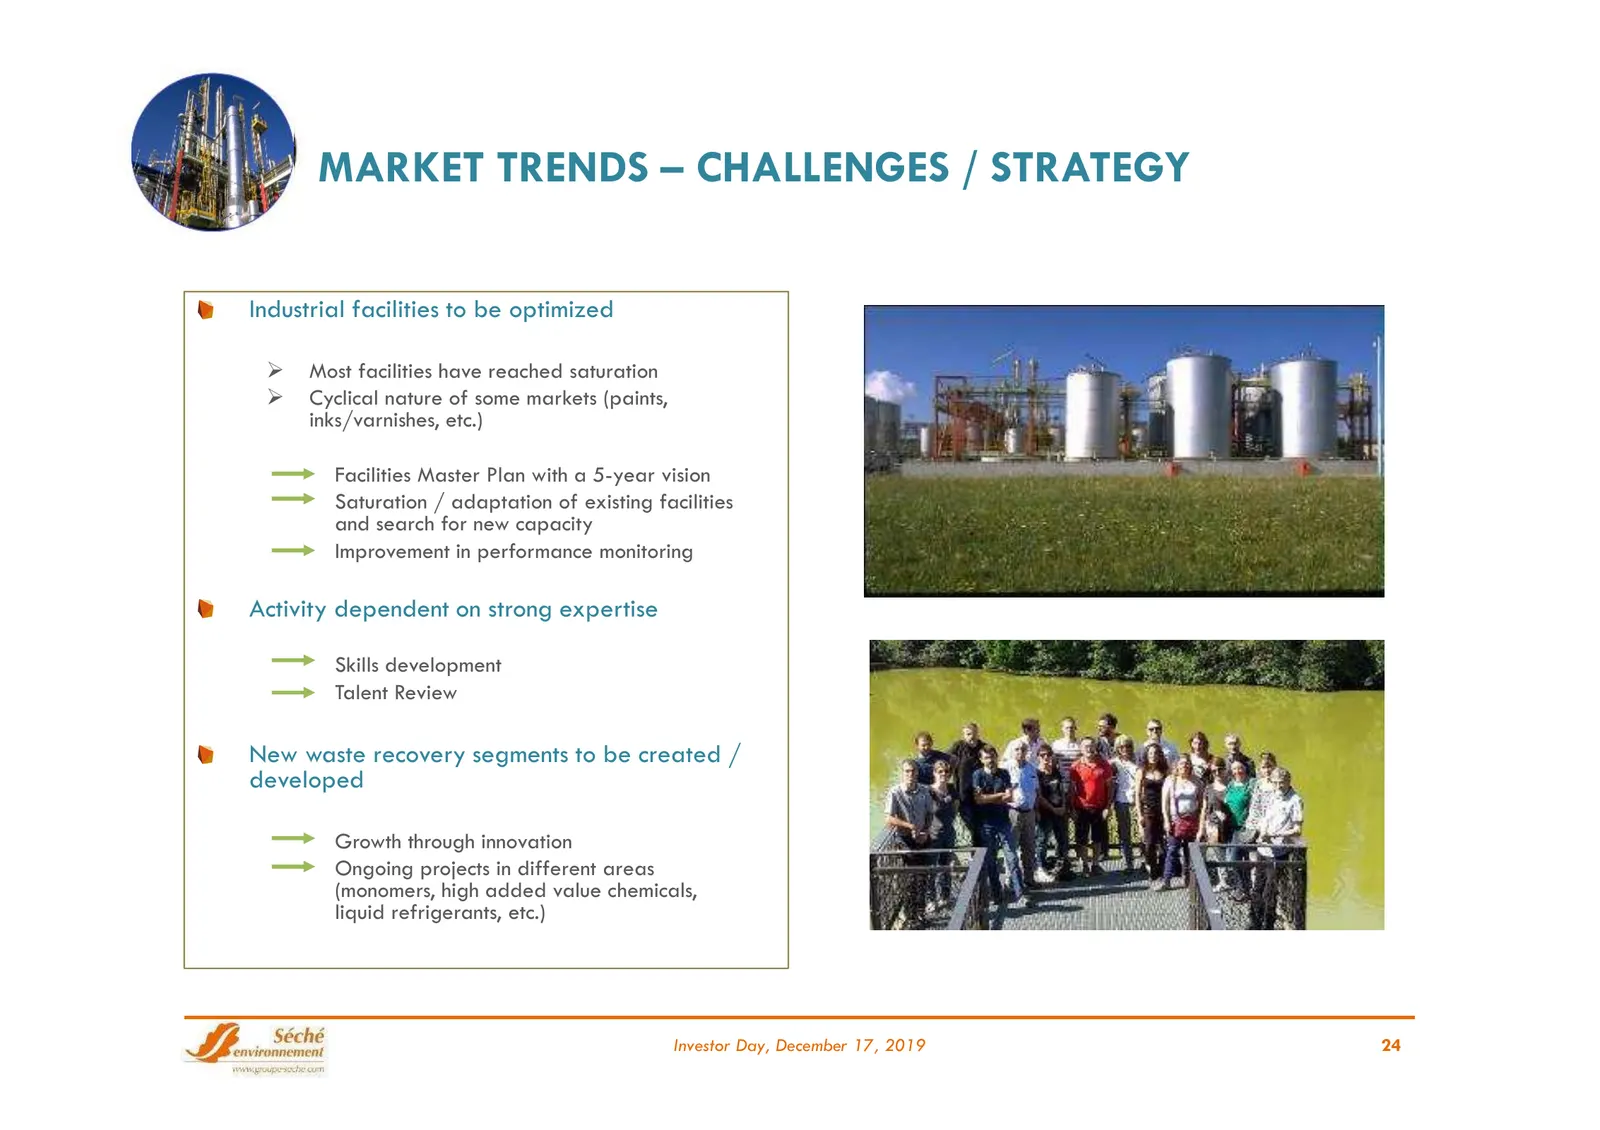
MARKET TRENDS – CHALLENGES / STRATEGY Industrial facilities to be optimized Most facilities have reached saturation Cyclical nature of some markets (paints, inks/varnishes, etc.) Facilities Master Plan with a 5-year vision Saturation / adaptation of existing facilities and search for new capacit
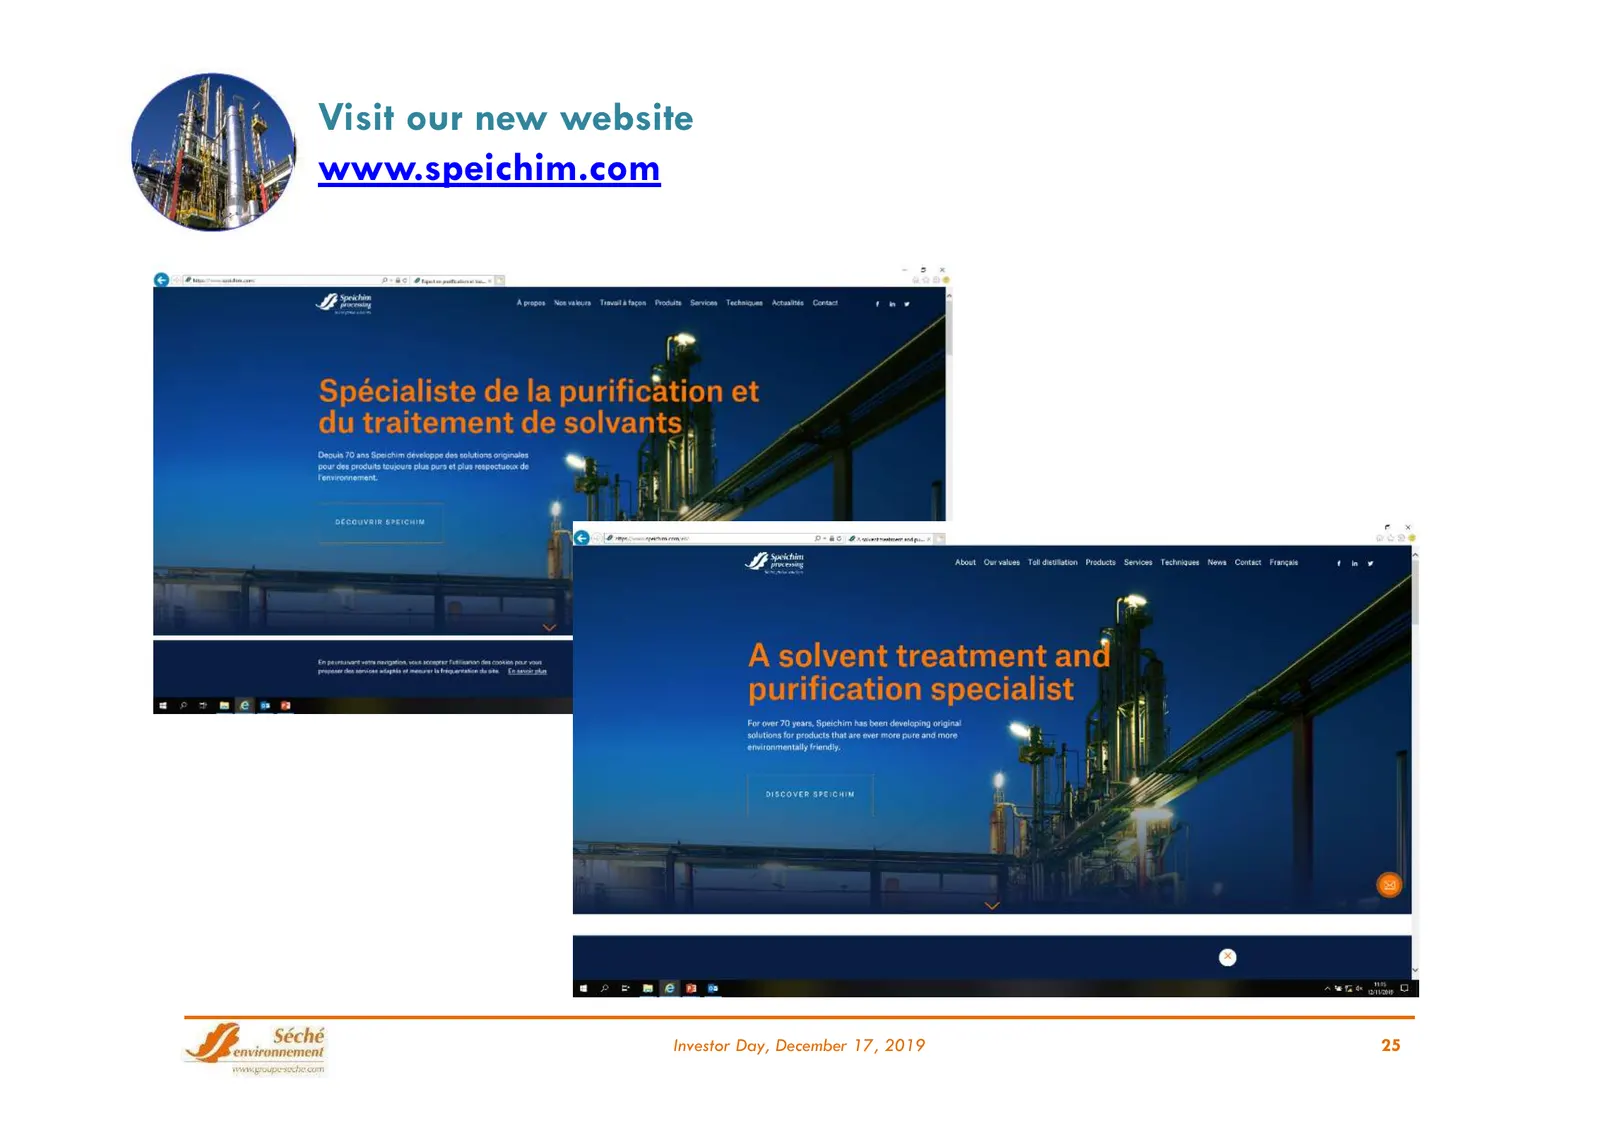
Slide 25: Visit our new website www.speichim.com
Visit our new website www.speichim.com Investor Day, December 17, 2019 25
Slide 26: Focus: Measures to counter climate change
Focus: Measures to counter climate change Audrey Mejdoubi, Head of CSR projects Investor Day, December 17, 2019 26
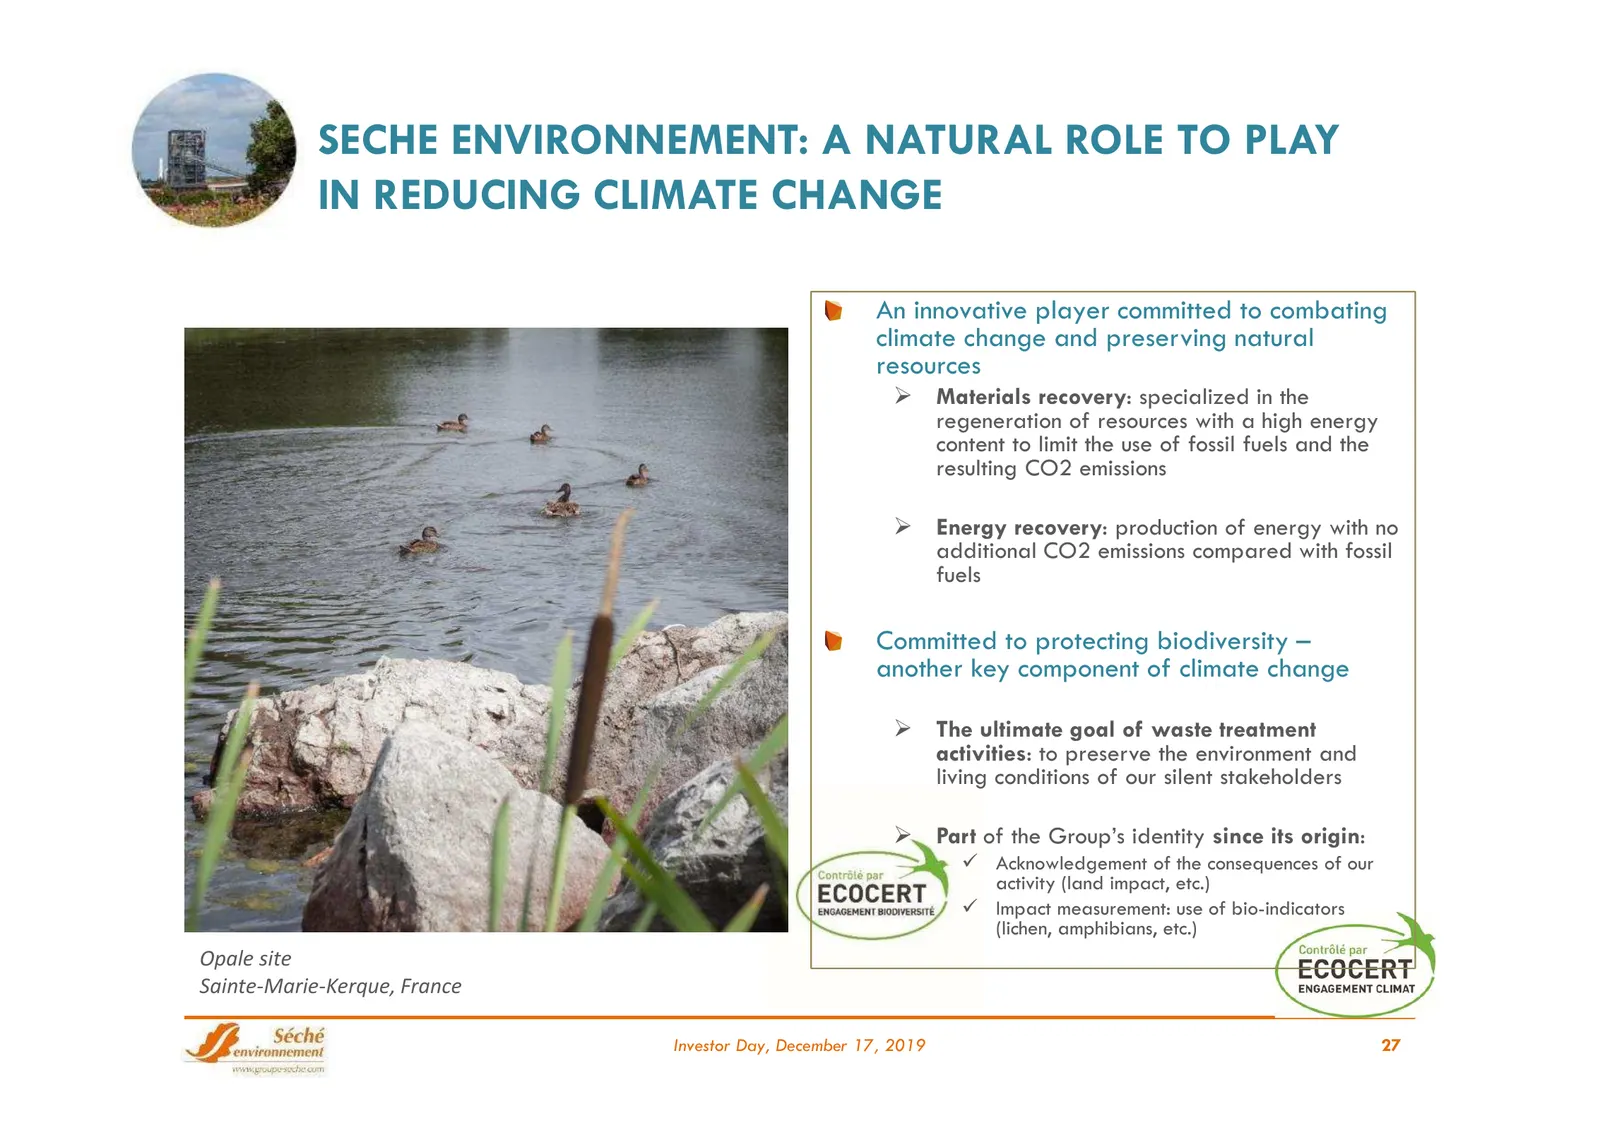
Slide 27: A Natural Role to Play in Reducing Climate Change
SECHE ENVIRONNEMENT: A NATURAL ROLE TO PLAY IN REDUCING CLIMATE CHANGE An innovative player committed to combating climate change and preserving natural resources Materials recovery: specialized in the regeneration of resources with a high energy content to limit the use of fossil fuels and the re
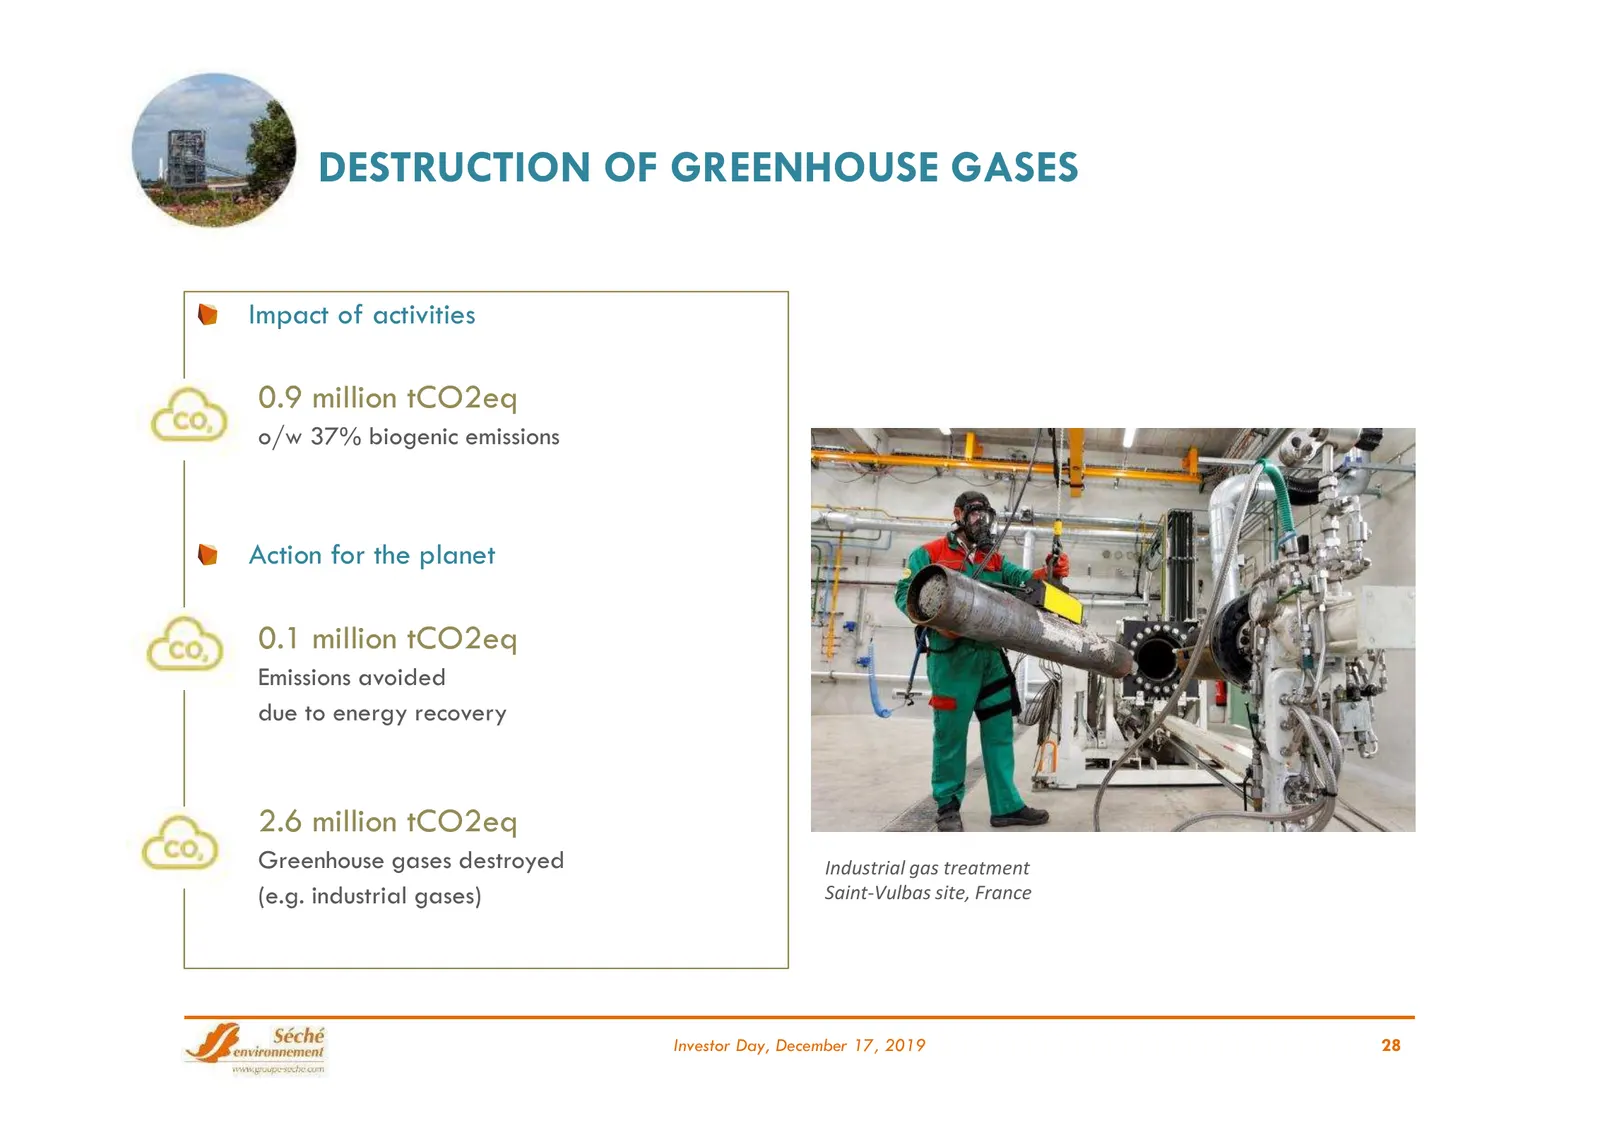
Slide 28: Destruction of Greenhouse Gases
DESTRUCTION OF GREENHOUSE GASES Impact of activities 0.9 million tCO2eq o/w 37% biogenic emissions Action for the planet 0.1 million tCO2eq Emissions avoided due to energy recovery 2.6 million tCO2eq Greenhouse gases destroyed Industrial gas treatment (e.g. industrial gases) Saint-Vulbas site, Franc
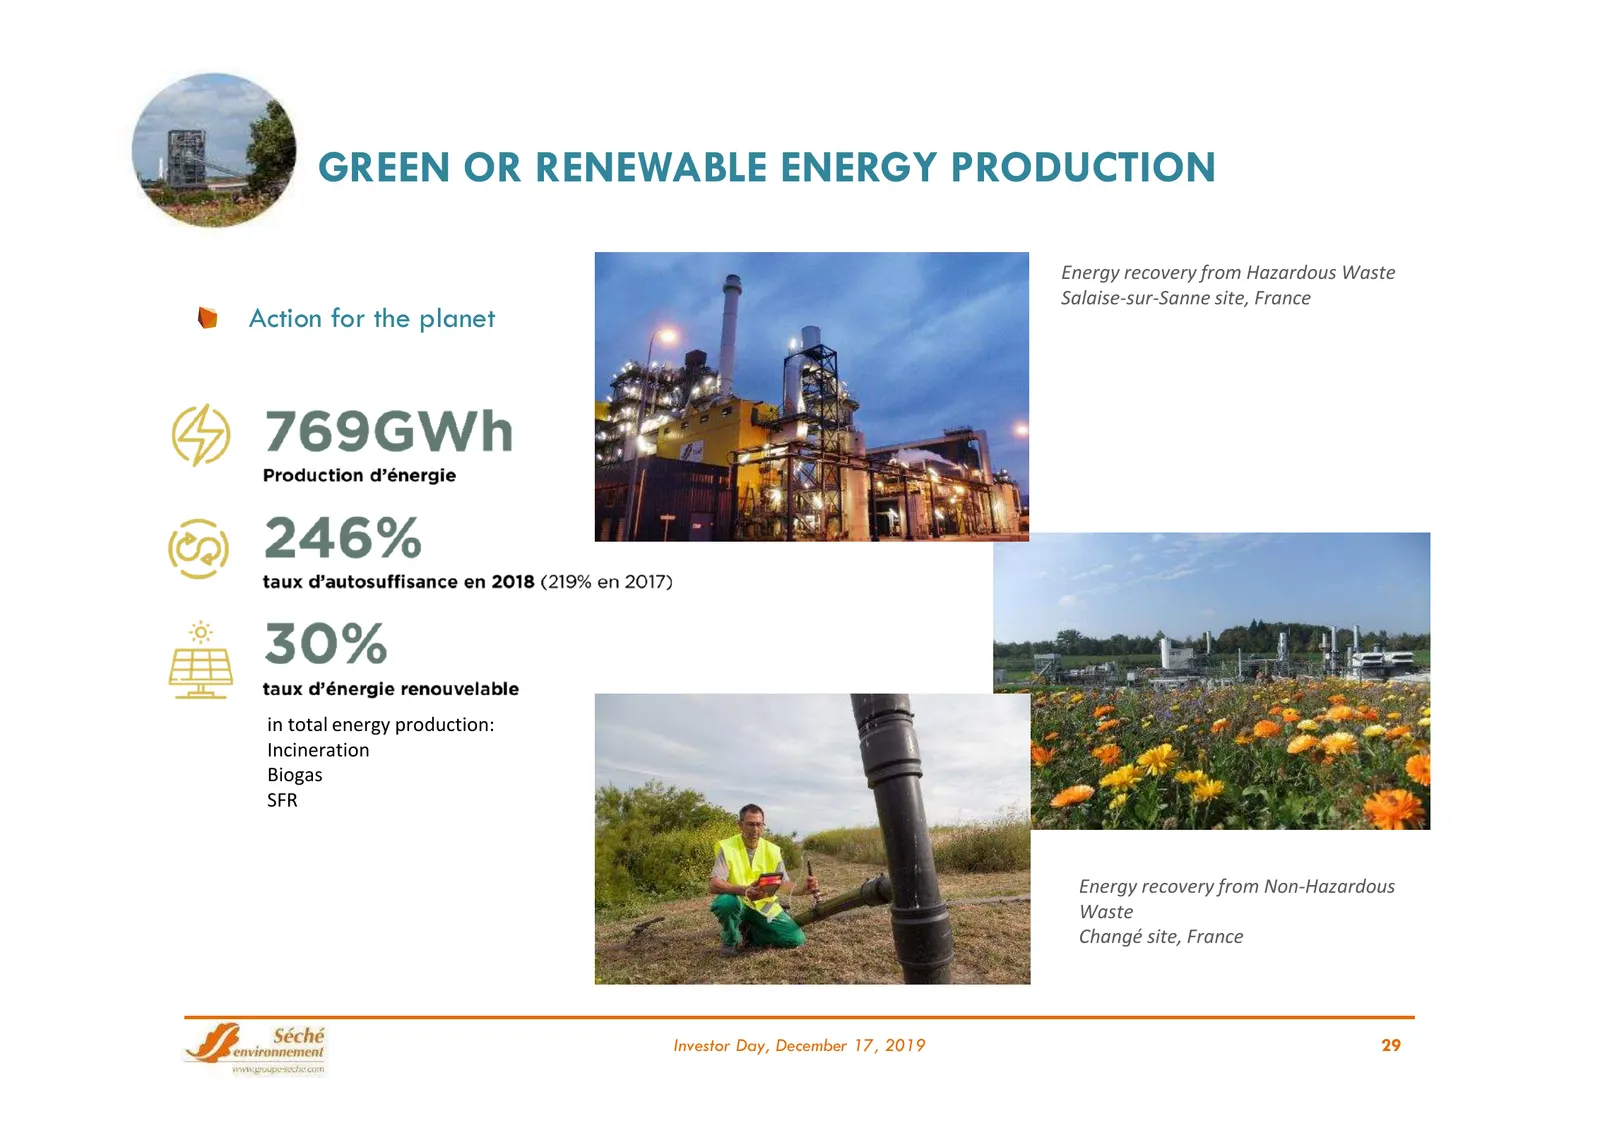
Slide 29: Green or Renewable Energy Production
GREEN OR RENEWABLE ENERGY PRODUCTION Energy recovery from Hazardous Waste Salaise-sur-Sanne site, France Action for the planet in total energy production: Incineration Biogas SFR Energy recovery from Non-Hazardous Waste Changé site, France Investor Day, December 17, 2019 29
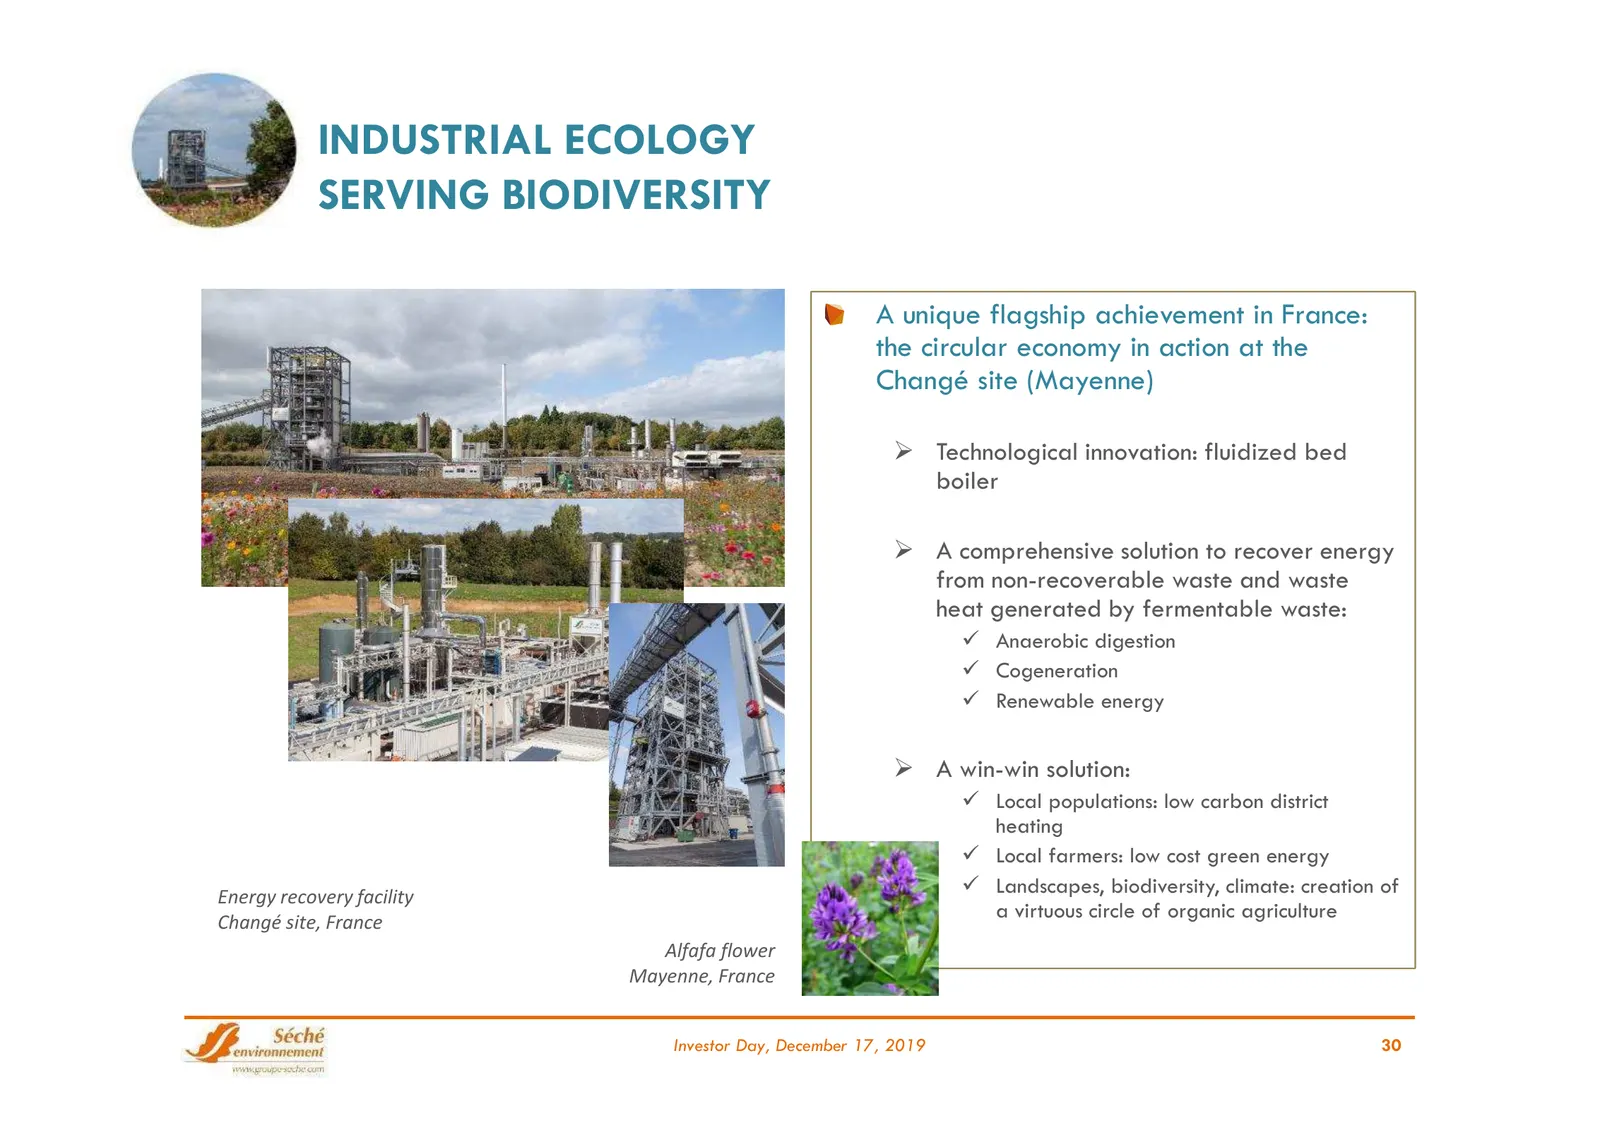
Slide 30: Industrial Ecology Serving Biodiversity
INDUSTRIAL ECOLOGY SERVING BIODIVERSITY A unique flagship achievement in France: the circular economy in action at the Changé site (Mayenne) Technological innovation: fluidized bed boiler A comprehensive solution to recover energy from non-recoverable waste and waste heat generated by fermentabl
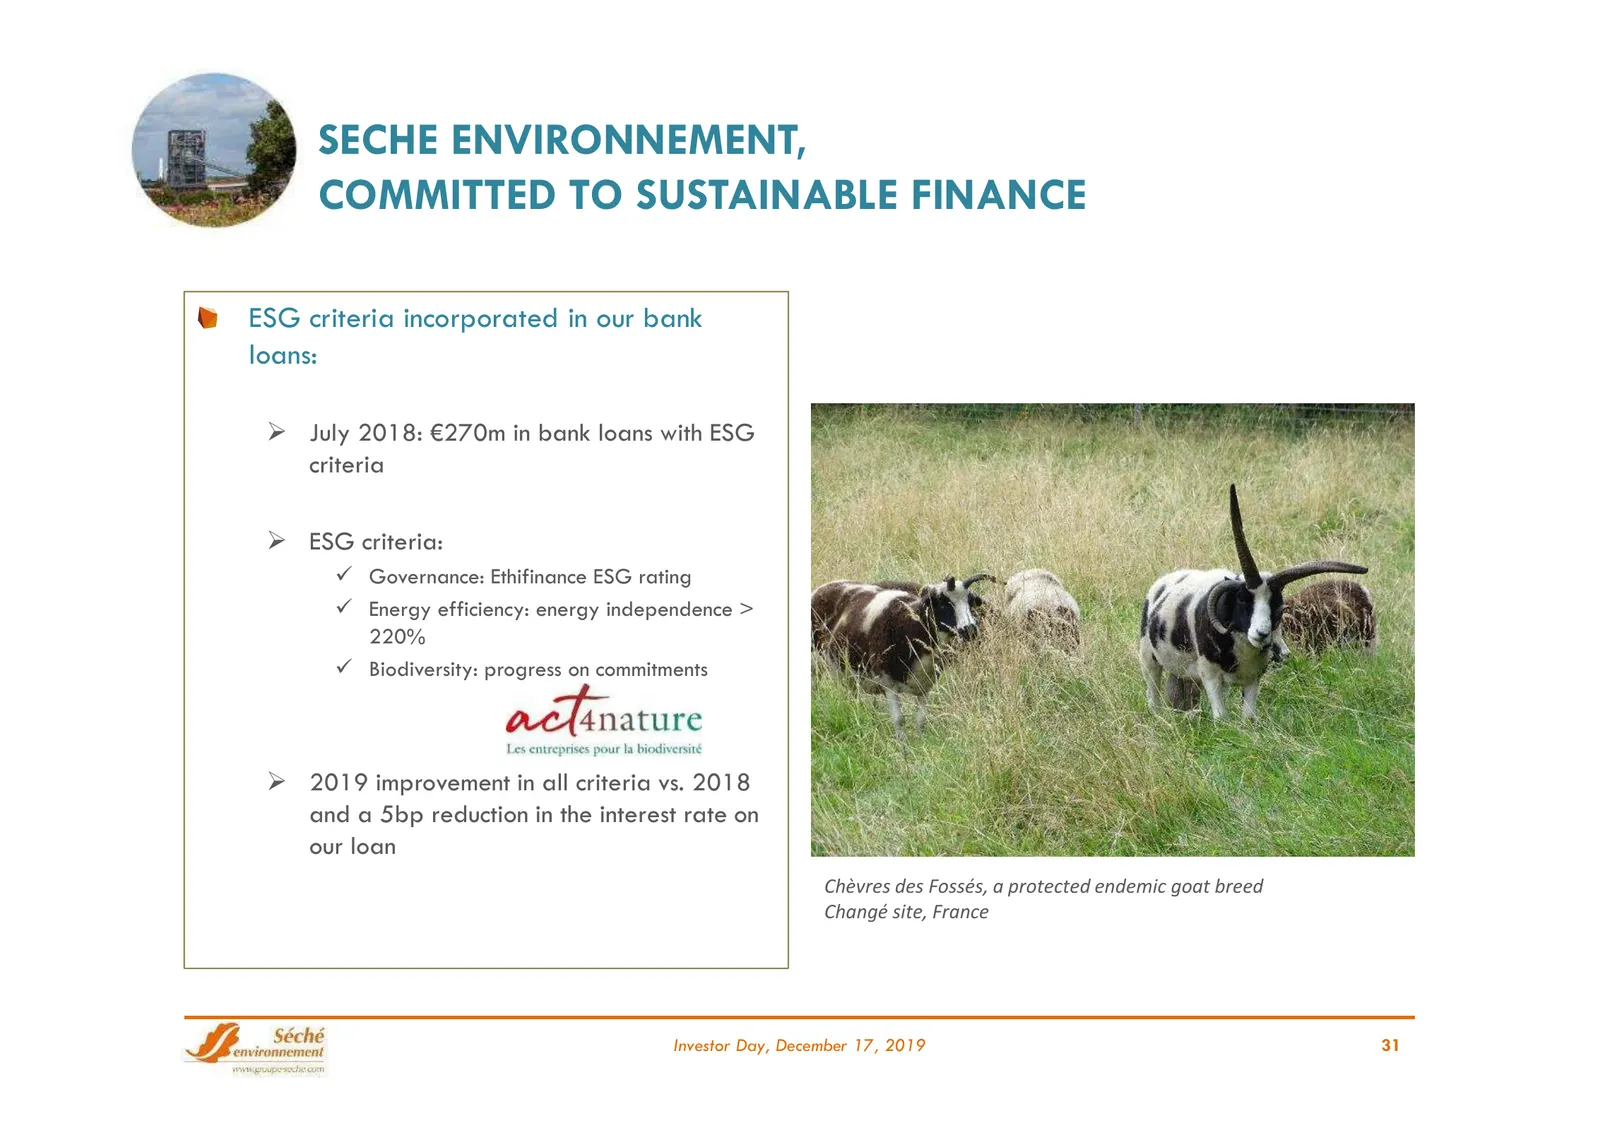
Slide 31: Committed to Sustainable Finance
SECHE ENVIRONNEMENT, COMMITTED TO SUSTAINABLE FINANCE ESG criteria incorporated in our bank loans: July 2018: €270m in bank loans with ESG criteria ESG criteria: Governance: Ethifinance ESG rating Energy efficiency: energy independence > 220% Biodiversity: progress on commitments 2019 im
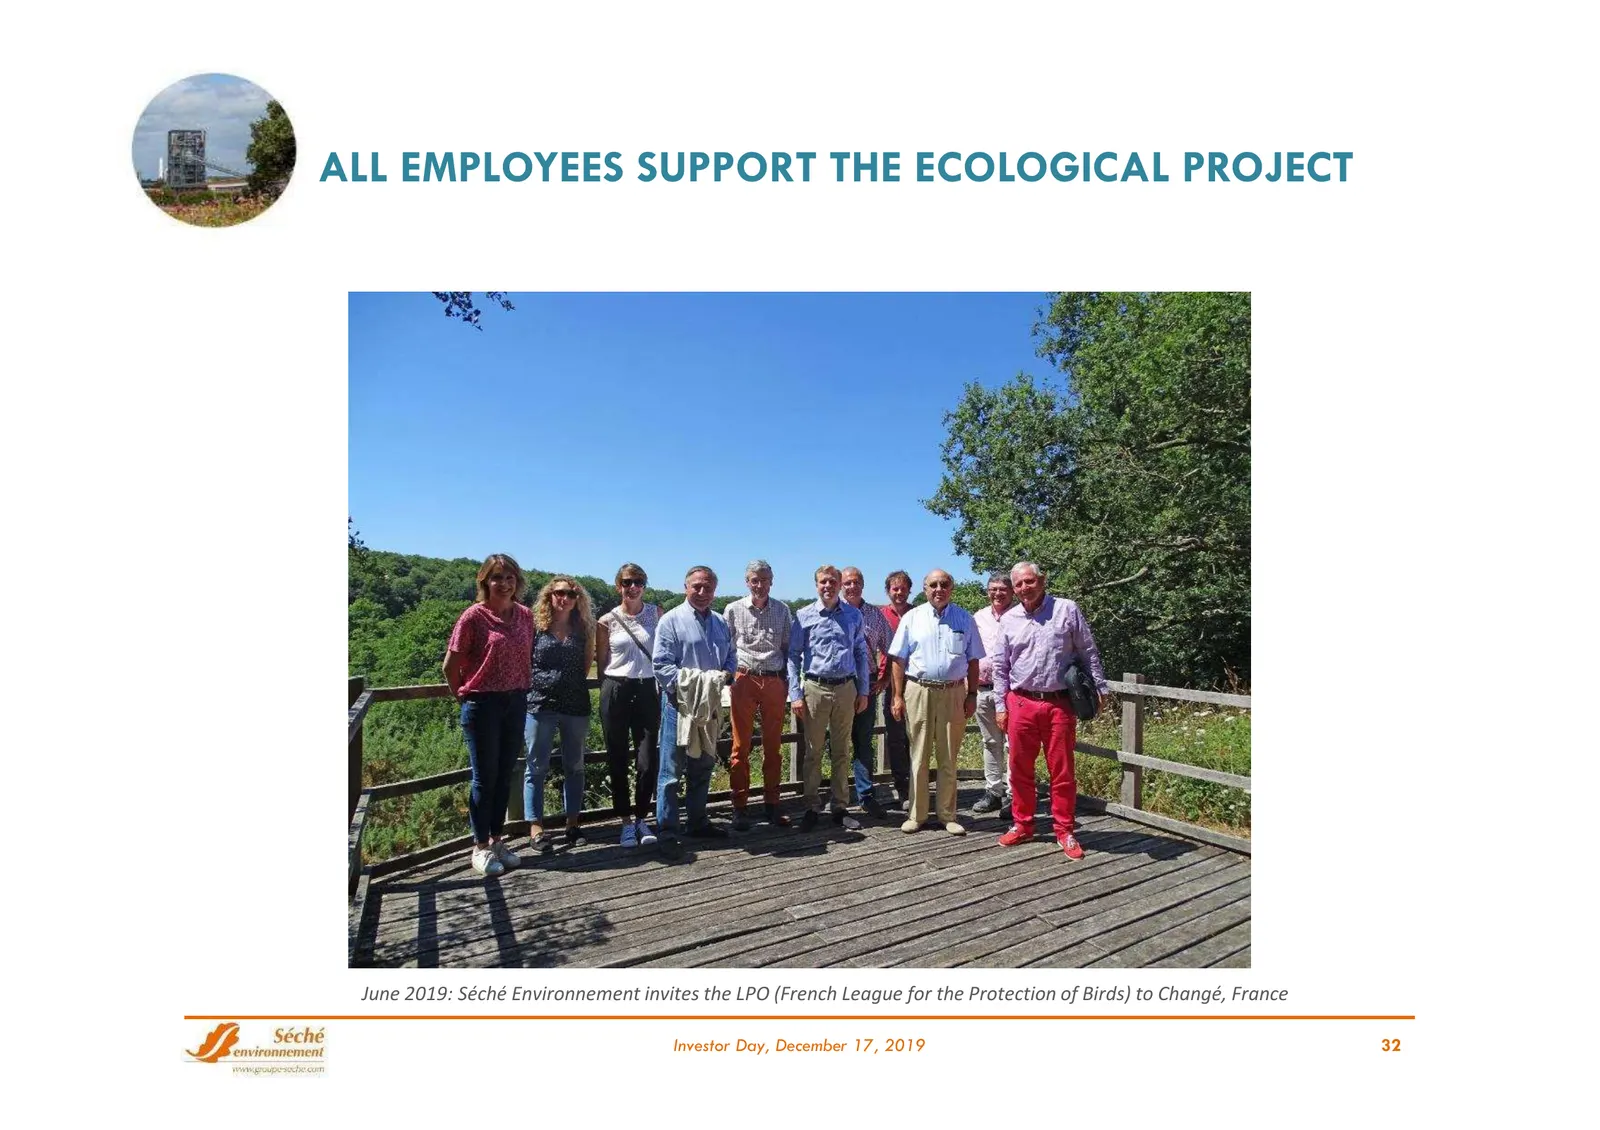
Slide 32: All Employees Support the Ecological Project
ALL EMPLOYEES SUPPORT THE ECOLOGICAL PROJECT June 2019: Séché Environnement invites the LPO (French League for the Protection of Birds) to Changé, France Investor Day, December 17, 2019 32
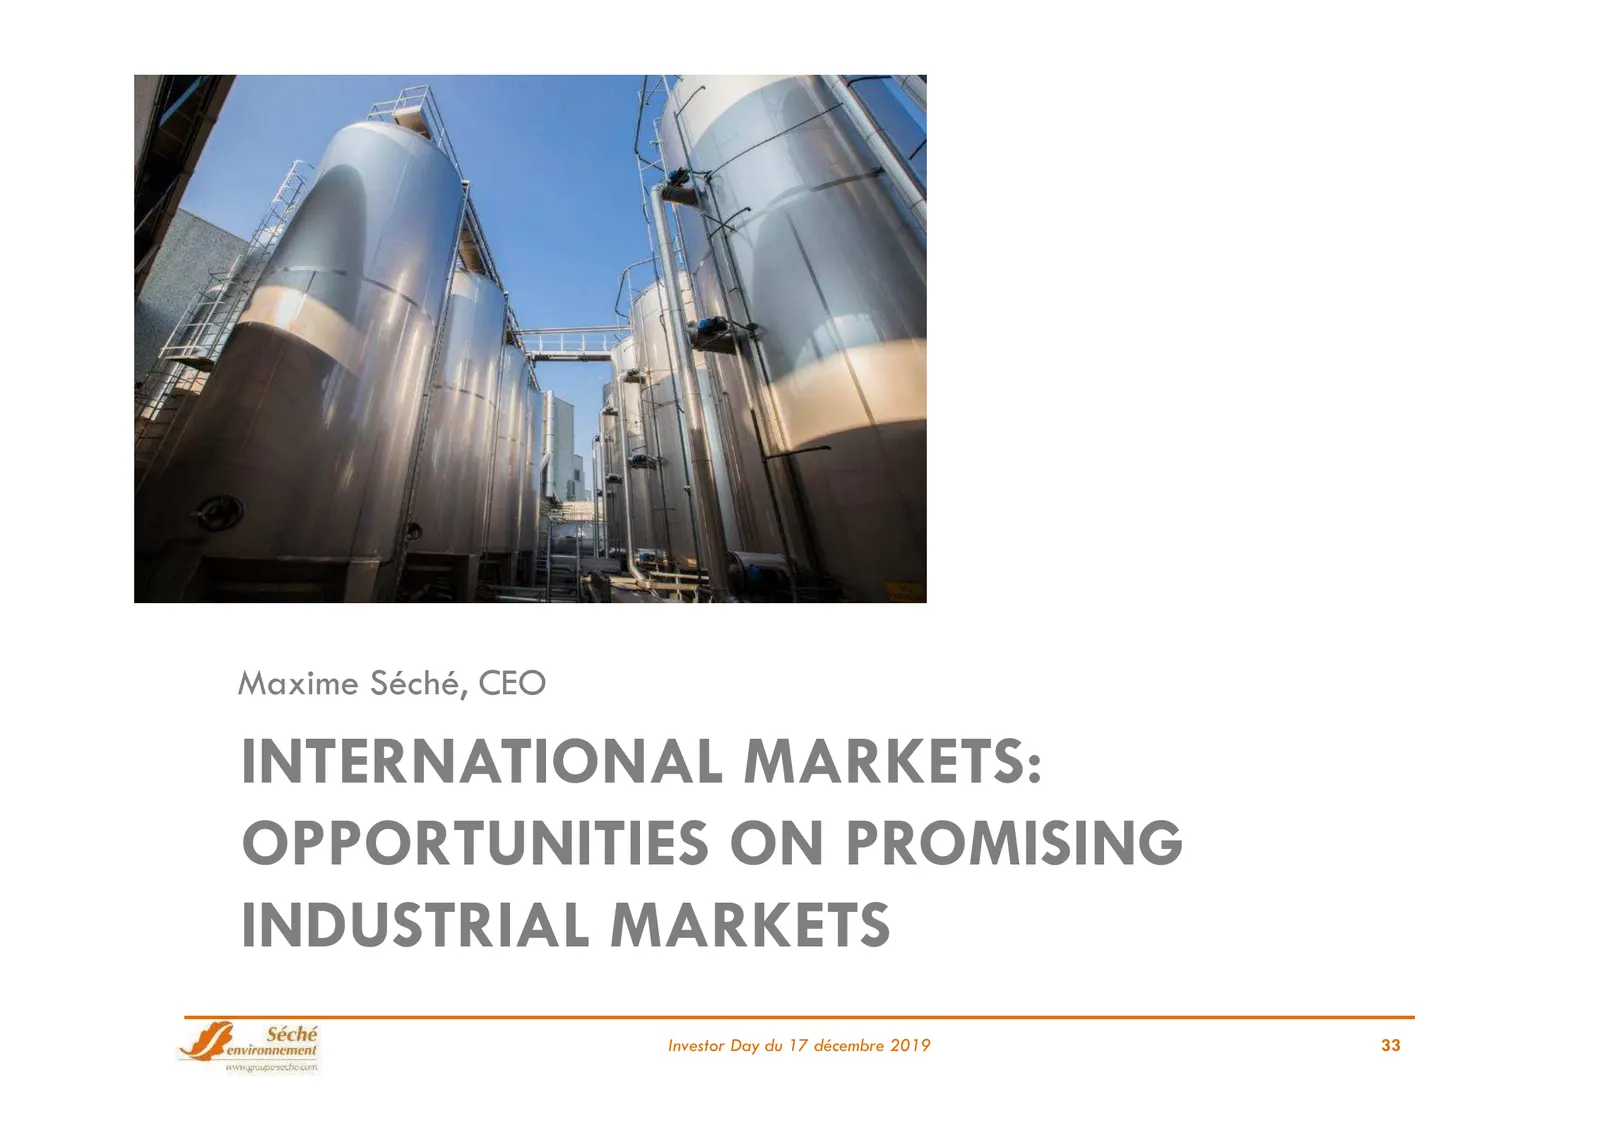
Slide 33: International Markets: Opportunities on Promising Industrial Markets
Maxime Séché, CEO INTERNATIONAL MARKETS: OPPORTUNITIES ON PROMISING INDUSTRIAL MARKETS Investor Day du 17 décembre 2019 33
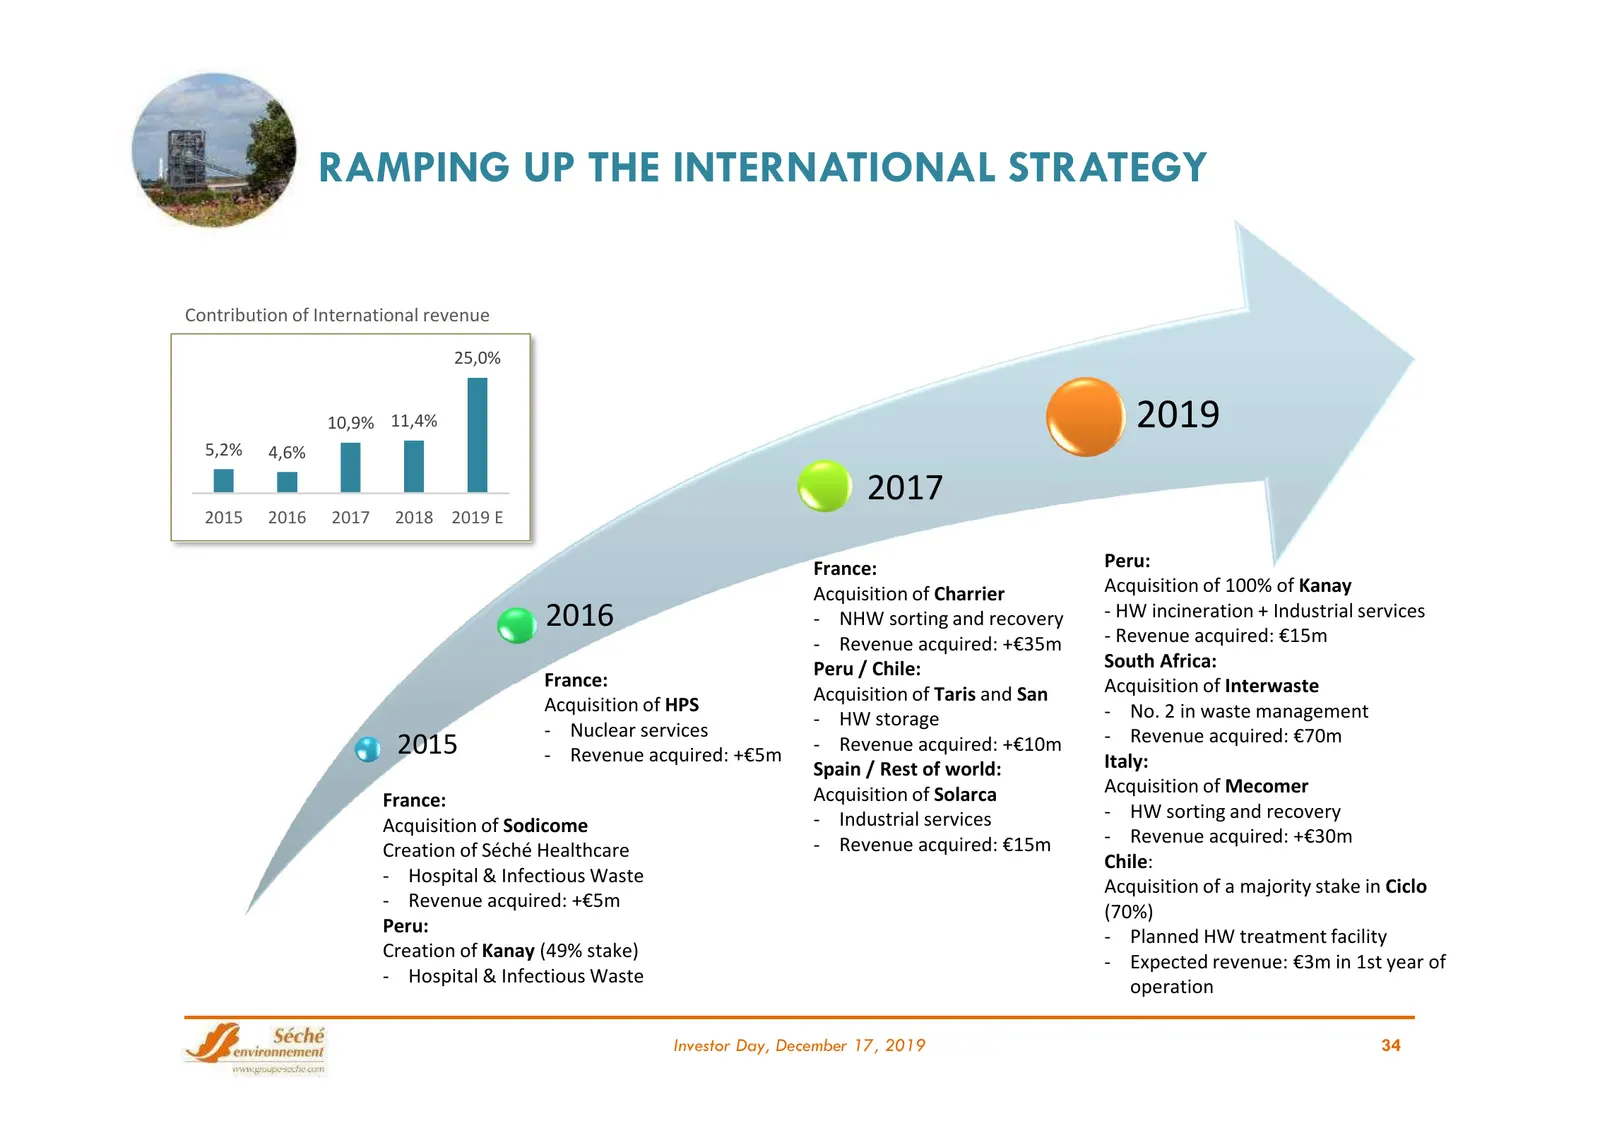
Slide 34: Ramping Up the International Strategy
RAMPING UP THE INTERNATIONAL STRATEGY Contribution of International revenue 25,0% 10,9% 11,4% 2019 5,2% 4,6% 2017 2015 2016 2017 2018 2019 E France: Peru: Acquisition of Charrier Acquisition of 100% of Kanay 2016 - NHW sorting and recovery - HW incineration + Industrial services - Revenue acquired:
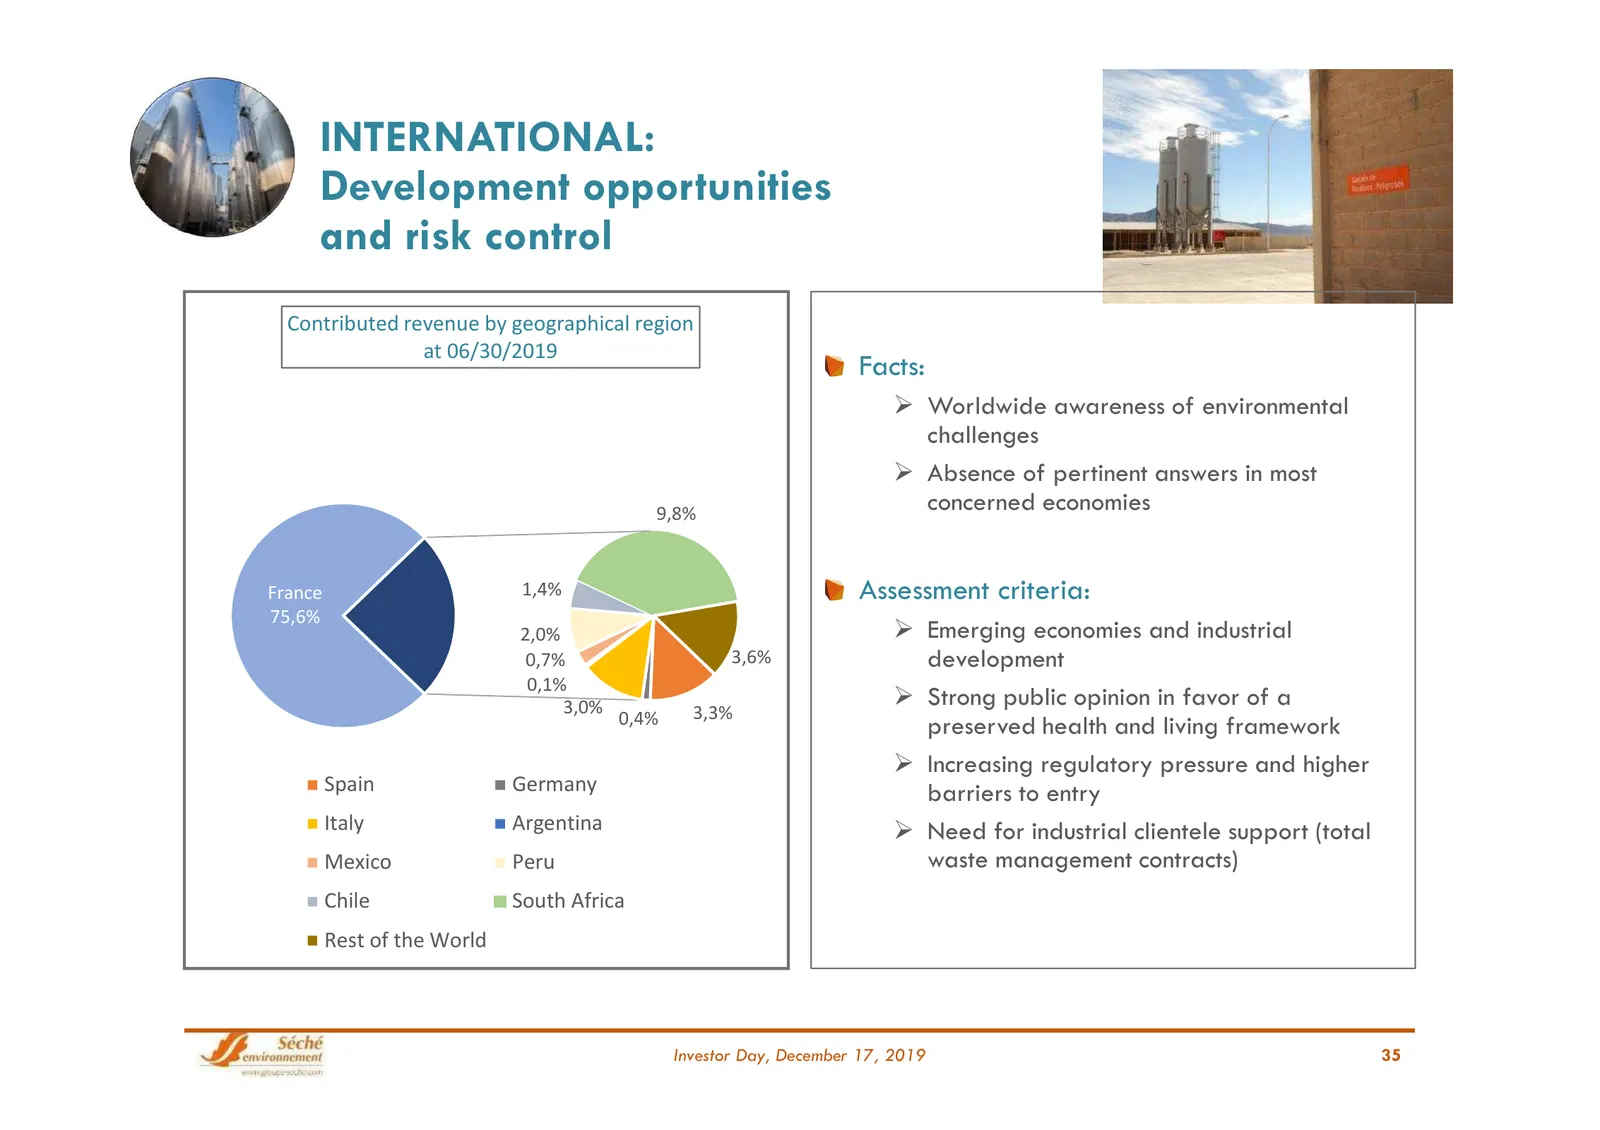
Slide 35: International: Development opportunities and risk control
INTERNATIONAL: Development opportunities and risk control Contributed revenue by geographical region at 06/30/2019 Facts: Worldwide awareness of environmental challenges Absence of pertinent answers in most 9,8% concerned economies France 1,4% Assessment criteria: 75,6% 2,0% Emerging economies
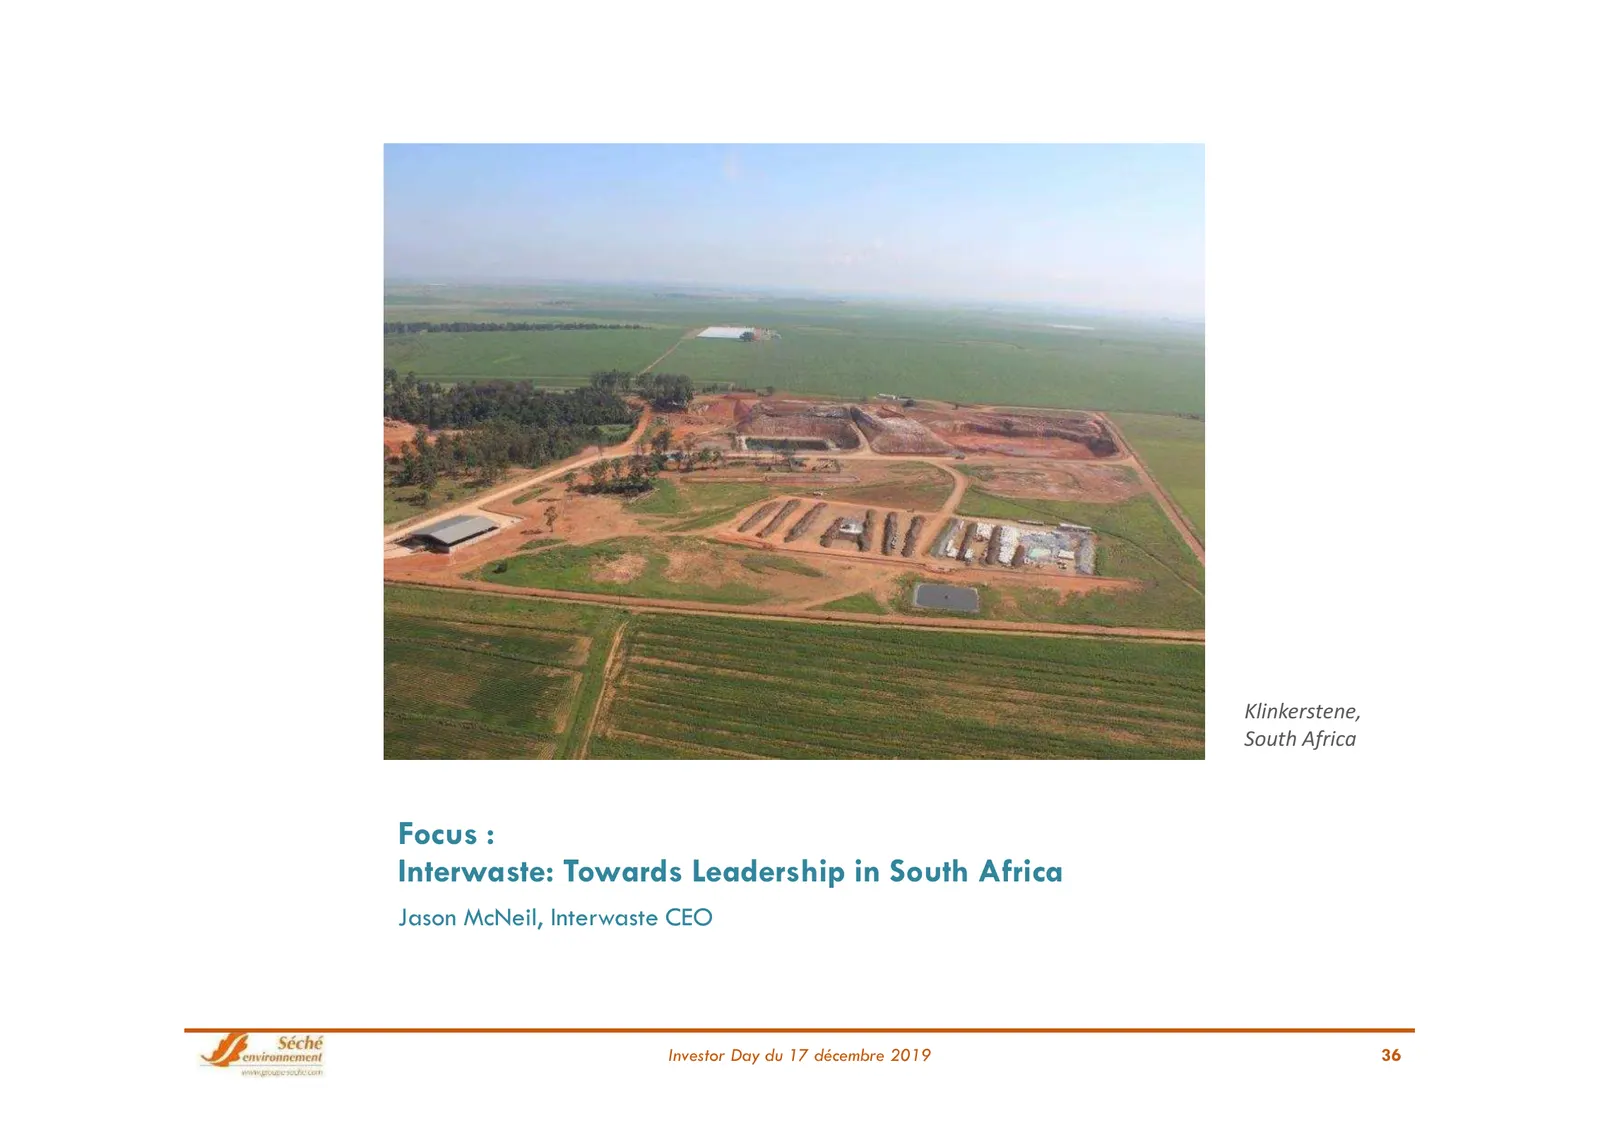
Slide 36: Focus: Interwaste: Towards Leadership in South Africa
Klinkerstene, South Africa Focus : Interwaste: Towards Leadership in South Africa Jason McNeil, Interwaste CEO Investor Day du 17 décembre 2019 36
Slide 37: Interwaste Overview
Interwaste Overview interwaste.co.za 37
Slide 38: Our vision
Our vision Serving Land and Life. Our aim is to lead in the sustainable preservation of our environment. 38
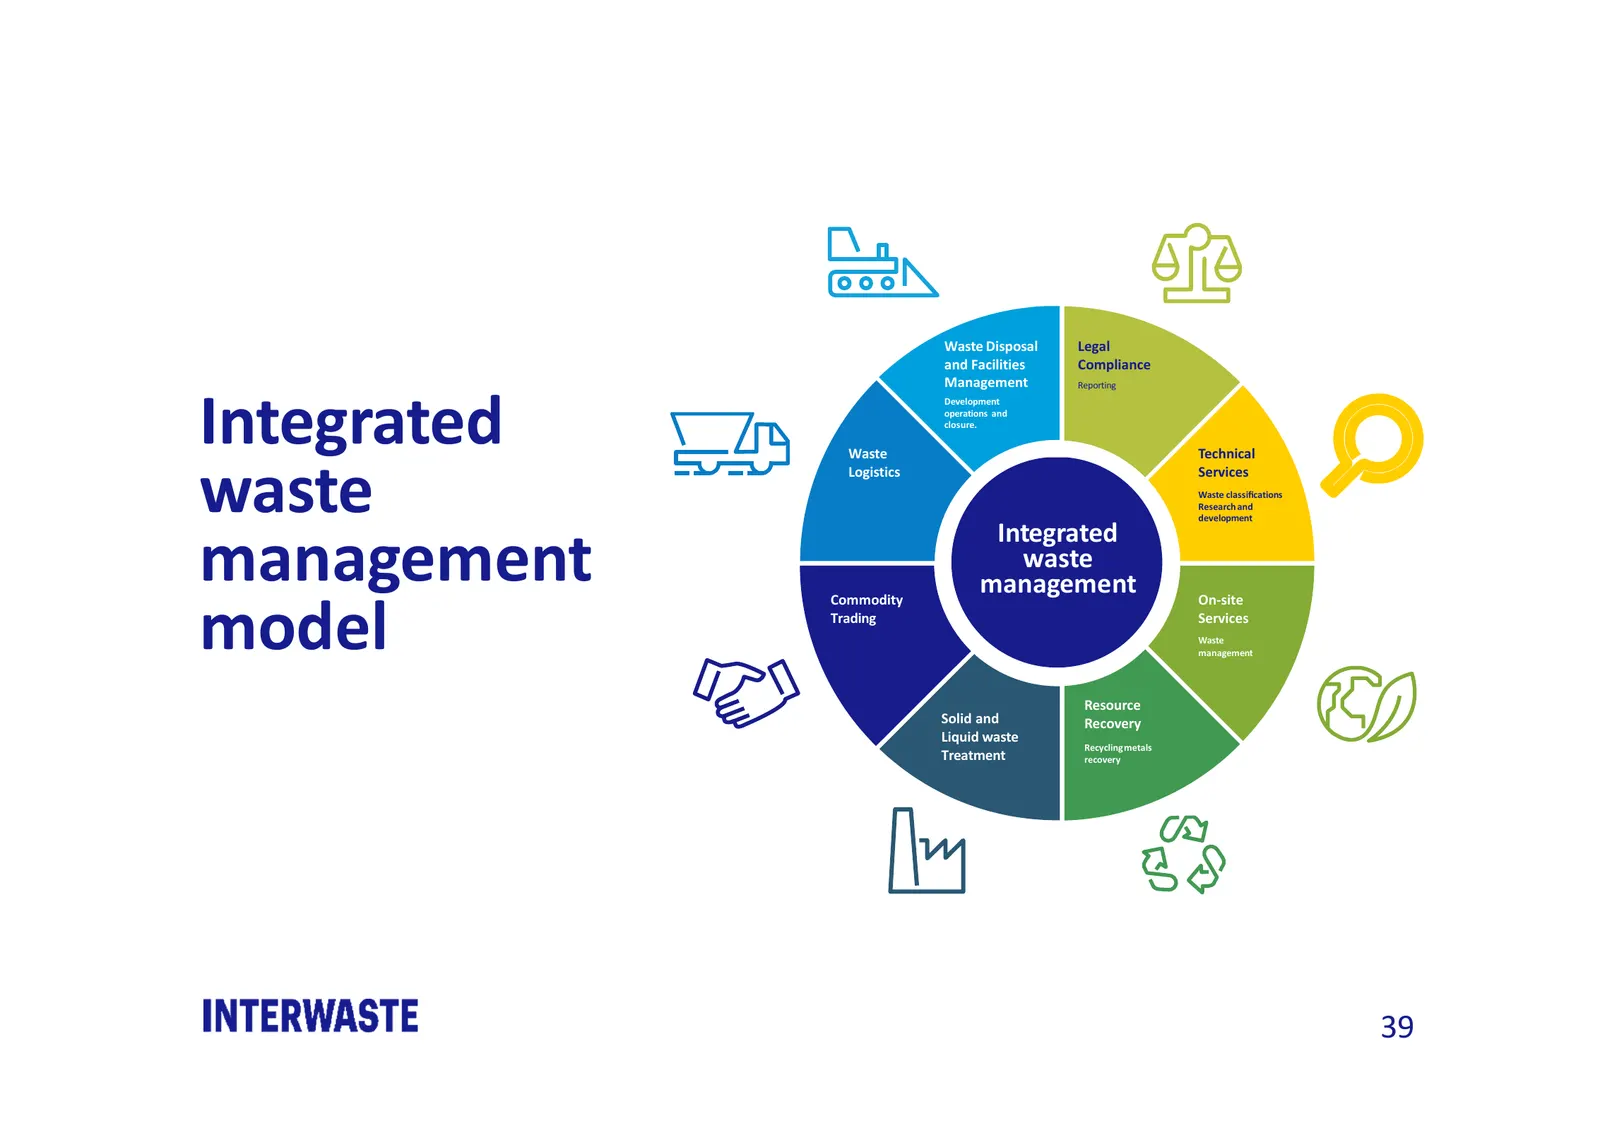
Slide 39: Integrated waste management
Waste Disposal Legal and Facilities Compliance Management Reporting Integrated Development operations and closure. Waste Technical waste Logistics Integrated Services Waste classifications Research and development management Commodity waste management On-site model Trading Services Waste management R
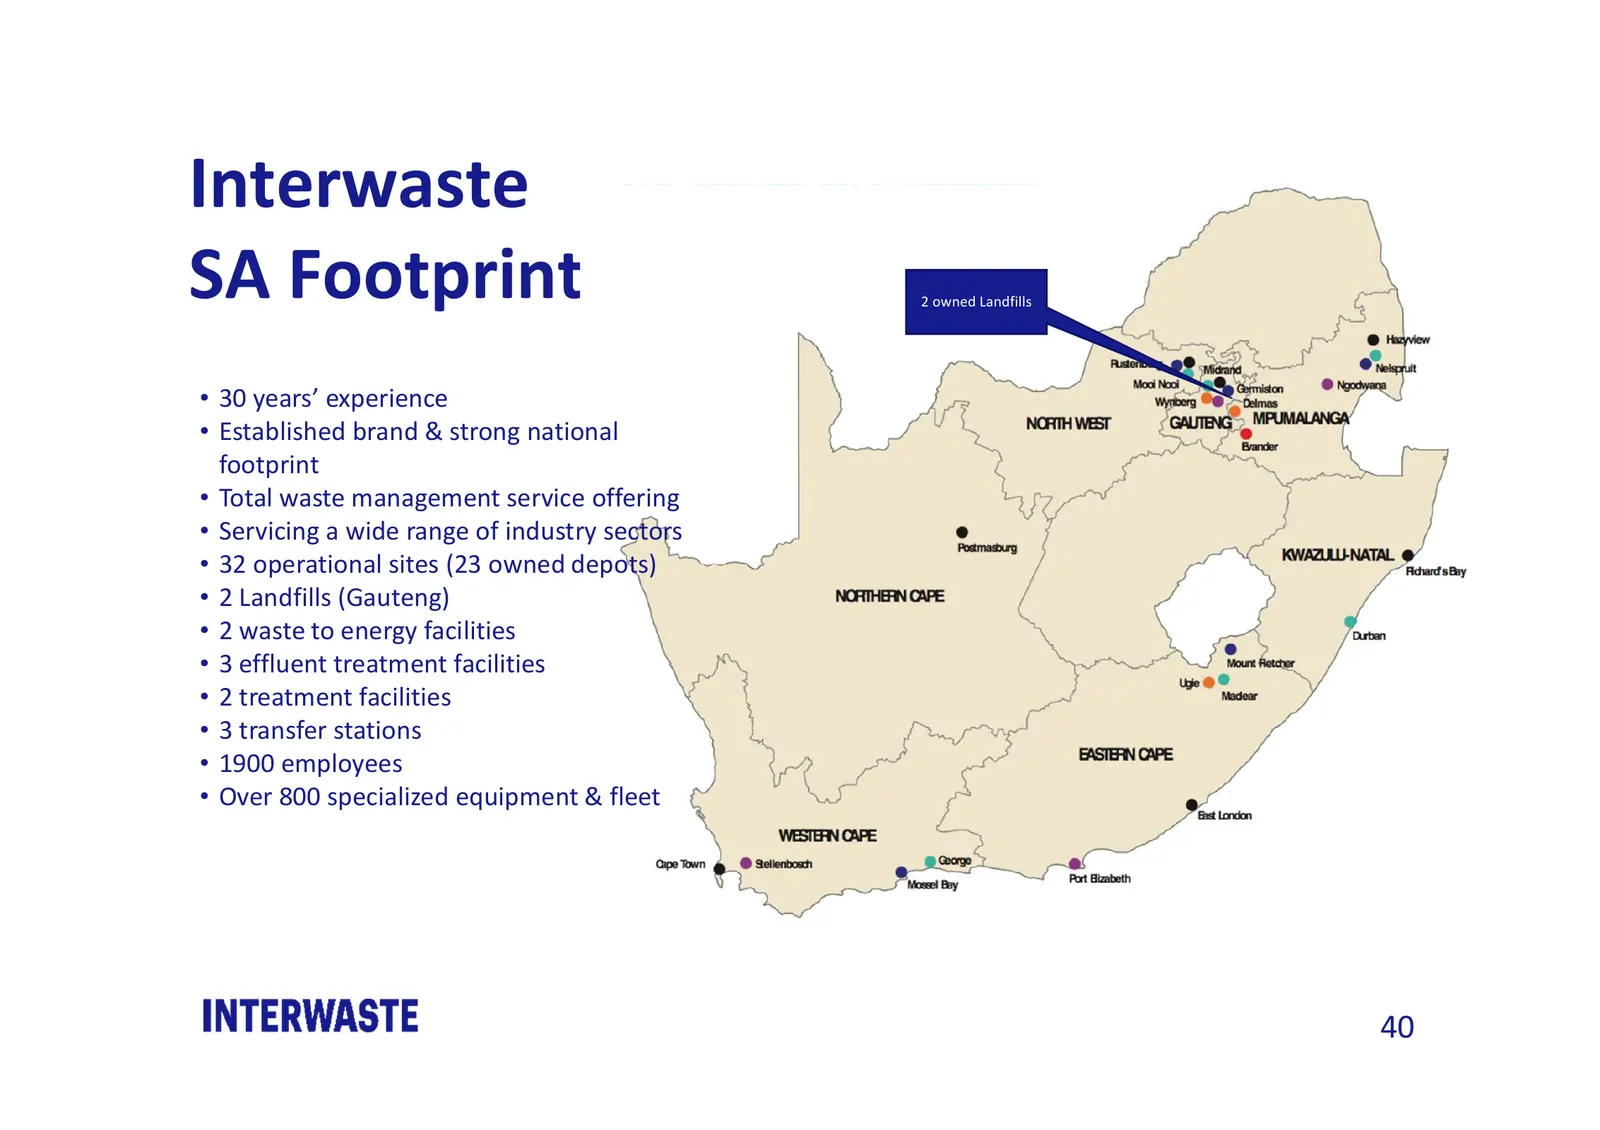
Slide 40: Interwaste SA Footprint
Interwaste SA Footprint 2 owned Landfills • 30 years’ experience • Established brand & strong national footprint • Total waste management service offering • Servicing a wide range of industry sectors • 32 operational sites (23 owned depots) • 2 Landfills (Gauteng) • 2 waste to energy facilities • 3
Slide 41: Moz Environmental Footprint
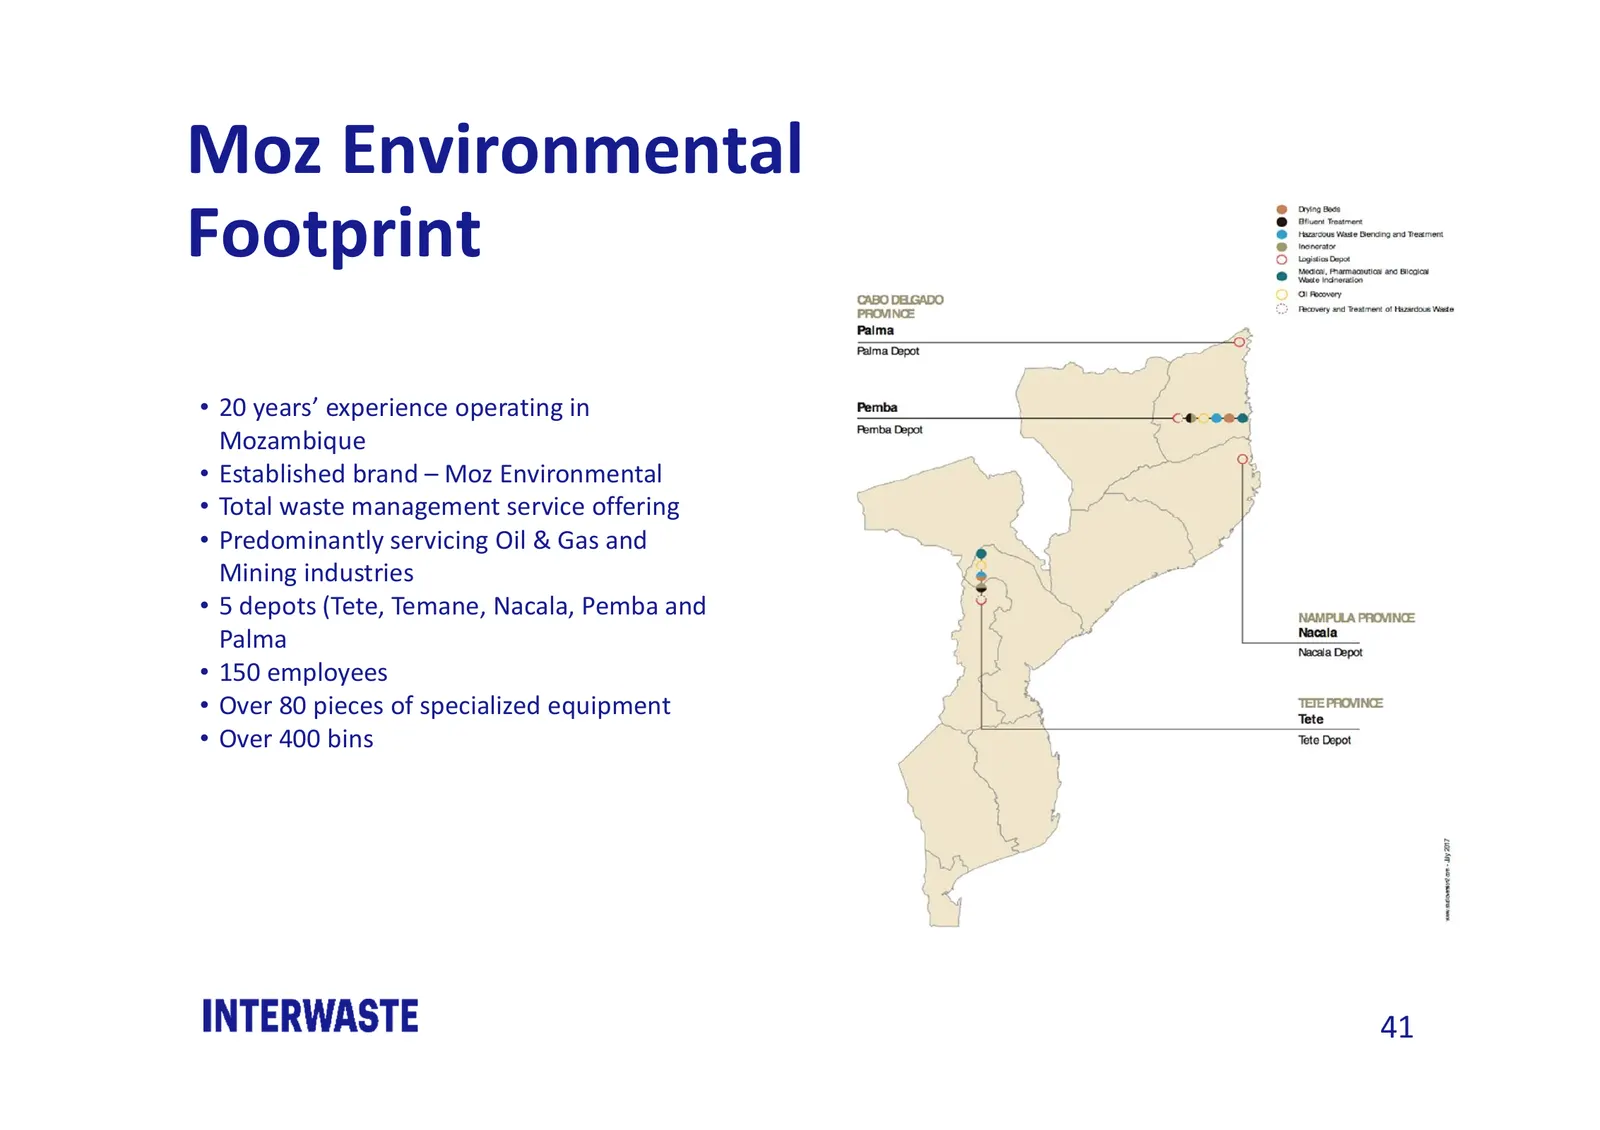
Moz Environmental Footprint • 20 years’ experience operating in Mozambique • Established brand – Moz Environmental • Total waste management service offering • Predominantly servicing Oil & Gas and Mining industries • 5 depots (Tete, Temane, Nacala, Pemba and Palma • 150 employees • Over 80 pieces of
Slide 42: Key clients
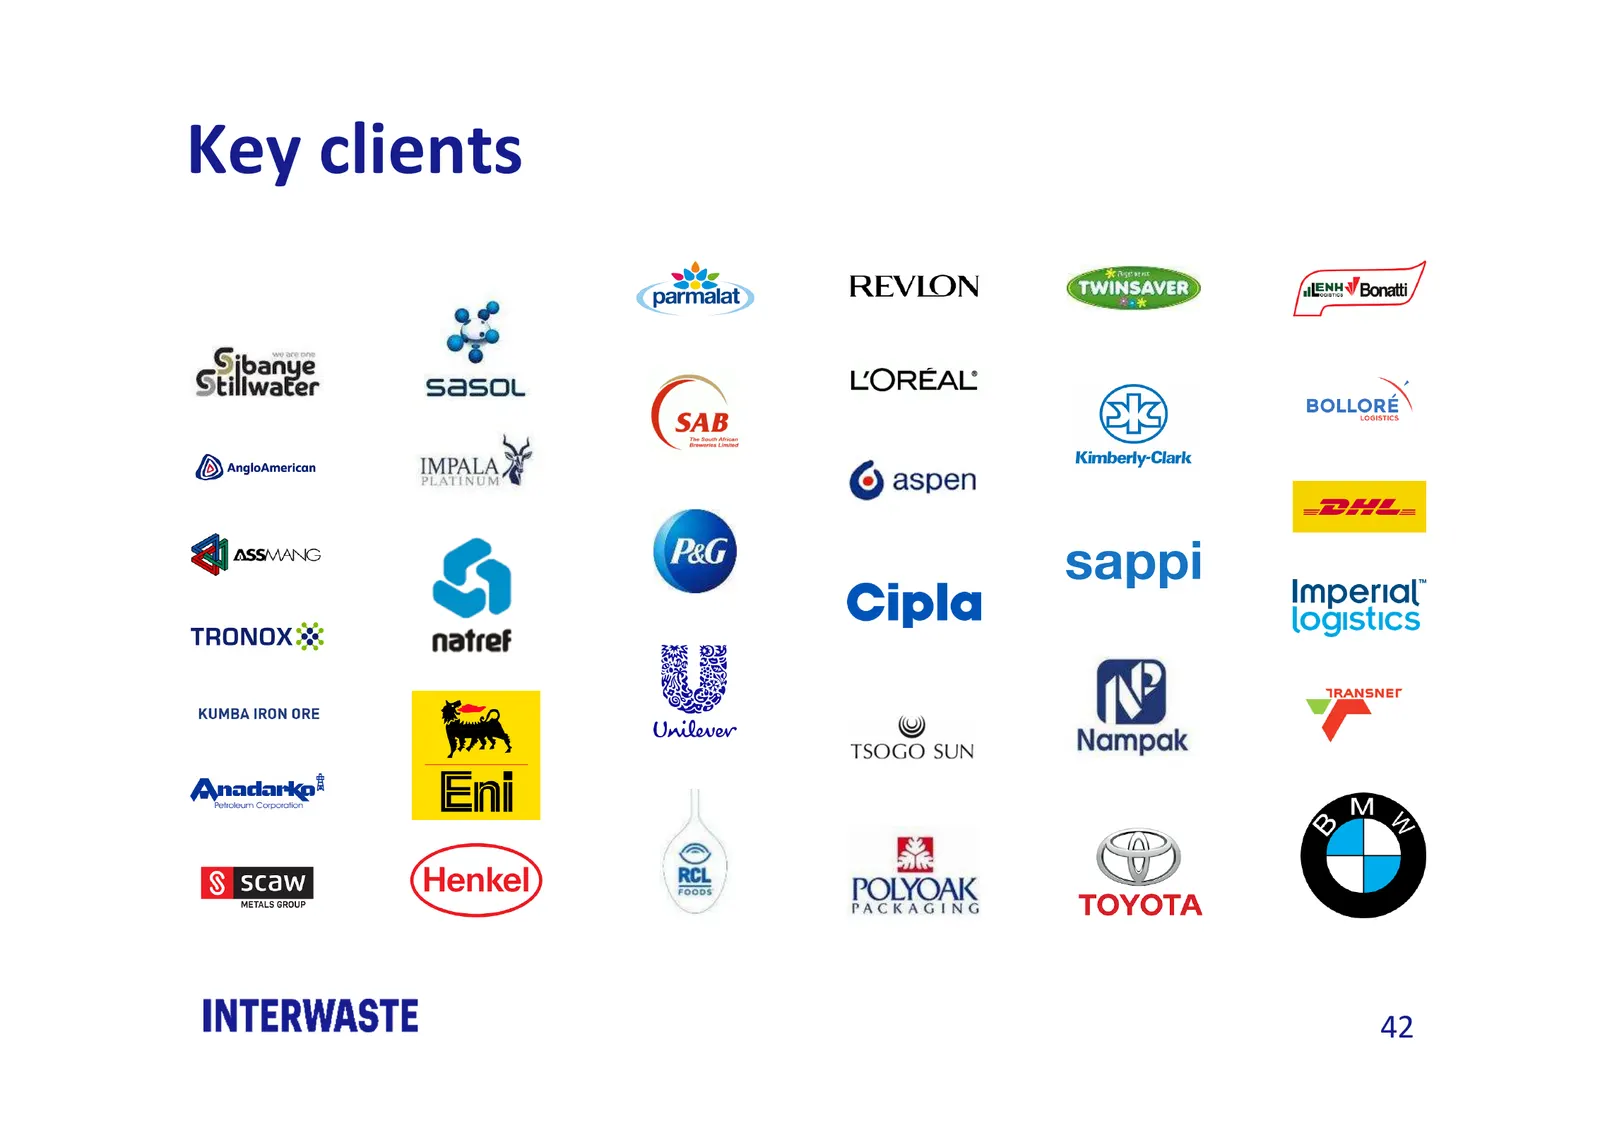
Key clients Sibanye Gtillwa er TRONOX = KUMBA IRON ORE Pettoleurn Corporation INTERWASTE e? oe Sasol IMPALA D natref Fooos Yg TSOGO SUN ak POLYOAK PACKAGING <=> a Kimberly-Clark sappl WW” Nampak CIA TOYOTA Cocistics Imperial" logistics TRANSNEr 42
Slide 43: Competitor overview and Interwaste market position
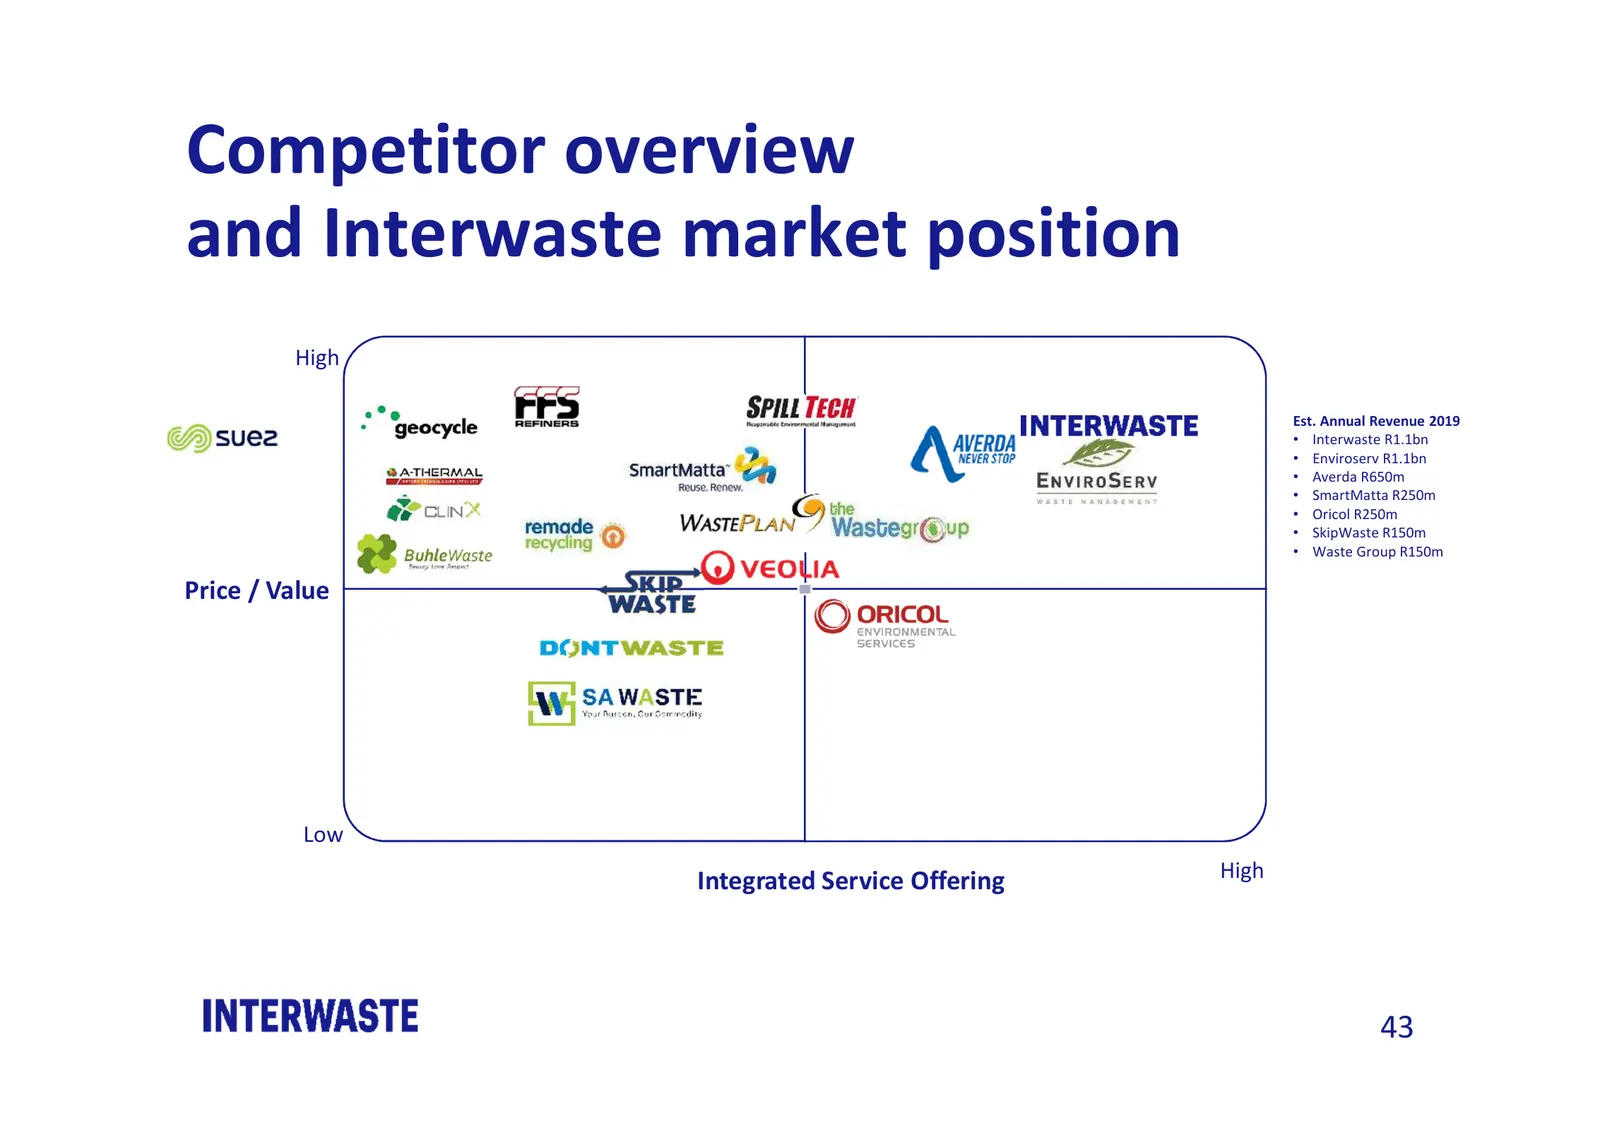
Competitor overview and Interwaste market position High Est. Annual Revenue 2019 • Interwaste R1.1bn • Enviroserv R1.1bn • Averda R650m • SmartMatta R250m • Oricol R250m • SkipWaste R150m • Waste Group R150m Price / Value Low Integrated Service Offering High 43
Slide 44: Southern African Market & Growth Opportunities
Southern African Market & Growth Opportunities interwaste.co.za 44
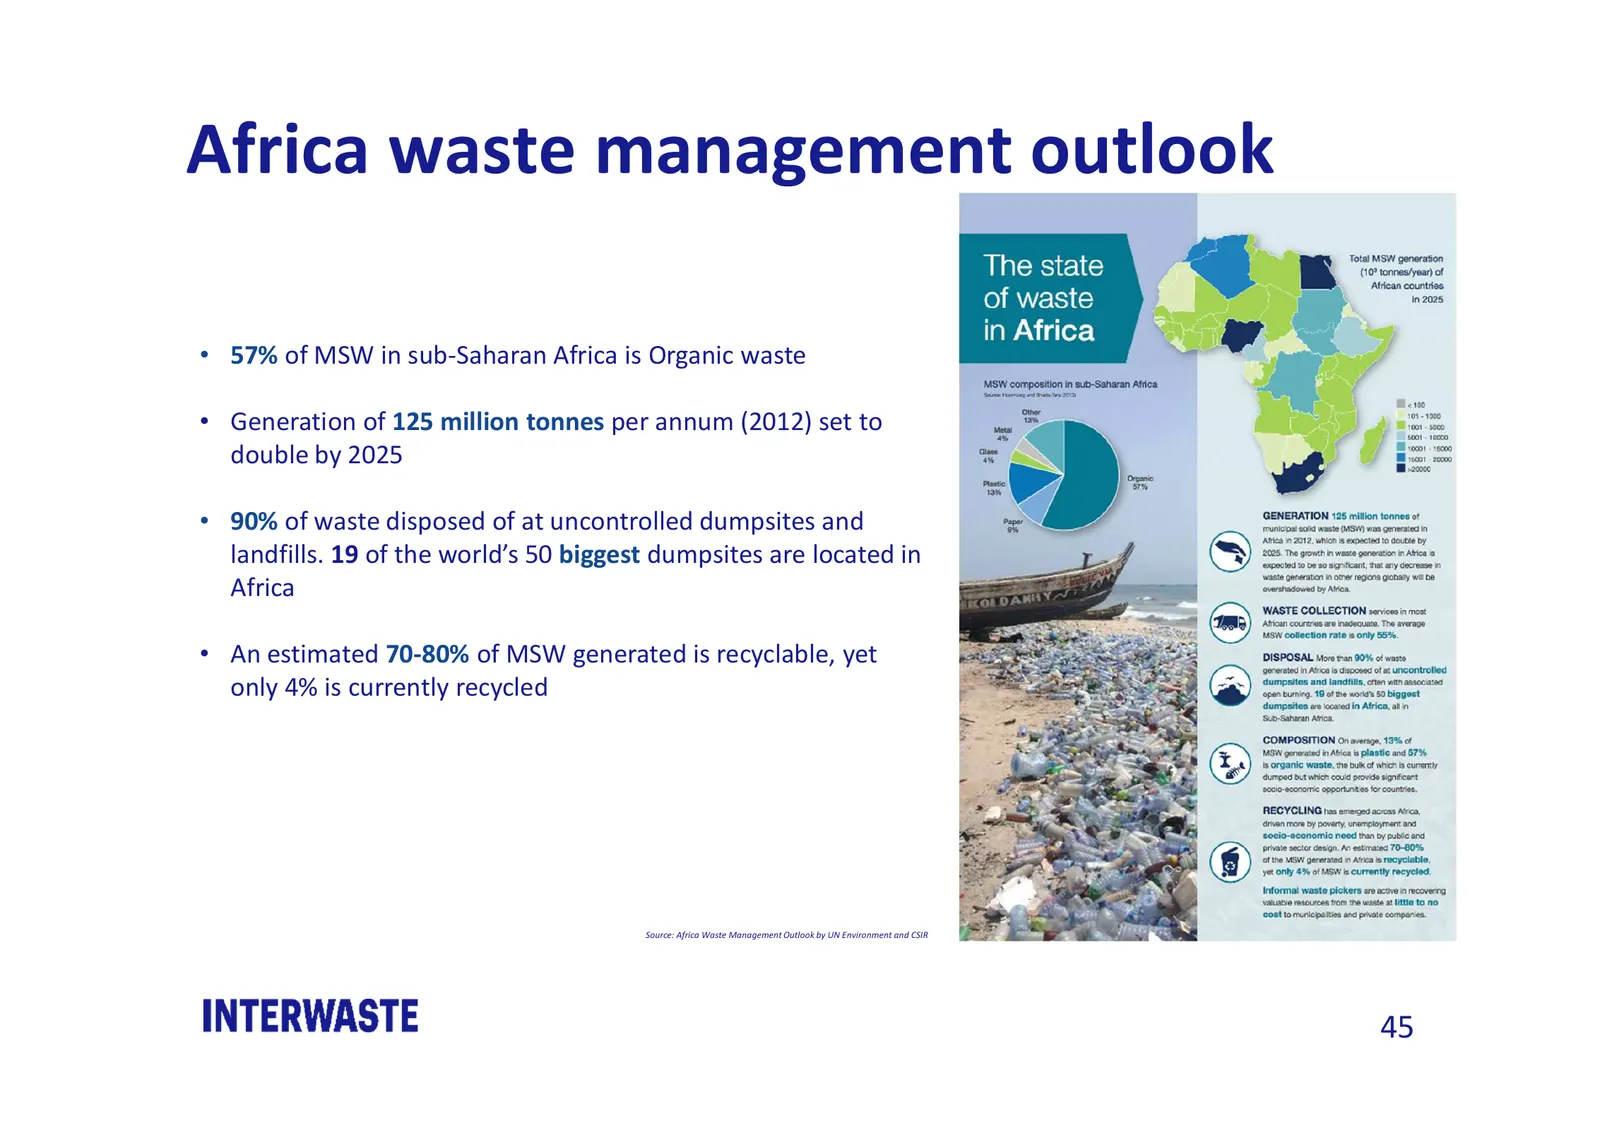
Slide 45: Africa waste management outlook
Africa waste management outlook • 57% of MSW in sub-Saharan Africa is Organic waste • Generation of 125 million tonnes per annum (2012) set to double by 2025 • 90% of waste disposed of at uncontrolled dumpsites and landfills. 19 of the world’s 50 biggest dumpsites are located in Africa • An estimate
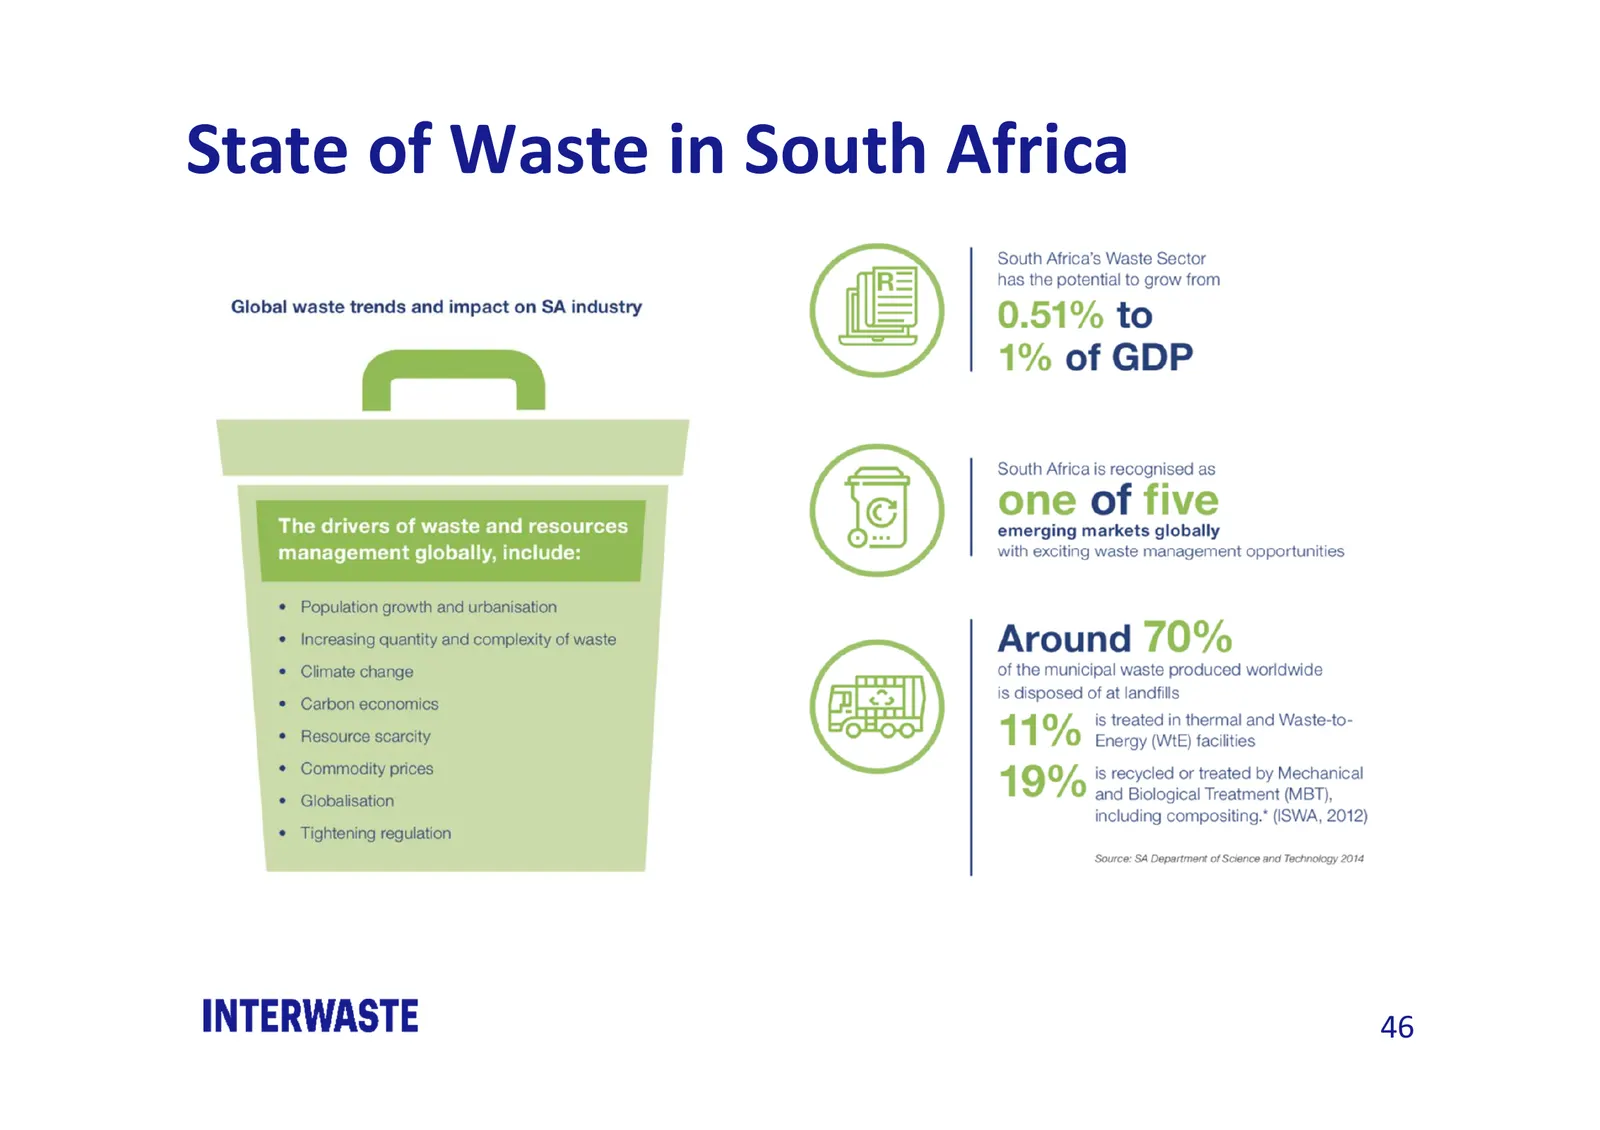
Slide 46: State of Waste in South Africa
State of Waste in South Africa 46
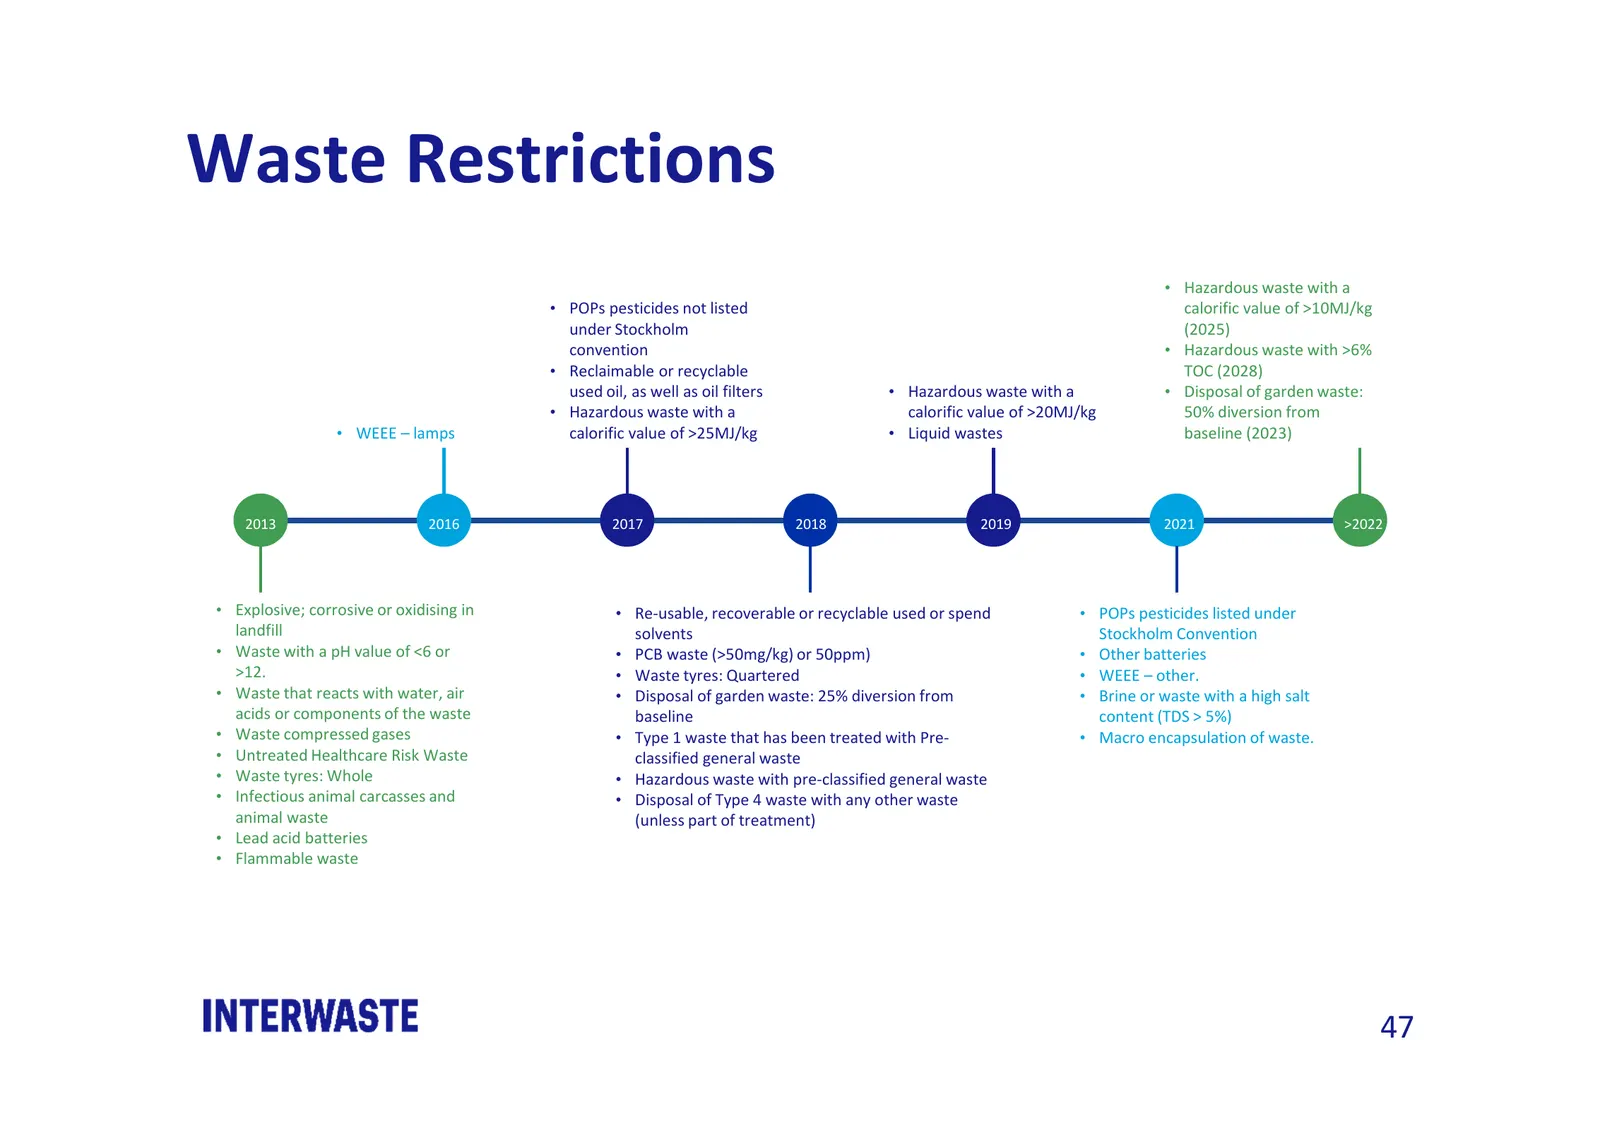
Slide 47: Waste Restrictions
Waste Restrictions • Hazardous waste with a • POPs pesticides not listed calorific value of >10MJ/kg under Stockholm (2025) convention • Hazardous waste with >6% • Reclaimable or recyclable TOC (2028) used oil, as well as oil filters • Hazardous waste with a • Disposal of garden waste: • Hazardous w
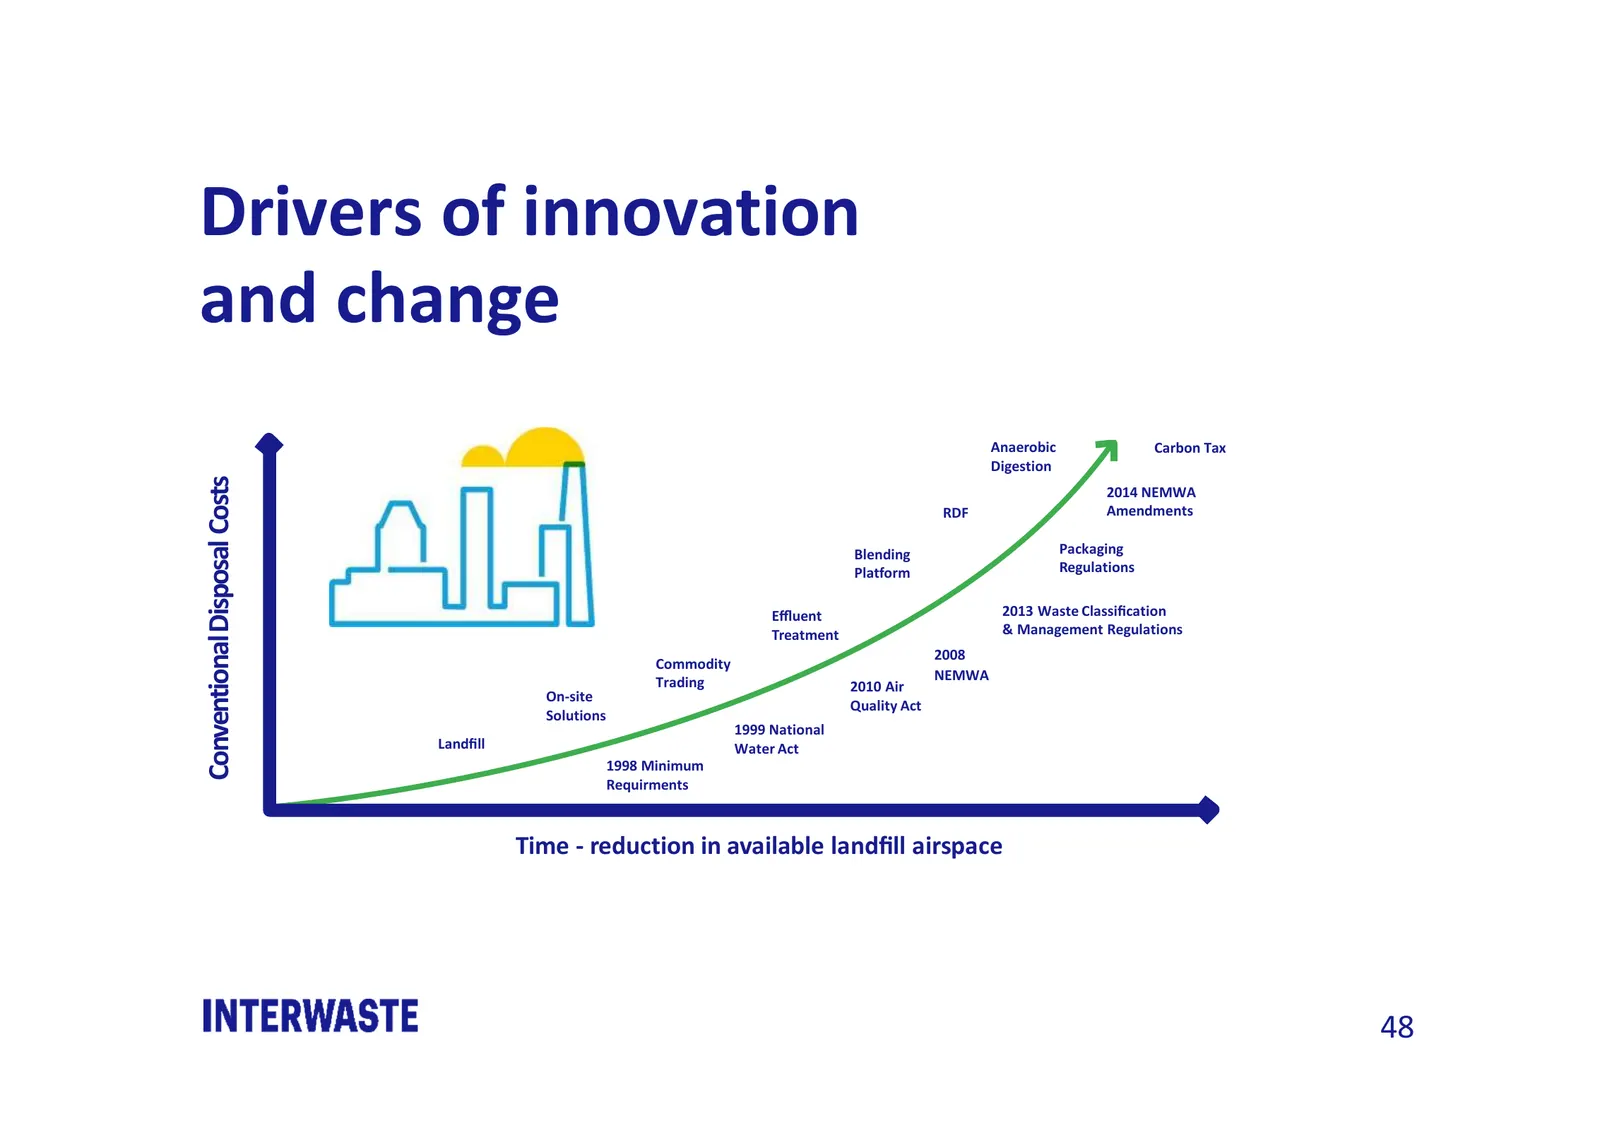
Slide 48: Drivers of innovation and change
Drivers of innovation and change Anaerobic Carbon Tax Digestion Conventional Disposal Costs 2014 NEMWA RDF Amendments Blending Packaging Platform Regulations Effluent 2013 Waste Classification Treatment & Management Regulations 2008 Commodity Trading NEMWA 2010 Air On-site Quality Act Solutions 1999 Na
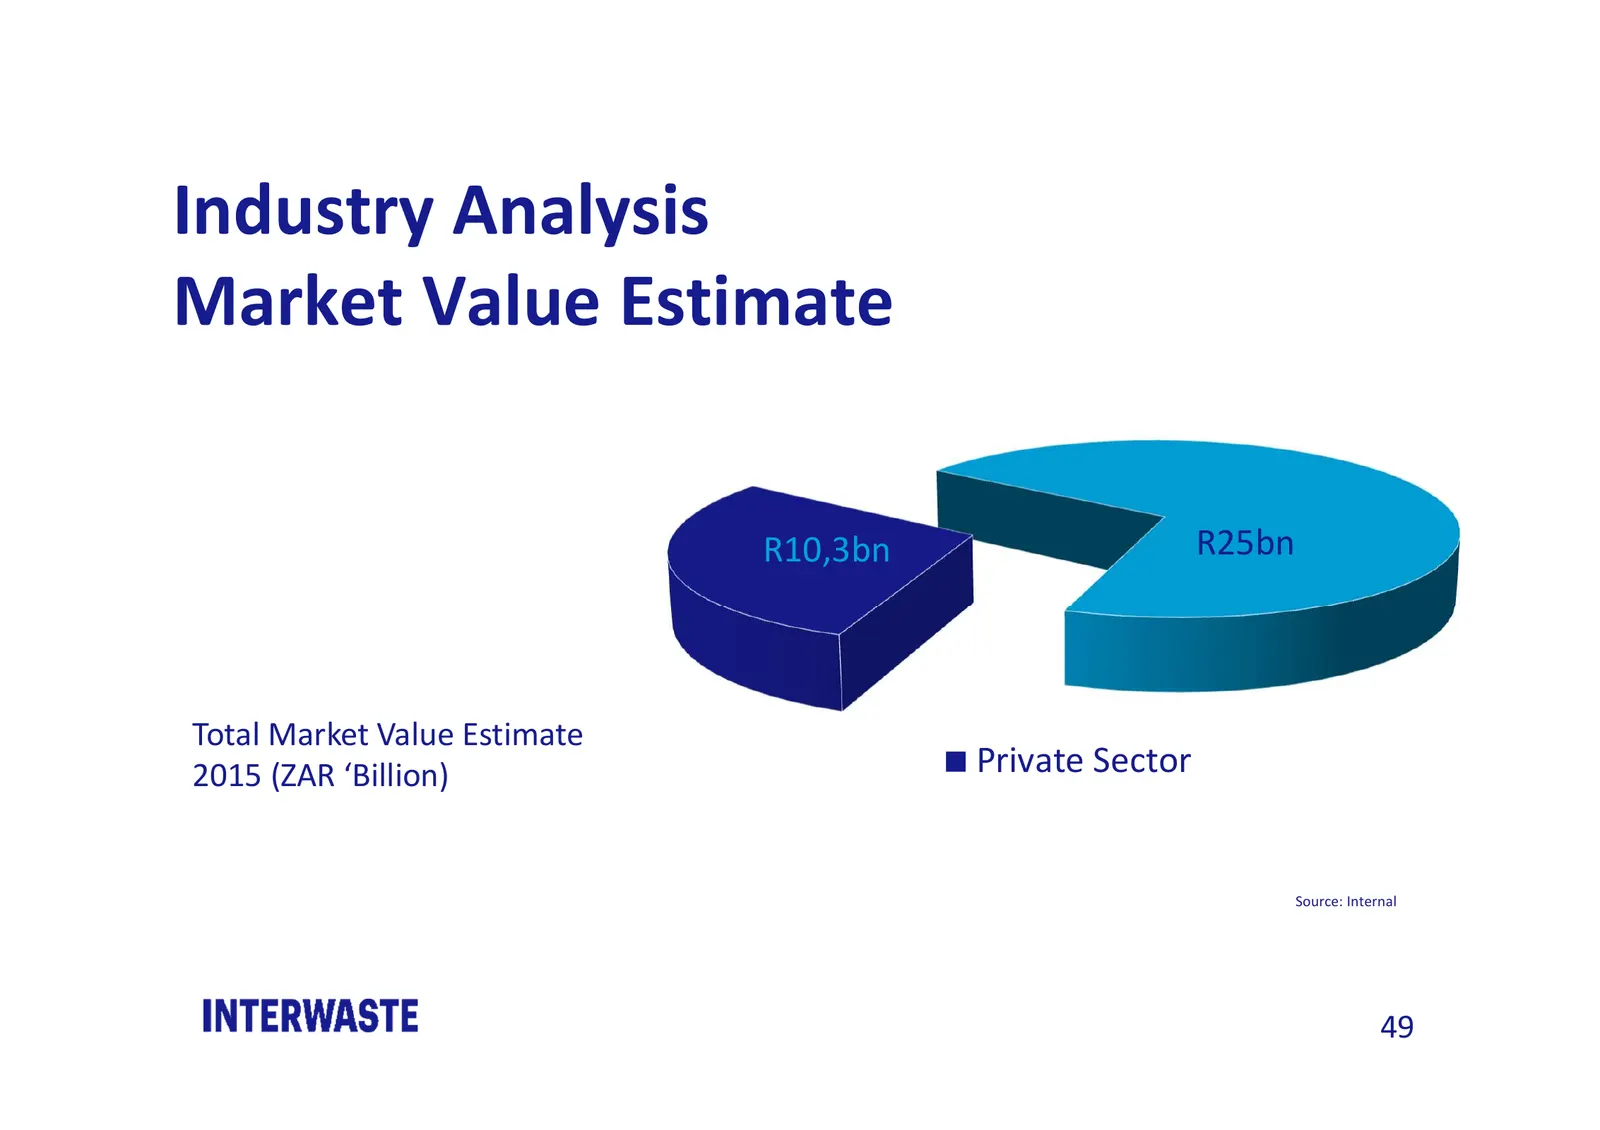
Slide 49: Industry Analysis Market Value Estimate
Industry Analysis Market Value Estimate R10,3bn R25bn Total Market Value Estimate 2015 (ZAR ‘Billion) Private Sector Source: Internal 49
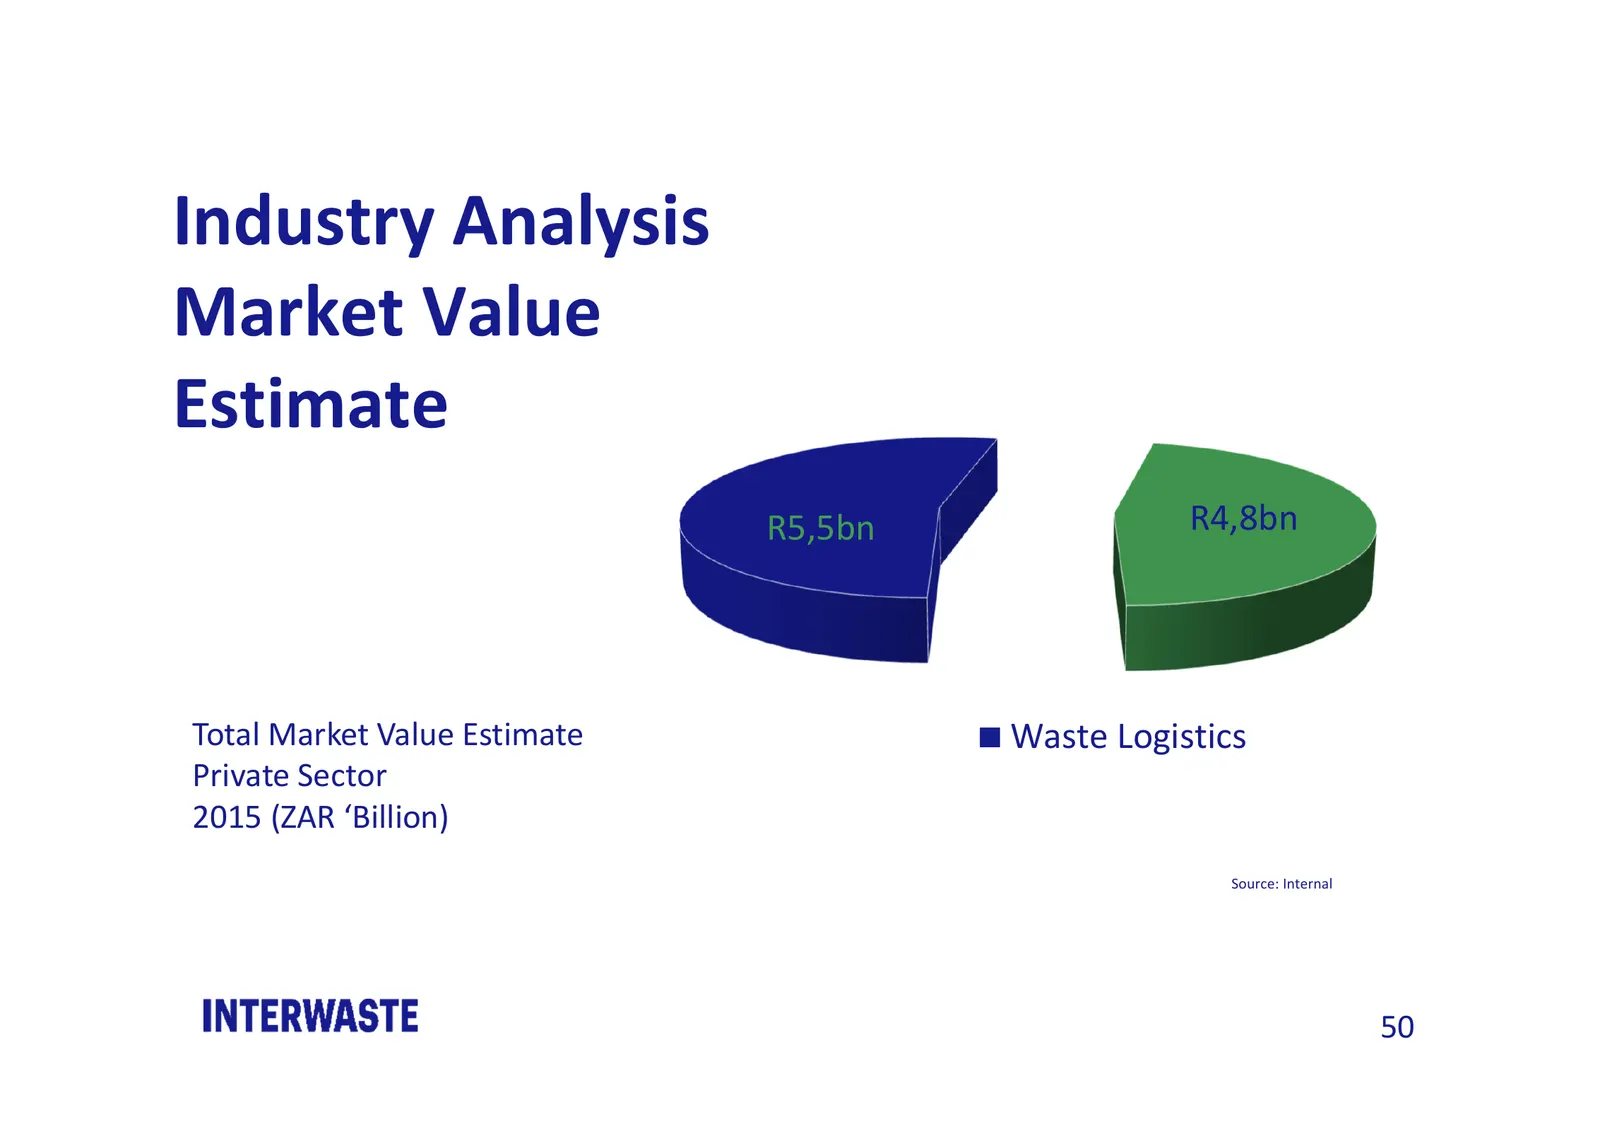
Slide 50: Industry Analysis Market Value Estimate
Industry Analysis Market Value Estimate R5,5bn R4,8bn Total Market Value Estimate Waste Logistics Private Sector 2015 (ZAR ‘Billion) Source: Internal 50
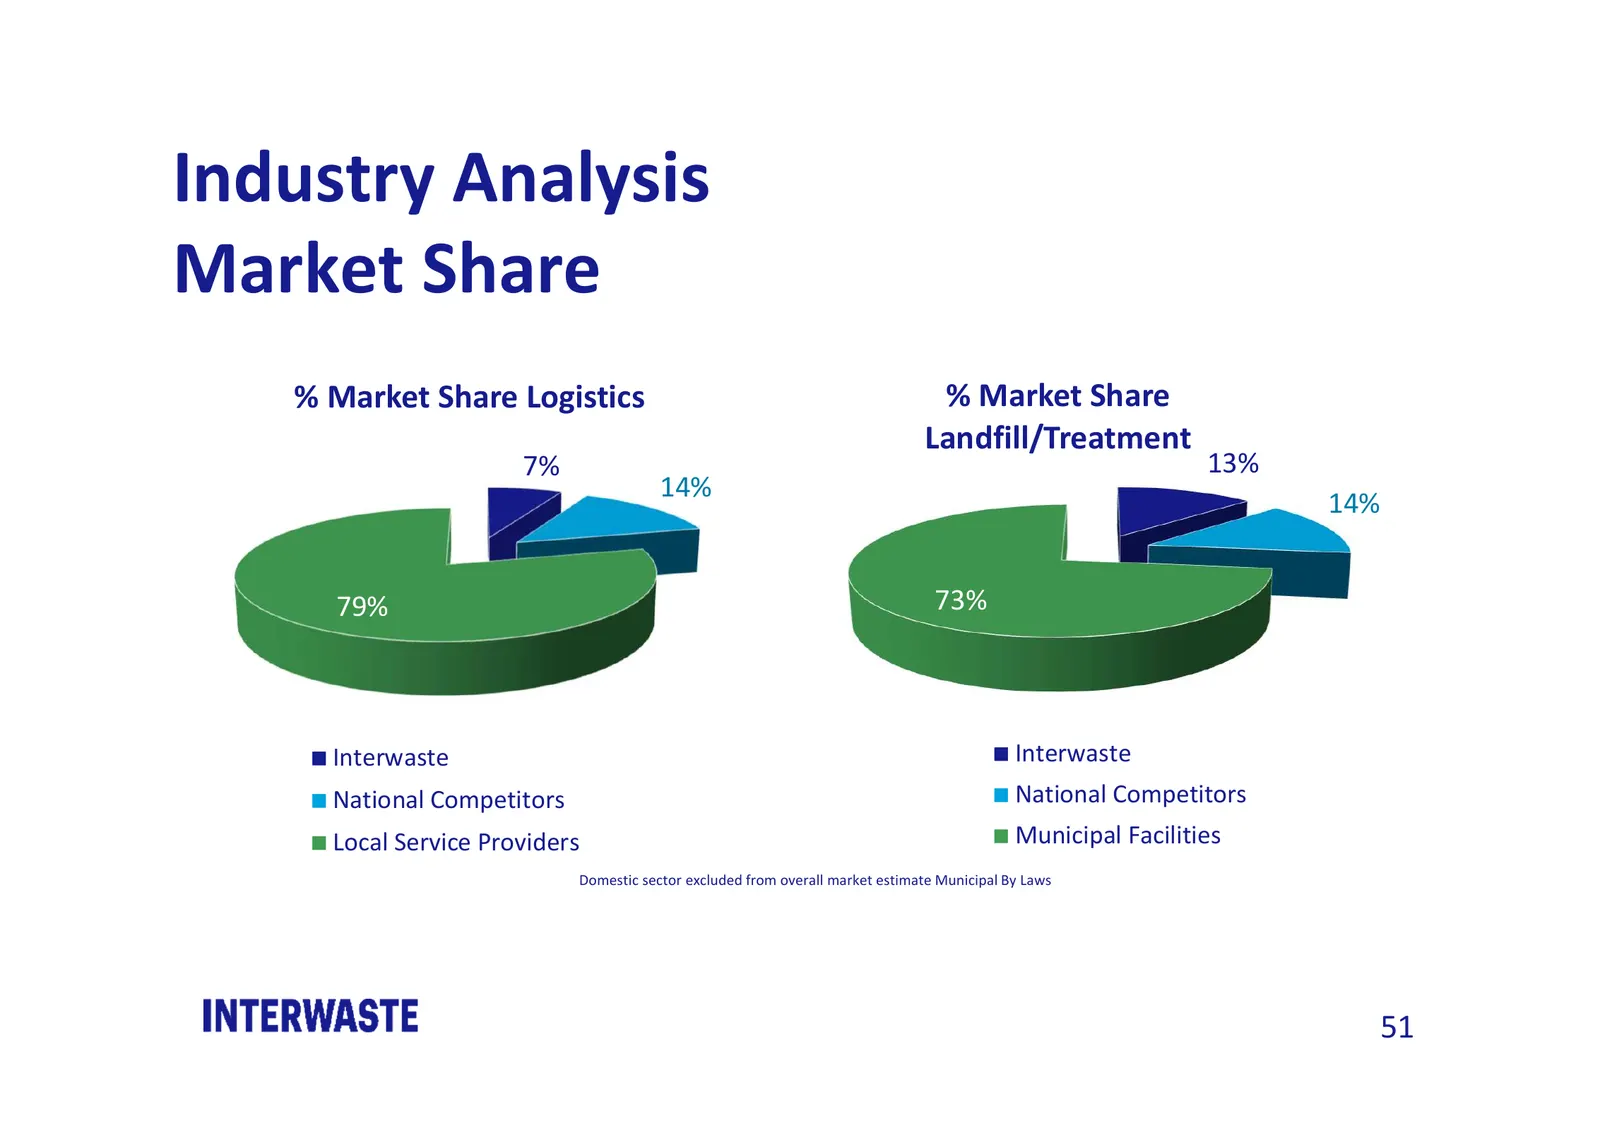
Slide 51: Industry Analysis Market Share
Industry Analysis Market Share % Market Share Logistics % Market Share Landfill/Treatment 7% 13% 14% 14% 79% 73% Interwaste Interwaste National Competitors National Competitors Local Service Providers Municipal Facilities Domestic sector excluded from overall market estimate Municipal By Laws 51
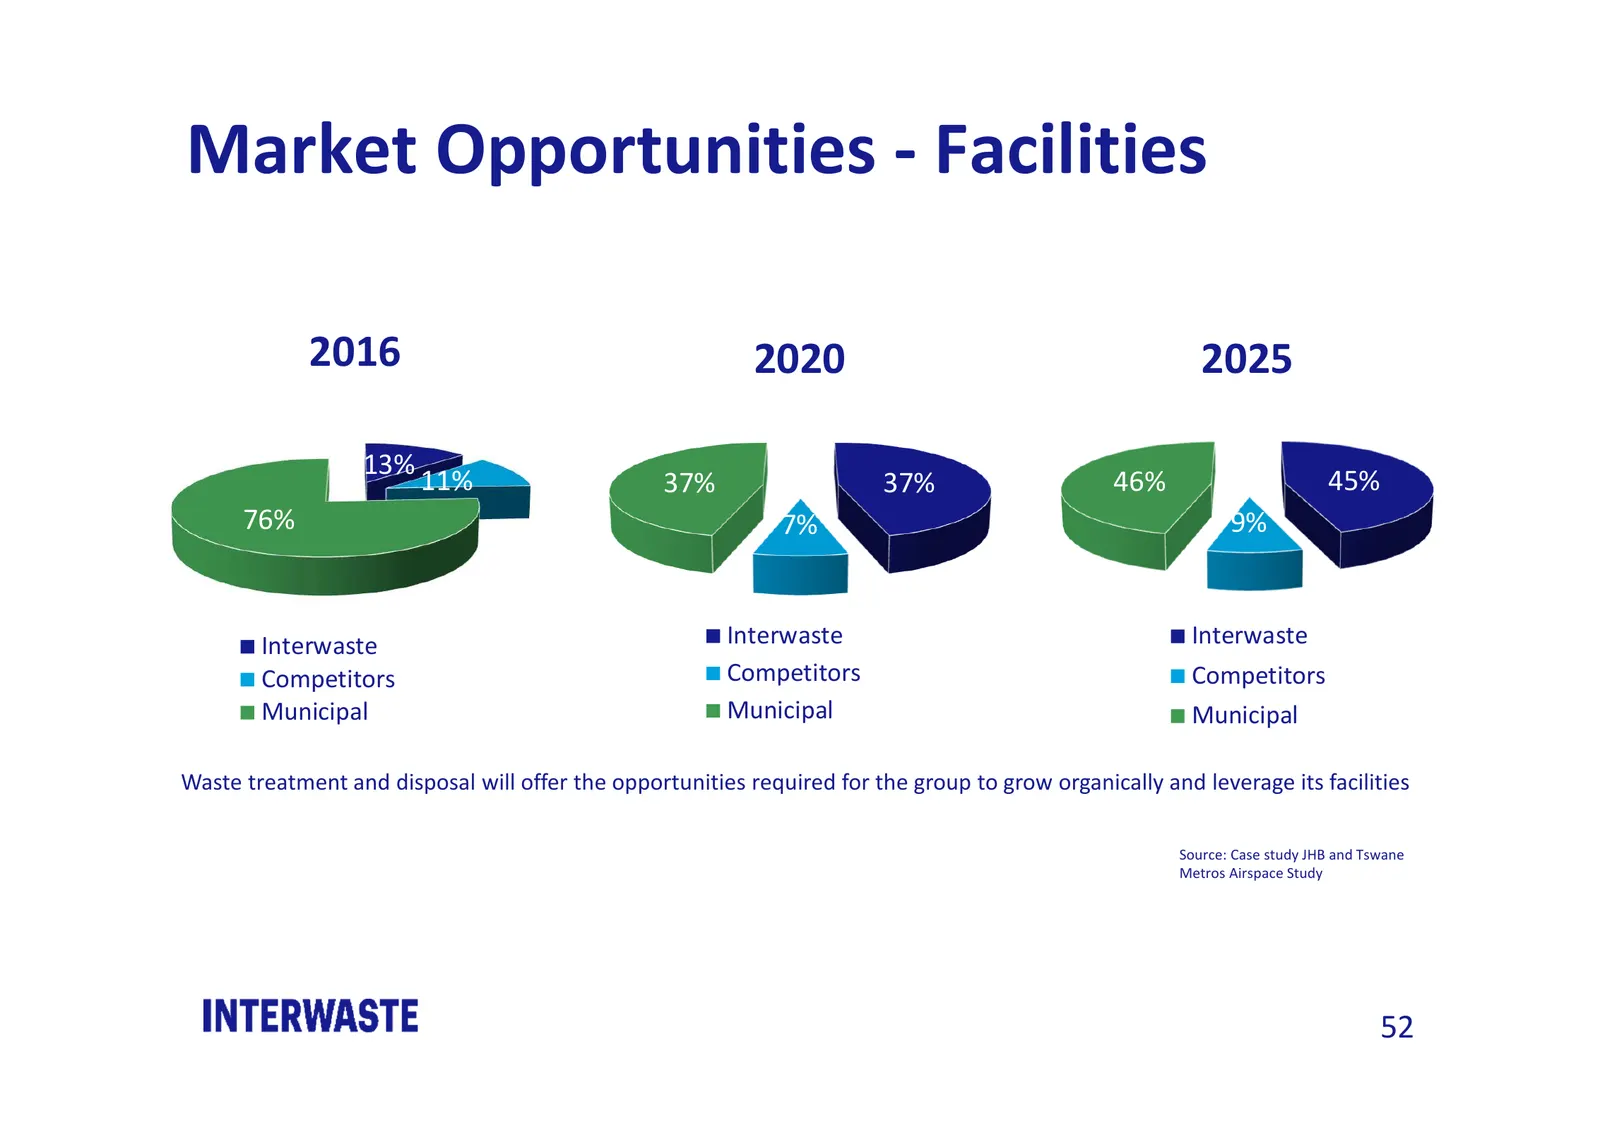
Slide 52: Market Opportunities - Facilities
Market Opportunities - Facilities 2016 2020 2025 13% 11% 37% 37% 46% 45% 76% 7% 9% Interwaste Interwaste Interwaste Competitors Competitors Competitors Municipal Municipal Municipal Waste treatment and disposal will offer the opportunities required for the group to grow organically and leverage its
Slide 53: F2020 Outlook
F2020 Outlook interwaste.co.za 53
Slide 54: F2020: Outlook
F2020 : Outlook • Interwaste remains well positioned for growth and to offer Innovative Integrated Waste Management Solutions • Strong long term relationships with blue chip clients • Well positioned depot network especially in Northern Mozambique providing significant growth opportunities • Strong
Slide 55: Focus: Mecomer: Major Take Over on High Value Added Markets in Italy
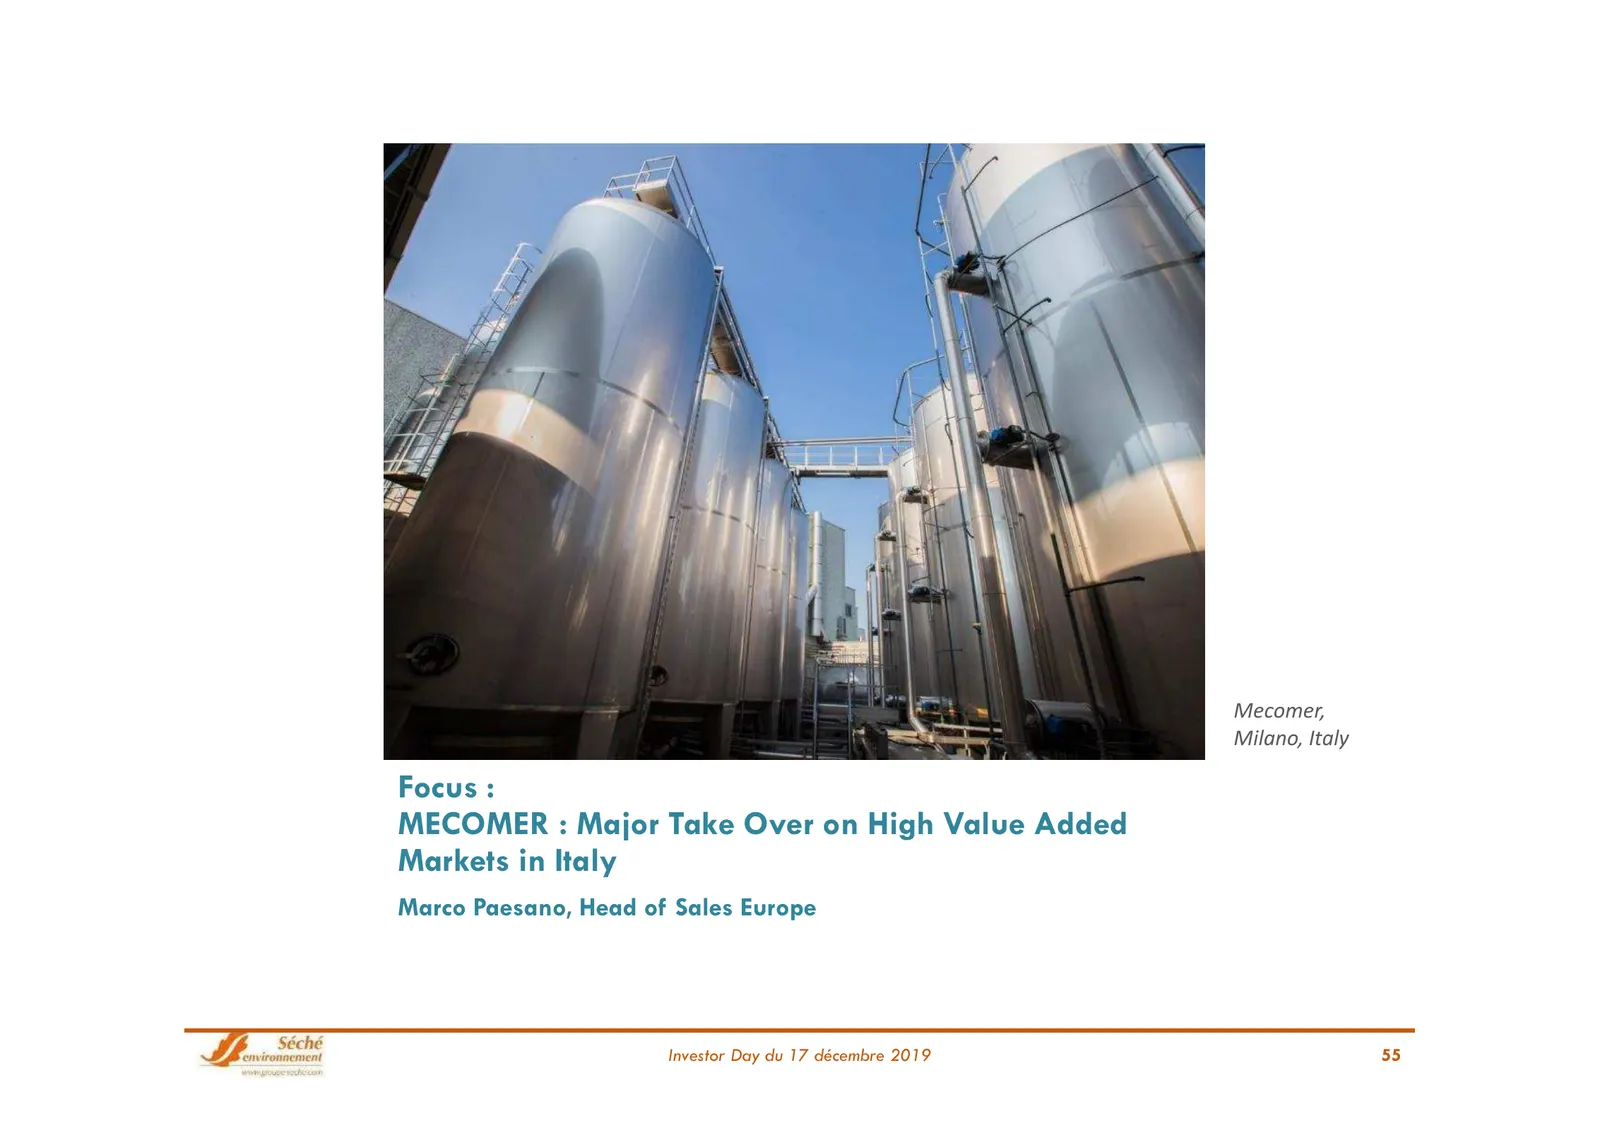
Mecomer, Milano, Italy Focus : MECOMER : Major Take Over on High Value Added Markets in Italy Marco Paesano, Head of Sales Europe Investor Day du 17 décembre 2019 55
Slide 56: Mecomer: Polyfunctional Hazardous Waste Platform
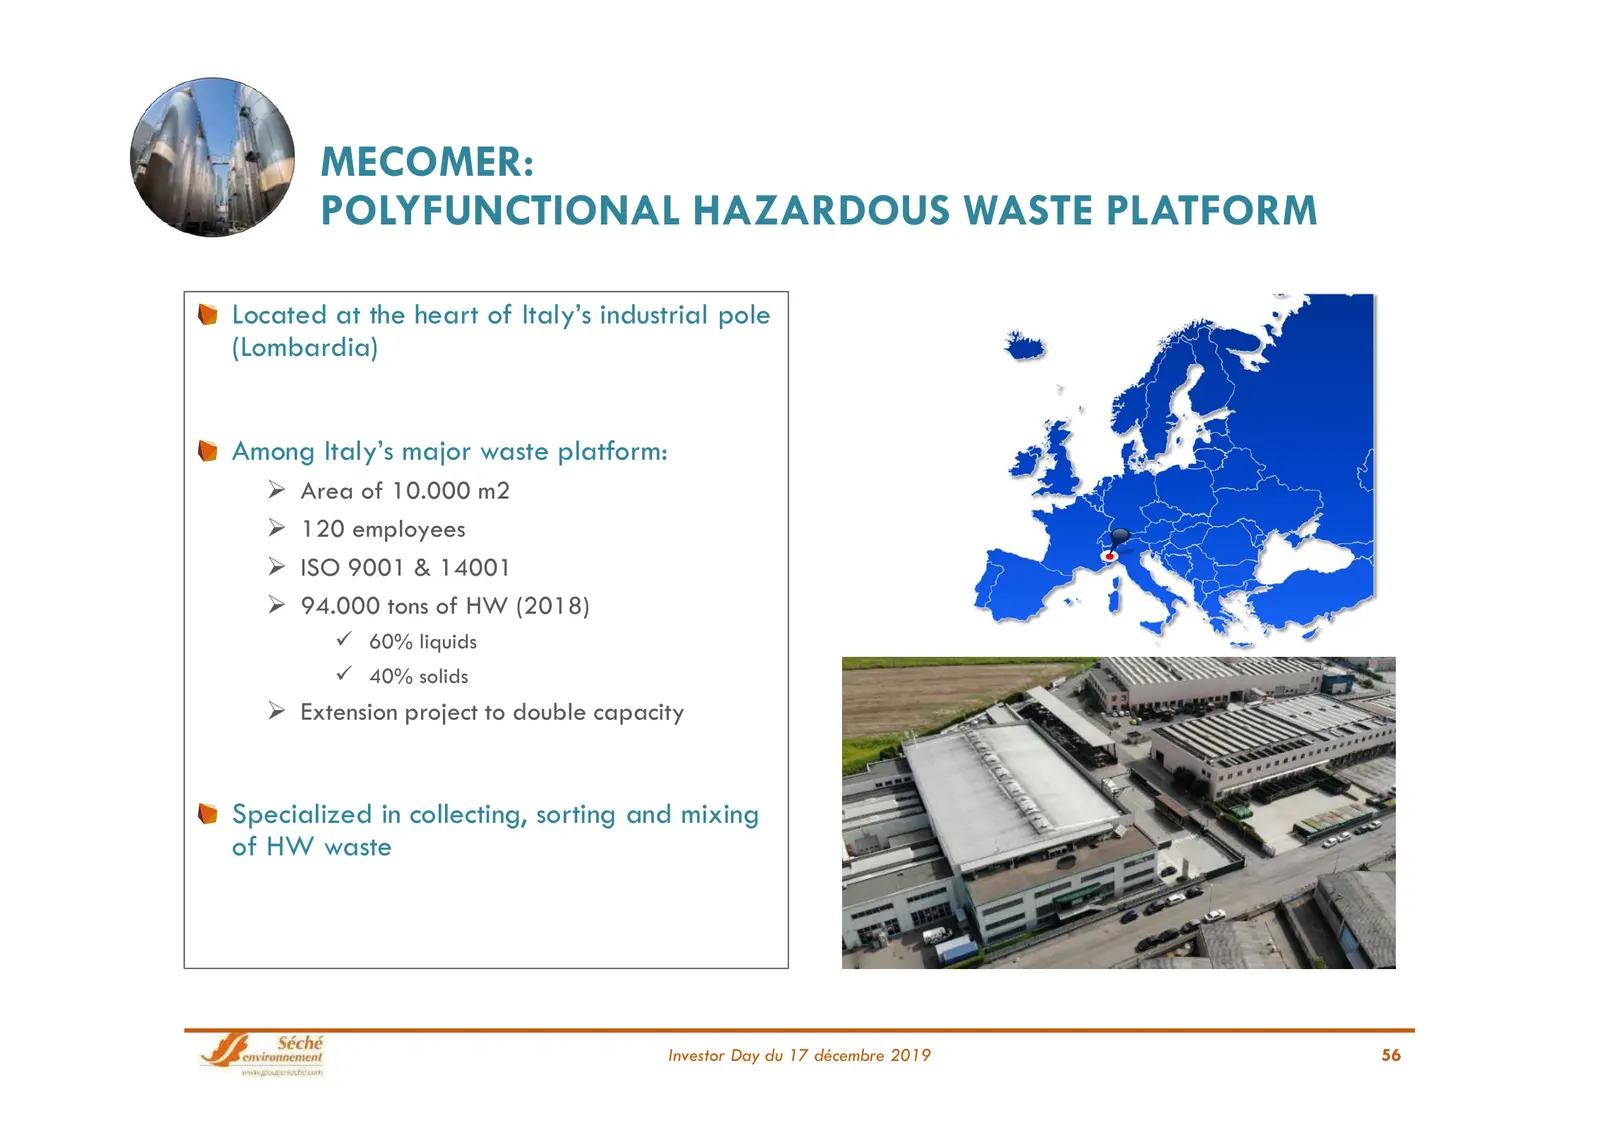
MECOMER: POLYFUNCTIONAL HAZARDOUS WASTE PLATFORM Located at the heart of Italy’s industrial pole (Lombardia) Among Italy’s major waste platform: Area of 10.000 m2 120 employees ISO 9001 & 14001 94.000 tons of HW (2018) 60% liquids 40% solids Extension project to double capacity Special
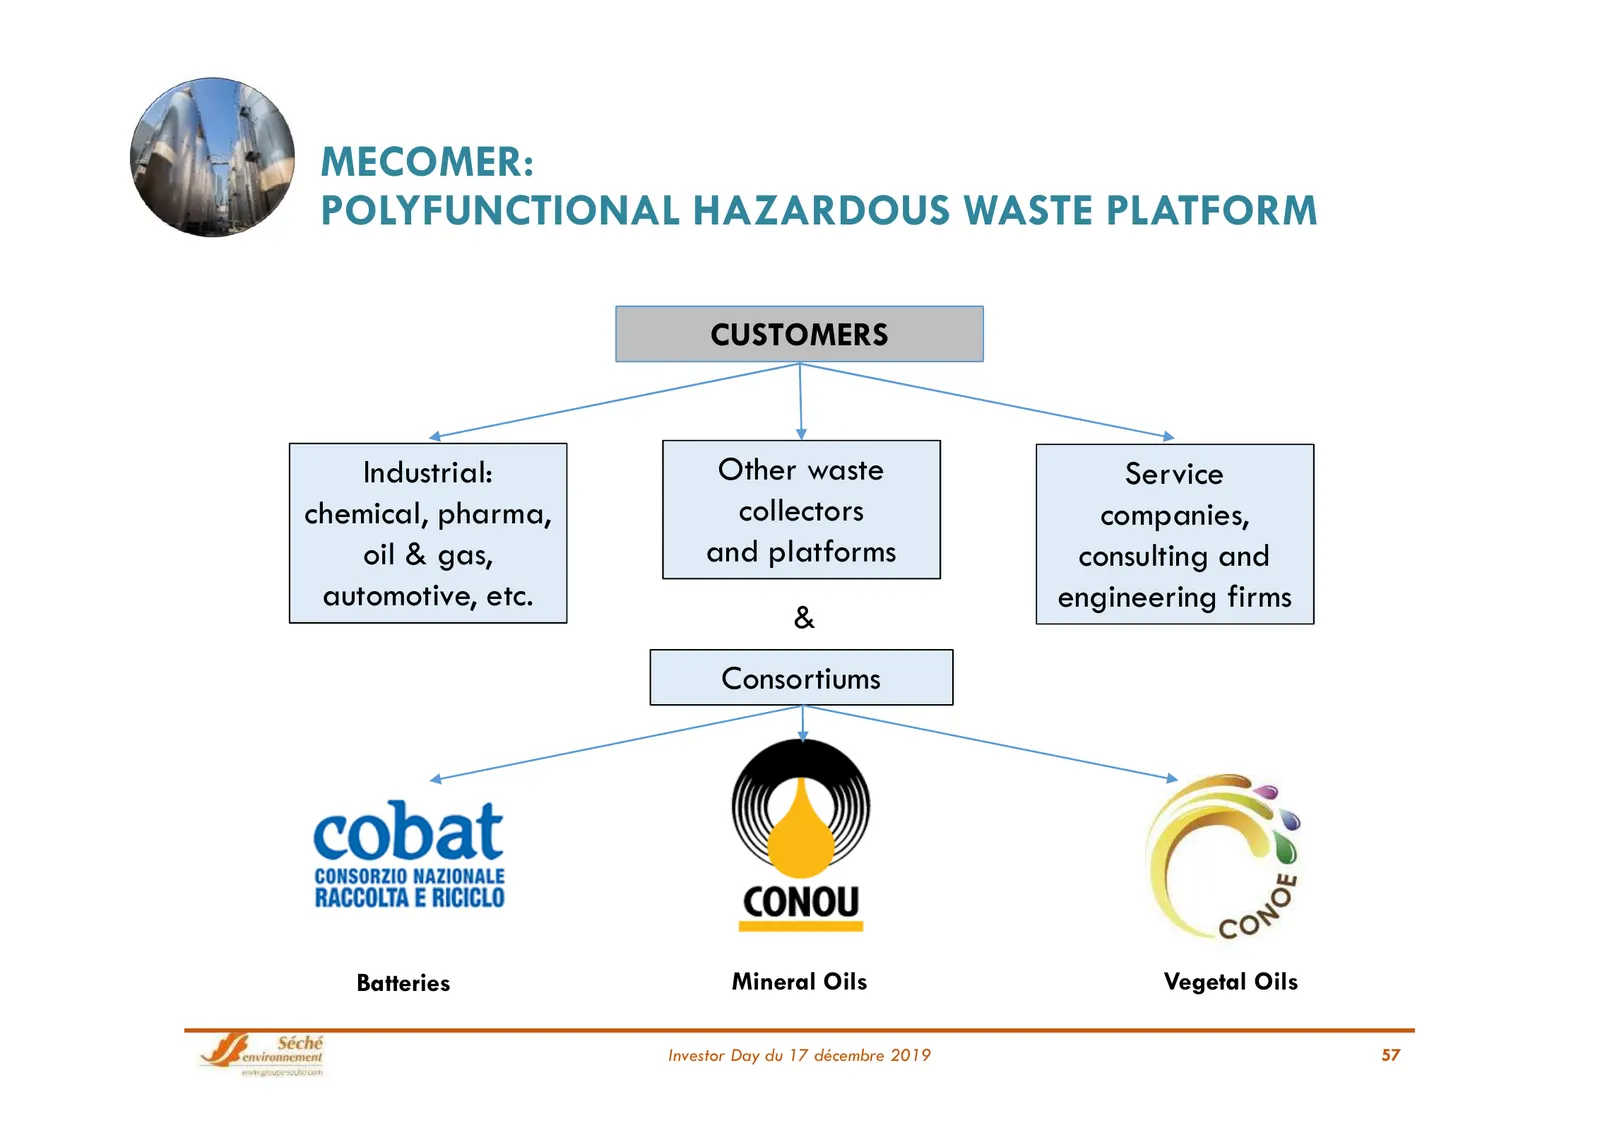
Slide 57: Mecomer: Polyfunctional Hazardous Waste Platform
MECOMER: POLYFUNCTIONAL HAZARDOUS WASTE PLATFORM CUSTOMERS Industrial: Other waste Service chemical, pharma, collectors companies, oil & gas, and platforms consulting and automotive, etc. engineering firms & Consortiums Batteries Mineral Oils Vegetal Oils Investor Day du 17 décembre 2019 57
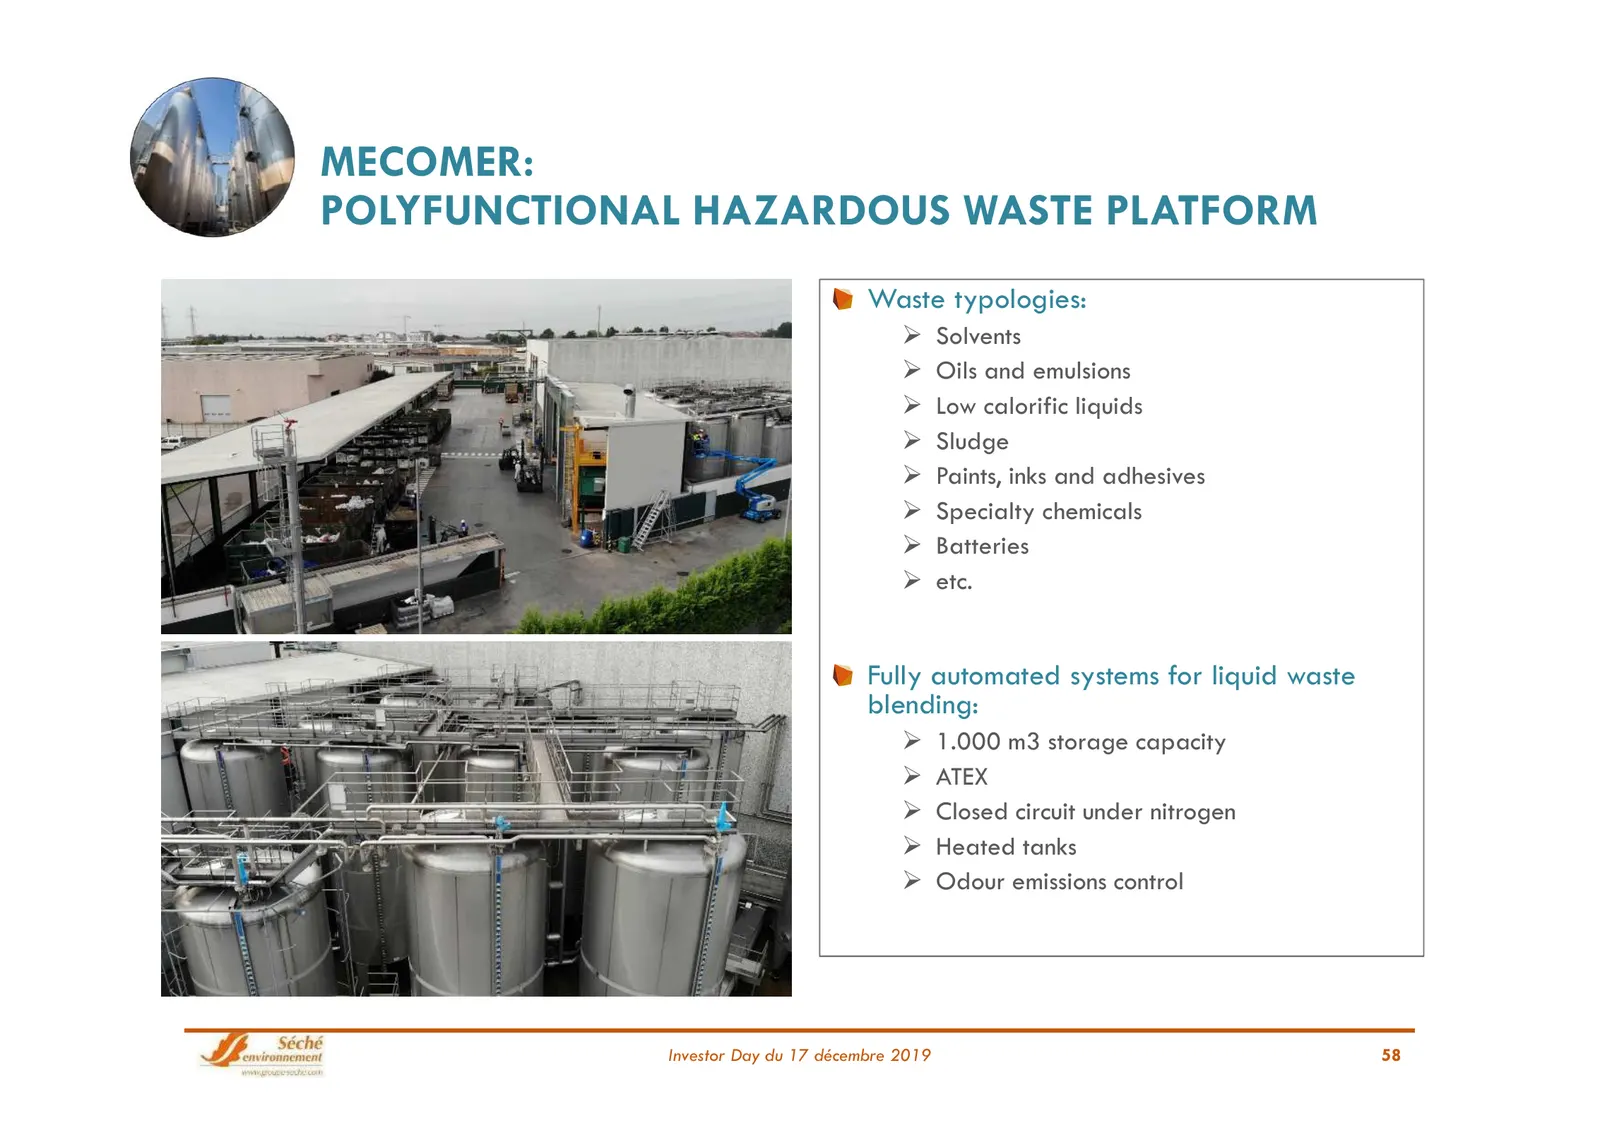
Slide 58: Mecomer: Polyfunctional Hazardous Waste Platform
MECOMER: POLYFUNCTIONAL HAZARDOUS WASTE PLATFORM Waste typologies: Solvents Oils and emulsions Low calorific liquids Sludge Paints, inks and adhesives Specialty chemicals Batteries etc. Fully automated systems for liquid waste blending: 1.000 m3 storage capacity ATEX Closed cir
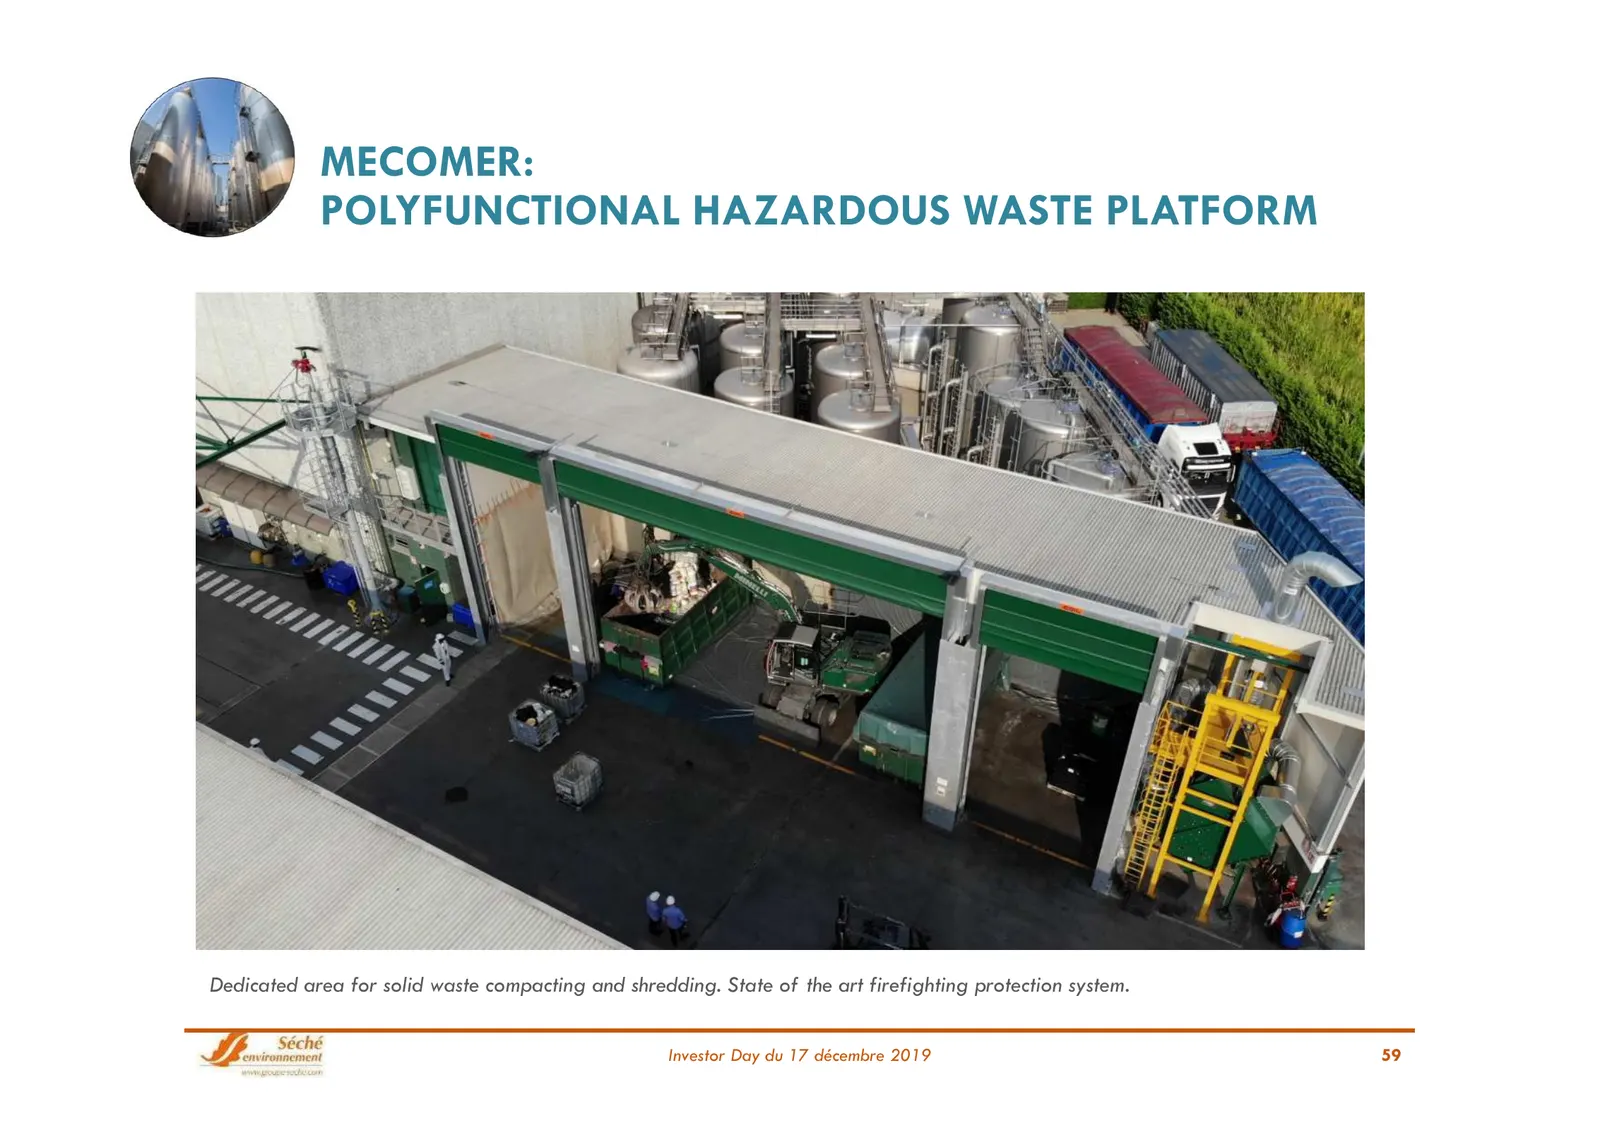
Slide 59: Mecomer: Polyfunctional Hazardous Waste Platform
MECOMER: POLYFUNCTIONAL HAZARDOUS WASTE PLATFORM Dedicated area for solid waste compacting and shredding. State of the art firefighting protection system. Investor Day du 17 décembre 2019 59
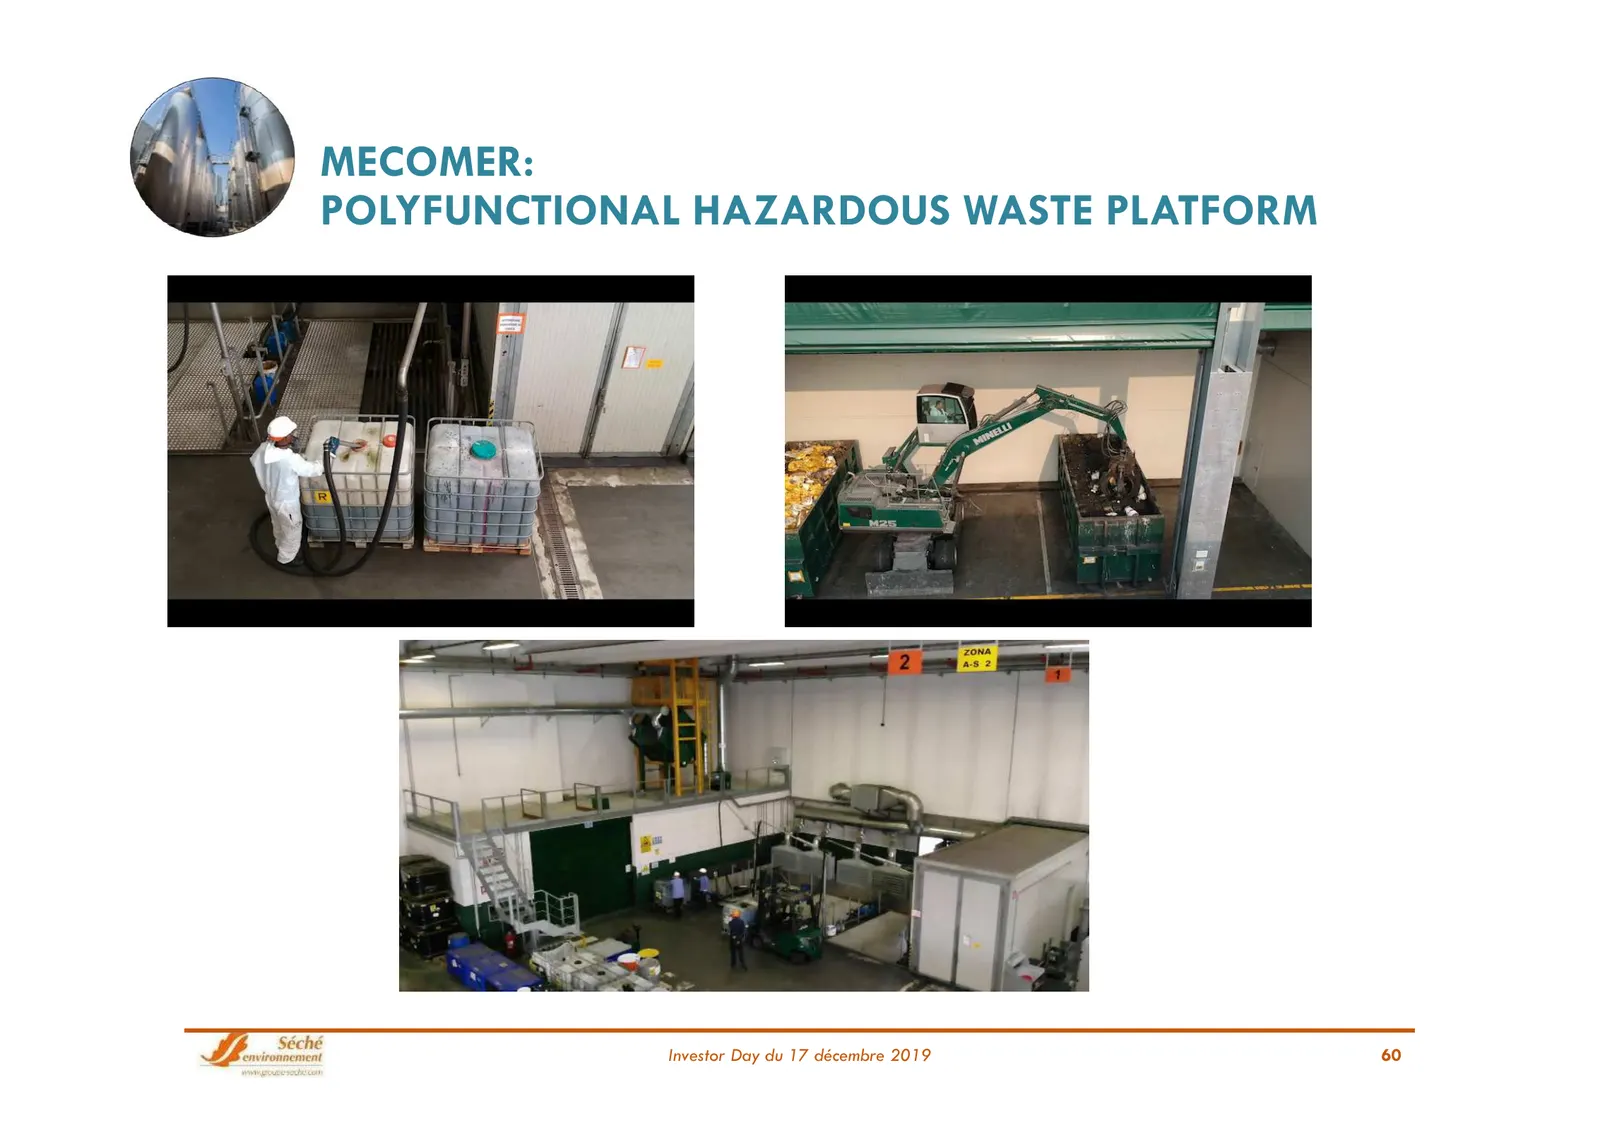
Slide 60: Mecomer: Polyfunctional Hazardous Waste Platform
MECOMER: POLYFUNCTIONAL HAZARDOUS WASTE PLATFORM Investor Day du 17 décembre 2019 60
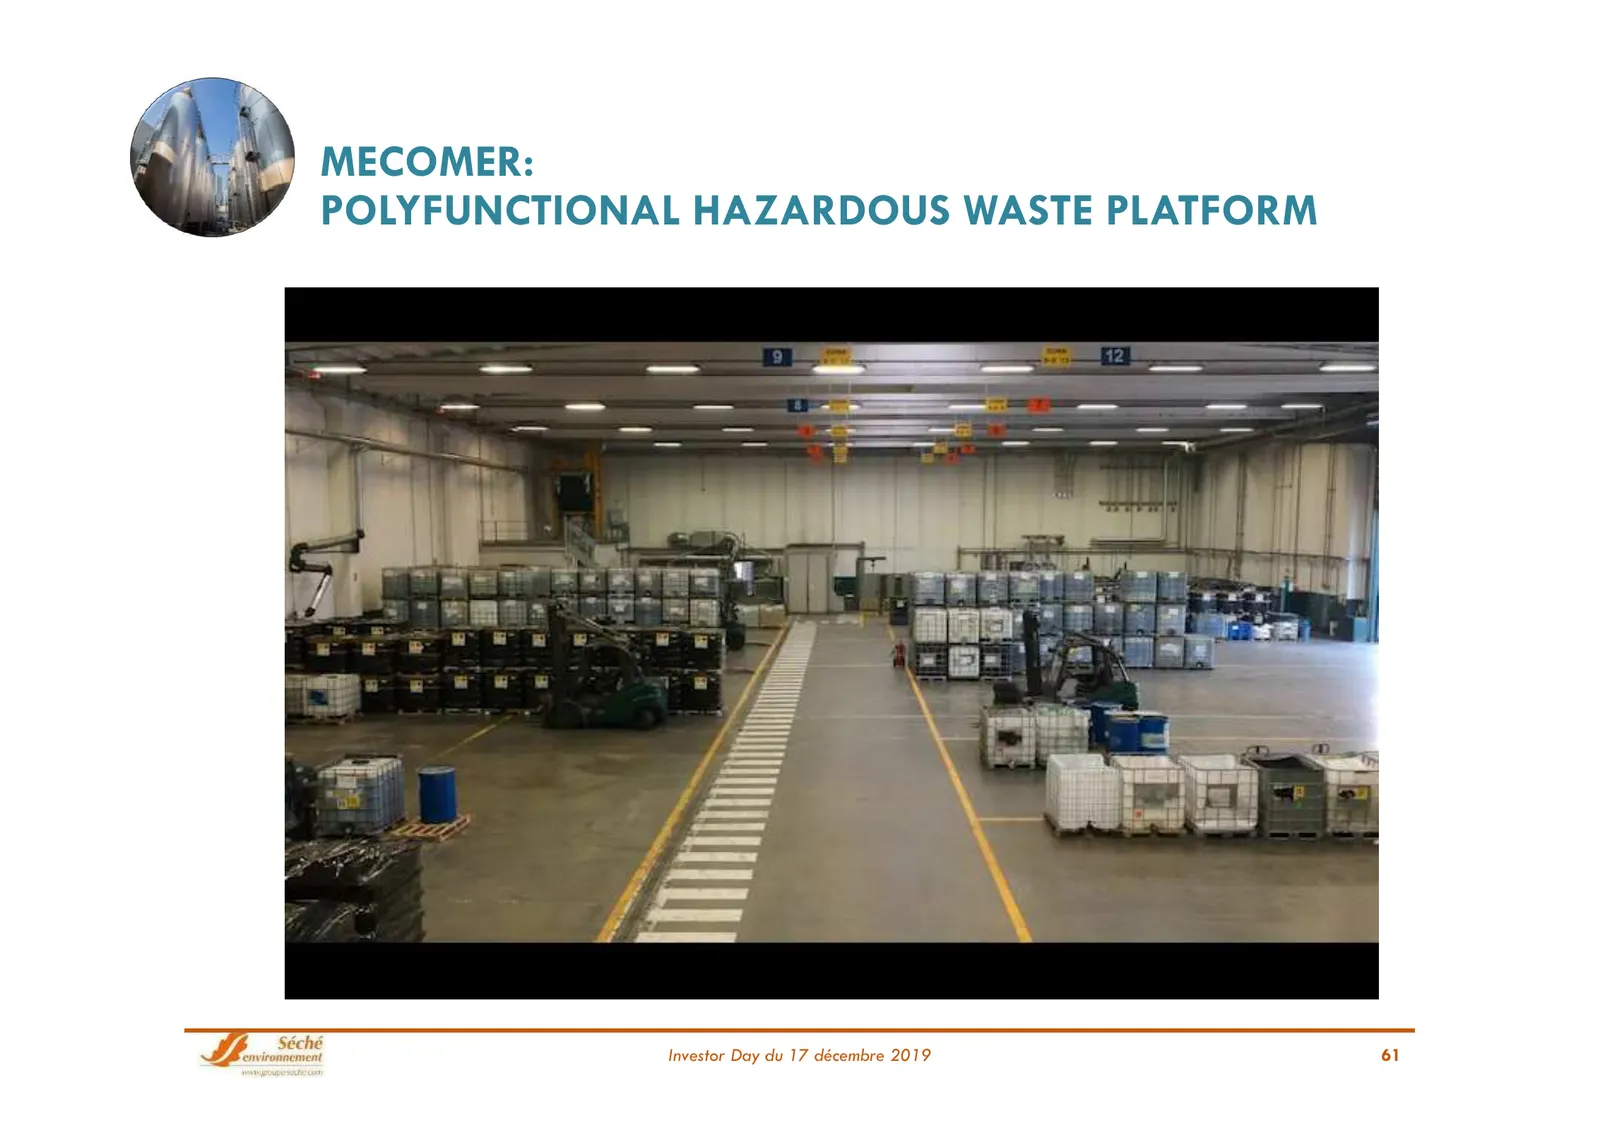
Slide 61: Mecomer: Polyfunctional Hazardous Waste Platform
MECOMER: POLYFUNCTIONAL HAZARDOUS WASTE PLATFORM Investor Day du 17 décembre 2019 61
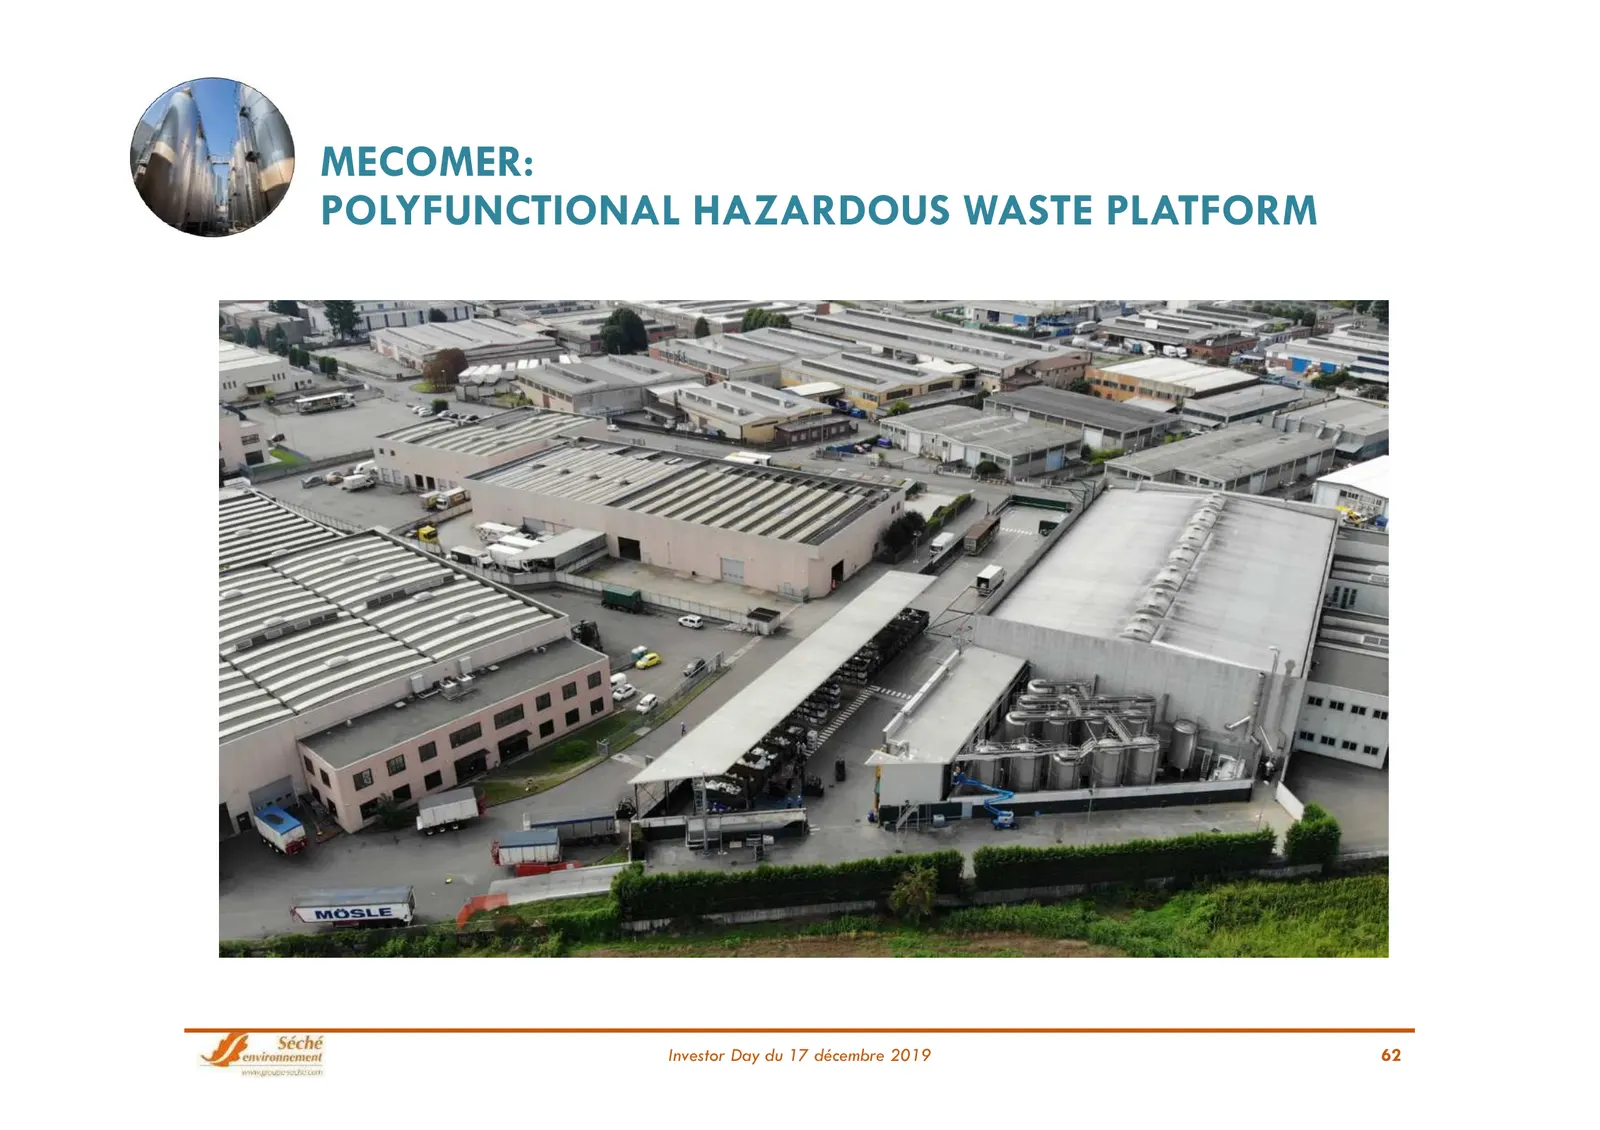
Slide 62: Mecomer: Polyfunctional Hazardous Waste Platform
MECOMER: POLYFUNCTIONAL HAZARDOUS WASTE PLATFORM Investor Day du 17 décembre 2019 62
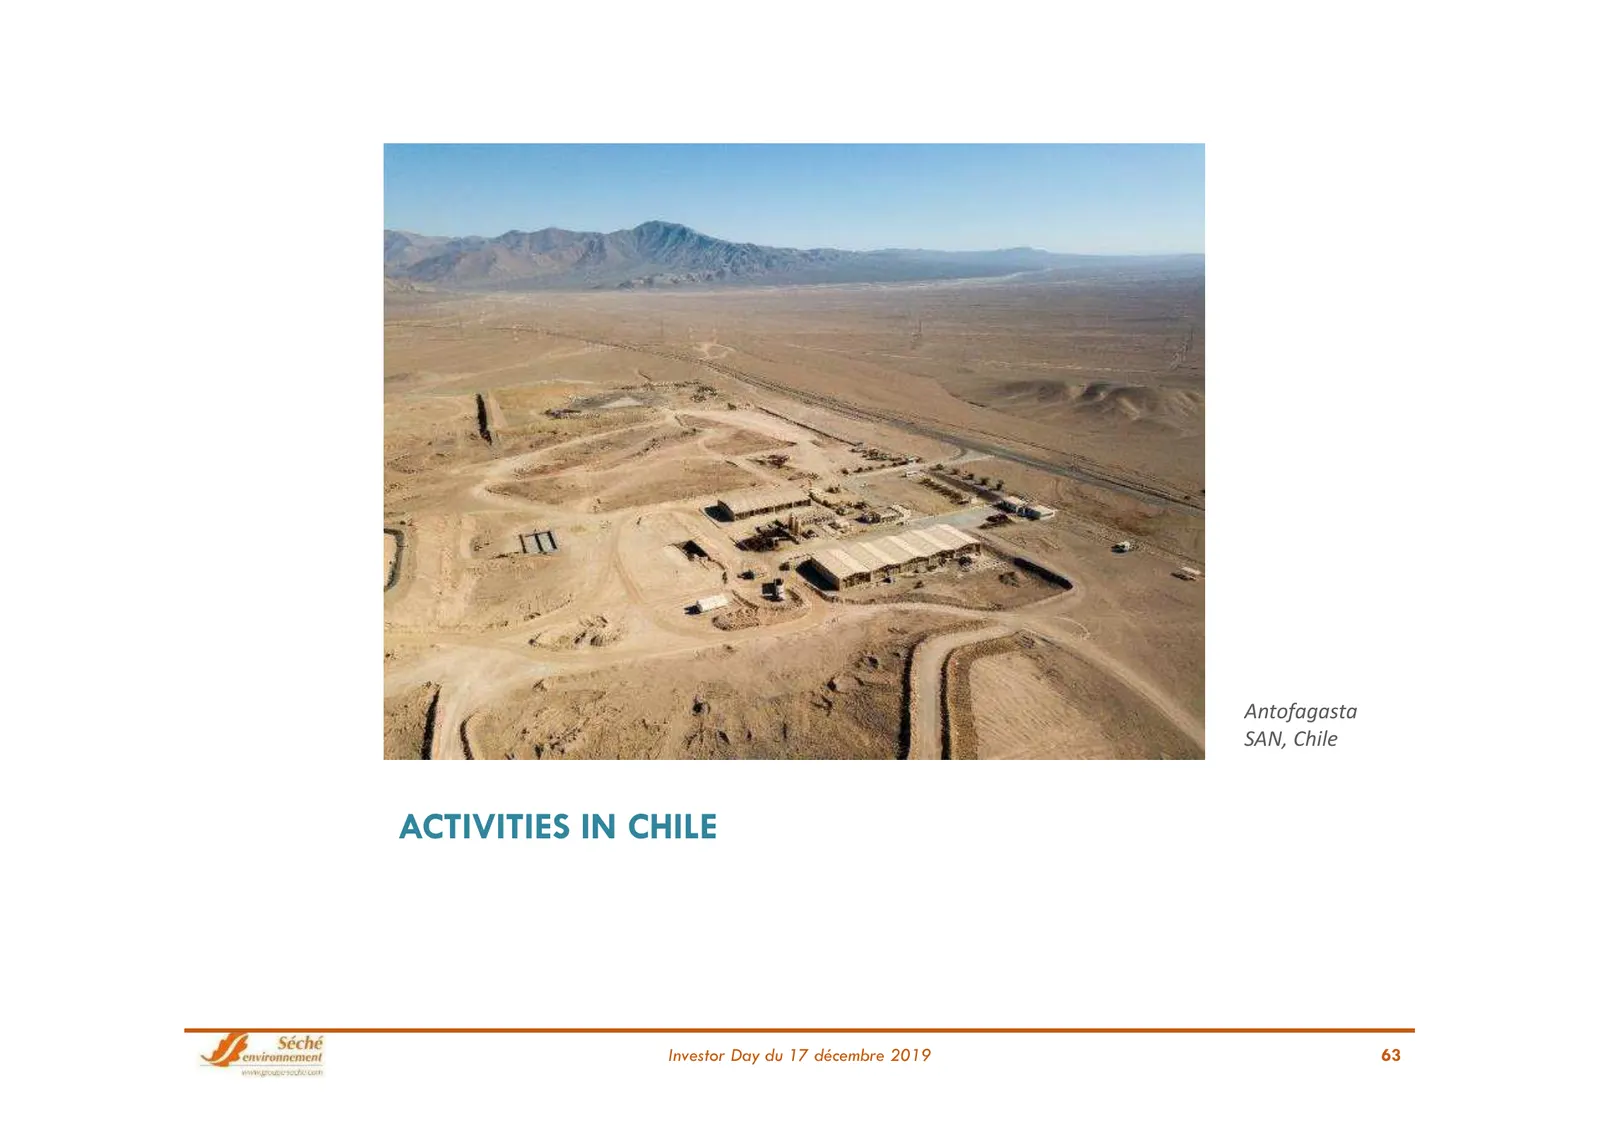
Slide 63: Activities in Chile
Antofagasta SAN, Chile ACTIVITIES IN CHILE Investor Day du 17 décembre 2019 63
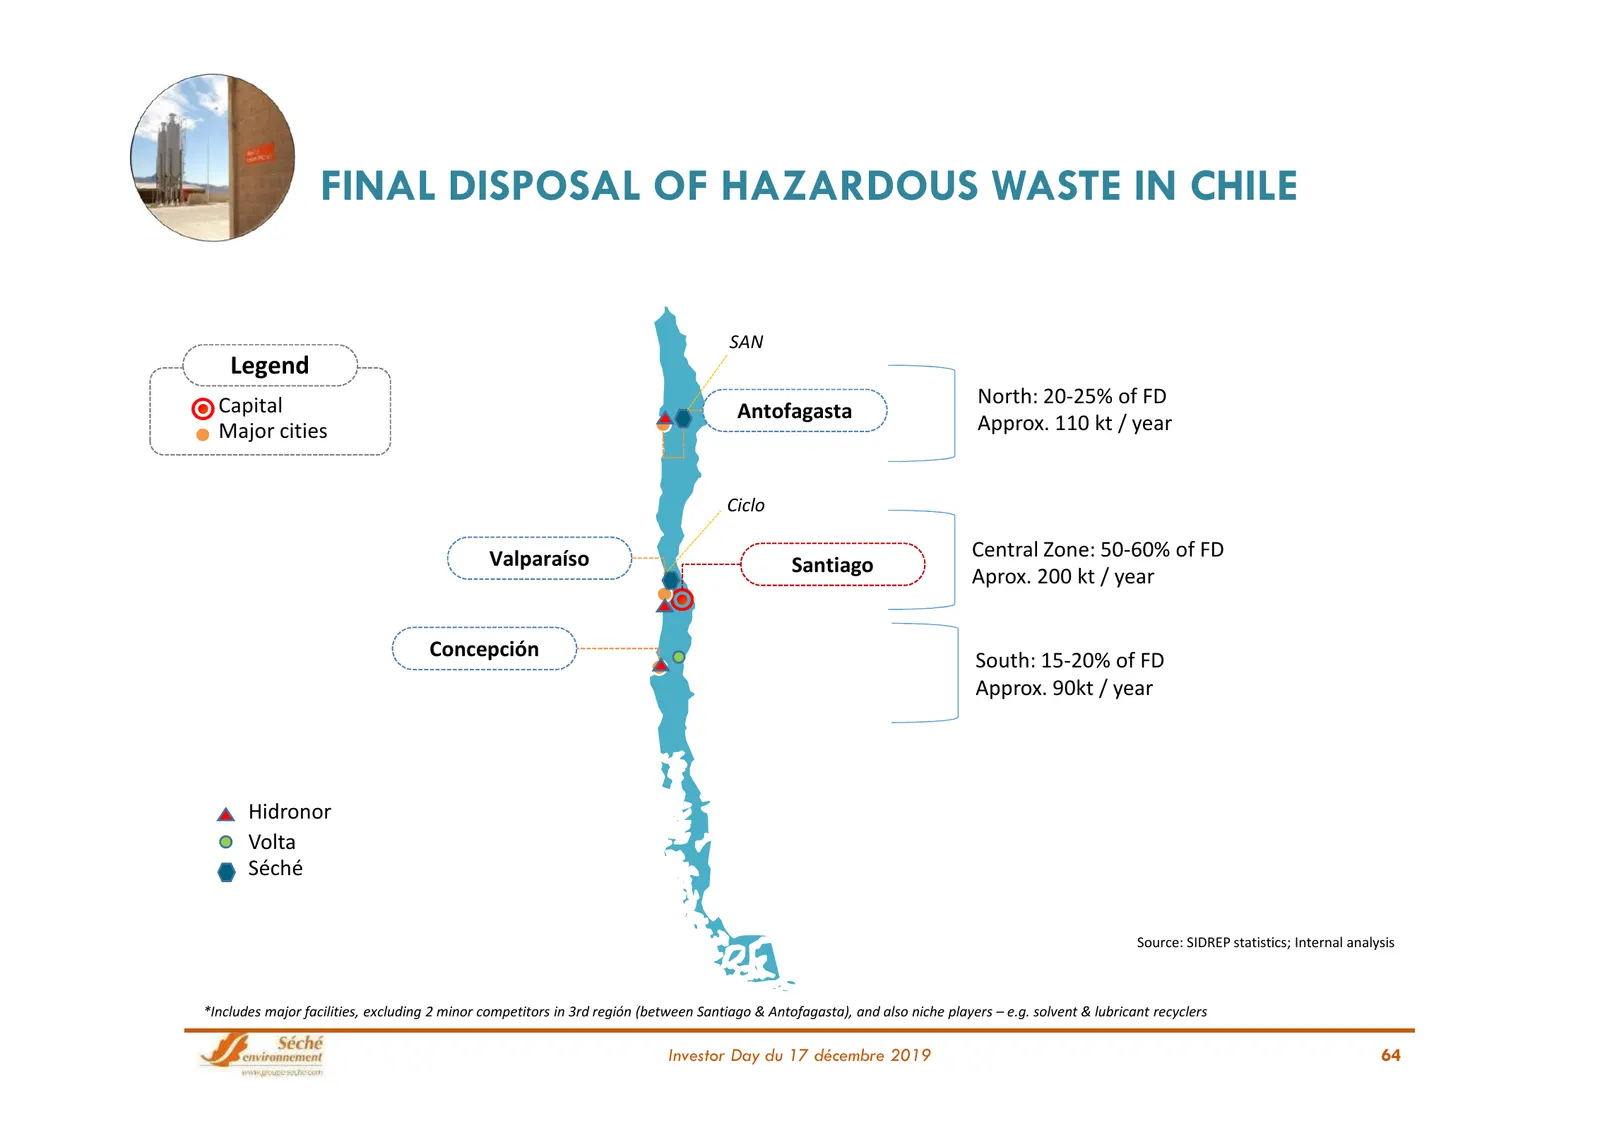
Slide 64: Final Disposal of Hazardous Waste in Chile
FINAL DISPOSAL OF HAZARDOUS WASTE IN CHILE SAN Legend Capital North: 20-25% of FD Antofagasta Major cities Approx. 110 kt / year Ciclo Valparaíso Central Zone: 50-60% of FD Santiago Aprox. 200 kt / year Concepción South: 15-20% of FD Approx. 90kt / year Hidronor Volta Séché Source: SIDREP statistics
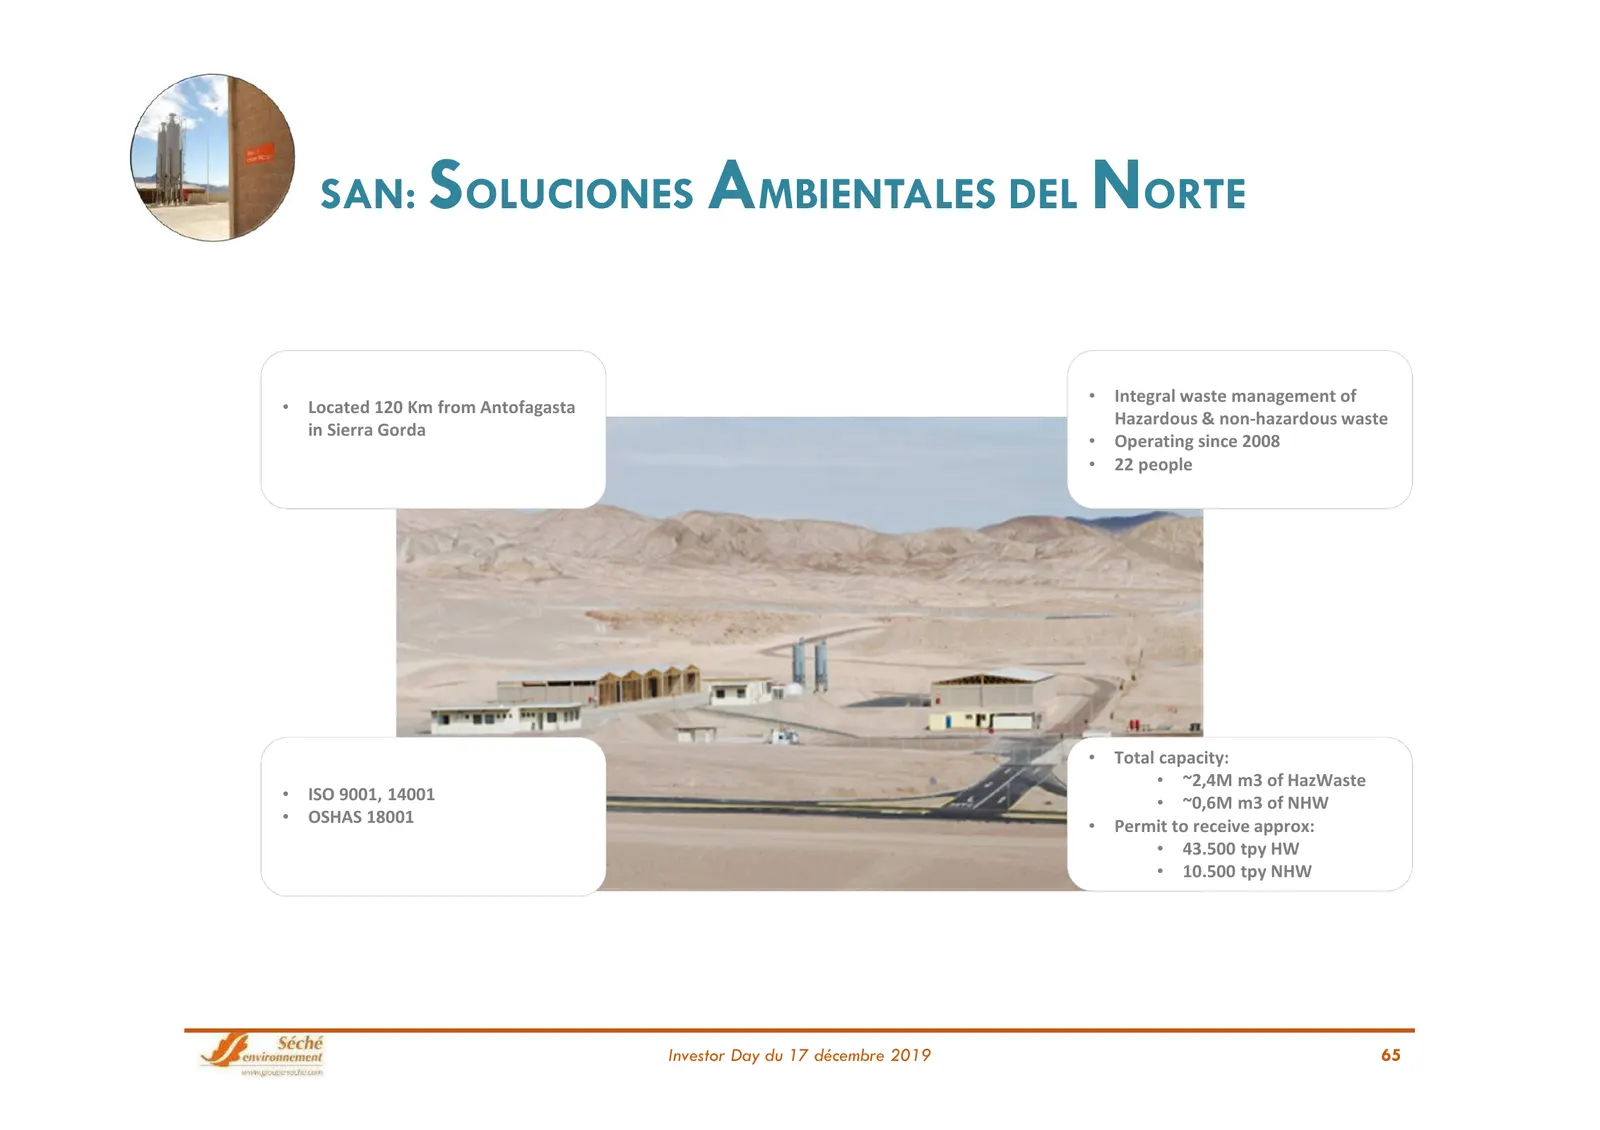
Slide 65: Soluciones Ambientales del Norte (SAN)
SAN: SOLUCIONES AMBIENTALES DEL NORTE • Integral waste management of • Located 120 Km from Antofagasta Hazardous & non-hazardous waste in Sierra Gorda • Operating since 2008 • 22 people • Total capacity: • ~2,4M m3 of HazWaste • ISO 9001, 14001 • ~0,6M m3 of NHW • OSHAS 18001 • Permit to receive app
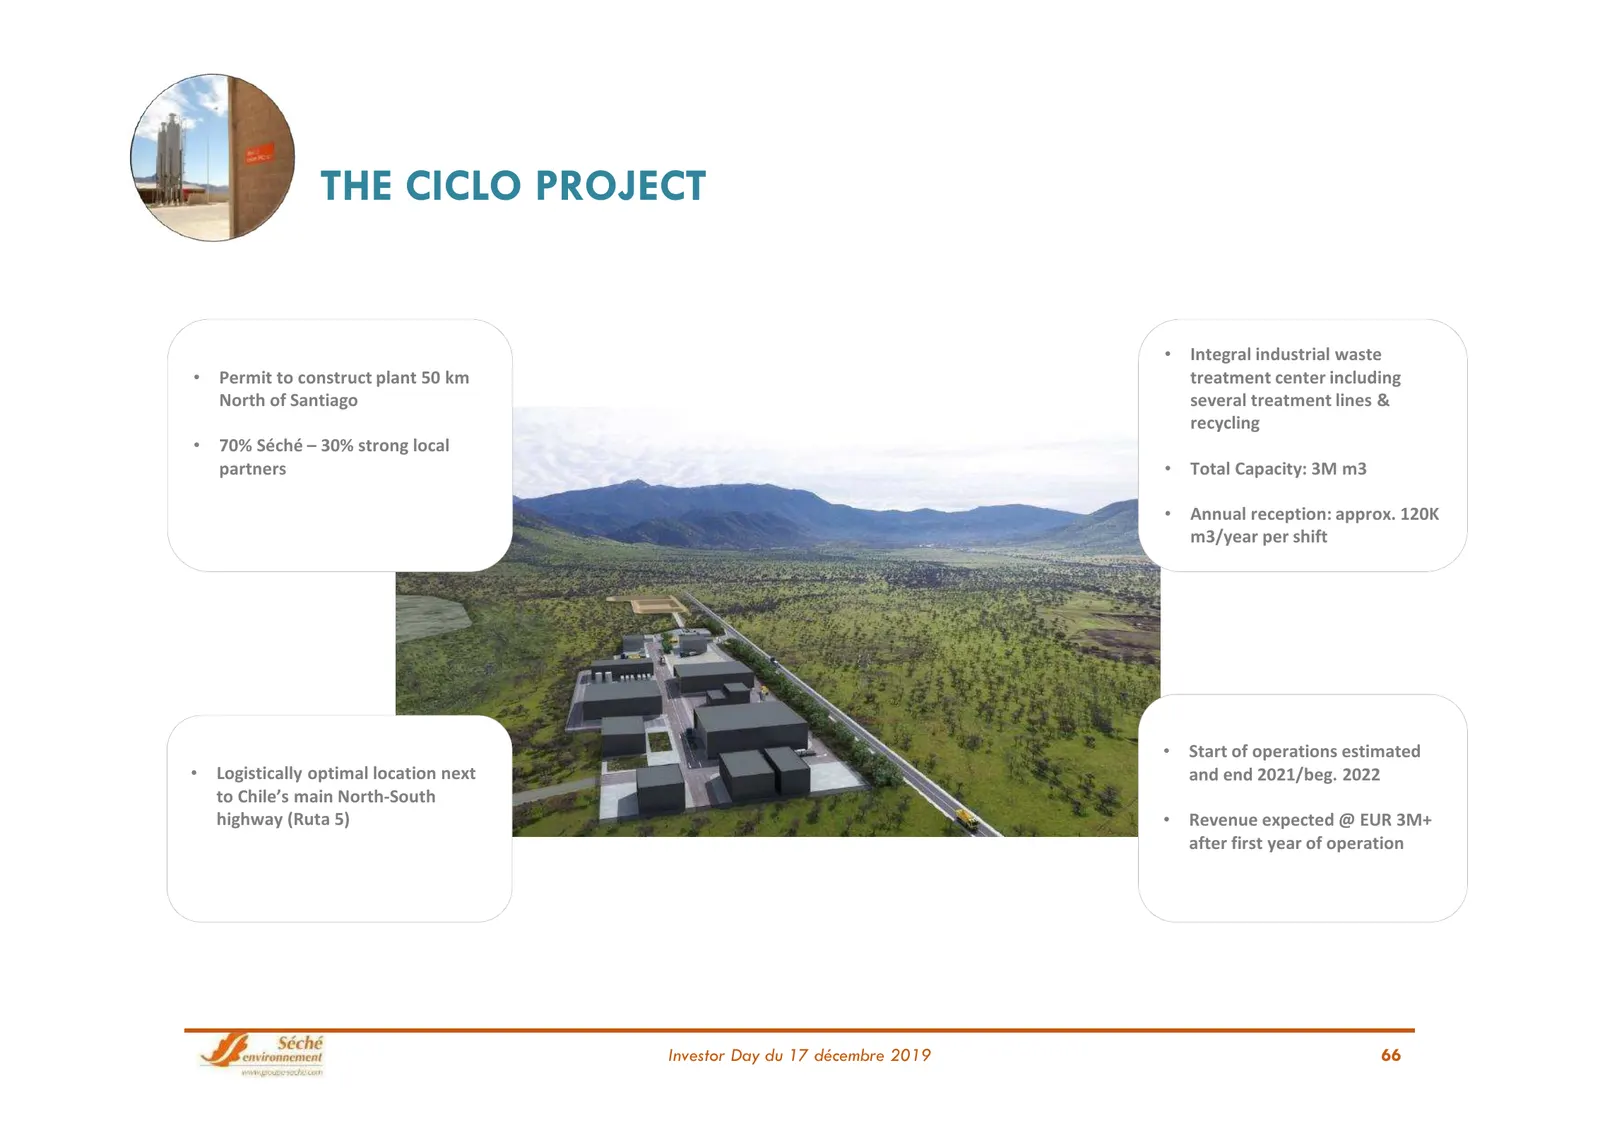
Slide 66: The Ciclo Project
THE CICLO PROJECT • Integral industrial waste • Permit to construct plant 50 km treatment center including North of Santiago several treatment lines & recycling • 70% Séché – 30% strong local partners • Total Capacity: 3M m3 • Annual reception: approx. 120K m3/year per shift • Start of operations es
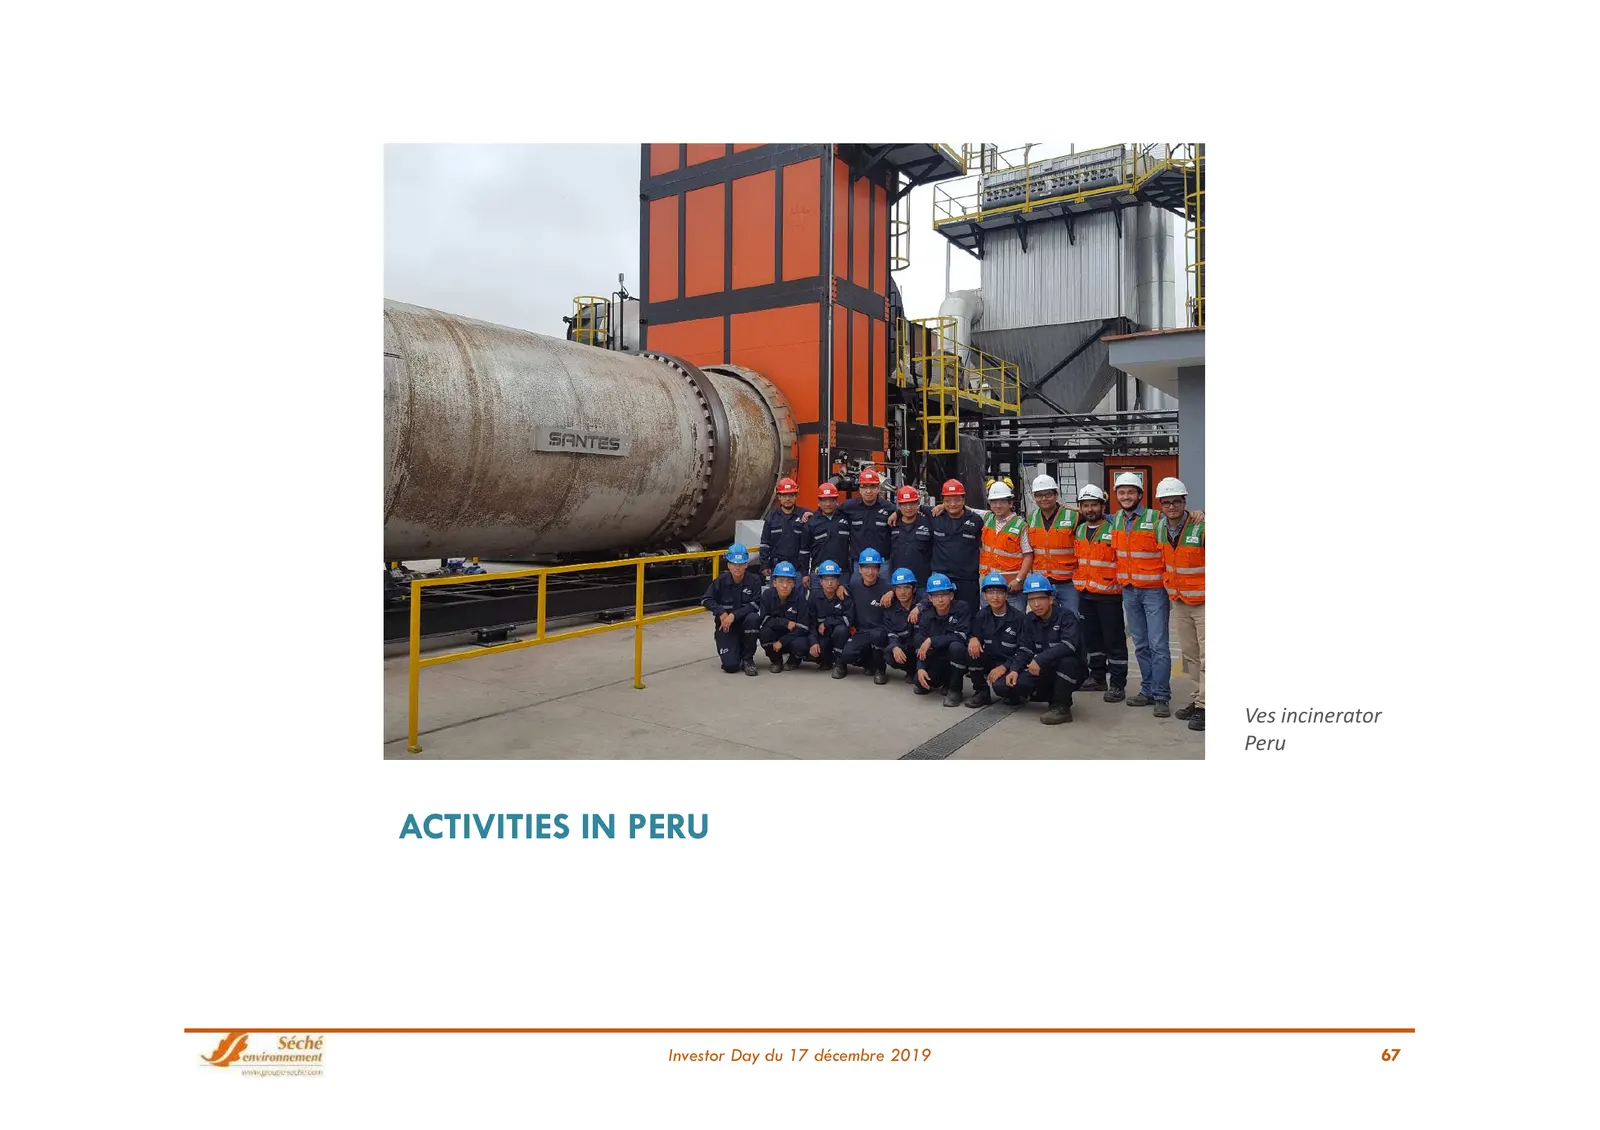
Slide 67: Activities in Peru
Ves incinerator Peru ACTIVITIES IN PERU Investor Day du 17 décembre 2019 67
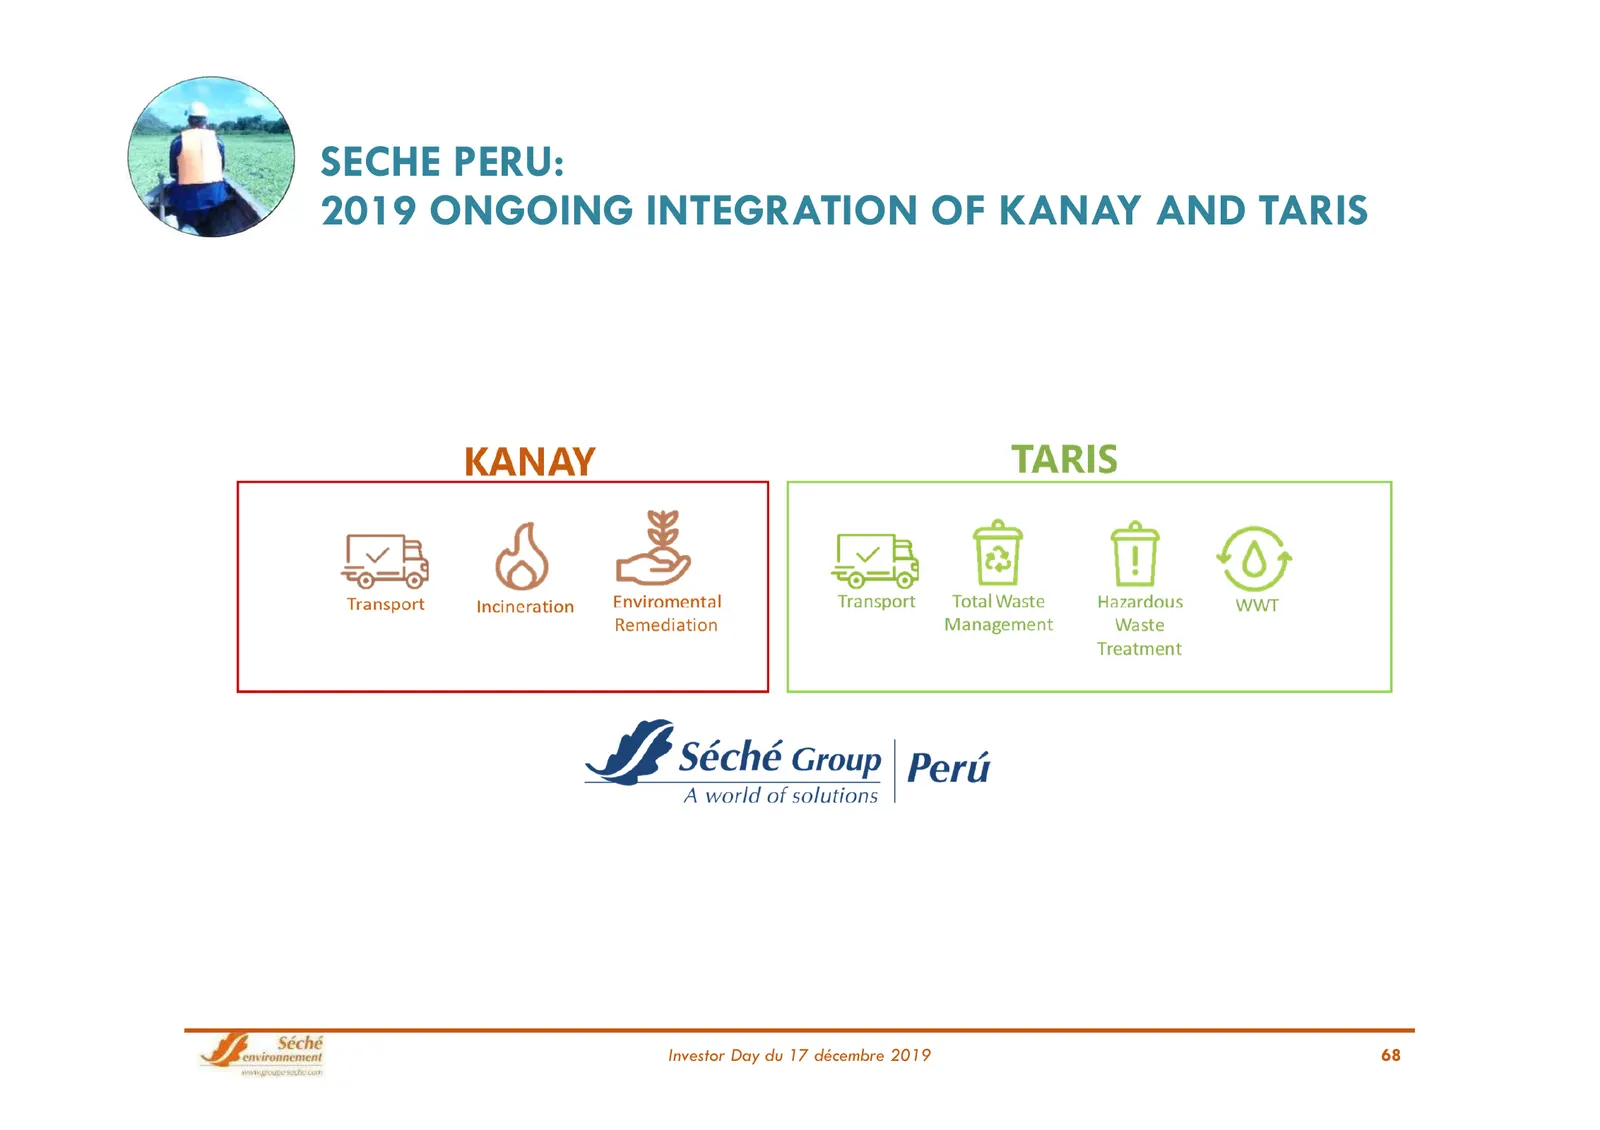
Slide 68: Séché Peru: 2019 Ongoing Integration of Kanay and Taris
SECHE PERU: 2019 ONGOING INTEGRATION OF KANAY AND TARIS Investor Day du 17 décembre 2019 68
Slide 69: Séché Peru: Integrated Hazardous Waste Management
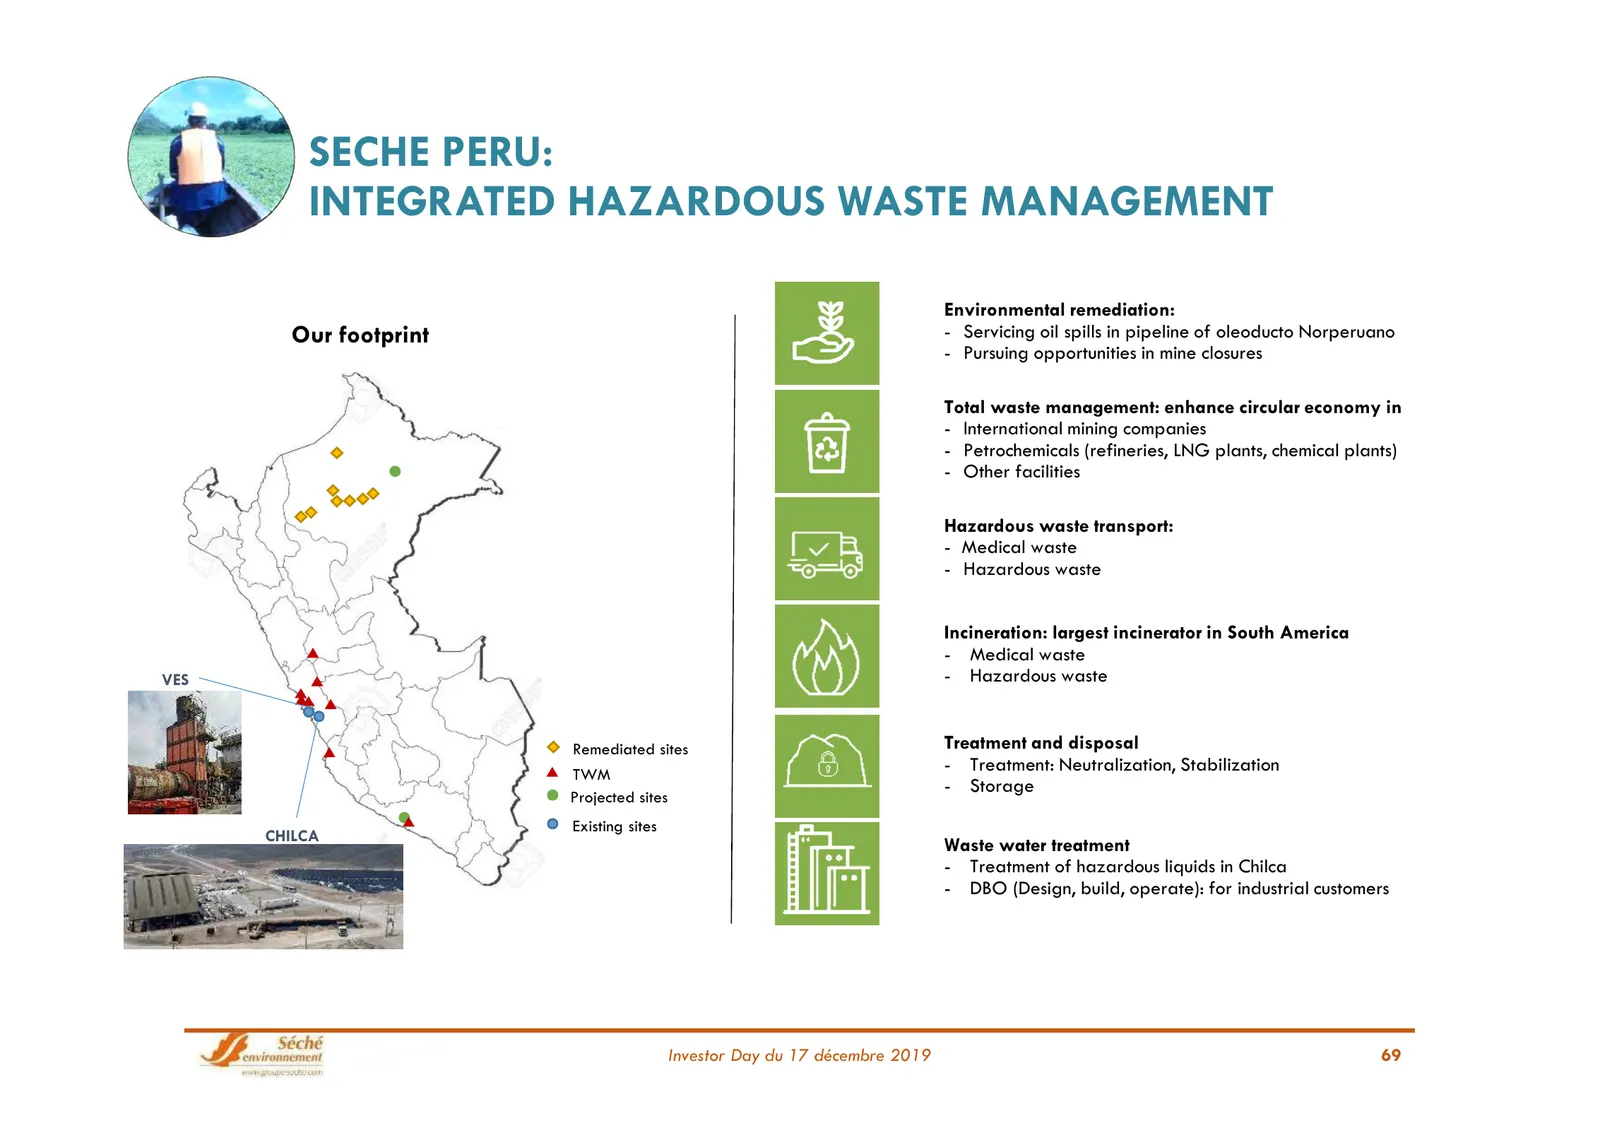
SECHE PERU: INTEGRATED HAZARDOUS WASTE MANAGEMENT Environmental remediation: Our footprint - Servicing oil spills in pipeline of oleoducto Norperuano - Pursuing opportunities in mine closures Total waste management: enhance circular economy in - International mining companies - Petrochemicals (refin
Slide 70: A Matrix Structure to Drive Growth
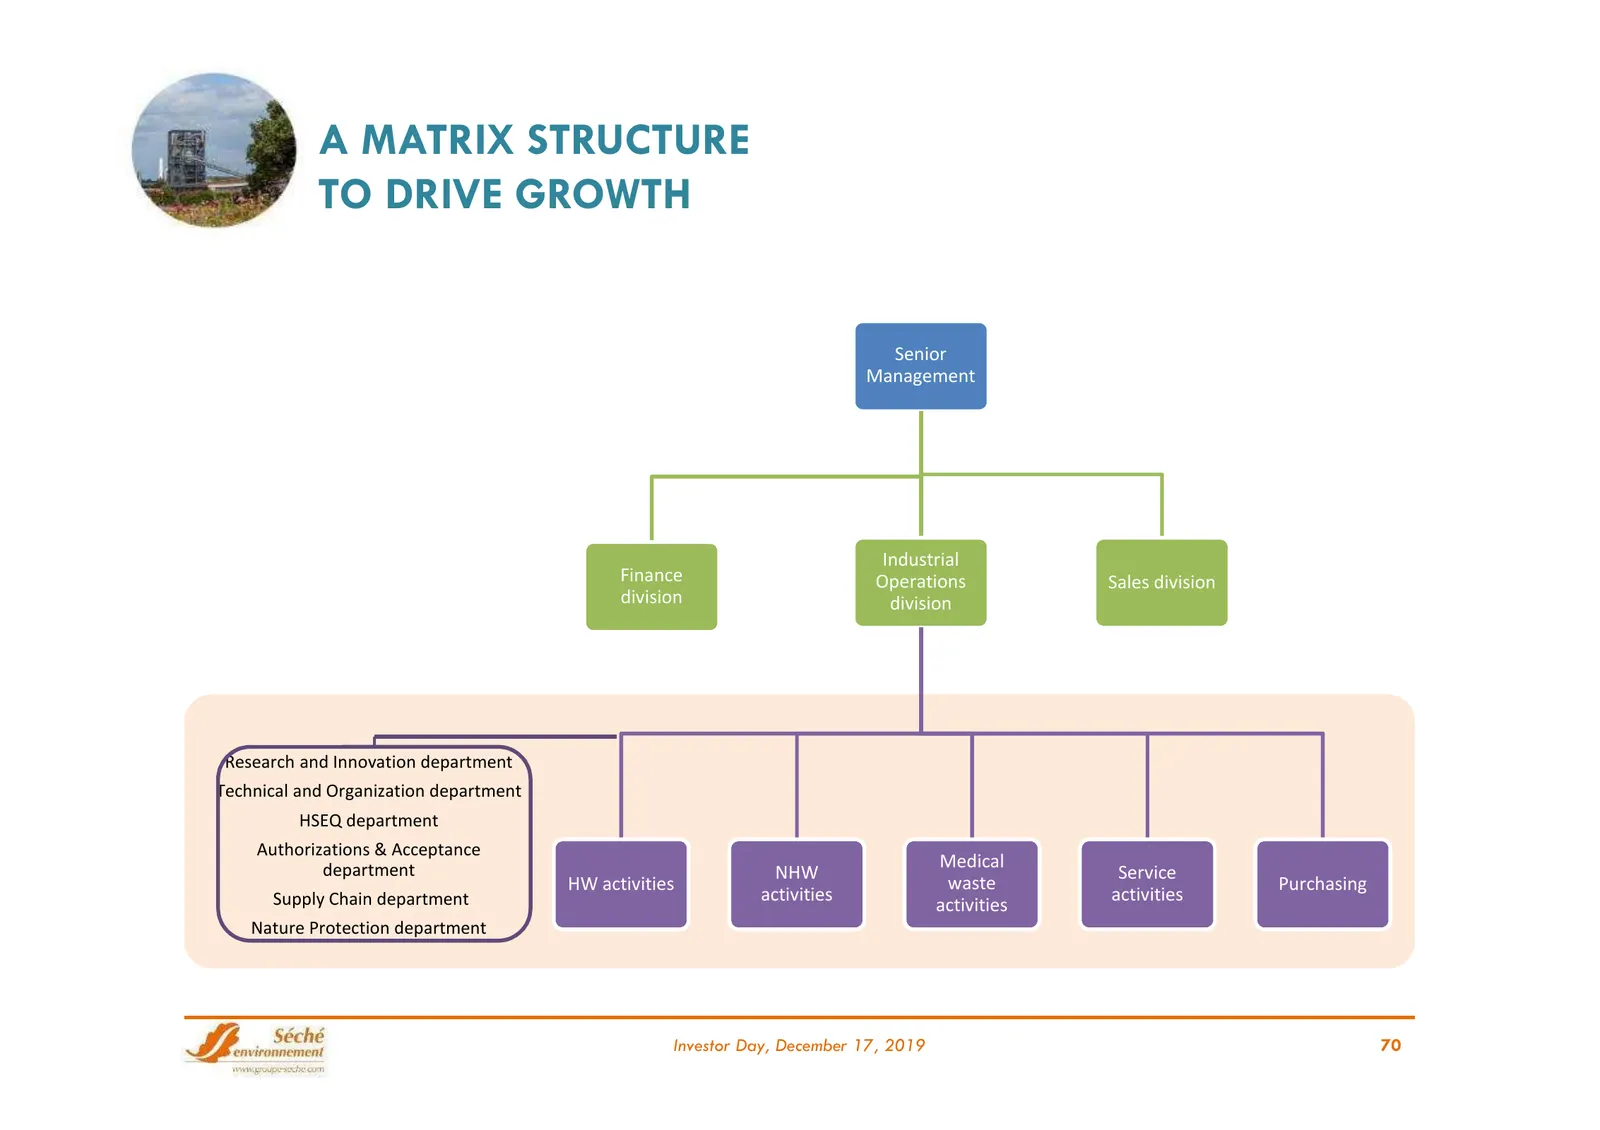
A MATRIX STRUCTURE TO DRIVE GROWTH Senior Management Industrial Finance Operations Sales division division division Research and Innovation department Technical and Organization department HSEQ department Authorizations & Acceptance department Medical NHW Service HW activities waste Purchasing Suppl
Slide 71: Industrial Efficiency Underlying a Profitable Growth Strategy
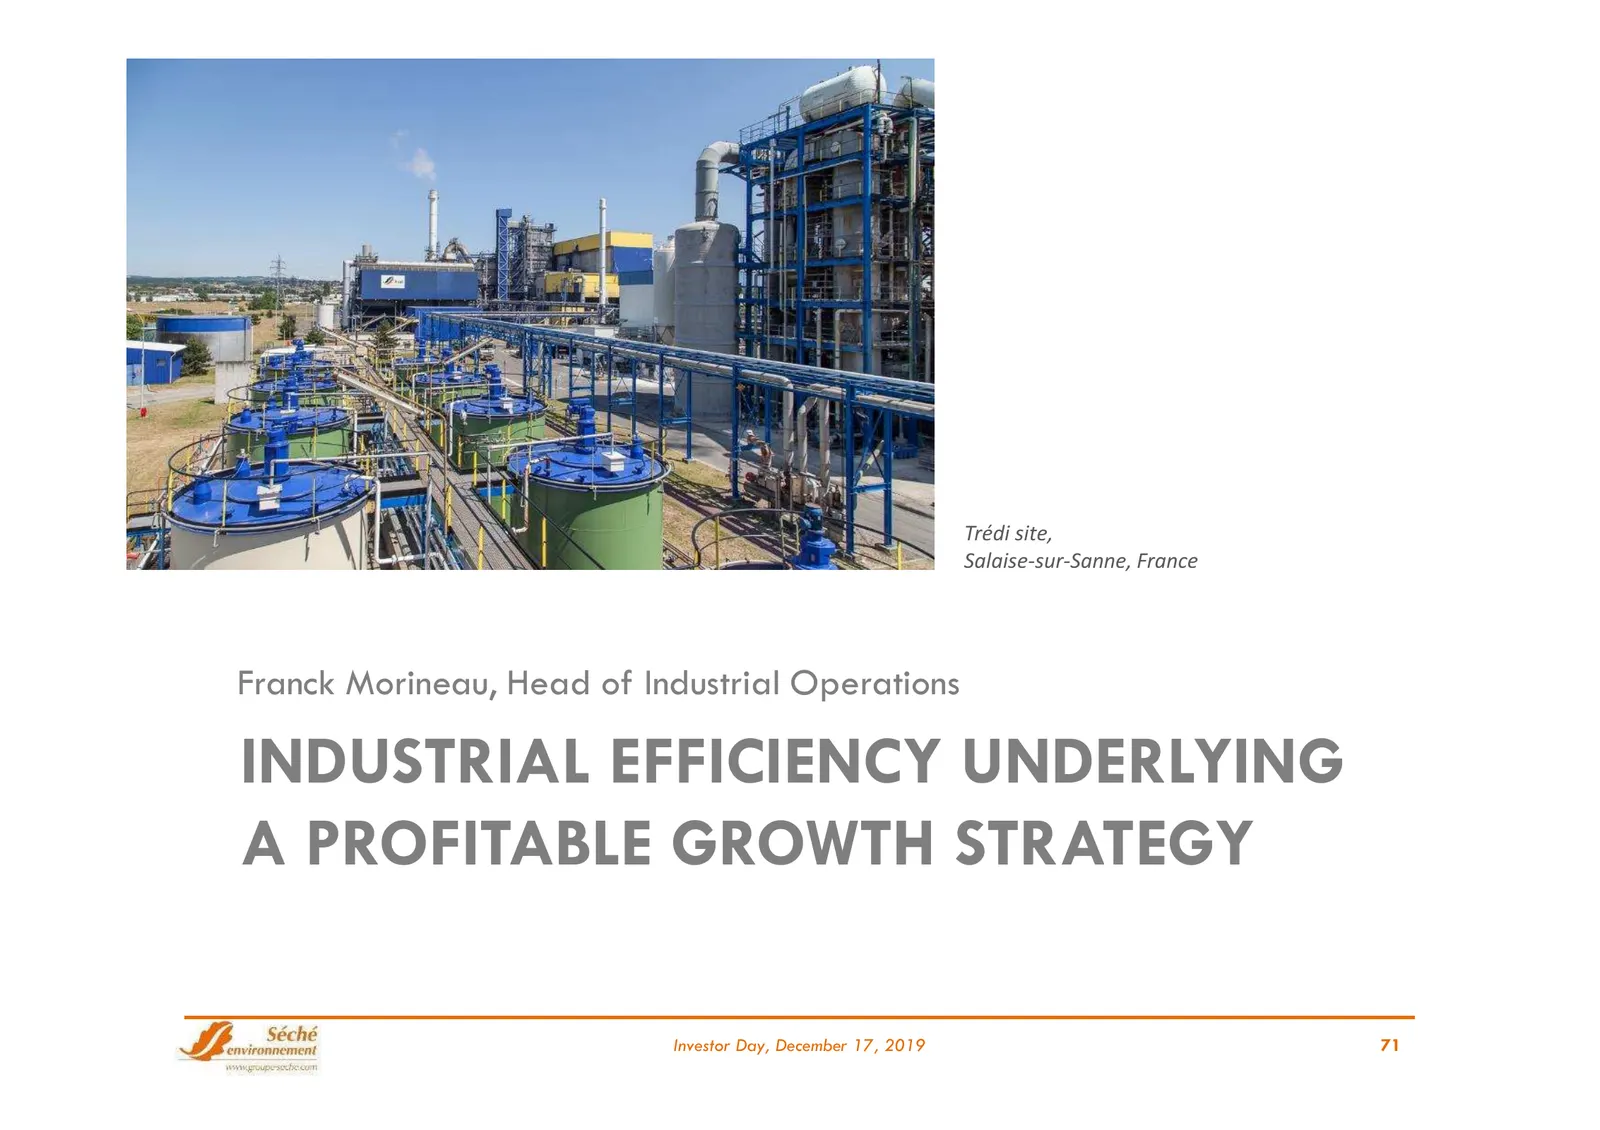
Trédi site, Salaise-sur-Sanne, France Franck Morineau, Head of Industrial Operations INDUSTRIAL EFFICIENCY UNDERLYING A PROFITABLE GROWTH STRATEGY Investor Day, December 17, 2019 71
Slide 72: Structure industrial operations with the right focus
“Structure industrial operations with the right focus to enhance industrial efficiency and create value” Franck Morineau Head of Industrial Operations Investor Day, December 17, 2019 72
Slide 73: Business Lines and Organizational Structure
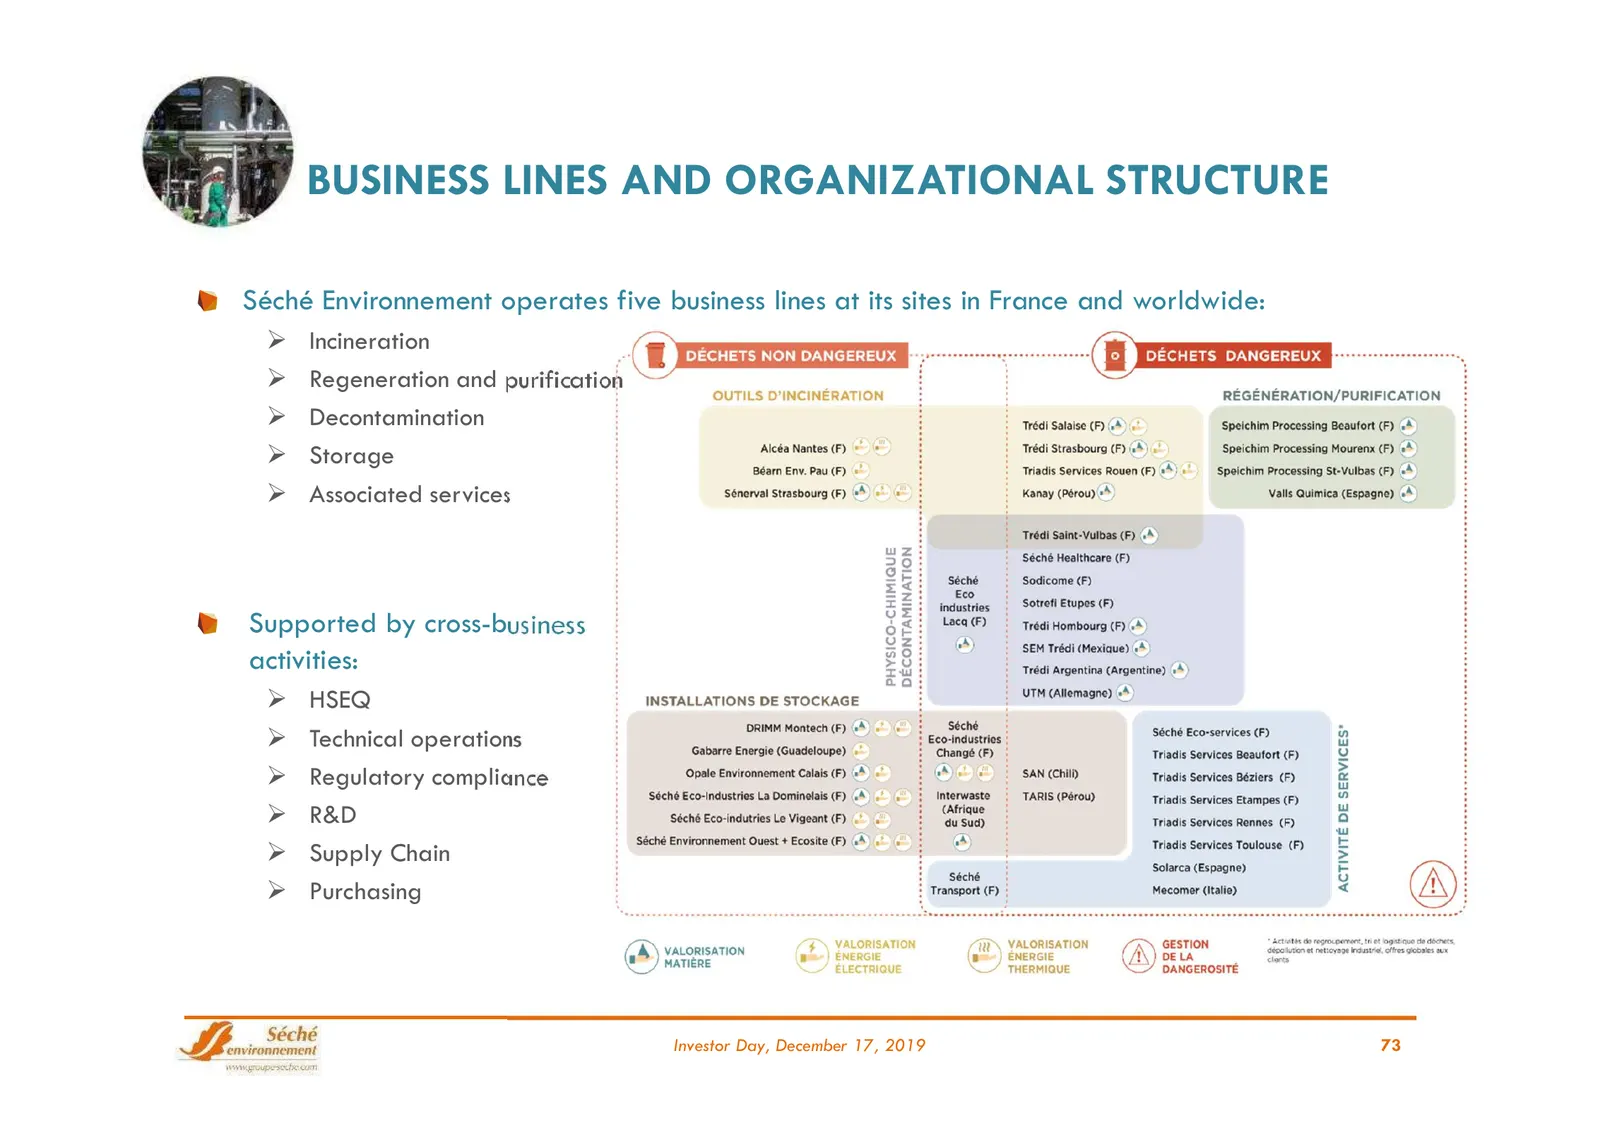
BUSINESS LINES AND ORGANIZATIONAL STRUCTURE Séché Environnement operates five business lines at its sites in France and worldwide: Incineration Regeneration and purification Decontamination Storage Associated services Supported by cross-business activities: HSEQ Technical operations
Slide 74: 5 Priorities
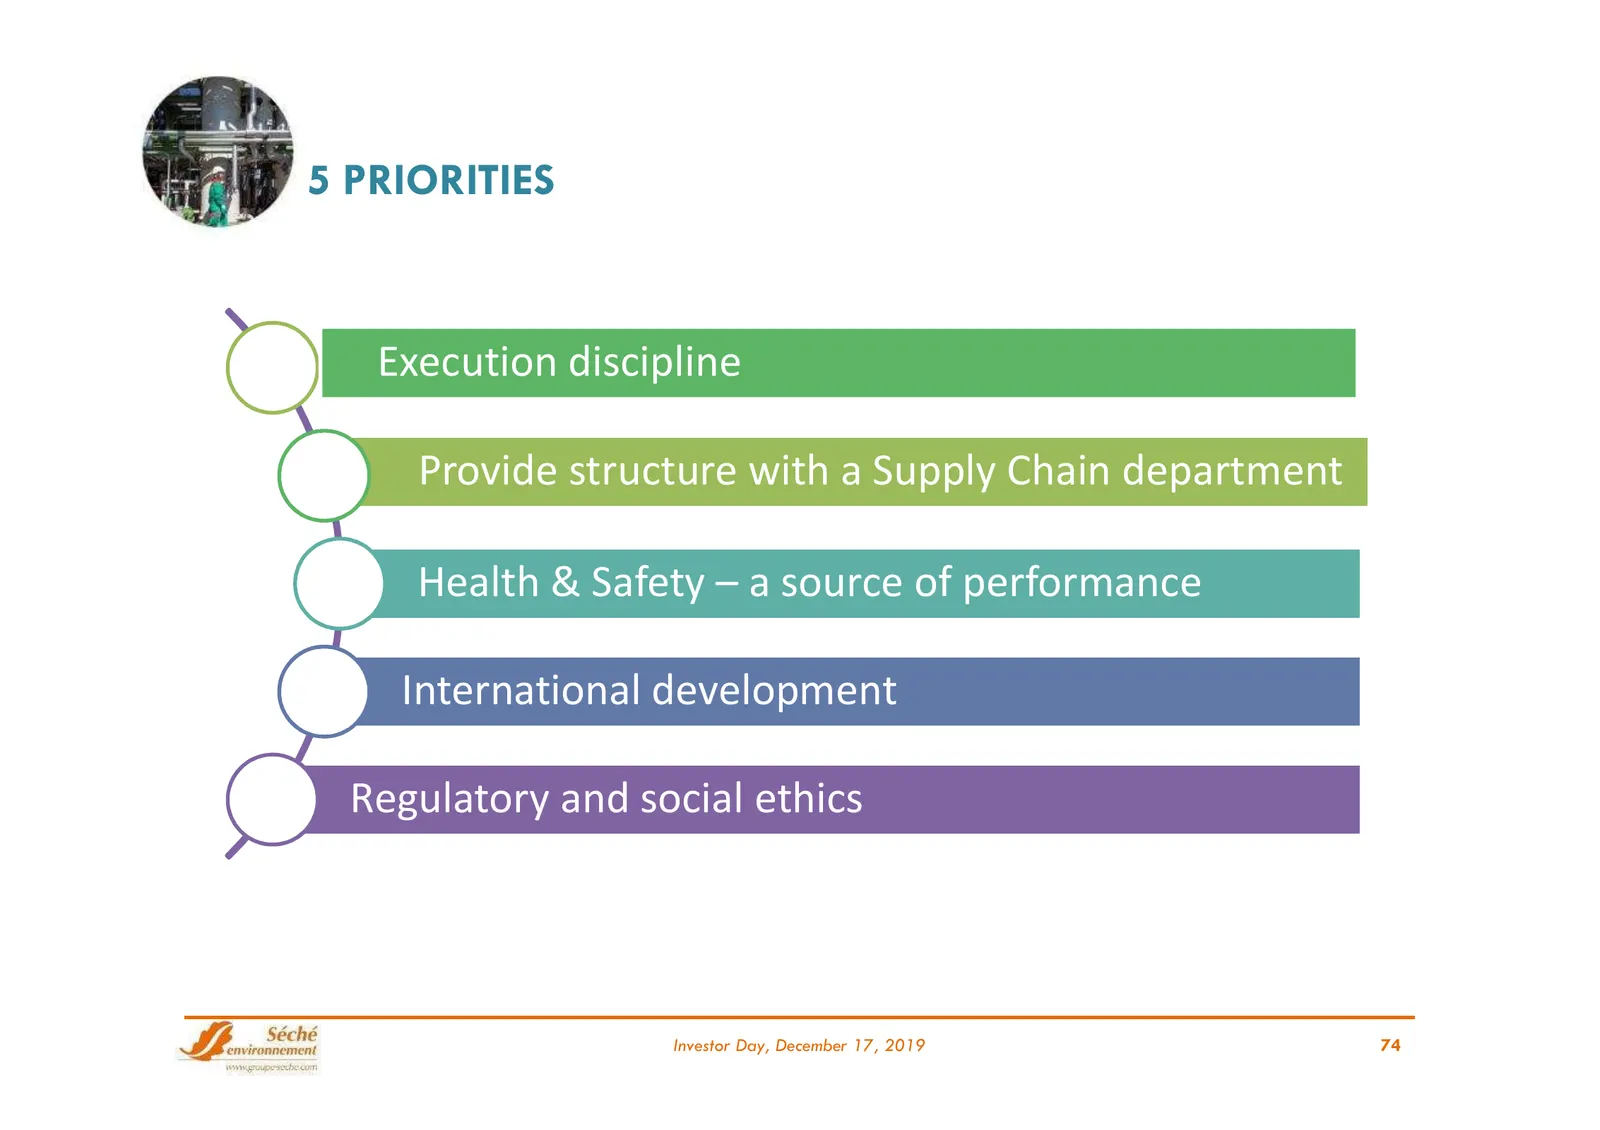
5 PRIORITIES Execution discipline Provide structure with a Supply Chain department Health & Safety – a source of performance International development Regulatory and social ethics Investor Day, December 17, 2019 74
Slide 75: Execution Discipline
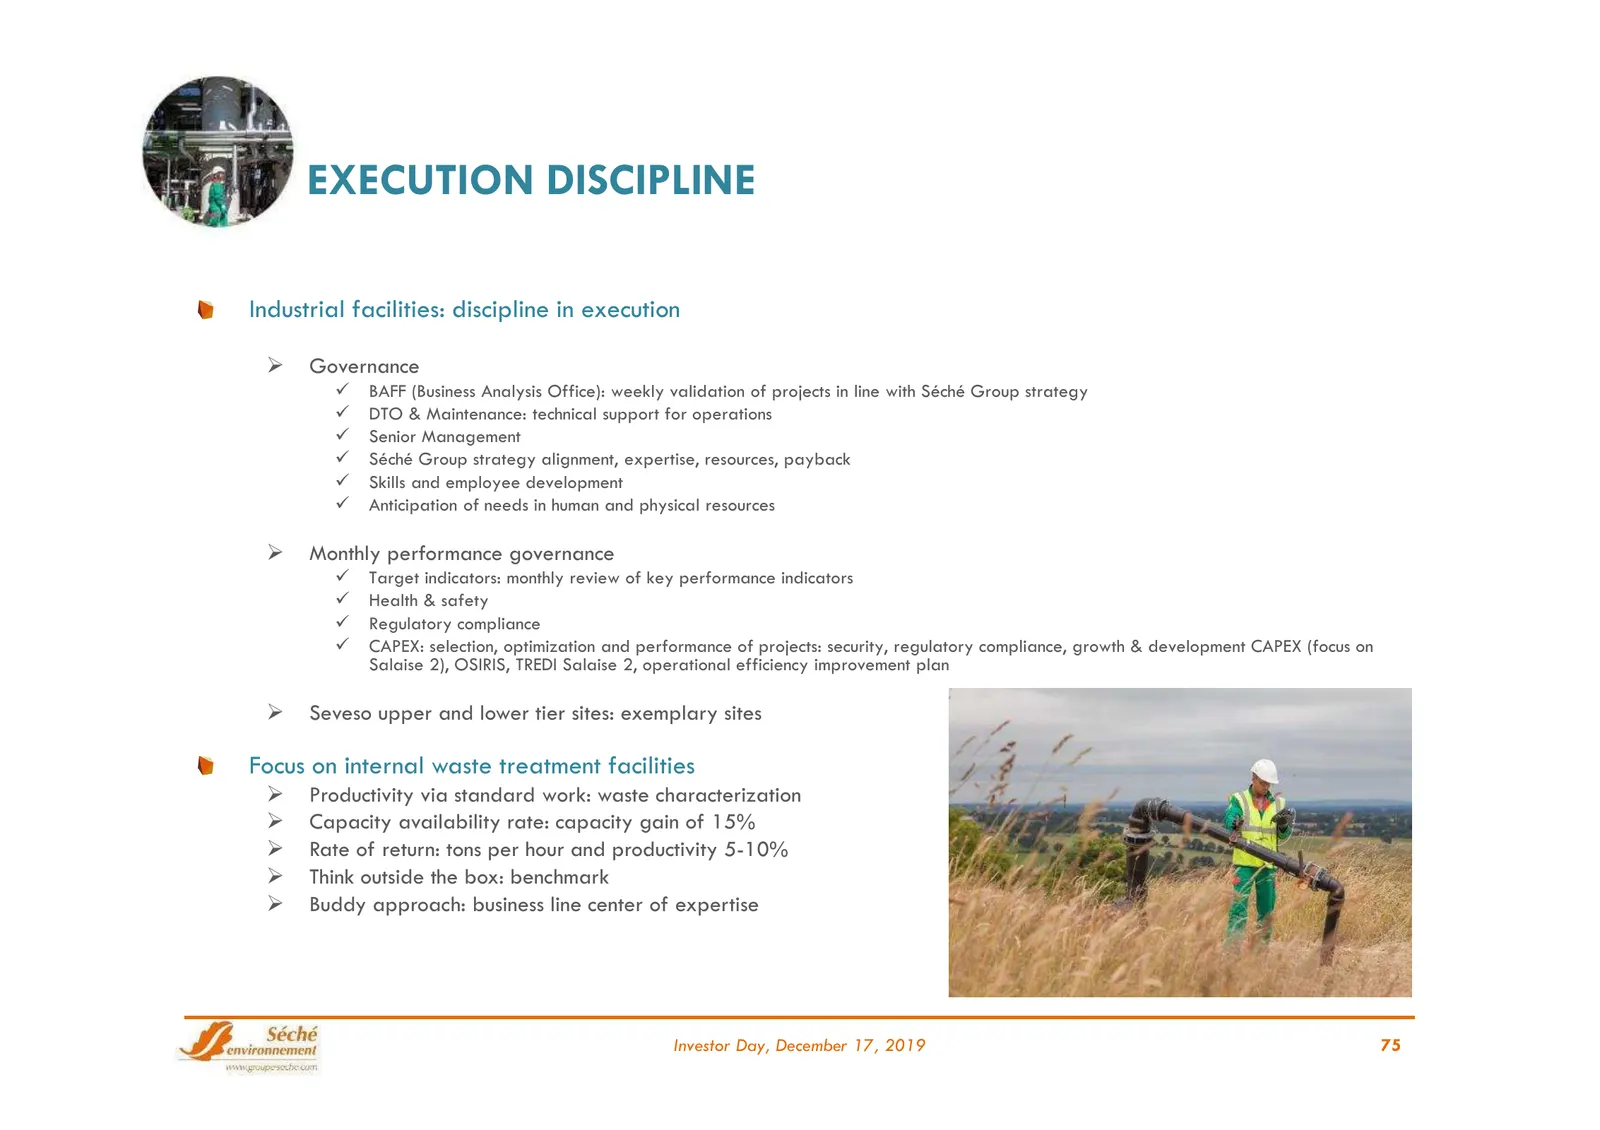
EXECUTION DISCIPLINE Industrial facilities: discipline in execution Governance BAFF (Business Analysis Office): weekly validation of projects in line with Séché Group strategy DTO & Maintenance: technical support for operations Senior Management Séché Group strategy alignment, expertise, r
Slide 76: Creation of a Supply Chain Department
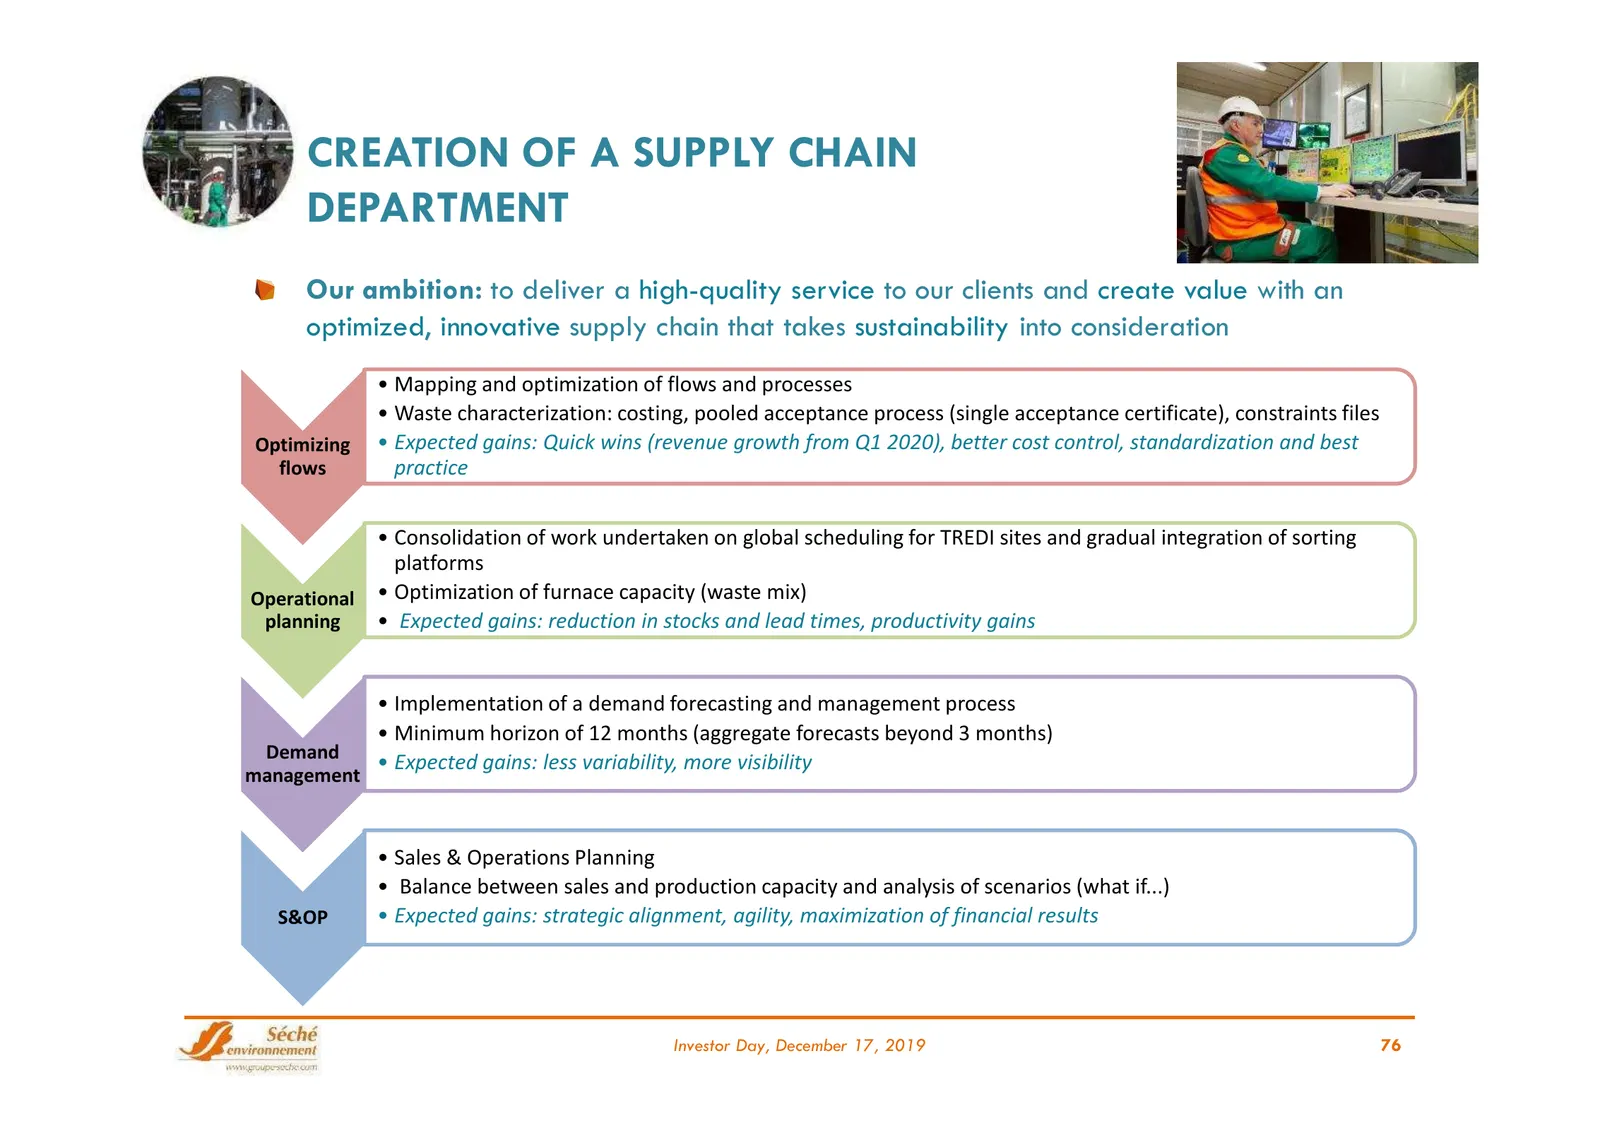
CREATION OF A SUPPLY CHAIN DEPARTMENT Our ambition: to deliver a high-quality service to our clients and create value with an optimized, innovative supply chain that takes sustainability into consideration • Mapping and optimization of flows and processes • Waste characterization: costing, pooled ac
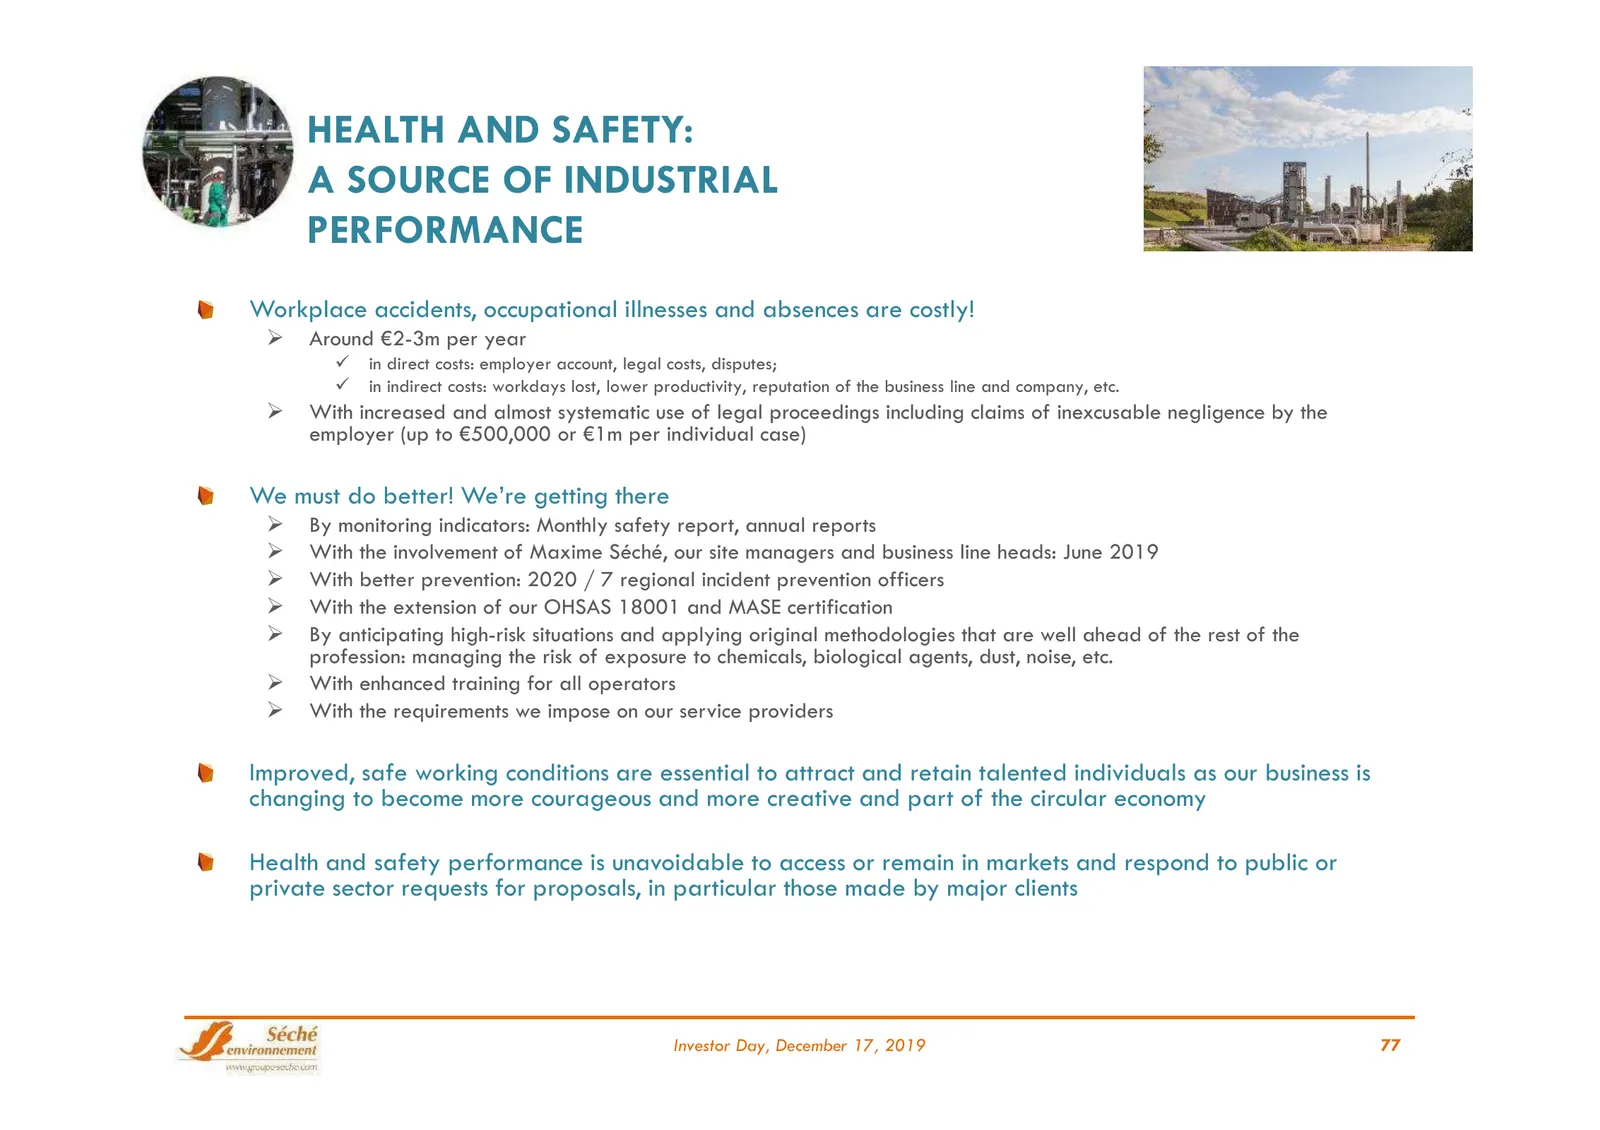
Slide 77: Health and Safety: A Source of Industrial Performance
HEALTH AND SAFETY: A SOURCE OF INDUSTRIAL PERFORMANCE Workplace accidents, occupational illnesses and absences are costly! Around €2-3m per year in direct costs: employer account, legal costs, disputes; in indirect costs: workdays lost, lower productivity, reputation of the business line and c
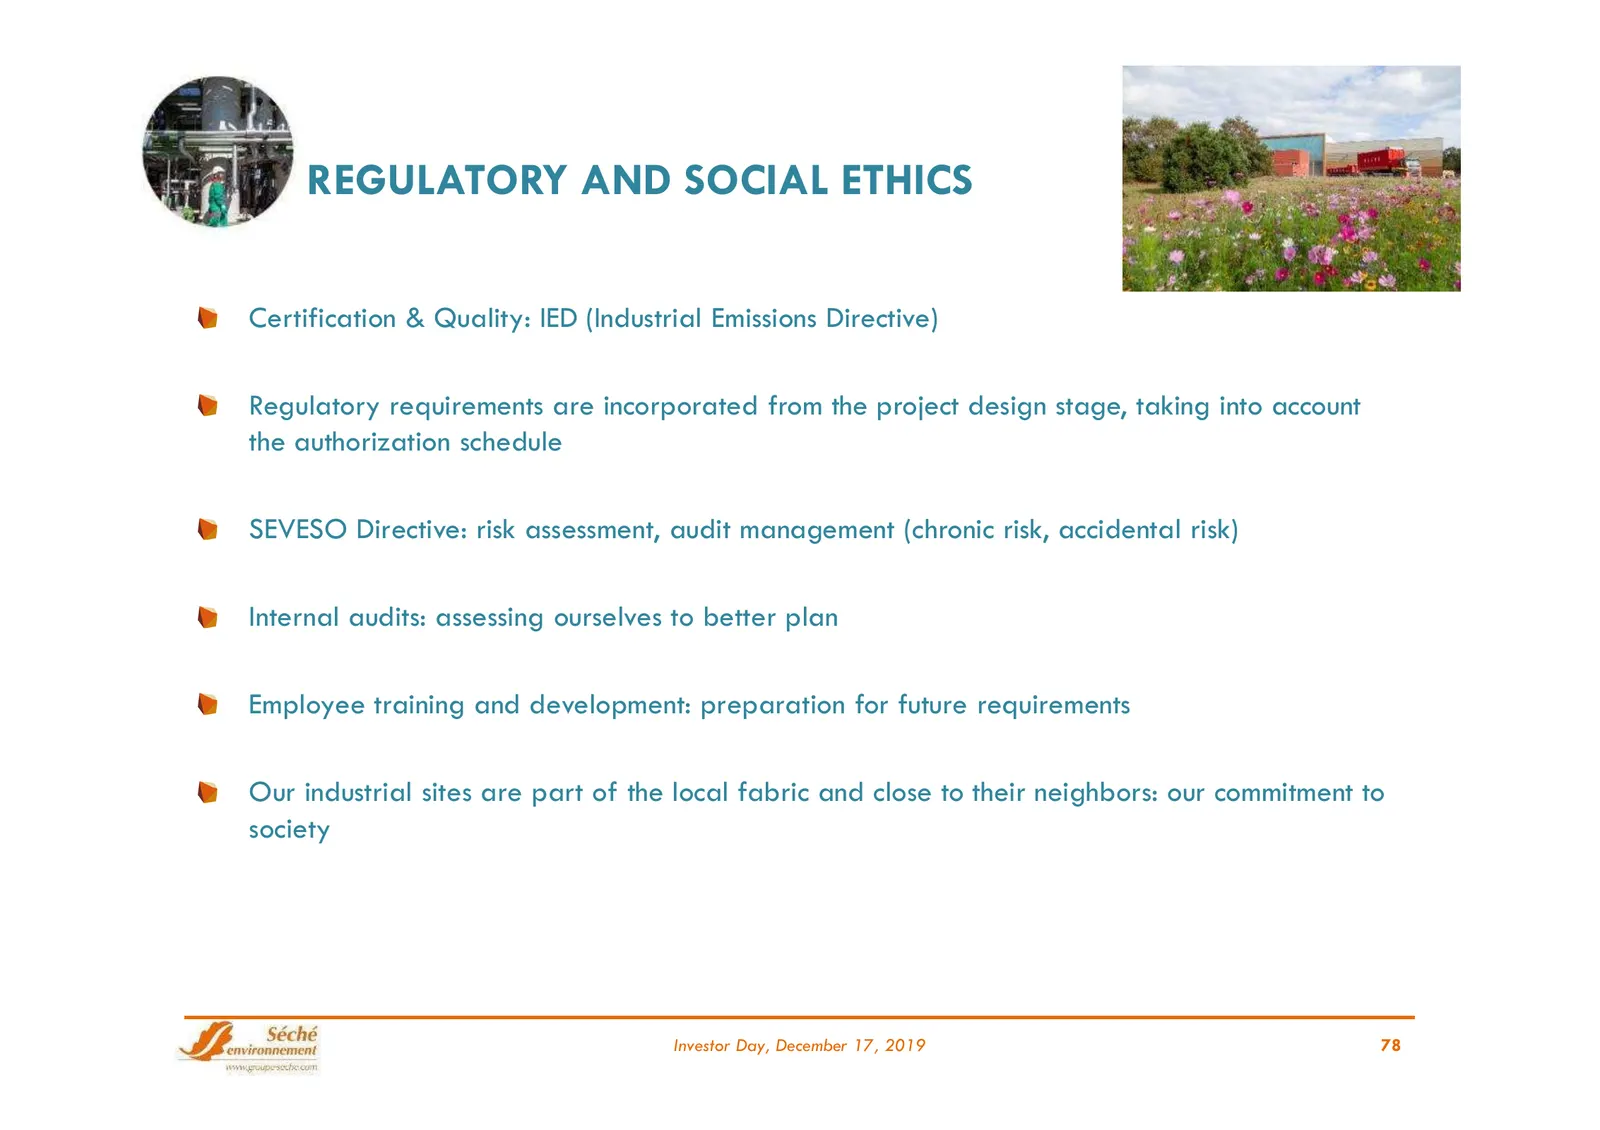
Slide 78: Regulatory and Social Ethics
REGULATORY AND SOCIAL ETHICS Certification & Quality: IED (Industrial Emissions Directive) Regulatory requirements are incorporated from the project design stage, taking into account the authorization schedule SEVESO Directive: risk assessment, audit management (chronic risk, accidental risk) Intern
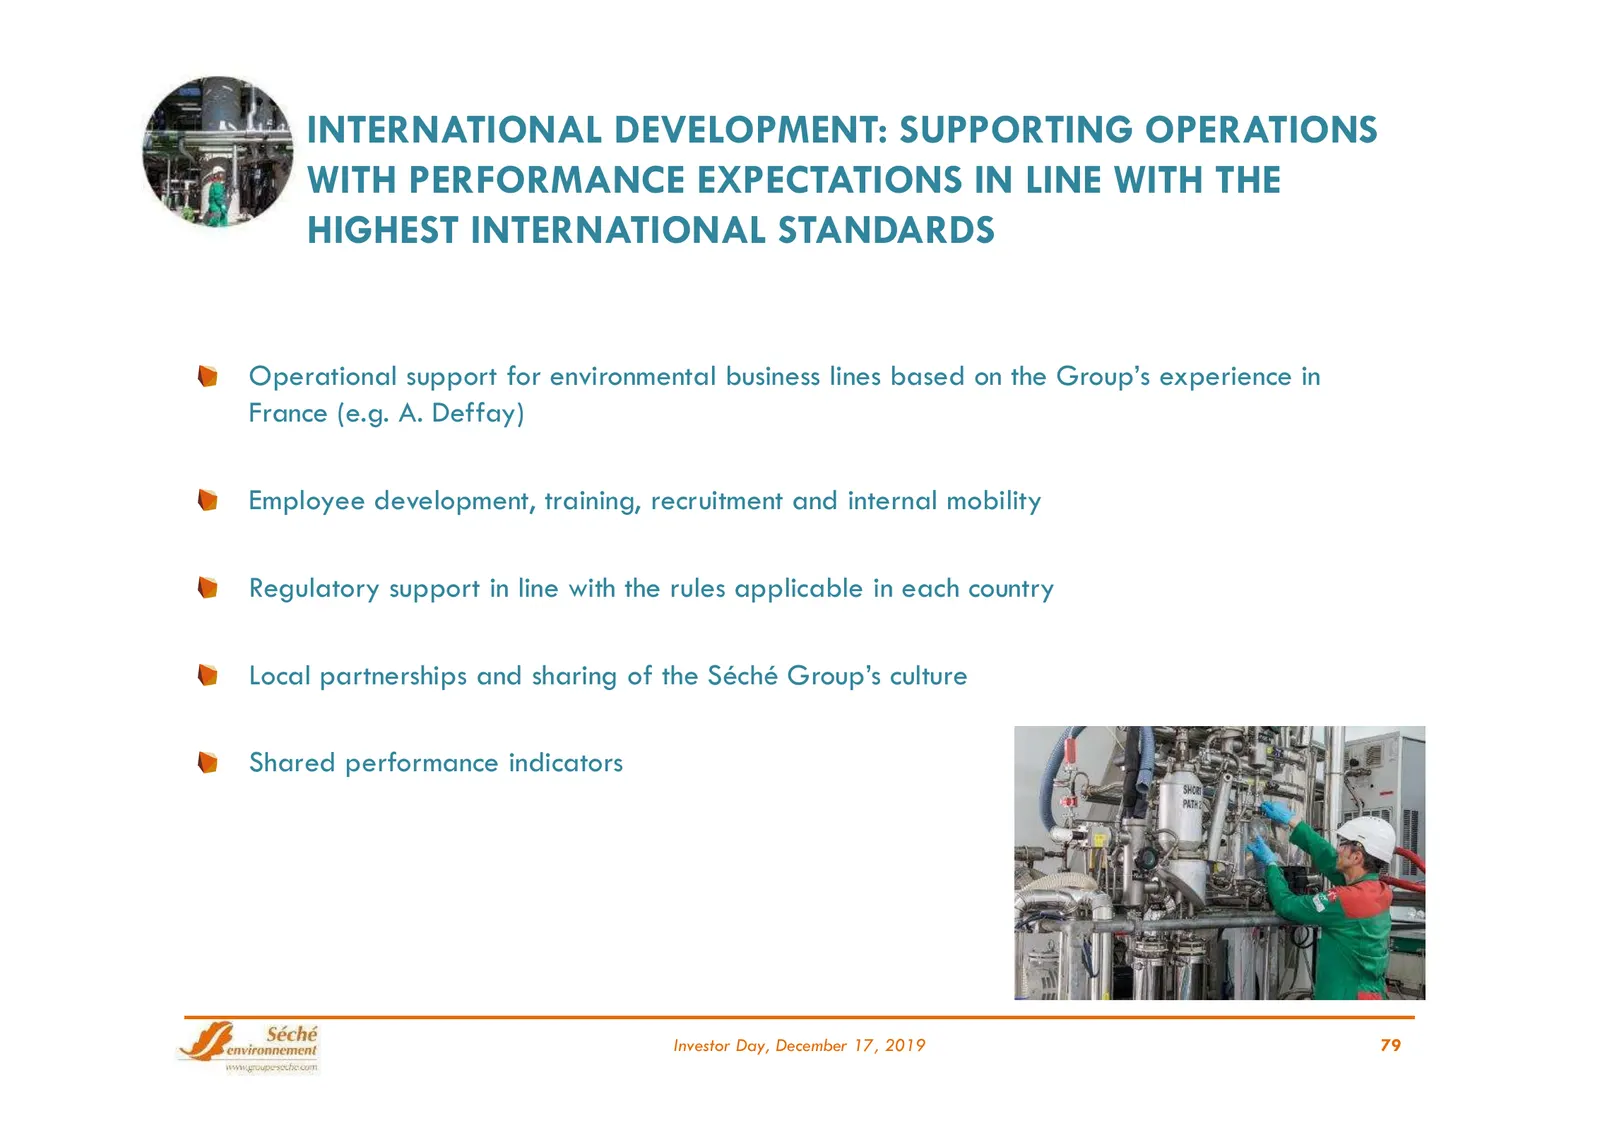
Slide 79: International Development: Supporting Operations
INTERNATIONAL DEVELOPMENT: SUPPORTING OPERATIONS WITH PERFORMANCE EXPECTATIONS IN LINE WITH THE HIGHEST INTERNATIONAL STANDARDS Operational support for environmental business lines based on the Group’s experience in France (e.g. A. Deffay) Employee development, training, recruitment and internal mob
Slide 80: Model to Achieve Operational Excellence
Exemplary behavior, Commitment, High standards and Organization a model to achieve OPERATIONAL EXCELLENCE Anticipating and complying with environmental regulations to limit our impact Continuous controls and treatment of wastewater effluents at our operating sites Continuous control of mercury l
Slide 81: Summary
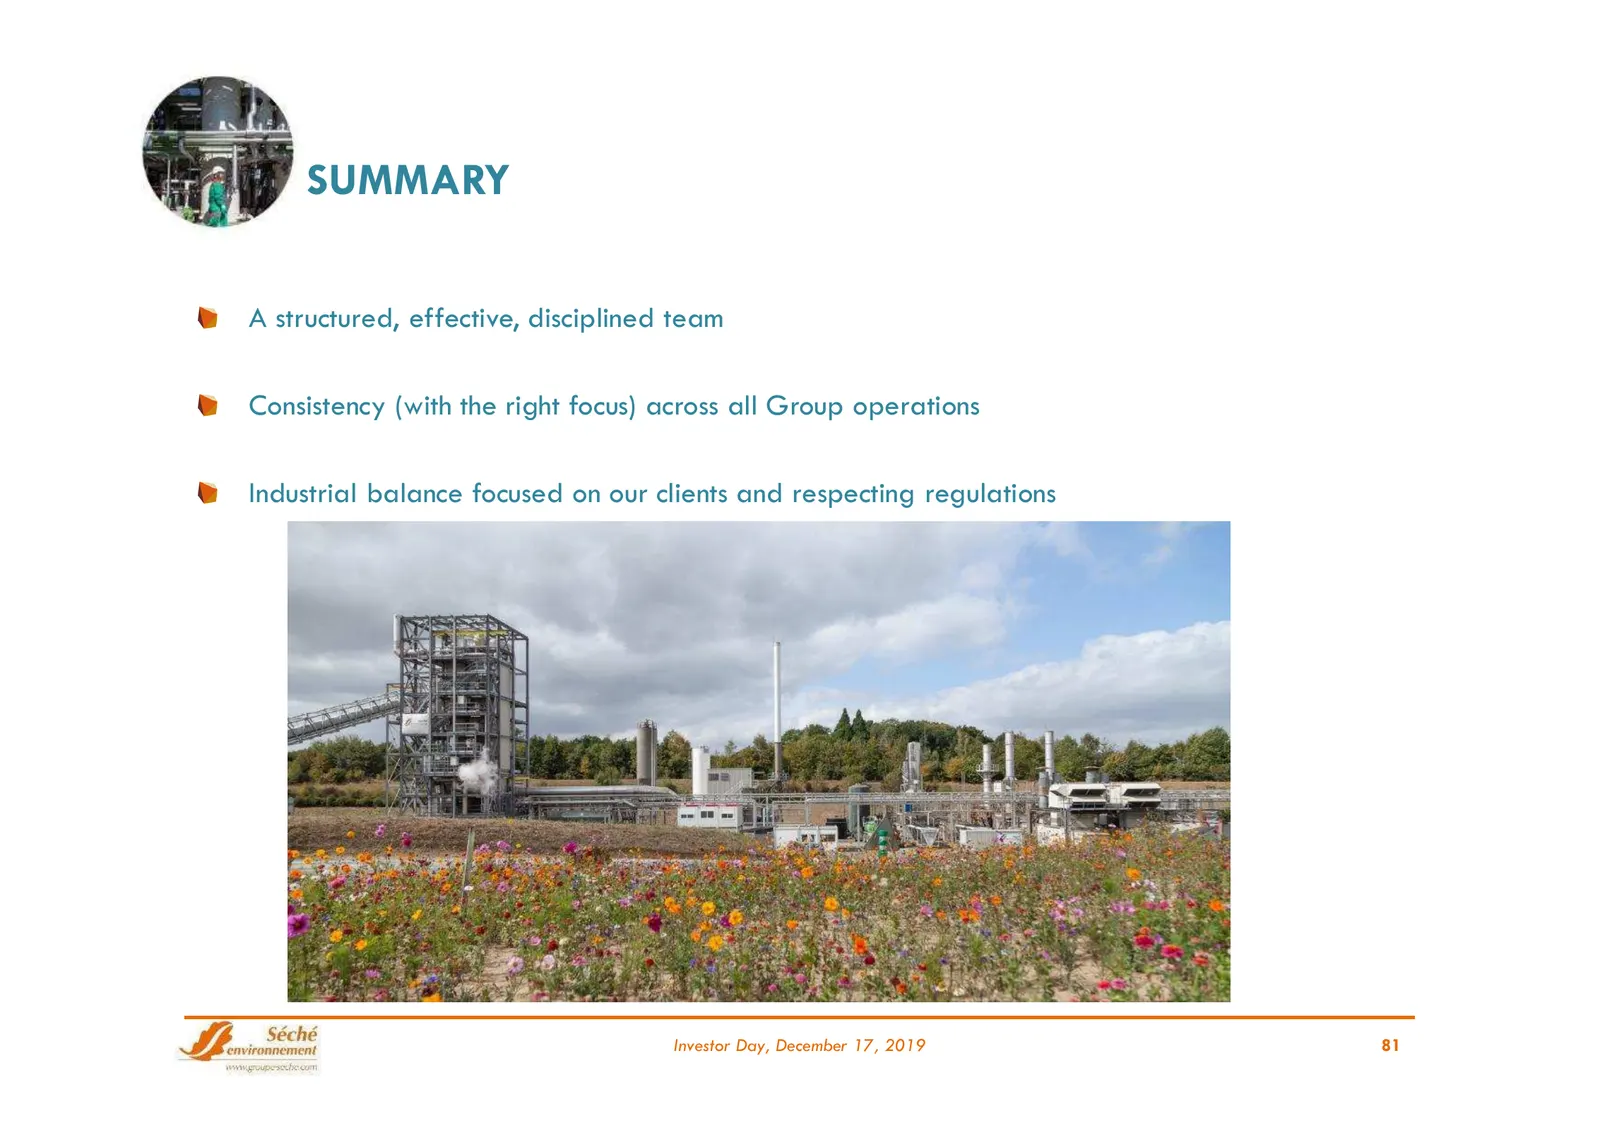
SUMMARY A structured, effective, disciplined team Consistency (with the right focus) across all Group operations Industrial balance focused on our clients and respecting regulations Investor Day, December 17, 2019 81
Slide 82: Focus: Salaise: an exemplary Seveso upper tier facility
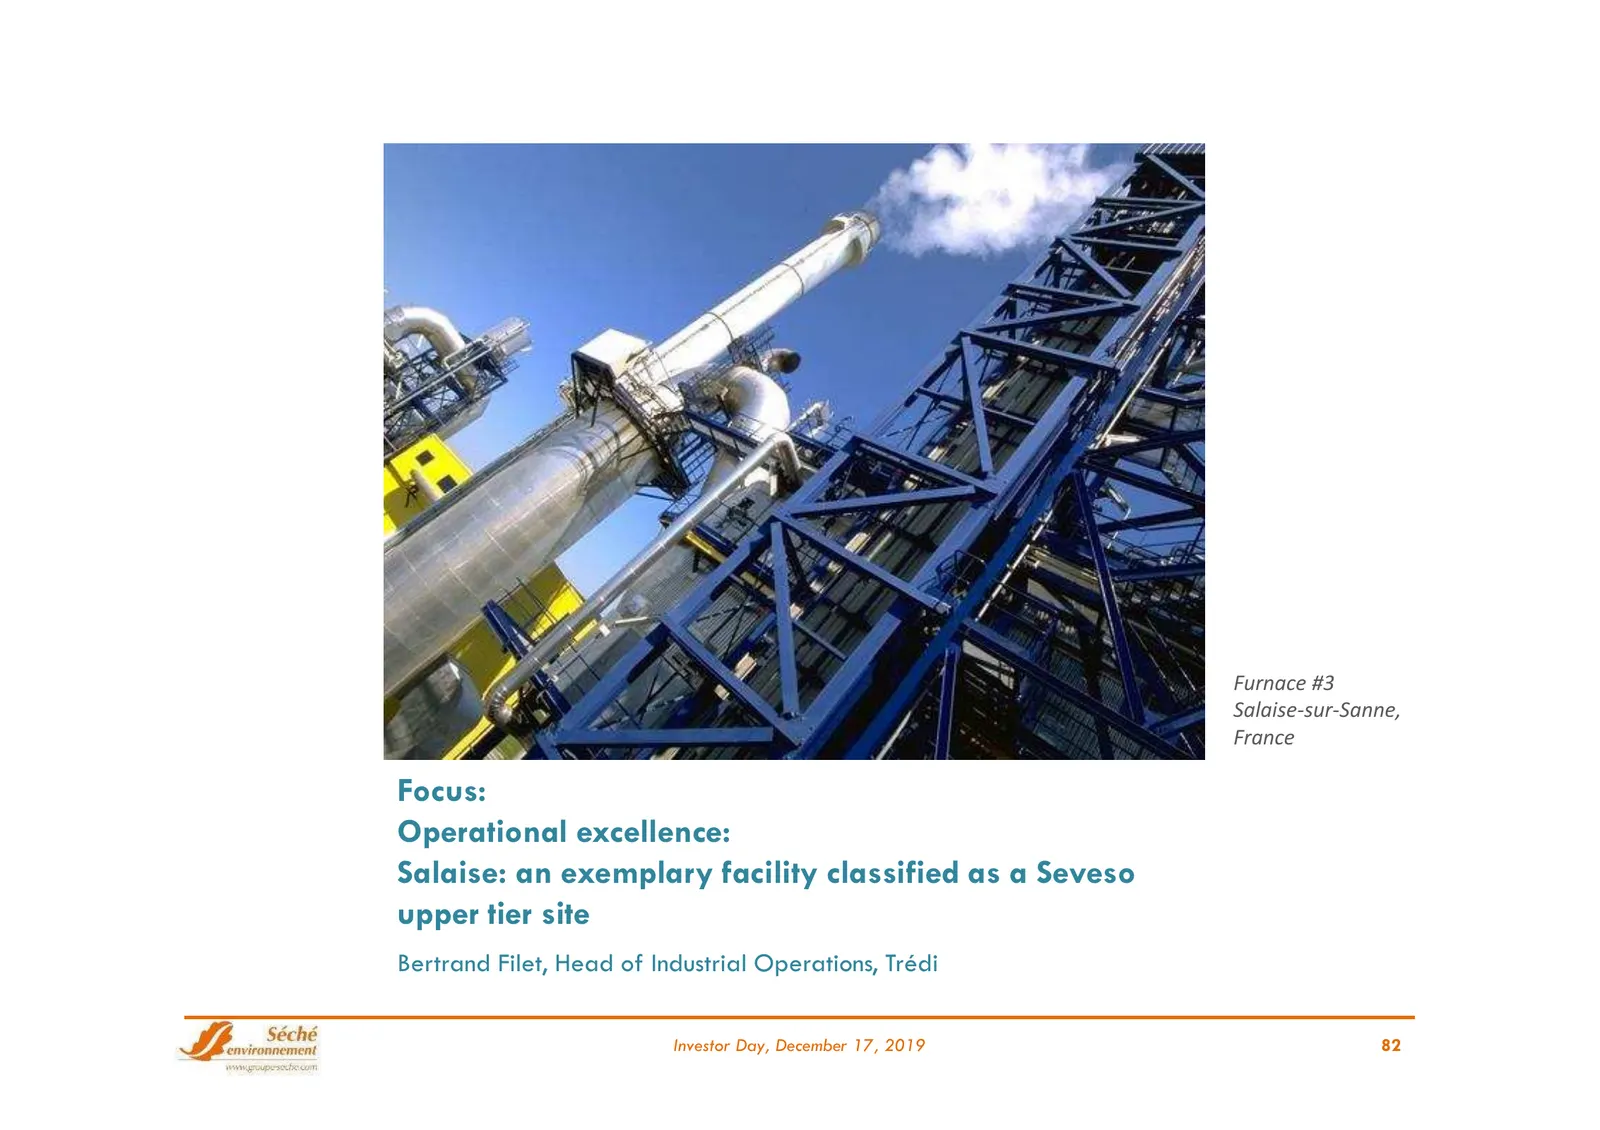
Furnace #3 Salaise-sur-Sanne, France Focus: Operational excellence: Salaise: an exemplary facility classified as a Seveso upper tier site Bertrand Filet, Head of Industrial Operations, Trédi Investor Day, December 17, 2019 82
Slide 83: SLS 2 Upgrade: a far-reaching, exemplary project
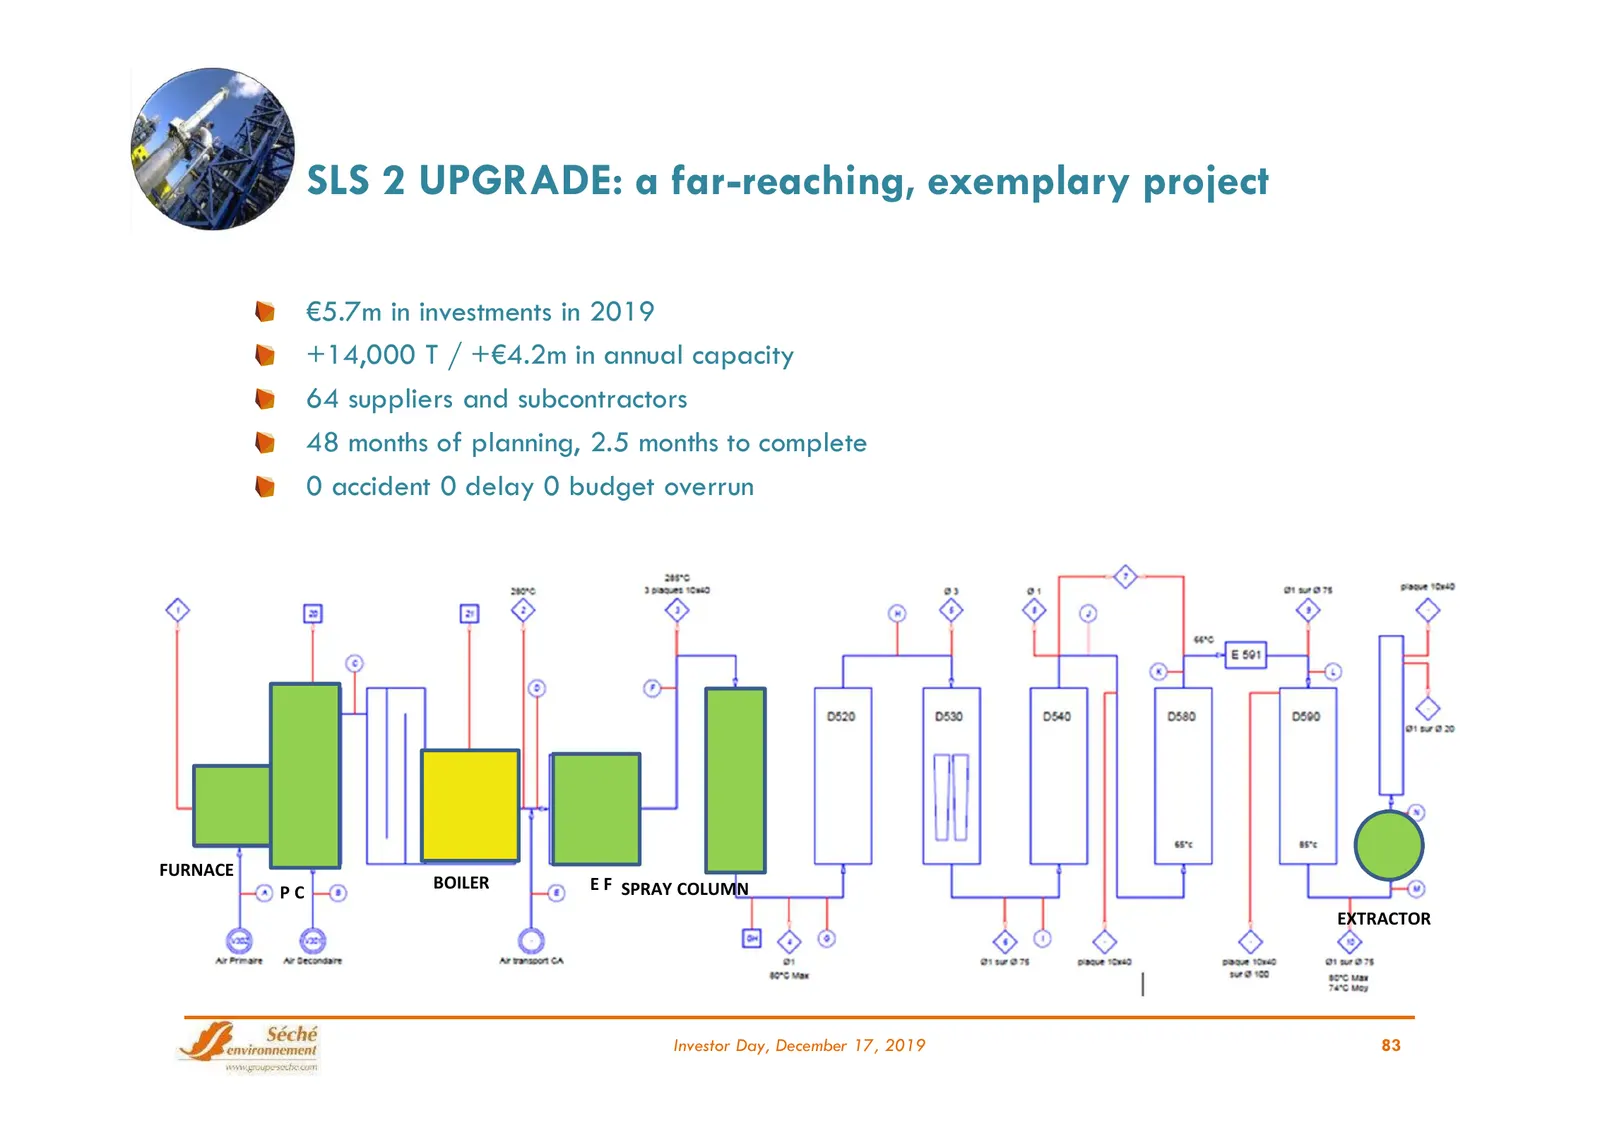
SLS 2 UPGRADE: a far-reaching, exemplary project €5.7m in investments in 2019 +14,000 T / +€4.2m in annual capacity 64 suppliers and subcontractors 48 months of planning, 2.5 months to complete 0 accident 0 delay 0 budget overrun FURNACE BOILER E F SPRAY COLUMN PC EXTRACTOR Investor Day, December 17
Slide 84: SLS 3 Steam Production: 2020 energy recovery project
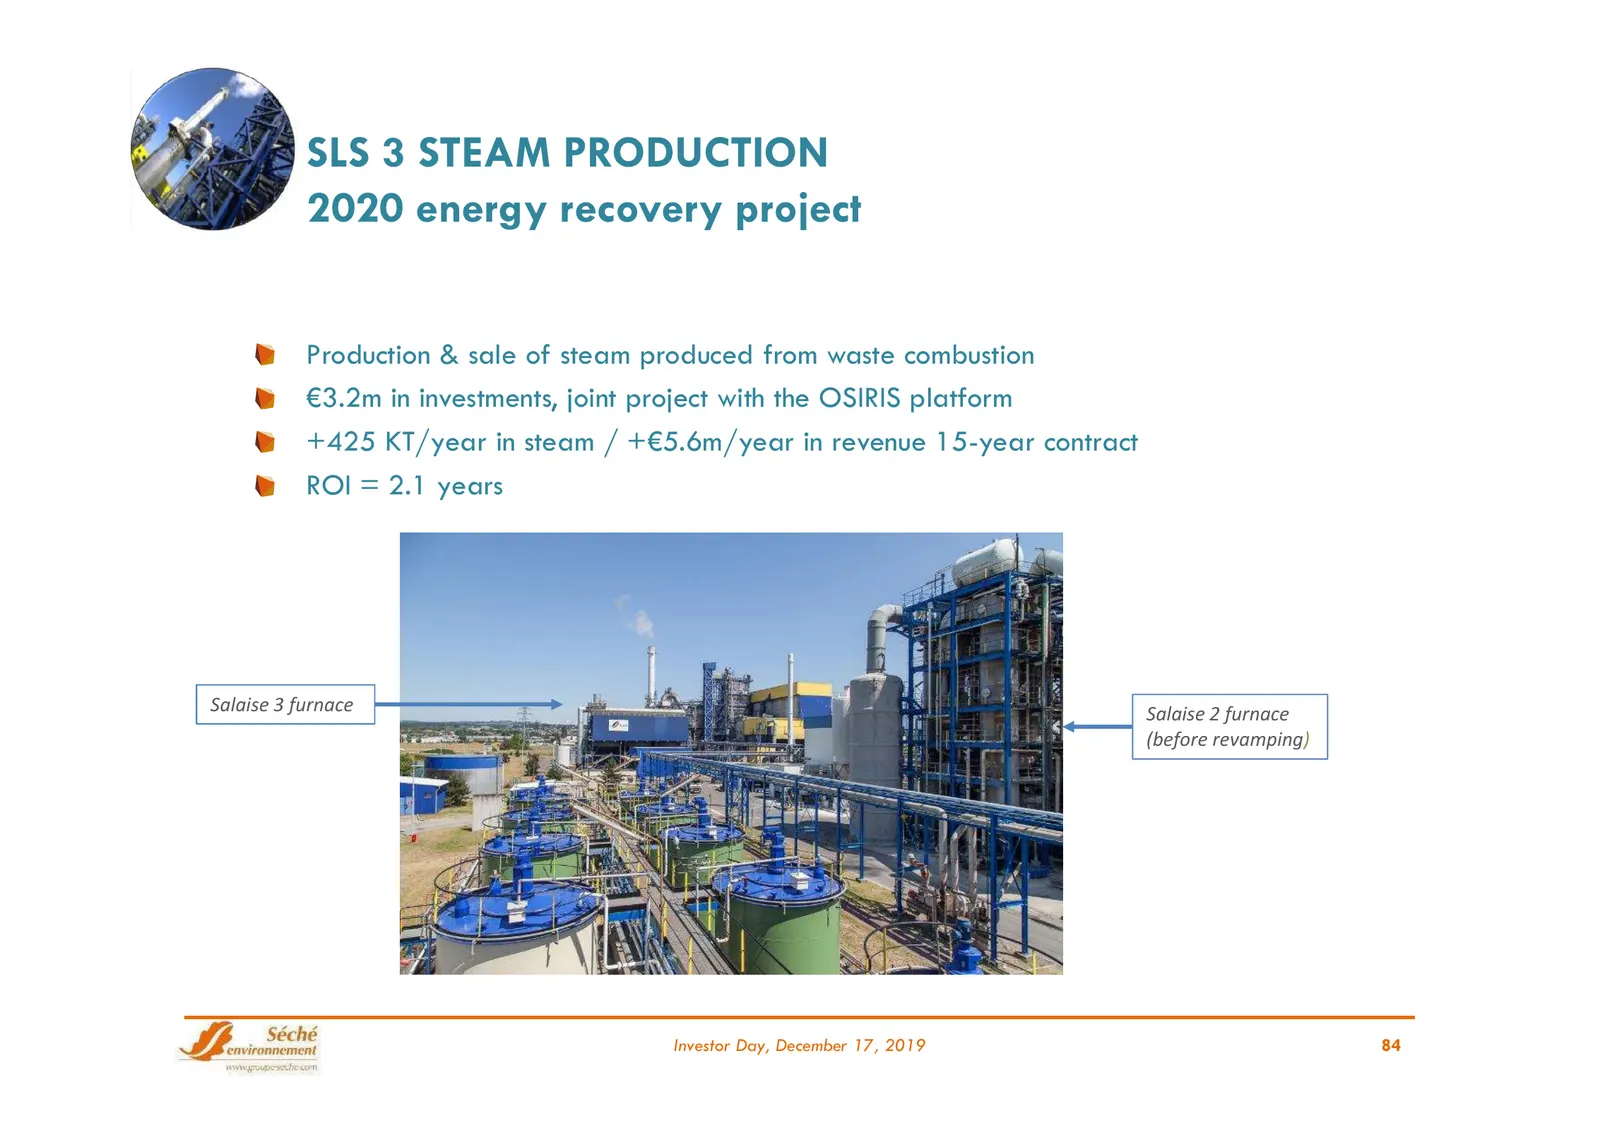
SLS 3 STEAM PRODUCTION 2020 energy recovery project Production & sale of steam produced from waste combustion €3.2m in investments, joint project with the OSIRIS platform +425 KT/year in steam / +€5.6m/year in revenue 15-year contract ROI = 2.1 years Salaise 3 furnace Salaise 2 furnace (before revam
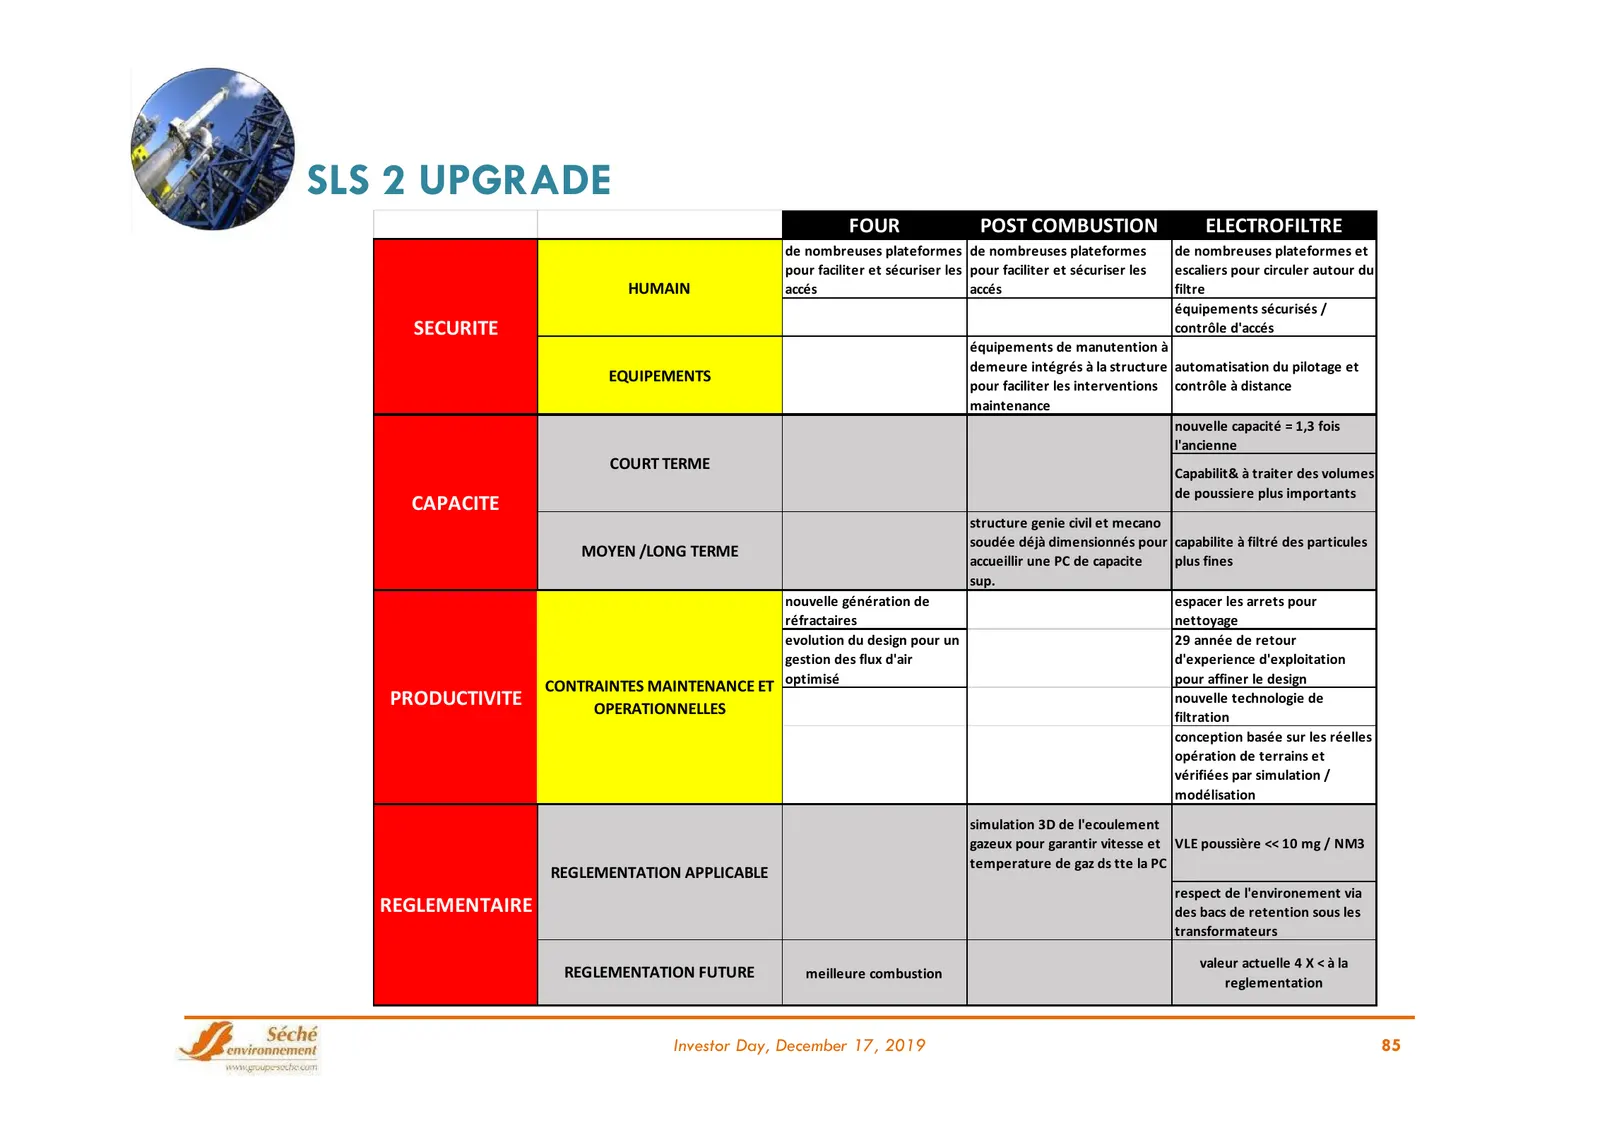
Slide 85: SLS 2 Upgrade
SLS 2 UPGRADE FOUR POST COMBUSTION ELECTROFILTRE de nombreuses plateformes de nombreuses plateformes de nombreuses plateformes et pour faciliter et sécuriser les pour faciliter et sécuriser les escaliers pour circuler autour du HUMAIN accés accés filtre équipements sécurisés / SECURITE contrôle d'ac
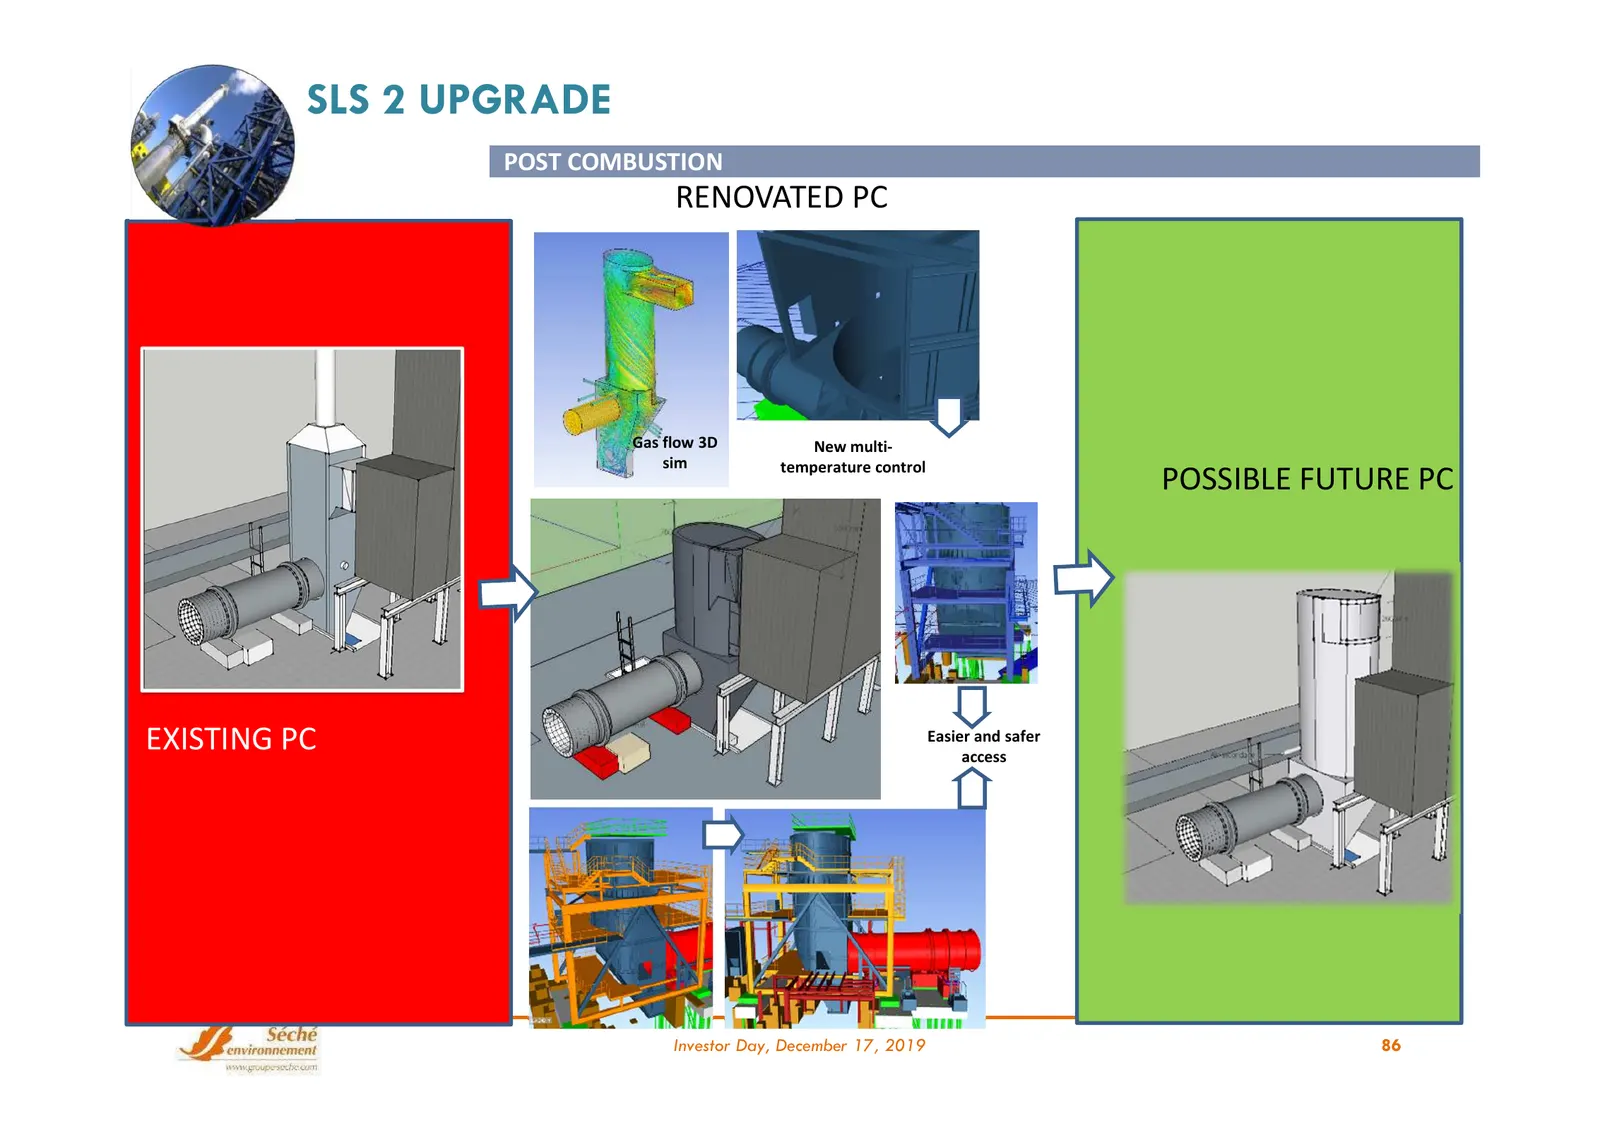
Slide 86: SLS 2 Upgrade
SLS 2 UPGRADE POST COMBUSTION RENOVATED PC Gas flow 3D New multi- sim temperature control POSSIBLE FUTURE PC EXISTING PC Easier and safer access Investor Day, December 17, 2019 86
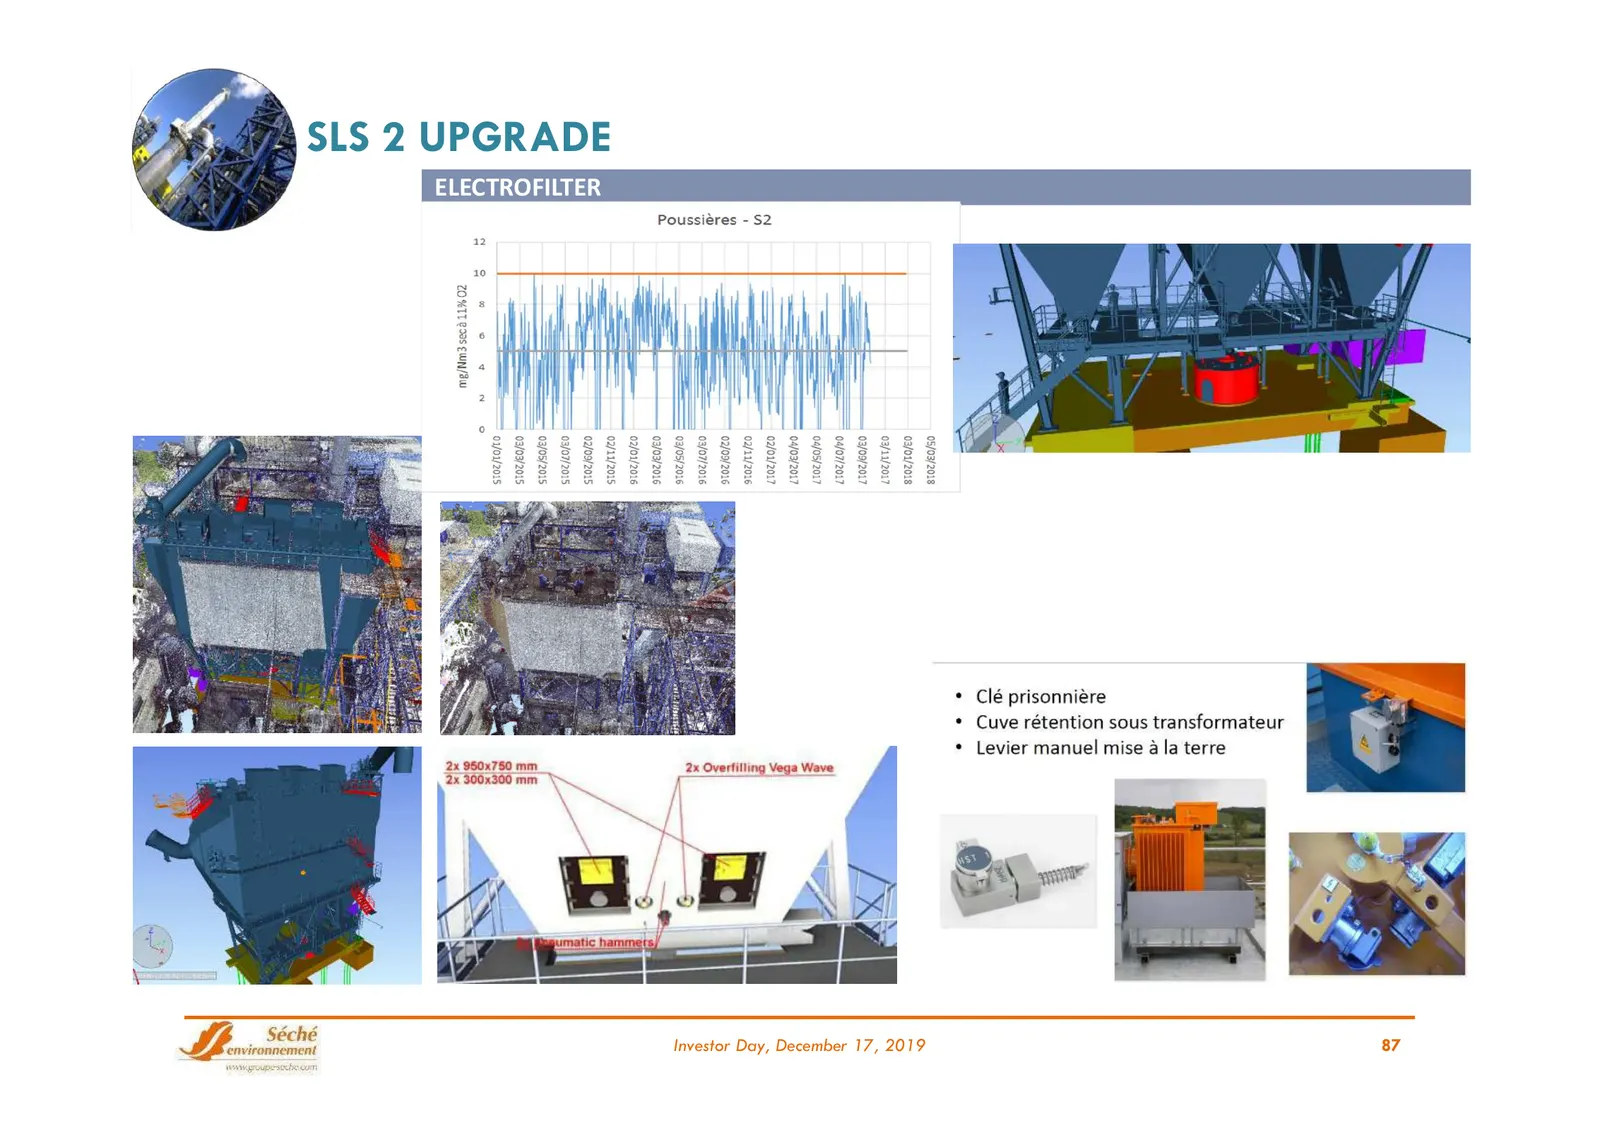
Slide 87: SLS 2 Upgrade: Electrofilter
SLS 2 UPGRADE ELECTROFILTER Investor Day, December 17, 2019 87
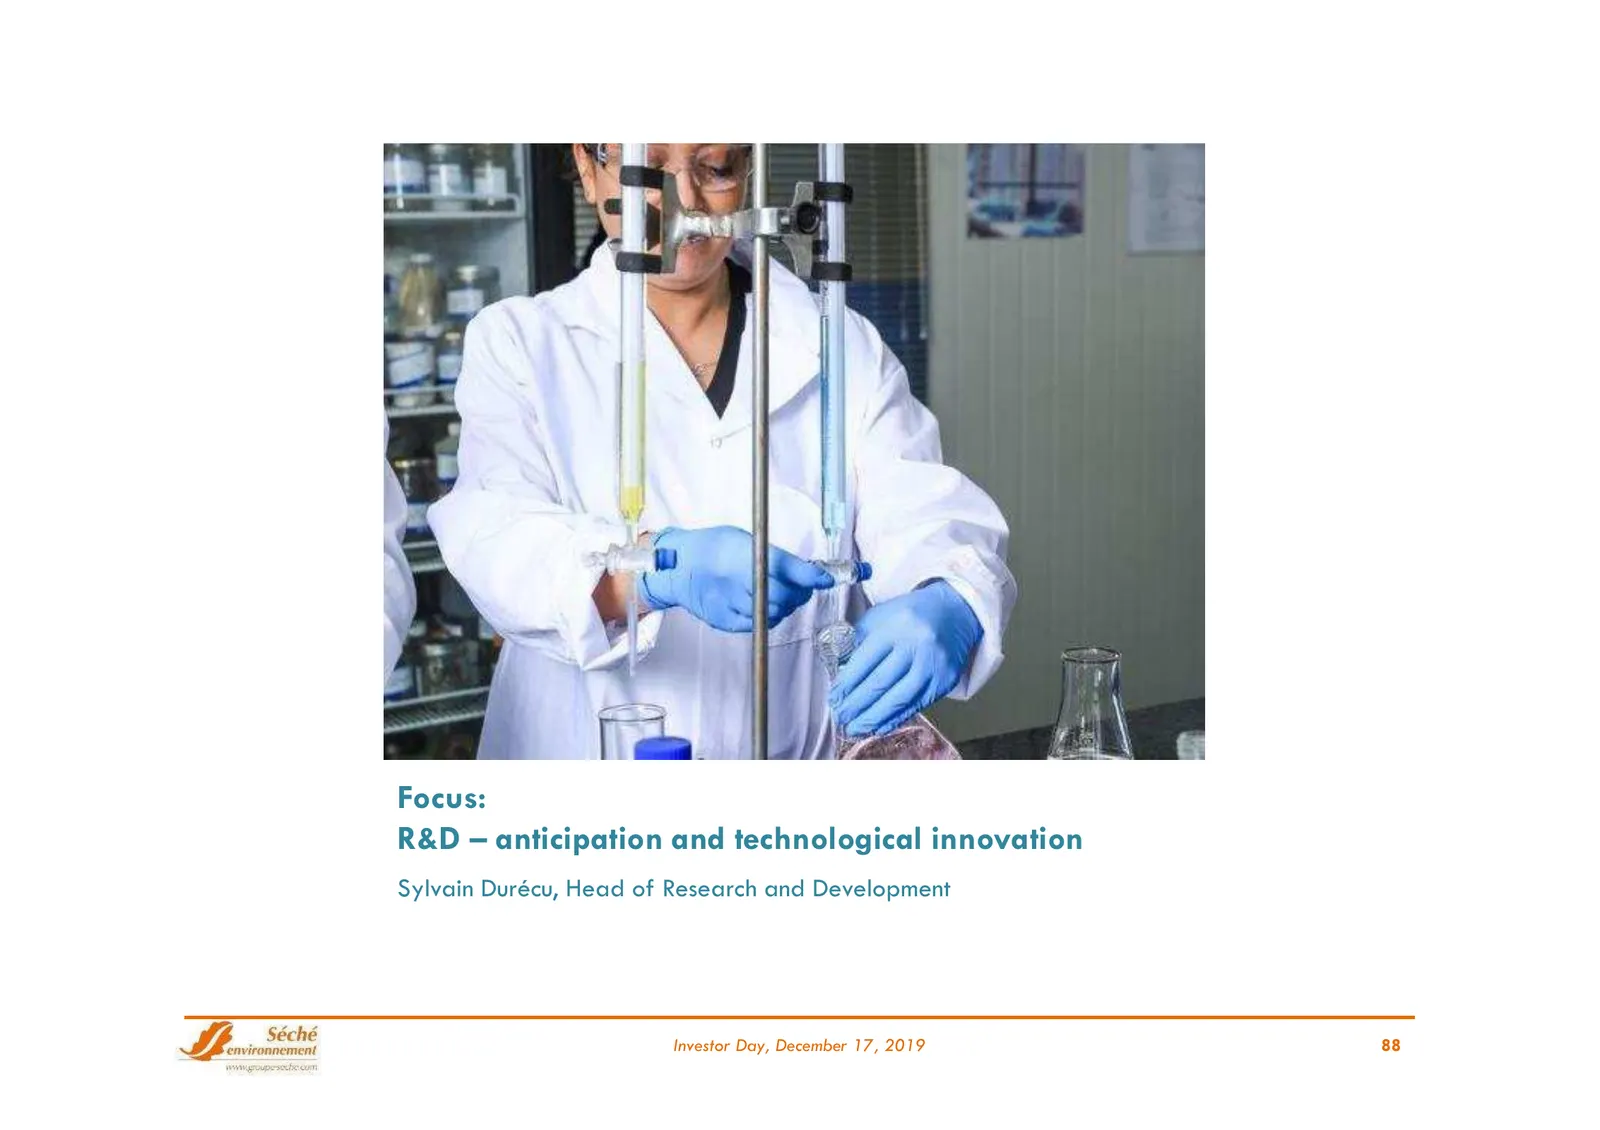
Slide 88: Focus: R&D – anticipation and technological innovation
Focus: R&D – anticipation and technological innovation Sylvain Durécu, Head of Research and Development Investor Day, December 17, 2019 88
Slide 89: Research at Séché Environnement
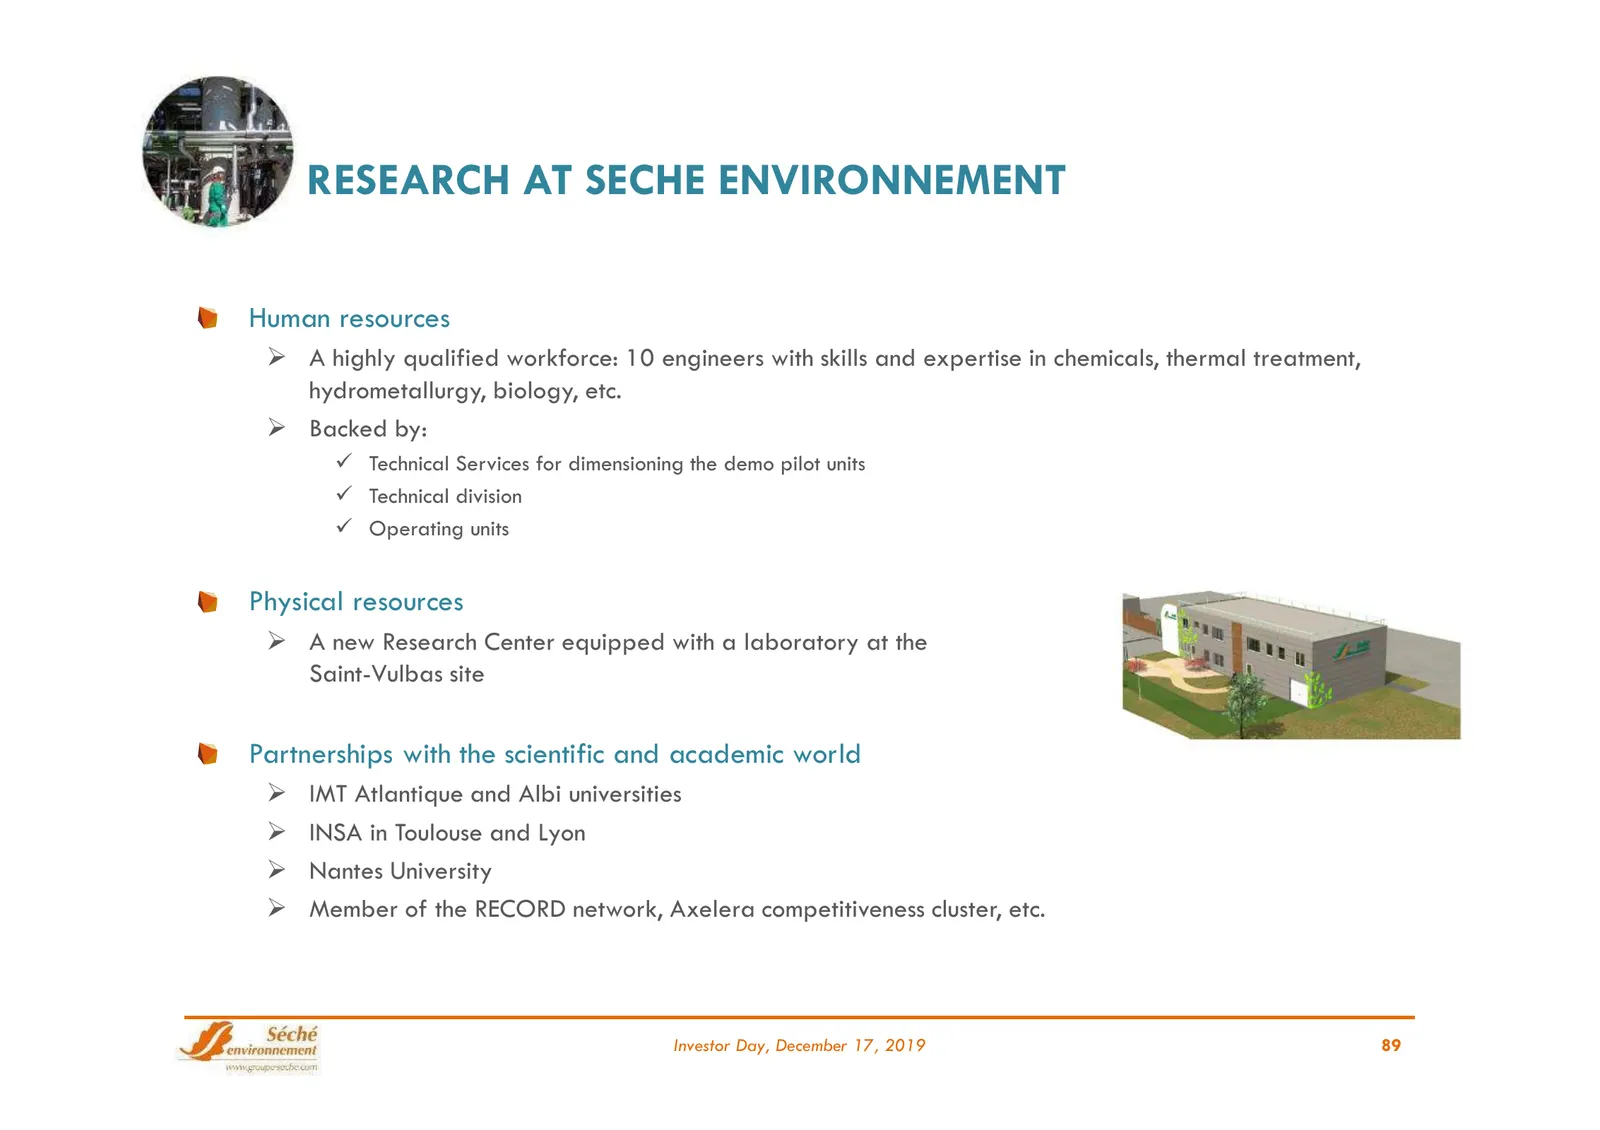
RESEARCH AT SECHE ENVIRONNEMENT Human resources A highly qualified workforce: 10 engineers with skills and expertise in chemicals, thermal treatment, hydrometallurgy, biology, etc. Backed by: Technical Services for dimensioning the demo pilot units Technical division Operating units Physic
Slide 90: Research Goals
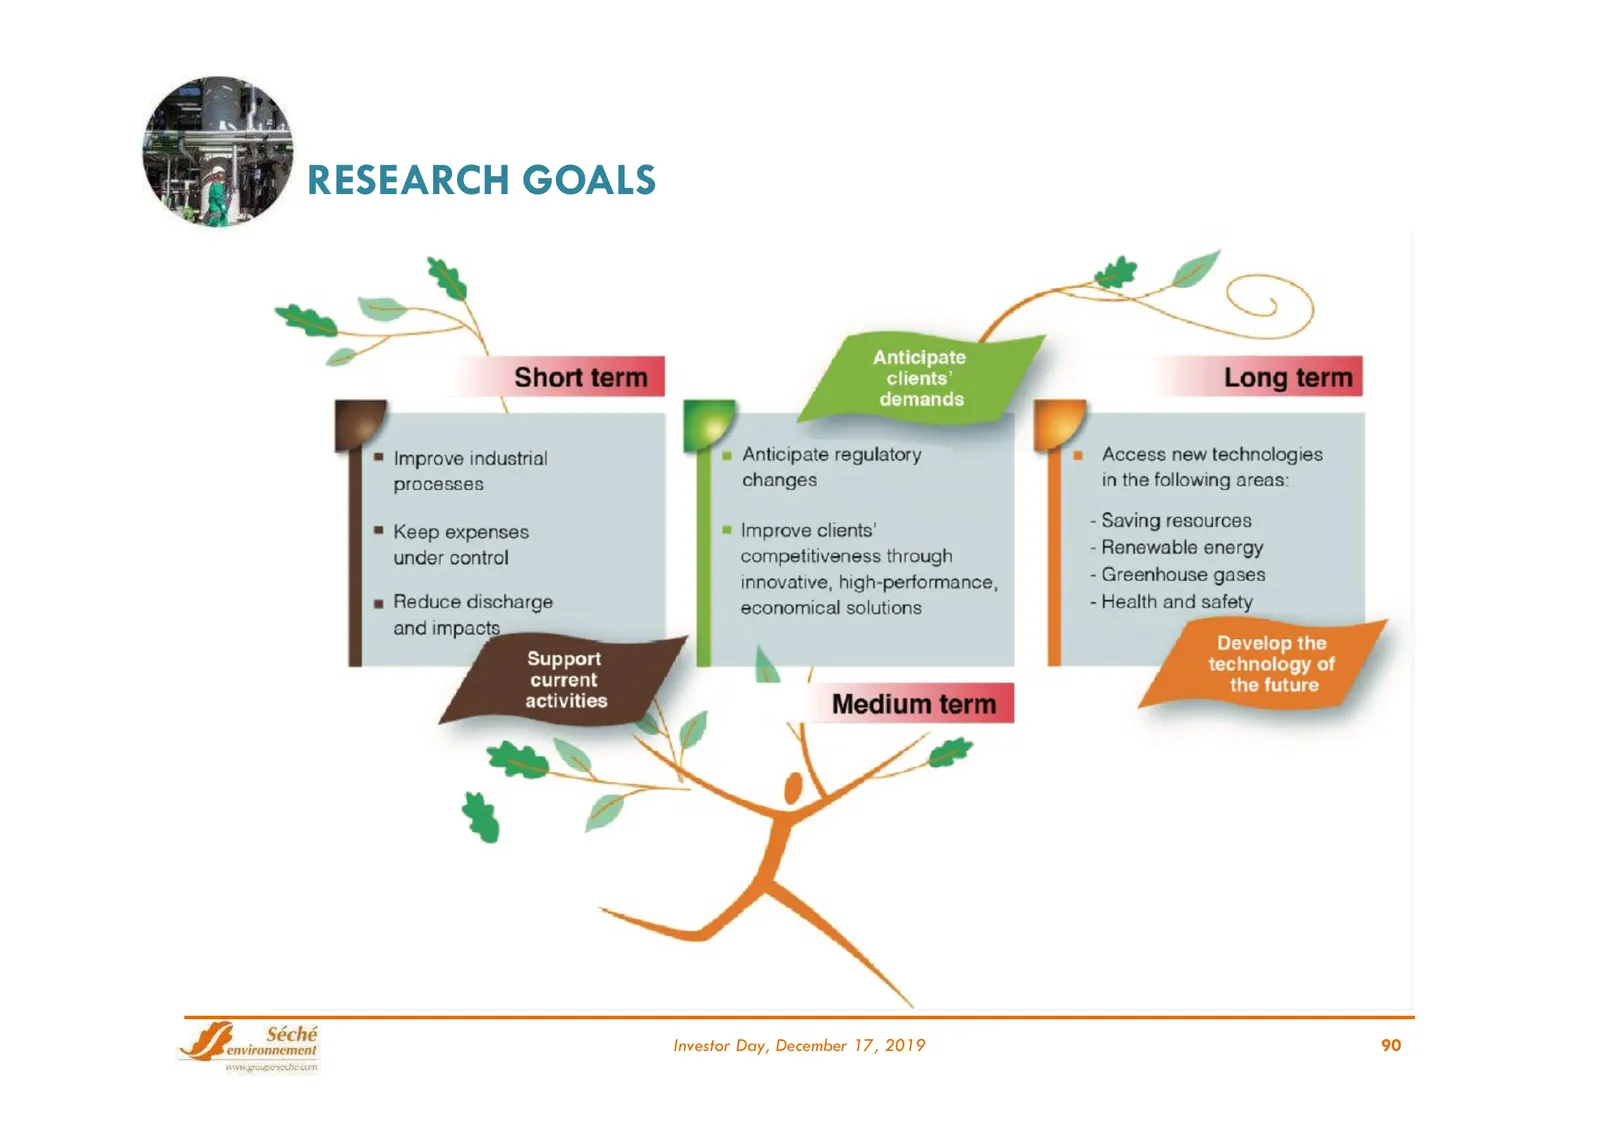
RESEARCH GOALS Investor Day, December 17, 2019 90
Slide 91: Continuous Improvement in Our Processes (1/2)
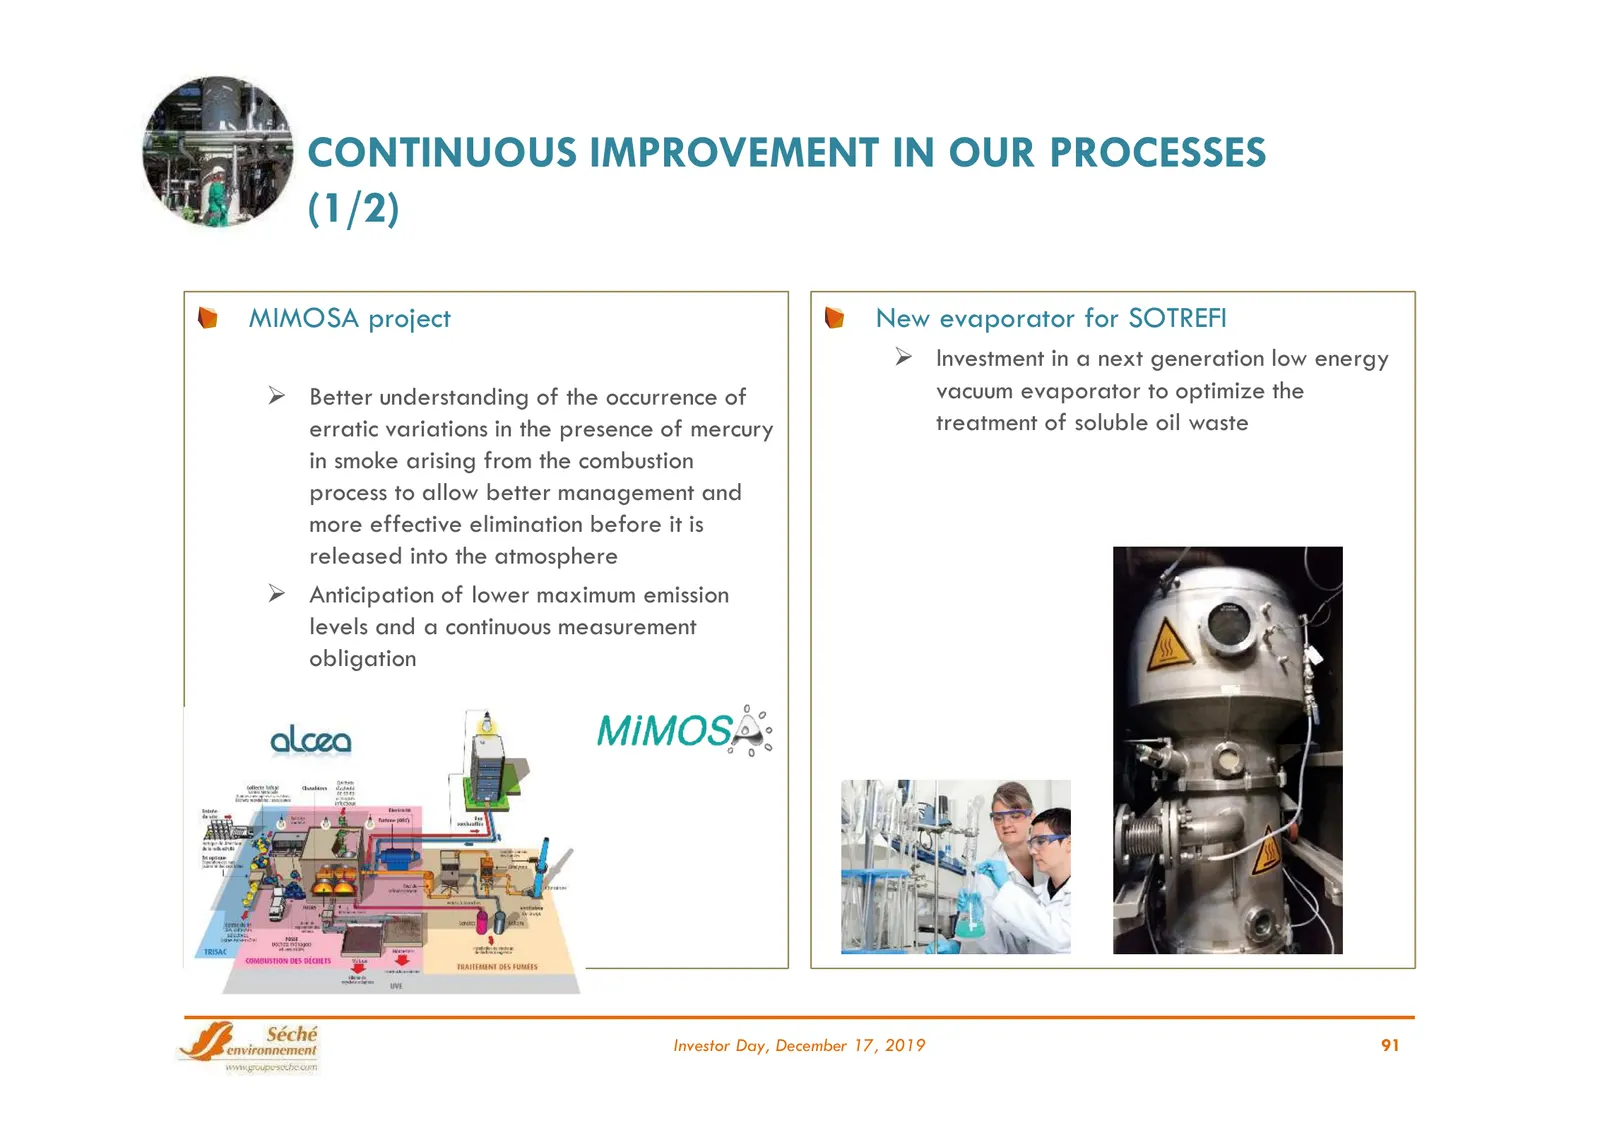
CONTINUOUS IMPROVEMENT IN OUR PROCESSES (1/2) MIMOSA project New evaporator for SOTREFI Investment in a next generation low energy Better understanding of the occurrence of vacuum evaporator to optimize the erratic variations in the presence of mercury treatment of soluble oil waste in smoke ari
Slide 92: Continuous Improvement in Our Processes (2/2)
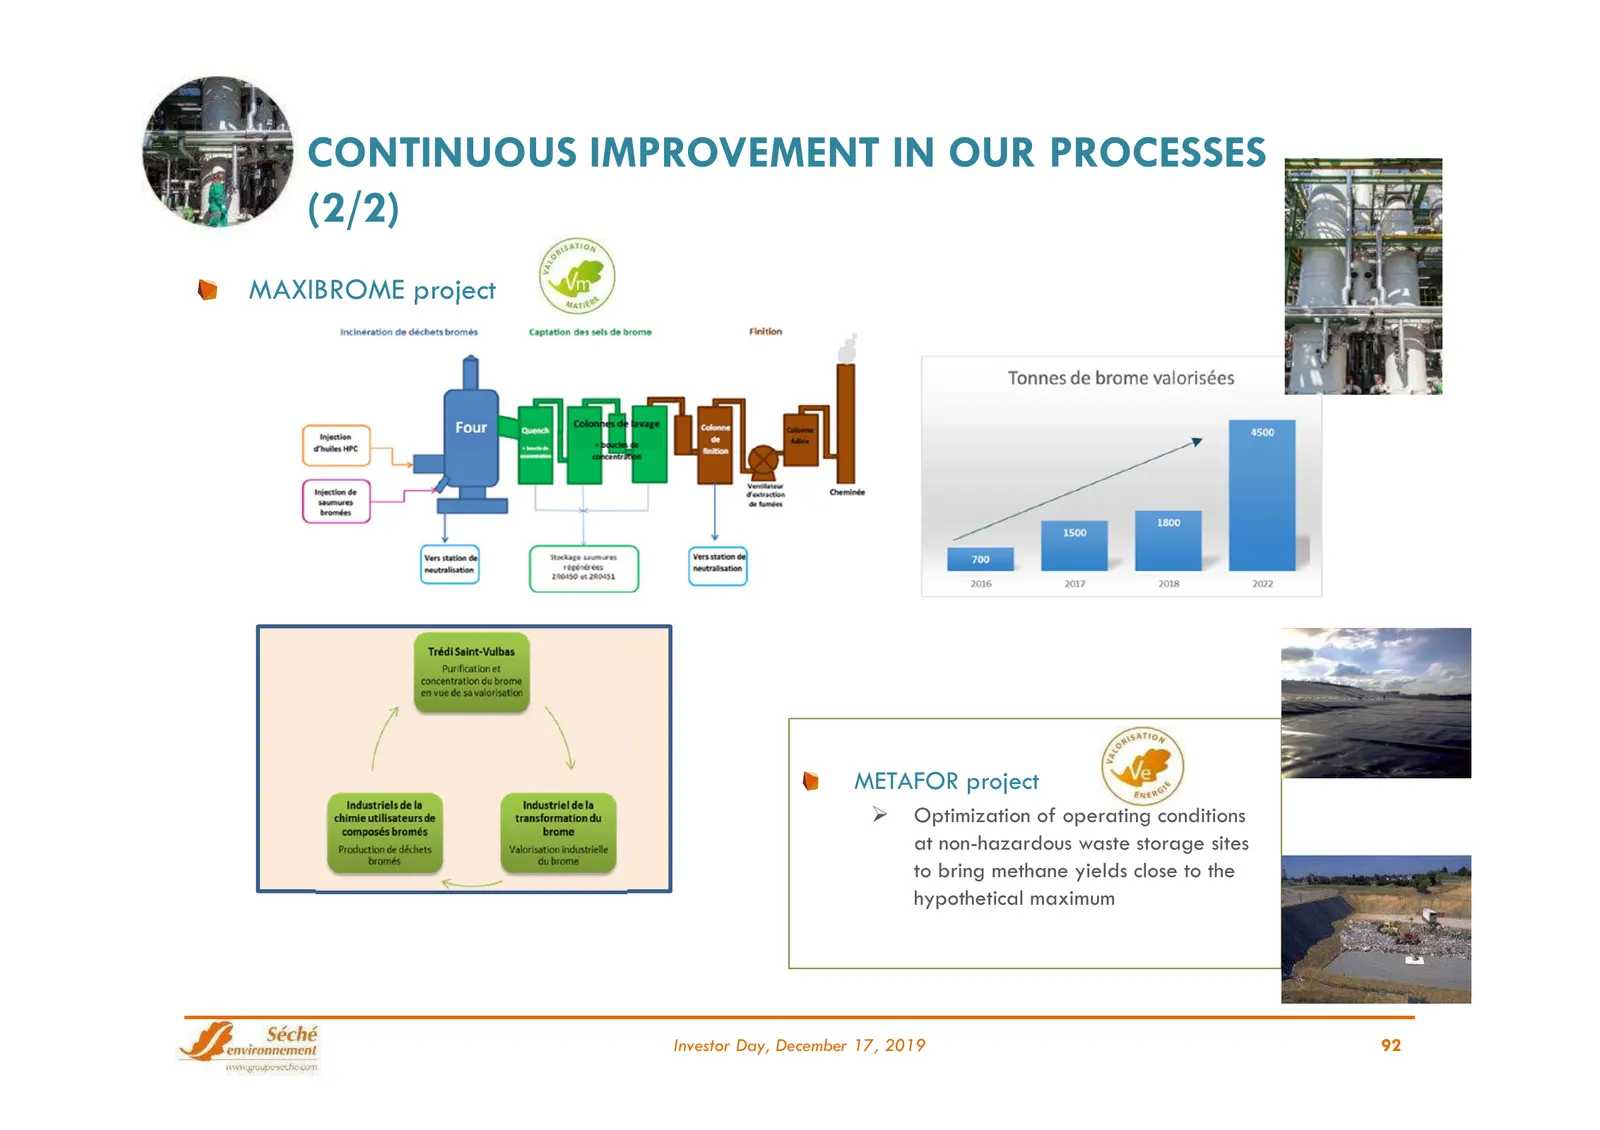
CONTINUOUS IMPROVEMENT IN OUR PROCESSES (2/2) MAXIBROME project METAFOR project Optimization of operating conditions at non-hazardous waste storage sites to bring methane yields close to the hypothetical maximum Investor Day, December 17, 2019 92
Slide 93: Future Projects (1/2)
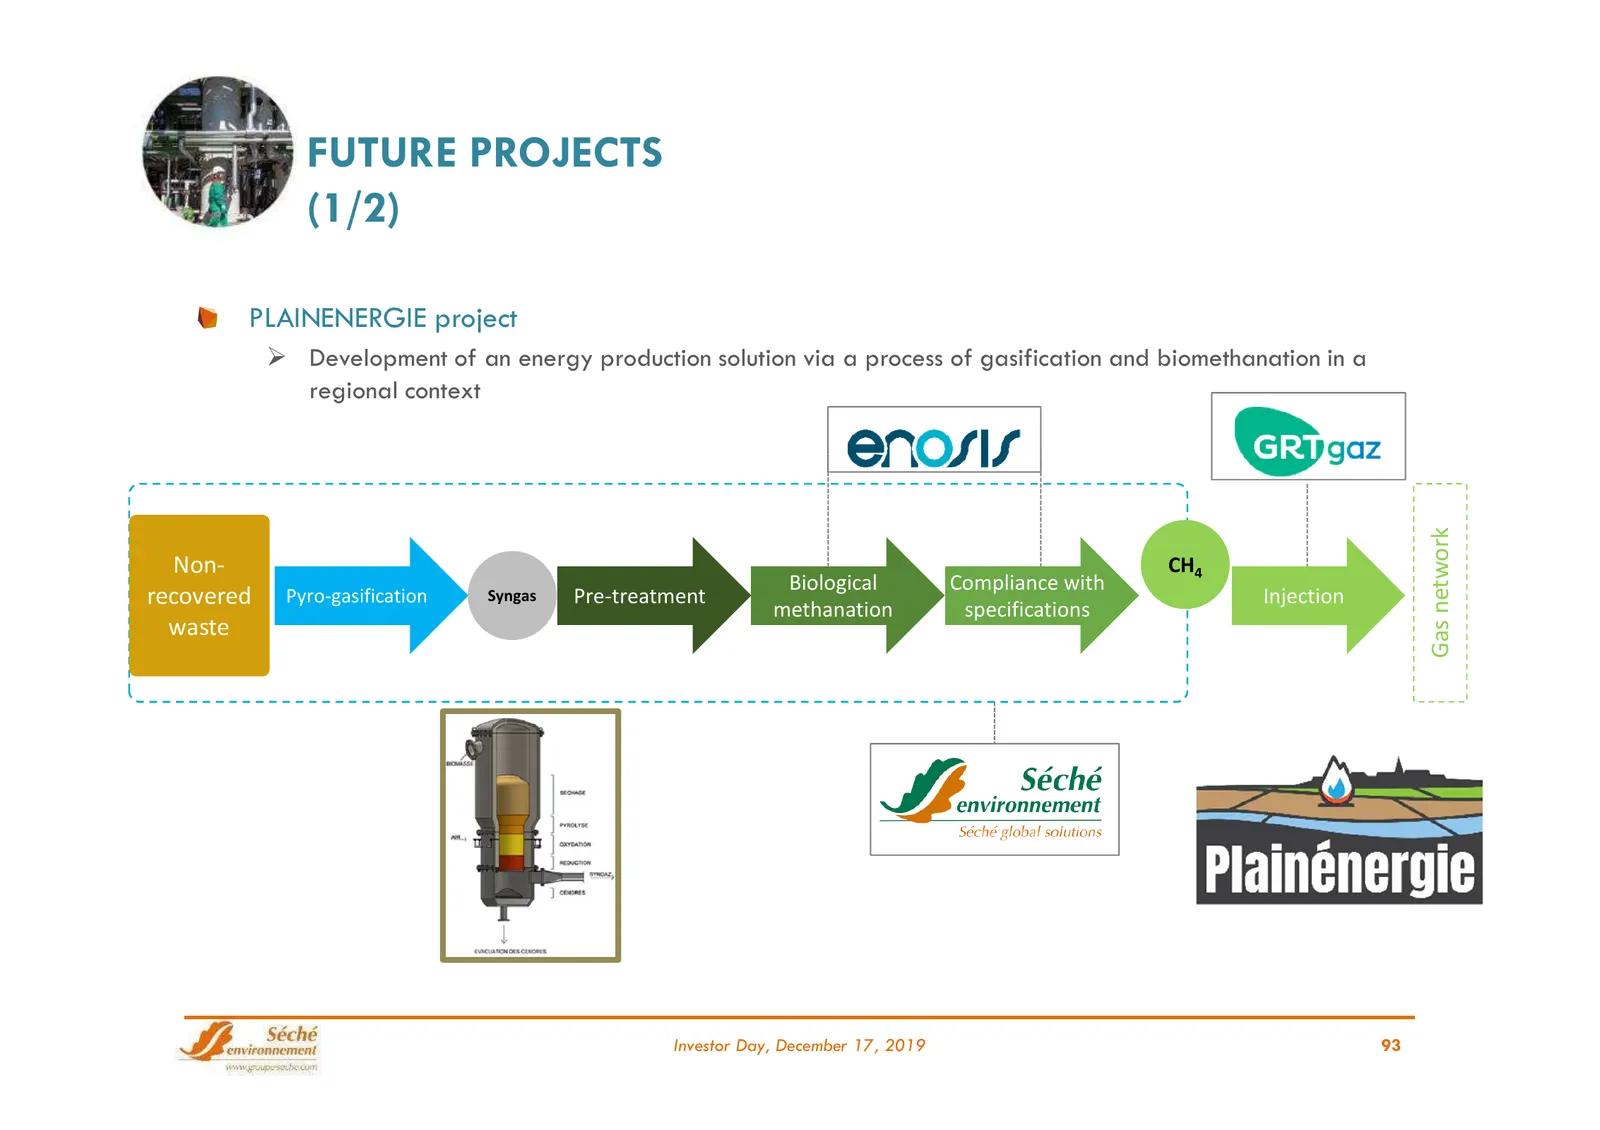
FUTURE PROJECTS (1/2) PLAINENERGIE project Development of an energy production solution via a process of gasification and biomethanation in a regional context Gas network Non- CH4 Biological Compliance with recovered Pyro-gasification Syngas Pre-treatment Injection methanation specifications waste
Slide 94: Future Projects (2/2)
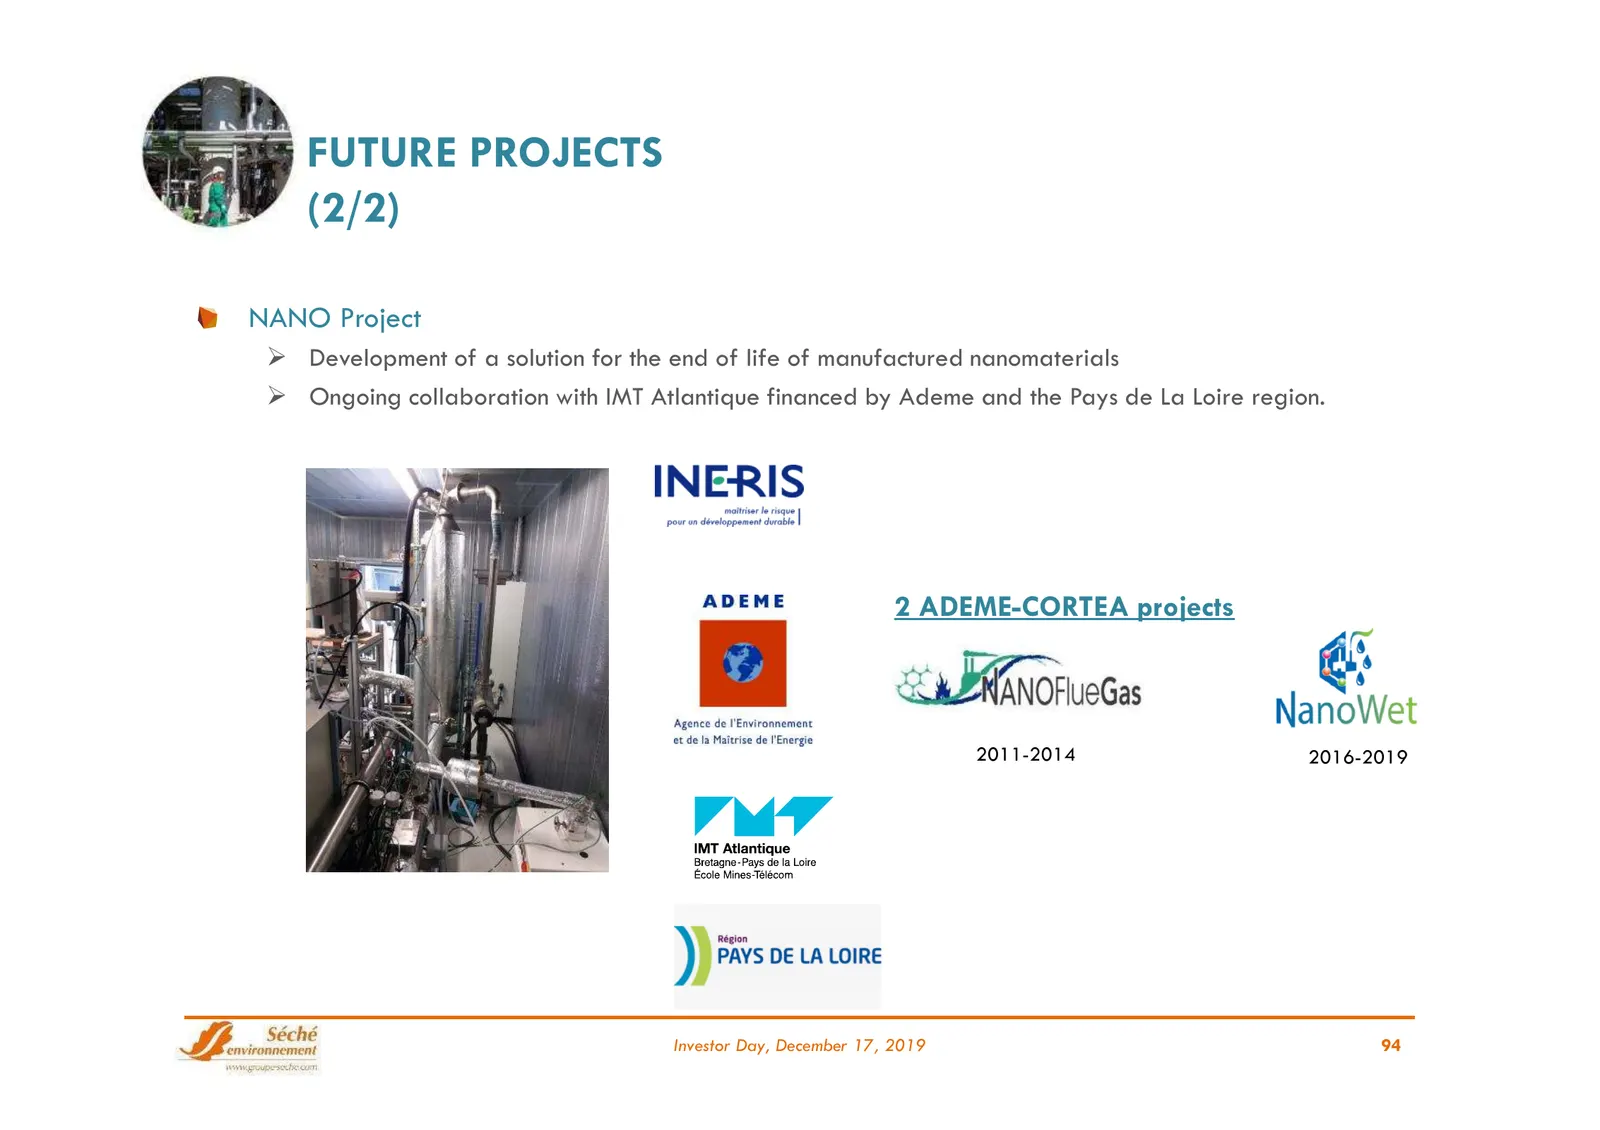
FUTURE PROJECTS (2/2) NANO Project Development of a solution for the end of life of manufactured nanomaterials Ongoing collaboration with IMT Atlantique financed by Ademe and the Pays de La Loire region. 2 ADEME-CORTEA projects 2011-2014 2016-2019 Investor Day, December 17, 2019 94
Slide 95: Our Performance Indicators
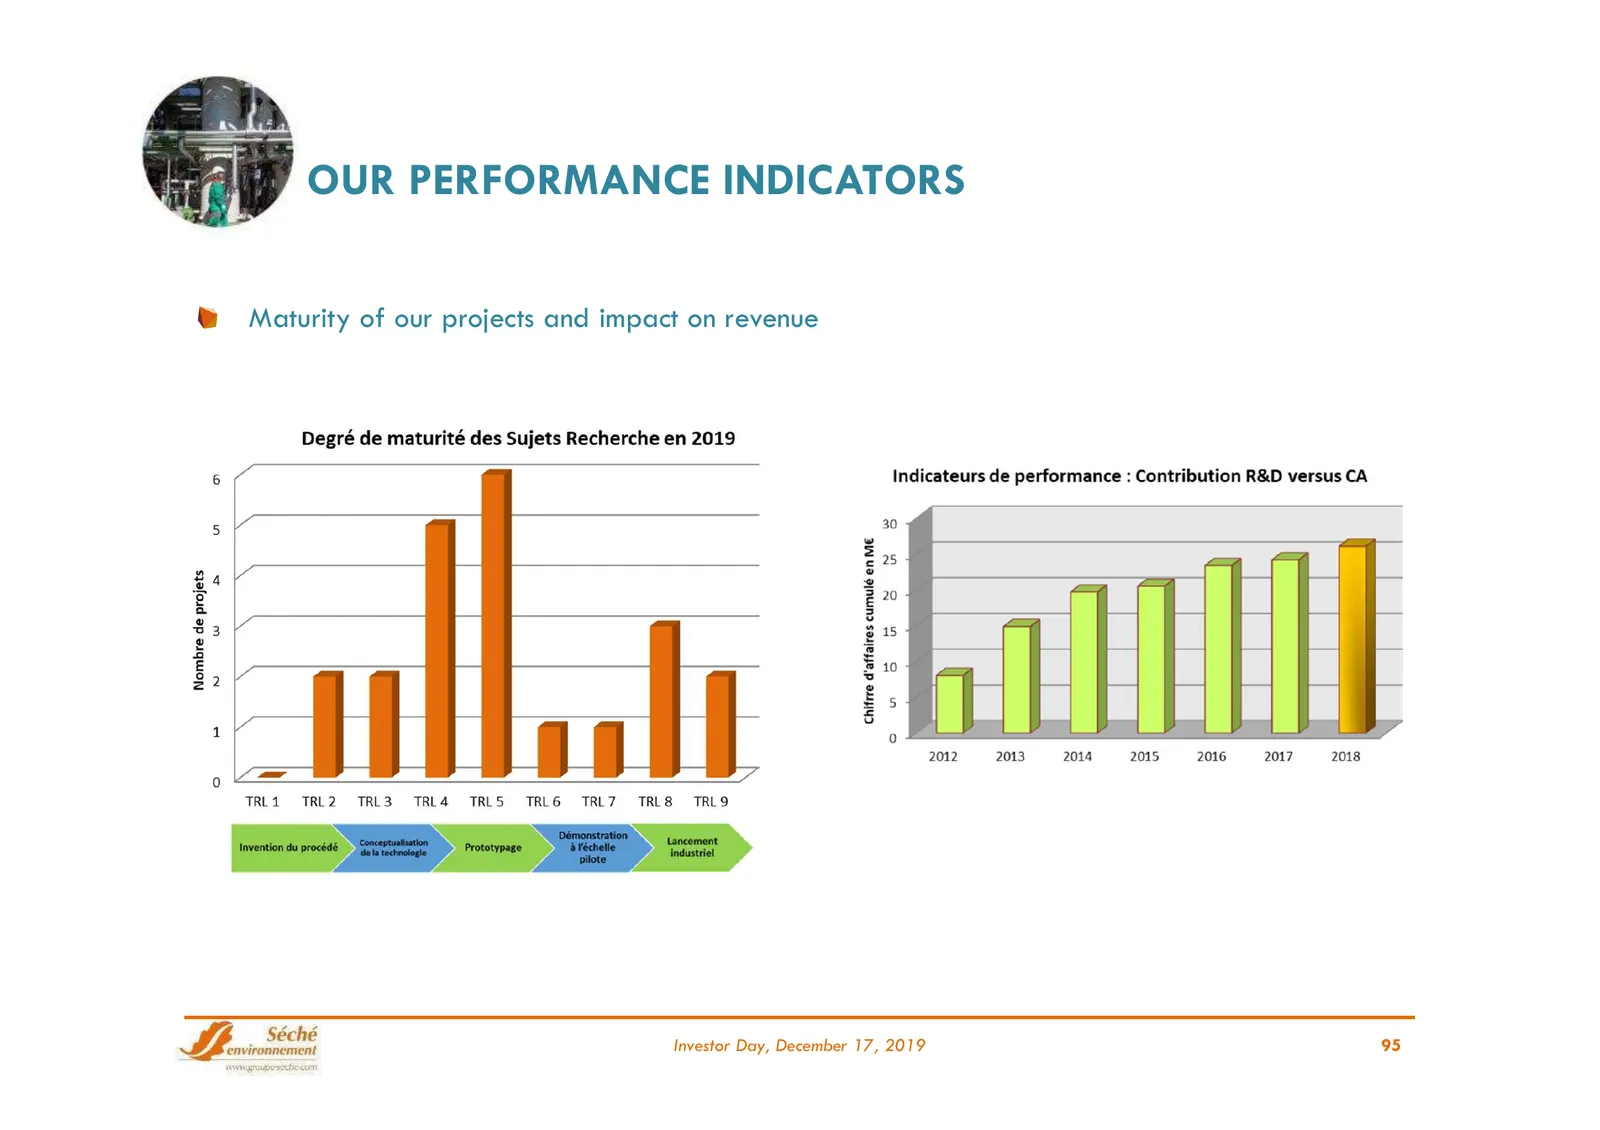
OUR PERFORMANCE INDICATORS Maturity of our projects and impact on revenue Investor Day, December 17, 2019 95
Slide 96: Economic and Financial Performance Through to 2022
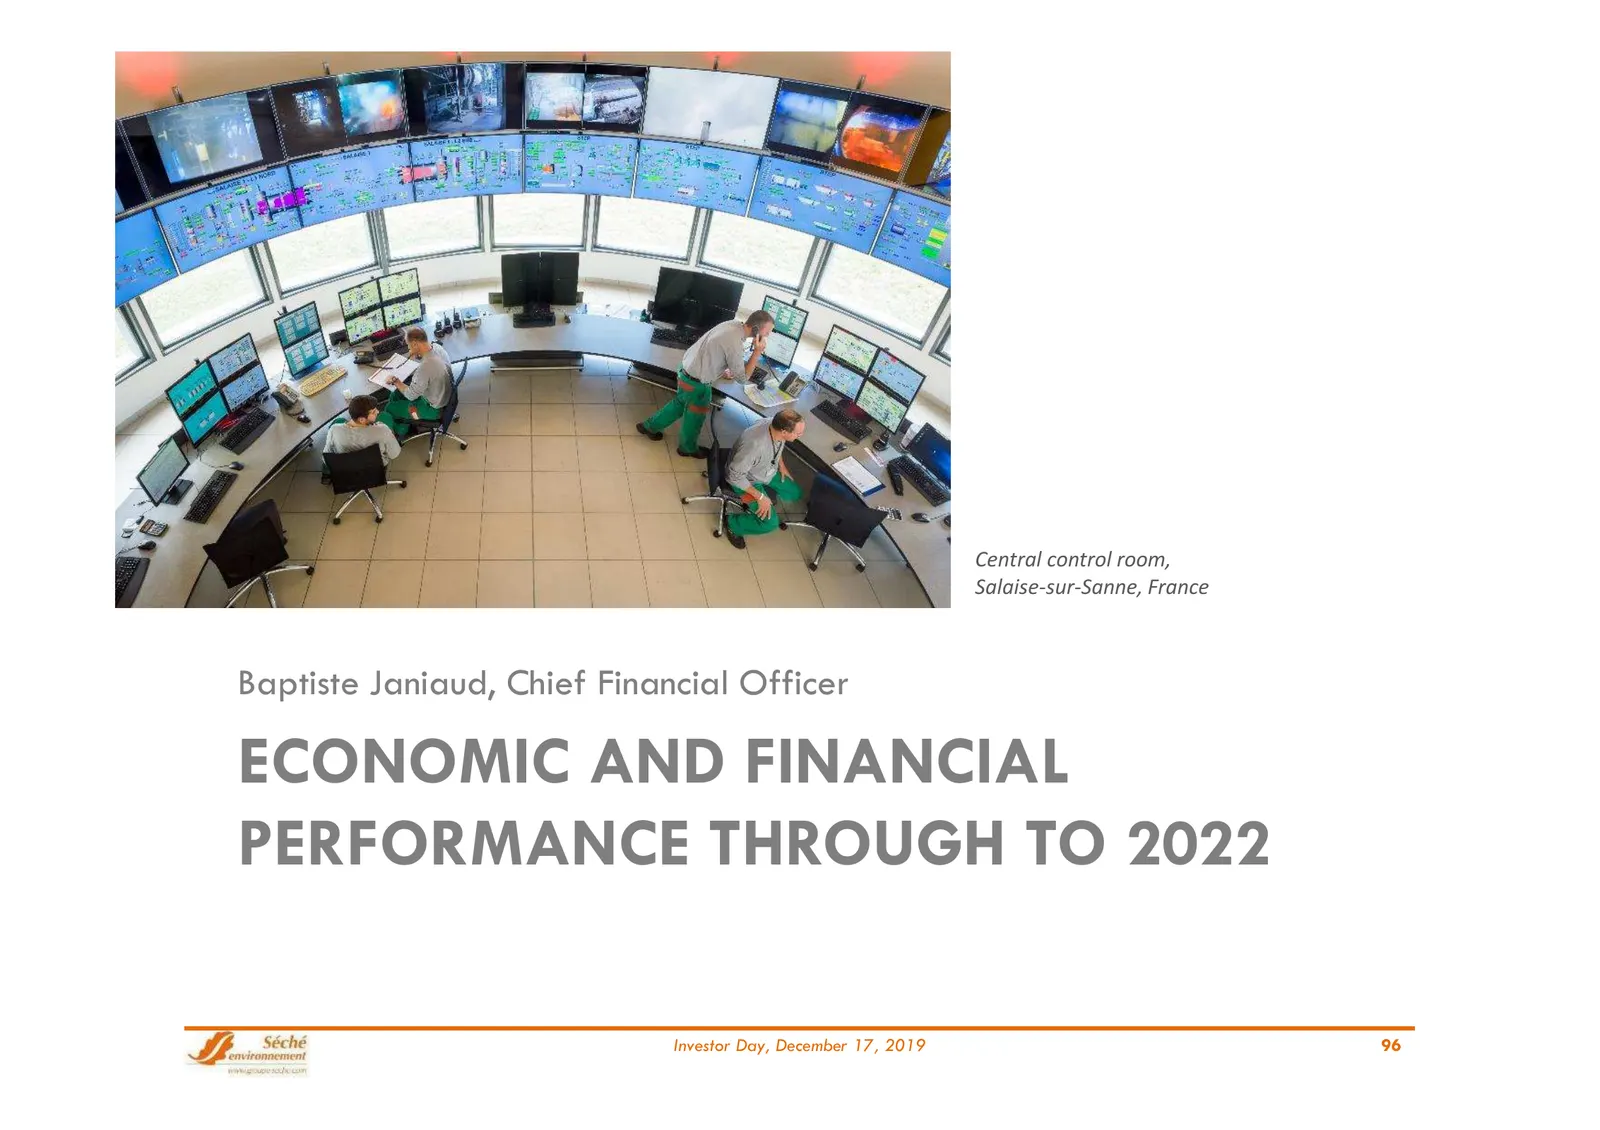
Central control room, Salaise-sur-Sanne, France Baptiste Janiaud, Chief Financial Officer ECONOMIC AND FINANCIAL PERFORMANCE THROUGH TO 2022 Investor Day, December 17, 2019 96
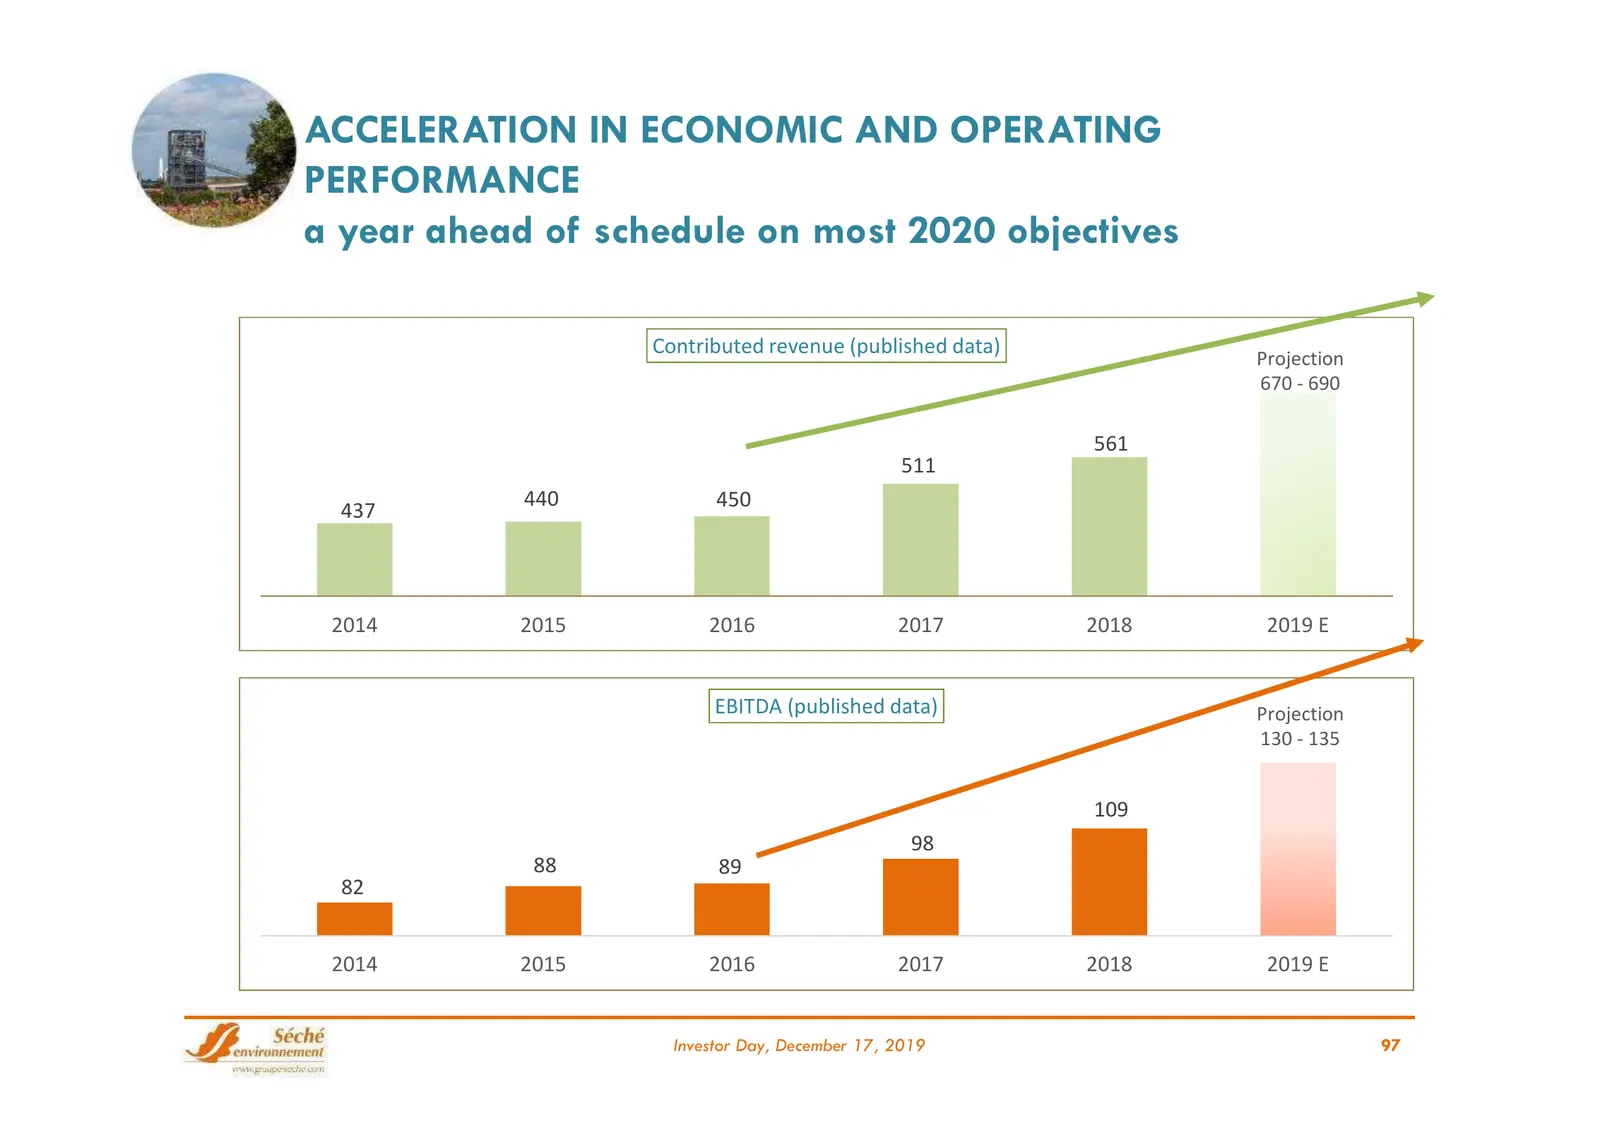
Slide 97: Acceleration in Economic and Operating Performance
ACCELERATION IN ECONOMIC AND OPERATING PERFORMANCE a year ahead of schedule on most 2020 objectives Contributed revenue (published data) Projection 670 - 690 561 511 440 450 437 2014 2015 2016 2017 2018 2019 E EBITDA (published data) Projection 130 - 135 109 98 88 89 82 2014 2015 2016 2017 2018 2019
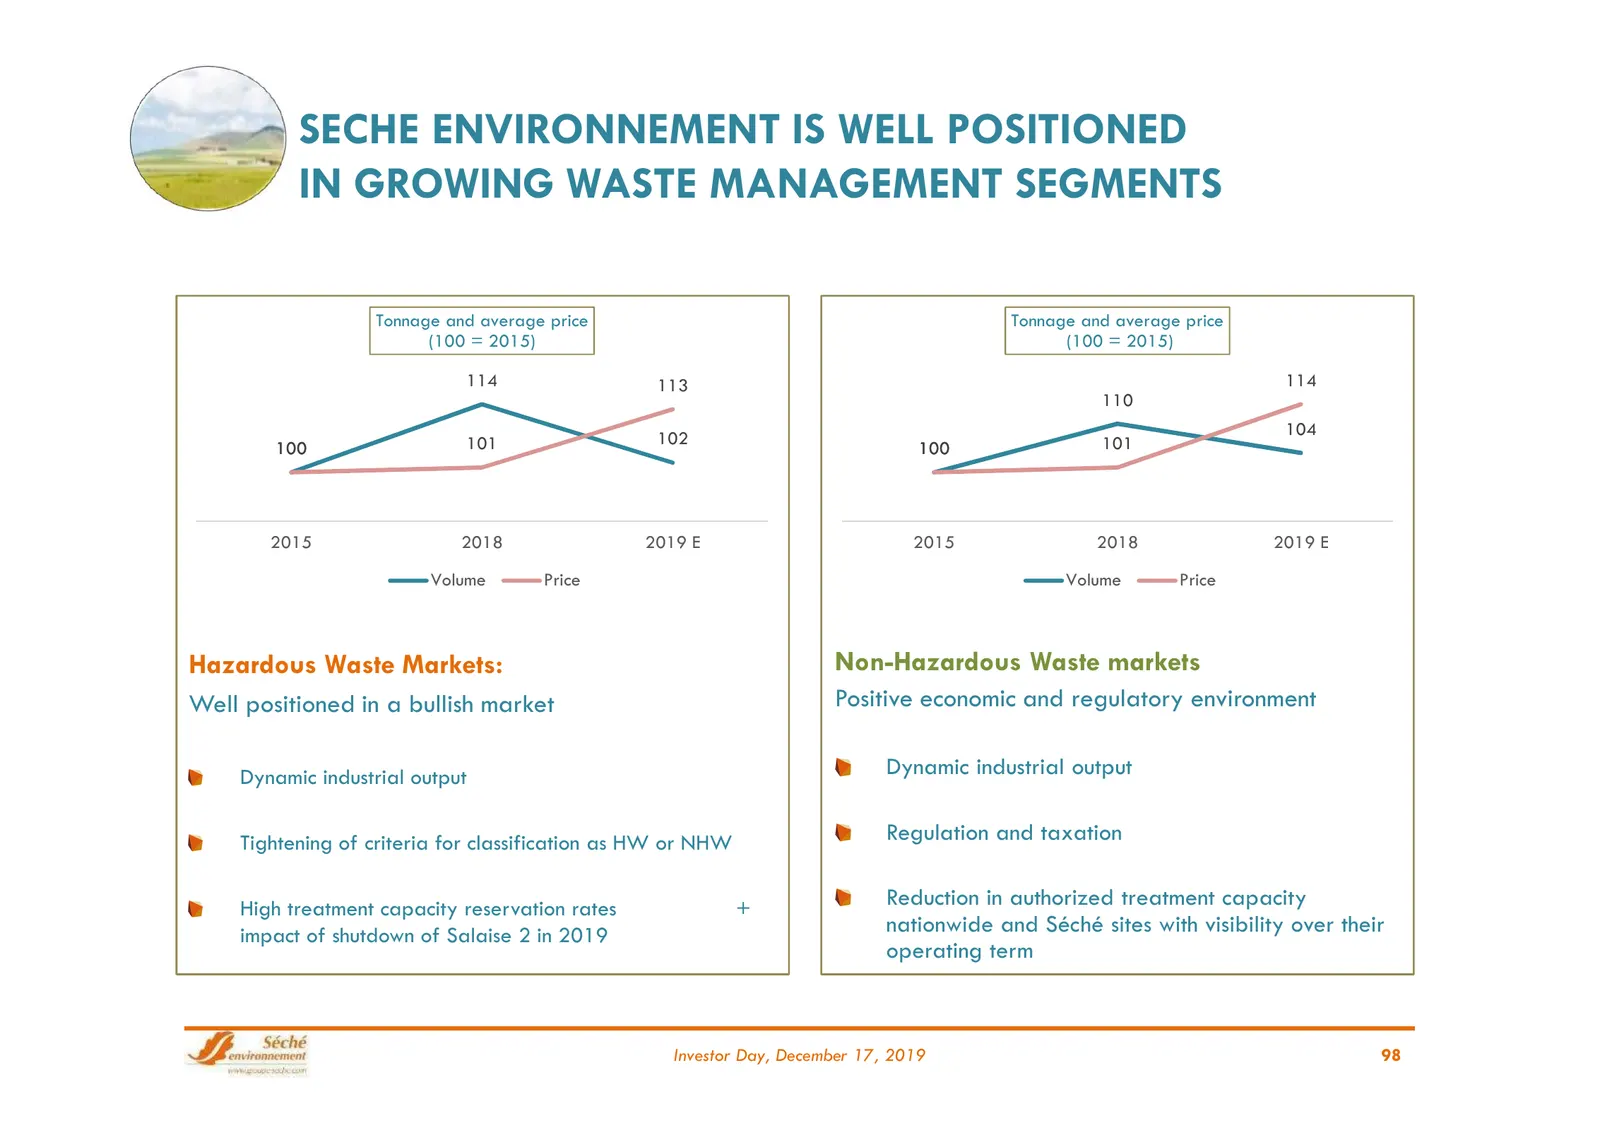
Slide 98: Well Positioned in Growing Waste Management Segments
SECHE ENVIRONNEMENT IS WELL POSITIONED IN GROWING WASTE MANAGEMENT SEGMENTS Tonnage and average price Tonnage and average price (100 = 2015) (100 = 2015) 114 113 114 110 104 101 102 101 100 100 2015 2018 2019 E 2015 2018 2019 E Volume Price Volume Price Hazardous Waste Markets: Non-Hazardous Waste m
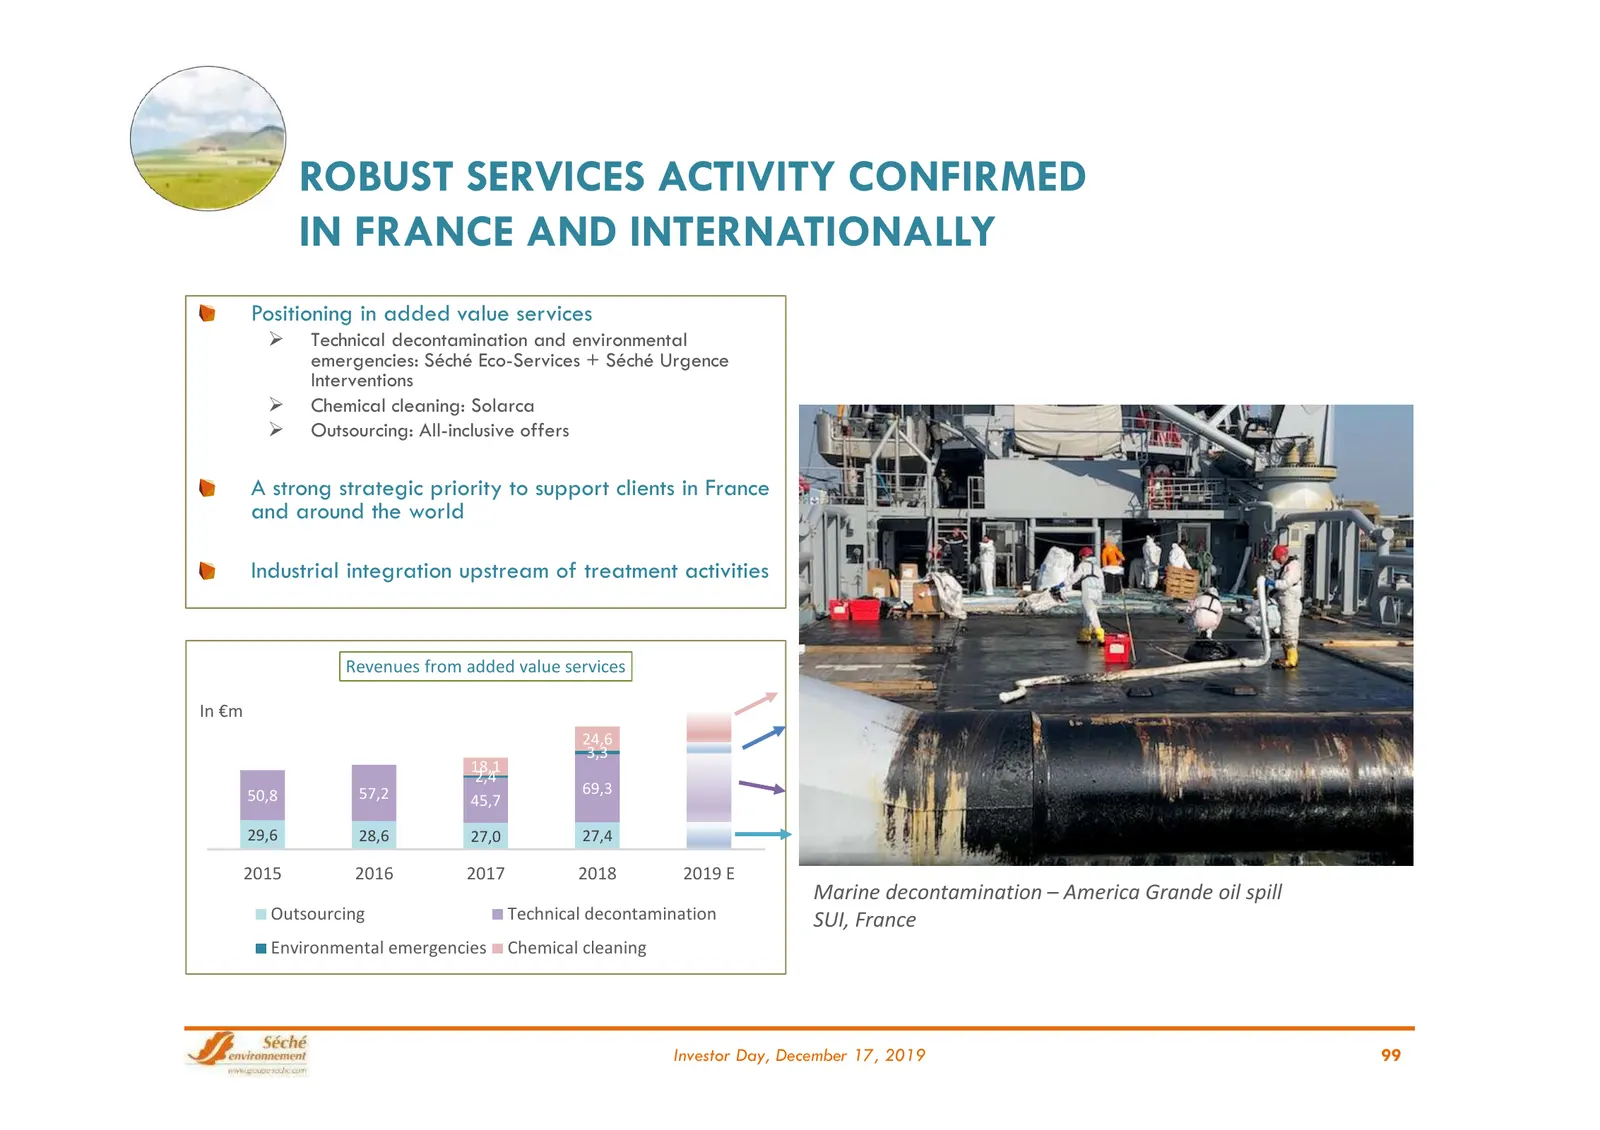
Slide 99: Robust Services Activity Confirmed in France and Internationally
ROBUST SERVICES ACTIVITY CONFIRMED IN FRANCE AND INTERNATIONALLY Positioning in added value services Technical decontamination and environmental emergencies: Séché Eco-Services + Séché Urgence Interventions Chemical cleaning: Solarca Outsourcing: All-inclusive offers A strong strategic priorit
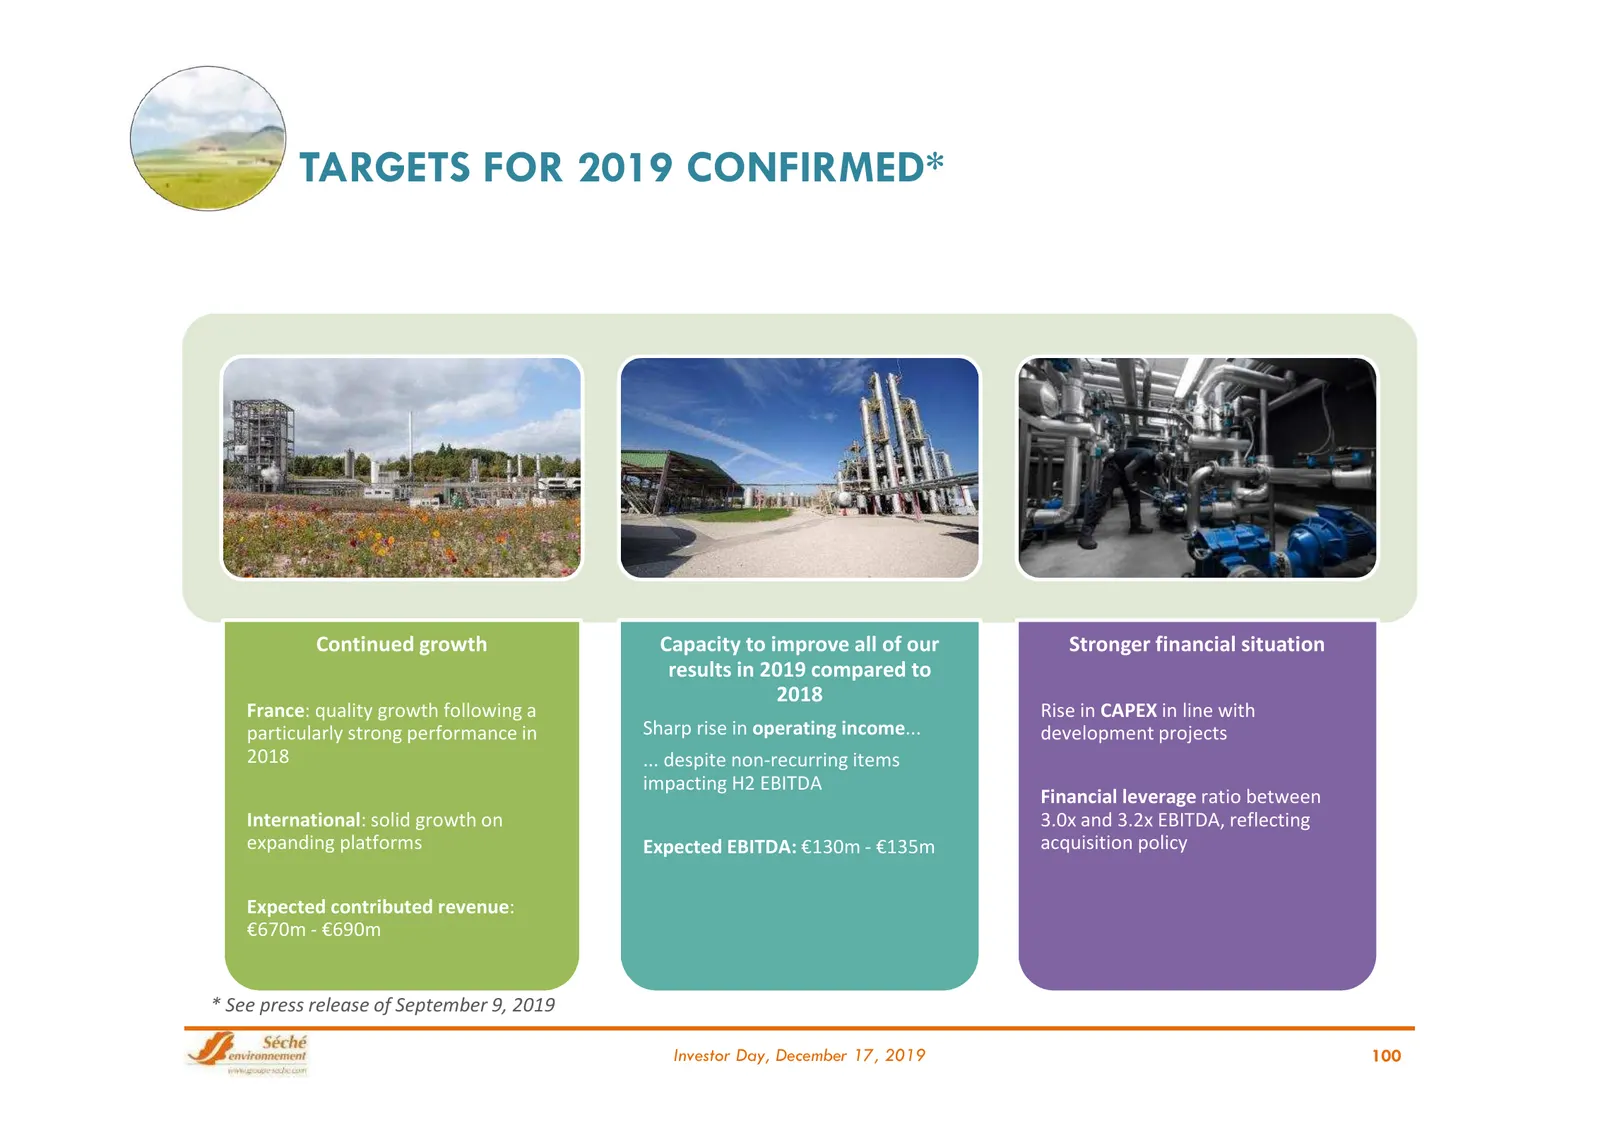
Slide 100: Targets for 2019 Confirmed
TARGETS FOR 2019 CONFIRMED* Continued growth Capacity to improve all of our Stronger financial situation results in 2019 compared to 2018 France: quality growth following a Rise in CAPEX in line with particularly strong performance in Sharp rise in operating income... development projects 2018 ... d
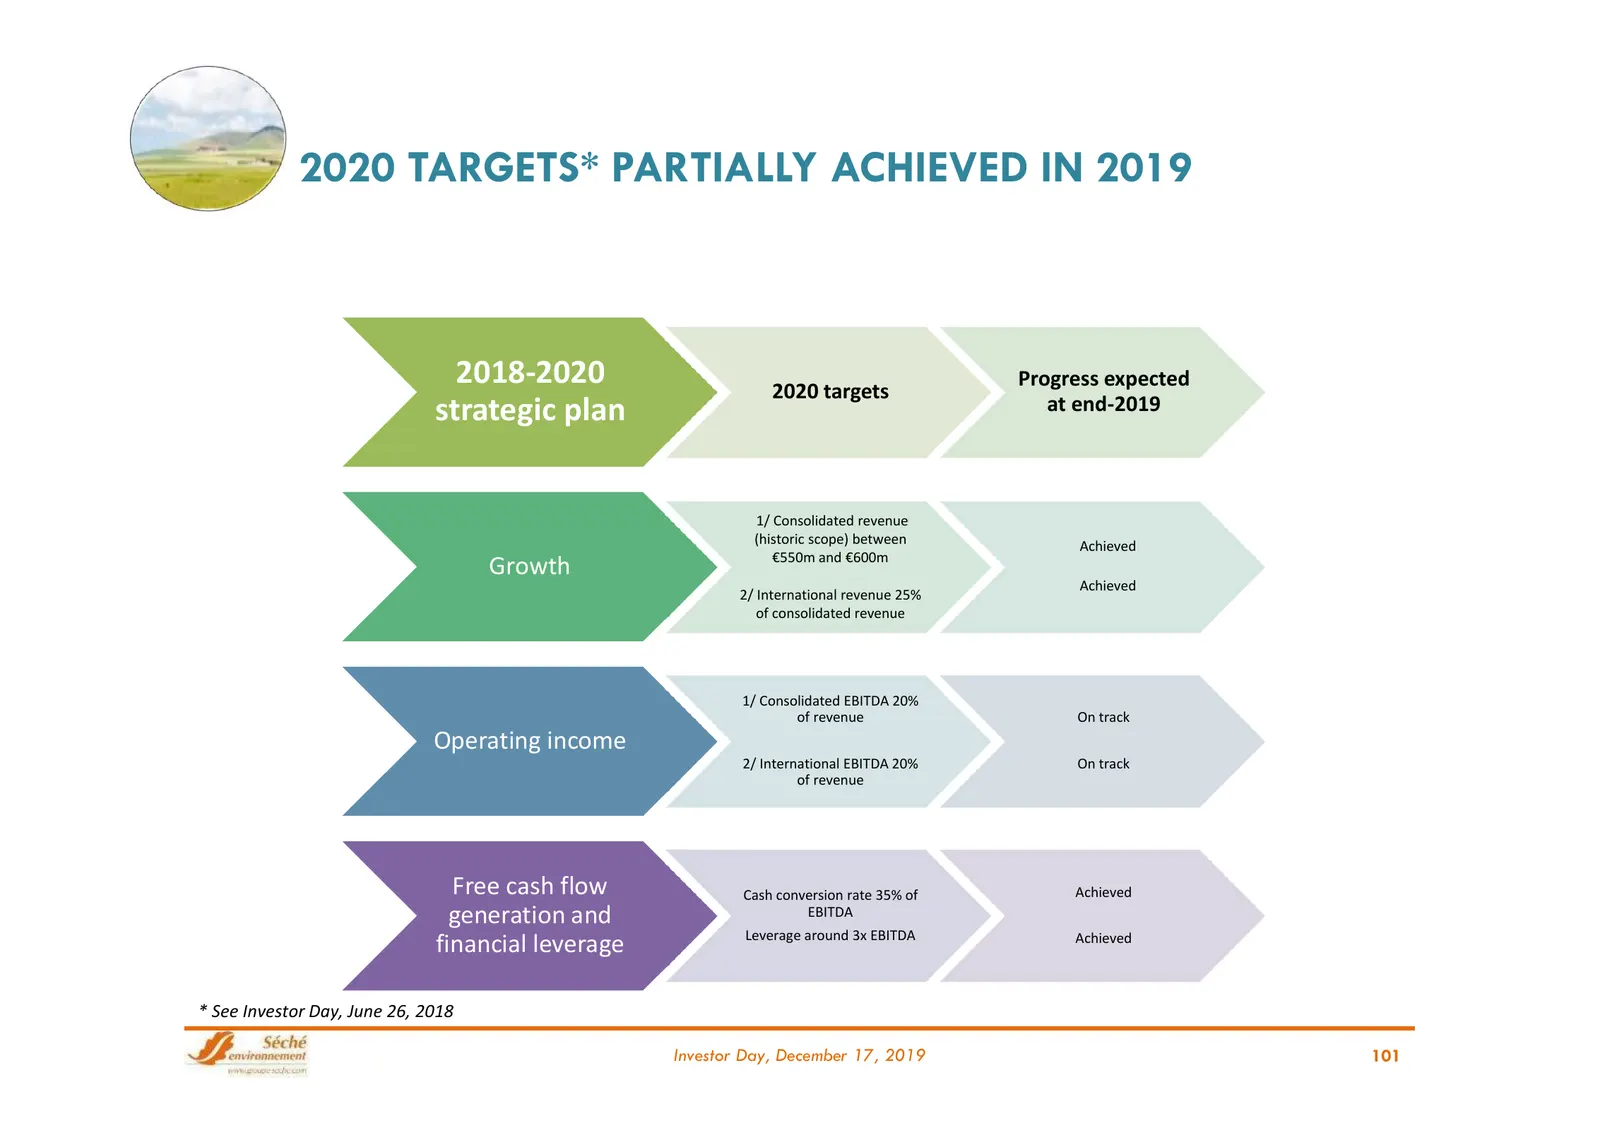
Slide 101: 2020 Targets Partially Achieved in 2019
2020 TARGETS* PARTIALLY ACHIEVED IN 2019 2018-2020 2020 targets Progress expected strategic plan at end-2019 1/ Consolidated revenue (historic scope) between Achieved €550m and €600m Growth Achieved 2/ International revenue 25% of consolidated revenue 1/ Consolidated EBITDA 20% of revenue On track O
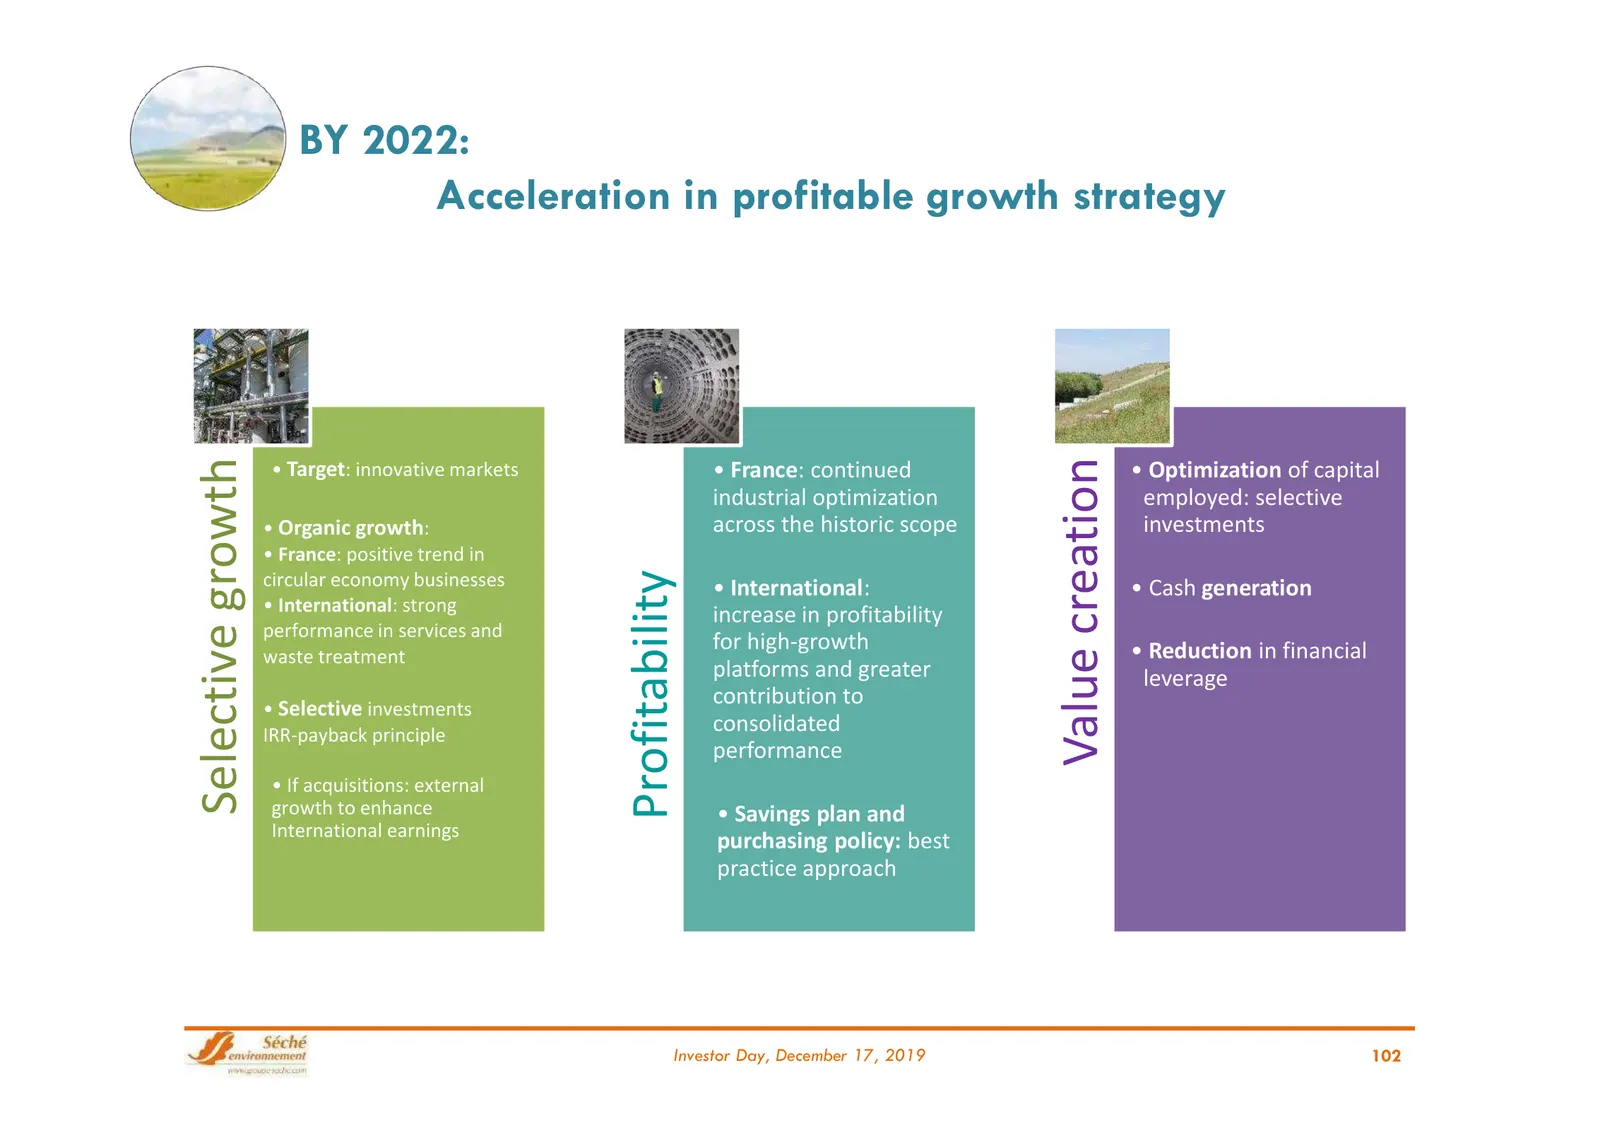
Slide 102: By 2022: Acceleration in profitable growth strategy
BY 2022: Acceleration in profitable growth strategy Selective growth Value creation • Target: innovative markets • France: continued • Optimization of capital industrial optimization employed: selective • Organic growth: across the historic scope investments • France: positive trend in Profitability
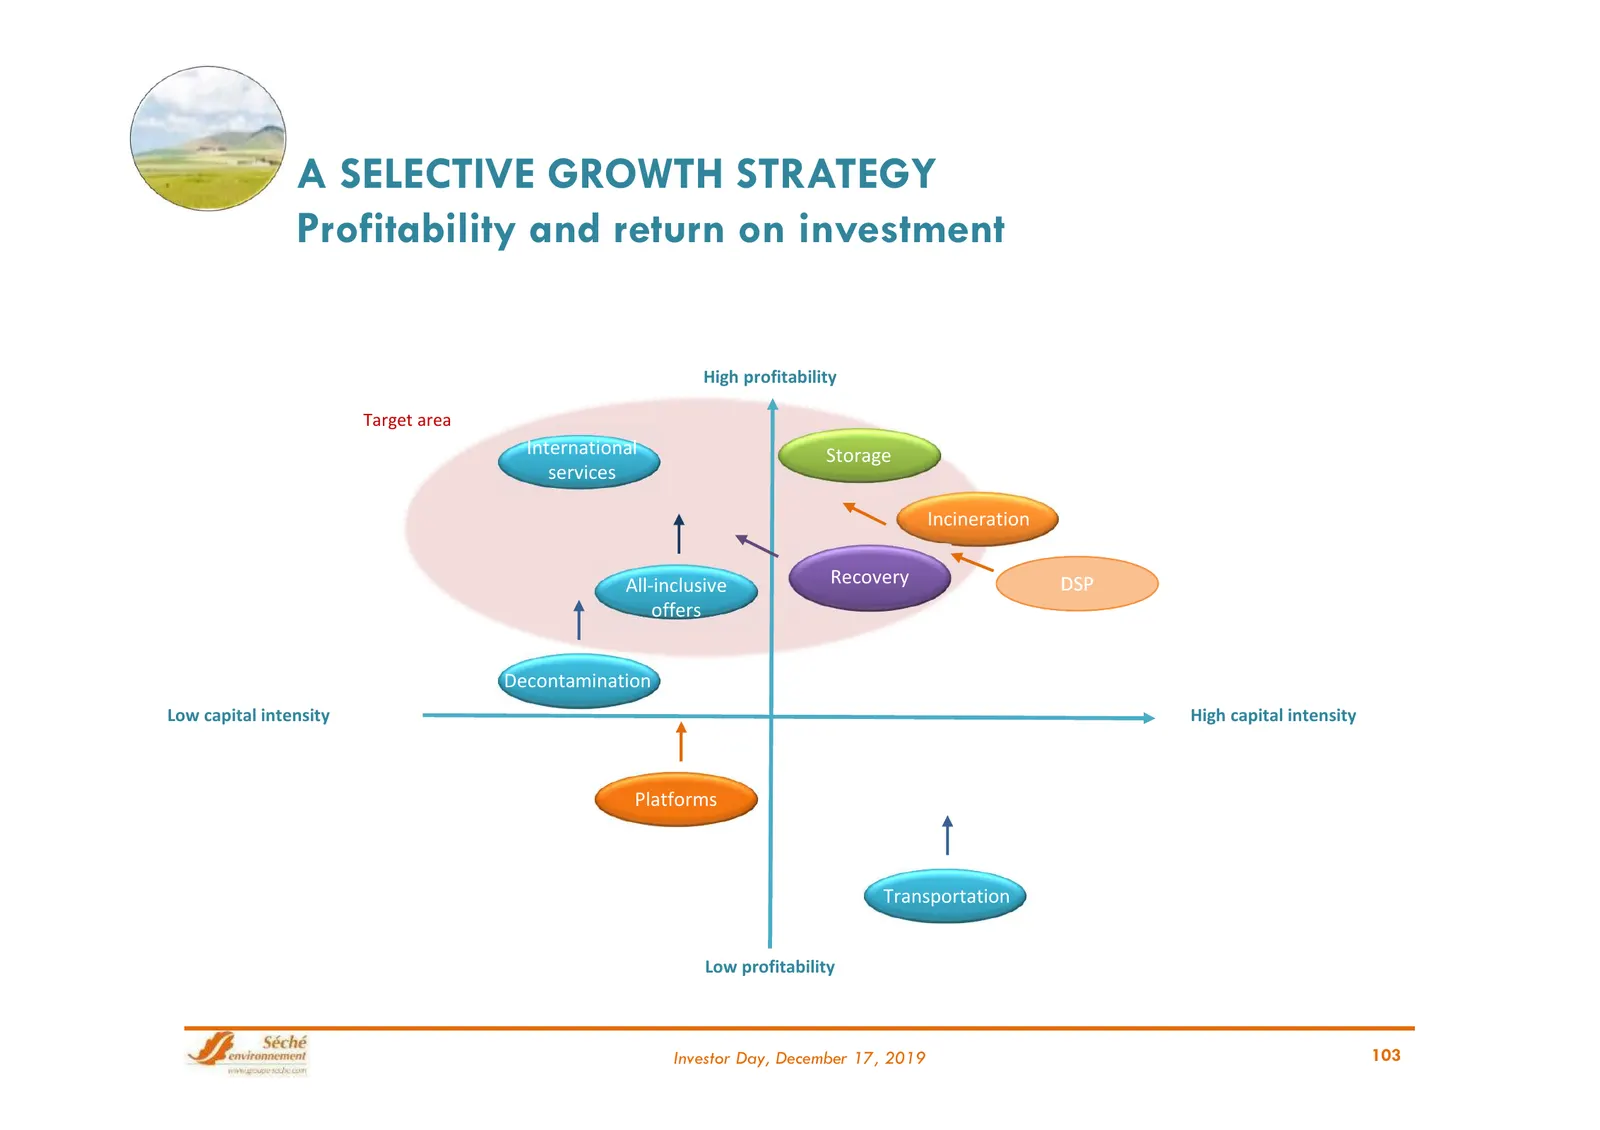
Slide 103: A Selective Growth Strategy
A SELECTIVE GROWTH STRATEGY Profitability and return on investment High profitability Target area International Storage services Incineration All-inclusive Recovery DSP offers Decontamination Low capital intensity High capital intensity Platforms Transportation Low profitability Investor Day, Decemb
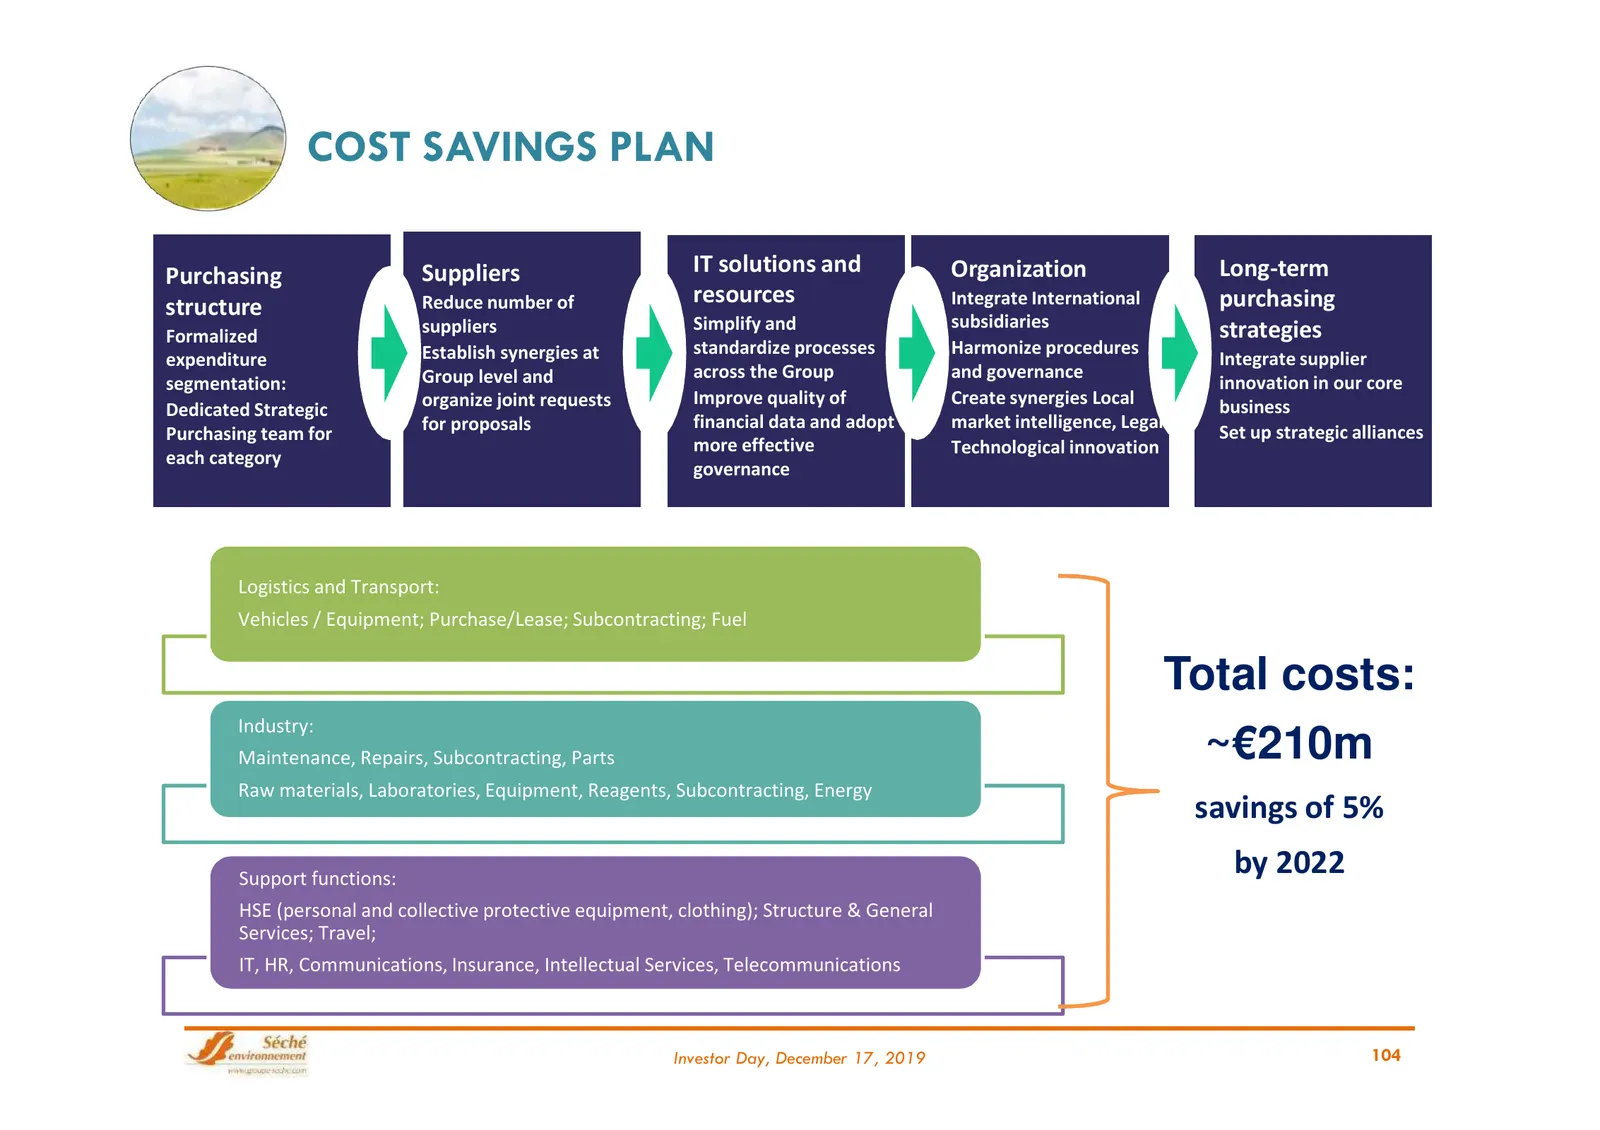
Slide 104: Cost Savings Plan
COST SAVINGS PLAN Purchasing Suppliers IT solutions and Organization Long-term structure Reduce number of resources Integrate International purchasing suppliers Simplify and subsidiaries strategies Formalized Establish synergies at standardize processes Harmonize procedures expenditure Integrate sup
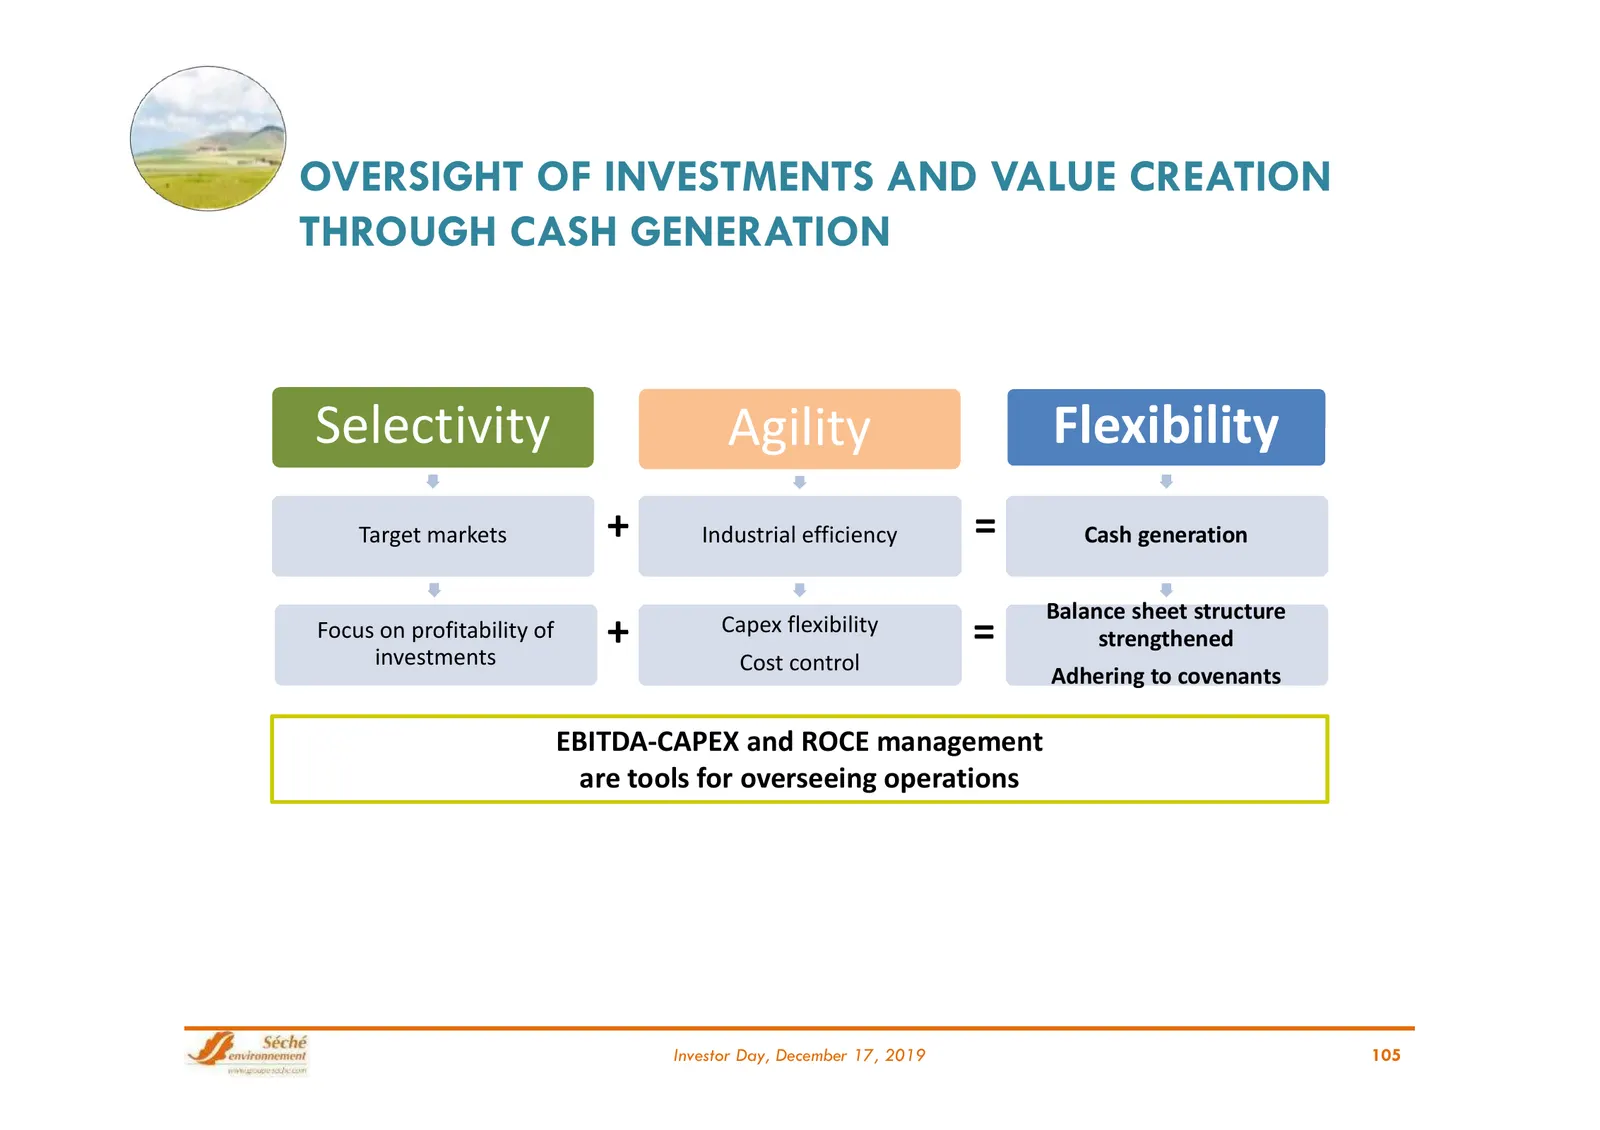
Slide 105: Oversight of Investments and Value Creation Through Cash Generation
OVERSIGHT OF INVESTMENTS AND VALUE CREATION THROUGH CASH GENERATION Selectivity Agility Flexibility Target markets + Industrial efficiency = Cash generation Balance sheet structure Focus on profitability of investments + Capex flexibility = strengthened Cost control Adhering to covenants EBITDA-CAPE
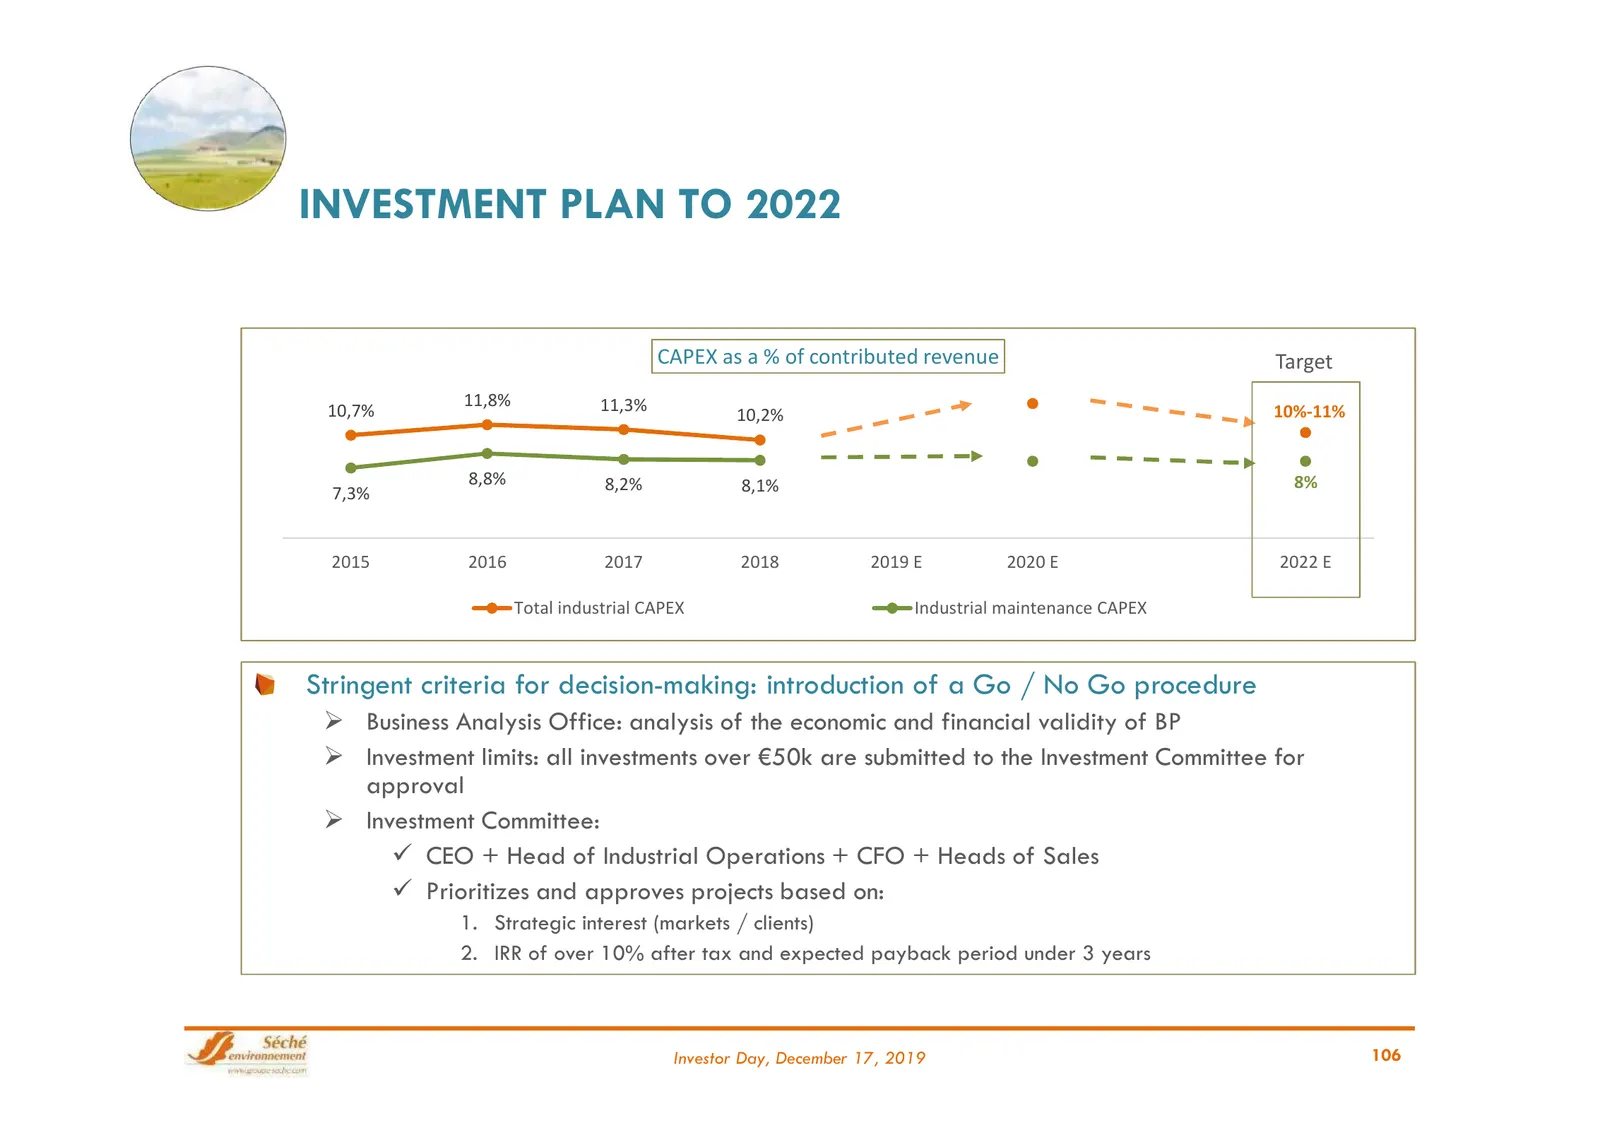
Slide 106: Investment Plan to 2022
INVESTMENT PLAN TO 2022 CAPEX as a % of contributed revenue Target 11,8% 11,3% 10,7% 10,2% 10%-11% 8,8% 8,2% 8,1% 8% 7,3% 2015 2016 2017 2018 2019 E 2020 E 2022 E Total industrial CAPEX Industrial maintenance CAPEX Stringent criteria for decision-making: introduction of a Go / No Go procedure Busi
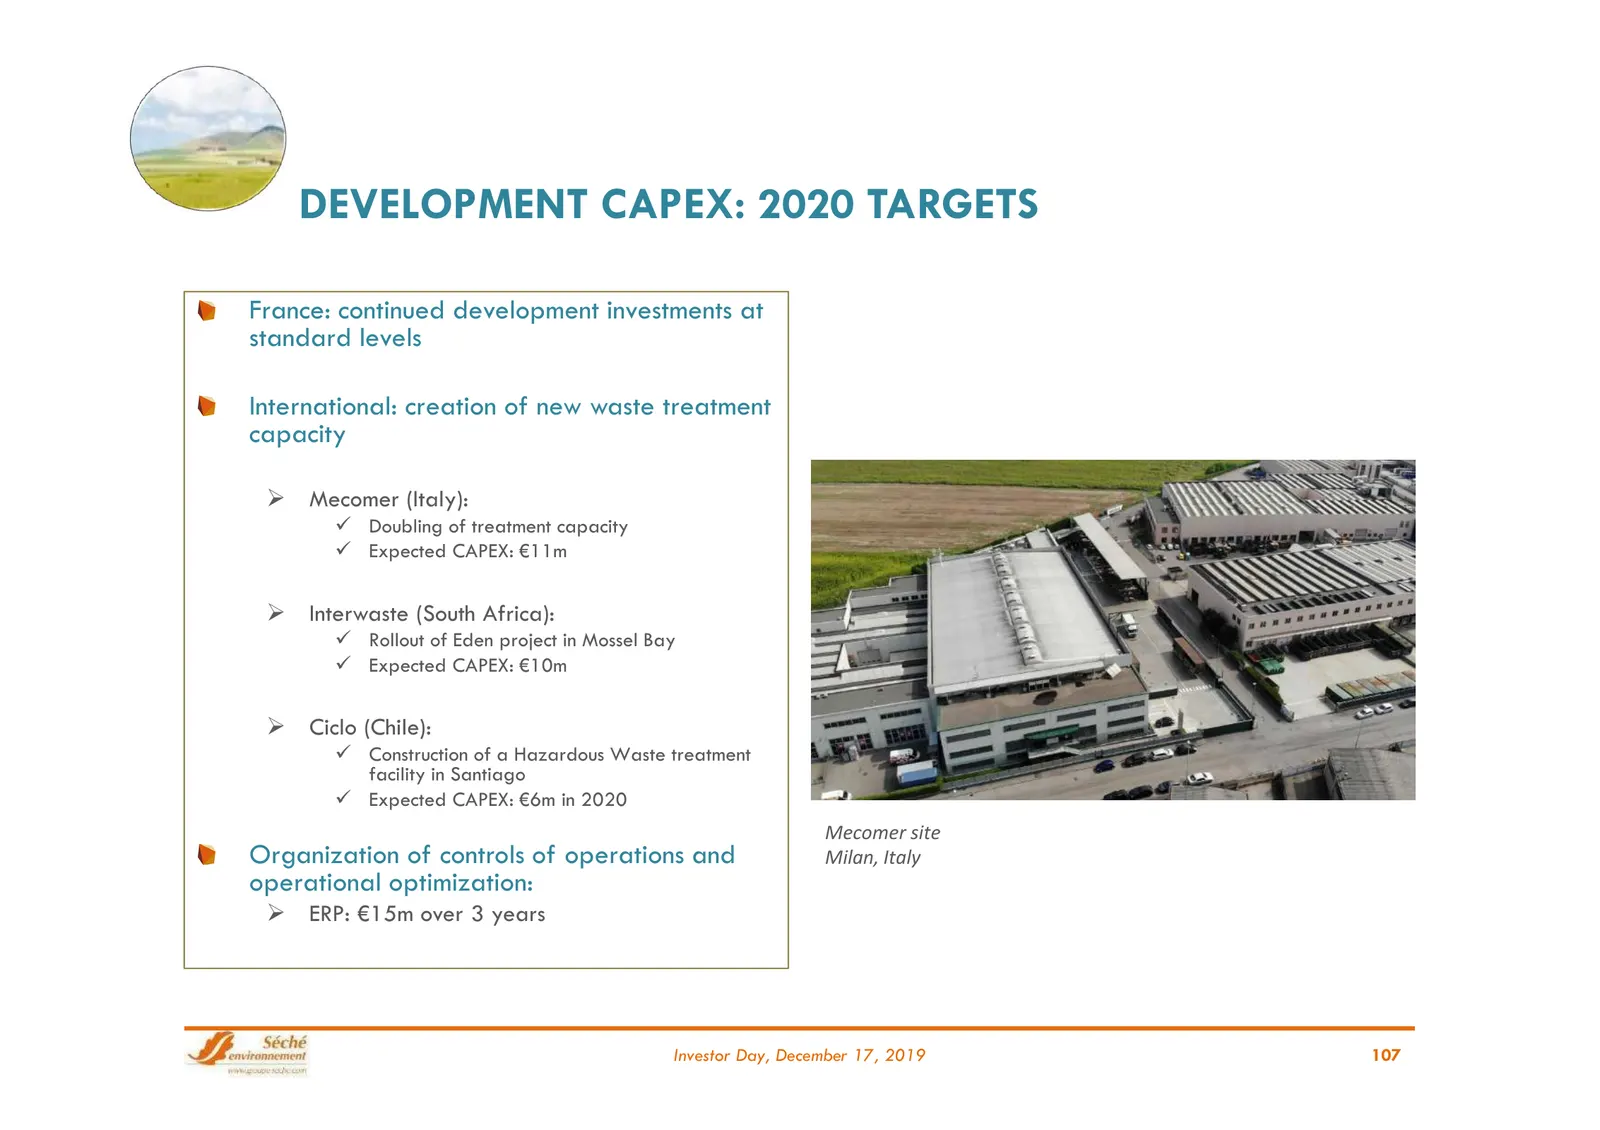
Slide 107: Development Capex: 2020 Targets
DEVELOPMENT CAPEX: 2020 TARGETS France: continued development investments at standard levels International: creation of new waste treatment capacity Mecomer (Italy): Doubling of treatment capacity Expected CAPEX: €11m Interwaste (South Africa): Rollout of Eden project in Mossel Bay Expec
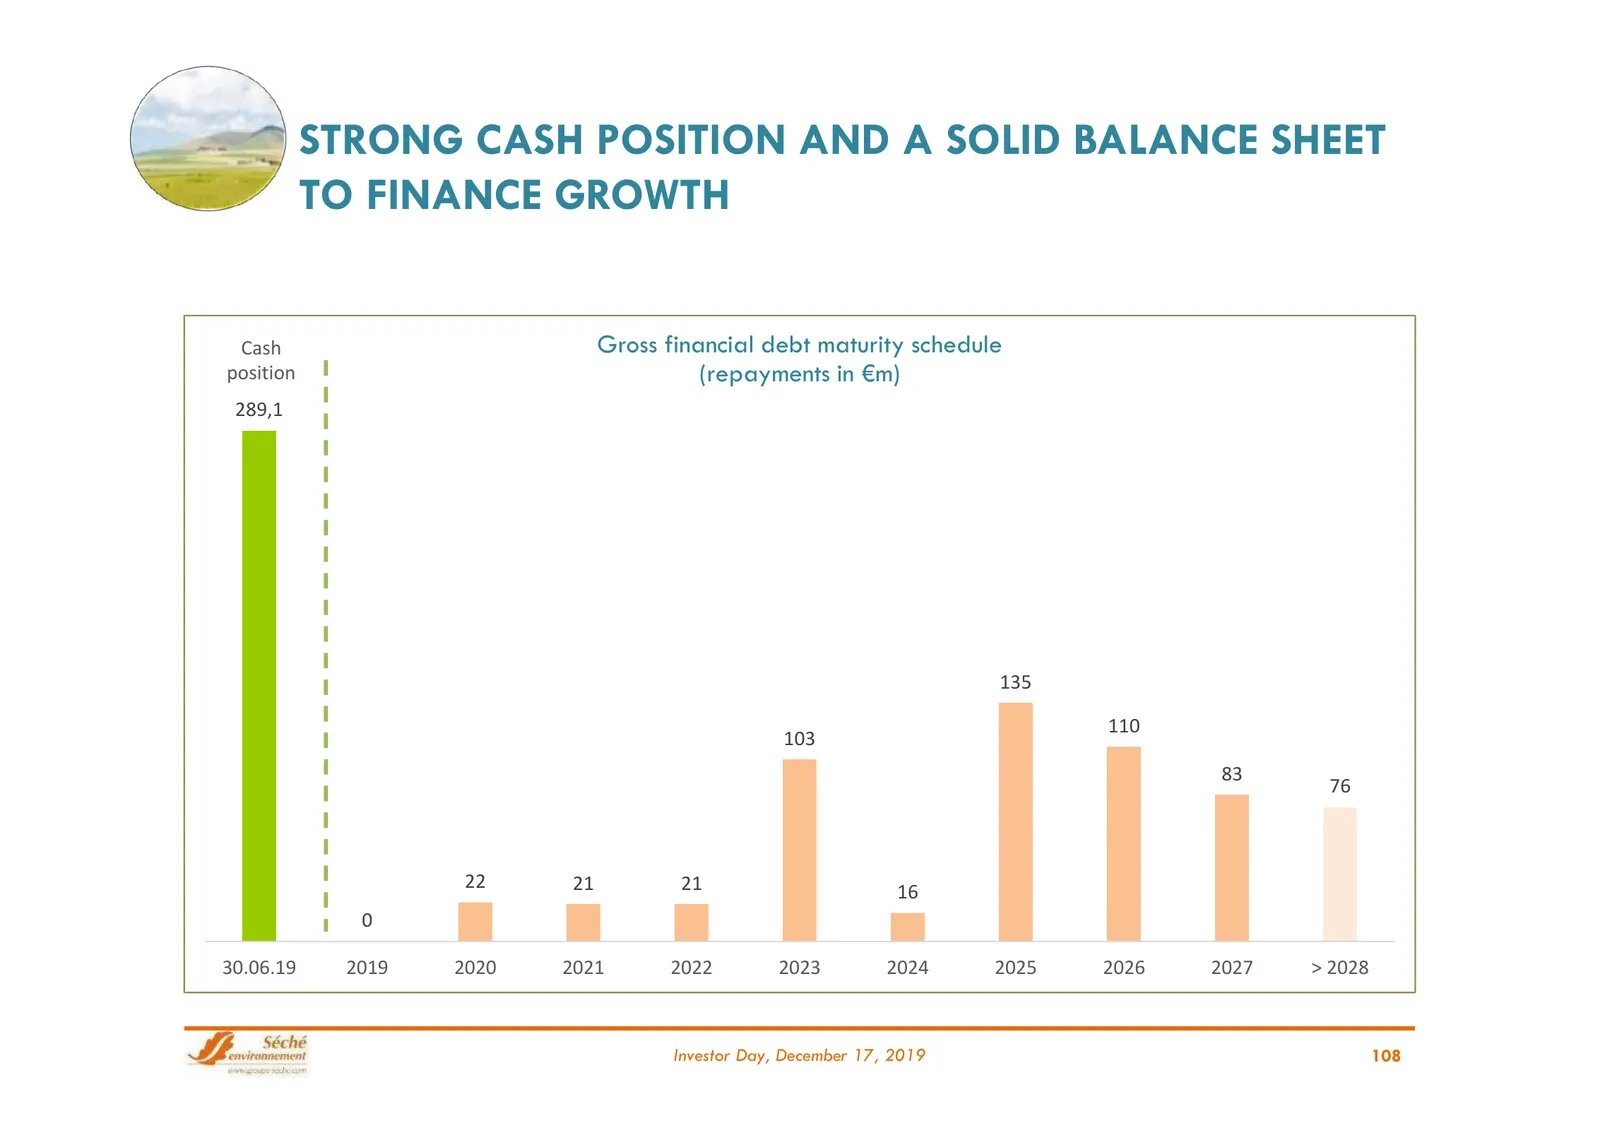
Slide 108: Strong Cash Position and a Solid Balance Sheet
STRONG CASH POSITION AND A SOLID BALANCE SHEET TO FINANCE GROWTH Cash Gross financial debt maturity schedule position (repayments in €m) 289,1 135 110 103 83 76 22 21 21 16 0 30.06.19 2019 2020 2021 2022 2023 2024 2025 2026 2027 > 2028 Investor Day, December 17, 2019 108
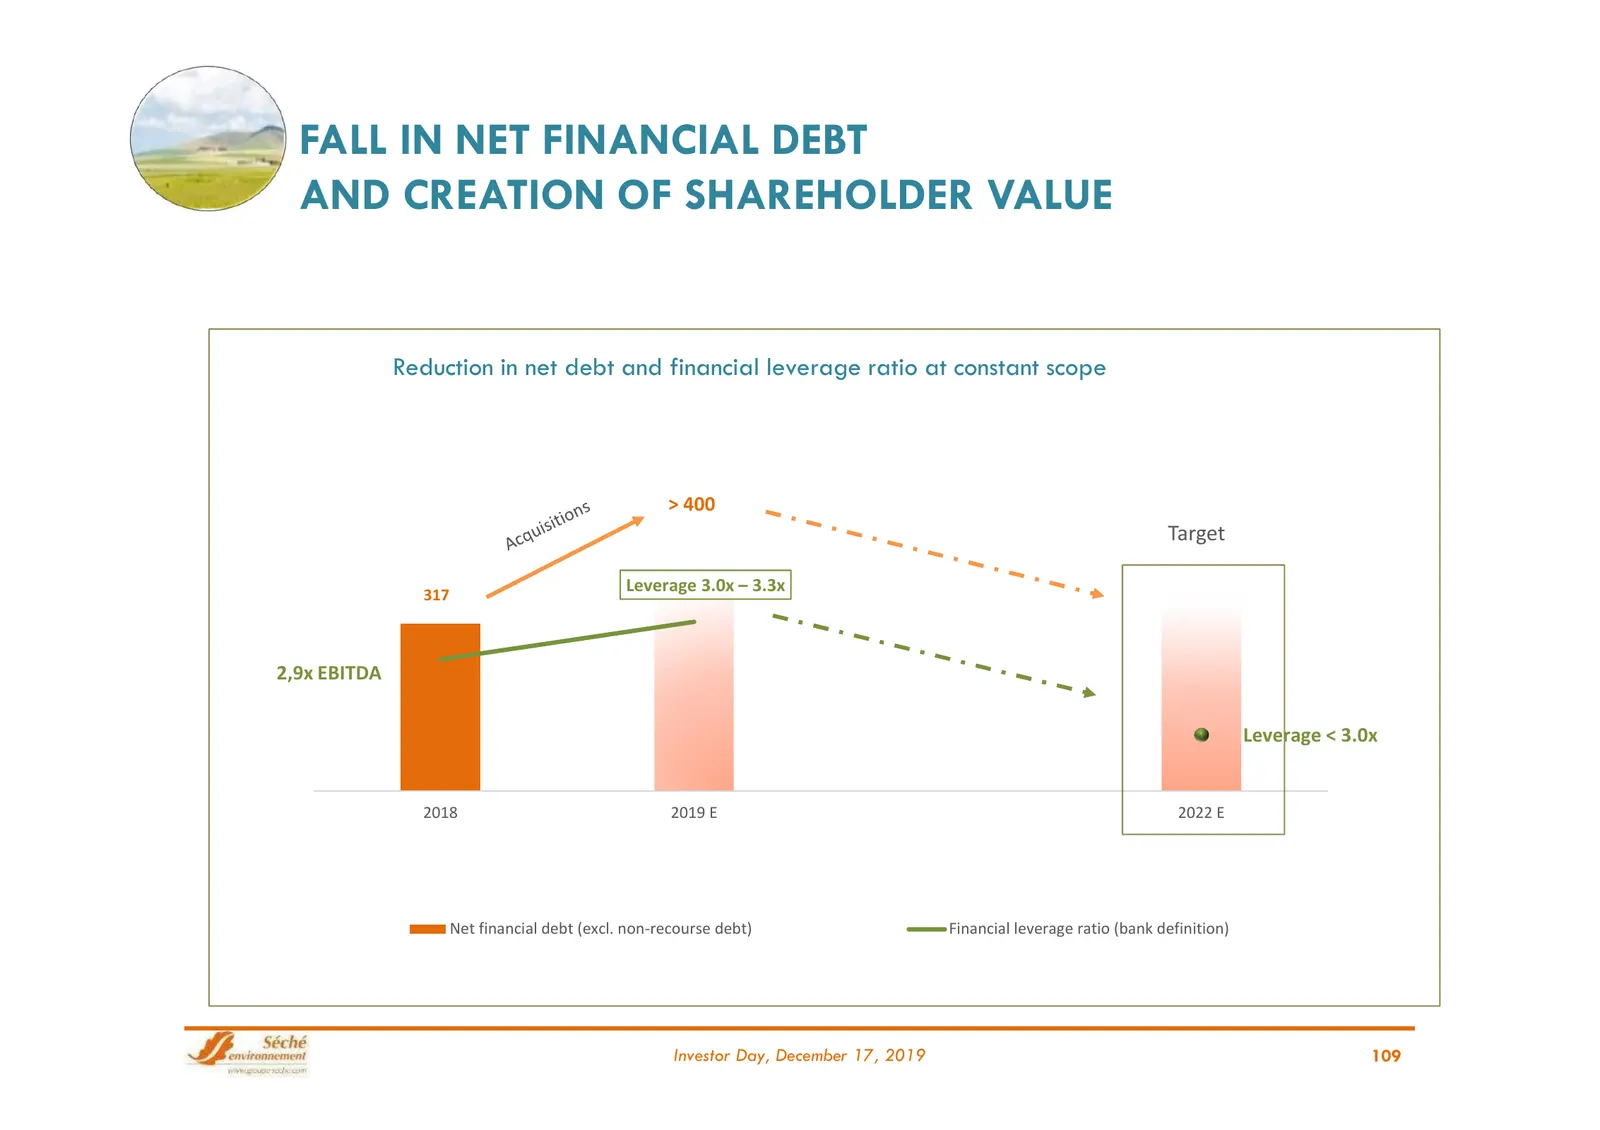
Slide 109: Fall in Net Financial Debt and Creation of Shareholder Value
FALL IN NET FINANCIAL DEBT AND CREATION OF SHAREHOLDER VALUE Reduction in net debt and financial leverage ratio at constant scope > 400 500 Target 450 400 Leverage 3.0x – 3.3x 317 3,2 350 300 250 2,9x EBITDA 200 2,7 150 100 Leverage < 3.0x 50 0 2,2 2018 2019 E 2022 E Net financial debt (excl. non-re
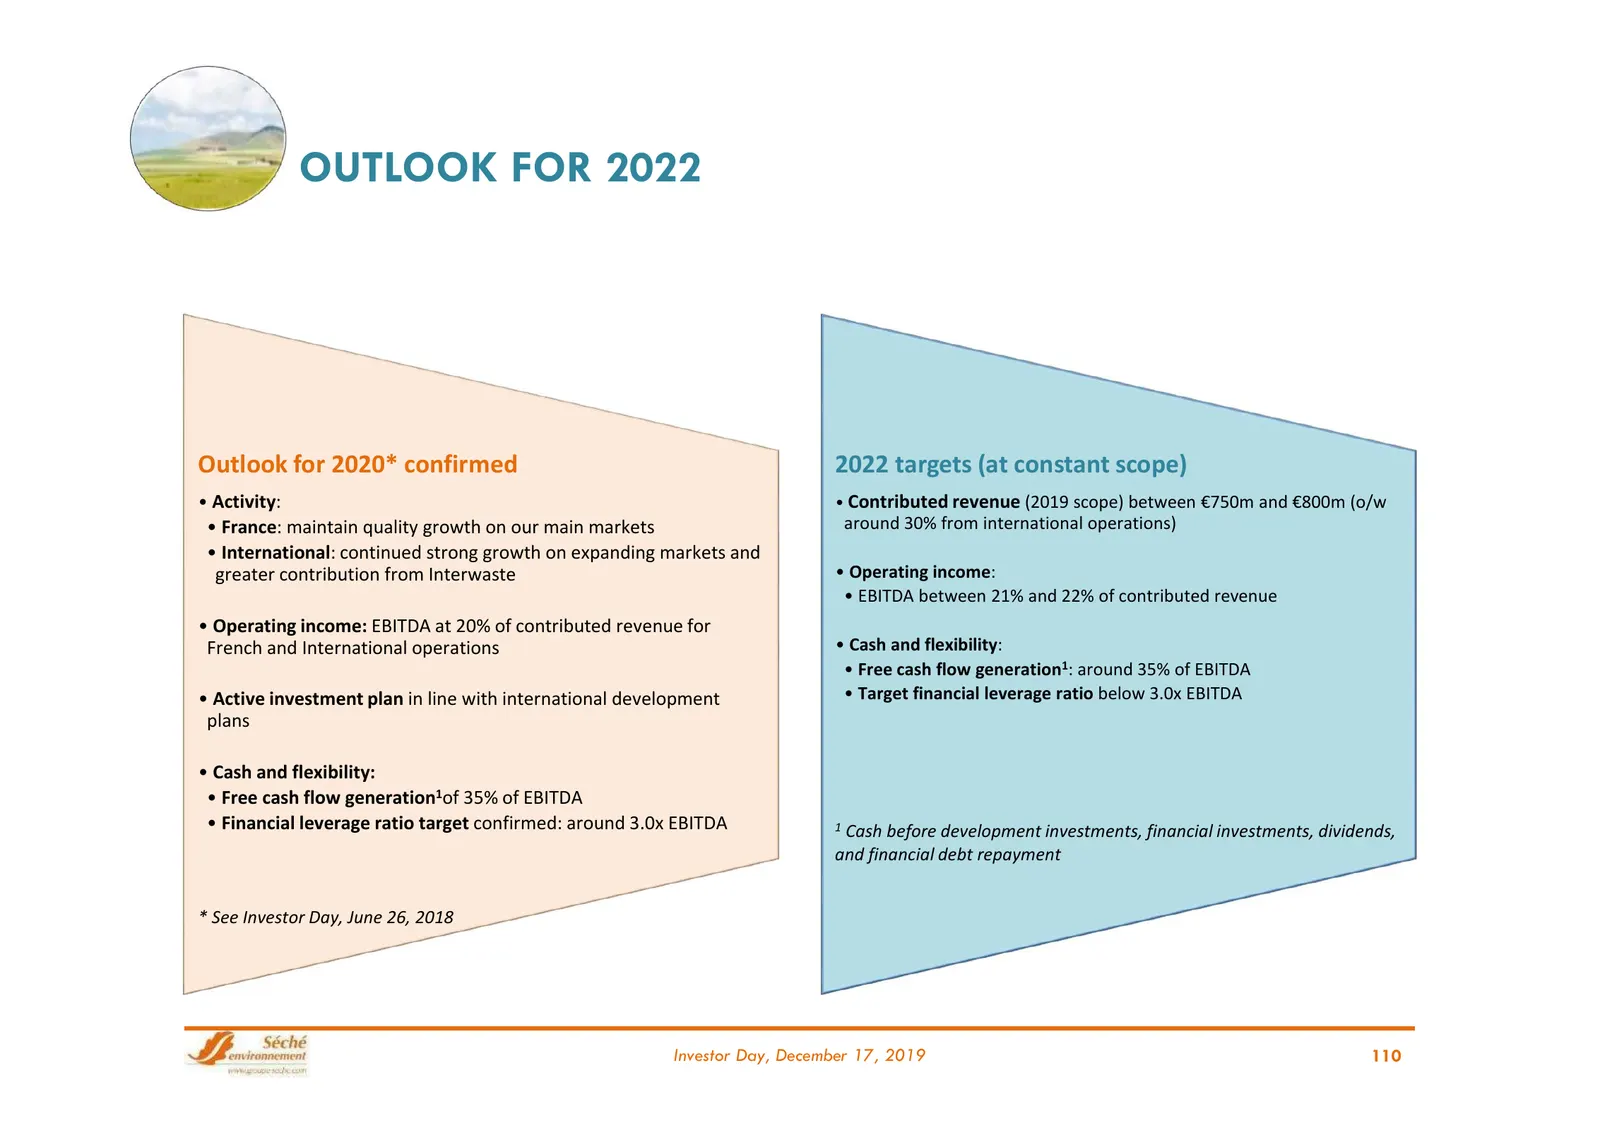
Slide 110: Outlook for 2022
OUTLOOK FOR 2022 Outlook for 2020* confirmed 2022 targets (at constant scope) • Activity: • Contributed revenue (2019 scope) between €750m and €800m (o/w • France: maintain quality growth on our main markets around 30% from international operations) • International: continued strong growth on expand
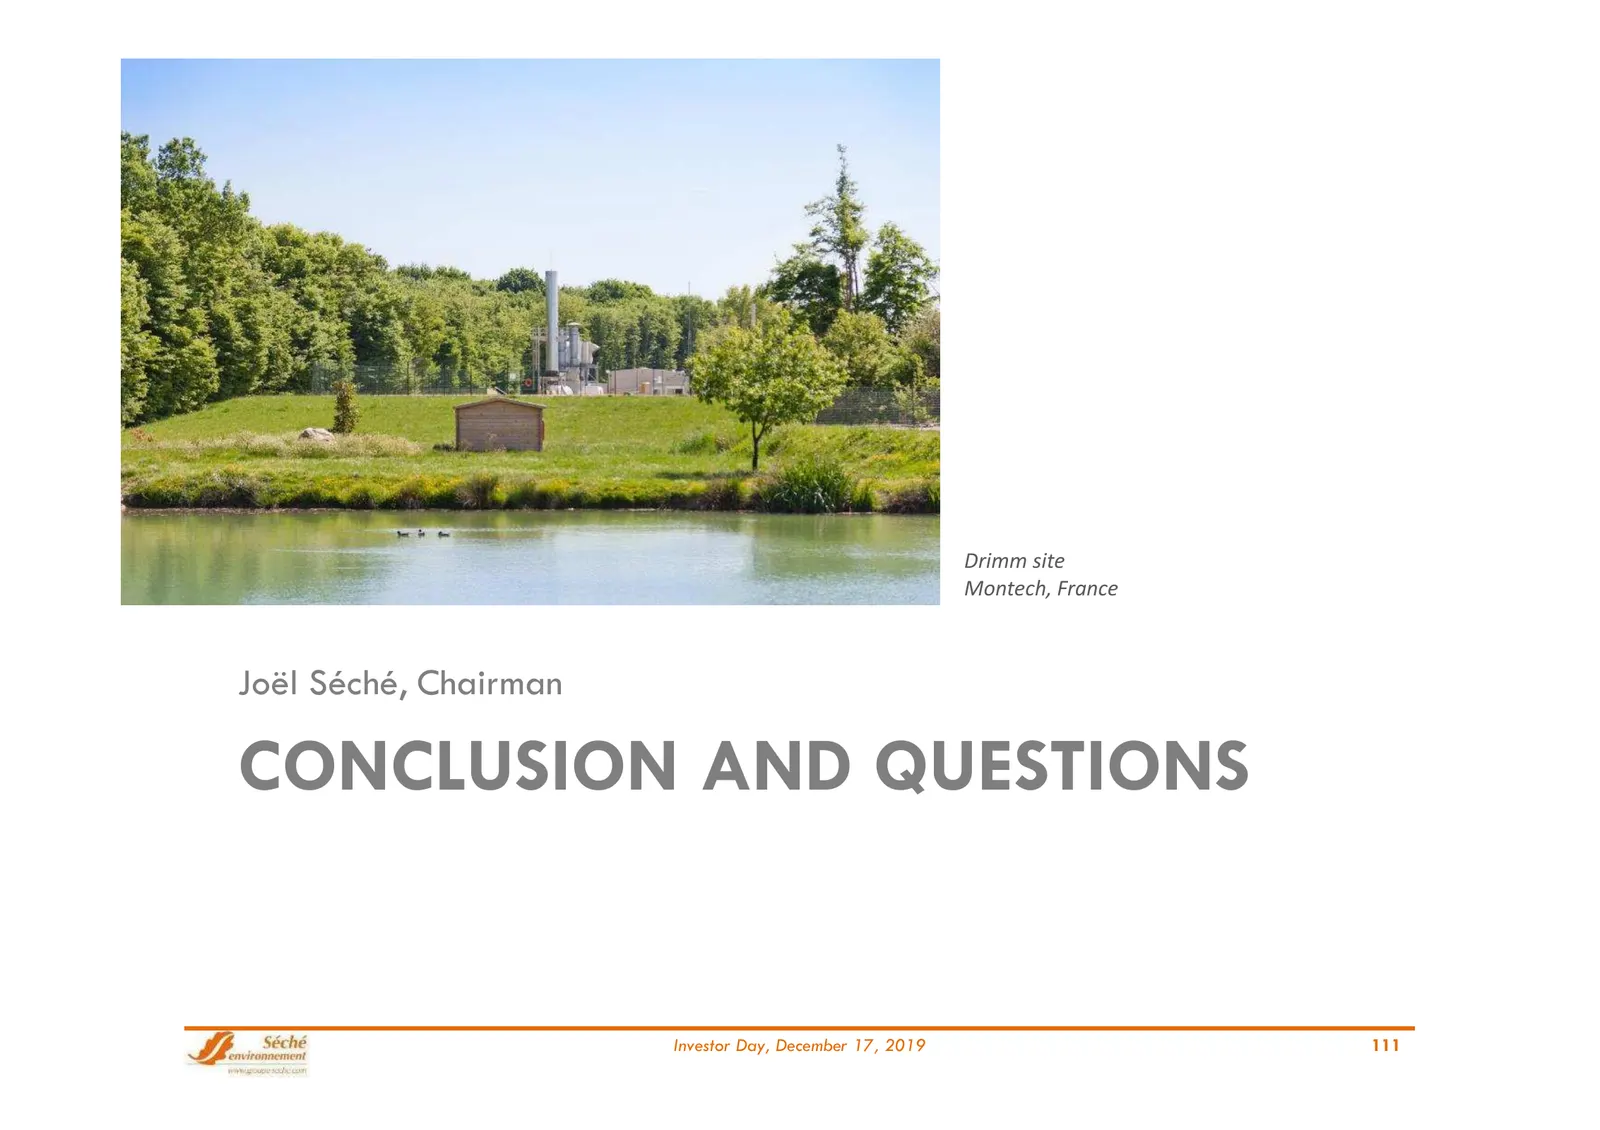
Slide 111: Conclusion and Questions
Drimm site Montech, France Joël Séché, Chairman CONCLUSION AND QUESTIONS Investor Day, December 17, 2019 111
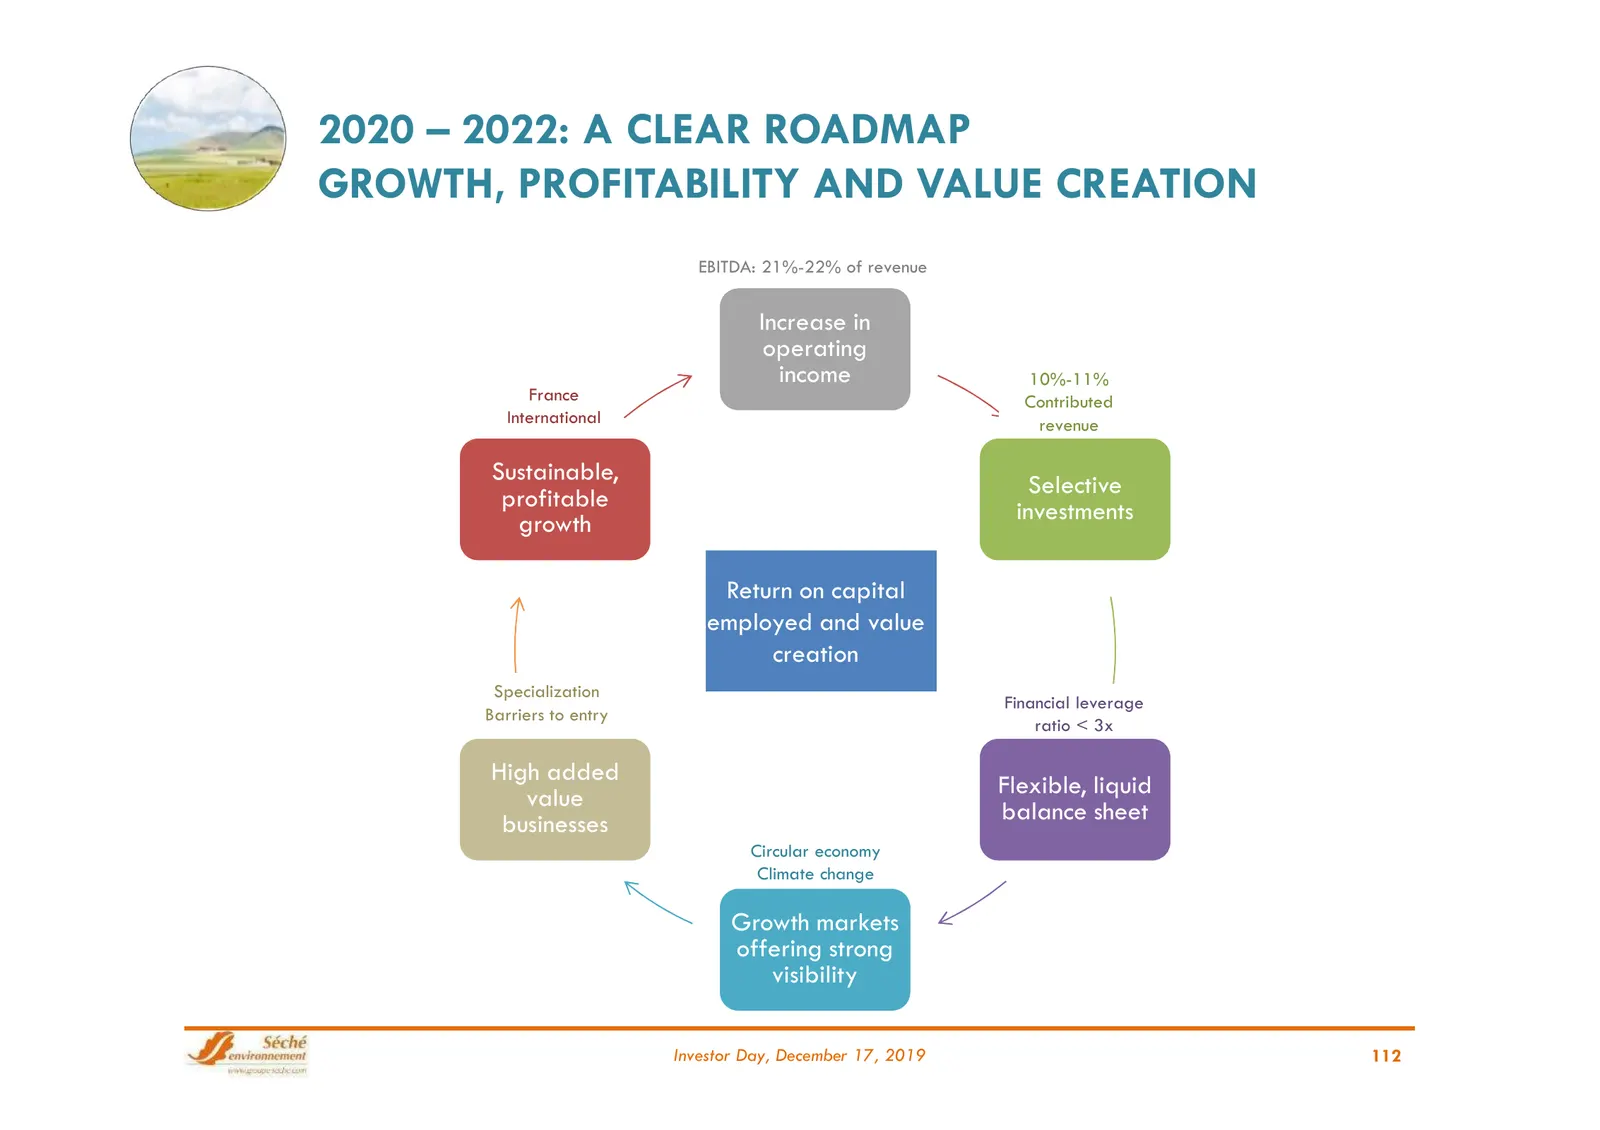
Slide 112: 2020 – 2022: A Clear Roadmap
2020 – 2022: A CLEAR ROADMAP GROWTH, PROFITABILITY AND VALUE CREATION EBITDA: 21%-22% of revenue Increase in operating income 10%-11% France Contributed International revenue Sustainable, Selective profitable investments growth Return on capital employed and value creation Specialization Financial l
Slide 113: Disclaimer
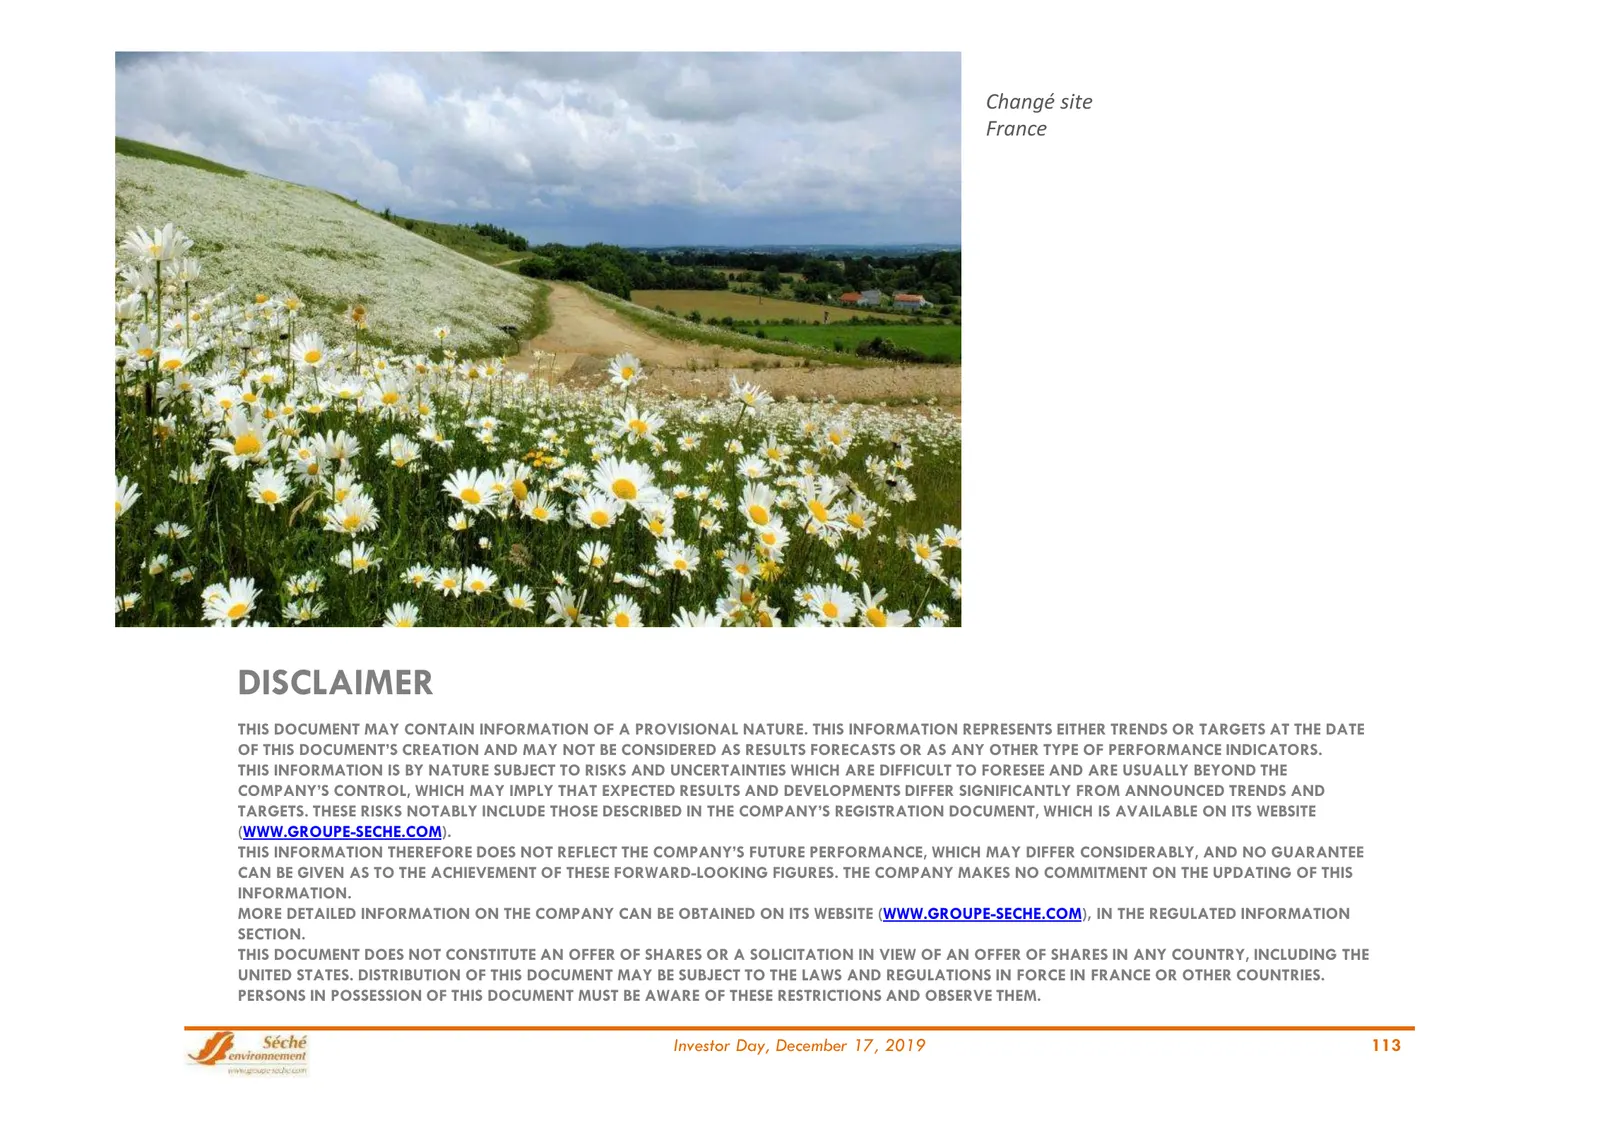
Changé site France DISCLAIMER THIS DOCUMENT MAY CONTAIN INFORMATION OF A PROVISIONAL NATURE. THIS INFORMATION REPRESENTS EITHER TRENDS OR TARGETS AT THE DATE OF THIS DOCUMENT’S CREATION AND MAY NOT BE CONSIDERED AS RESULTS FORECASTS OR AS ANY OTHER TYPE OF PERFORMANCE INDICATORS. THIS INFORMATION IS
Source: Internet Archive copy of groupe-seche.com
More decks from Seche Environnement SA
 Groupe Séché Environnement — Q3 2026 Earnings Presentation13 slides · Oct 27, 2026
 H1 2026 Earnings Presentation34 slides · Sep 9, 2026
 H1 2026 Earnings Presentation34 slides · Sep 9, 2026
 Q1 2026 Earnings Presentation10 slides · Apr 23, 2026
 FY2025 Earnings Presentation43 slides · Mar 10, 2026
 Q3 2025 Earnings Presentation13 slides · Oct 28, 2025