Pioneer Natural Resources — Howard Weil Energy Conference 2007
34 slides from Pioneer Natural Resources's conference presentation, Apr 3, 2007
Slide 1: Howard Weil Energy Conference April 3-4, 2007
Howard Weil Energy Conference April 3-4, 2007

Slide 2: Forward-Looking Statements
Forward-Looking Statements Except for historical information contained herein, the statements, charts and graphs in this presentation are forward-looking statements that are made pursuant to the Safe Harbor Provisions of the Private Securities Litigation Reform Act of 1995. Forward- looking statemen
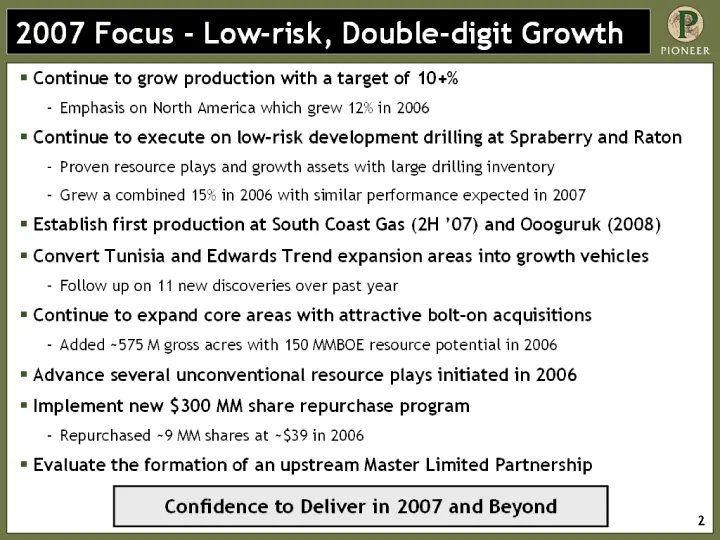
Slide 3: 2007 Focus - Low-risk, Double-digit Growth
2007 Focus - Low-risk, Double-digit Growth Continue to grow production with a target of 10+% Emphasis on North America which grew 12% in 2006 Continue to execute on low-risk development drilling at Spraberry and Raton Proven resource plays and growth assets with large drilling inventory Grew a combi
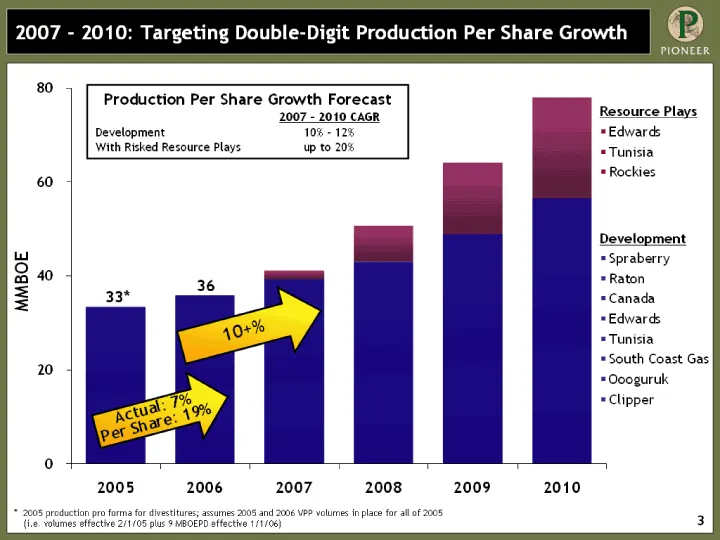
Slide 4: 2007 - 2010: Targeting Double-Digit Production Per Share Growth
2007 - 2010: Targeting Double-Digit Production Per Share Growth 2005 2006 2007 2008 2009 2010 Historical Production Production Outlook 33.4 35.9 39.4 43 48.9 56.57 1.8 7.7 15.3 21.5 Development Spraberry Raton Canada Edwards Tunisia South Coast Gas Oooguruk Clipper Resource Plays Edwards Tunisia Roc
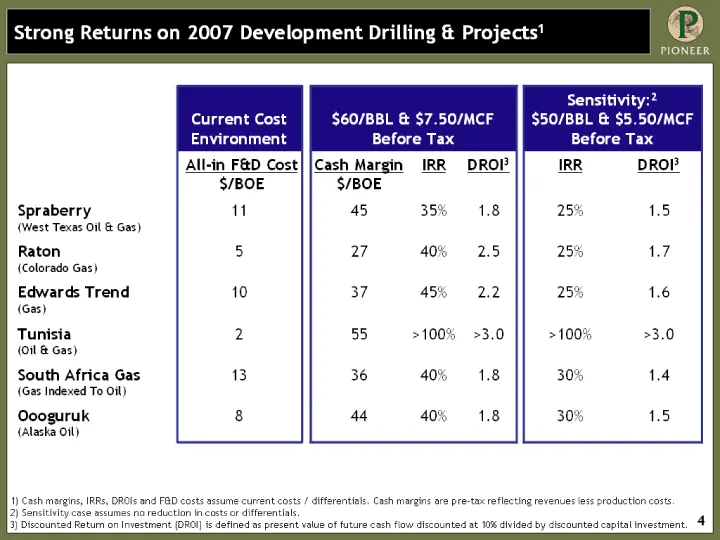
Slide 5: Strong Returns on 2007 Development Drilling & Projects
Strong Returns on 2007 Development Drilling & Projects1 Current Cost Environment $60/BBL & $7.50/MCF Before Tax $60/BBL & $7.50/MCF Before Tax $60/BBL & $7.50/MCF Before Tax Sensitivity:2 $50/BBL & $5.50/MCF Before Tax Sensitivity:2 $50/BBL & $5.50/MCF Before Tax All-in F&D Cost $/BOE Cash Margin $/
Slide 6: Spraberry Resource Play - Cornerstone of Growth
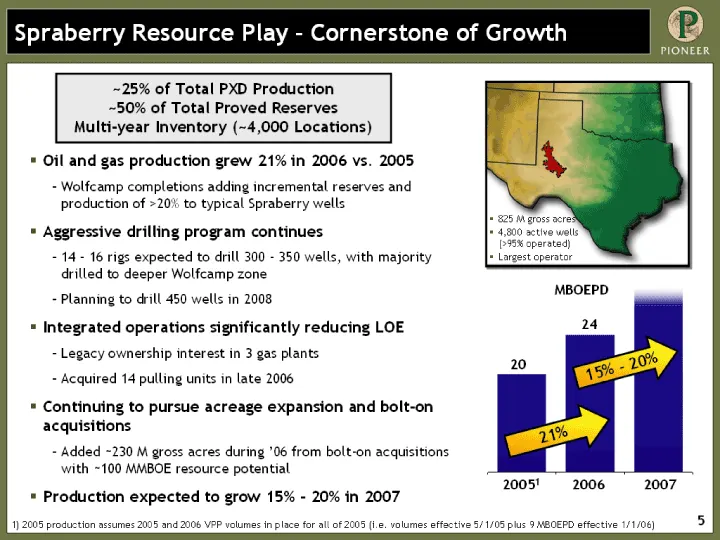
FY '05 FY '06 FY '07 20 24 27 2 Spraberry Resource Play - Cornerstone of Growth 20 1) 2005 production assumes 2005 and 2006 VPP volumes in place for all of 2005 (i.e. volumes effective 5/1/05 plus 9 MBOEPD effective 1/1/06) 24 MBOEPD 15% - 20% 20051 2006 2007 21% Oil and gas production grew 21% in 2
Slide 7: Continued to Acquire Quality Spraberry Acreage in 2005 / 2006
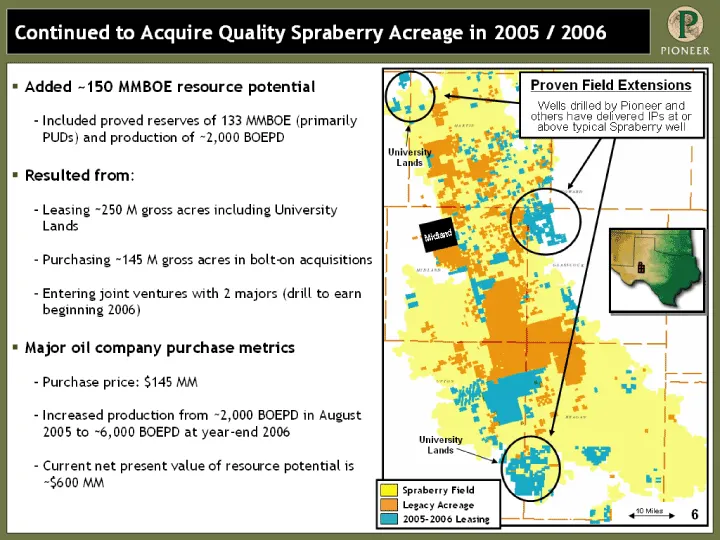
Added ~150 MMBOE resource potential Included proved reserves of 133 MMBOE (primarily PUDs) and production of ~2,000 BOEPD Resulted from: Leasing ~250 M gross acres including University Lands Purchasing ~145 M gross acres in bolt-on acquisitions Entering joint ventures with 2 majors (drill to earn be
Slide 8: Spraberry F&D is Best Measured on an "All-in" Basis
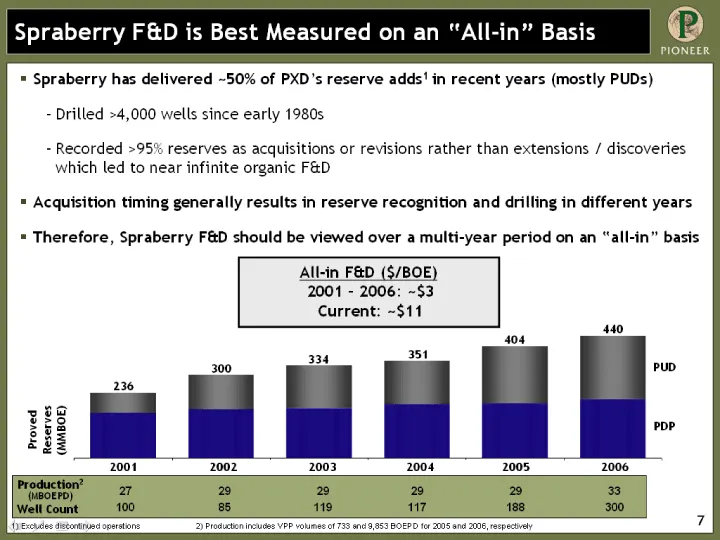
PDP PUD Total 2001 164 72 236 27.16667 27.1667 2002 177 123 300 29.333 29.332 2003 180 154 334 29 29 2004 194 157 351 29.166 29.166 2005 199 205 404 29.39667 28.6667 2006 212 228 440 33.343 23.581 Spraberry F&D is Best Measured on an "All-in" Basis Proved Reserves (MMBOE) 236 300 334 351 404 440 PDP
Slide 9: Raton Expansion Continues
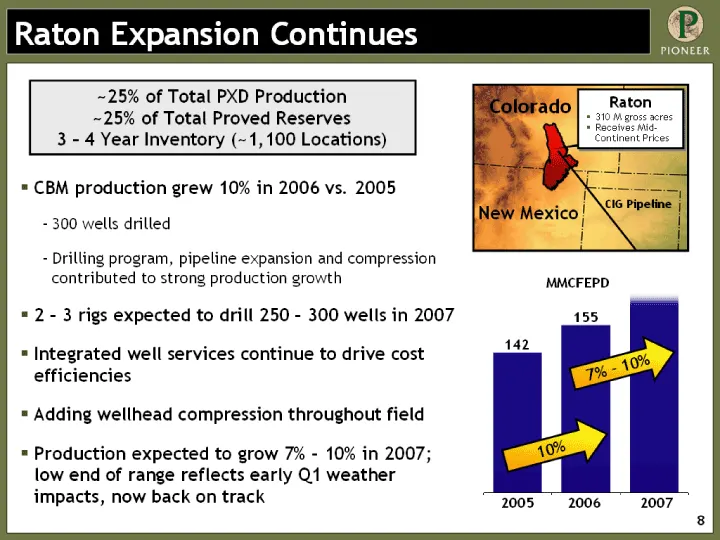
Raton Expansion Continues New Mexico Colorado Raton 310 M gross acres Receives Mid- Continent Prices Raton FY '05 FY '06 FY '07 142 155 165 6 MMCFEPD 7% - 10% 2005 2006 2007 CBM production grew 10% in 2006 vs. 2005 300 wells drilled Drilling program, pipeline expansion and compression contributed to
Slide 10: Edwards Trend Expansion on Schedule
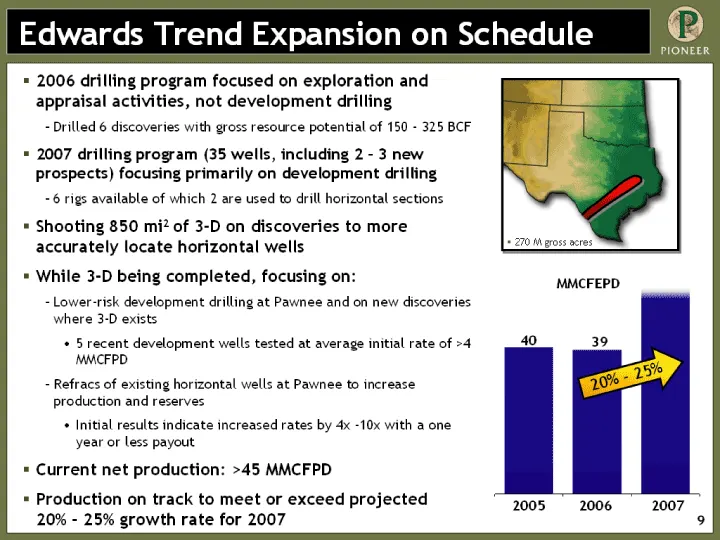
Edwards Trend Expansion on Schedule 2006 drilling program focused on exploration and appraisal activities, not development drilling Drilled 6 discoveries with gross resource potential of 150 - 325 BCF 2007 drilling program (35 wells, including 2 - 3 new prospects) focusing primarily on development d
Slide 11: New Discovery in Canada
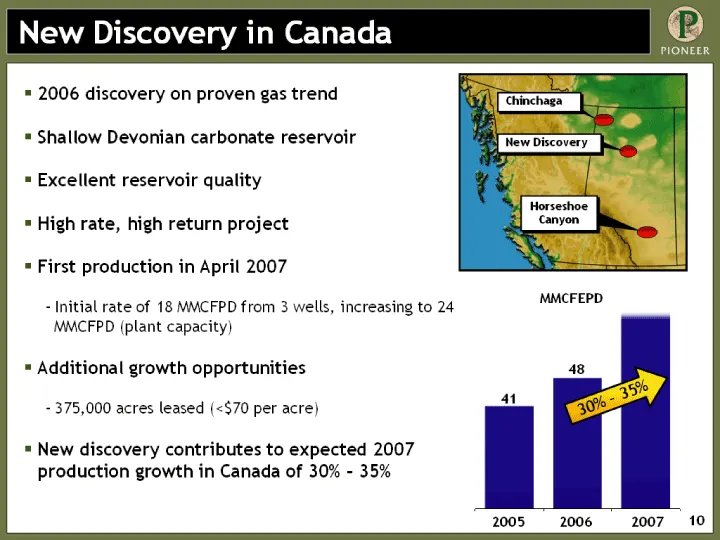
New Discovery in Canada 2006 discovery on proven gas trend Shallow Devonian carbonate reservoir Excellent reservoir quality High rate, high return project First production in April 2007 Initial rate of 18 MMCFPD from 3 wells, increasing to 24 MMCFPD (plant capacity) Additional growth opportunities 3
Slide 12: New Discovery in Canada Provides Upside
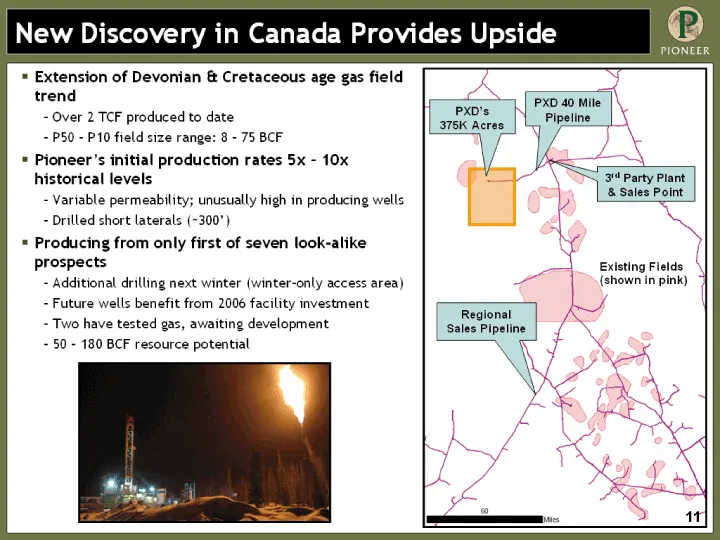
New Discovery in Canada Provides Upside PhotoshopElements.Image.4 PXD's 375K Acres Existing Fields (shown in pink) 3rd Party Plant & Sales Point Regional Sales Pipeline Extension of Devonian & Cretaceous age gas field trend Over 2 TCF produced to date P50 - P10 field size range: 8 - 75 BCF Pioneer's
Slide 13: Expandable Production Facilities
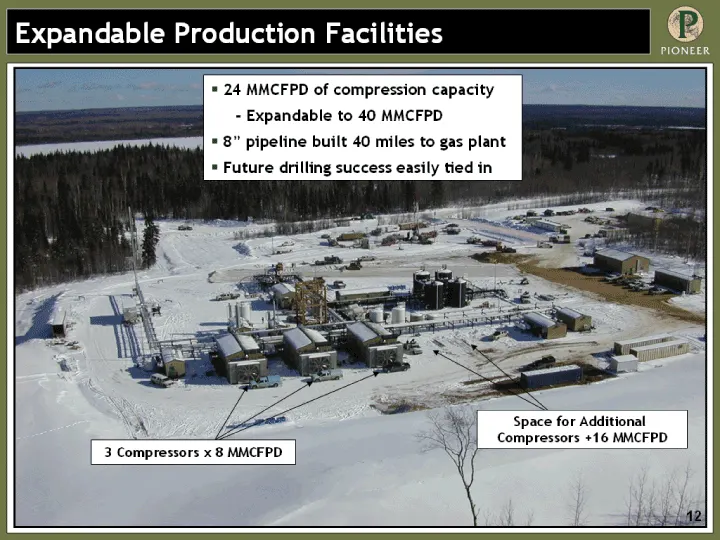
Expandable Production Facilities 24 MMCFPD of compression capacity - Expandable to 40 MMCFPD 8" pipeline built 40 miles to gas plant Future drilling success easily tied in Space for Additional Compressors +16 MMCFPD 3 Compressors x 8 MMCFPD 12
Slide 14: Tunisia Fast Becoming New Core Area
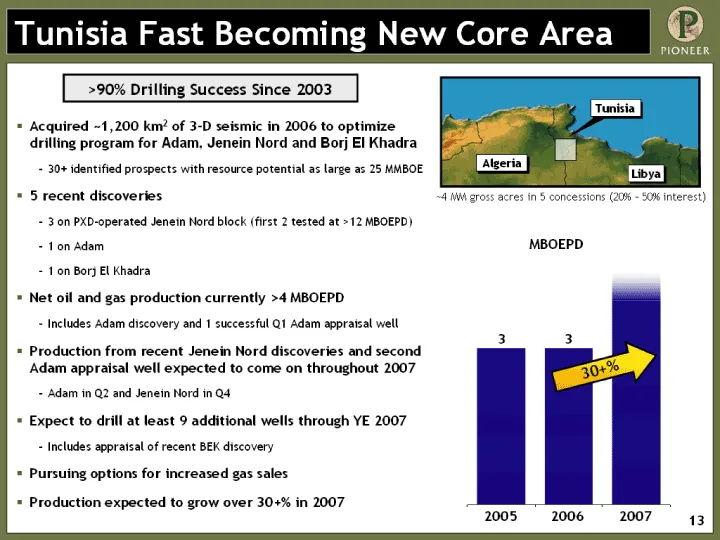
Tunisia Fast Becoming New Core Area Acquired ~1,200 km2 of 3-D seismic in 2006 to optimize drilling program for Adam, Jenein Nord and Borj El Khadra 30+ identified prospects with resource potential as large as 25 MMBOE 5 recent discoveries 3 on PXD-operated Jenein Nord block (first 2 tested at >12 M
Slide 15: 2007 Tunisia Drilling and Facilities Program
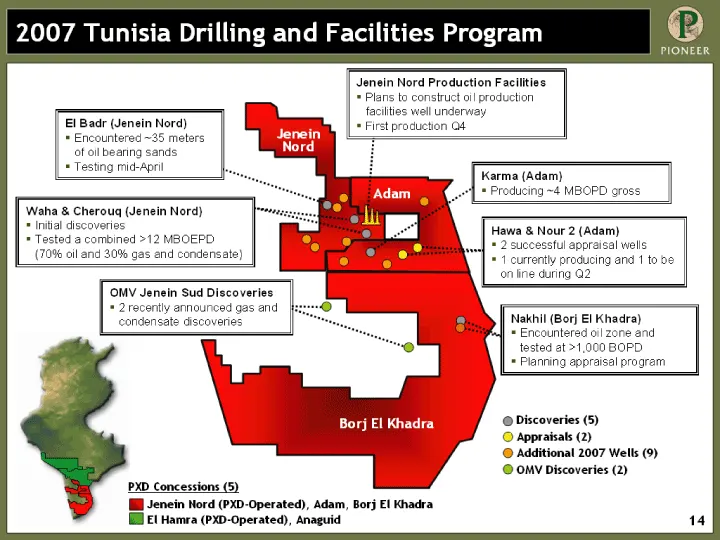
2007 Tunisia Drilling and Facilities Program Adam Borj El Khadra Jenein Nord Jenein Nord (PXD-Operated), Adam, Borj El Khadra El Hamra (PXD-Operated), Anaguid PXD Concessions (5) Nakhil (Borj El Khadra) Encountered oil zone and tested at >1,000 BOPD Planning appraisal program Karma (Adam) Producing
Slide 16: South Coast Gas Project On Schedule
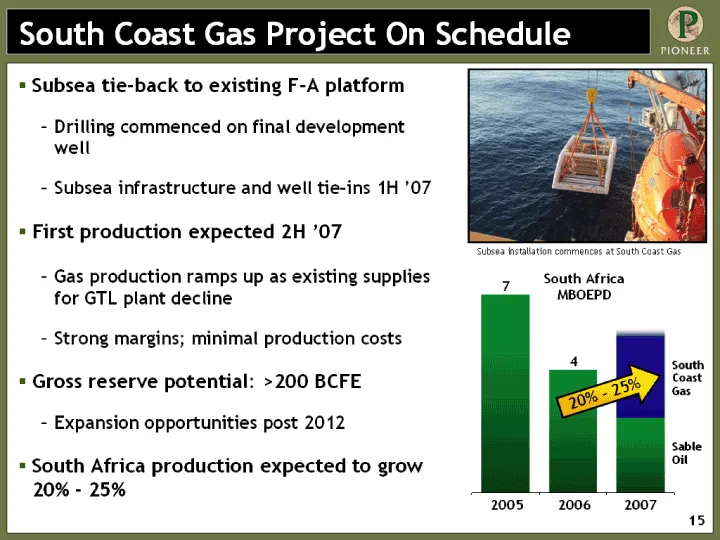
South Coast Gas Project On Schedule Subsea tie-back to existing F-A platform Drilling commenced on final development well Subsea infrastructure and well tie-ins 1H '07 First production expected 2H '07 Gas production ramps up as existing supplies for GTL plant decline Strong margins; minimal producti
Slide 17: 2007 Alaska Activities
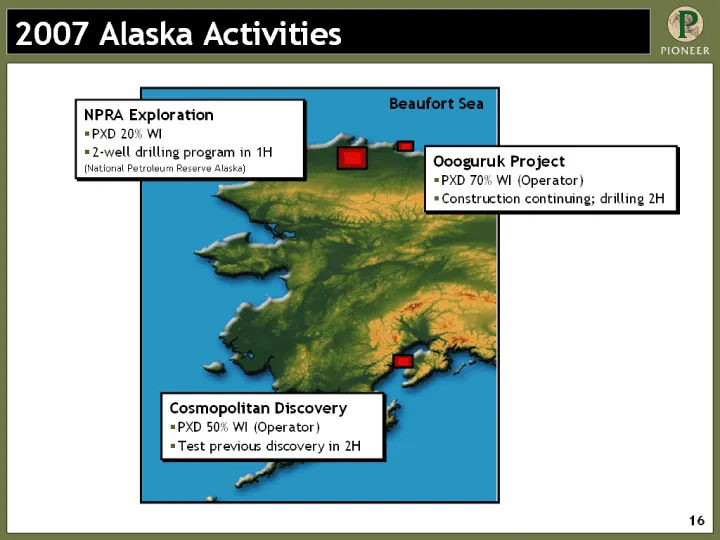
2007 Alaska Activities 2007 Alaska Activities Beaufort Sea Cosmopolitan Discovery PXD 50% WI (Operator) Test previous discovery in 2H Oooguruk Project PXD 70% WI (Operator) Construction continuing; drilling 2H NPRA Exploration PXD 20% WI 2-well drilling program in 1H (National Petroleum Reserve Alas
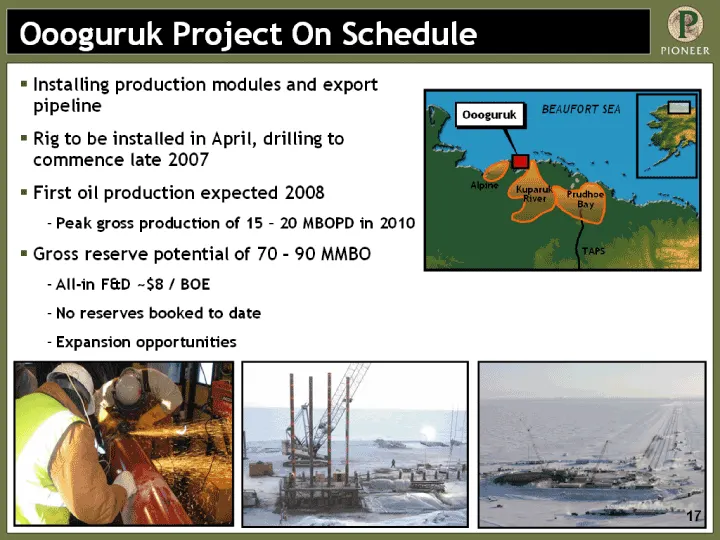
Slide 18: Oooguruk Project On Schedule
Oooguruk Project On Schedule Installing production modules and export pipeline Rig to be installed in April, drilling to commence late 2007 First oil production expected 2008 Peak gross production of 15 - 20 MBOPD in 2010 Gross reserve potential of 70 - 90 MMBO All-in F&D ~$8 / BOE No reserves booke
Slide 19: Emphasis on Value Creation
Emphasis on Value Creation Low-risk strategy Long-term growth visibility Large drilling inventory Attractive returns Operating strength Financial flexibility Confidence to Deliver in 2007 and Beyond
Slide 20: Appendix
Appendix
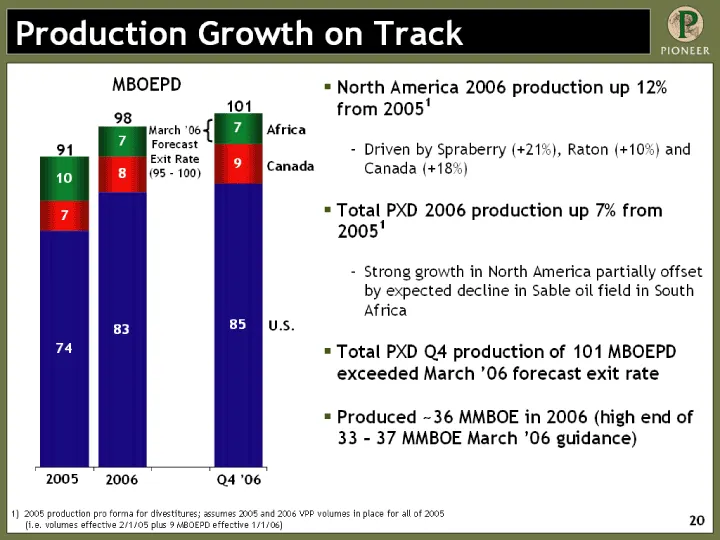
Slide 21: Production Growth on Track
FY '05 FY '06 '06 Exit Rate US 74 83 2 85 Canada 7 8 2 9 Africa 10 7 2 7 Production Growth on Track MBOEPD 91 2005 production pro forma for divestitures; assumes 2005 and 2006 VPP volumes in place for all of 2005 (i.e. volumes effective 2/1/05 plus 9 MBOEPD effective 1/1/06) 98 U.S. Canada Africa 10
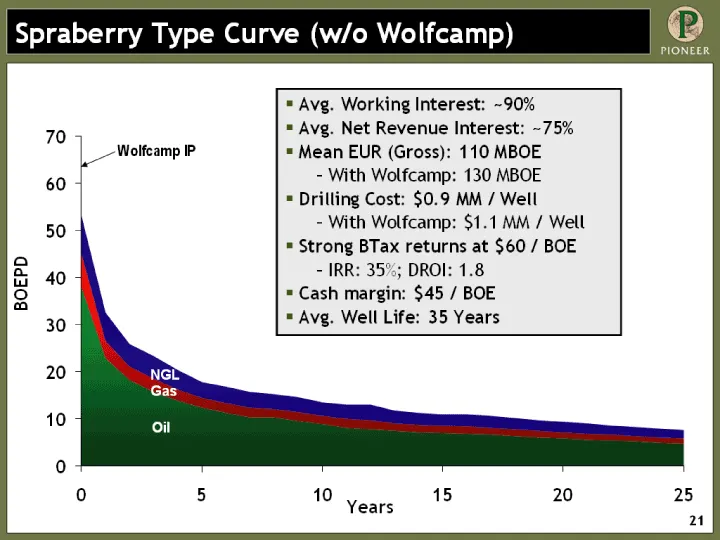
Slide 22: Spraberry Type Curve (w/o Wolfcamp)
Spraberry Type Curve (w/o Wolfcamp) Years Oil Wet Gas Dry Gas MCF Dry Gas (BOE) 0 38 97.33 49.73 7 8 1 22.87 43.04 21.99 3.67 6.03 2 18.18 34.53 17.64 2.94 4.83 3 15.78 33.51 17.12 2.85 4.69 4 13.77 28.9 14.76 2.46 4.05 5 12.34 24.39 12.46 2.08 3.41 6 11.22 24.64 12.59 2.1 3.45 7 10.31 24.2 12.36 2.
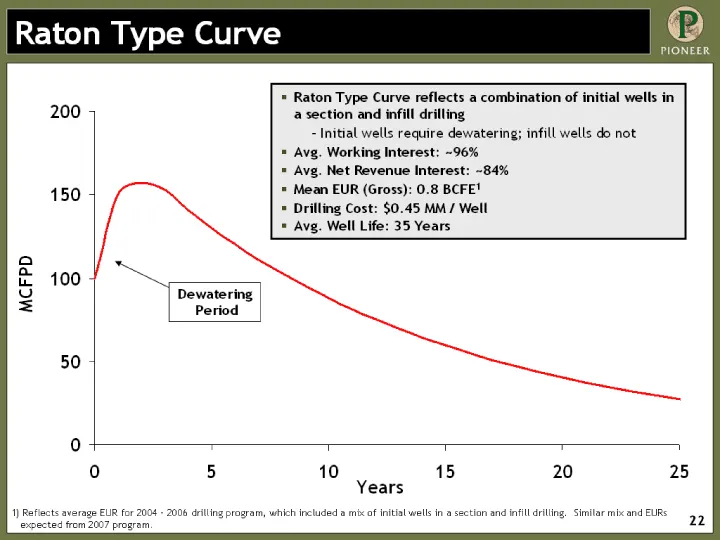
Slide 23: Raton Type Curve
Raton Type Curve Years 2004 - 2006 Avg 0 100 1 150 2 157 3 153 4 140.5601195 5 130.0131103 6 120.257502 7 111.2339114 8 102.8874111 9 95.16719519 10 88.02627013 11 81.42116847 12 75.3116844 13 69.66062897 14 64.43360373 15 59.59879133 16 55.12676184 17 50.99029365 18 47.16420773 19 43.62521436 20 40
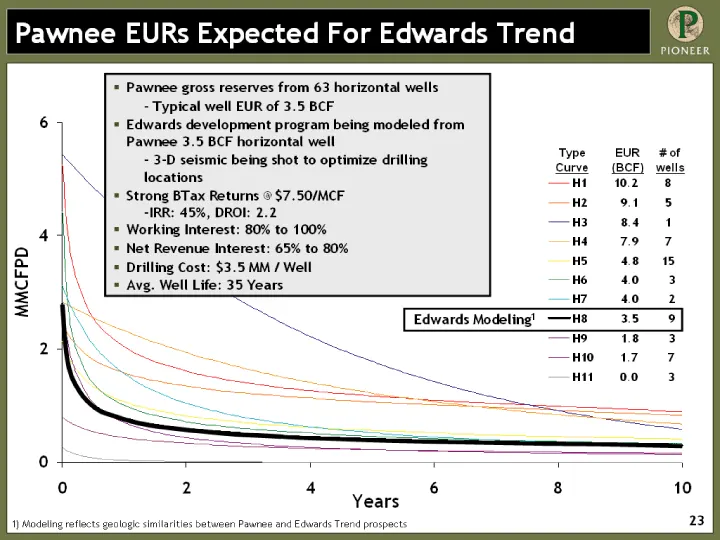
Slide 24: Pawnee EURs Expected For Edwards Trend
Pawnee EURs Expected For Edwards Trend H1 10.2 8 H2 9.1 5 H3 8.4 1 H4 7.9 7 H5 4.8 15 H6 4.0 3 H7 4.0 2 H8 3.5 9 H9 1.8 3 H10 1.7 7 H11 0.0 3 0 0 5.263 2.467 5.428 2.829 2.138 4.441 3.125 2.796 2.796 0.789 0.263 0.083333333 0 4.052 2.274 5.328 2.78 1.898 2.813 2.885 1.82 2.133 0.723 0.203 0.16666666
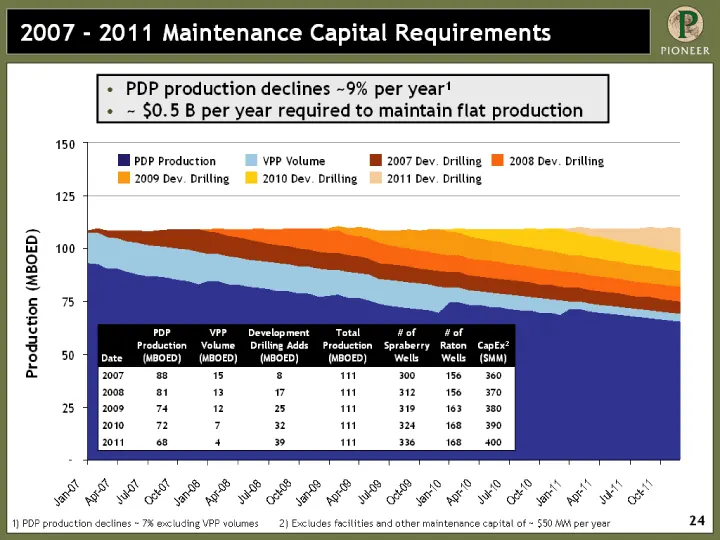
Slide 25: 2007 - 2011 Maintenance Capital Requirements
2007 - 2011 Maintenance Capital Requirements 1) PDP production declines ~ 7% excluding VPP volumes 2) Excludes facilities and other maintenance capital of ~ $50 MM per year PDP production declines ~9% per year1 ~ $0.5 B per year required to maintain flat production Date PDP Production (MBOED) VPP Vo
Slide 26: Q1 Q2 Q3 Q1 2000 Q2 2000 Q3 2000 Q4 2000 Q1 Q2 2001
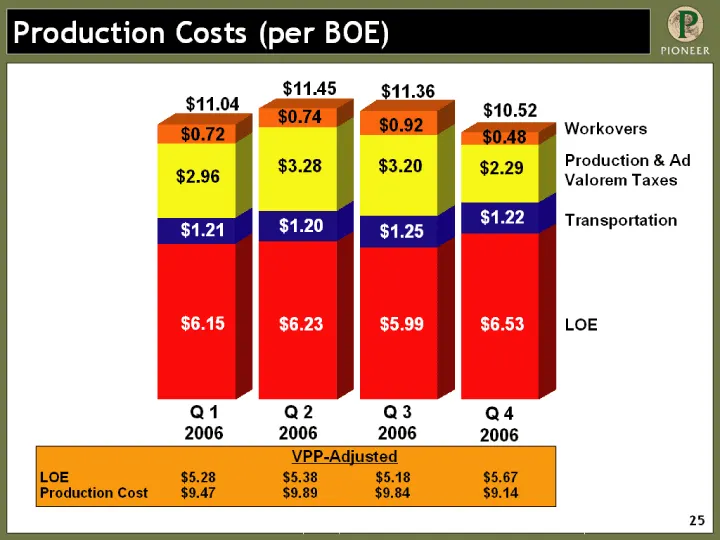
Q1 Q2 Q3 Q1 2000 Q2 2000 Q3 2000 Q4 2000 Q1 01 Q2 2001 Q3 01 Q4 01 Q1 02 Q2 02 Q3 02 Q4 02 Q1 03 Q2 03 Q3 03 Q4 03 Q1 04 Q2 04 Q3 04 Q4 04 Q1 05 Q2 05 Q3 05 Q4 05 Q1 06 Q2 06 Q3 06 Q4 06 LOE 2.99 2.42 2.47 2.18 2.05 2.2 2.33 2.36 2.58 2.89 3.19 3.29 2.88 2.63 2.68 3.02 3.3 3.29 3.44 3.43 3.71 3.81 4
Slide 27: 2006 Production Cost vs. Peers
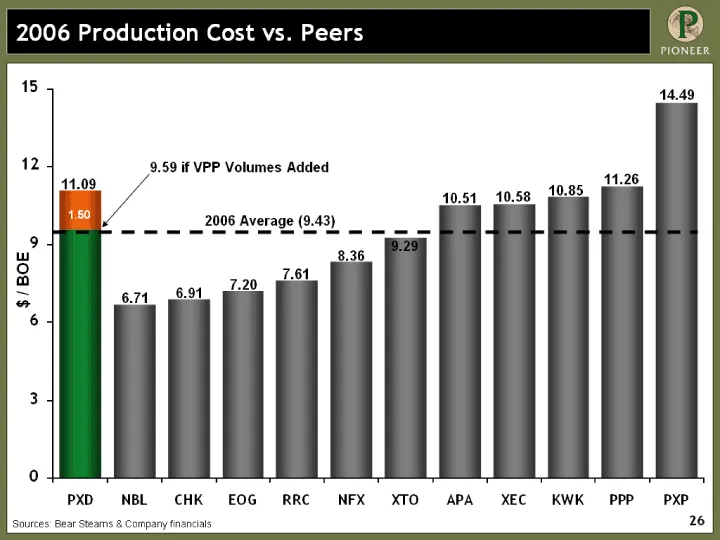
2006 Production Cost vs. Peers PXD 9.59 1.5 NBL 6.71 CHK 6.91 EOG 7.2 RRC 7.61 NFX 8.36 XTO 9.29 APA 10.51 XEC 10.58 KWK 10.85 PPP 11.26 PXP 14.49 $ / BOE 11.09 6.71 6.91 7.20 7.61 8.36 9.29 14.49 11.26 10.58 10.51 2006 Average (9.43) 9.59 if VPP Volumes Added Sources: Bear Stearns & Company financi
Slide 28: VPP - Adjusted Production Costs
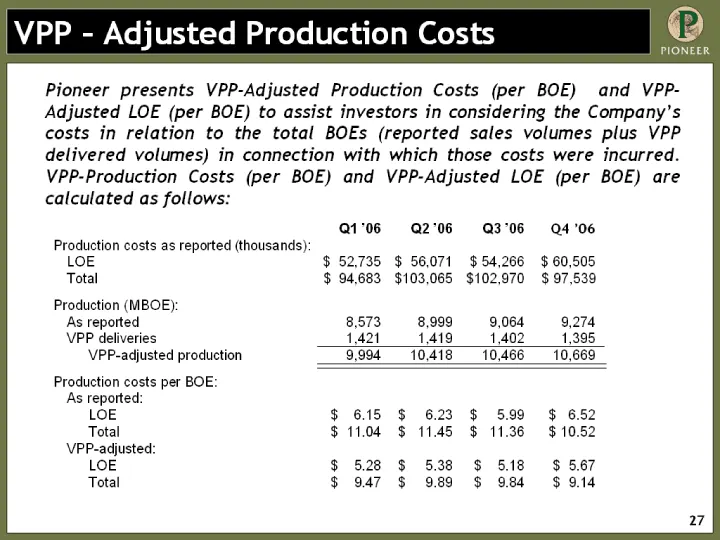
VPP - Adjusted Production Costs Pioneer presents VPP-Adjusted Production Costs (per BOE) and VPP- Adjusted LOE (per BOE) to assist investors in considering the Company's costs in relation to the total BOEs (reported sales volumes plus VPP delivered volumes) in connection with which those costs were
Slide 29: Hedge Position as of 4/02/2007
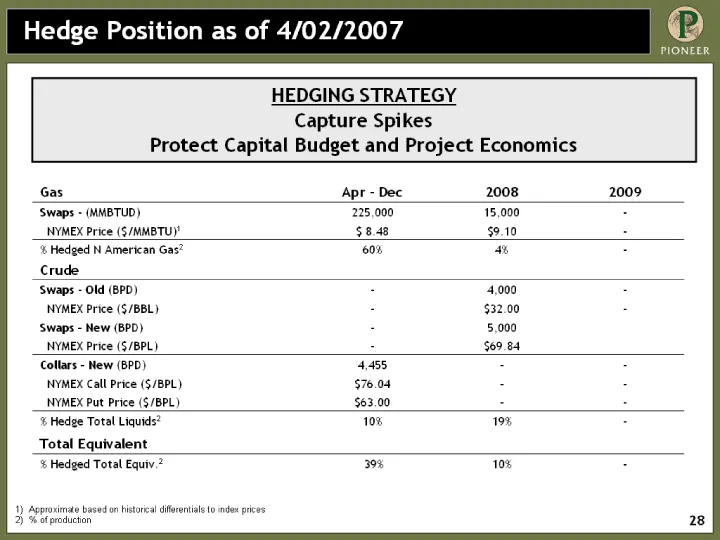
Approximate based on historical differentials to index prices % of production Gas Apr - Dec 2008 2009 Swaps - (MMBTUD) 225,000 15,000 - NYMEX Price ($/MMBTU)1 $ 8.48 $9.10 - % Hedged N American Gas2 60% 4% - Crude Swaps - Old (BPD) - 4,000 - NYMEX Price ($/BBL) - $32.00 - Swaps - New (BPD) - 5,000 N
Slide 30: Pro Forma Senior Notes and Credit Facility
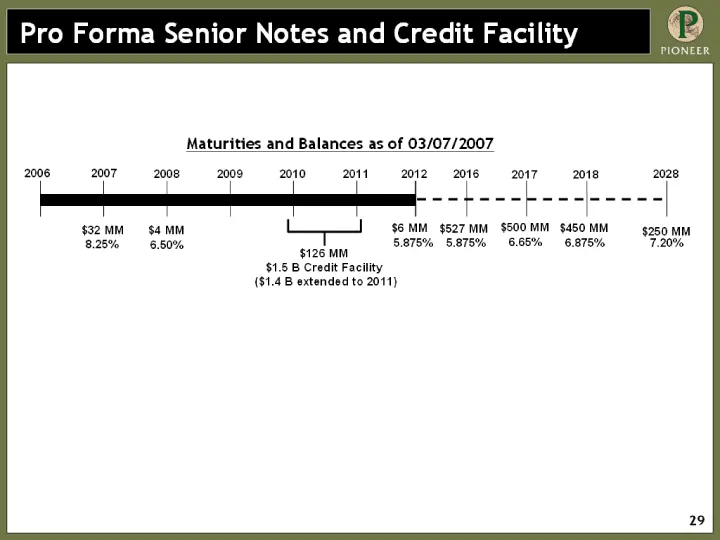
Pro Forma Senior Notes and Credit Facility 2006 2007 2008 2009 2010 2011 2012 2028 $32 MM 8.25% $6 MM 5.875% $250 MM 7.20% 2016 $527 MM 5.875% 2018 $450 MM 6.875% $126 MM $1.5 B Credit Facility ($1.4 B extended to 2011) $4 MM 6.50% Maturities and Balances as of 03/07/2007 2017 $500 MM 6.65%
Slide 31: Met 2006 F&D and Reserves Goals
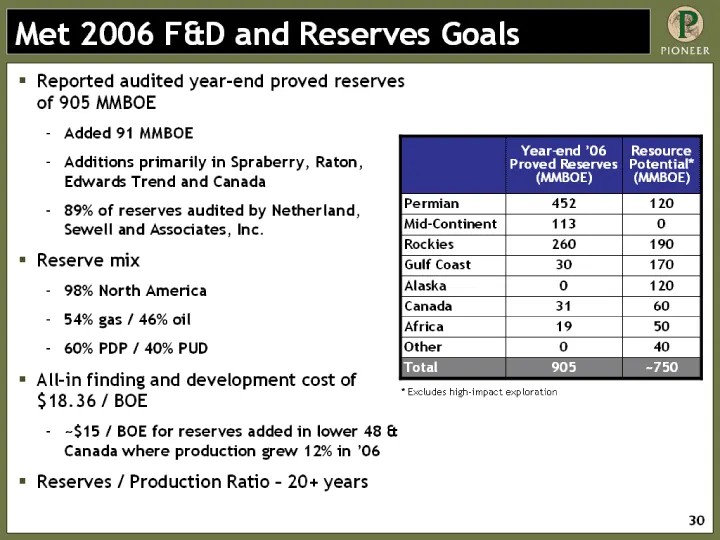
Met 2006 F&D and Reserves Goals Reported audited year-end proved reserves of 905 MMBOE Added 91 MMBOE Additions primarily in Spraberry, Raton, Edwards Trend and Canada 89% of reserves audited by Netherland, Sewell and Associates, Inc. Reserve mix 98% North America 54% gas / 46% oil 60% PDP / 40% PUD
Slide 32: Historical Spraberry F&D - Consistently Attractive
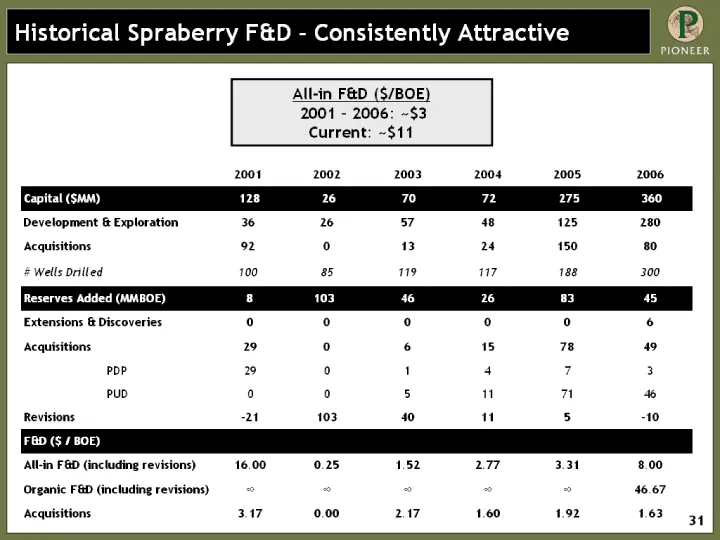
Historical Spraberry F&D - Consistently Attractive 2001 2001 2001 2002 2003 2004 2005 2006 Capital ($MM) Capital ($MM) 128 128 128 26 70 72 275 360 Development & Exploration Development & Exploration 36 36 36 26 57 48 125 280 Acquisitions Acquisitions 92 92 92 0 13 24 150 80 # Wells Drilled # Wells
Slide 33: Finding and Development Costs
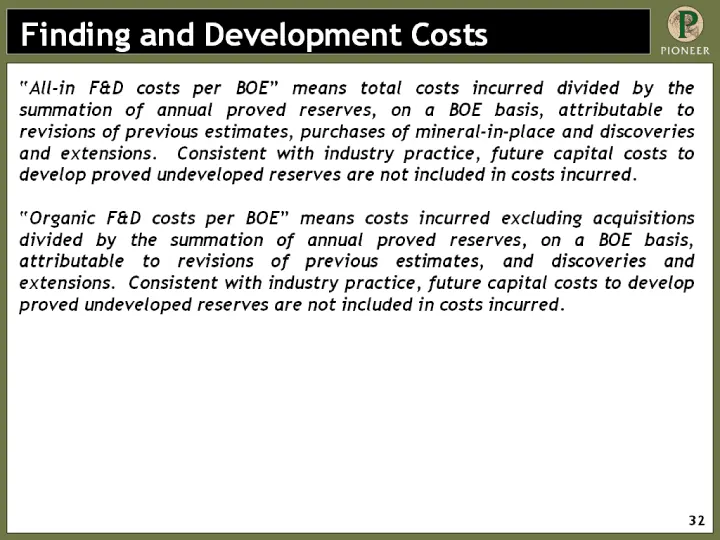
Finding and Development Costs "All-in F&D costs per BOE" means total costs incurred divided by the summation of annual proved reserves, on a BOE basis, attributable to revisions of previous estimates, purchases of mineral-in-place and discoveries and extensions. Consistent with industry practice, fu
Slide 34: Certain Reserve Information
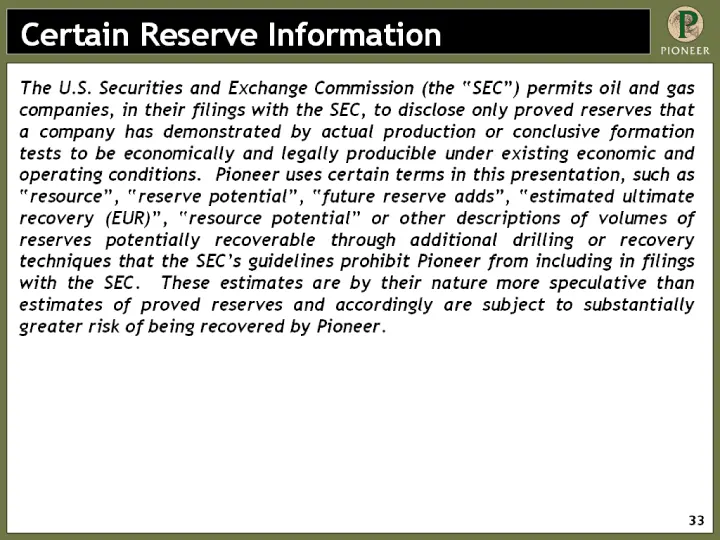
Certain Reserve Information The U.S. Securities and Exchange Commission (the "SEC") permits oil and gas companies, in their filings with the SEC, to disclose only proved reserves that a company has demonstrated by actual production or conclusive formation tests to be economically and legally produci
Source: SEC EDGAR · 8-K filed Apr 3, 2007
More decks from Pioneer Natural Resources Co
 Merger or Acquisition (October 2023)15 slides · Oct 11, 2023
 Q3 2020 Earnings Presentation30 slides · Nov 4, 2020
 Merger or Acquisition (October 2020)18 slides · Oct 20, 2020
 IPAA Oil & Gas Investment Symposium 201846 slides · Apr 9, 2018
 Investor Presentation (January 2014)80 slides · Jan 6, 2014
 Q4 2012 Earnings Presentation48 slides · Feb 13, 2013