NHPC Limited · NSE:NHPC
NHPC — FY2012 Earnings Presentation
39 slides from NHPC's earnings presentation, Jul 4, 2012
Slide 1: Welcome to Analysts'/Investors' Conference
Welcome to Analysts’/Investors’ Conference 1
Slide 2: Investors'/Analysts' Conference Mumbai
Investors’ / Analysts’ Conference Mumbai 2
Slide 3: Agenda
Agenda Hydro Scenario in India NHPC Overview Significant Expansion Plan Performance Highlights Financial Highlights 3 3
Slide 4: Hydro Scenario in India
Hydro Scenario in India 4
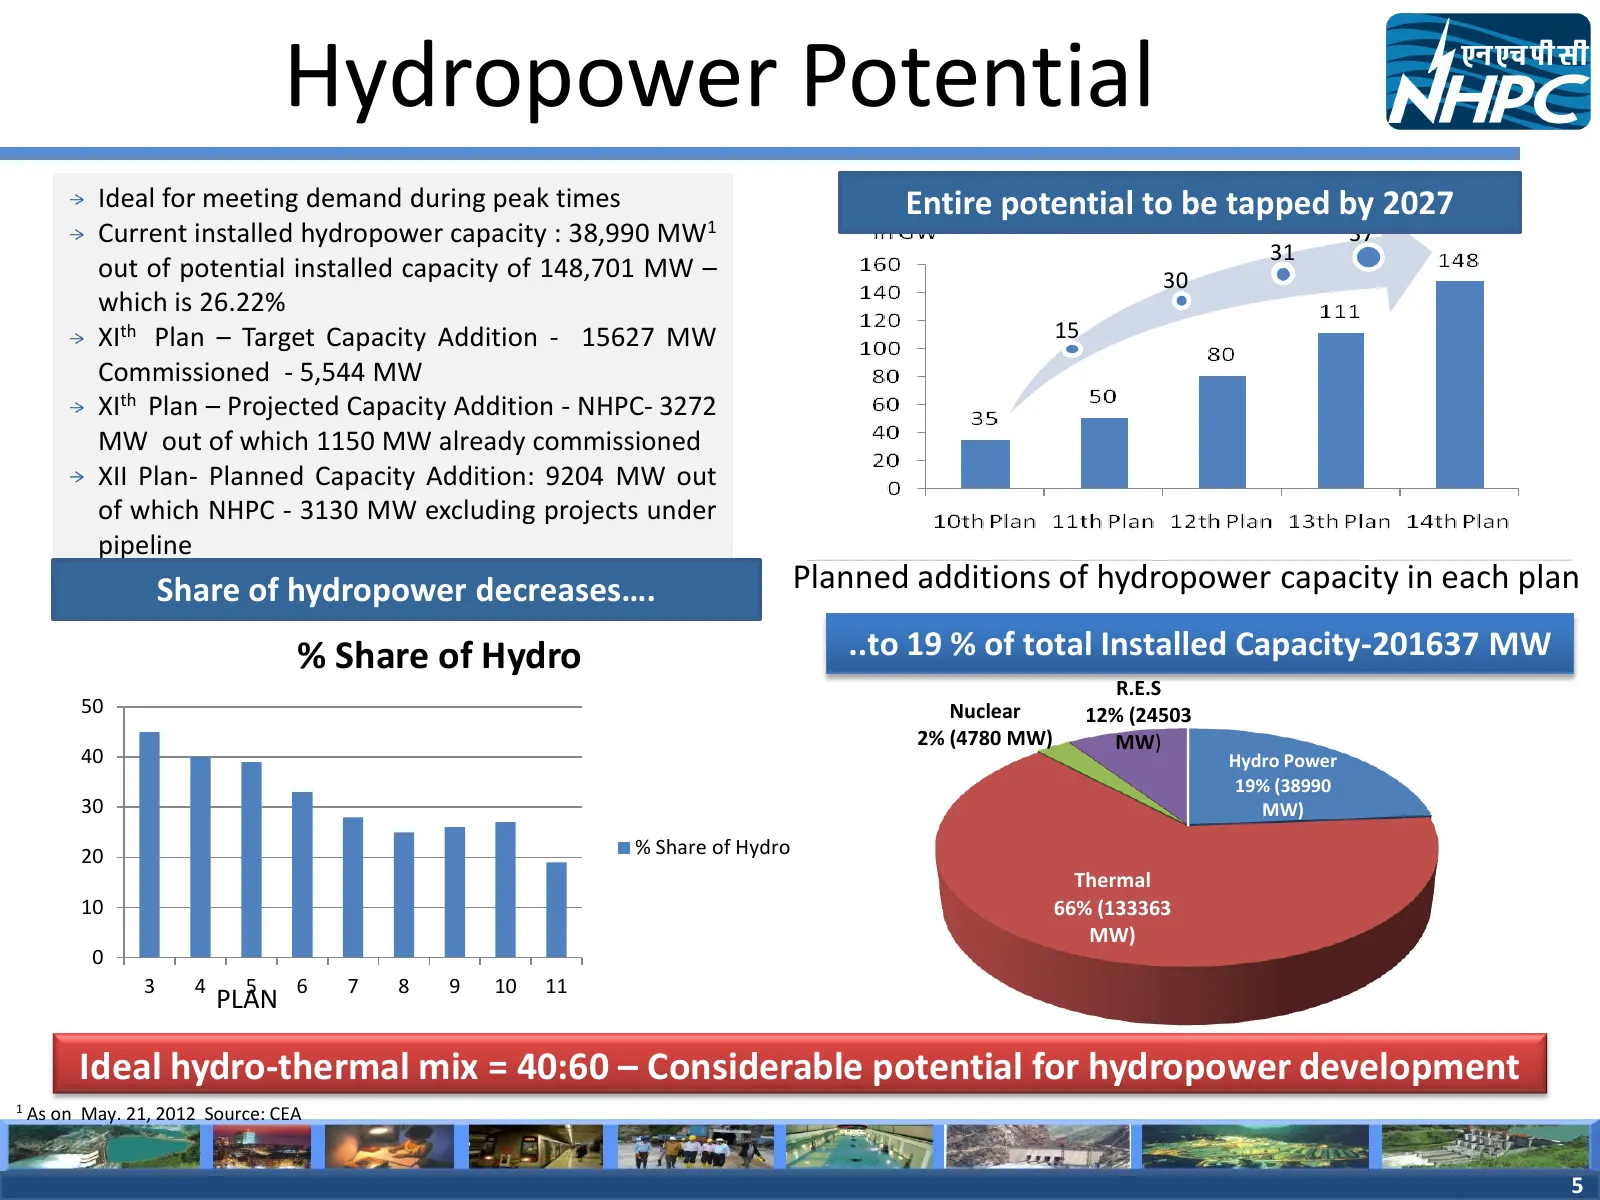
Slide 5: Hydropower Potential
Hydropower Potential Ideal for meeting demand during peak times Entire potential to be tapped by 2027 Current installed hydropower capacity : 38,990 MW1 37 31 out of potential installed capacity of 148,701 MW – 30 which is 26.22% XIth Plan – Target Capacity Addition - 15627 MW 15 Commissioned - 5,54
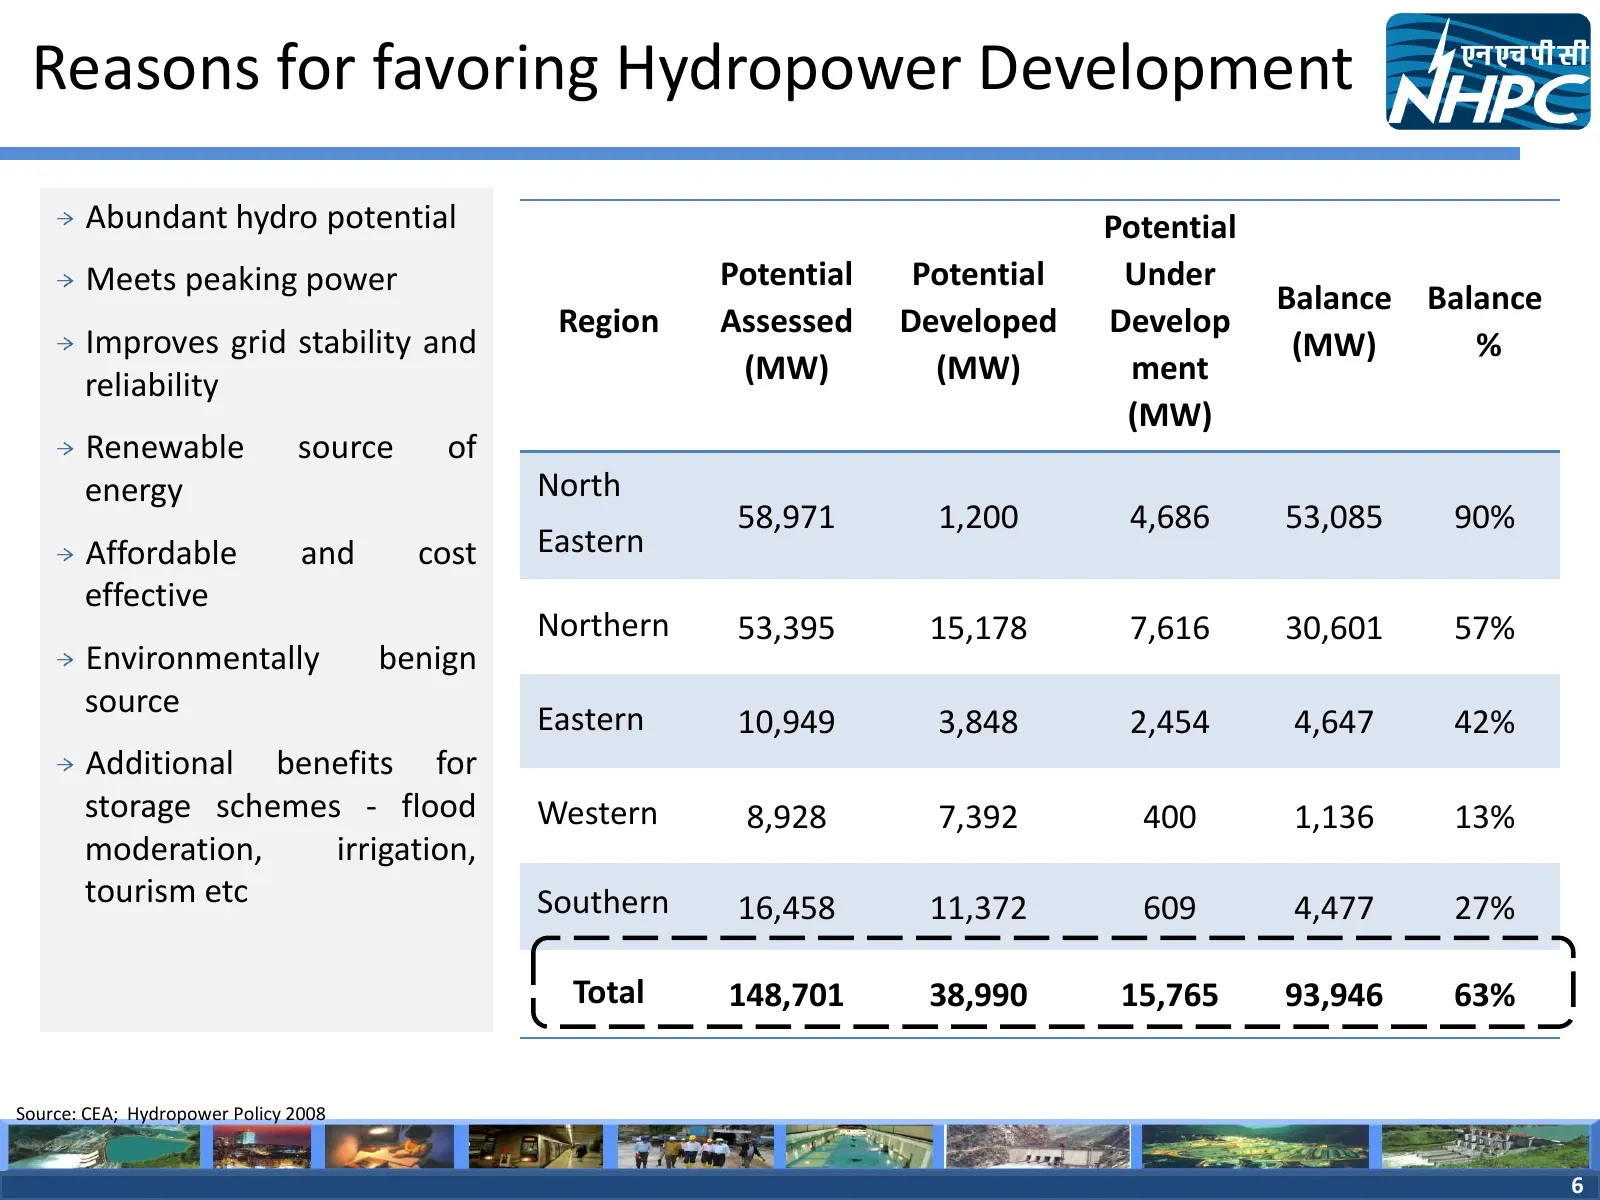
Slide 6: Reasons for favoring Hydropower Development
Reasons for favoring Hydropower Development Abundant hydro potential Potential Meets peaking power Potential Potential Under Balance Balance Region Assessed Developed Develop Improves grid stability and (MW) % reliability (MW) (MW) ment (MW) Renewable source of energy North 58,971 1,200 4,686 53,085

Slide 7: NHPC Overview
NHPC Overview 7
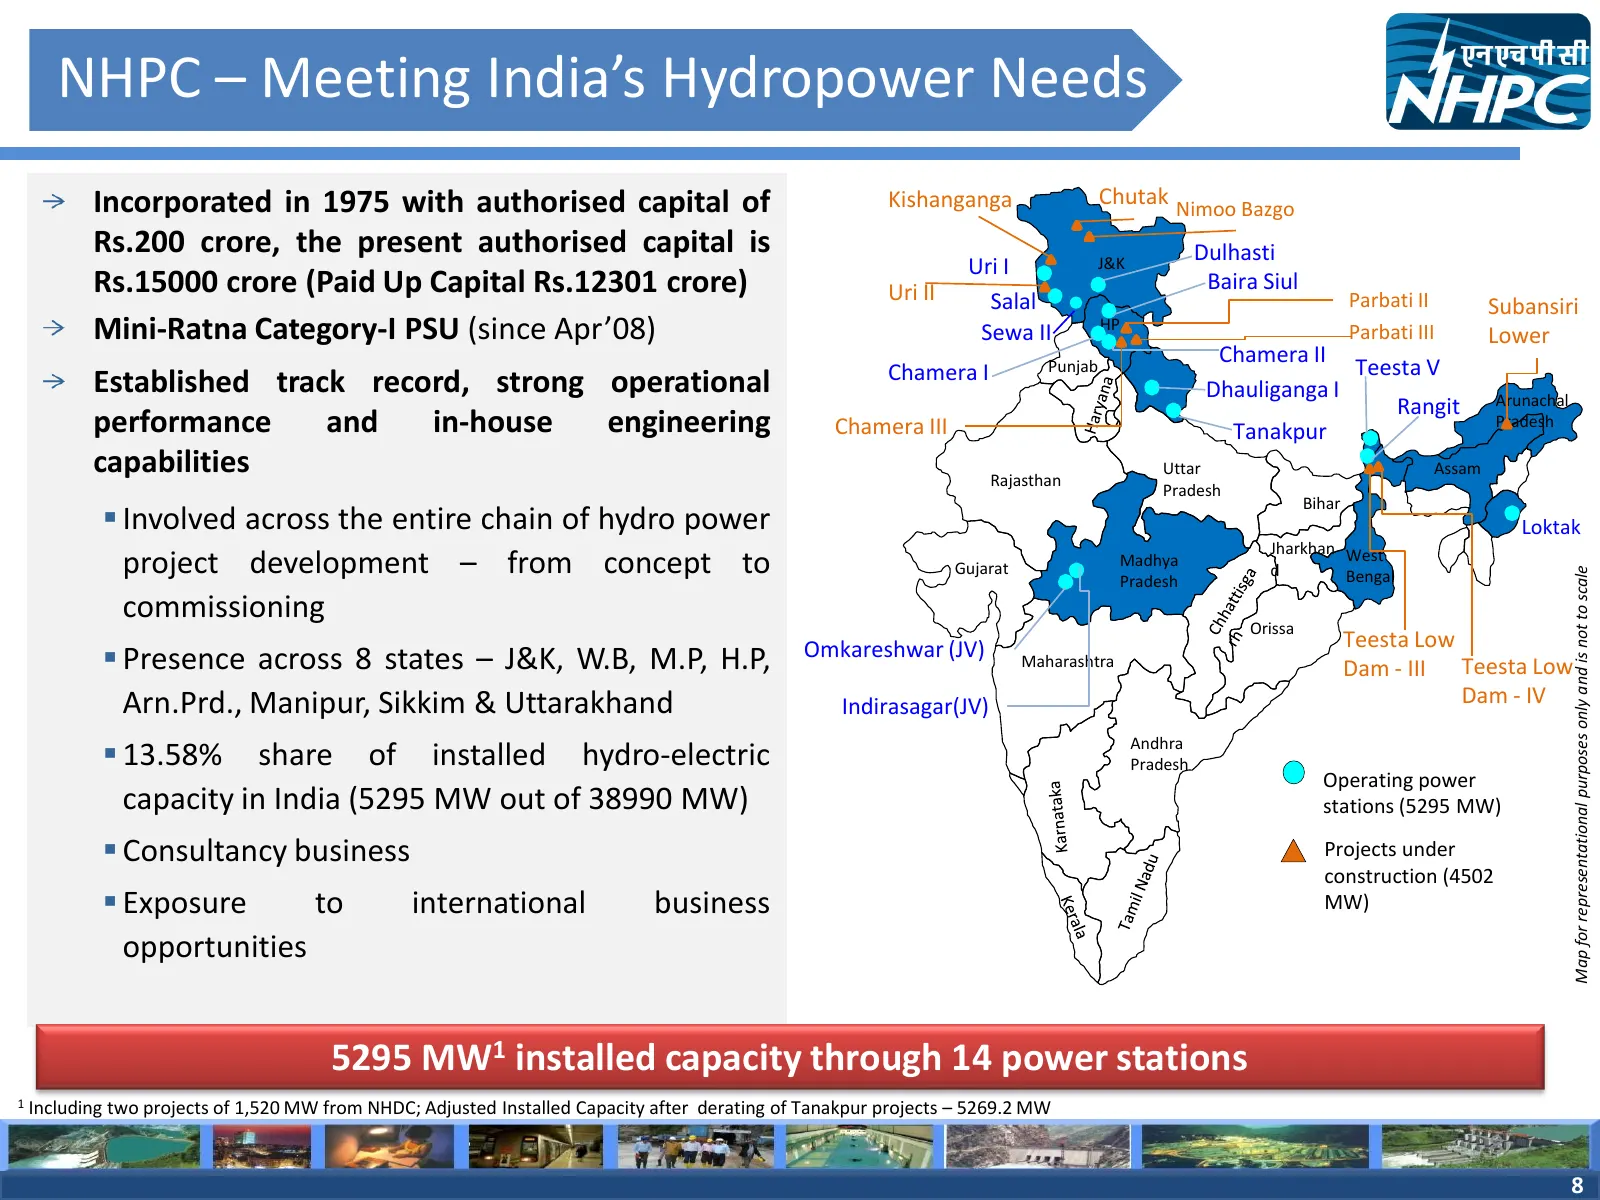
Slide 8: NHPC – Meeting India's Hydropower Needs
NHPC – Meeting India’s Hydropower Needs Incorporated in 1975 with authorised capital of Kishanganga Chutak Nimoo Bazgo Rs.200 crore, the present authorised capital is Dulhasti Uri I J&K Rs.15000 crore (Paid Up Capital Rs.12301 crore) Uri II Baira Siul Parbati II Salal Subansiri Mini-Ratna Category-I
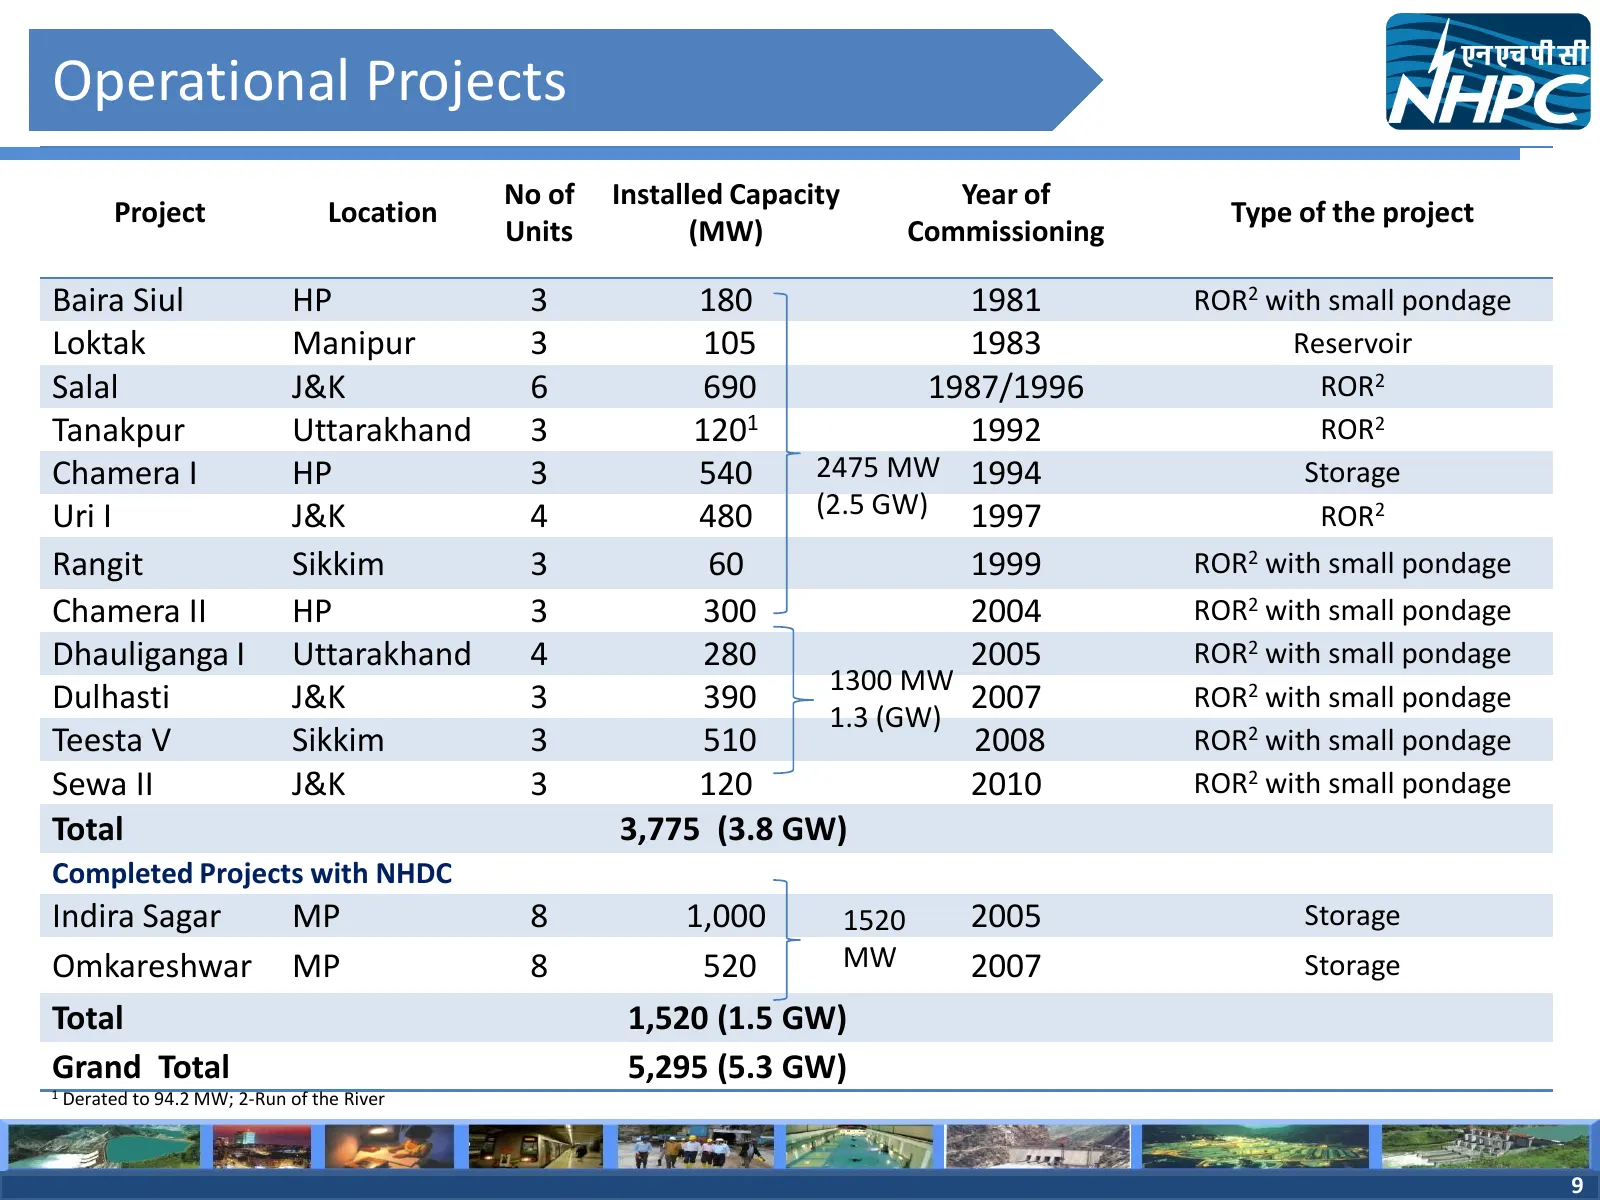
Slide 9: Operational Projects
Operational Projects No of Installed Capacity Year of Project Location Type of the project Units (MW) Commissioning Baira Siul HP 3 180 1981 ROR2 with small pondage Loktak Manipur 3 105 1983 Reservoir Salal J&K 6 690 1987/1996 ROR2 Tanakpur Uttarakhand 3 1201 1992 ROR2 Chamera I HP 3 540 2475 MW 199
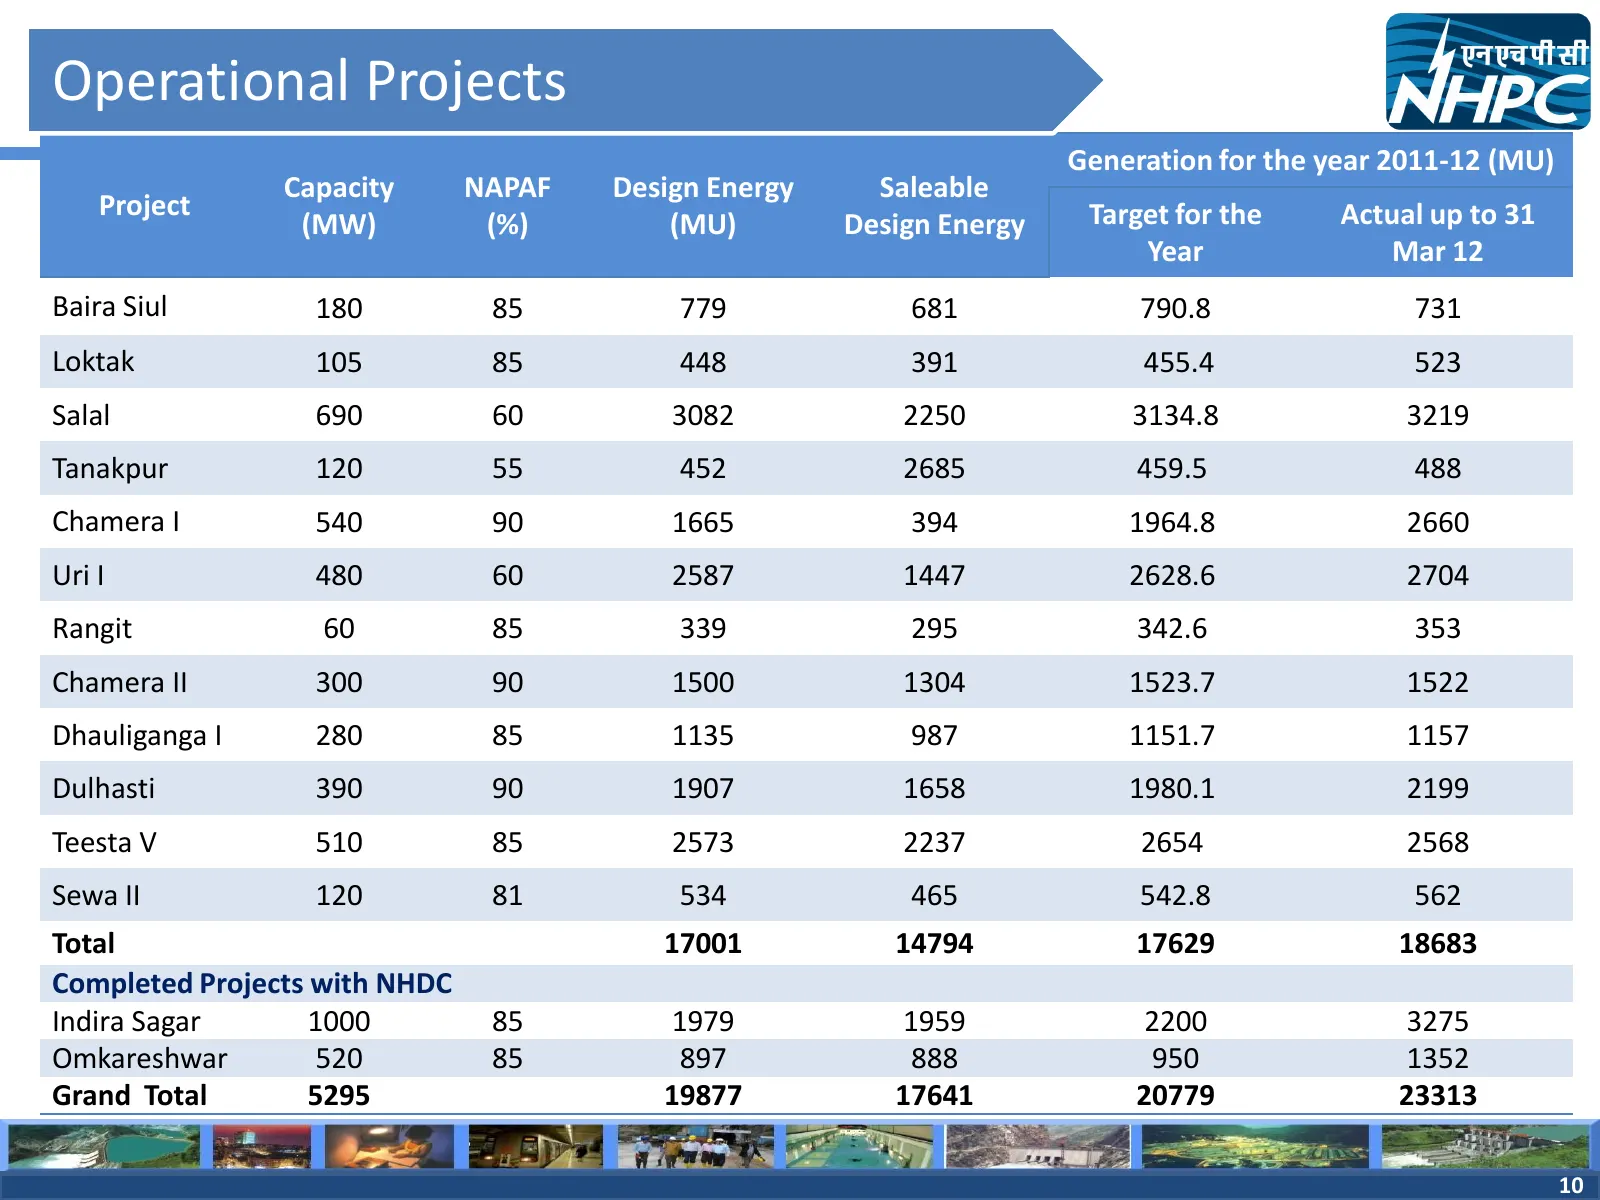
Slide 10: Operational Projects
Operational Projects Generation for the year 2011-12 (MU) Capacity NAPAF Design Energy Saleable Project Target for the Actual up to 31 (MW) (%) (MU) Design Energy Year Mar 12 Baira Siul 180 85 779 681 790.8 731 Loktak 105 85 448 391 455.4 523 Salal 690 60 3082 2250 3134.8 3219 Tanakpur 120 55 452 26
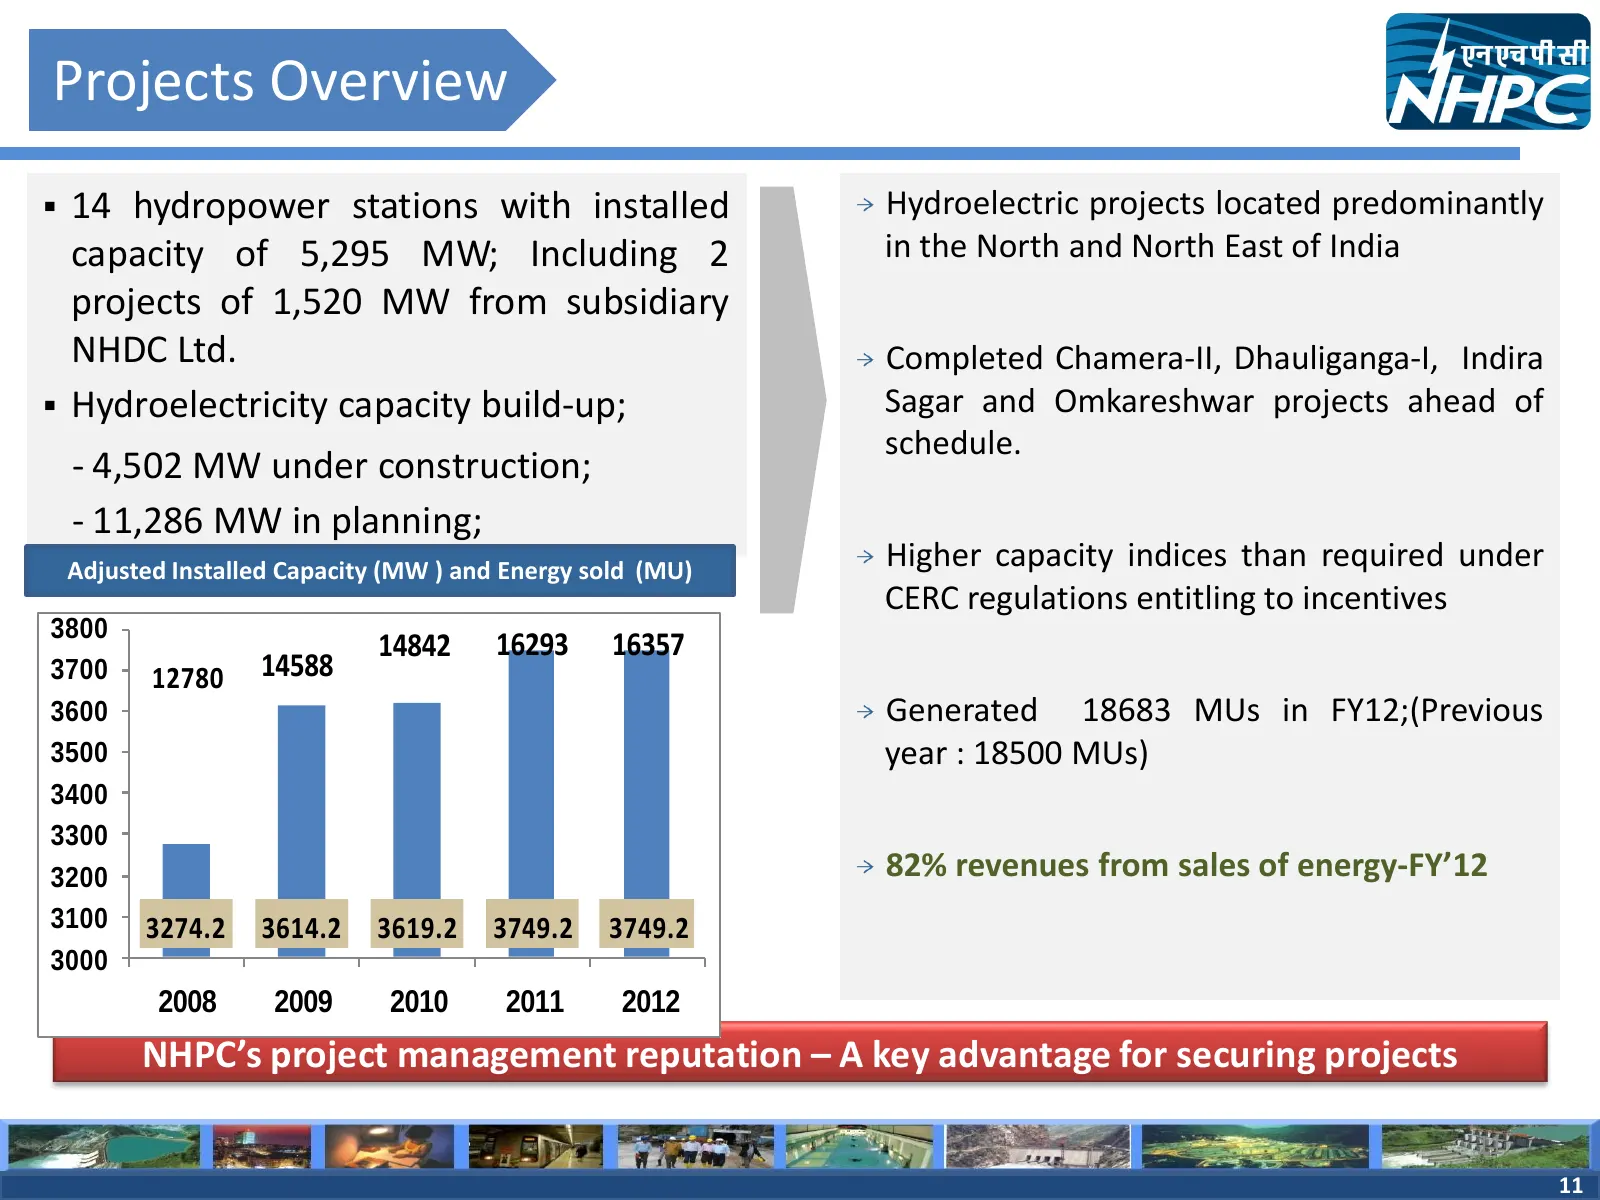
Slide 11: Projects Overview
Projects Overview 14 hydropower stations with installed Hydroelectric projects located predominantly capacity of 5,295 MW; Including 2 in the North and North East of India projects of 1,520 MW from subsidiary NHDC Ltd. Completed Chamera-II, Dhauliganga-I, Indira Hydroelectricity capacity build-u
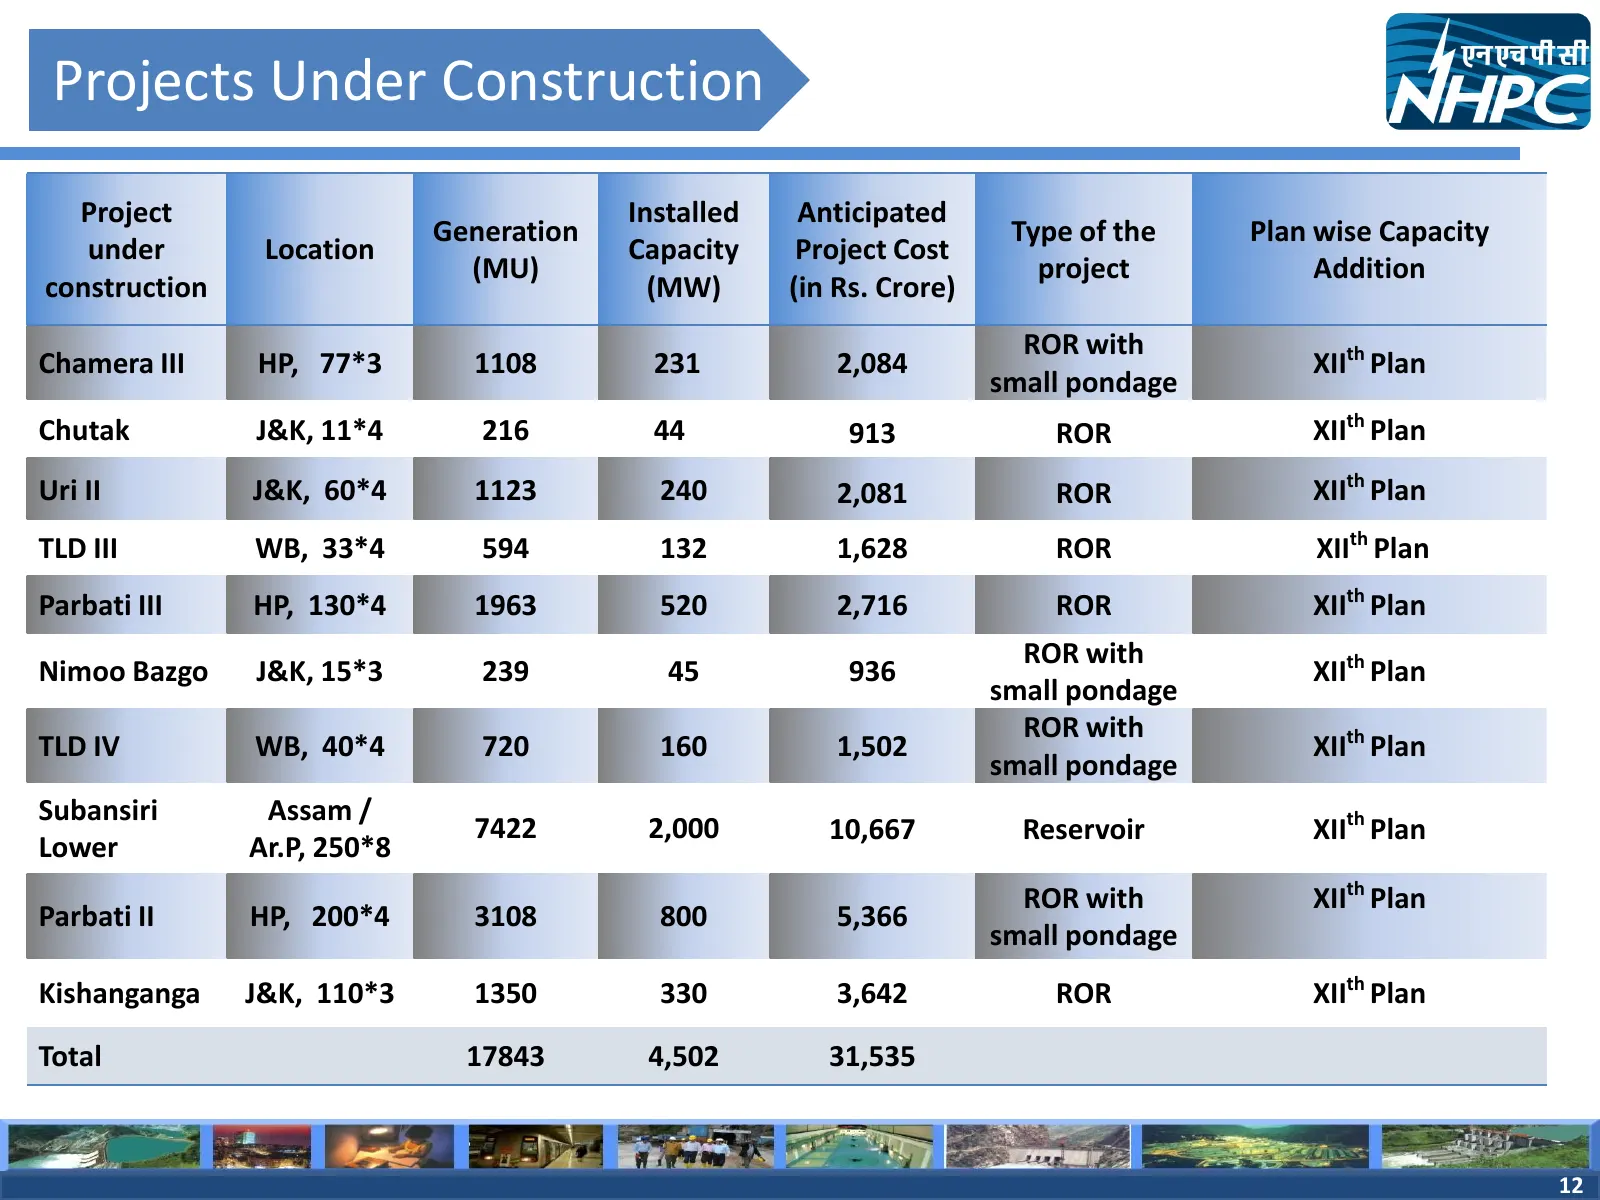
Slide 12: Projects Under Construction
Projects Under Construction Project Installed Anticipated Generation Type of the Plan wise Capacity under Location Capacity Project Cost (MU) project Addition construction (MW) (in Rs. Crore) ROR with Chamera III HP, 77*3 1108 231 2,084 XIIth Plan small pondage Chutak J&K, 11*4 216 44 913 ROR XIIth
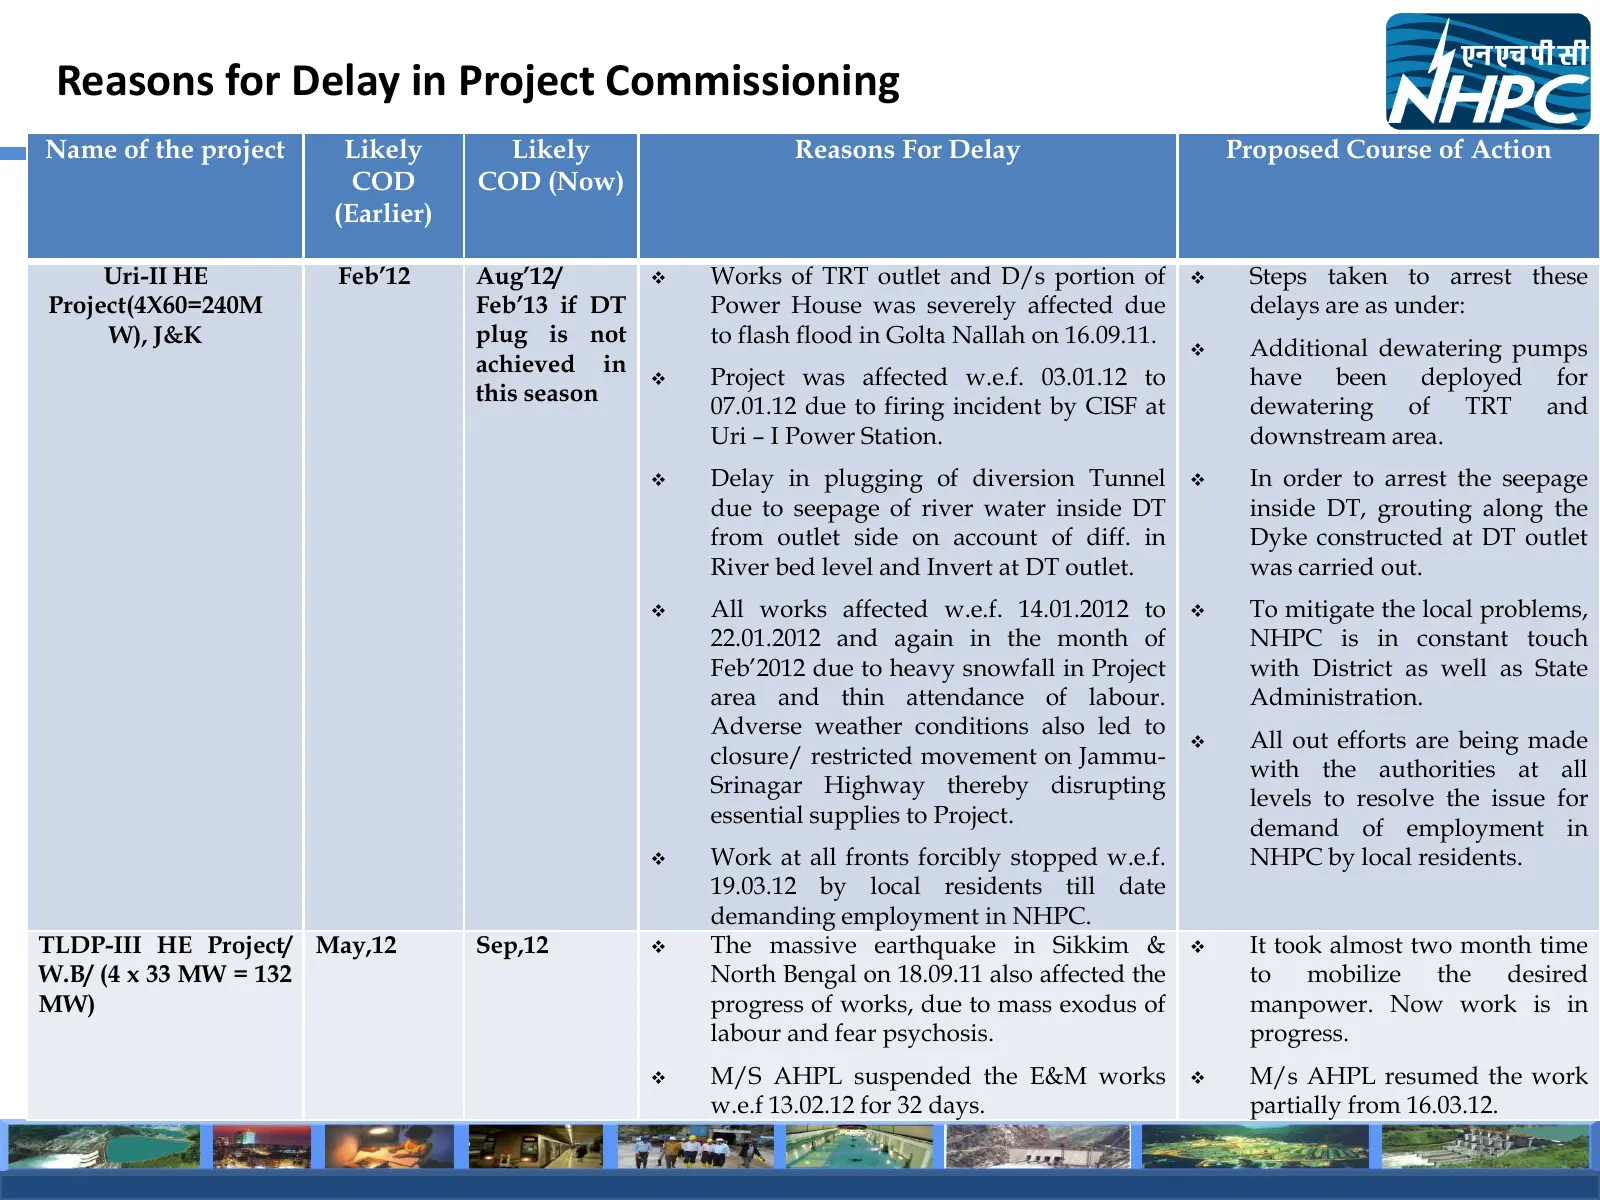
Slide 13: Reasons for Delay in Project Commissioning
Reasons for Delay in Project Commissioning Name of the project Likely Likely Reasons For Delay Proposed Course of Action COD COD (Now) (Earlier) Uri-II HE Feb’12 Aug’12/ Works of TRT outlet and D/s portion of Steps taken to arrest these Project(4X60=240M Feb’13 if DT Power House was severely aff
Slide 14: Reasons for Delay in Project Commissioning
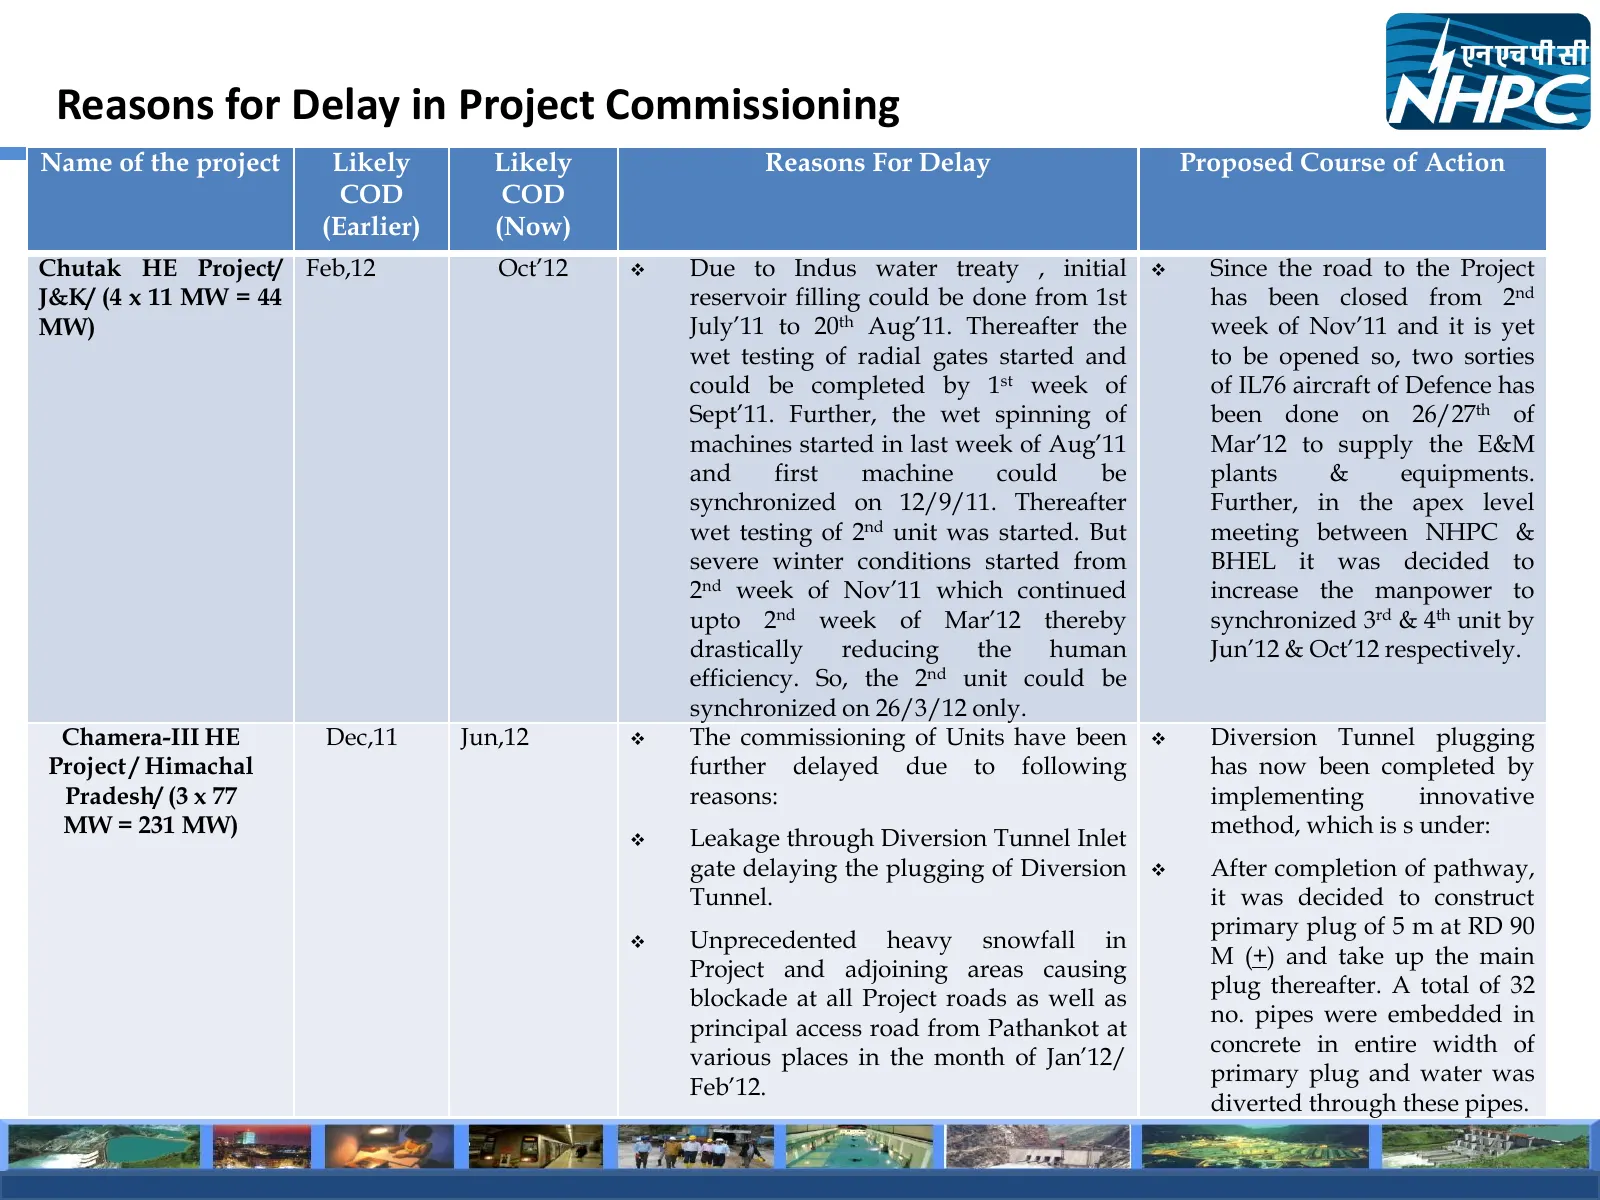
Reasons for Delay in Project Commissioning Name of the project Likely Likely Reasons For Delay Proposed Course of Action COD COD (Earlier) (Now) Chutak HE Project/ Feb,12 Oct’12 Due to Indus water treaty , initial Since the road to the Project J&K/ (4 x 11 MW = 44 reservoir filling could be done
Slide 15: Reasons for Delay in Project Commissioning
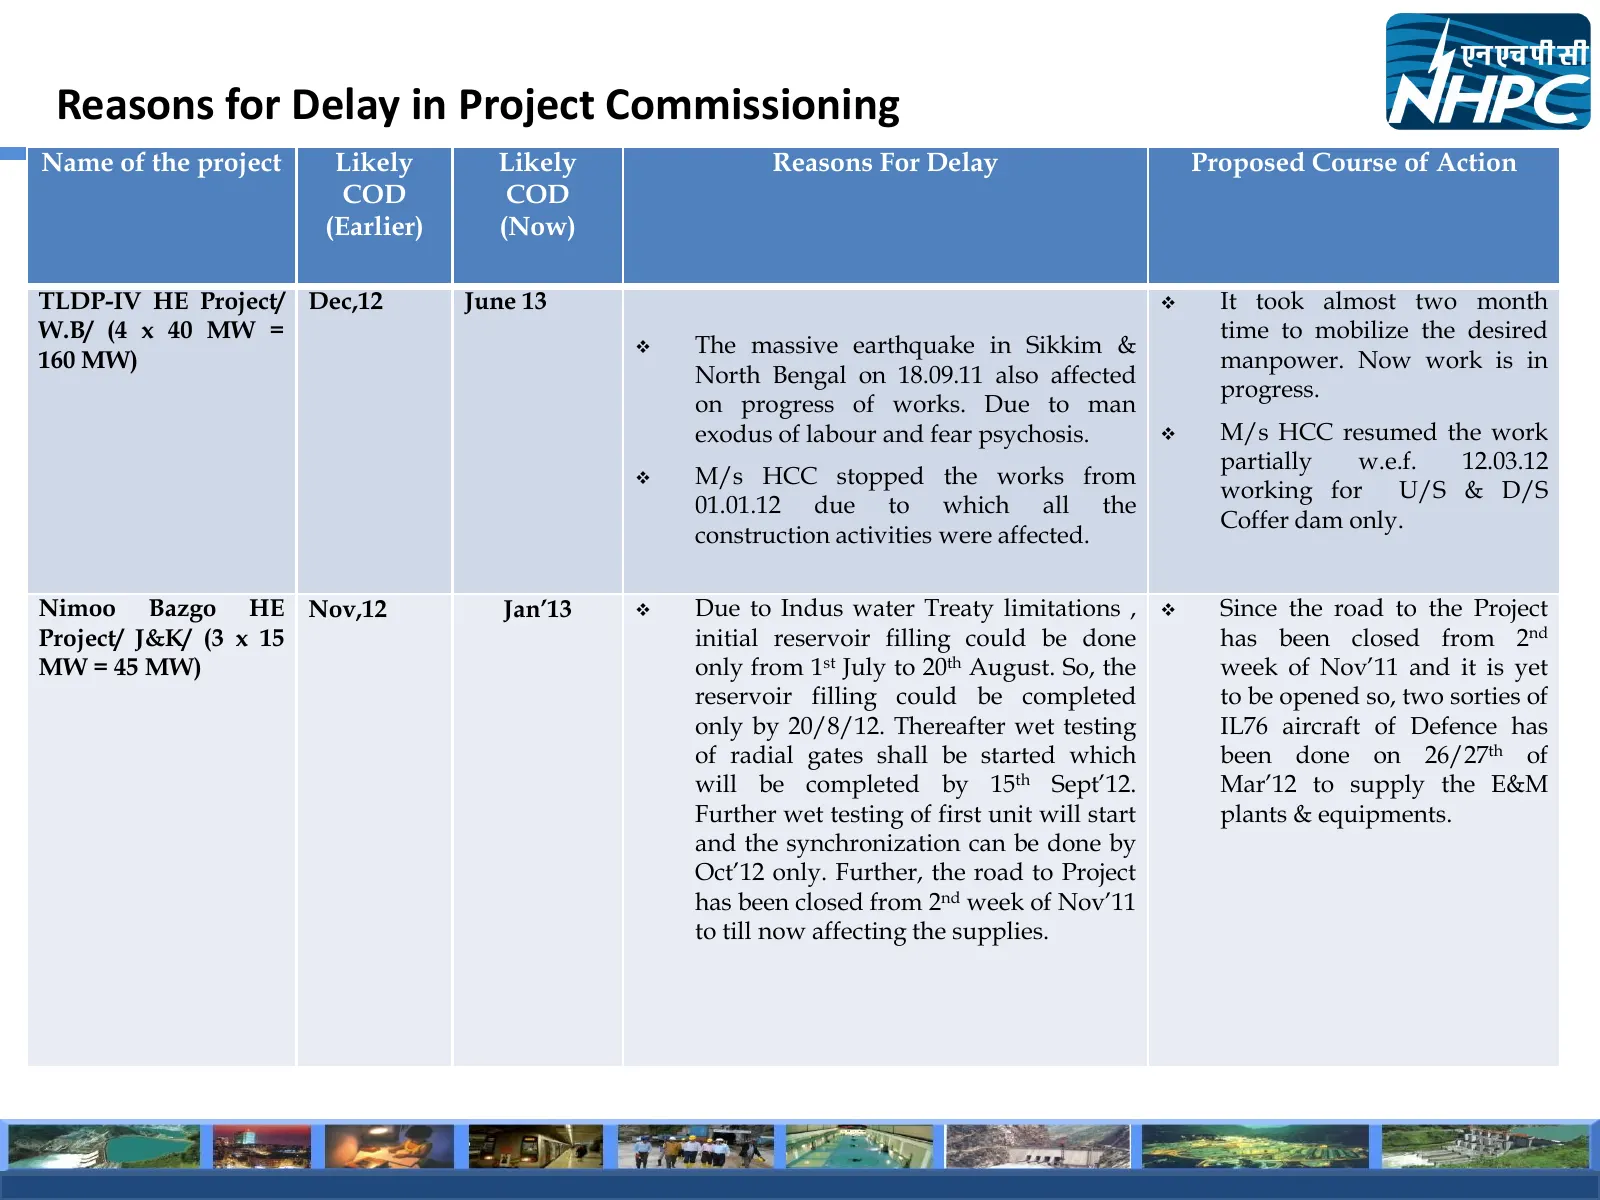
Reasons for Delay in Project Commissioning Name of the project Likely Likely Reasons For Delay Proposed Course of Action COD COD (Earlier) (Now) TLDP-IV HE Project/ Dec,12 June 13 It took almost two month W.B/ (4 x 40 MW = time to mobilize the desired The massive earthquake in Sikkim & 160 MW) m
Slide 16: Reasons for Delay in Project Commissioning
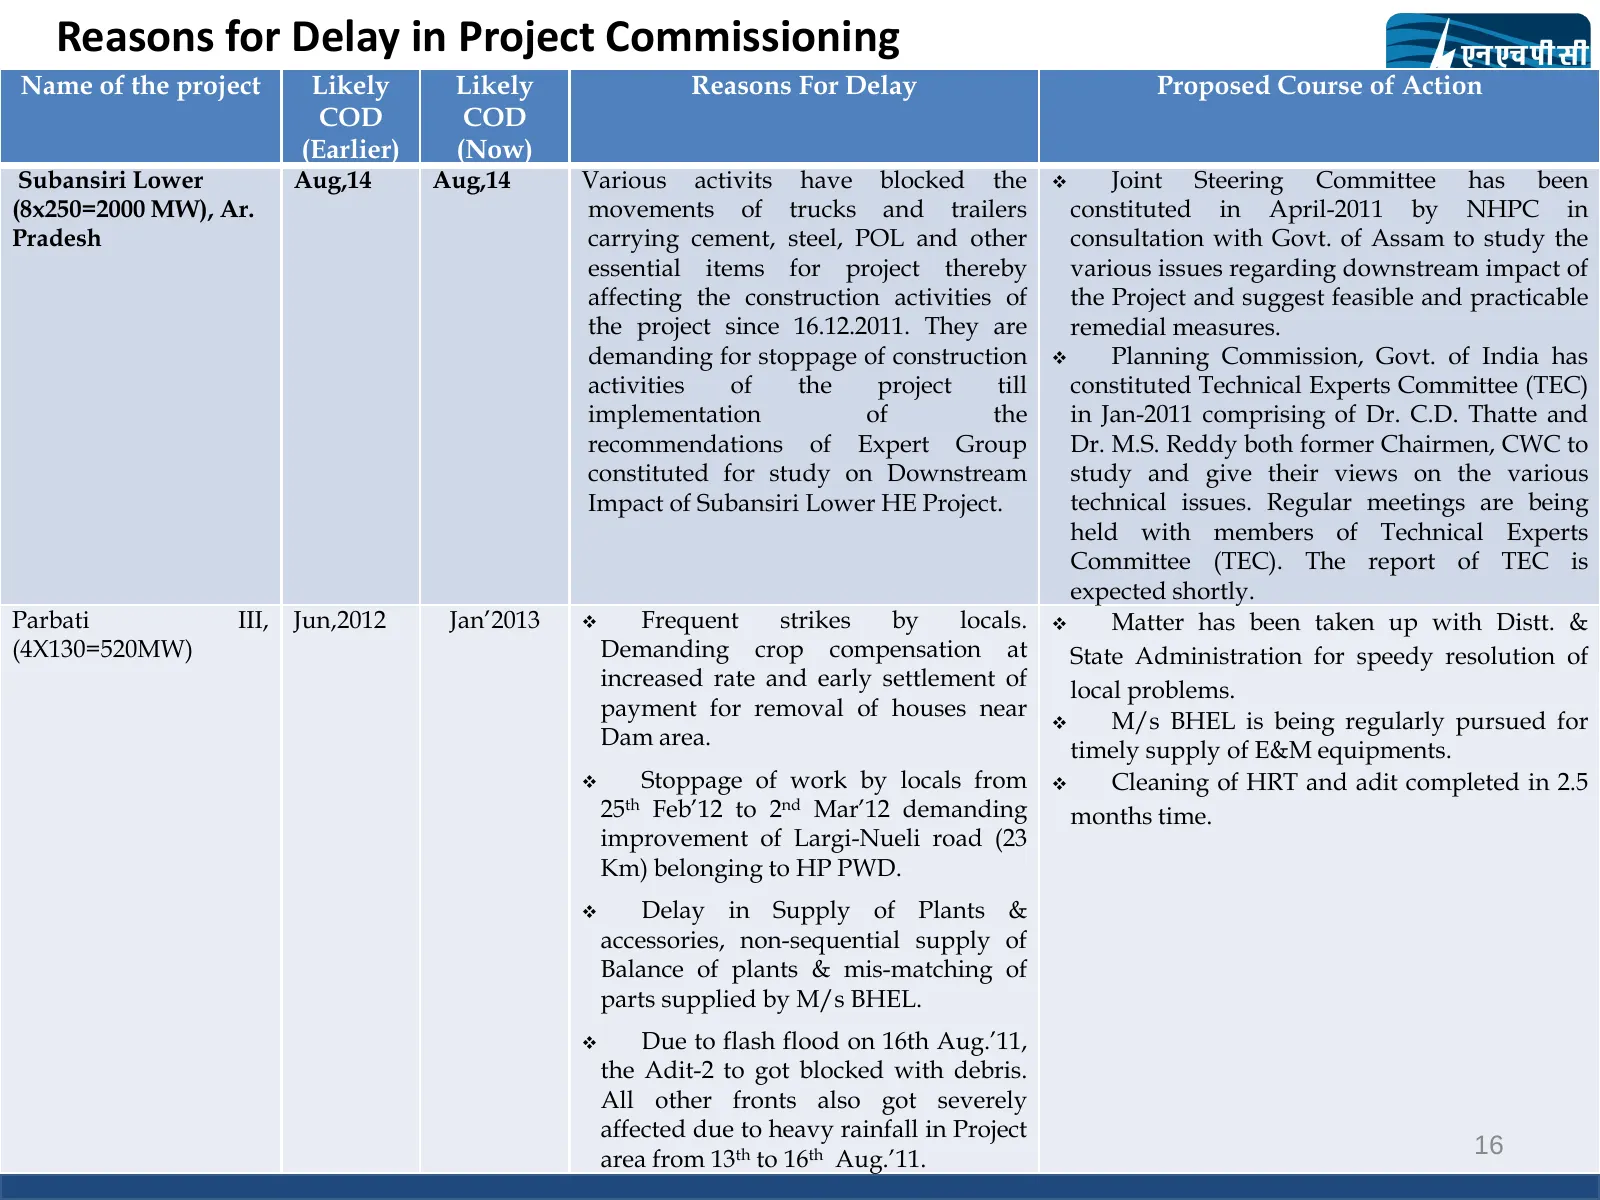
Reasons for Delay in Project Commissioning Name of the project Likely Likely Reasons For Delay Proposed Course of Action COD COD (Earlier) (Now) Subansiri Lower Aug,14 Aug,14 Various activits have blocked the Joint Steering Committee has been (8x250=2000 MW), Ar. movements of trucks and trailers c
Slide 17: Plan wise Capacity Addition
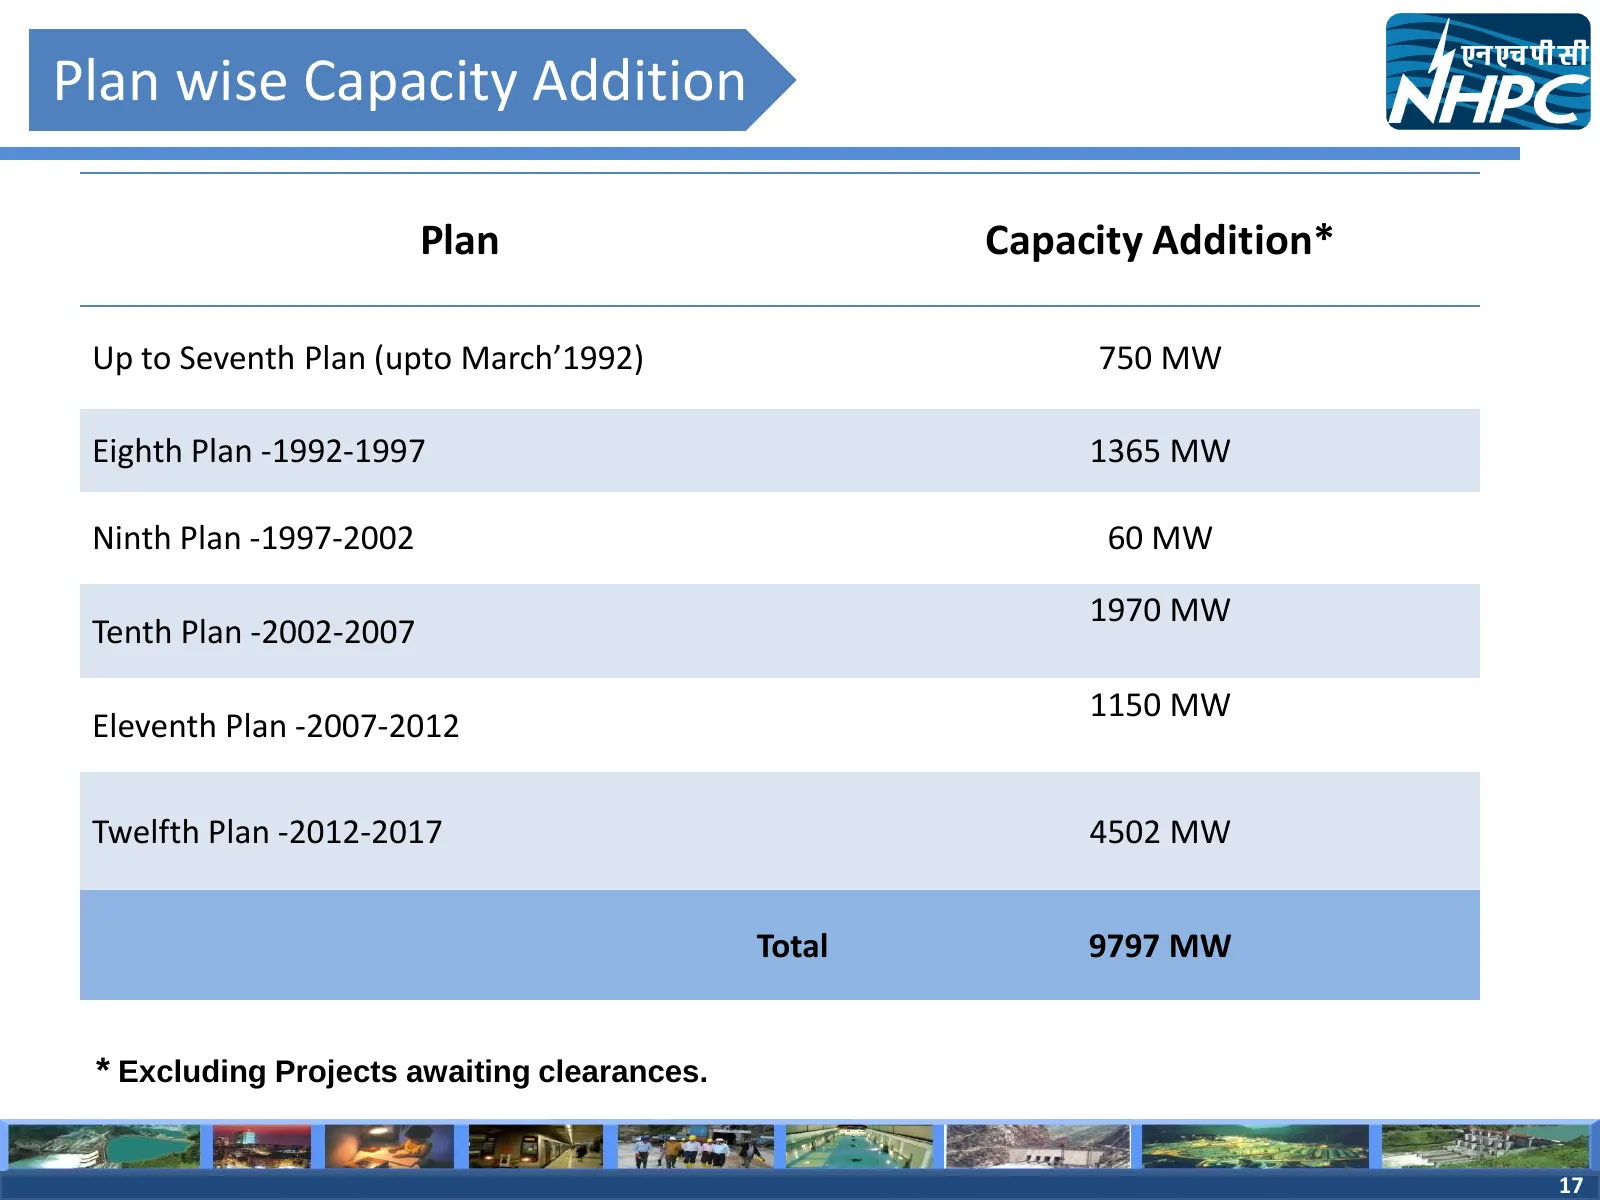
Plan wise Capacity Addition Plan Capacity Addition* Up to Seventh Plan (upto March’1992) 750 MW Eighth Plan -1992-1997 1365 MW Ninth Plan -1997-2002 60 MW 1970 MW Tenth Plan -2002-2007 1150 MW Eleventh Plan -2007-2012 Twelfth Plan -2012-2017 4502 MW Total 9797 MW * Excluding Projects awaiting cleara
Slide 18: Significant Expansion Plans
Significant Expansion Plans 18
Slide 19: Major Subsidiary/Joint Ventures
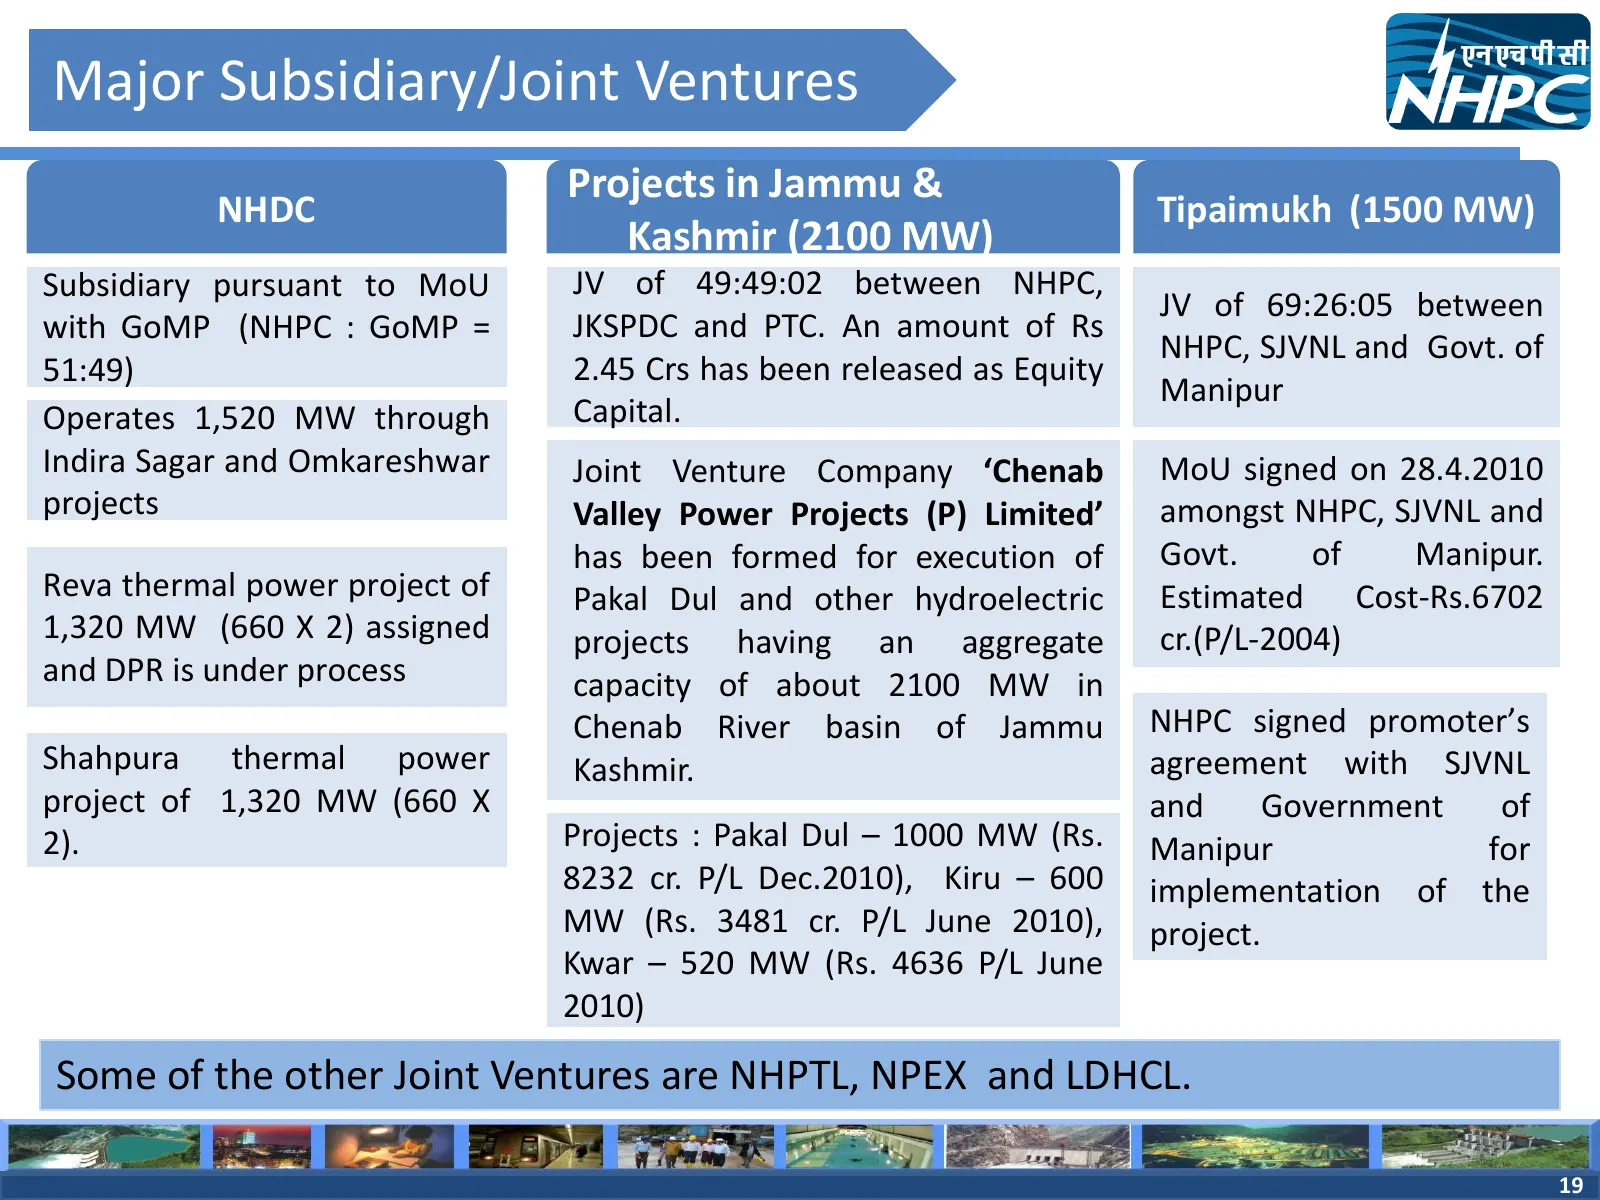
Major Subsidiary/Joint Ventures Projects in Jammu & NHDC Tipaimukh (1500 MW) Kashmir (2100 MW) Subsidiary pursuant to MoU JV of 49:49:02 between NHPC, JV of 69:26:05 between with GoMP (NHPC : GoMP = JKSPDC and PTC. An amount of Rs NHPC, SJVNL and Govt. of 51:49) 2.45 Crs has been released as Equity
Slide 20: Additional 11,286 MW in the Pipeline
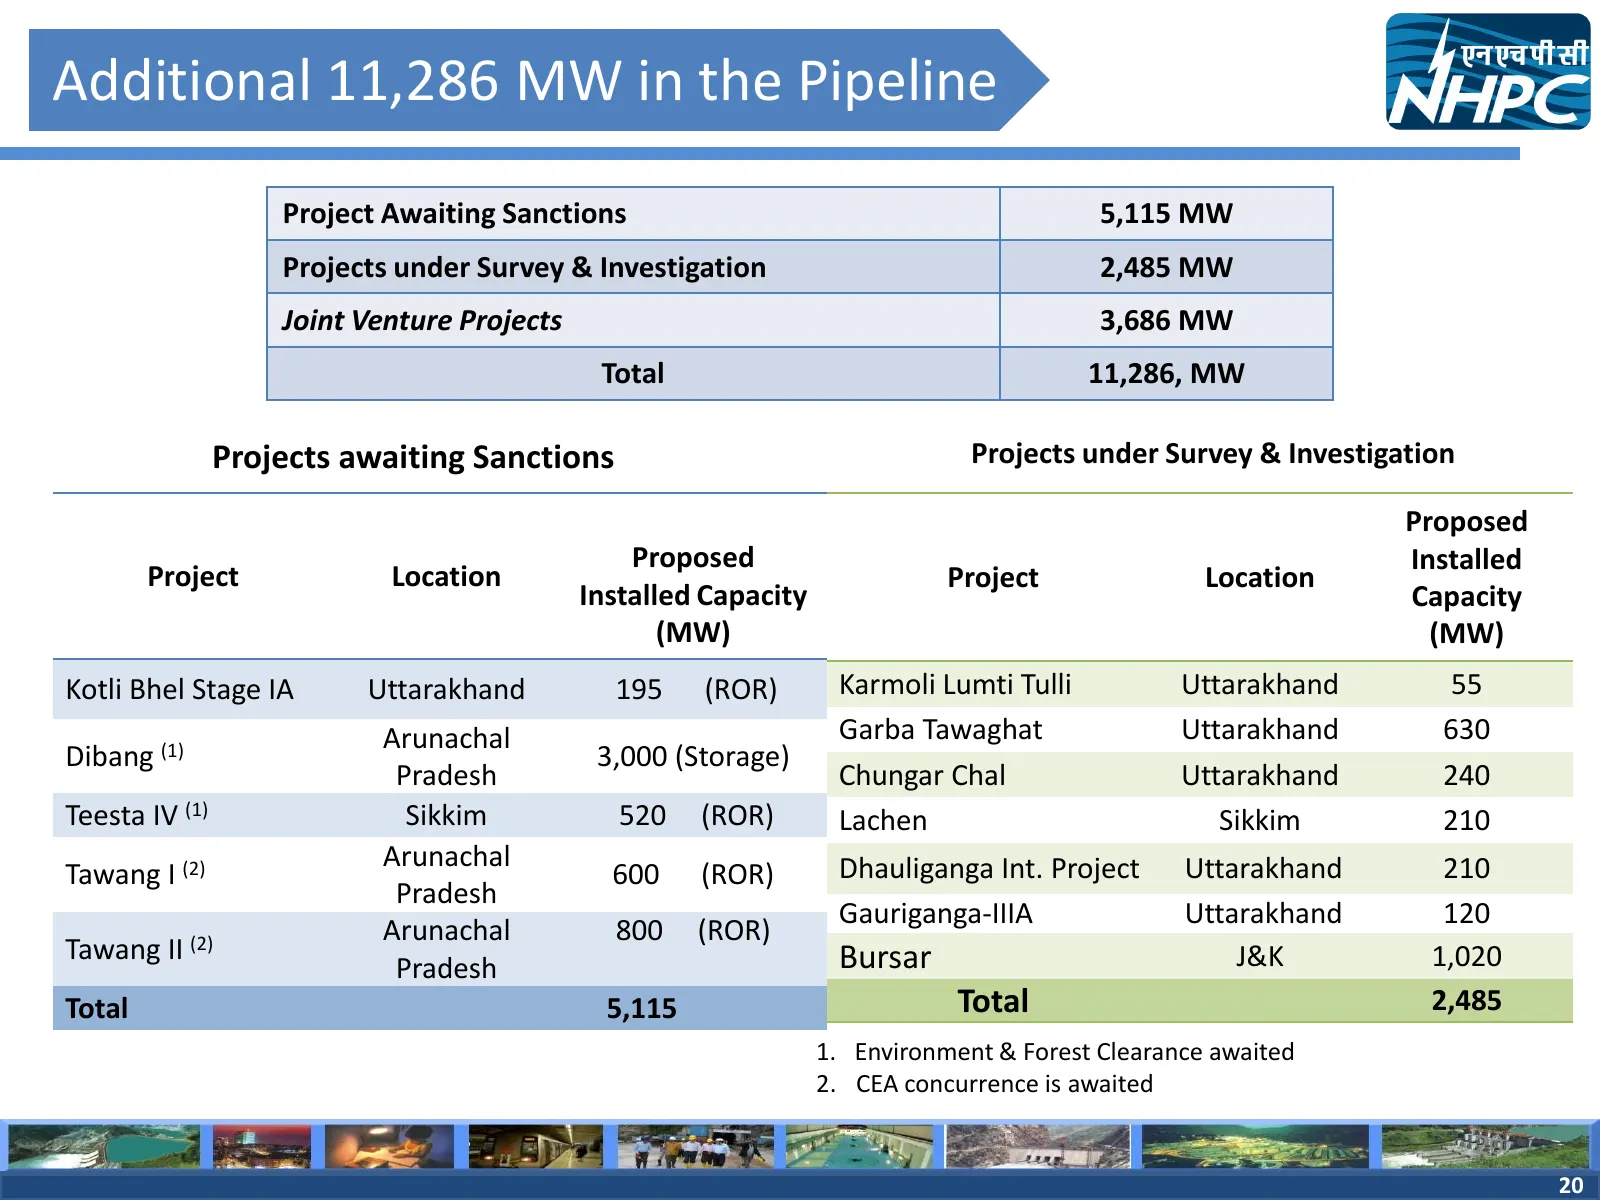
Additional 11,286 MW in the Pipeline Project Awaiting Sanctions 5,115 MW Projects under Survey & Investigation 2,485 MW Joint Venture Projects 3,686 MW Total 11,286, MW Projects awaiting Sanctions Projects under Survey & Investigation Proposed Proposed Installed Project Location Project Location Ins
Slide 21: Additional 11,286 MW in the Pipeline
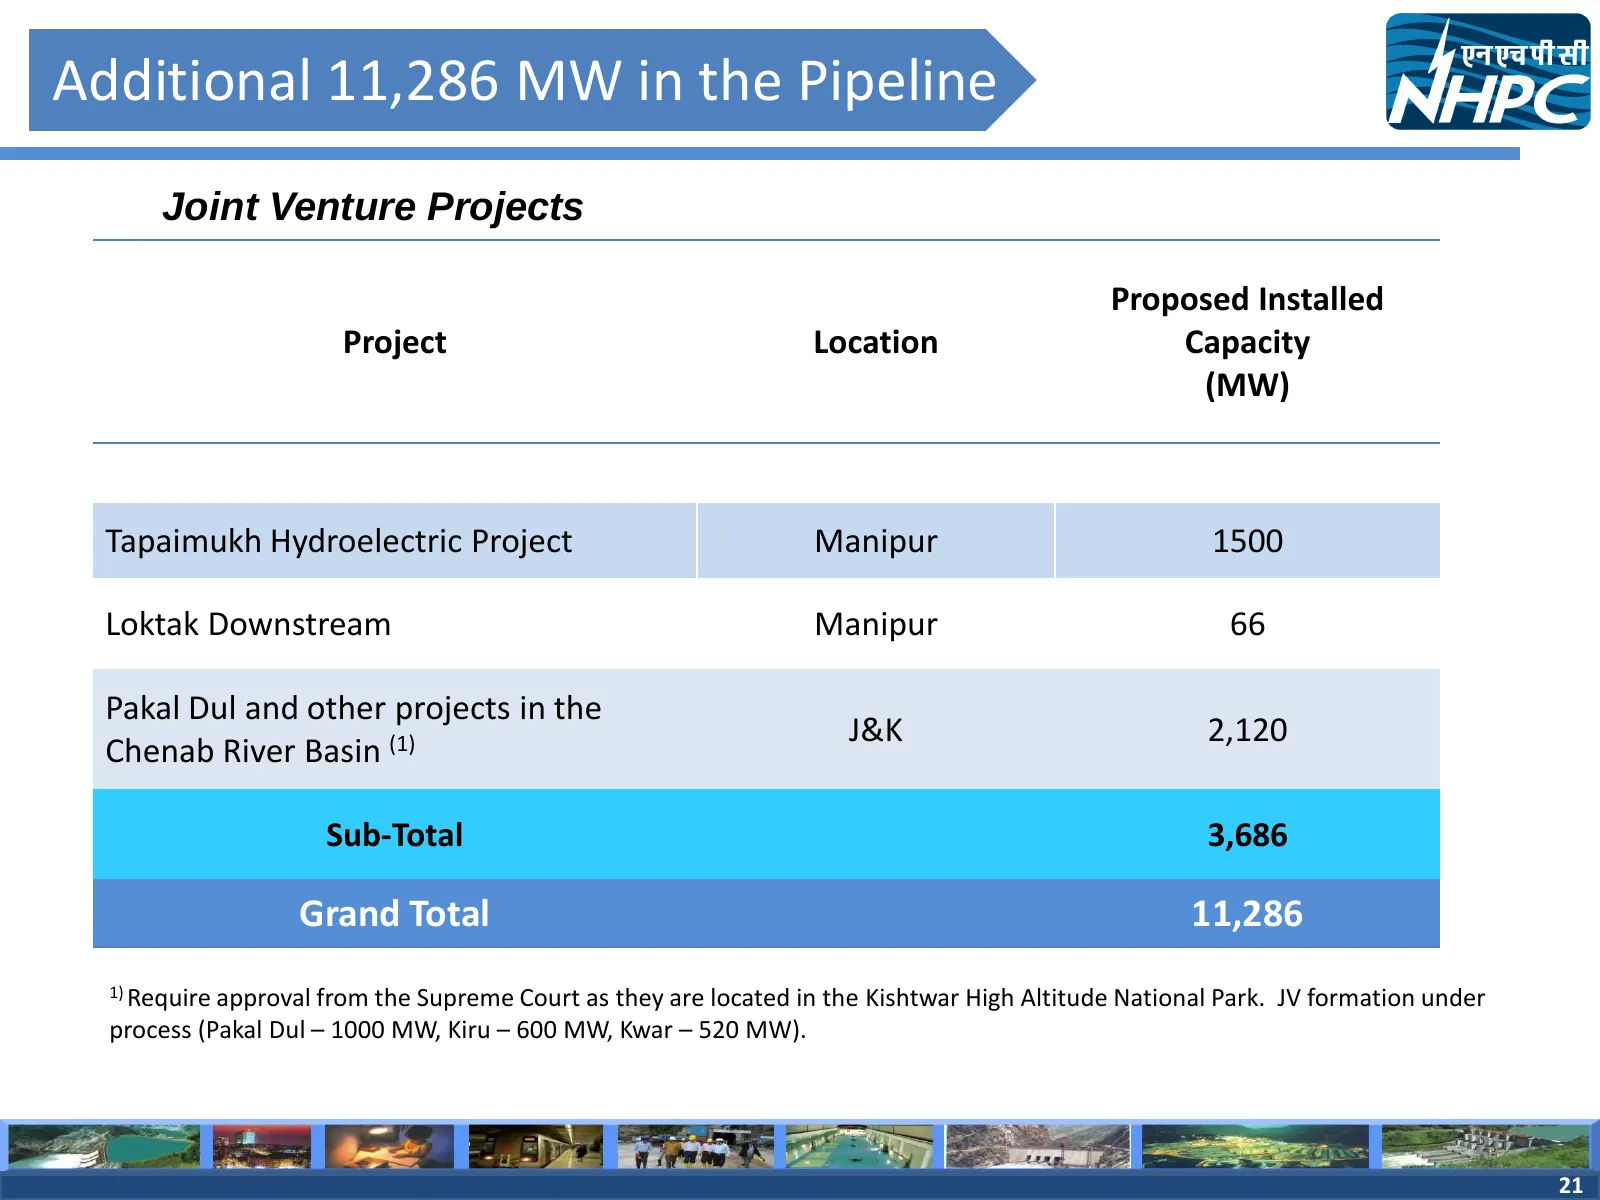
Additional 11,286 MW in the Pipeline Joint Venture Projects Proposed Installed Project Location Capacity (MW) Tapaimukh Hydroelectric Project Manipur 1500 Loktak Downstream Manipur 66 Pakal Dul and other projects in the J&K 2,120 Chenab River Basin (1) Sub-Total 3,686 Grand Total 11,286 1) Require a
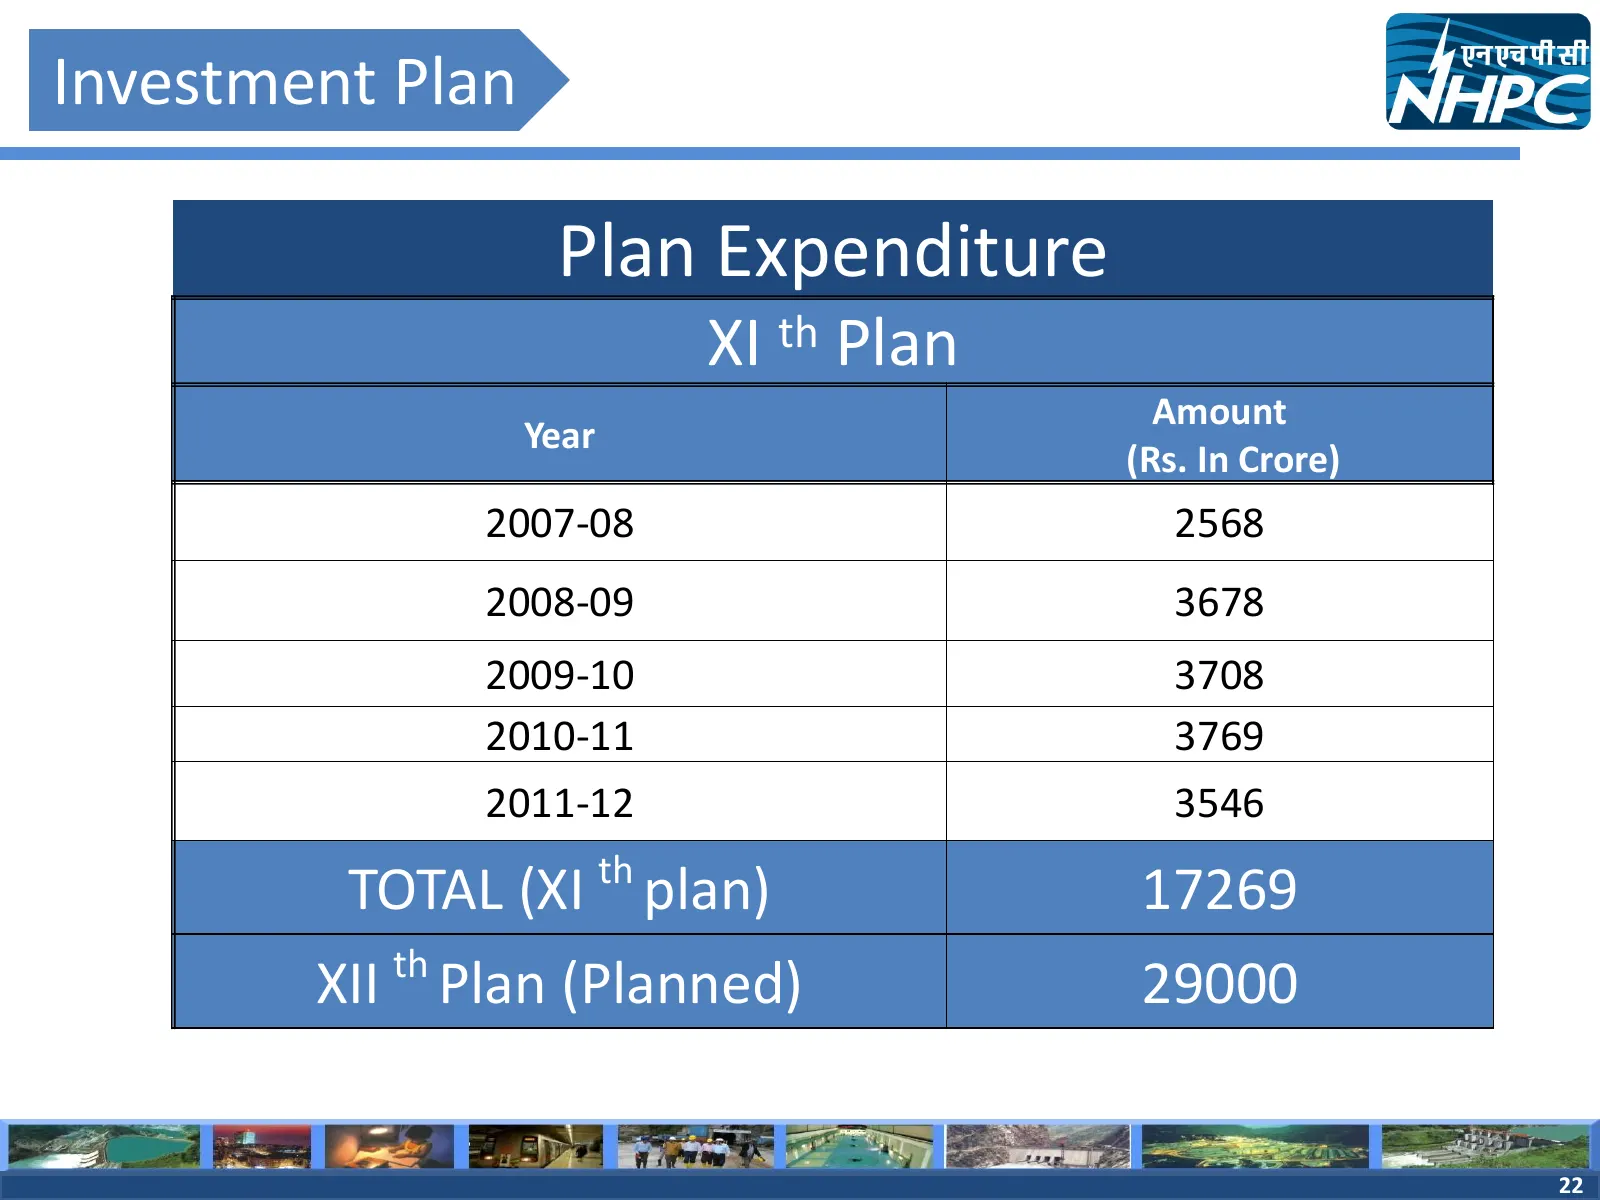
Slide 22: Plan Expenditure
Investment Plan Plan Expenditure XI th Plan Amount Year (Rs. In Crore) 2007-08 2568 2008-09 3678 2009-10 3708 2010-11 3769 2011-12 3546 TOTAL (XI th plan) 17269 XII th Plan (Planned) 29000 22 22

Slide 23: Performance Highlights
Performance Highlights 23
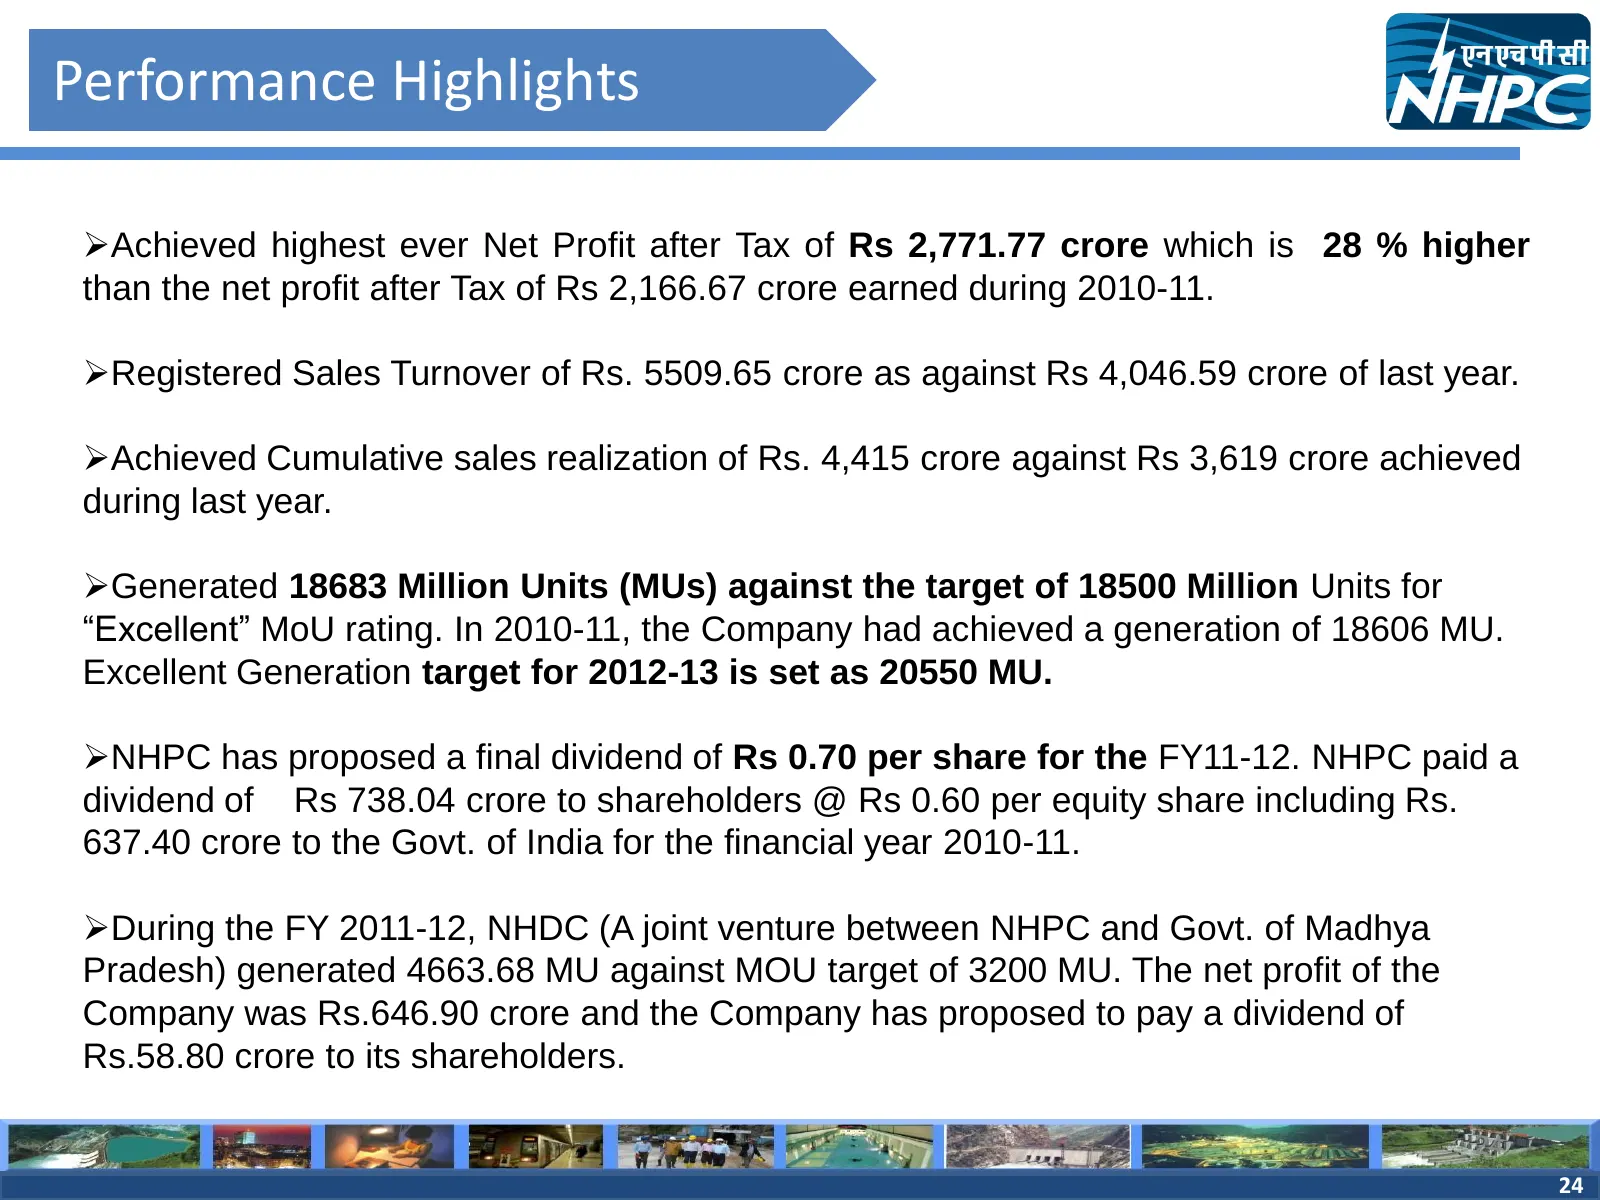
Slide 24: Performance Highlights
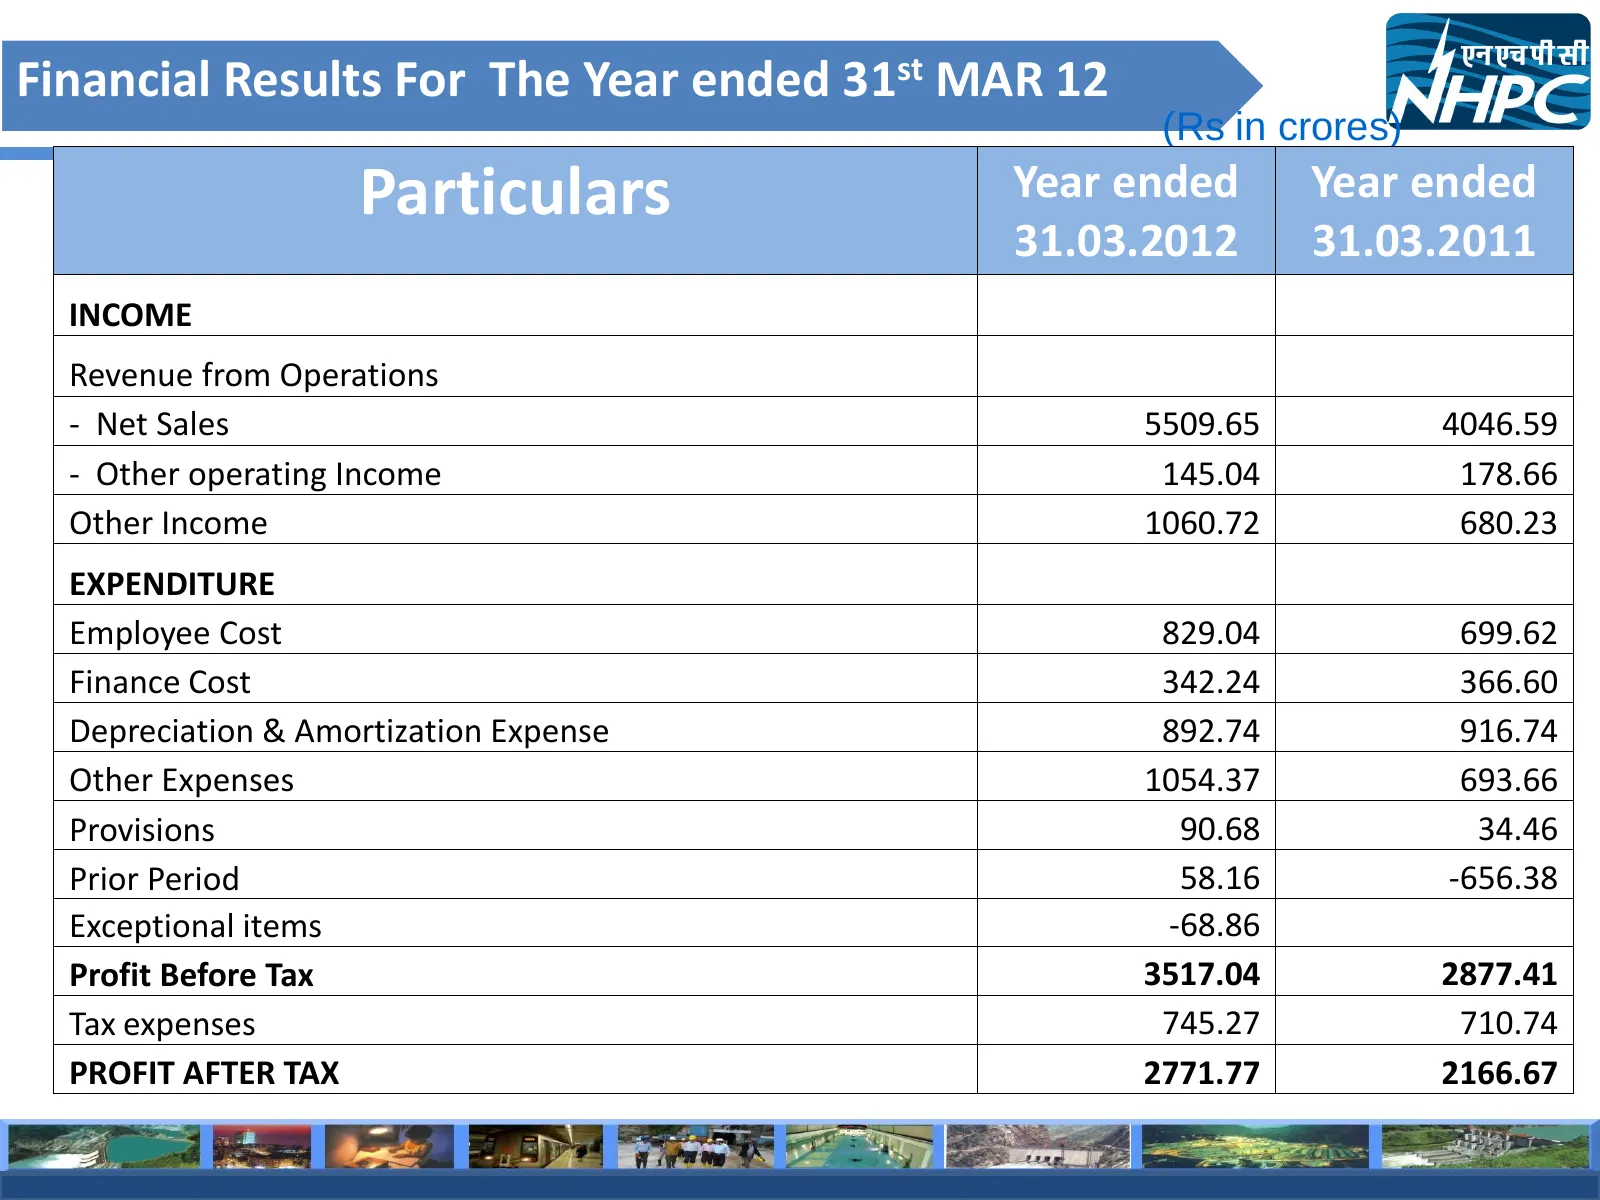
Performance Highlights Achieved highest ever Net Profit after Tax of Rs 2,771.77 crore which is 28 % higher than the net profit after Tax of Rs 2,166.67 crore earned during 2010-11. Registered Sales Turnover of Rs. 5509.65 crore as against Rs 4,046.59 crore of last year. Achieved Cumulative sales
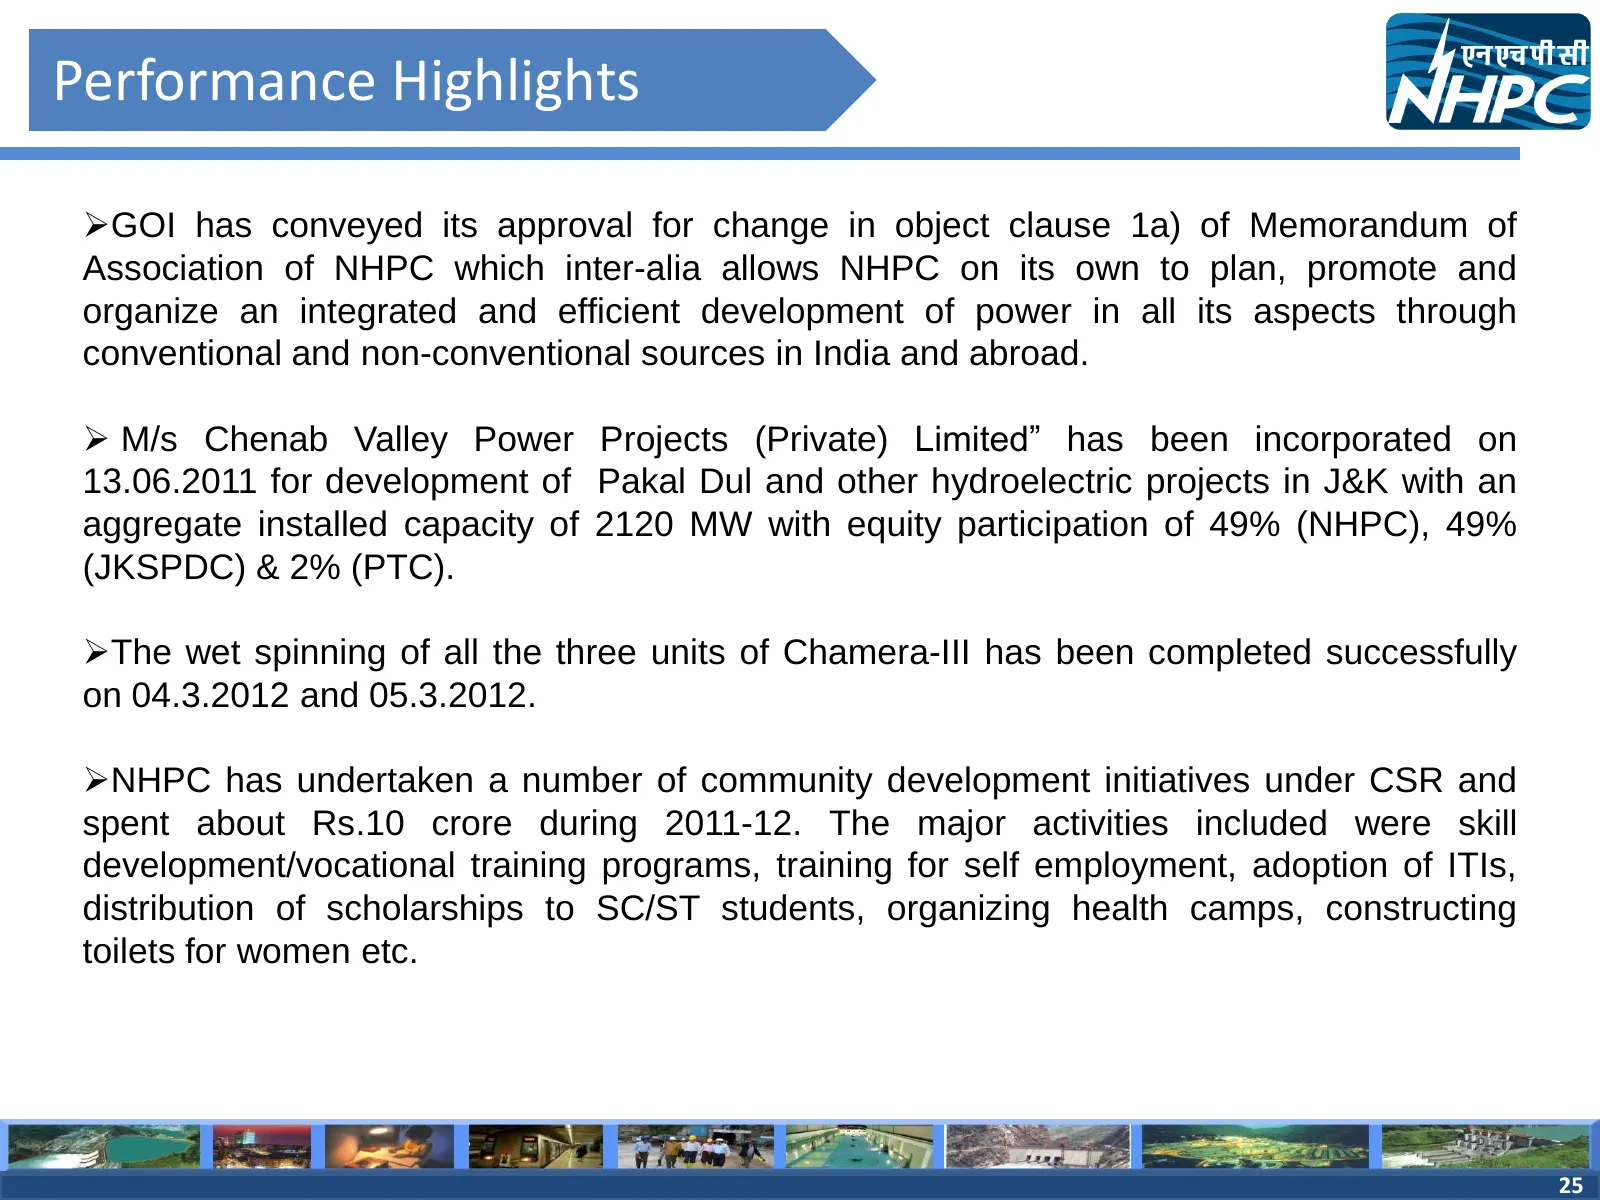
Slide 25: Performance Highlights
Performance Highlights GOI has conveyed its approval for change in object clause 1a) of Memorandum of Association of NHPC which inter-alia allows NHPC on its own to plan, promote and organize an integrated and efficient development of power in all its aspects through conventional and non-convention
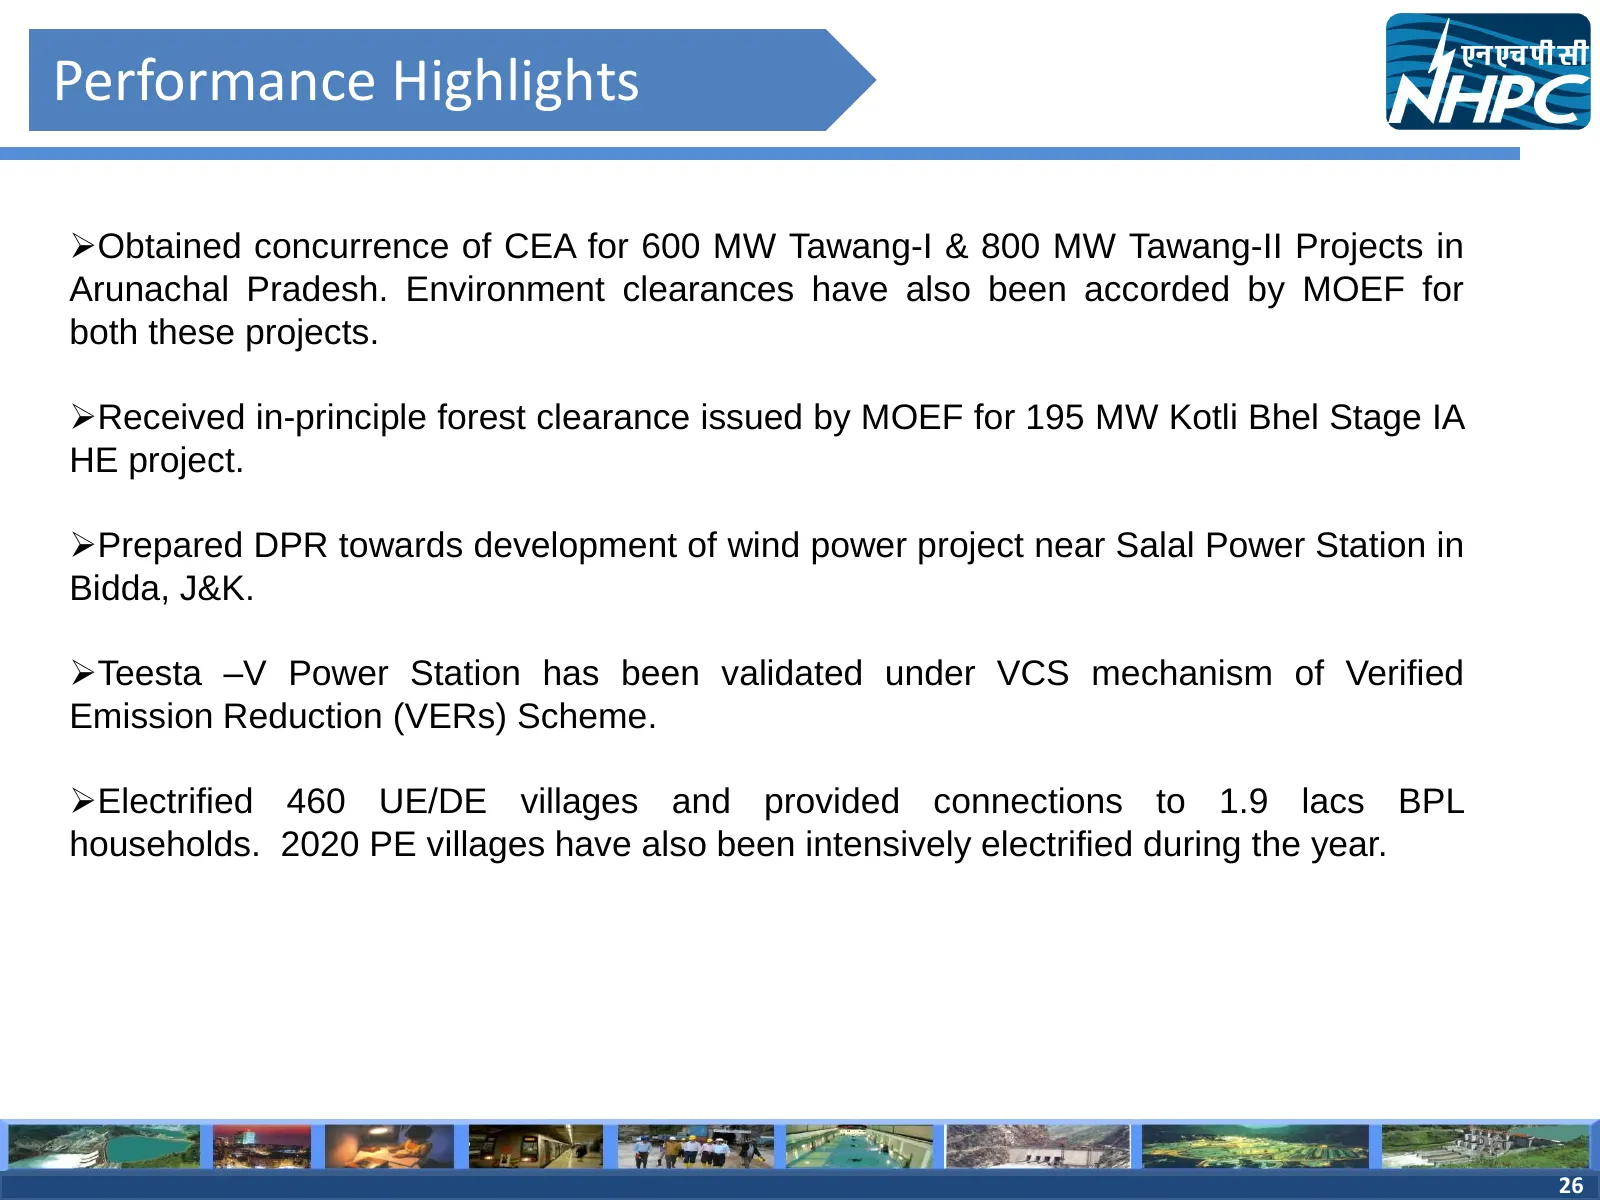
Slide 26: Performance Highlights
Performance Highlights Obtained concurrence of CEA for 600 MW Tawang-I & 800 MW Tawang-II Projects in Arunachal Pradesh. Environment clearances have also been accorded by MOEF for both these projects. Received in-principle forest clearance issued by MOEF for 195 MW Kotli Bhel Stage IA HE project.

Slide 27: Financial Highlights
Financial Highlights 27
Slide 28: Financial Results For The Year ended 31st March
Financial Results For The Year ended 31st MAR 12 (Rs in crores) Particulars Year ended Year ended 31.03.2012 31.03.2011 INCOME Revenue from Operations - Net Sales 5509.65 4046.59 - Other operating Income 145.04 178.66 Other Income 1060.72 680.23 EXPENDITURE Employee Cost 829.04 699.62 Finance Cost 3
Slide 29: Reasons for Change in Income
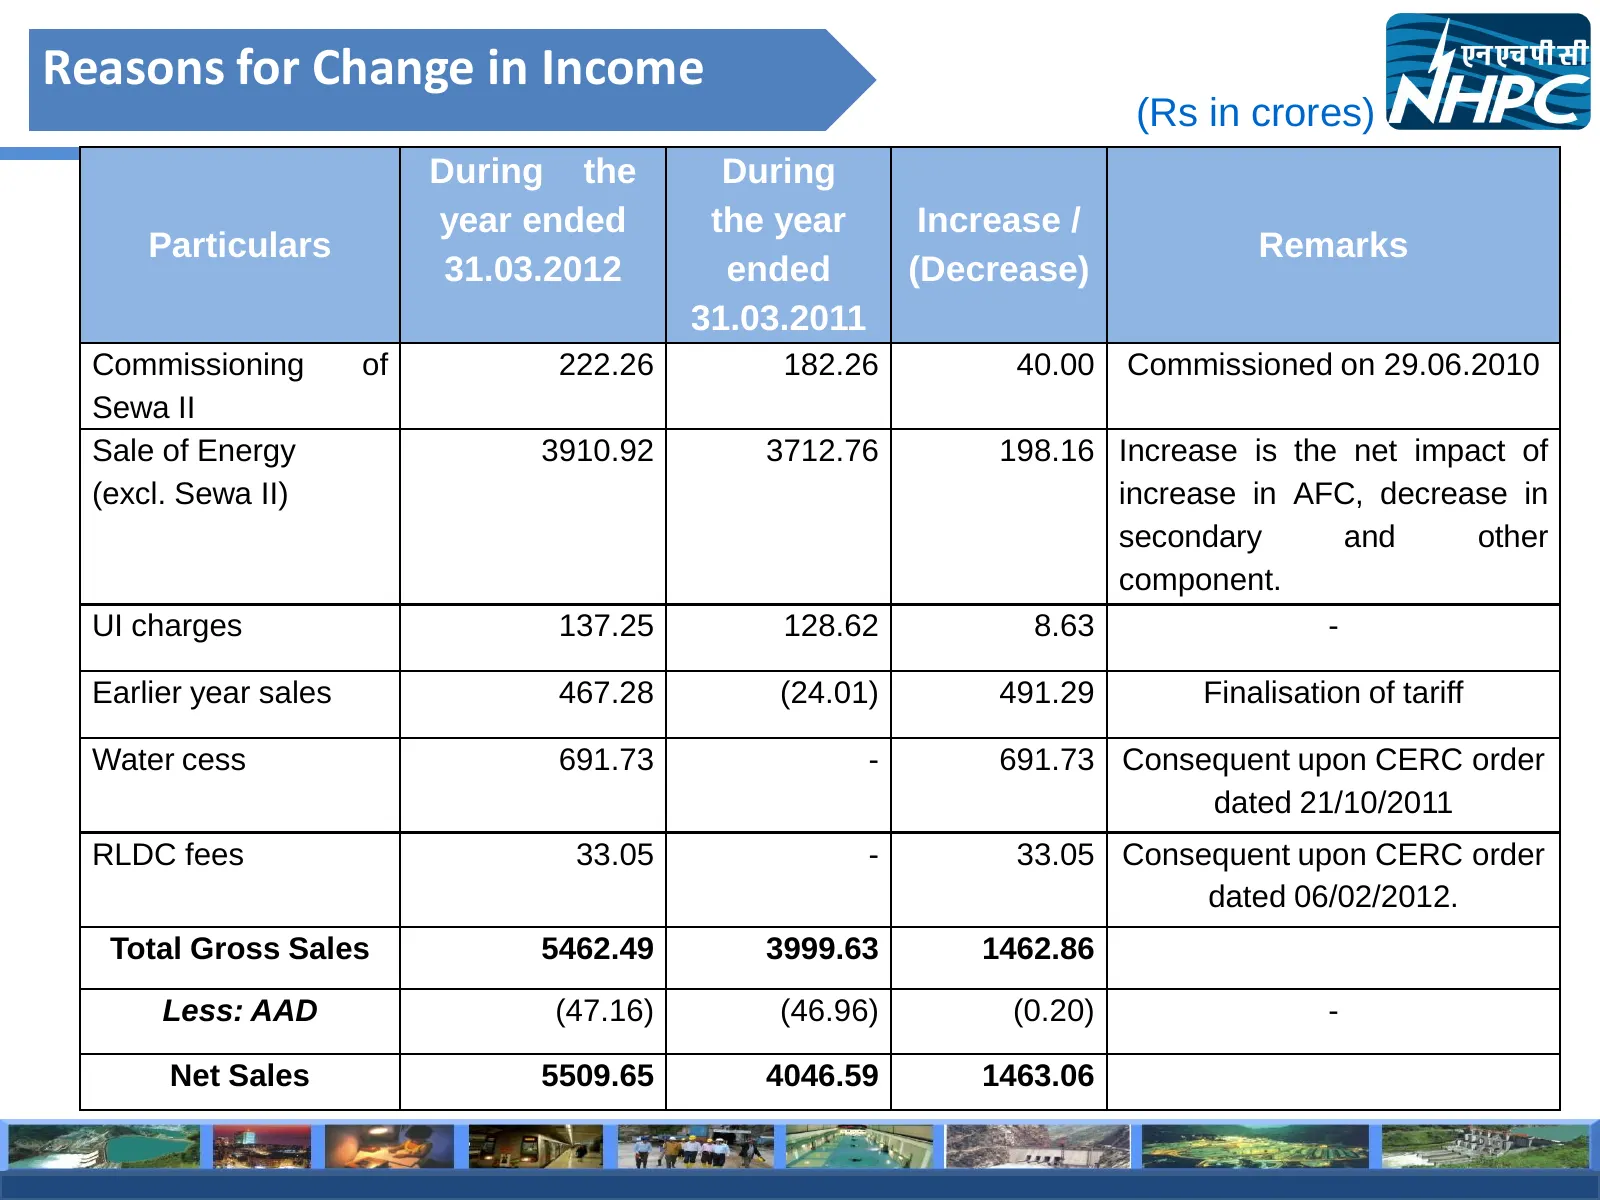
Reasons for Change in Income (Rs in crores) During the During year ended the year Increase / Particulars Remarks 31.03.2012 ended (Decrease) 31.03.2011 Commissioning of 222.26 182.26 40.00 Commissioned on 29.06.2010 Sewa II Sale of Energy 3910.92 3712.76 198.16 Increase is the net impact of (excl. S
Slide 30: Reasons for increase of Other Income
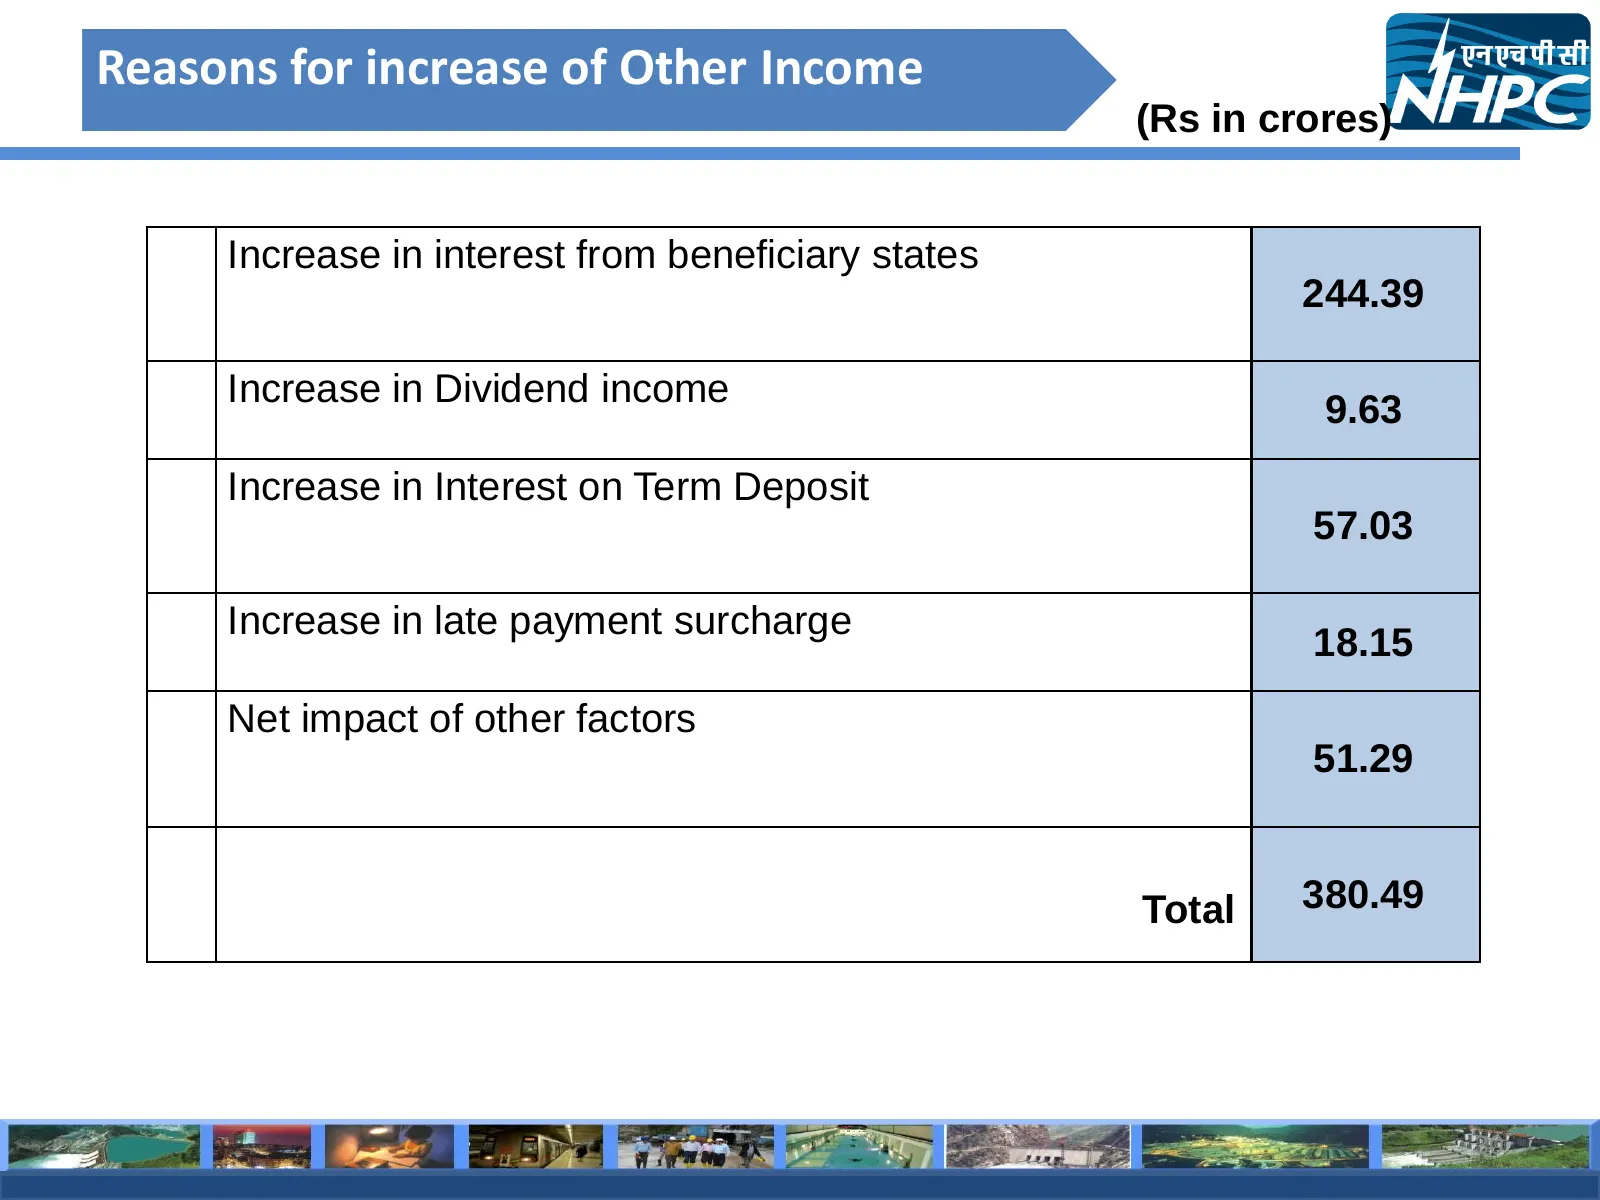
Reasons for increase of Other Income (Rs in crores) Increase in interest from beneficiary states 244.39 Increase in Dividend income 9.63 Increase in Interest on Term Deposit 57.03 Increase in late payment surcharge 18.15 Net impact of other factors 51.29 Total 380.49 30
Slide 31: Major Factors for Increase in Profits
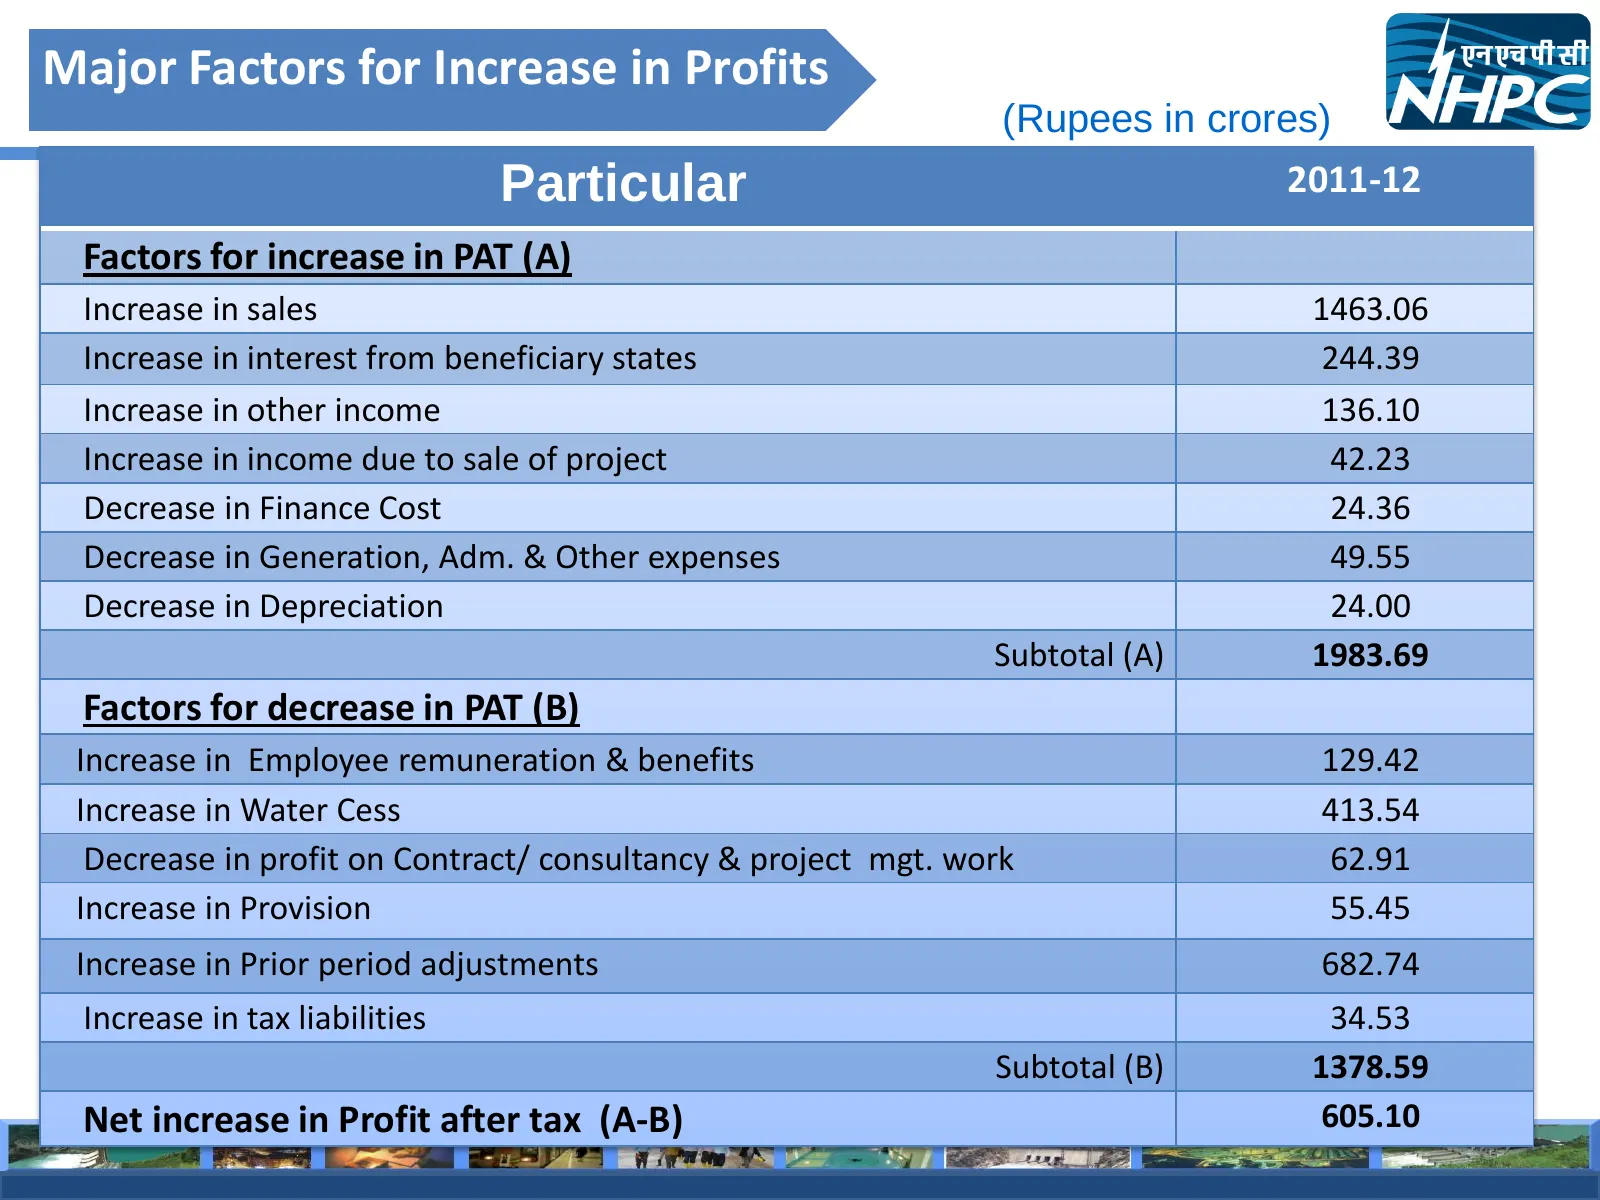
Major Factors for Increase in Profits (Rupees in crores) Particular 2011-12 Factors for increase in PAT (A) Increase in sales 1463.06 Increase in interest from beneficiary states 244.39 Increase in other income 136.10 Increase in income due to sale of project 42.23 Decrease in Finance Cost 24.36 Dec
Slide 32: Highlights of Financial Items
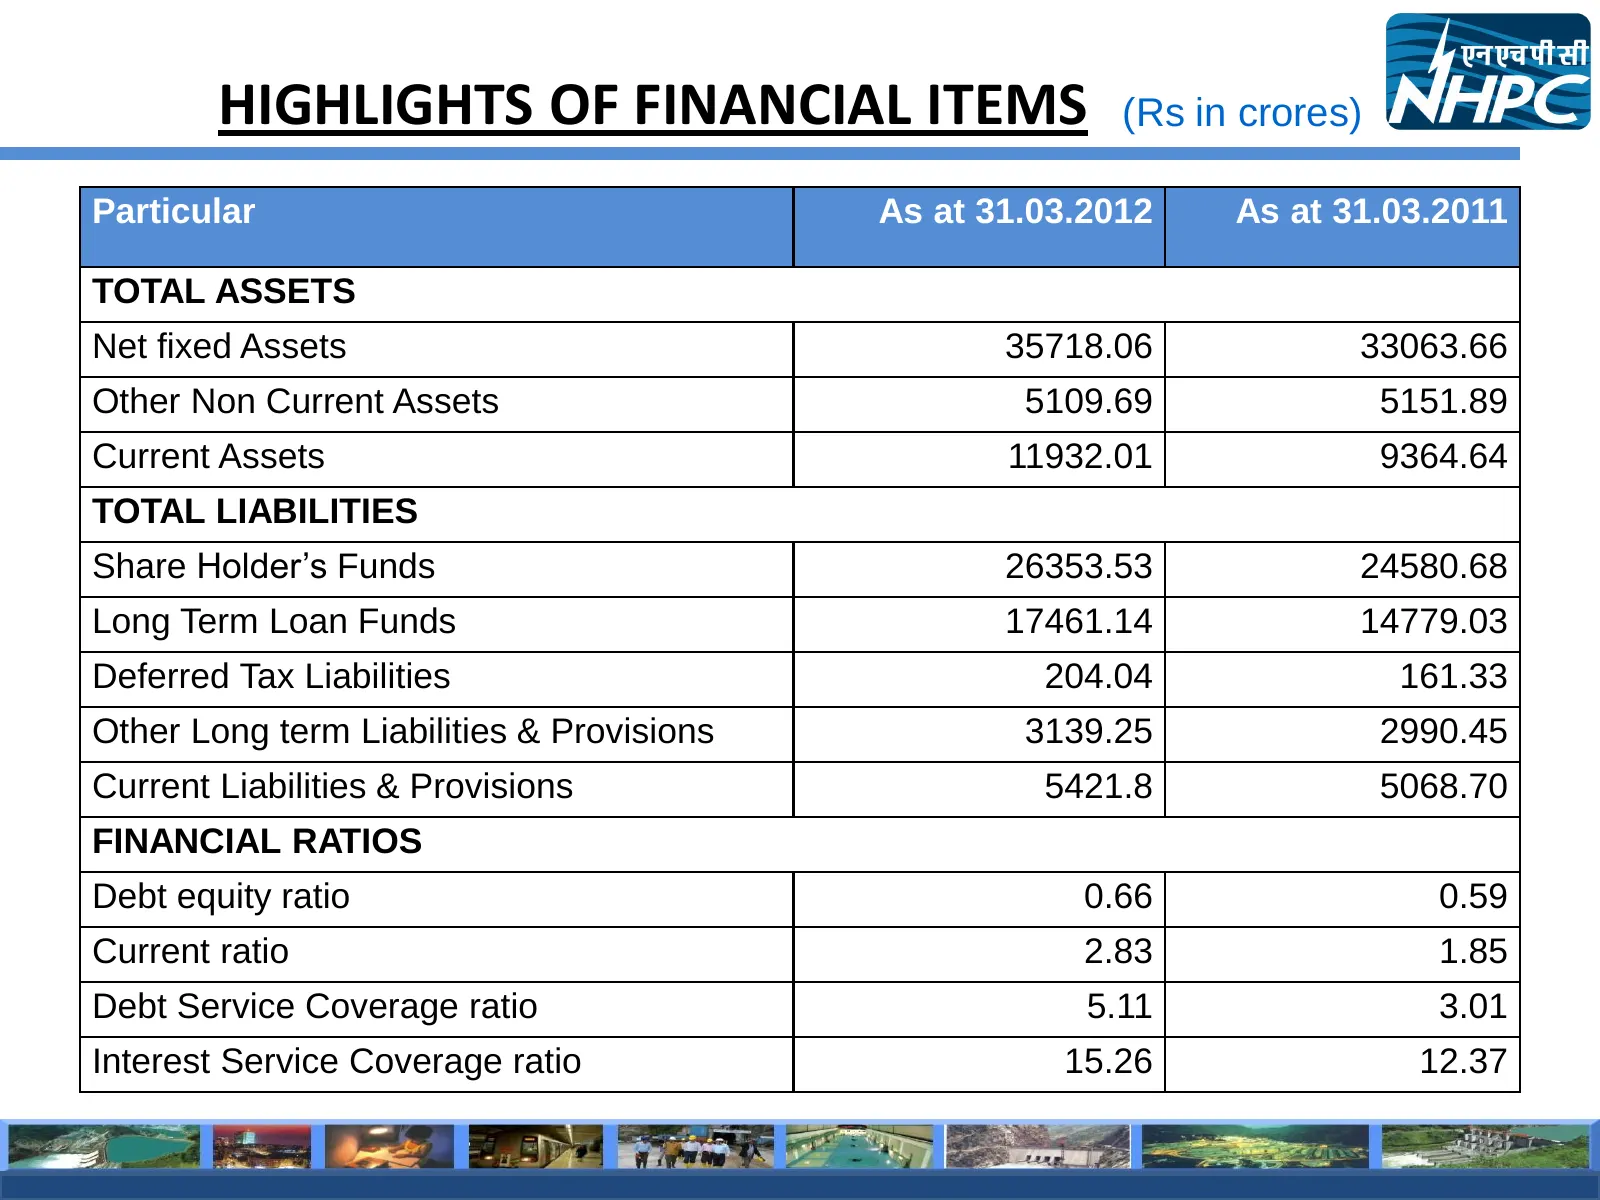
HIGHLIGHTS OF FINANCIAL ITEMS (Rs in crores) Particular As at 31.03.2012 As at 31.03.2011 TOTAL ASSETS Net fixed Assets 35718.06 33063.66 Other Non Current Assets 5109.69 5151.89 Current Assets 11932.01 9364.64 TOTAL LIABILITIES Share Holder’s Funds 26353.53 24580.68 Long Term Loan Funds 17461.14 14
Slide 33: Details of Incentives, Secondary Energy & UI Charges
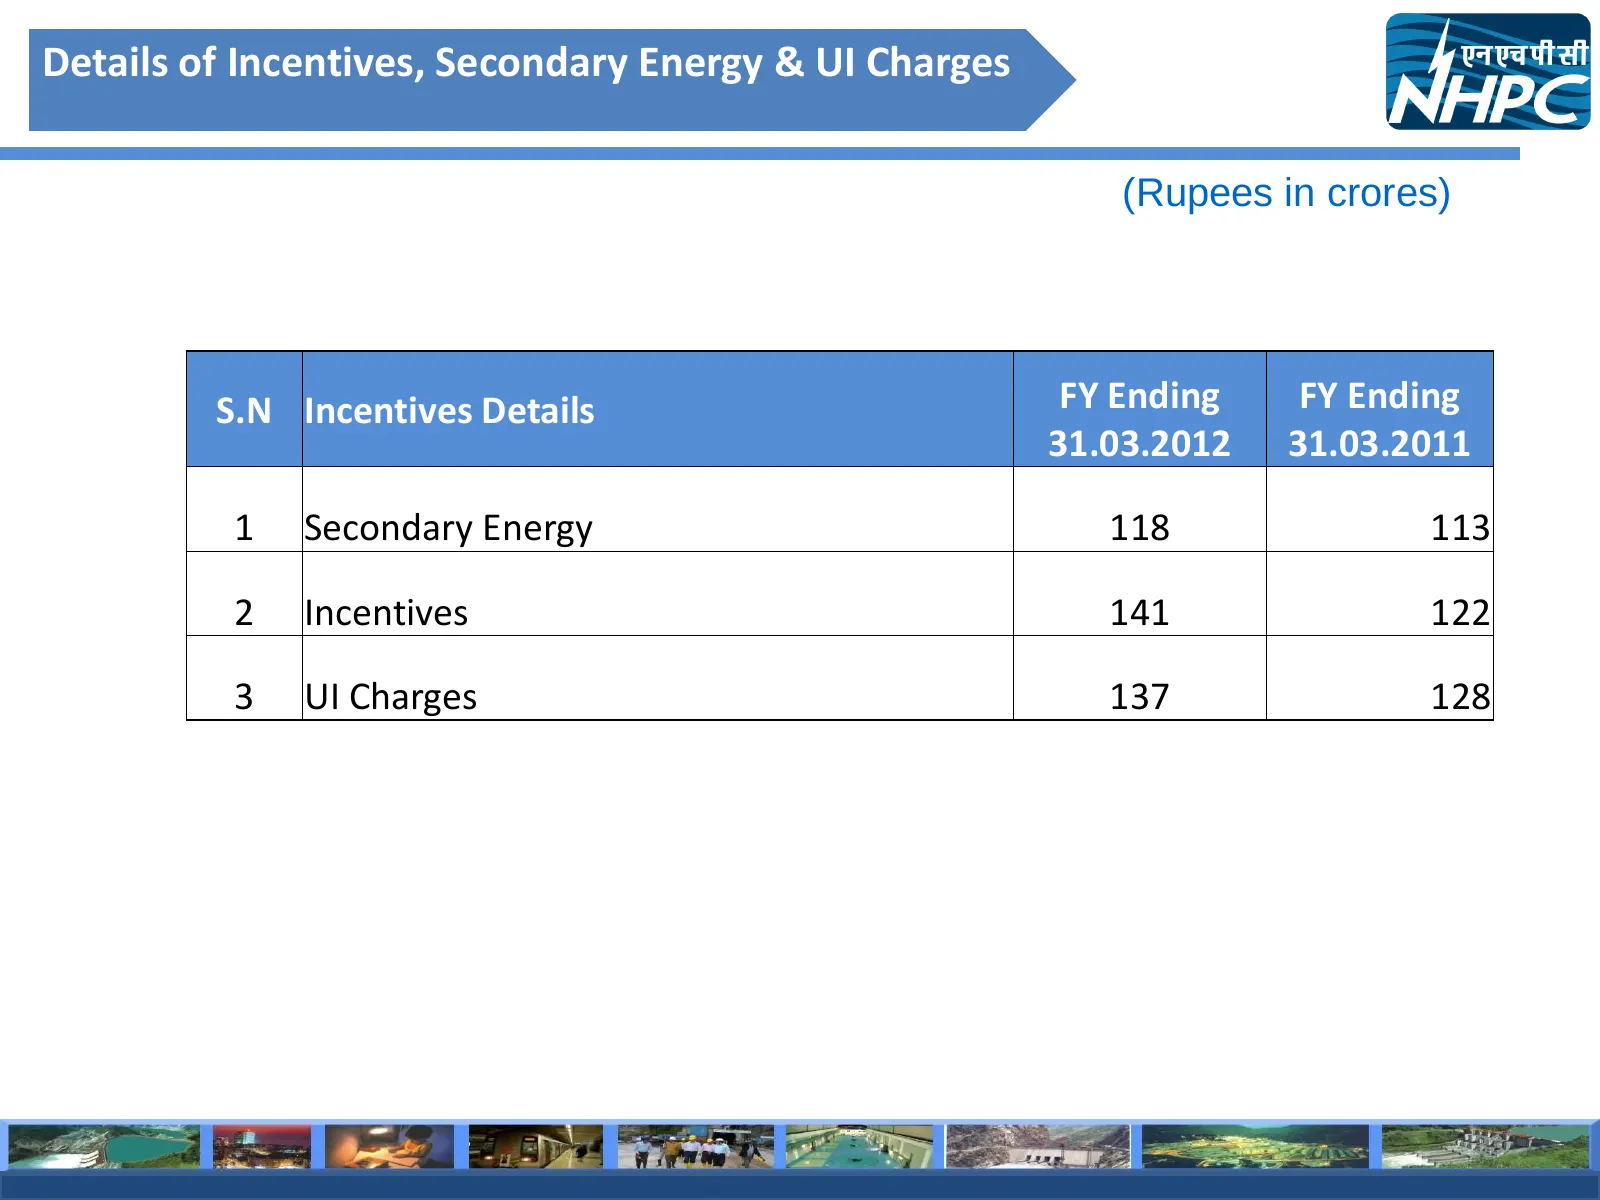
Details of Incentives, Secondary Energy & UI Charges (Rupees in crores) S.N Incentives Details FY Ending FY Ending 31.03.2012 31.03.2011 1 Secondary Energy 118 113 2 Incentives 141 122 3 UI Charges 137 128 33
Slide 34: Financial Results For The Q-4 ended 31st March
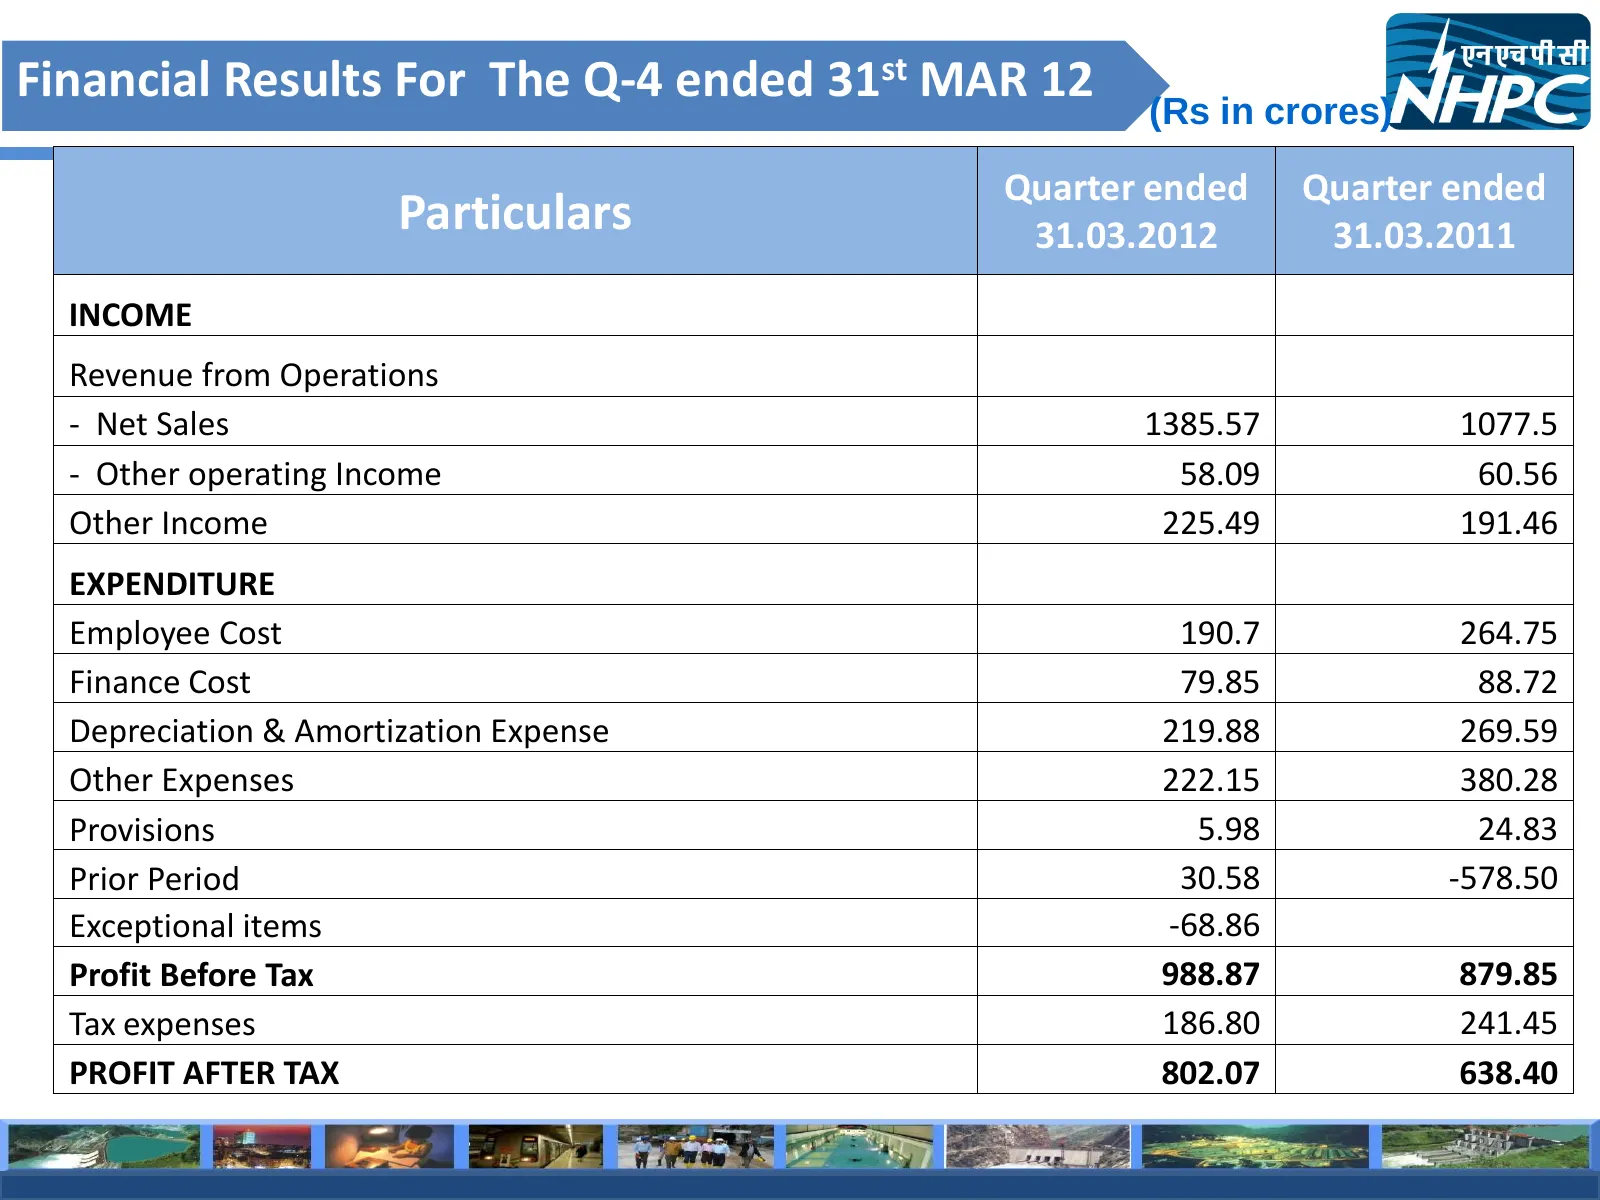
Financial Results For The Q-4 ended 31st MAR 12 (Rs in crores) Quarter ended Quarter ended Particulars 31.03.2012 31.03.2011 INCOME Revenue from Operations - Net Sales 1385.57 1077.5 - Other operating Income 58.09 60.56 Other Income 225.49 191.46 EXPENDITURE Employee Cost 190.7 264.75 Finance Cost 7
Slide 35: Major Factors for Increase in Profits Q4
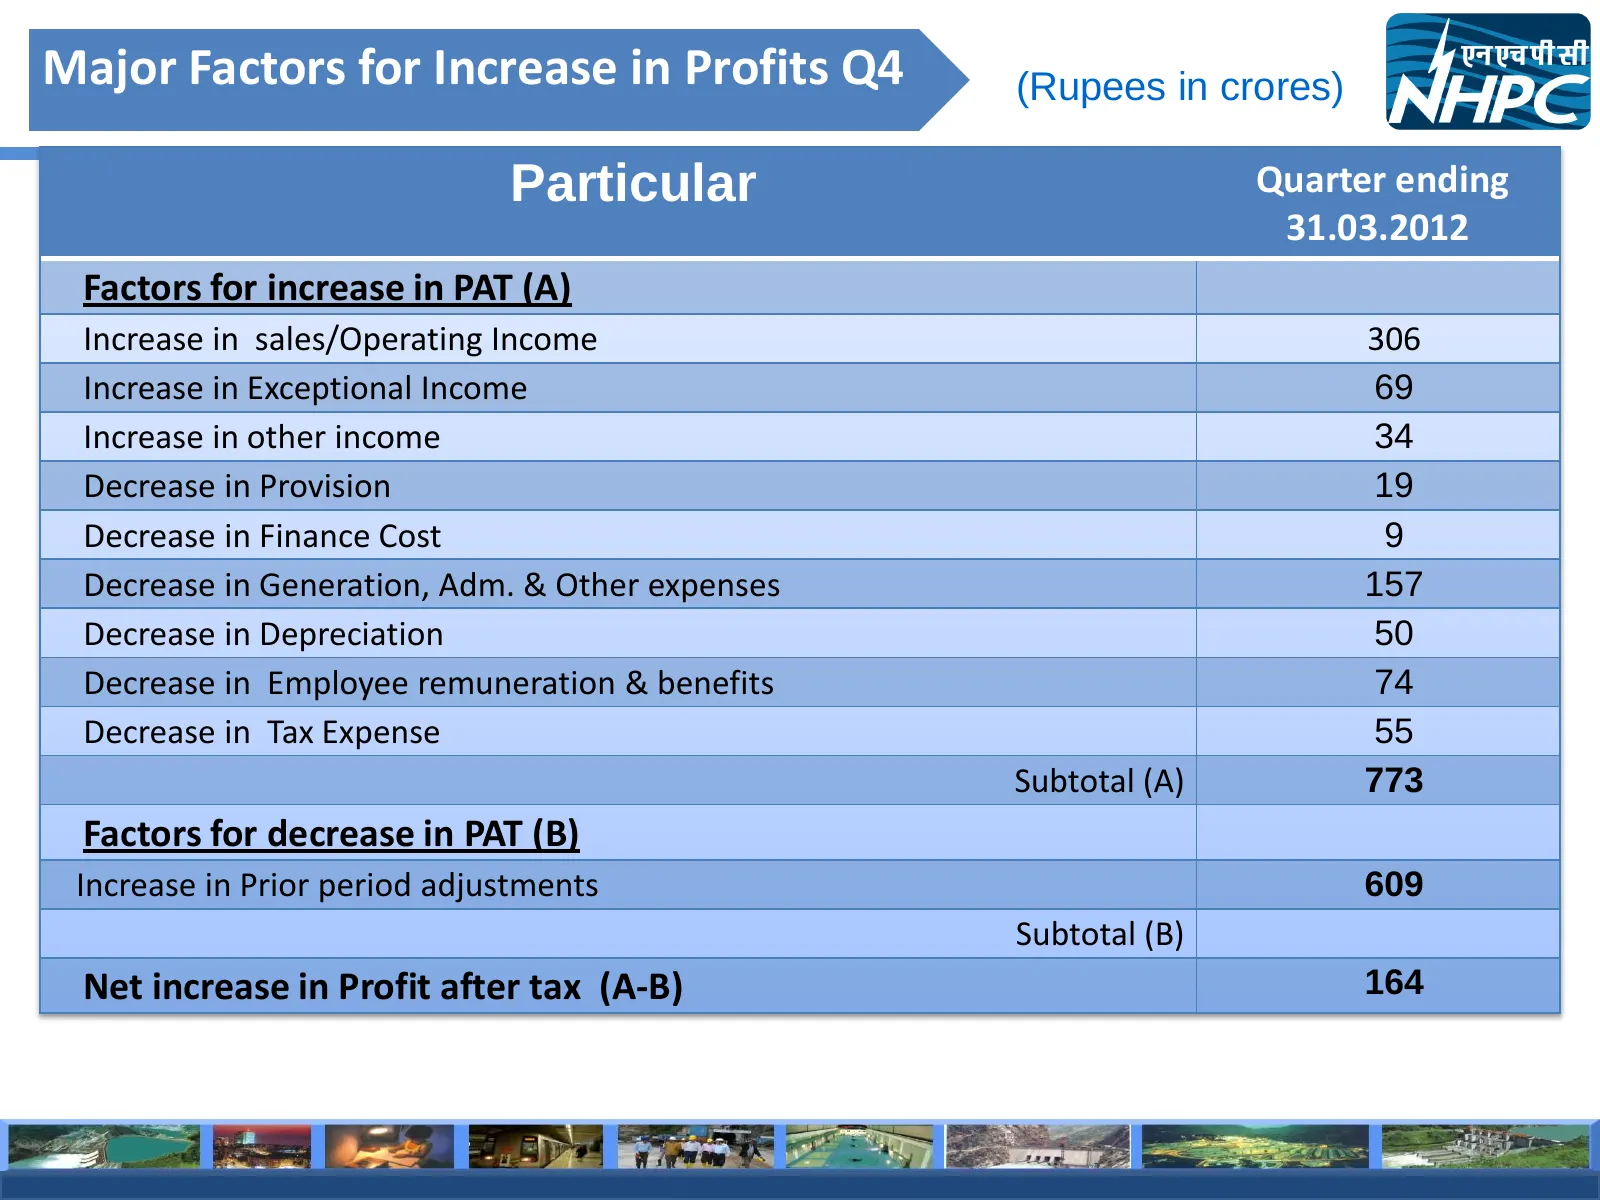
Major Factors for Increase in Profits Q4 (Rupees in crores) Particular Quarter ending 31.03.2012 Factors for increase in PAT (A) Increase in sales/Operating Income 306 Increase in Exceptional Income 69 Increase in other income 34 Decrease in Provision 19 Decrease in Finance Cost 9 Decrease in Genera
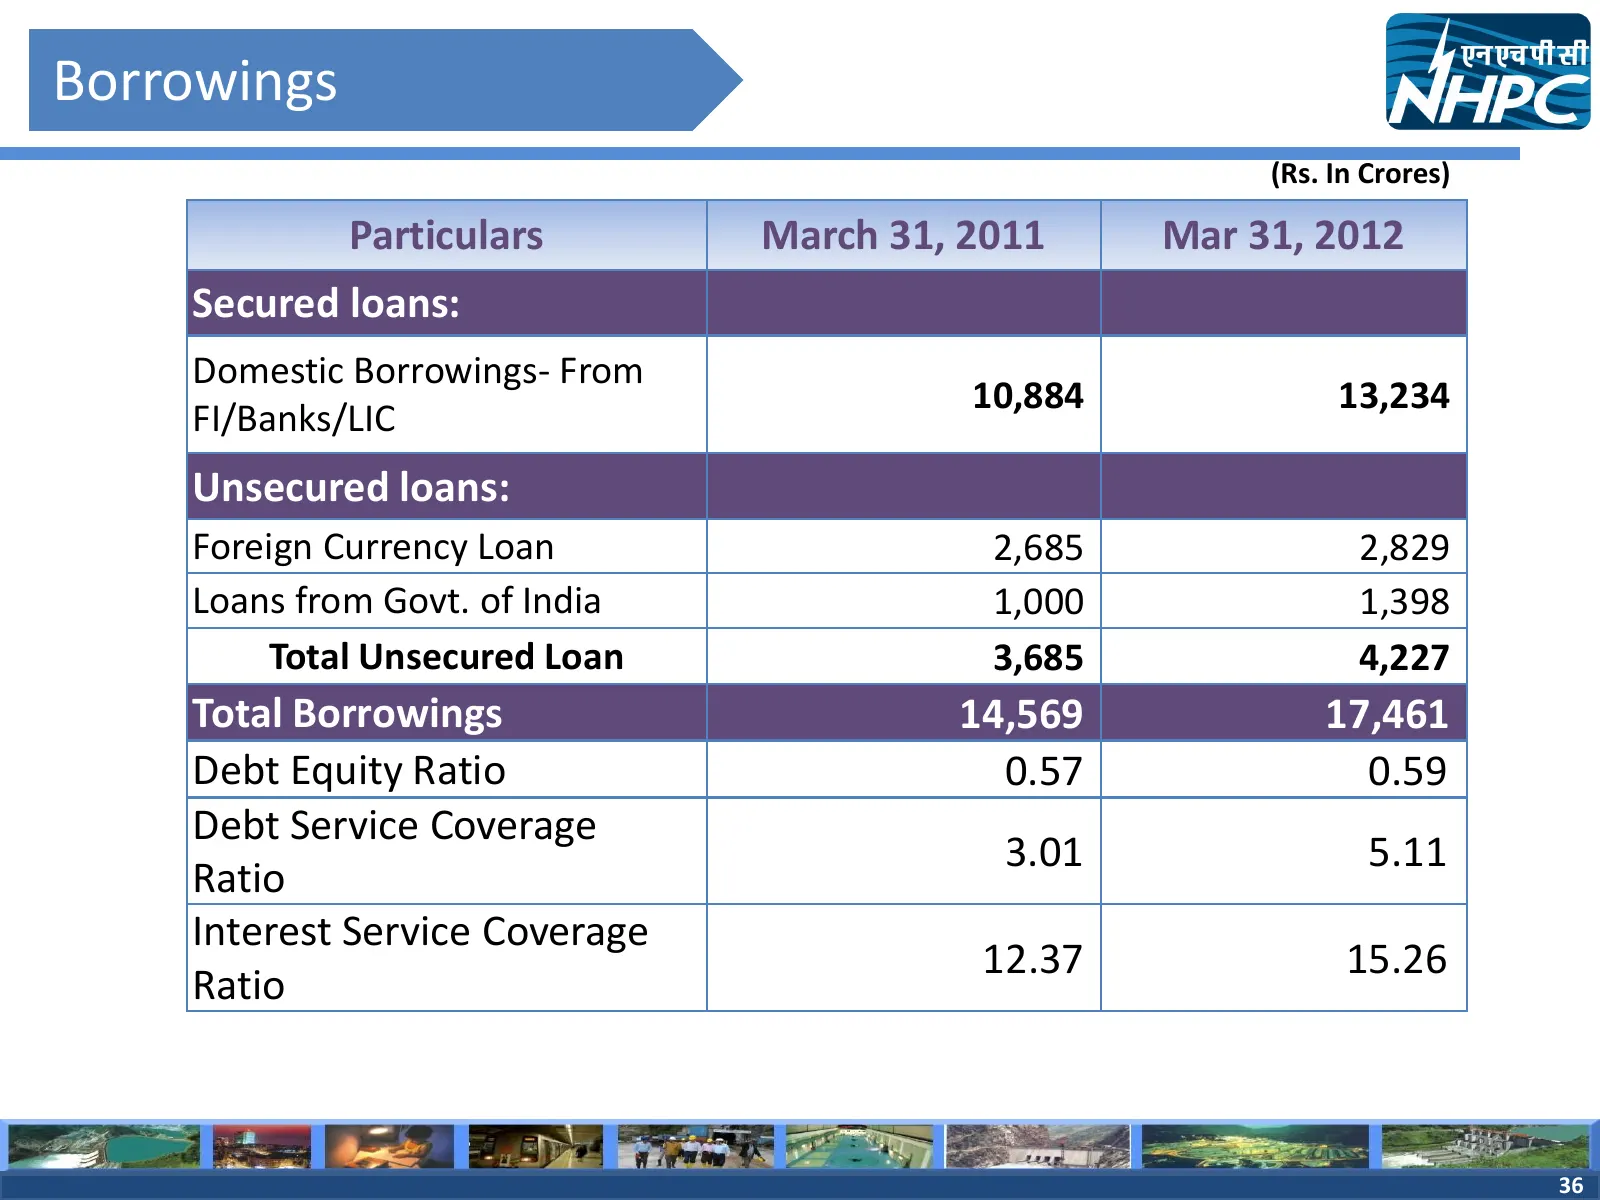
Slide 36: Borrowings
Borrowings (Rs. In Crores) Particulars March 31, 2011 Mar 31, 2012 Secured loans: Domestic Borrowings- From 10,884 13,234 FI/Banks/LIC Unsecured loans: Foreign Currency Loan 2,685 2,829 Loans from Govt. of India 1,000 1,398 Total Unsecured Loan 3,685 4,227 Total Borrowings 14,569 17,461 Debt Equity
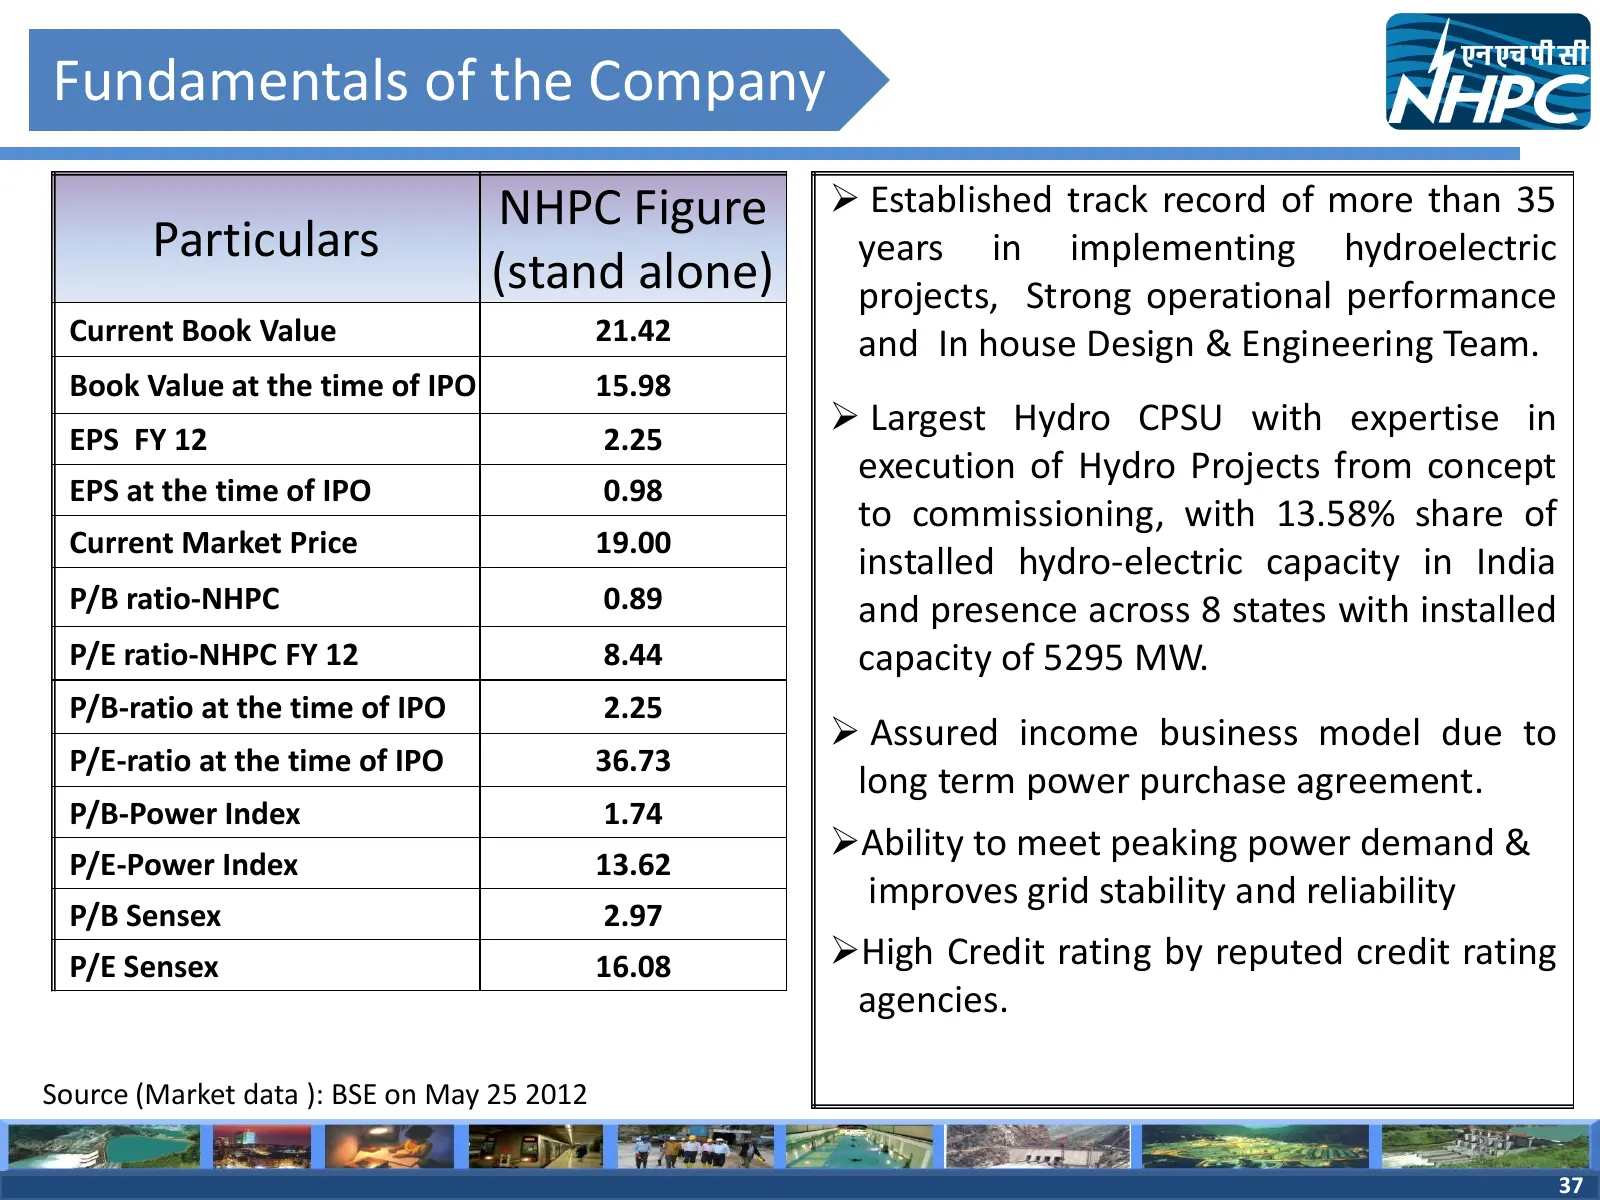
Slide 37: Fundamentals of the Company
Fundamentals of the Company NHPC Figure Established track record of more than 35 Particulars years in implementing hydroelectric (stand alone) projects, Strong operational performance Current Book Value 21.42 and In house Design & Engineering Team. Book Value at the time of IPO 15.98 EPS FY 12 2.2
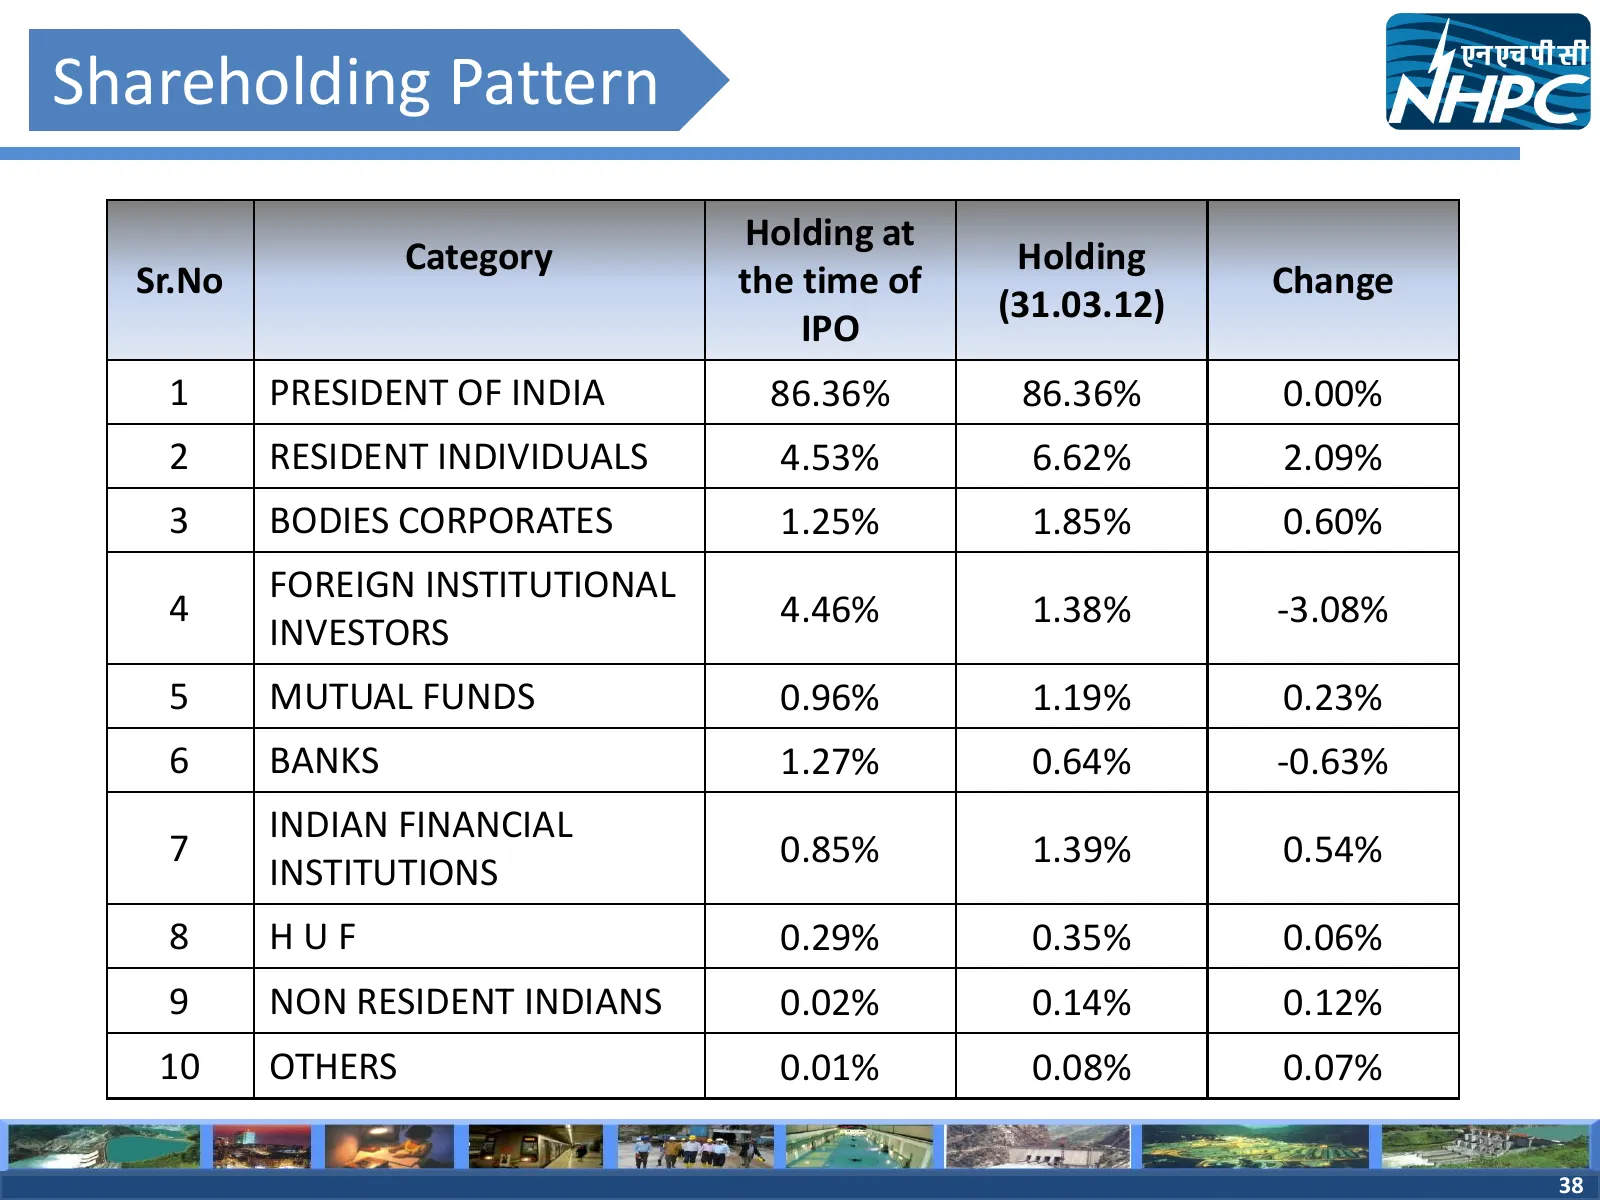
Slide 38: Shareholding Pattern
Shareholding Pattern Holding at Category Holding Sr.No the time of Change (31.03.12) IPO 1 PRESIDENT OF INDIA 86.36% 86.36% 0.00% 2 RESIDENT INDIVIDUALS 4.53% 6.62% 2.09% 3 BODIES CORPORATES 1.25% 1.85% 0.60% FOREIGN INSTITUTIONAL 4 4.46% 1.38% -3.08% INVESTORS 5 MUTUAL FUNDS 0.96% 1.19% 0.23% 6 BAN

Slide 39: Thank You
Thank You 39
Source: Internet Archive copy of nhpcindia.com
More decks from NHPC Limited
 Investor Presentation (June 2026)49 slides · June 2026
 Investor Presentation (March 2026)48 slides · March 2026
 Investor Presentation (December 2025)49 slides · December 2025
 Investor Presentation (September 2025)49 slides · September 2025
 Investor Presentation (June 2025)51 slides · June 2025
 Investor Presentation (May 2025)49 slides · May 2025