National Penn Bancshares — Investor Presentation (November 2014)
37 slides from National Penn Bancshares's investor presentation, Nov 12, 2014
Slide 1: National Penn Bancshares, Inc. (NPBC)
National Penn Bancshares, Inc. (NPBC) Consistent Performance 4 Well-Positioned for Growth wy NATIONAL mg@ PENN November 13, 2014 ‘BANKING | INSURANCE | INVESTMENTS | TRUST
Slide 2: Safe Harbor Regarding Forward Looking Statements
Safe Harbor Regarding Forward Looking Statements 9 {28 “believe,” “expect,” ‘may,” “wil,” ‘should, ” “project,” could,” ‘plan,” “goa,” potential." “pro forma, “seek,” intend,” ‘anicpate” or the negative thereof or comparable terminology, and include i assumptions) i Nat these: ty, ology, tiga ings 8
Slide 3: Leading Community Bank in Eastern PA
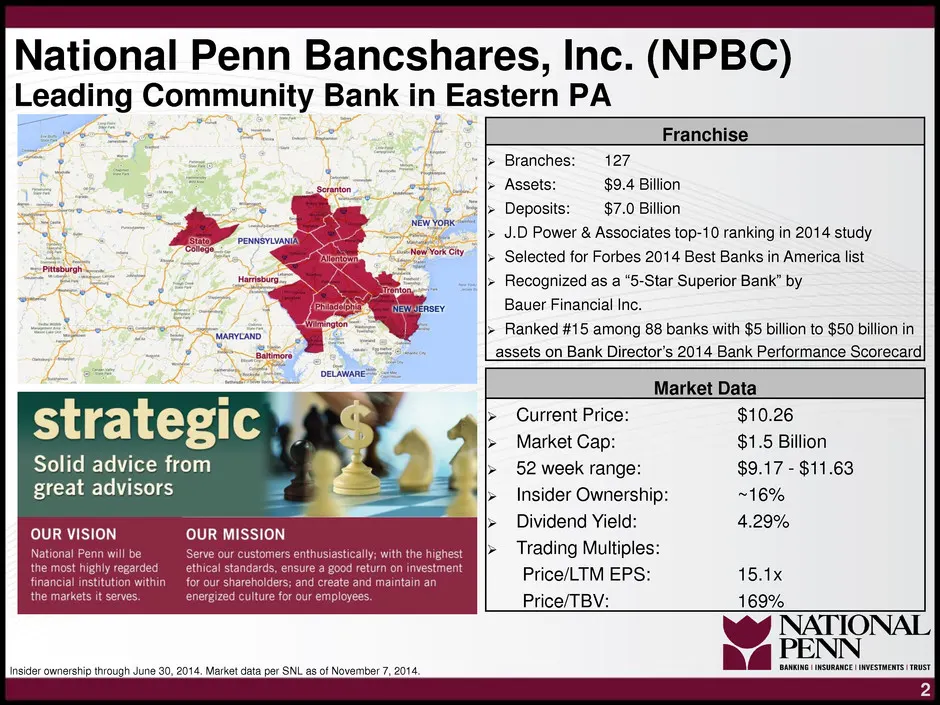
National Penn Bancshares, Inc. (NPBC) Leading Community Bank in Eastern PA Solid advice from great advisors OUR VISION OUR MISSION ier gris Se 2 custo enhusiesisaly, wi Cre Net oe ee ee foldrs and cesta ea the markets it serves. ES caus fo ur employe = |> Deposits: Franchise | Branches: 127 | Assets
Slide 4: Concentrated Franchise Leading All Other Community Banks in the National Penn Market
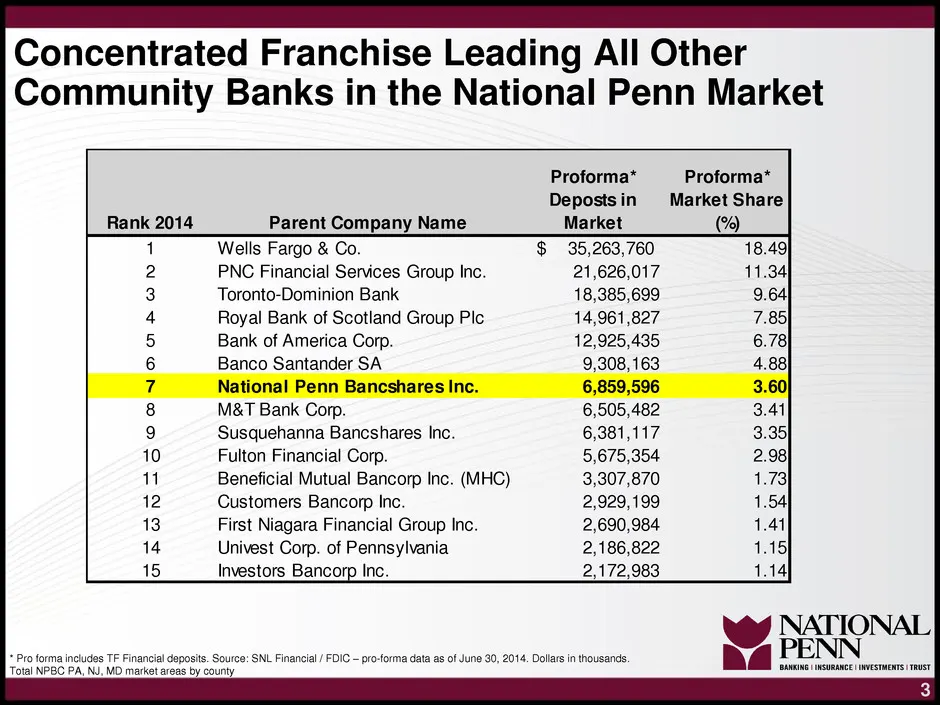
Concentrated Franchise Leading All Other Community Banks in the National Penn Market Proforma* Proforma* Market Share Rank 2014 Parent Company Name Wells Fargo & Co. PNC Financial Services Group Inc. 21,626,017 Toronto-Dominion Bank 18,385,699 Royal Bank of Scotland Group Pie 14,961,827 Bank of Amer
Slide 5: TF Financial Corporation Acquisition
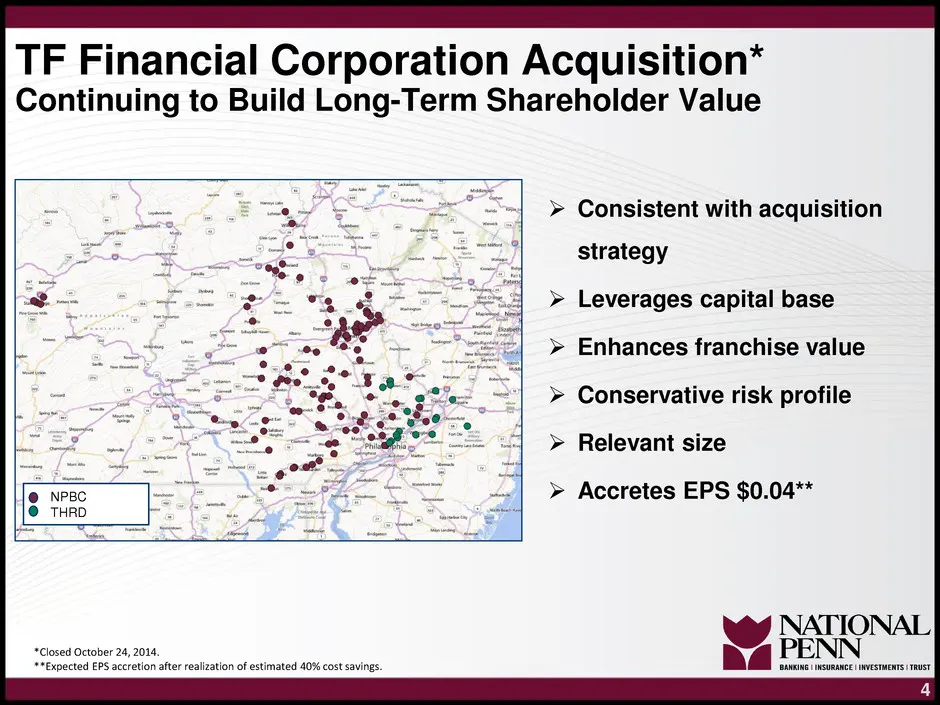
TF Financial Corporation Acquisition* Continuing to Build Long-Term Shareholder Value >C strategy > Leverages capital base > Enhances franchise value > Conservative risk profile > Relevant size > Accretes EPS $0.04** "Closed October 24, 2014.
Slide 6: NPBC Senior Debt Issuance
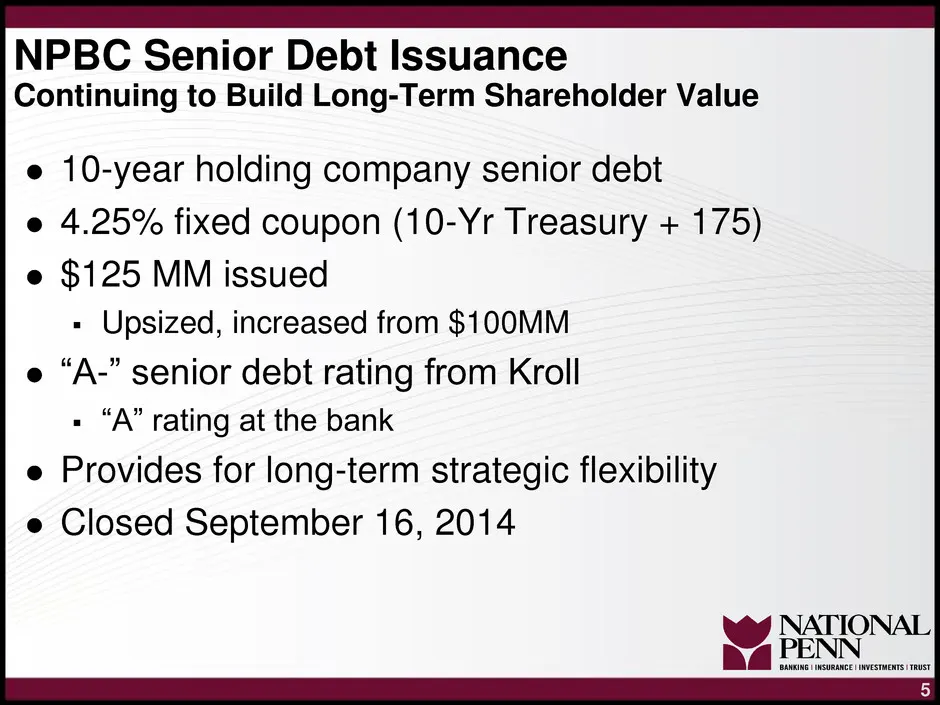
NPBC Senior Debt Issuance Continuing to Build Long-Term Shareholder Value e 10-year holding company senior debt e 4.25% fixed coupon (10-Yr Treasury + 175) e $125 MM issued » Upsized, increased from $100MM e “A-” senior debt rating from Kroll » “A” rating at the bank e Provides for long-term strateg
Slide 7: Enhancing Holding Company Liquidity
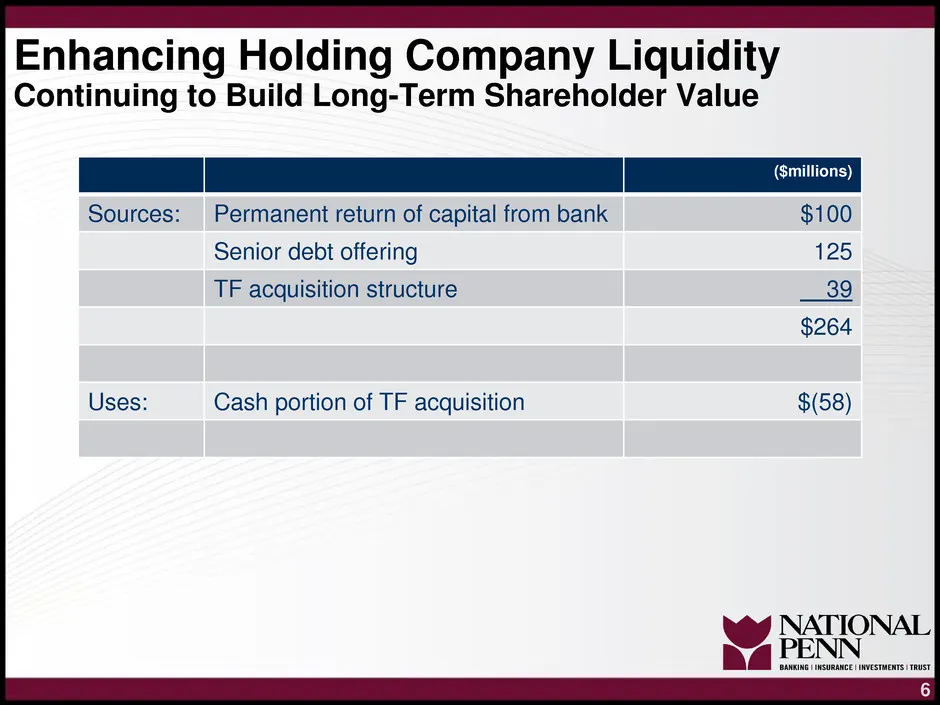
Enhancing Holding Company Liquidity Continuing to Build Long-Term Shareholder Value a Sources: Permanent return of capital from bank $100 Senior debt offering 125 TF acquisition structure 39 Uses: Cash portion of TF acquisition
Slide 8: Holding Company Liquidity - NPBC Cash
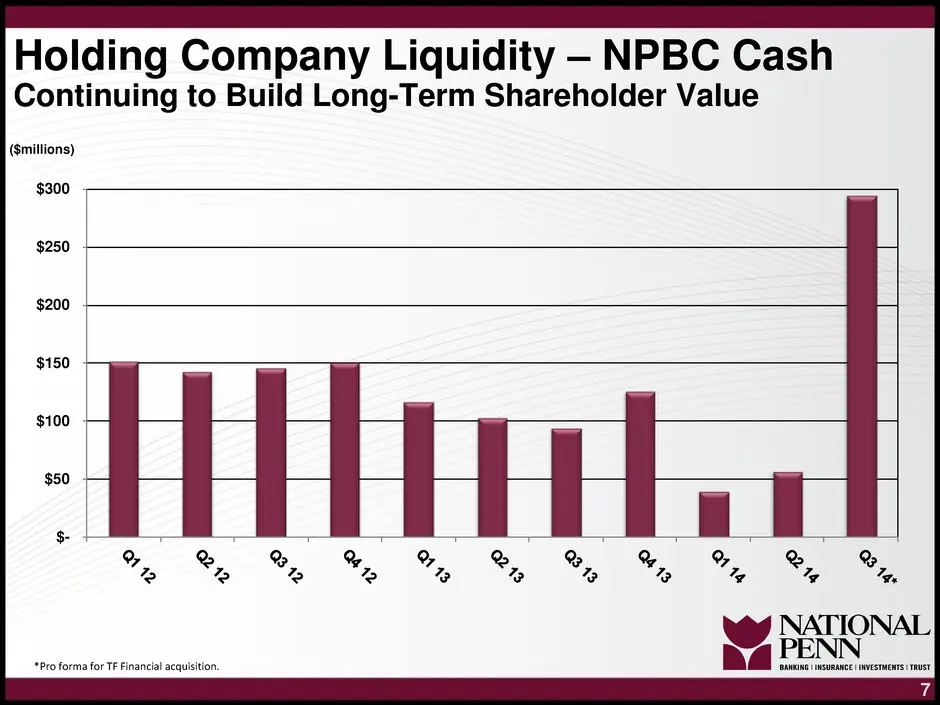
Holding Company Liquidity - NPBC Cash Continuing to Build Long-Term Shareholder Value (Smillions)
Slide 9: Sustained Earnings Performance and Strong ROAA Trend
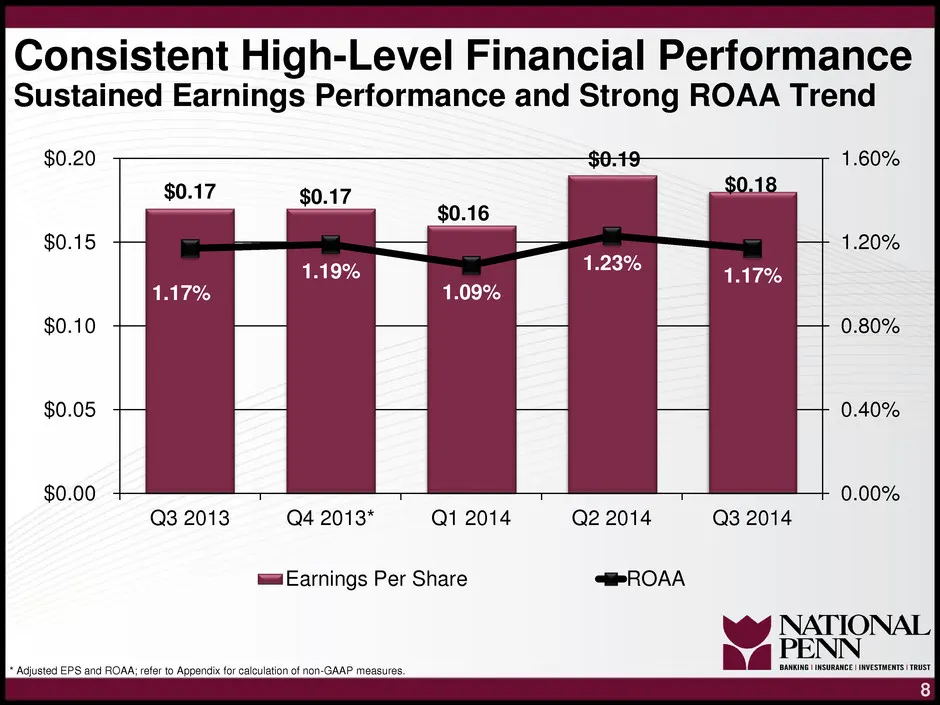
Consistent High-Level Financial Performance Sustained Earnings Performance and Strong ROAA Trend $0.20 $0.15 $0.10 $0.05 $0.00 1.60% Q3 2013 Q4 2013* Q1 2014 maa Earnings Per Share Q2 2014 @®ROAA Q3 2014 Mw NATIONAL PENN
Slide 10: Sustained Strong Return on Assets
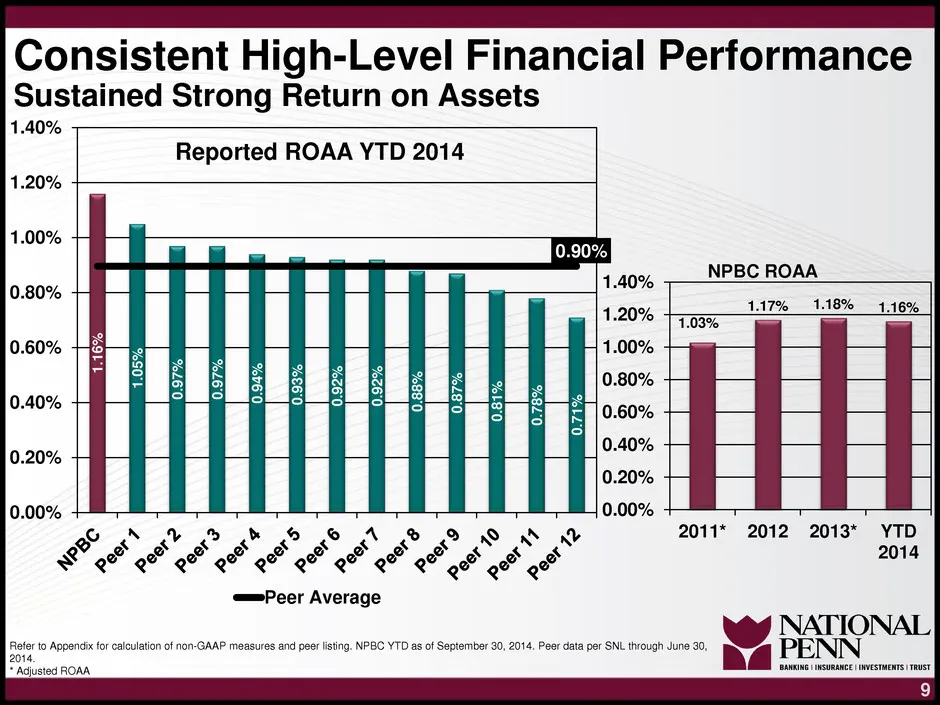
Consistent High-Level Financial Performance Sustained Strong Return on Assets 1.40% Reported ROAA YTD 2014 1.20% 1.00% 0.80% 0.60% 0.40% 0.20% 0.94% 0.93% 092% 0.92% 0.00% > a O° a) aa 1 en a rn A KY A A A 4 FoF oF oF oF of ==Peer Average eS 9, Ca 2011* 2012 2013* YTD rs 2014 QS kak %, % s wy NATION
Slide 11: Disciplined Growth of Quality Loans
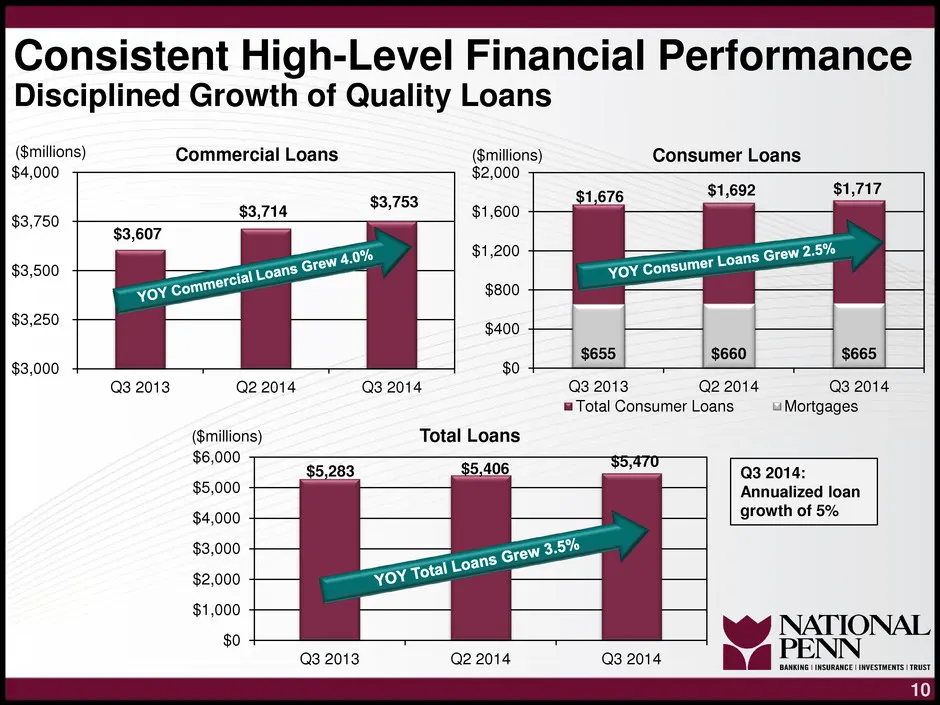
Consistent High-Level Financial Performance Disciplined Growth of Quality Loans ($millions) Commercial Loans ($millions) Consumer Loans $4,000 $2,000 $1,692 $3,750 $3,714 $1,600 $1,200 $3,500 $800 $3,250 $400 $3,000 $0 Q3 2013 Q2 2014 Q3 2014 13 2014 2013 Q2 2014 Q "Total Consumer Loans Mortgages ($
Slide 12: Disciplined Operating Expense Management
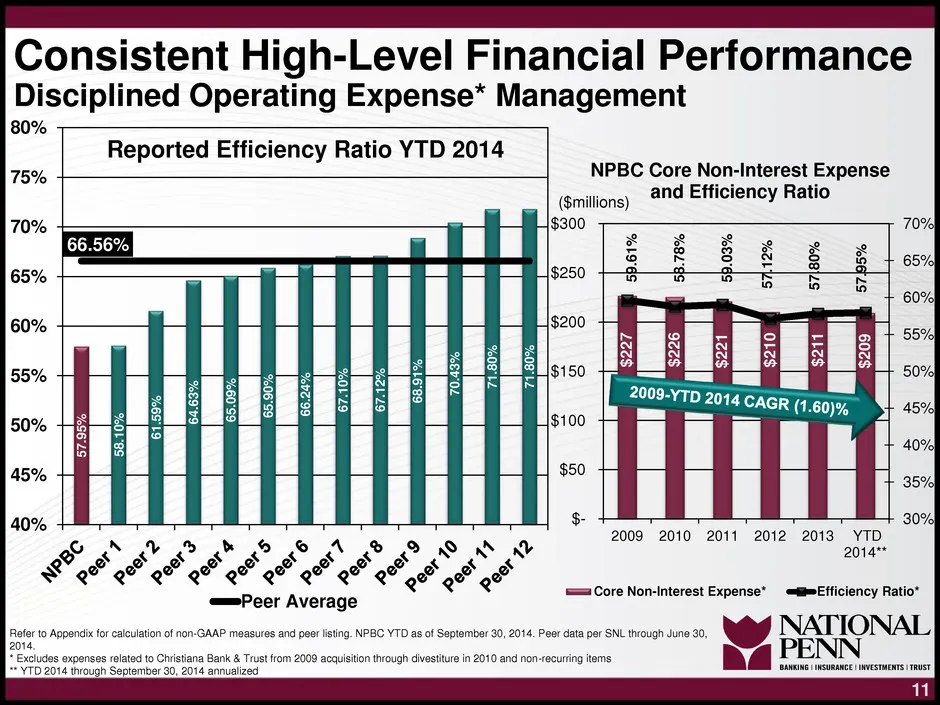
Consistent High-Level Financial Performance Disciplined Operating Expense* Management Reported Efficiency Ratio YTD 2014 NPBC Core Non-Interest Expense and Efficiency Ratio (millions) $300 Pe 6712% Ag oO A 2009 2010 2011 2012 2013 YTD < A ors & i wy 2014** LFF FFF FFF K ok o® ==Peer Average = Core N
Slide 13: Stable Margin in a Historically Low Rate Environment
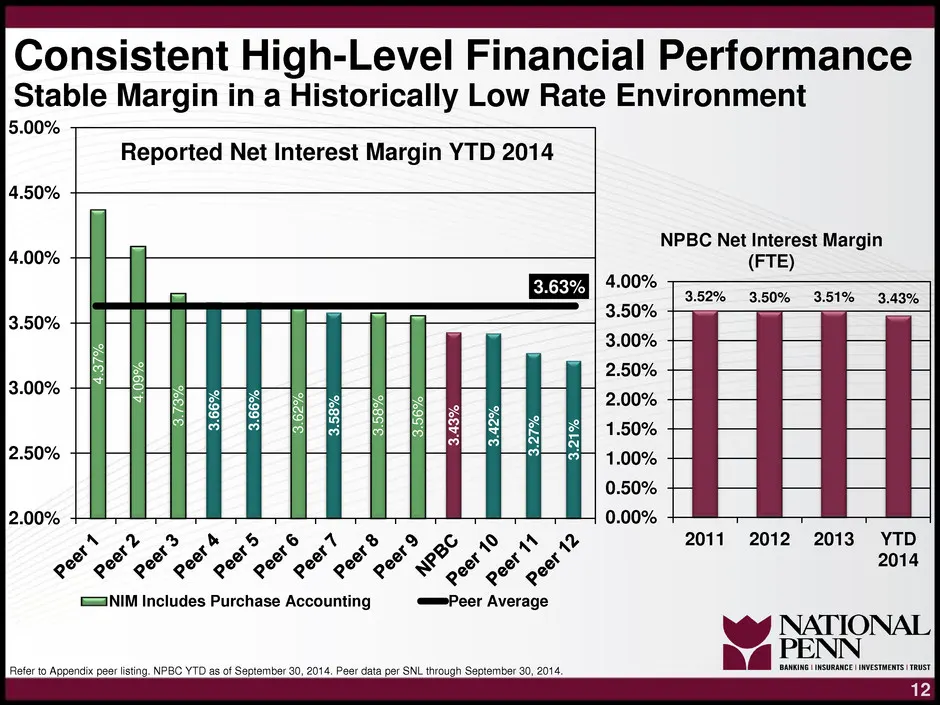
Consistent High-Level Financial Performance Stable Margin in a Historically Low Rate Environment 5.00% Reported Net Interest Margin YTD 2014 4.50% 4.00% NPBC Net Interest Margin (FTE) 3.52% 3.50% 3.51% 3.43% 3.50% 3.00% 2.50% 2.00% PSS PPP eB PoP Cos LSE a eek Sle plan dl Cod Cod CR OY} [SNM Include
Slide 14: Diversified Revenue Sources
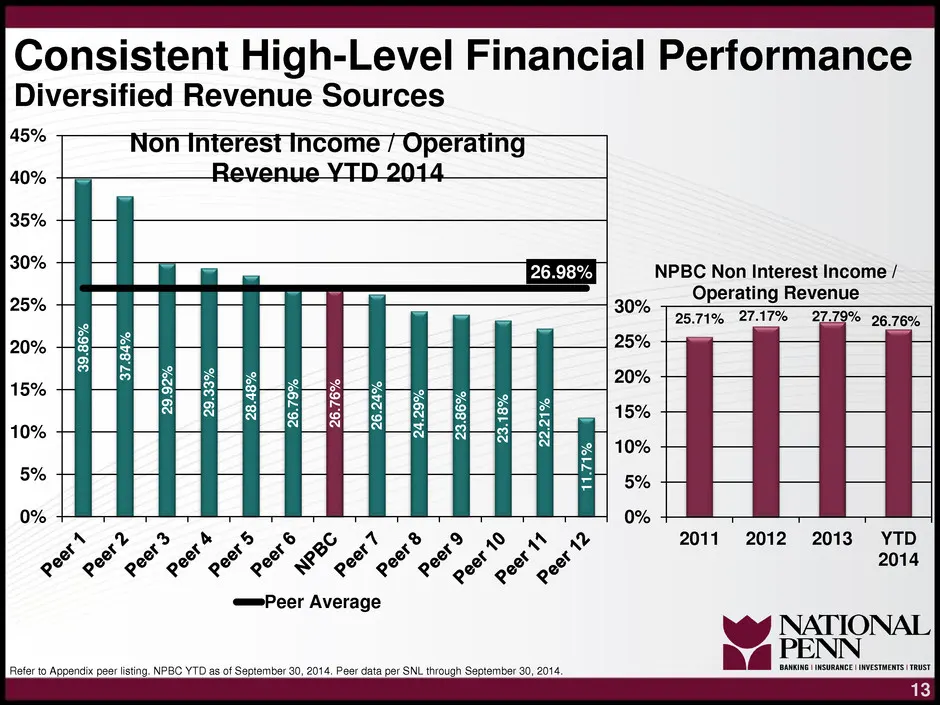
Consistent High-Level Financial Performance Diversified Revenue Sources So% Non Interest Income 7 Op d 40% YTD 2014 35% pe ion | NPBC Non Interest Income / 25% z= =| Operating Revenue || || || || 25.71% 27AT% 27 20% F A Aan R 15% ta ya - aa a aaa 0% 0% mh OO GA ® ®@ OK 2011 2012 2013 YTD eo ev e Ss
Slide 15: NPBC Repurchased 10% of Shares Over 2 Years
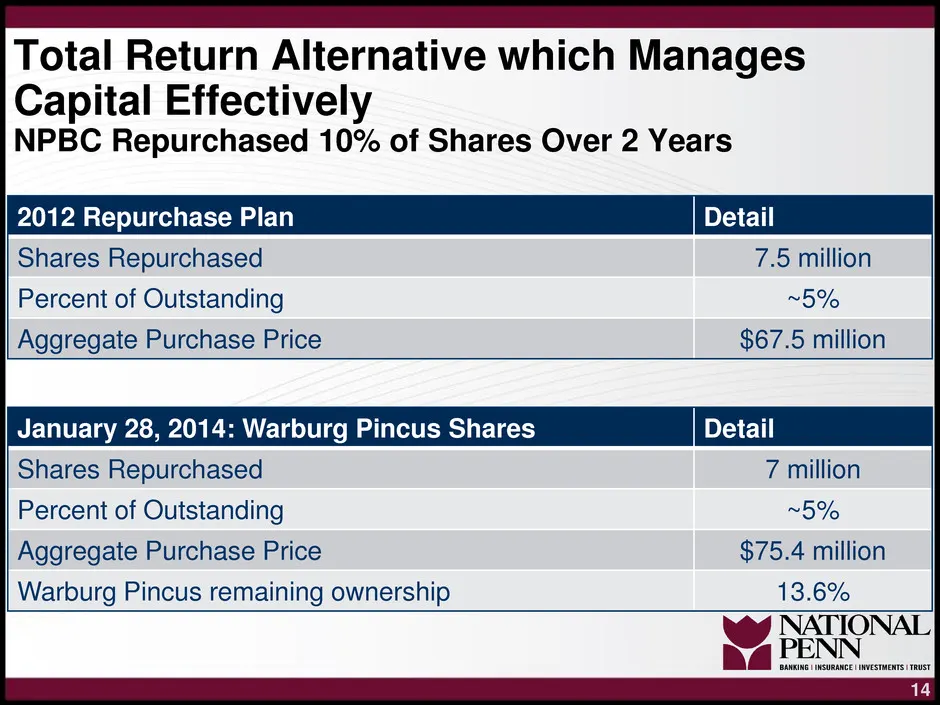
Total Return Alternative which Manages Capital Effectively NPBC Repurchased 10% of Shares Over 2 Years 2012 Repurchase Plan Shares Repurchased 7.5 million Percent of Outstanding ~5% Aggregate Purchase Price $67.5 million January 28, 2014: Warburg Pincus Shares Shares Repurchased 7 million Percent of
Slide 16: Dividend Payout Ratio
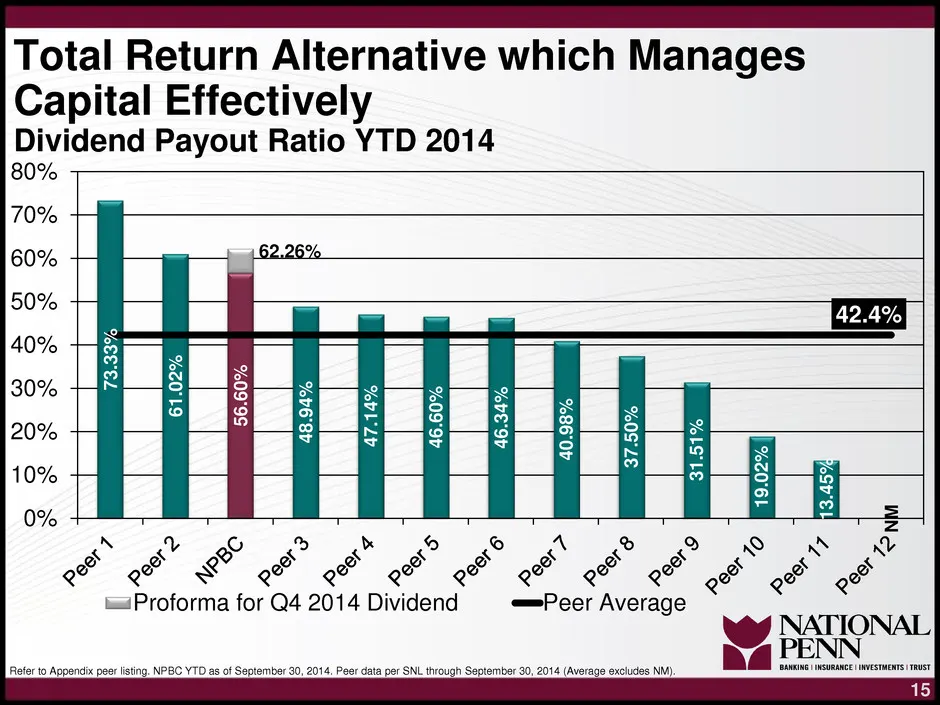
Total Return Alternative which Manages Capital Effectively Dividend Payout Ratio YTD 2014 80%
Slide 17: Dividend Yield
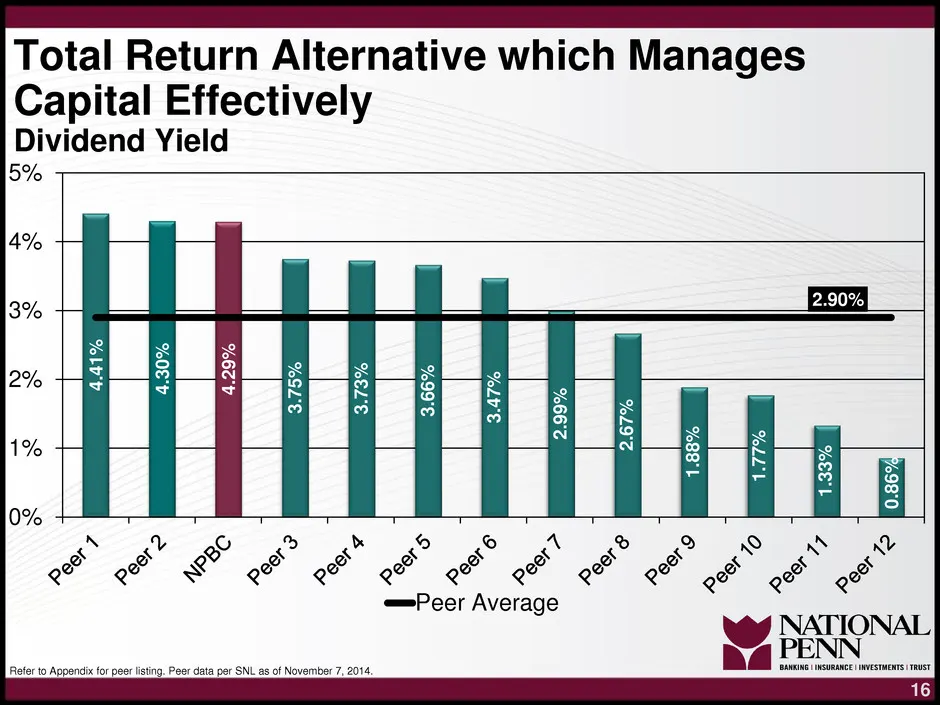
Total Return Alternative which Manages Capital Effectively Dividend Yield 5% 4% 3% 2% 1% mG Qe? —Peer Average
Slide 18: Strong Capital Levels
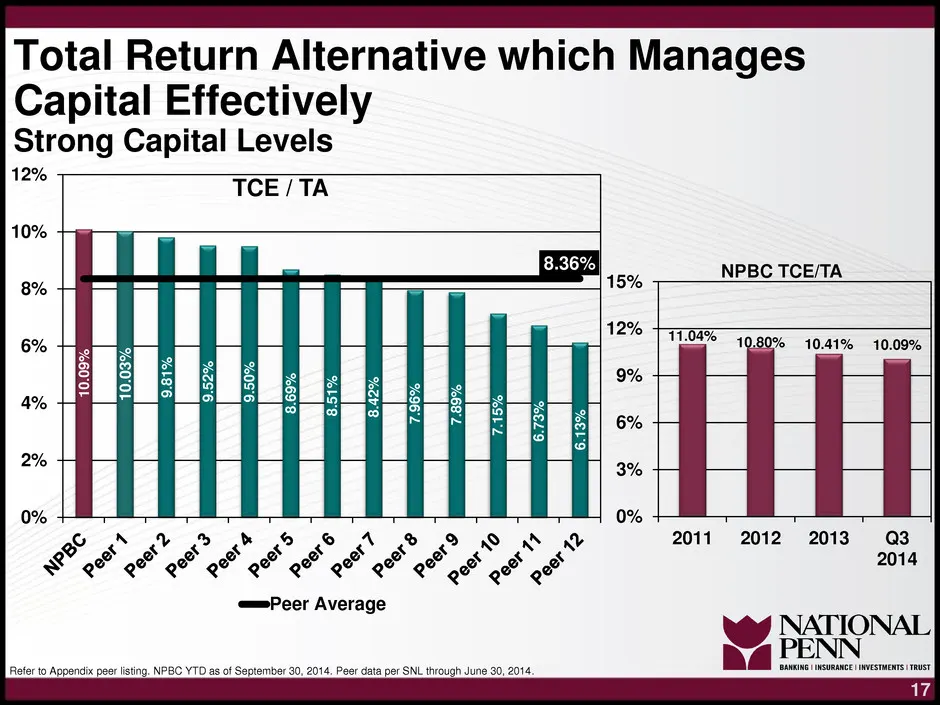
Total Return Alternative which Manages Capital Effectively Strong Capital Levels 12% TCE/TA | 10% - 8.36% 8% Lf | = : 8.367 NPBC TCE/TA 12% 6% A | } ! ! 1 || ! || = = % 10.41% 10.09% 4% He oom fy | | il i i = a 2% S| es 0% bo © A &® 2 8 NW SS SS LS Sg iS FF oF oF oF oF ooh ooh ==Peer Average ON v &
Slide 19: TF Financial Acquisition Prudently Leveraged Capital
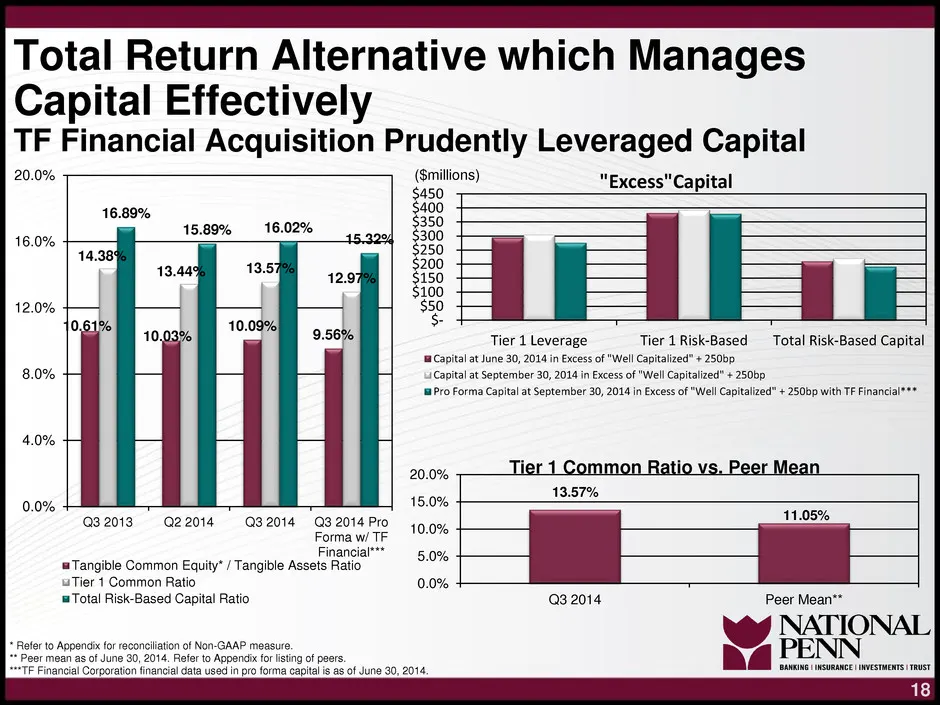
Total Return Alternative which Manages Capital Effectively TF Financial Acquisition Prudently Leveraged Capital 20.0% "Excess" Capital bed 15.89% 16.02% 16.0% _ ier 1 Leverage Tier 1 Risk-Based Total Risk-Based Capital ‘a Capital at June 30, 2014 in Excess of "Well Capitalized” + 2505 Copal t Septem
Slide 20: Consistent Earnings with Capital Management Enhances ROATCE
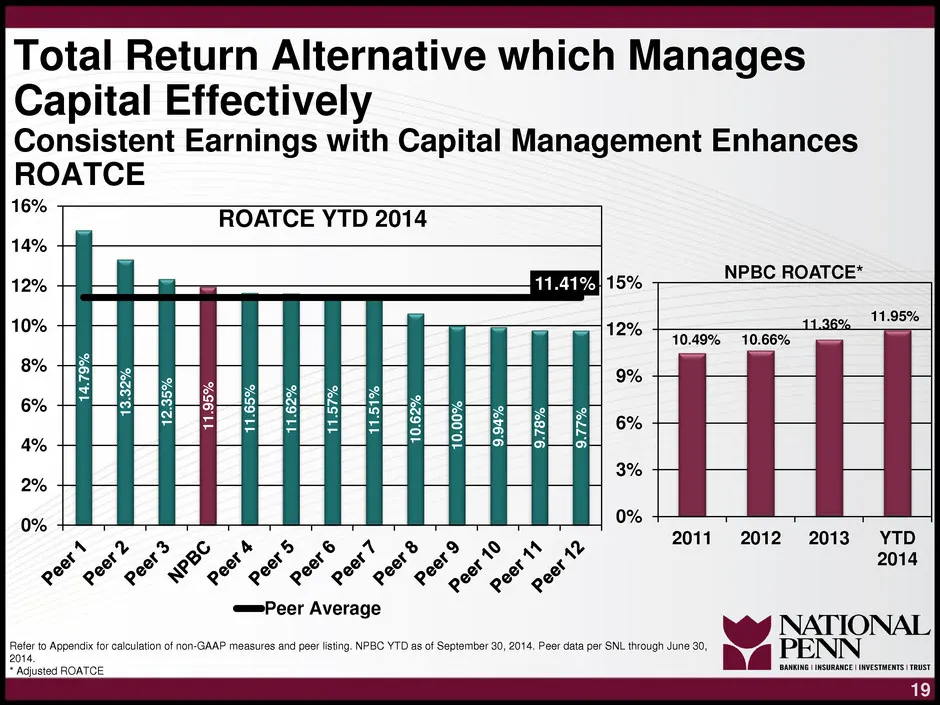
Total Return Alternative which Manages Capital Effectively Consistent Earnings with Capital Management Enhances ROATCE 1h ROATCE YTD 2014 14% NPBC ROATCE* 11.95% SR 2 8 — q a a ze > TSC 0.52% 30.00% o > a 2 a zg © 1 10.49% 10.66% 14.65% 11.57% Ba 12.35% C a 25 RK 2011 2012 2013 YTD SOS SS OS 2014 FL
Slide 21: Proactive Management Team with a Focus on Shareholder Returns
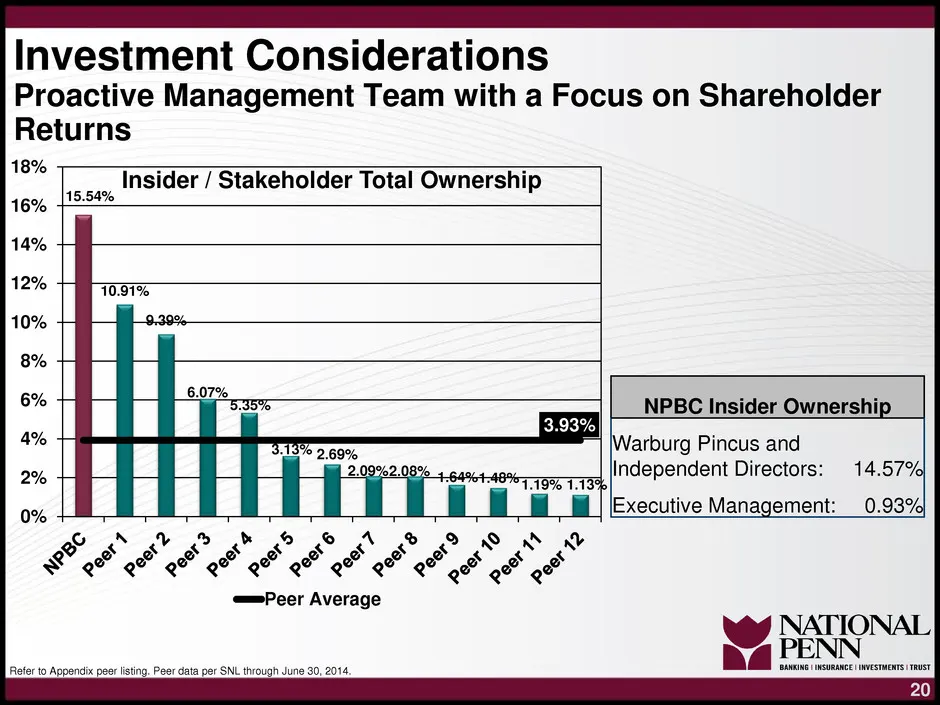
Investment Considerations Proactive Management Team with a Focus on Shareholder Returns 18% Insider / Stakeholder Total Ownership 16% 15.54% 14% 12% 10% 8% 6% NPBC Insider Ownership [Warburg Pincus and | |Independent Directors: 14.57% Executive Management: 0.93% SEEEEE "e 2 oe oy os Peer Average Vey
Slide 22: Proactive Management Team that Delivers on Strategic Objectives
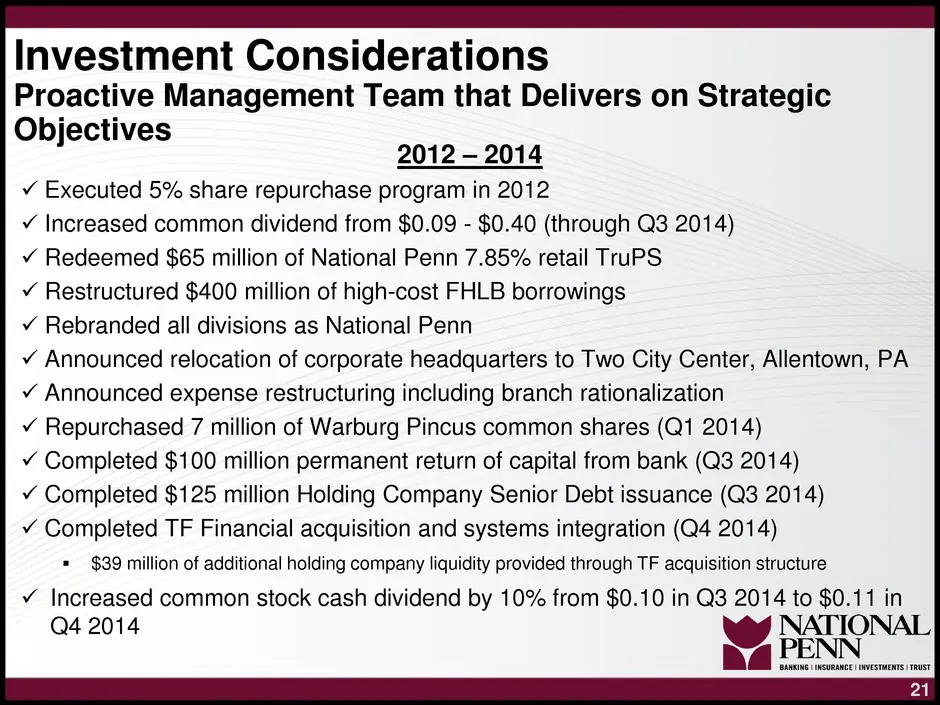
Investment Considerations Proactive Management Team that Delivers on Strategic Objectives 2012 — 2014 v Executed 5% share repurchase program in 2012 v Increased common dividend from $0.09 - $0.40 (through Q3 2014) v Redeemed $65 million of National Penn 7.85% retail TruPS v Restructured $400 million
Slide 23: Fortress Like Balance Sheet - Superior Asset Quality
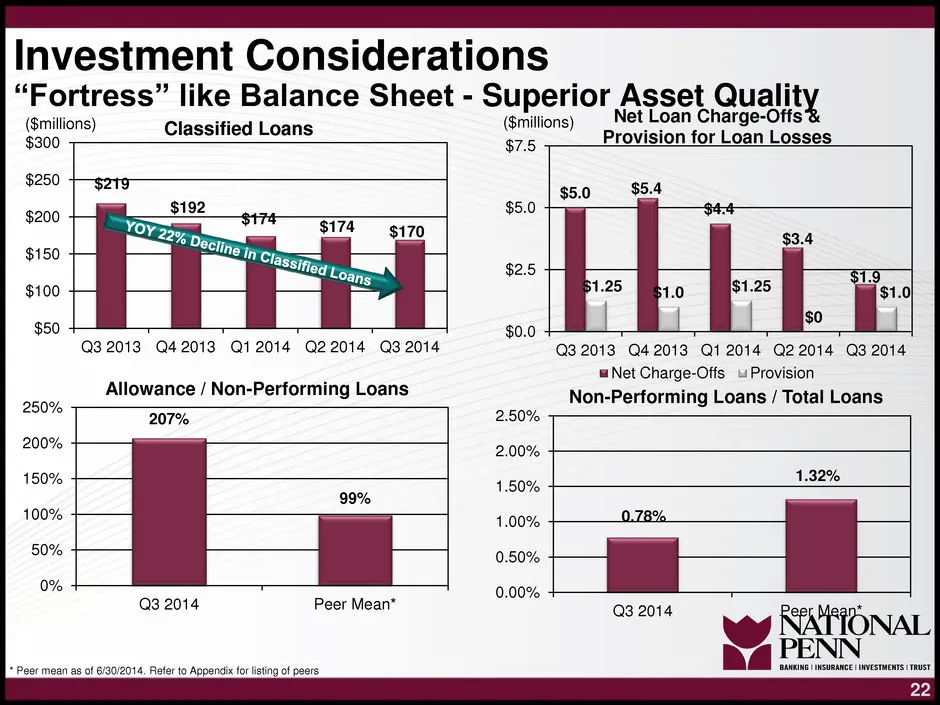
Investment Considerations “Fortress” like Balance Sheet - Superior / Asset t Quality st Loan Charge-Off: - millions) a lions) Classified Loans & ) a rosie ae Loan Losses $250 $5.0 $5.4 $200 $150 $100 $50 Q32013 Q42013 Q12014 Q22014 Q32014 Q3 2013 Q42013 Qt 2014 Q22014 Q32014 "Net Charge-Offs Provisi
Slide 24: Fortress Like Balance Sheet - Total Risk Based Capital Ratio
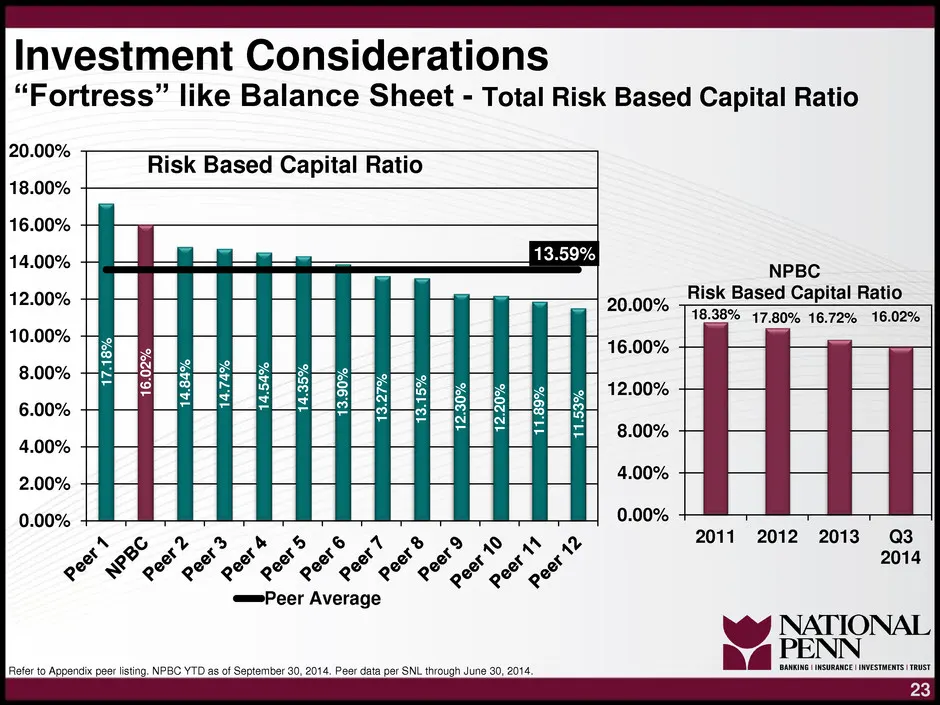
Investment Considerations “Fortress” like Balance Sheet - Total Risk Based Capital Ratio 20.00% 18.00% 16.00% 14.00% 12.00% 10.00% 8.00% 6.00% Risk Based Capital Ratio Hl | | 4.00% 2.00% 12:20% o2, 7 z Cae 47.53% 0.00% > EC °? 7 Pe “9 | °S | seit °C | nie cy sleet “> | lela err eemieiae “C |e “9 |i
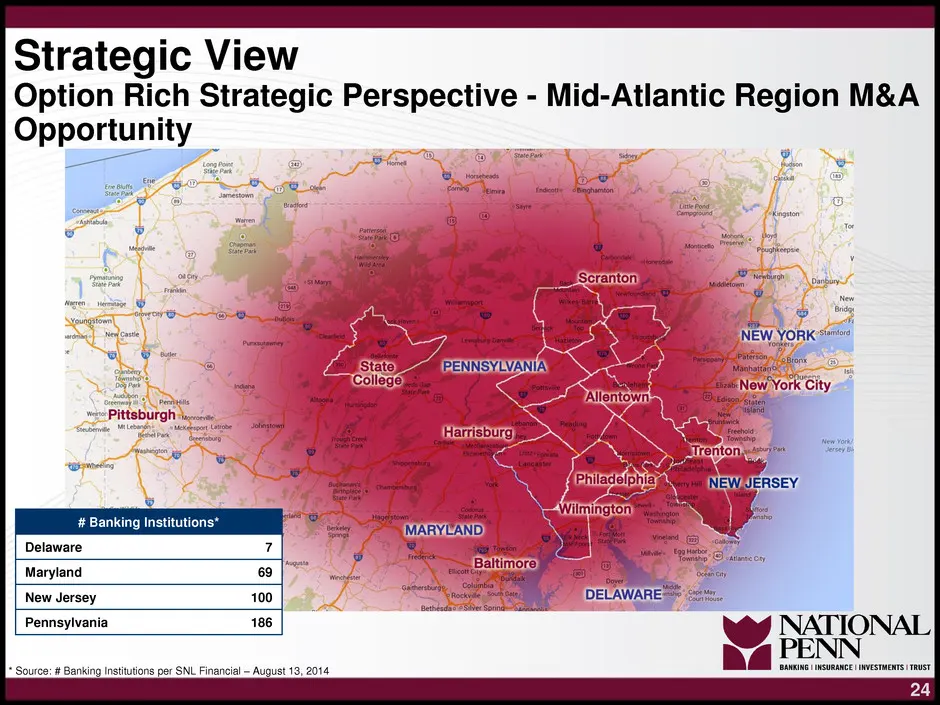
Slide 25: Option Rich Strategic Perspective - Mid-Atlantic Region M&A Opportunity
Strategic View Option Rich Strategic Perspective - Mid-Atlantic Region M&A Opportunity =a & # Banking Institutions’ « Delaware Maryland New Jersey Pennsylvania ‘Source: # Banking Institutions per SNL Financial — August 13, 2014
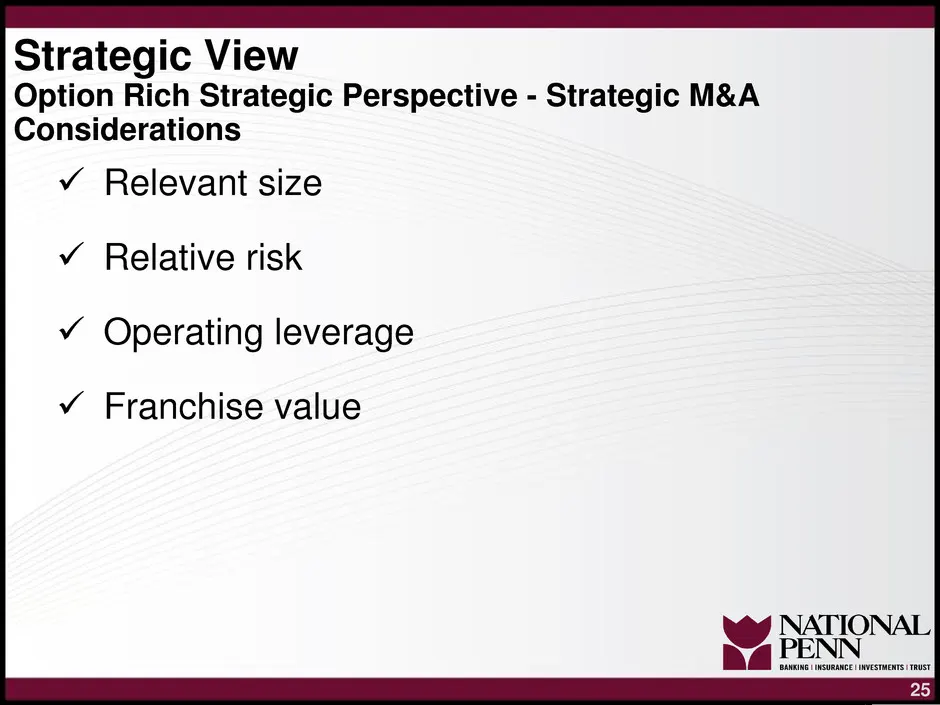
Slide 26: Option Rich Strategic Perspective - Strategic M&A Considerations
Strategic View Option Rich Strategic Perspective - Strategic M&A Considerations v Relevant size v Relative risk v Operating leverage v¥ Franchise value
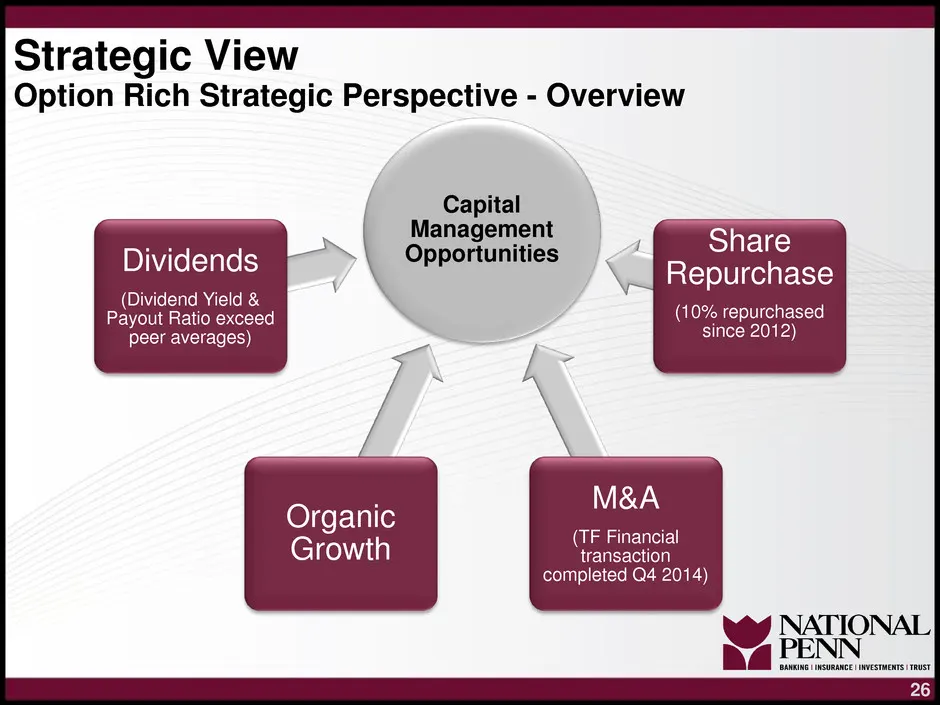
Slide 27: Option Rich Strategic Perspective - Overview
Strategic View Option Rich Strategic Perspective - Overview SS mr Capital | lanagement Shar ve Opportunities , EUS Dividends Repurchase (Dividend Yield & Payout Ratio exceed 7 (10% repurchased peer averages) . _4 since 2012) Organic aerienee ‘inancial Growth transaction completed Q4 2014)
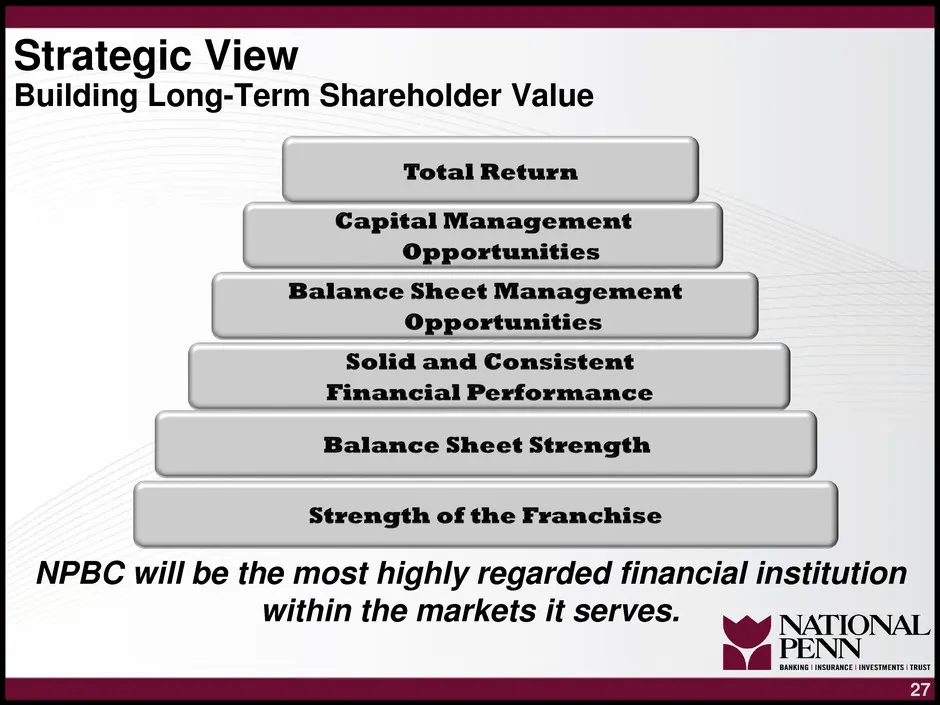
Slide 28: Building Long-Term Shareholder Value
Strategic View Building Long-Term Shareholder Value l Total Return eo PP oO cas, PP Bal Sheet M: l Solid and Consistent l Balance Sheet Strength g ——— NPBC will be the most highly regarded financial institution within the markets it serves.
Slide 29: NPBC Total Annual Return
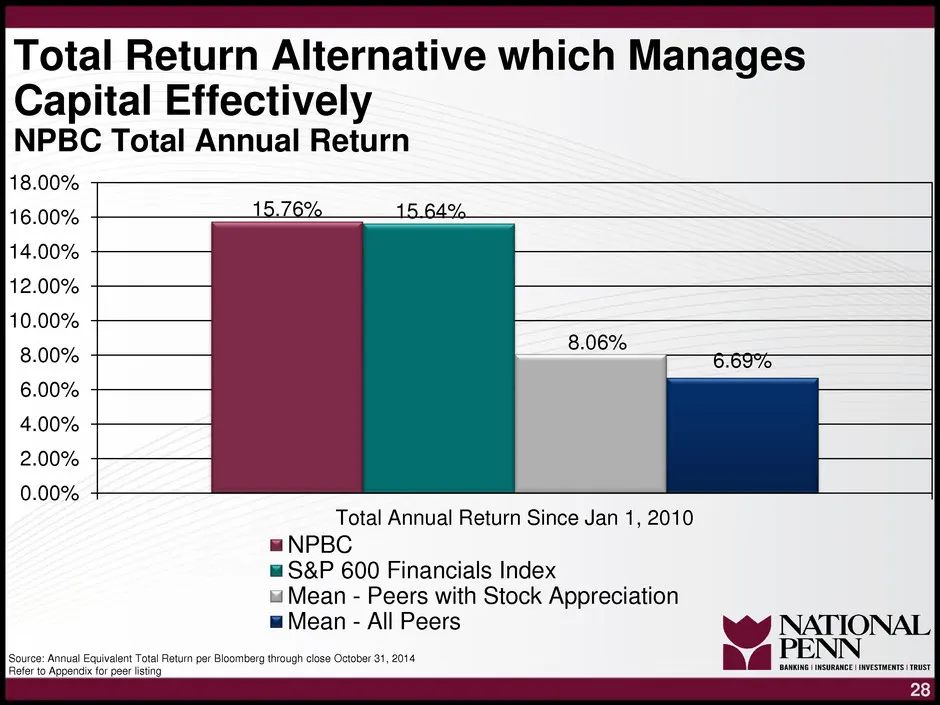
Total Return Alternative which Manages Capital Effectively NPBC Total Annual Return 18.00% 16.00% ~+~——__15.76%___15 64% __ 14.00% + 12.00% 7 10.00% + 8.00% 4 6.00% 4 4.00% 4 2.00% 4 0.00% + 8.06% Total Annual Return Since Jan 1, 2010 = NPBC S&P 600 Financials Index ui Mean - Peers with Stock Apprec
Slide 30: Appendix
Appendix
Slide 31: NPBC Peer Group
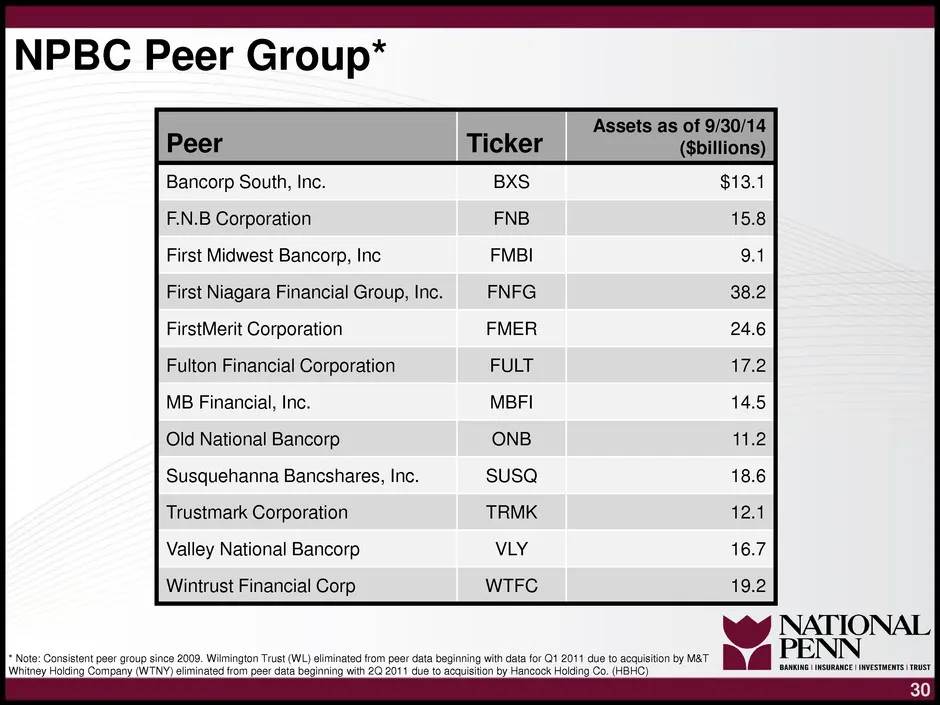
NPBC Peer Group* Assets as of 9/30/14 Peer Ticker ($billions) Bancorp South, Inc. $13.1 F.N.B Corporation 15.8 First Midwest Bancorp, Inc oO First Niagara Financial Group, Inc. 38.2 FirstMerit Corporation 24.6 Fulton Financial Corporation 17.2 MB Financial, Inc. 14.5 Old National Bancorp 11.2 Susque
Slide 32: Reconciliation of Non-GAAP Measures
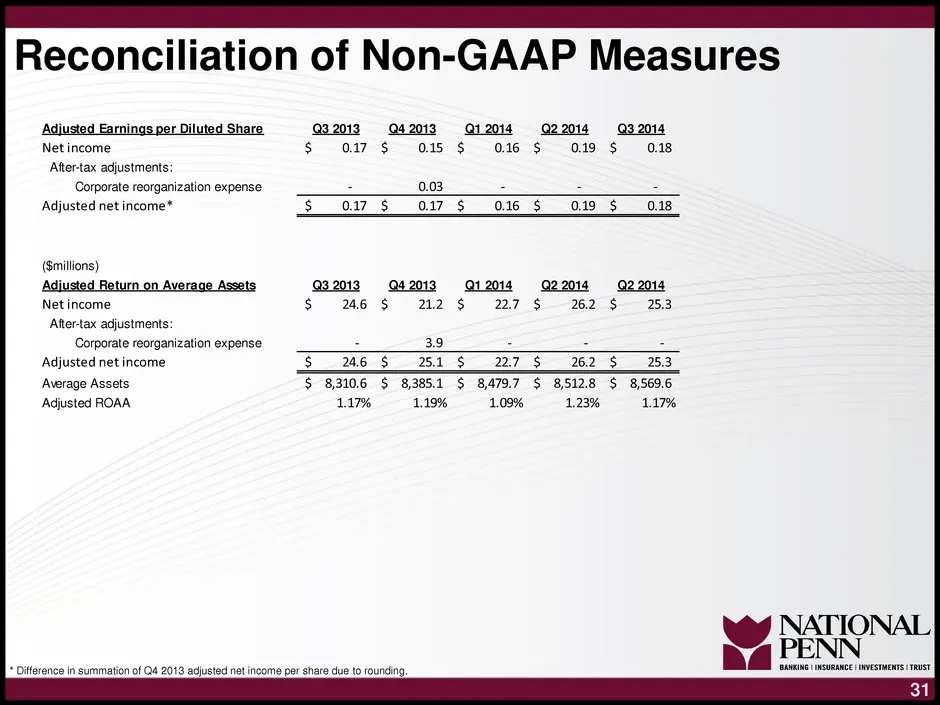
Reconciliation of Non-GAAP Measures 1 932013 Q42013. Qi 2014 «2.20143. 2014 Net income 017 $ 015 $ 016 $ 019 $ 0.18 Alter-tax adjustments: O17 $017 oie $ 019 $ 018 (Smitlions) Adjusted Return on Average Assets Q32013 Q42013 Q12014 = Q22014 = G2 2014 Net income 246 $ 212 27 $62 $— 353 Atter-tax adjus
Slide 33: Reconciliation of Non-GAAP Measures
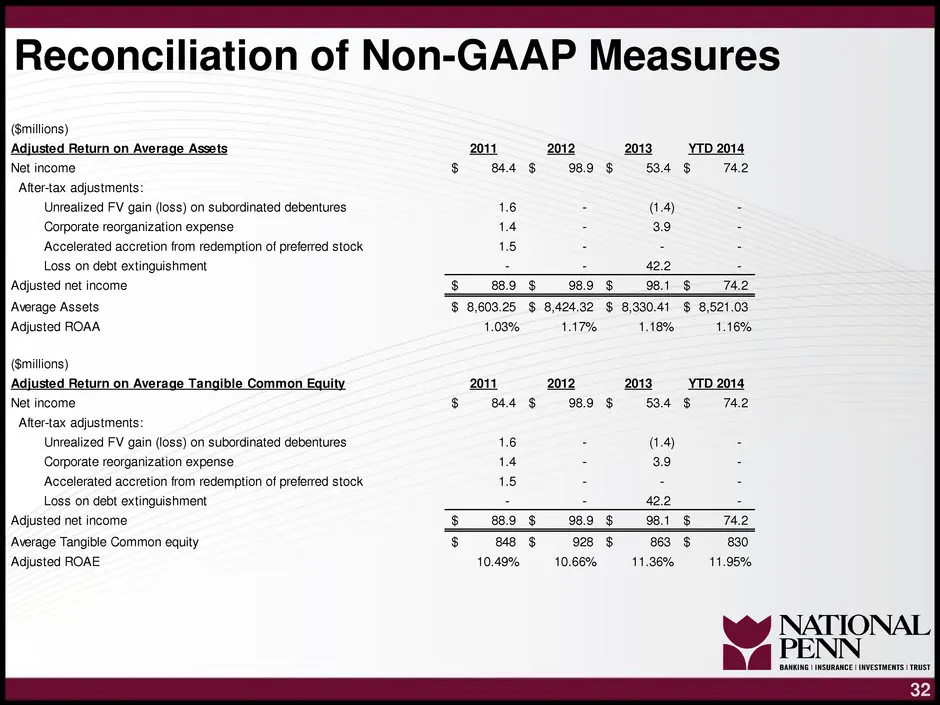
Reconciliation of Non-GAAP Measures er) turn on Average Assets 2013 YTD nae 53.4 § After-tax bee iments: realized FV gain (loss) on subordinated debentures Grose reorganization expenst Loss on debt extinguishment Adjusted net income § 3 ; a Average Assets. $ 8,603.25 $ 8,424.32 $ 8,390.41 § 8,521.03
Slide 34: Reconciliation of Non-GAAP Measures
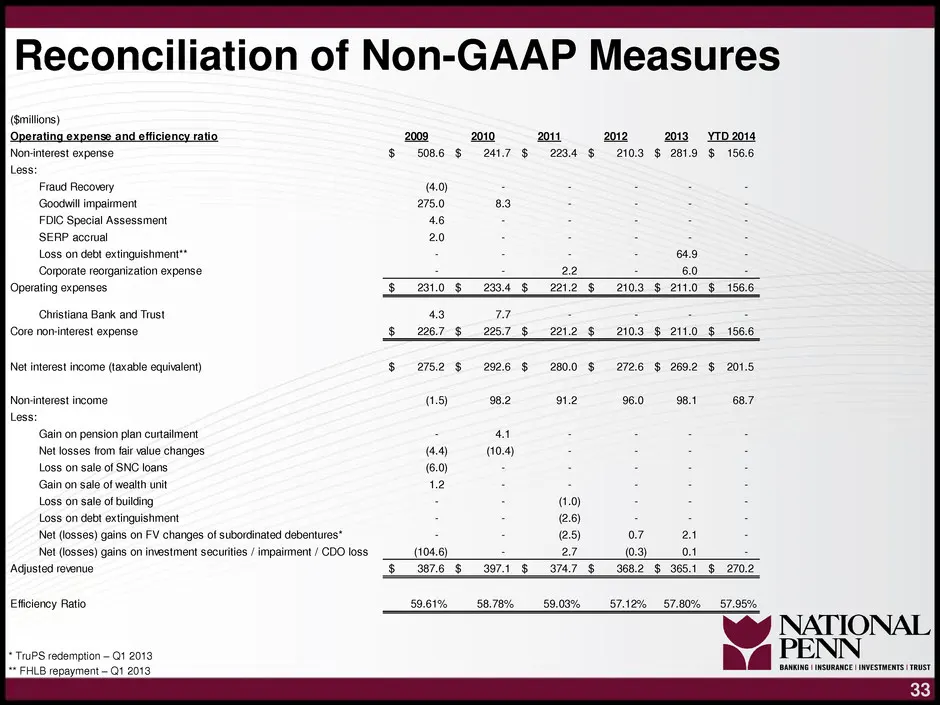
Reconciliation of Non-GAAP Measures (Smitions) ‘Operating expense and efficiency ratio 20g 0a 222013 YTD 2014 Nominterest expense $ 5086 $ 26.7 $ 284 $ 2103 $ 2819 $ 1566 Less: Fraud Recover (4.0) : ‘Goodwill impaliment 275.0 83 FDIC Special Assessment 46 ‘SERP accrual 20 = Loss on debt extinguishme
Slide 35: Reconciliation of Non-GAAP Measures
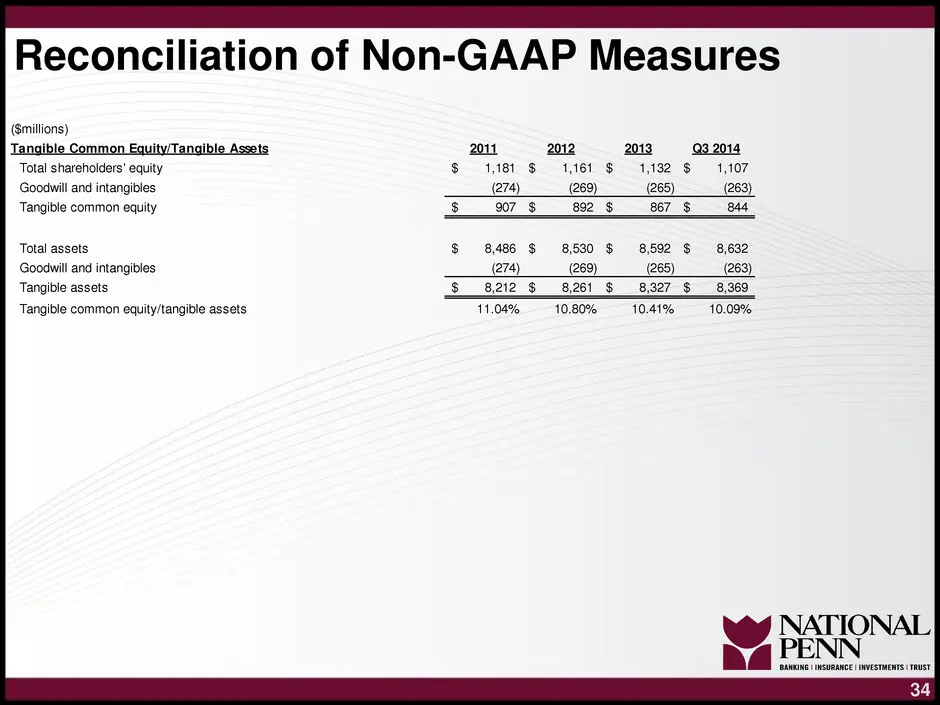
Reconciliation of Non-GAAP Measures (Smillions) Total shareholders’ equity Goodwill and intangibles Tangible common equity Total assets Goodwill and intangibles Tangible assets Tangible common equity/tangible assets 11.04% 10.80% 10.41%
Slide 36: Investor Relations Information
Investor Relations Information e The following information can be found on our Investor Relations Web site at www.nationalpennbancshares.com e SEC Filings e Corporate News e Analyst Estimates e and much more e Contact information - Michael J. Hughes, Chief Financial Officer 484.709.3305 | michael.hu

Slide 37
Source: SEC EDGAR · 8-K filed Nov 12, 2014
More decks from National Penn Bancshares
 BB&T Global Financial Services Conference (September 2015)33 slides · Sep 16, 2015
 Merger or Acquisition (August 2015)13 slides · Aug 18, 2015
 Q2 2015 Earnings Presentation17 slides · Jul 23, 2015
 Q1 2015 Earnings Presentation18 slides · Apr 24, 2015
 Investor Presentation (February 2015)36 slides · Feb 11, 2015
 Q4 2014 Earnings Presentation16 slides · Jan 22, 2015