Sembcorp Industries Ltd. · SGX:U96
Sembcorp Industries — Q1 2016 Earnings Presentation
14 slides from Sembcorp Industries's earnings presentation, May 4, 2016
Slide 1: 1Q2016 Results Announcement
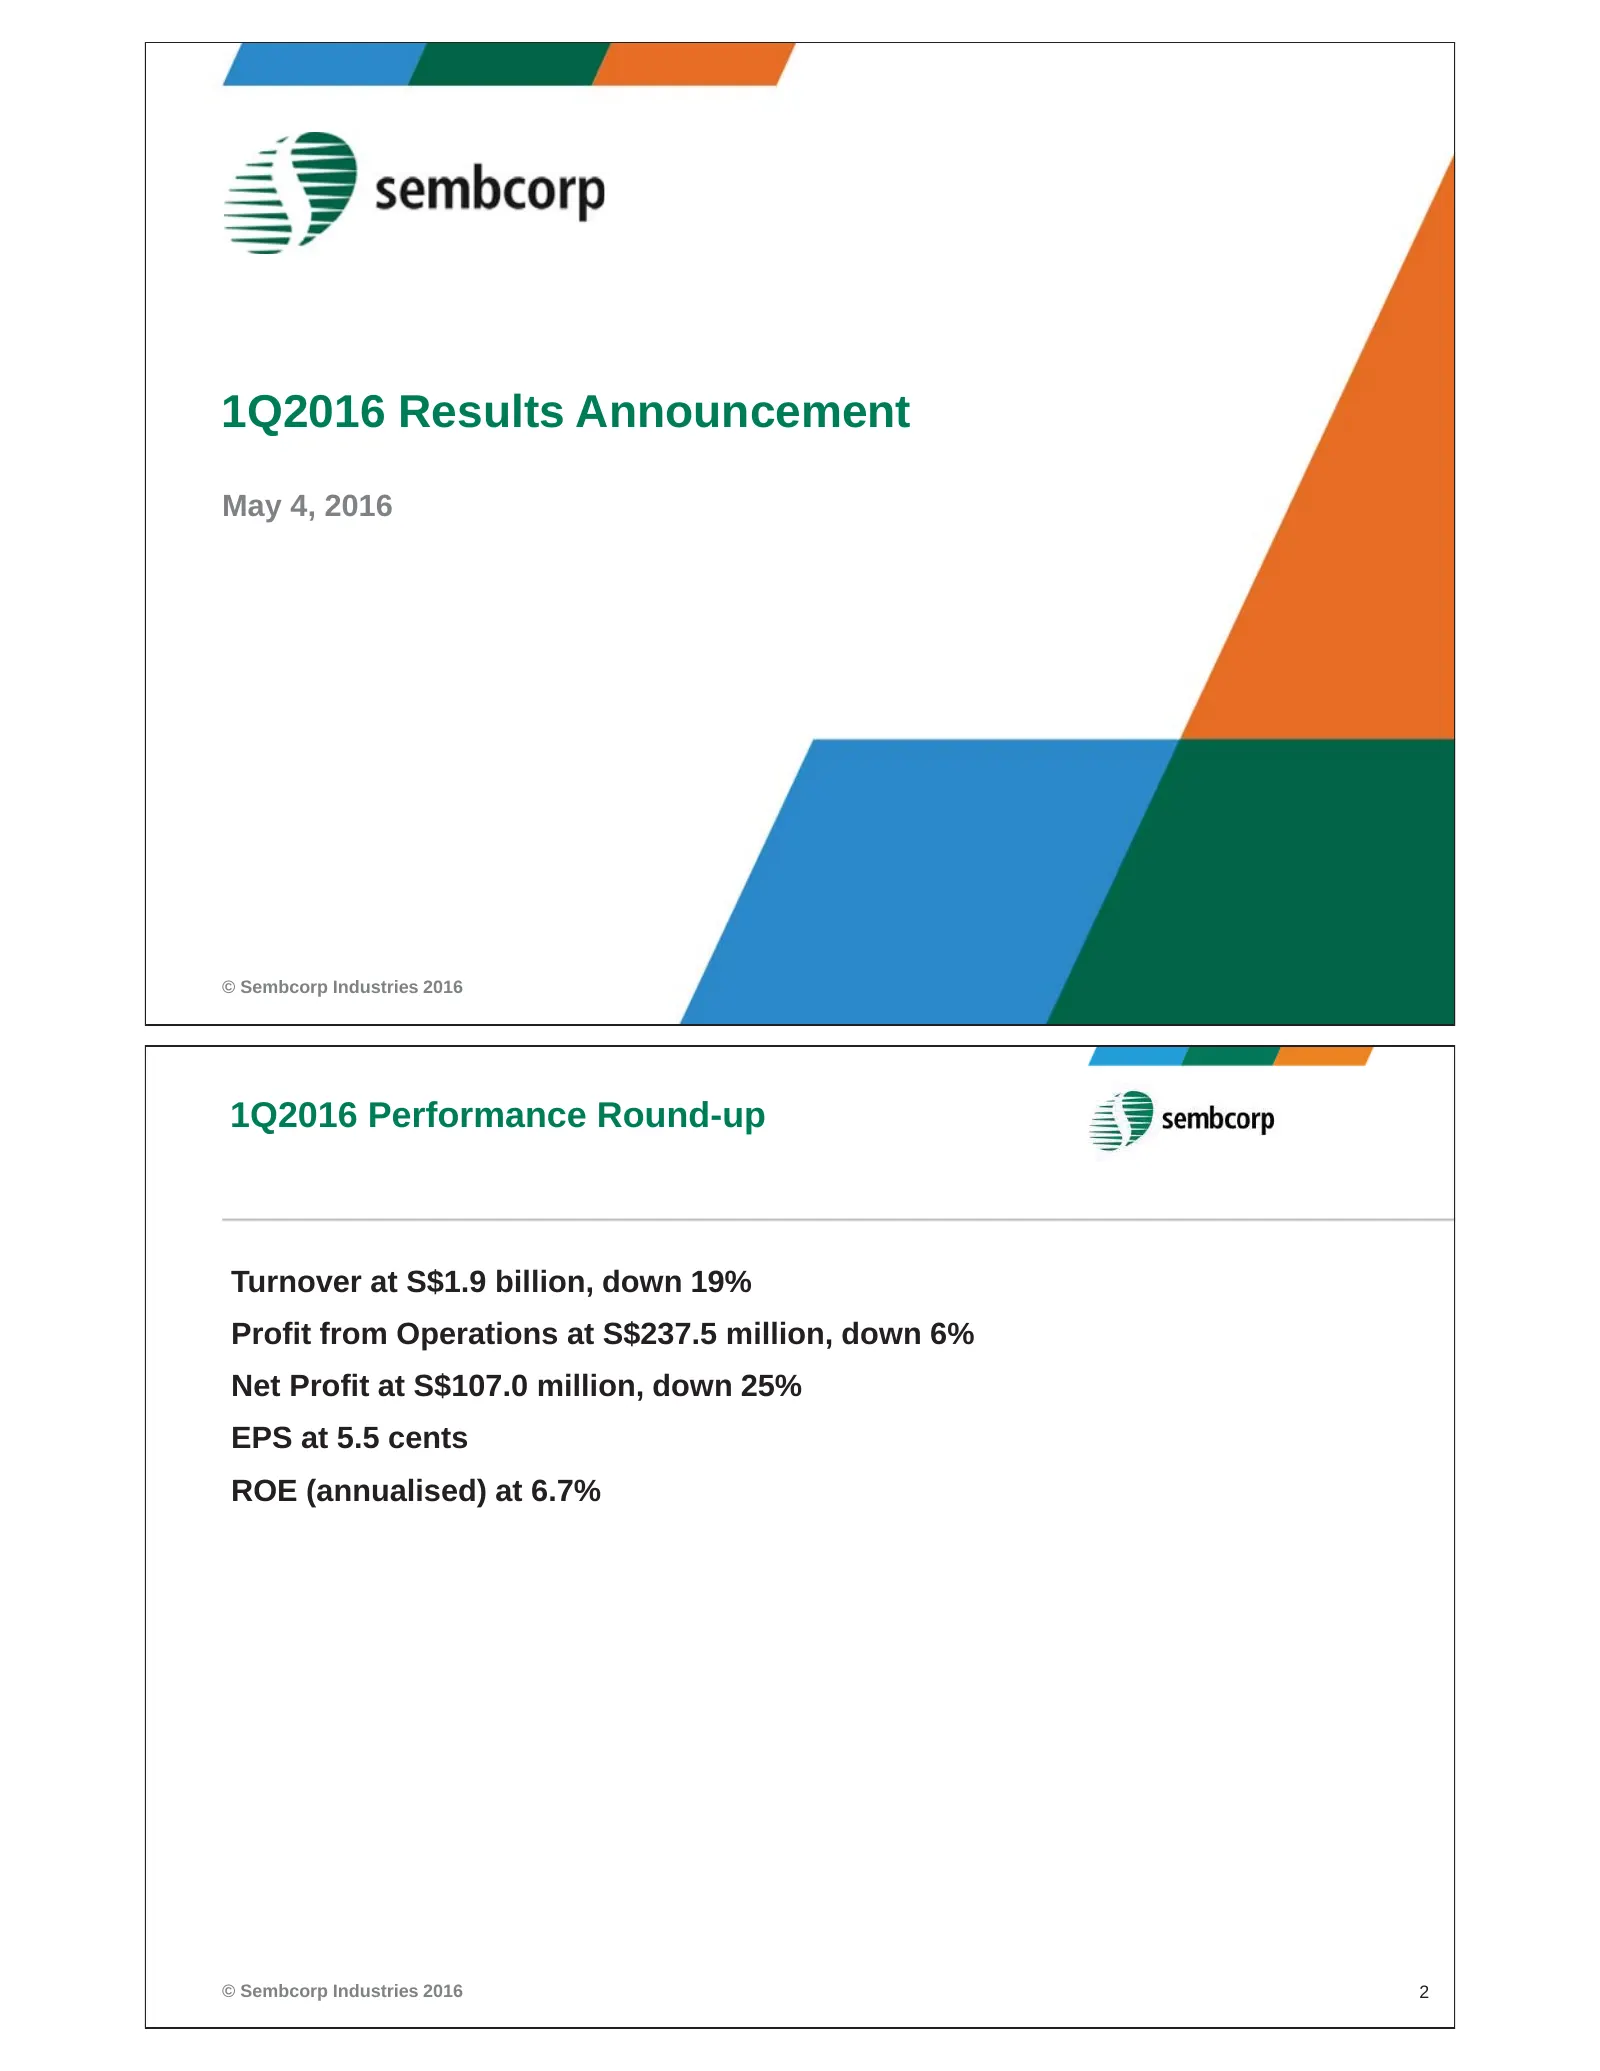
1Q2016 Results Announcement May 4, 2016 © Sembcorp Industries 2016 1Q2016 Performance Round-up Turnover at S$1.9 billion, down 19% Profit from Operations at S$237.5 million, down 6% Net Profit at S$107.0 million, down 25% EPS at 5.5 cents ROE (annualised) at 6.7% © Sembcorp Industries 2016 2
Slide 2: Group Net Profit Mix and Utilities Highlights
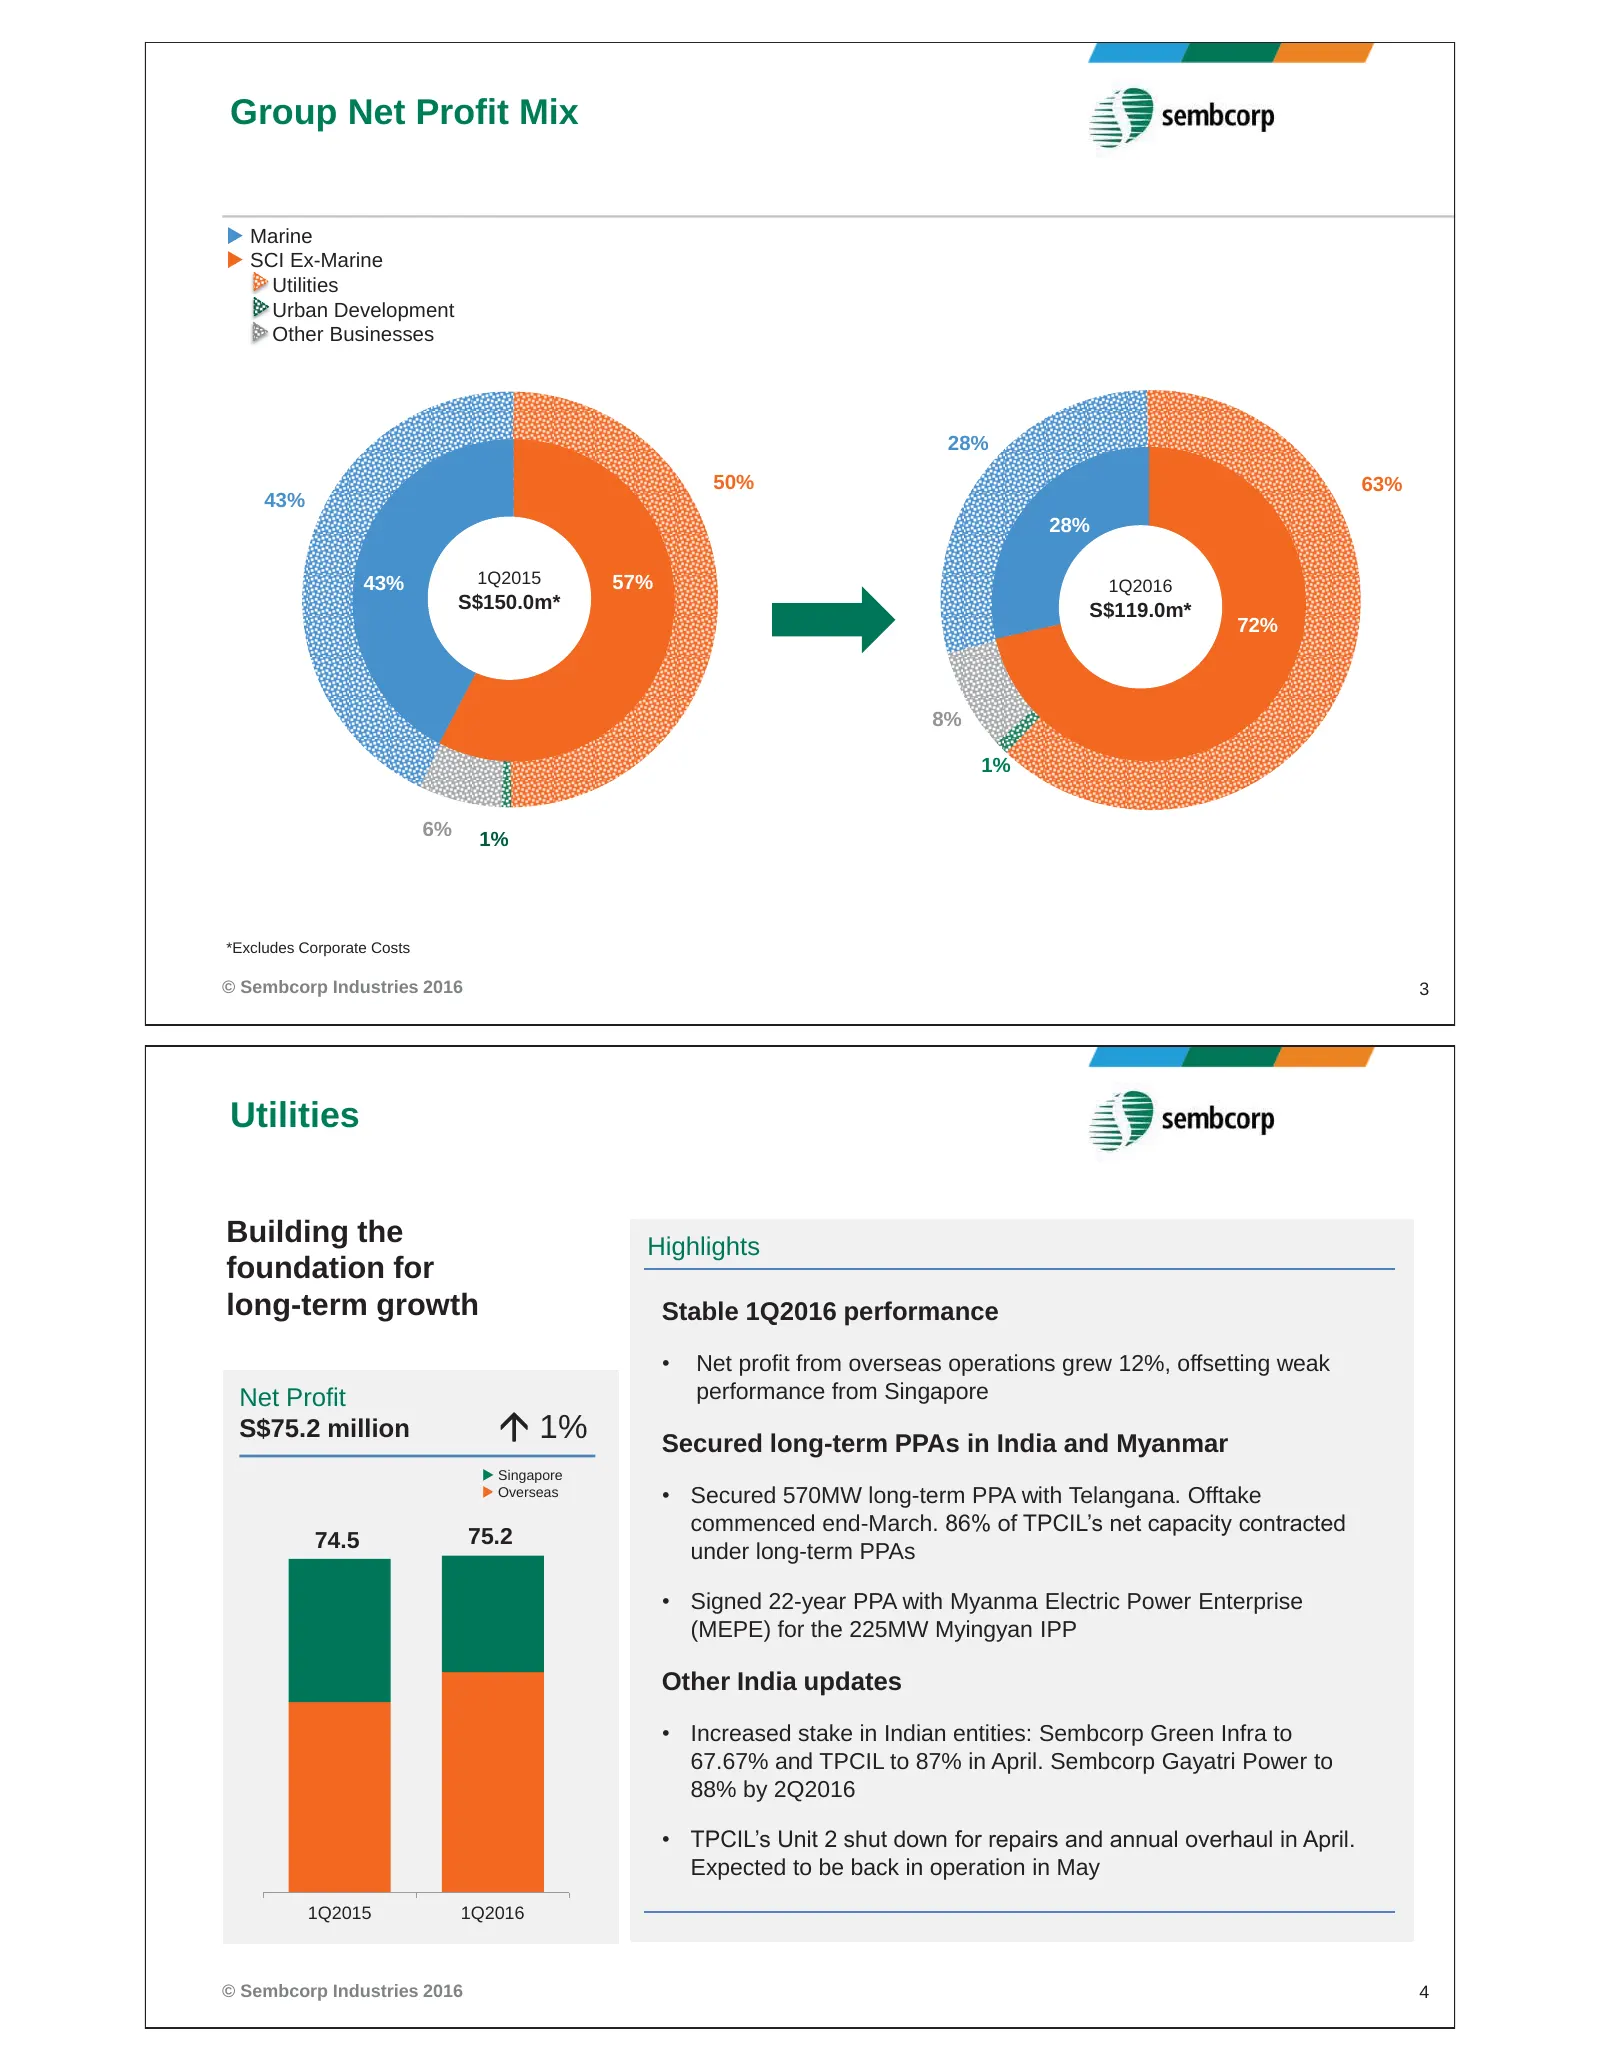
Group Net Profit Mix X Marine X SCI Ex-Marine Utilities Urban Development Other Businesses X 28% 50% 63% 43% 28% 43% 1Q2015 57% 1Q2016 S$150.0m* S$119.0m* 72% 8% 1% 6% 1% *Excludes Corporate Costs © Sembcorp Industries 2016 3 Utilities Building the Highlights foundation for long-term growth Stable 1
Slide 3: Utilities Project Pipeline and Marine Updates
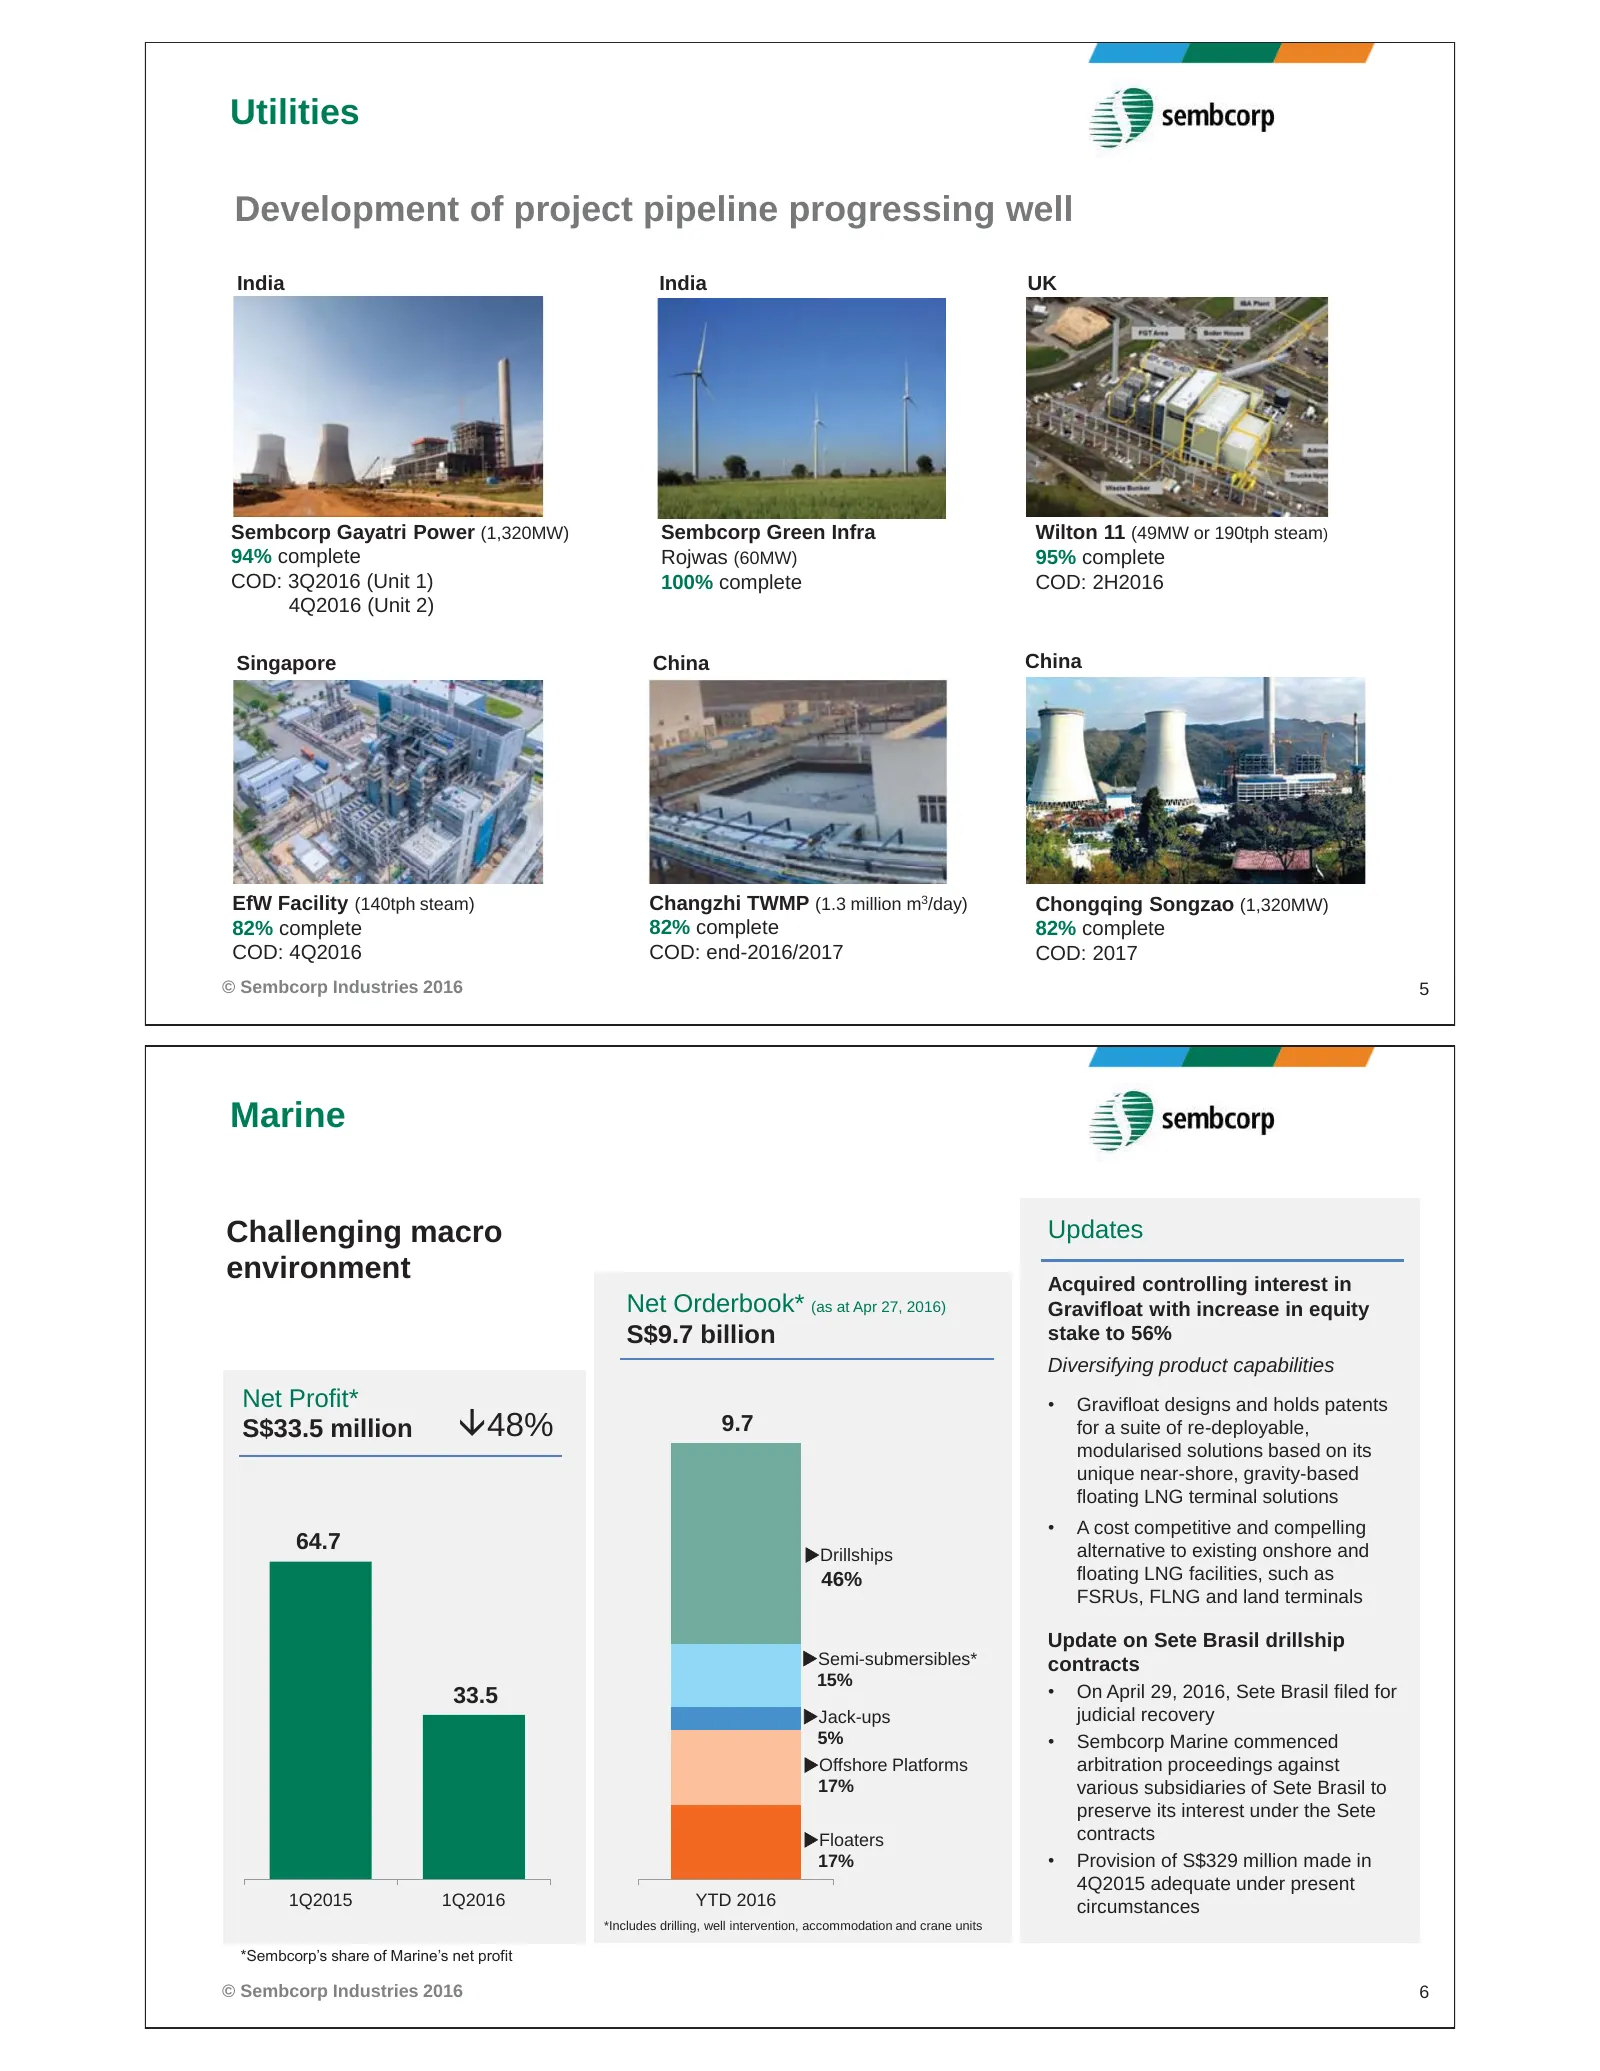
Utilities Development of project pipeline progressing well India India UK Sembcorp Gayatri Power (1,320MW) Sembcorp Green Infra Wilton 11 (49MW or 190tph steam) 94% complete Rojwas (60MW) 95% complete COD: 3Q2016 (Unit 1) 100% complete COD: 2H2016 4Q2016 (Unit 2) Singapore China China Singapore Chin
Slide 4: Urban Development Highlights
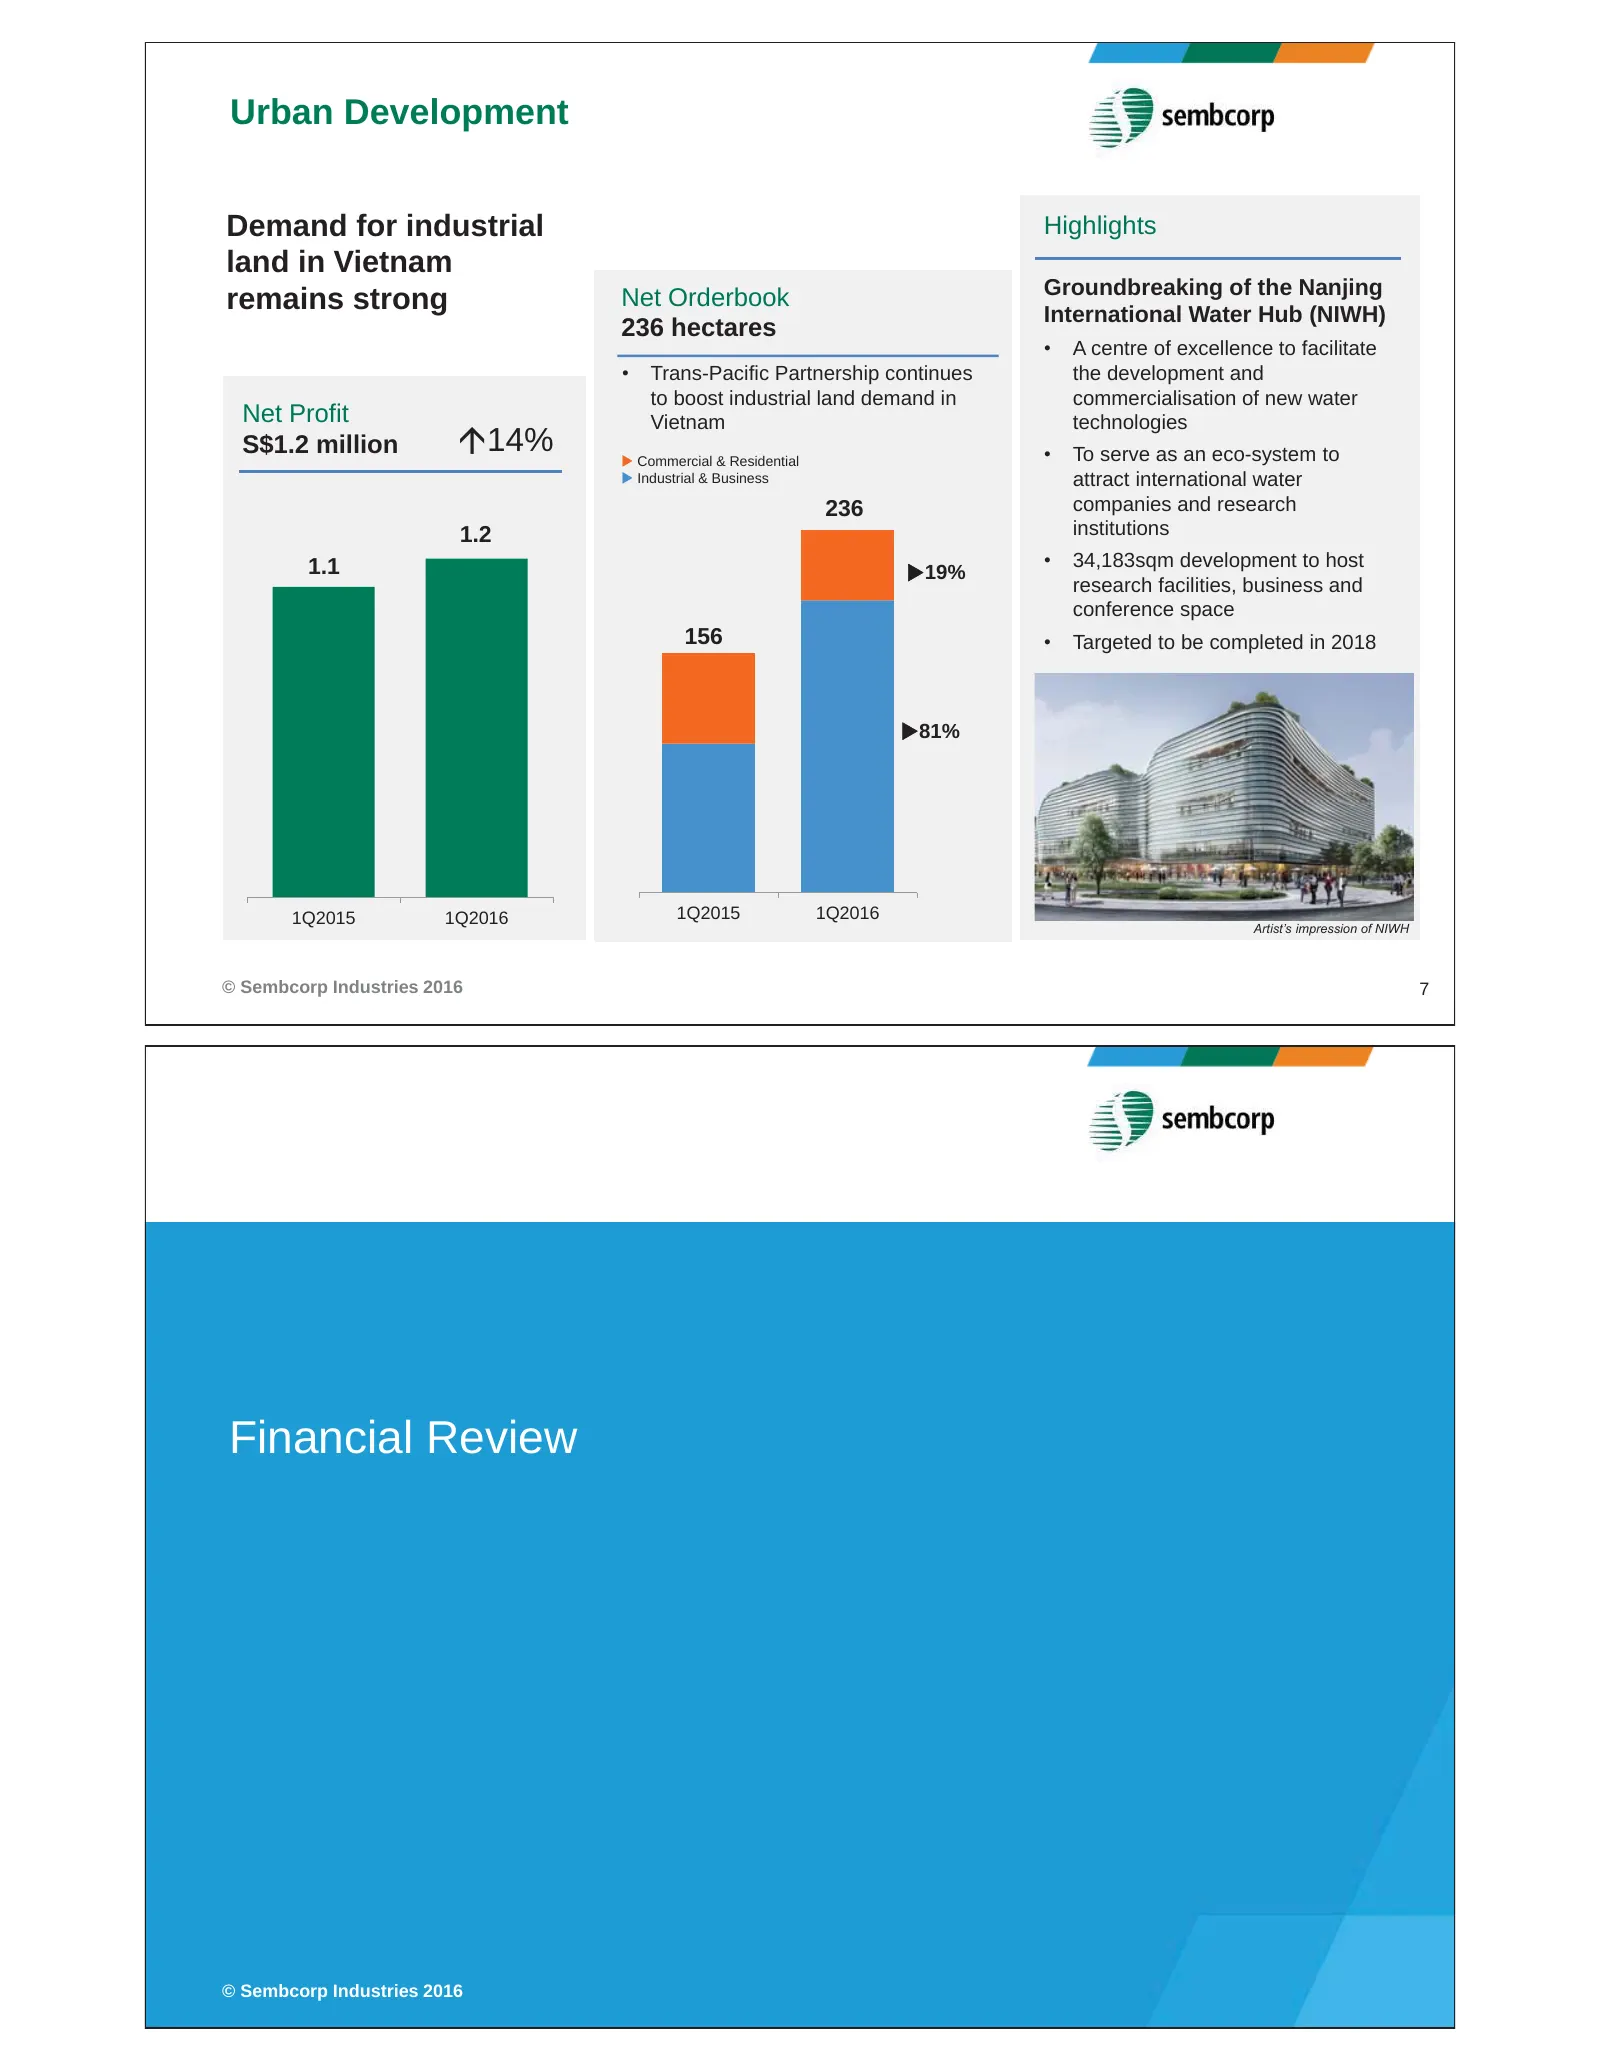
Urban Development Demand for industrial Highlights land in Vietnam Groundbreaking of the Nanjing remains strong Net Orderbook International Water Hub (NIWH) 236 hectares • A centre of excellence to facilitate • Trans-Pacific Partnership continues the development and to boost industrial land demand i
Slide 5: Group Profit & Loss and Turnover
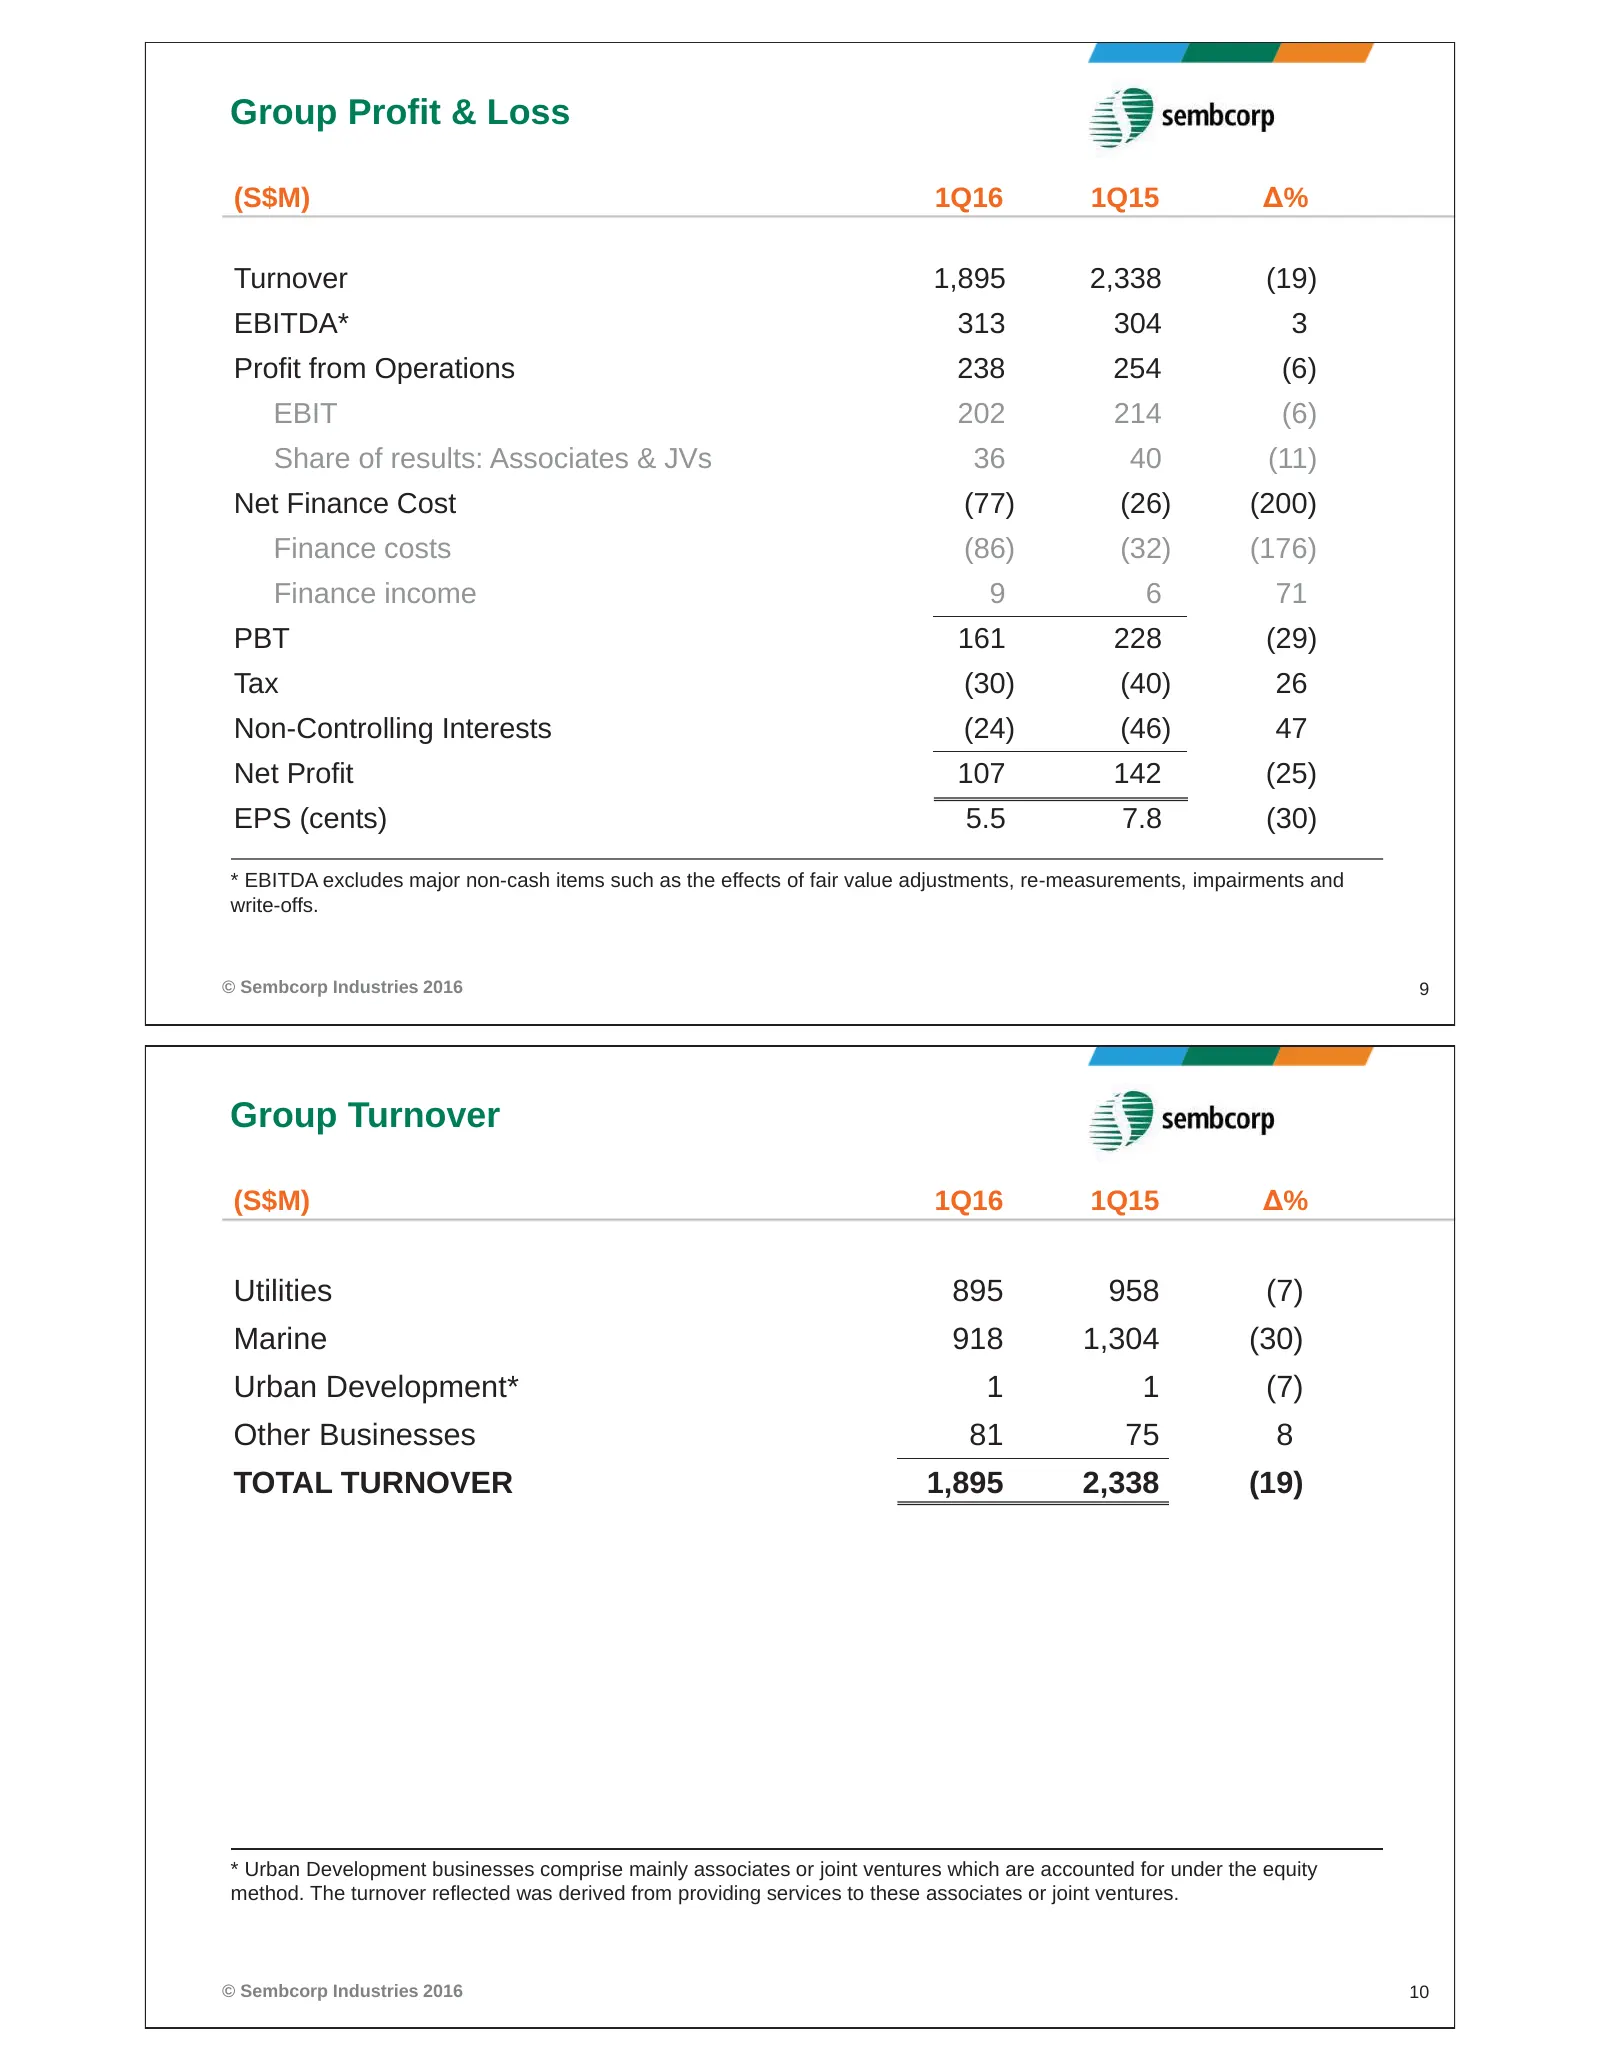
Group Profit & Loss (S$M) 1Q16 1Q15 Δ% Turnover 1,895 2,338 (19) EBITDA* 313 304 3 Profit from Operations 238 254 (6) EBIT 202 214 (6) Share of results: Associates & JVs 36 40 (11) Net Finance Cost (77) (26) (200) Finance costs (86) (32) (176) Finance income 9 6 71 PBT 161 228 (29) Tax (30) (40) 26
Slide 6: Group Profit from Operations and Net Profit
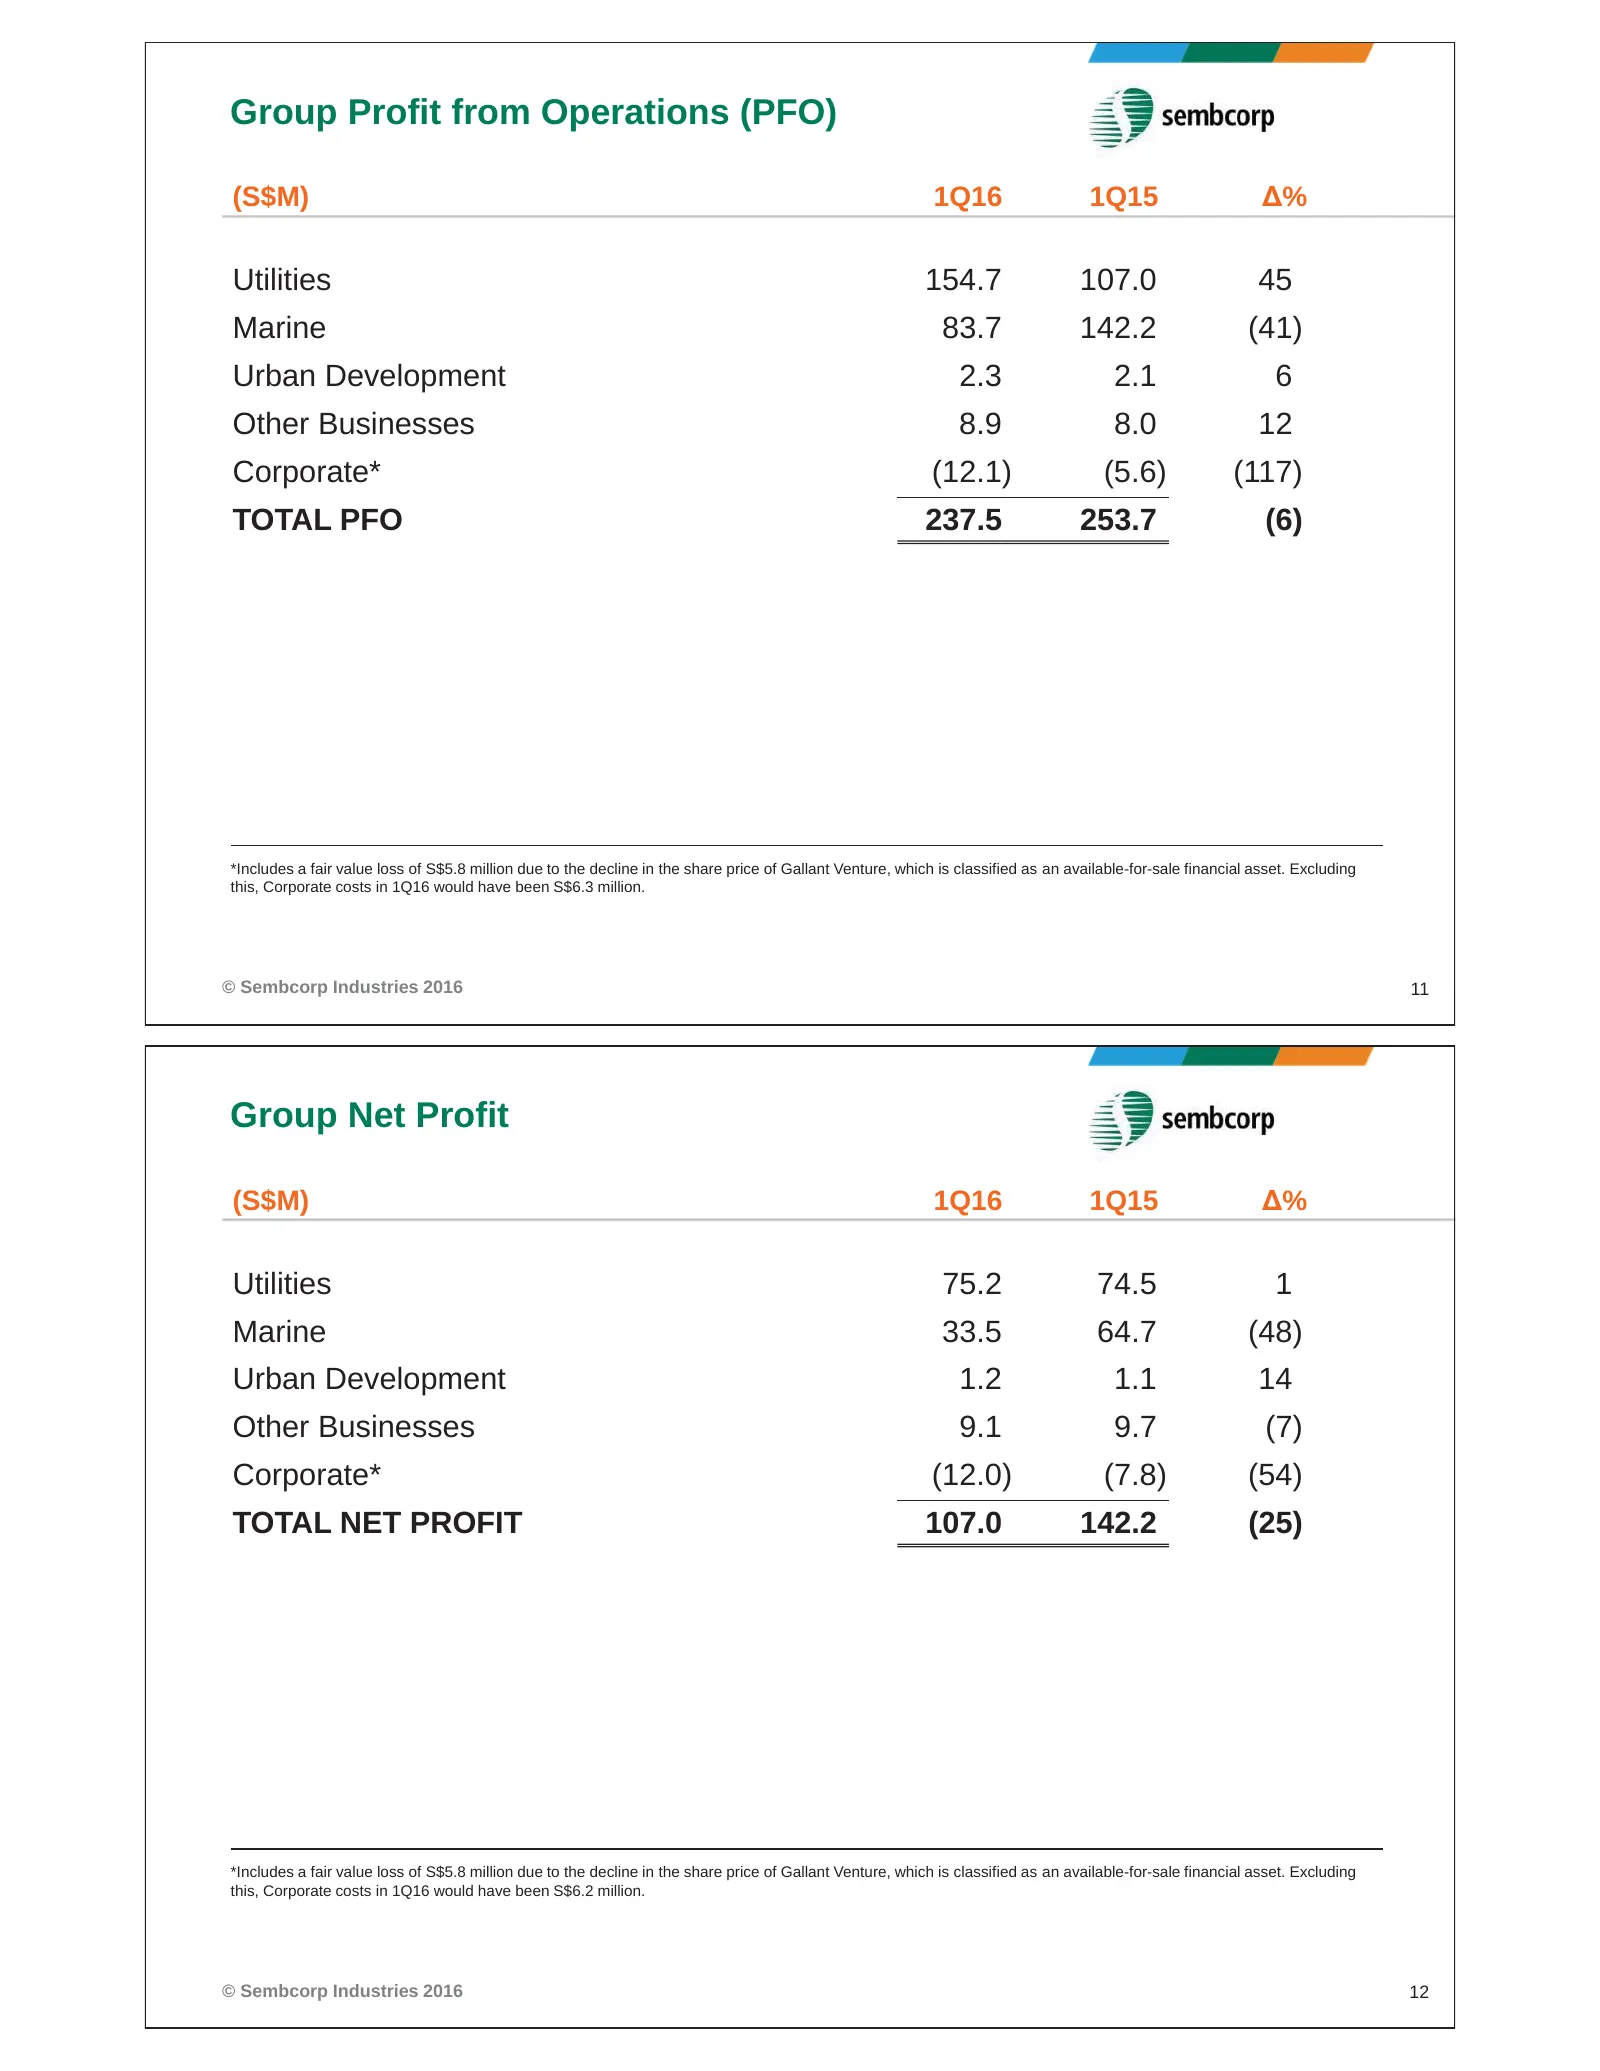
Group Profit from Operations (PFO) (S$M) 1Q16 1Q15 Δ% Utilities 154.7 107.0 45 Marine 83.7 142.2 (41) Urban Development 2.3 2.1 6 Other Businesses 8.9 8.0 12 Corporate* (12.1) (5.6) (117) TOTAL PFO 237.5 253.7 (6) *Includes a fair value loss of S$5.8 million due to the decline in the share price of
Slide 7: Utilities Net Profit by Geography and Segment
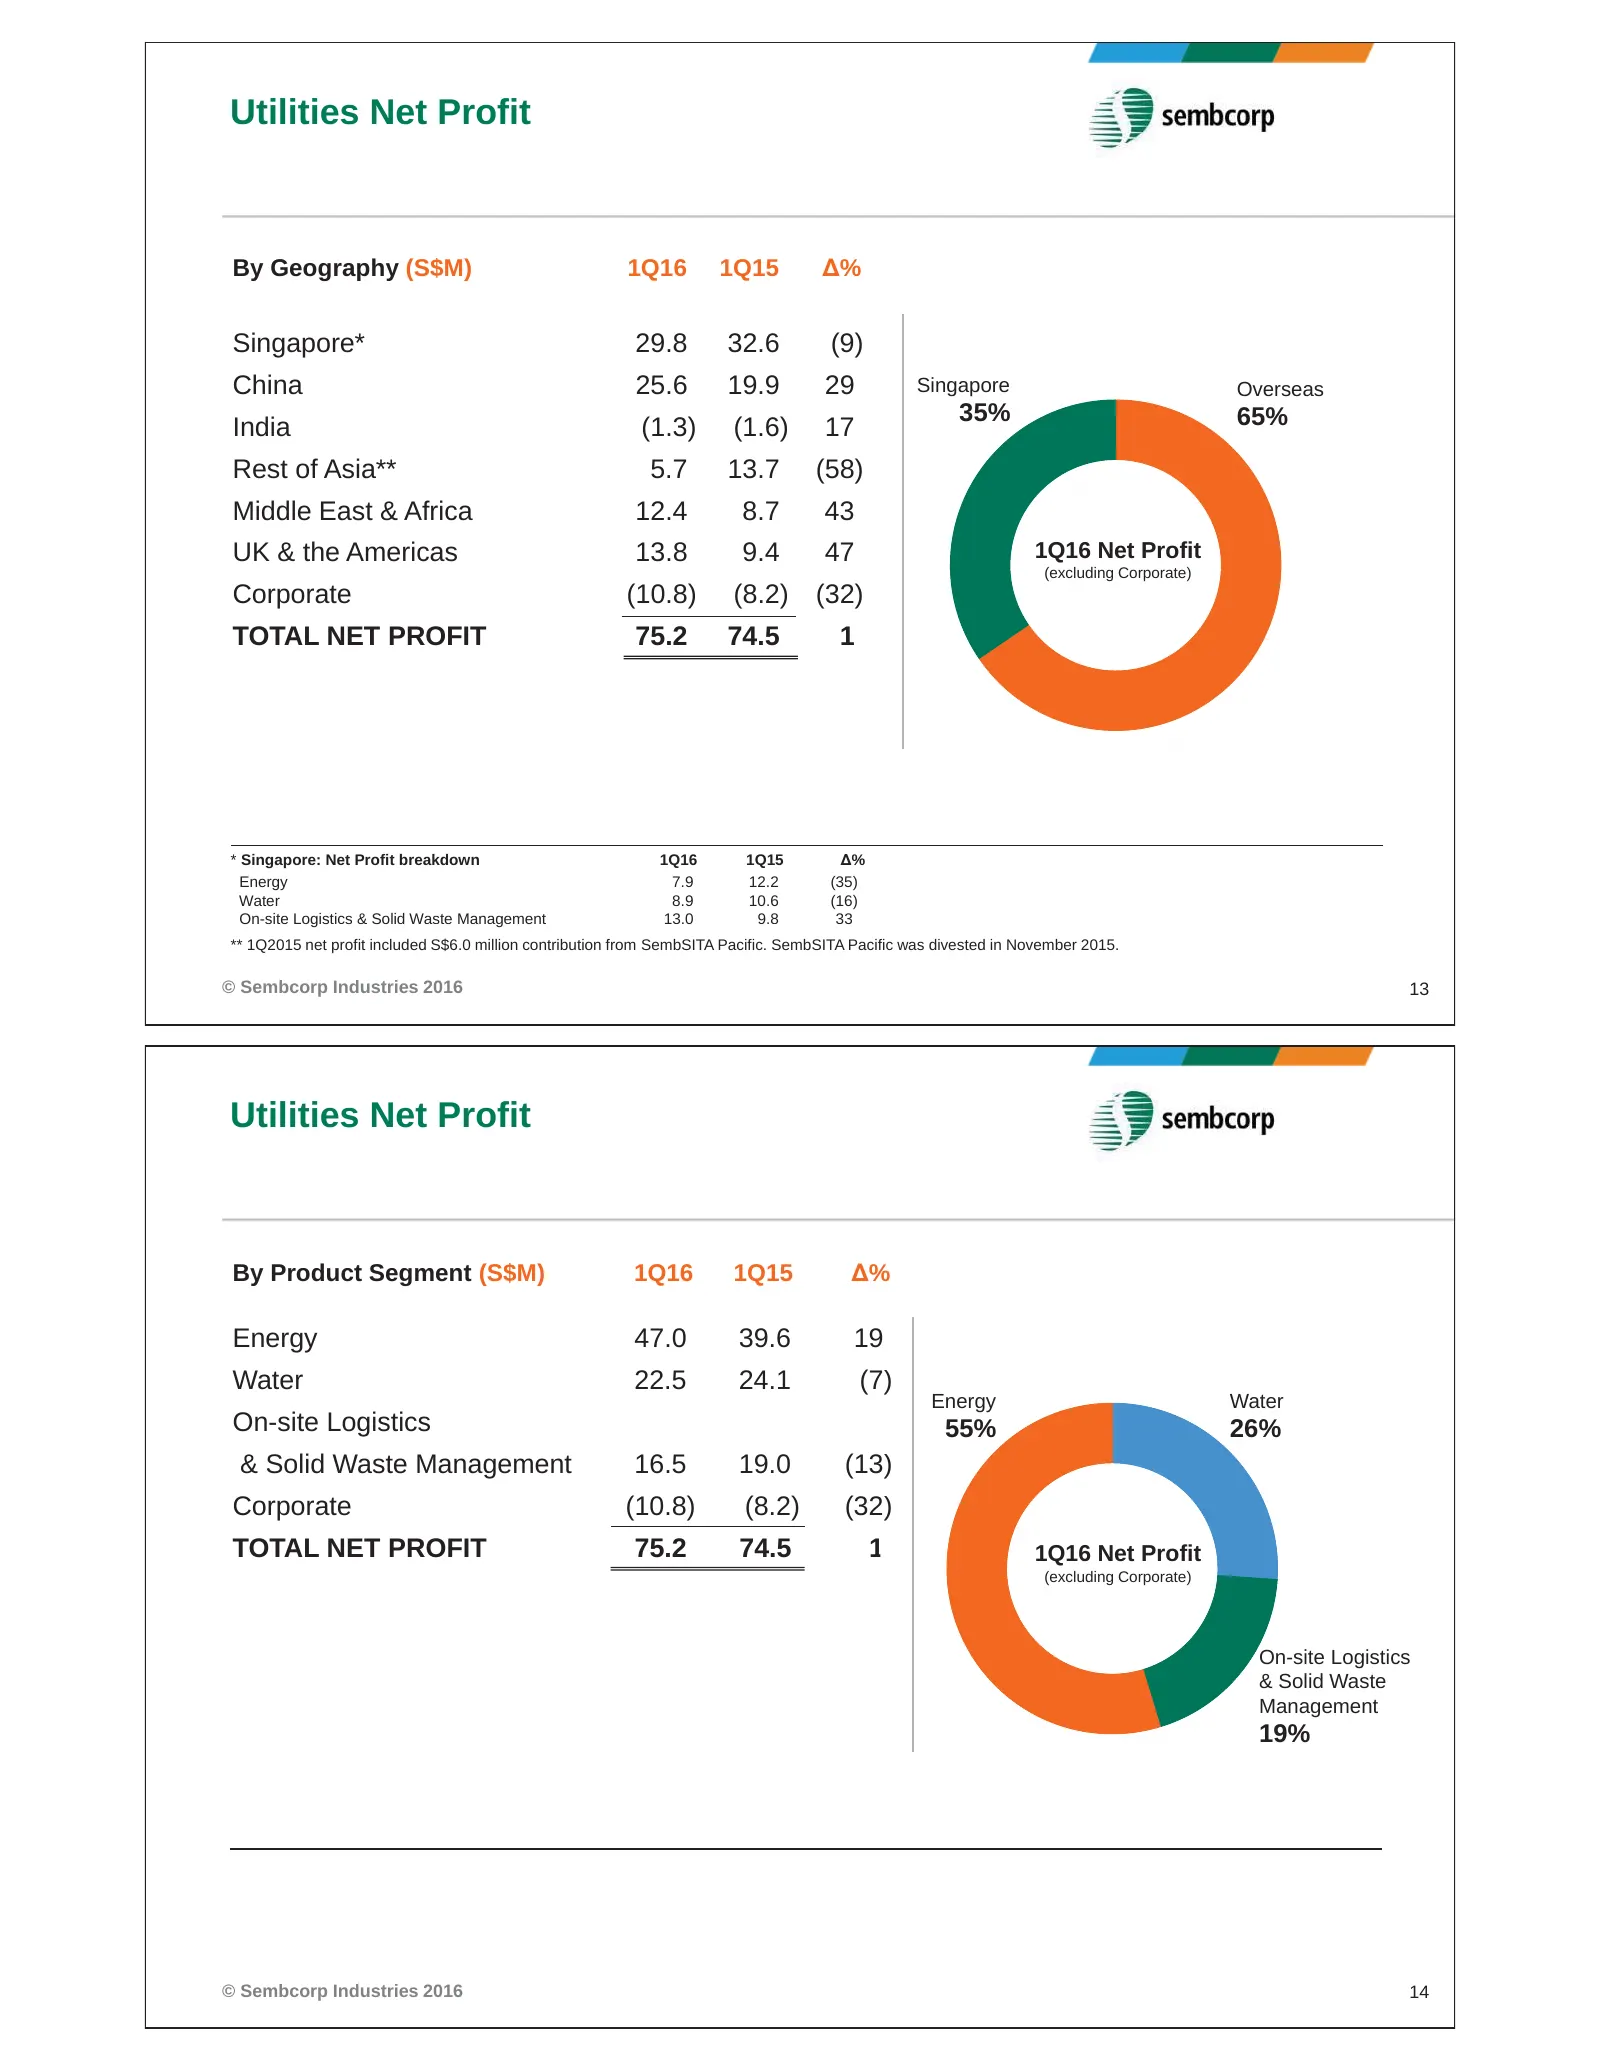
Utilities Net Profit By Geography (S$M) 1Q16 1Q15 Δ% Singapore* 29.8 32.6 (9) China 25.6 19.9 29 Singapore Overseas 35% 65% India (1.3) (1.6) 17 Rest of Asia** 5.7 13.7 (58) Middle East & Africa 12.4 8.7 43 UK & the Americas 13.8 9.4 47 1Q16 Net Profit (excluding Corporate) Corporate (10.8) (8.2) (3
Slide 8: Capex, Equity Investment and Free Cash Flow
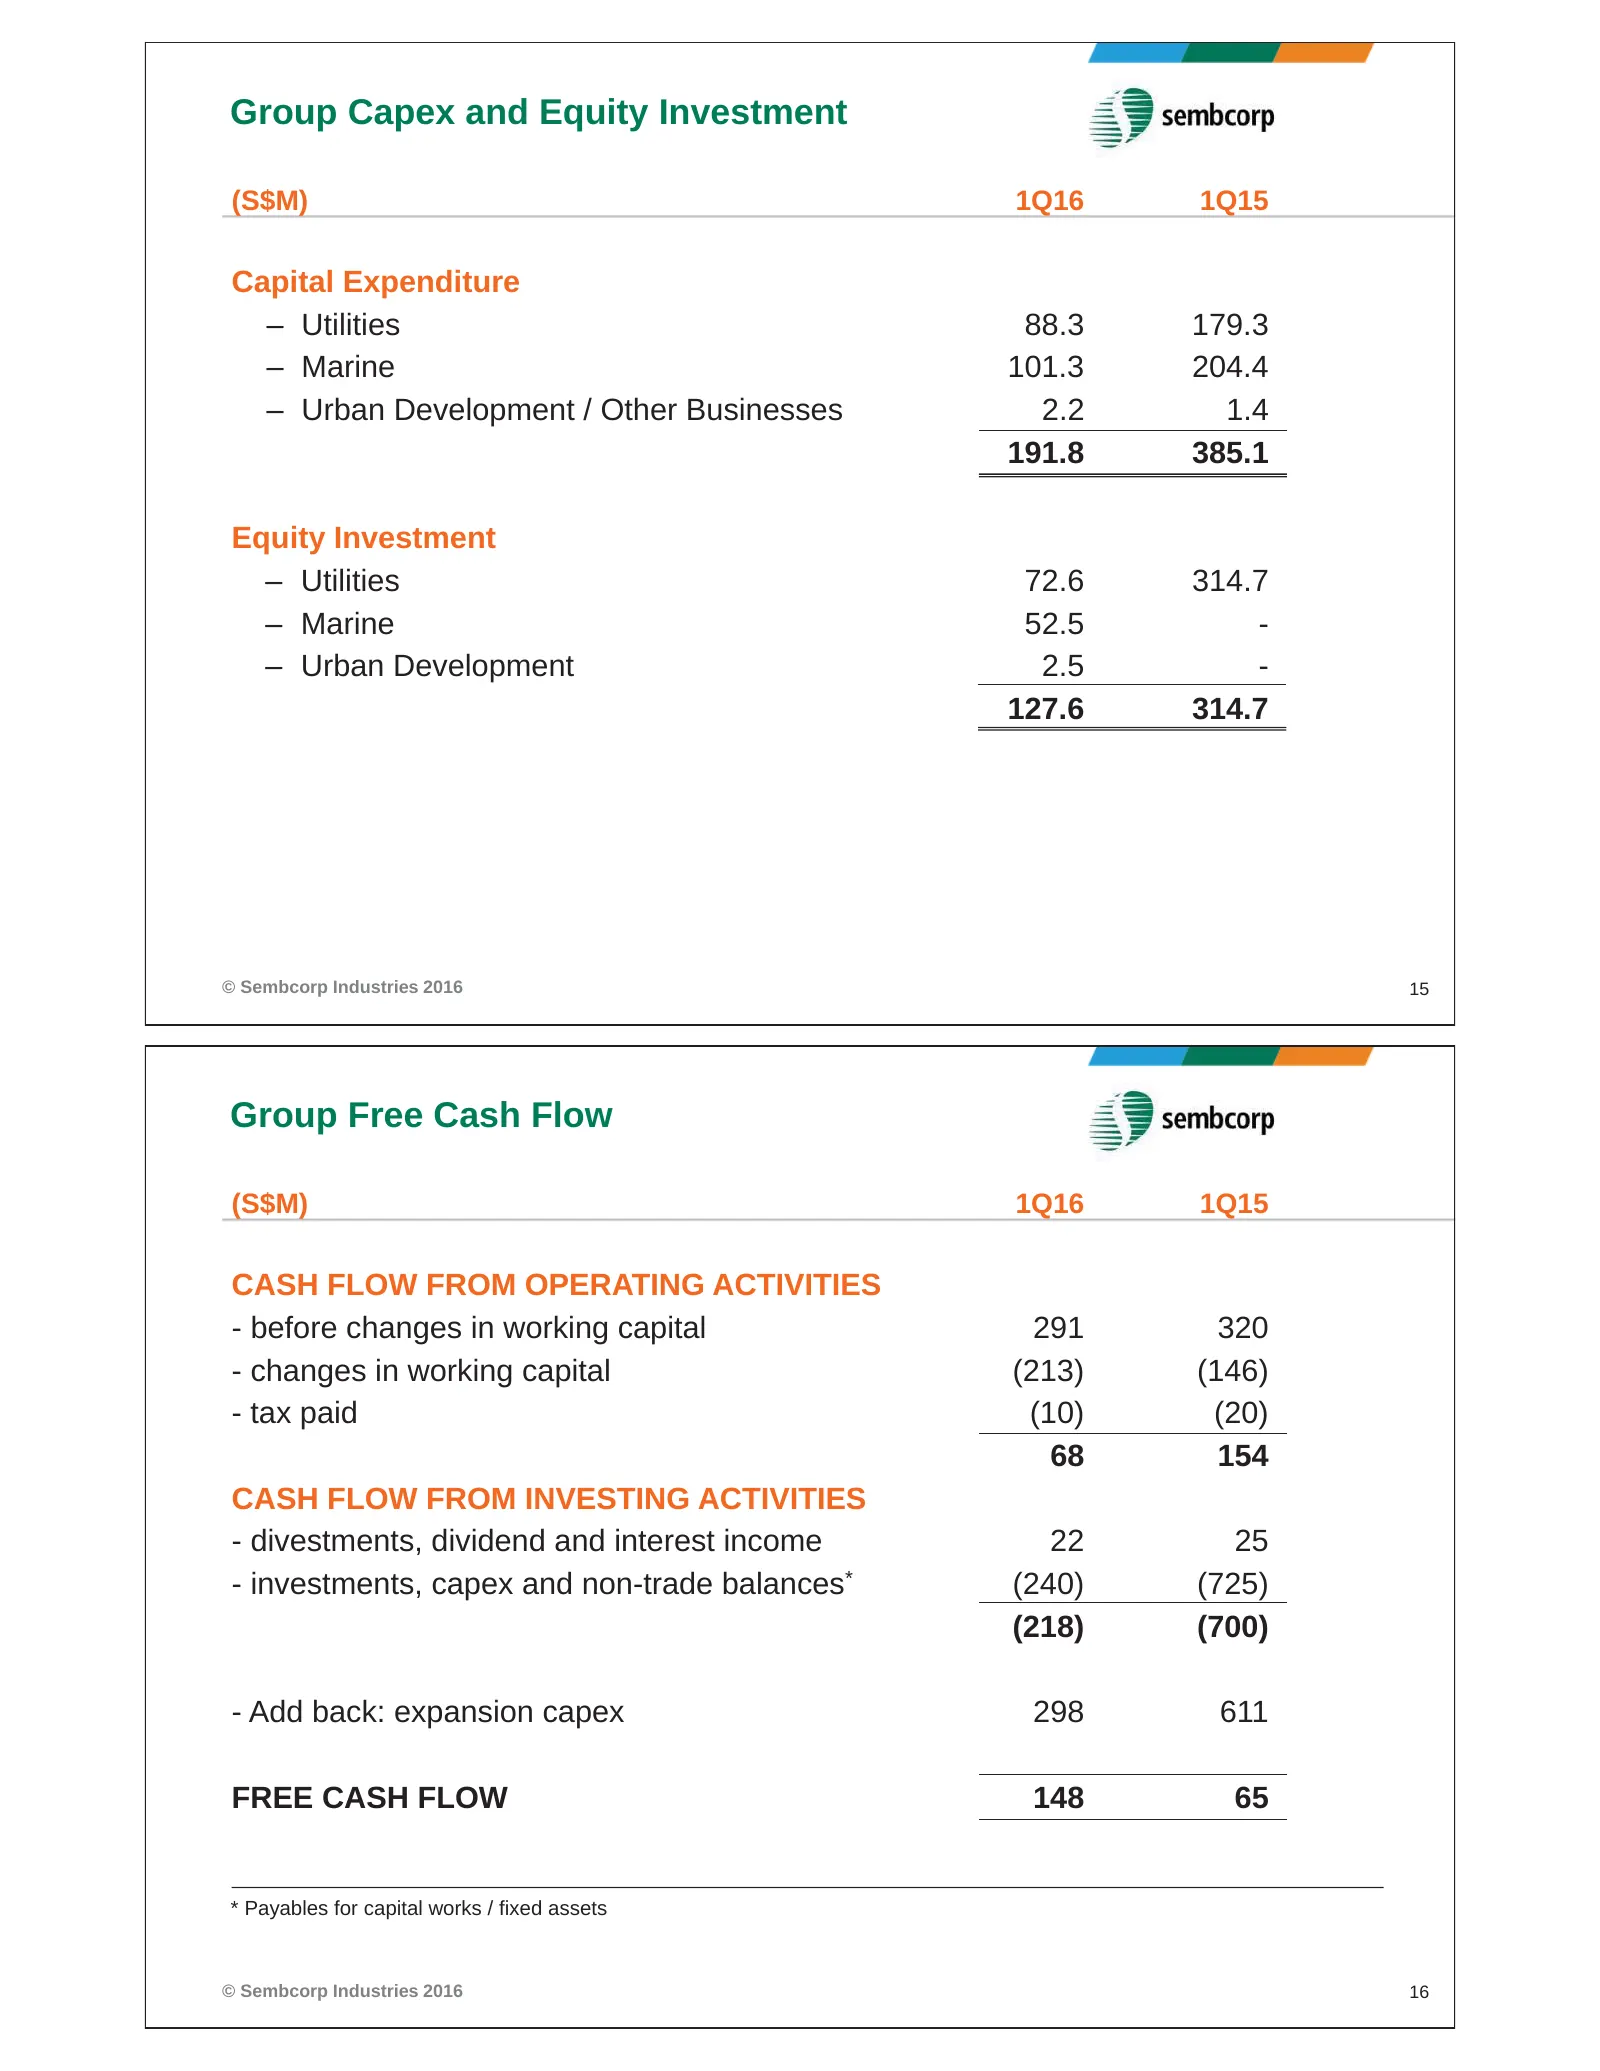
Group Capex and Equity Investment (S$M) 1Q16 1Q15 Capital Expenditure – Utilities 88.3 179.3 – Marine 101.3 204.4 – Urban Development / Other Businesses 2.2 1.4 191.8 385.1 Equity Investment – Utilities 72.6 314.7 – Marine 52.5 - – Urban Development 2.5 - 127.6 314.7 © Sembcorp Industries 2016 15 Gr
Slide 9: Group Borrowings and Financial Indicators
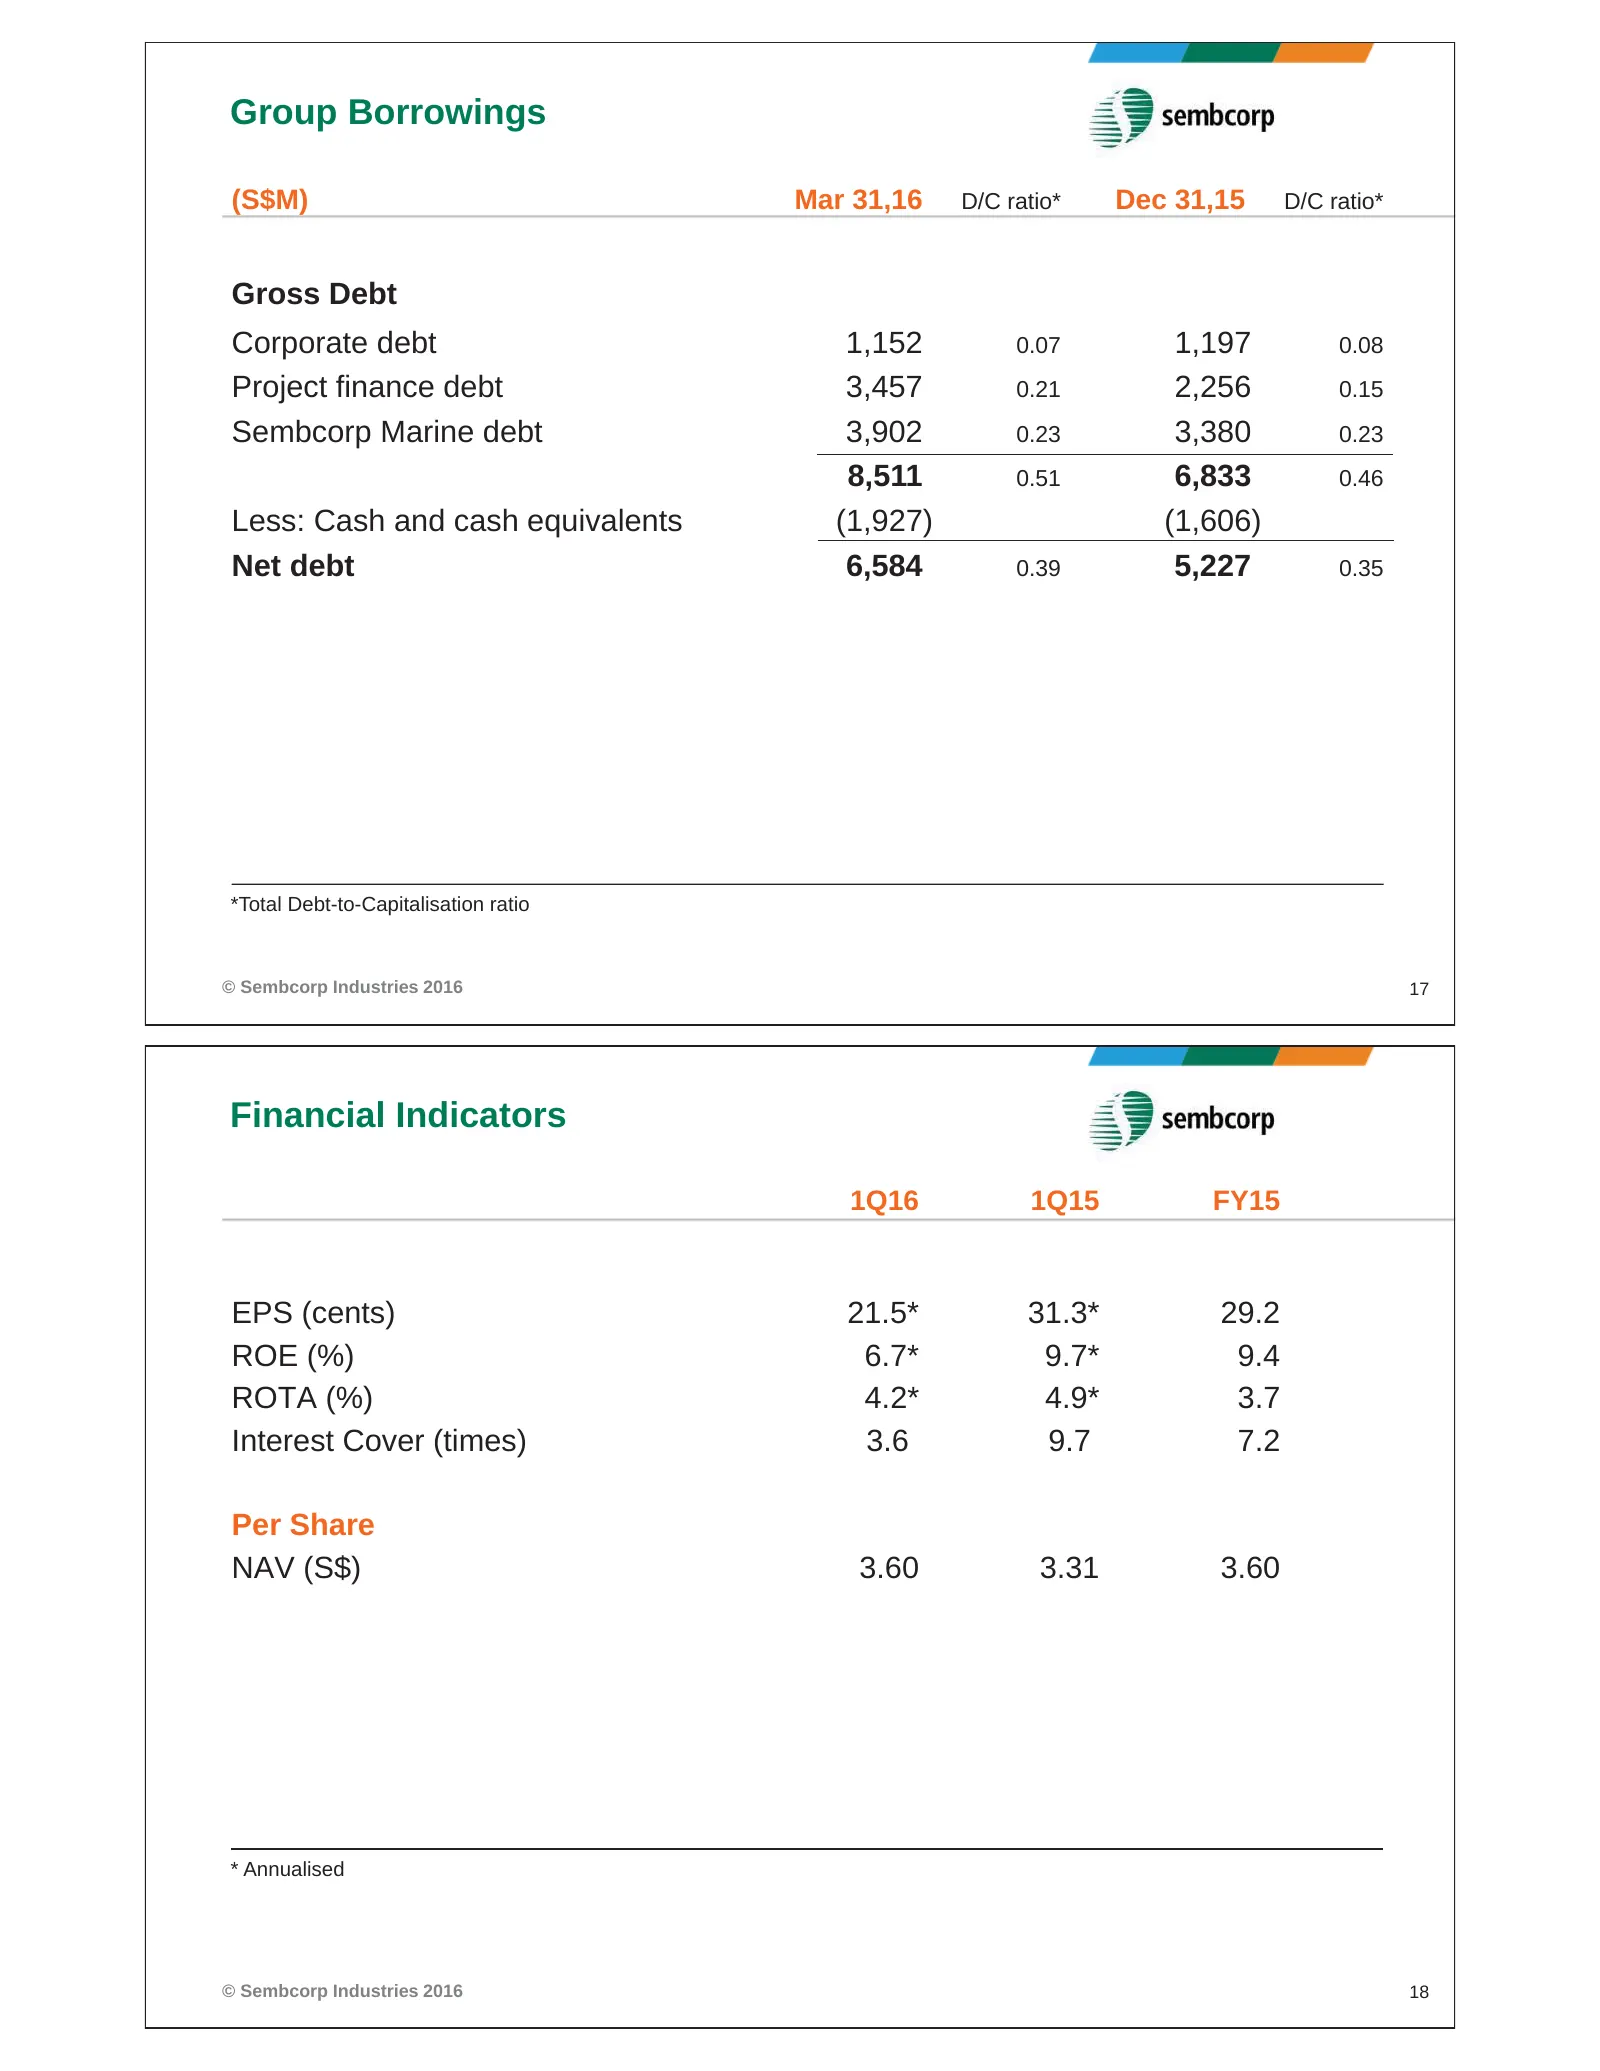
Group Borrowings (S$M) Mar 31,16 D/C ratio* Dec 31,15 D/C ratio* Gross Debt Corporate debt 1,152 0.07 1,197 0.08 Project finance debt 3,457 0.21 2,256 0.15 Sembcorp Marine debt 3,902 0.23 3,380 0.23 8,511 0.51 6,833 0.46 Less: Cash and cash equivalents (1,927) (1,606) Net debt 6,584 0.39 5,227 0.35
Slide 10: Outlook
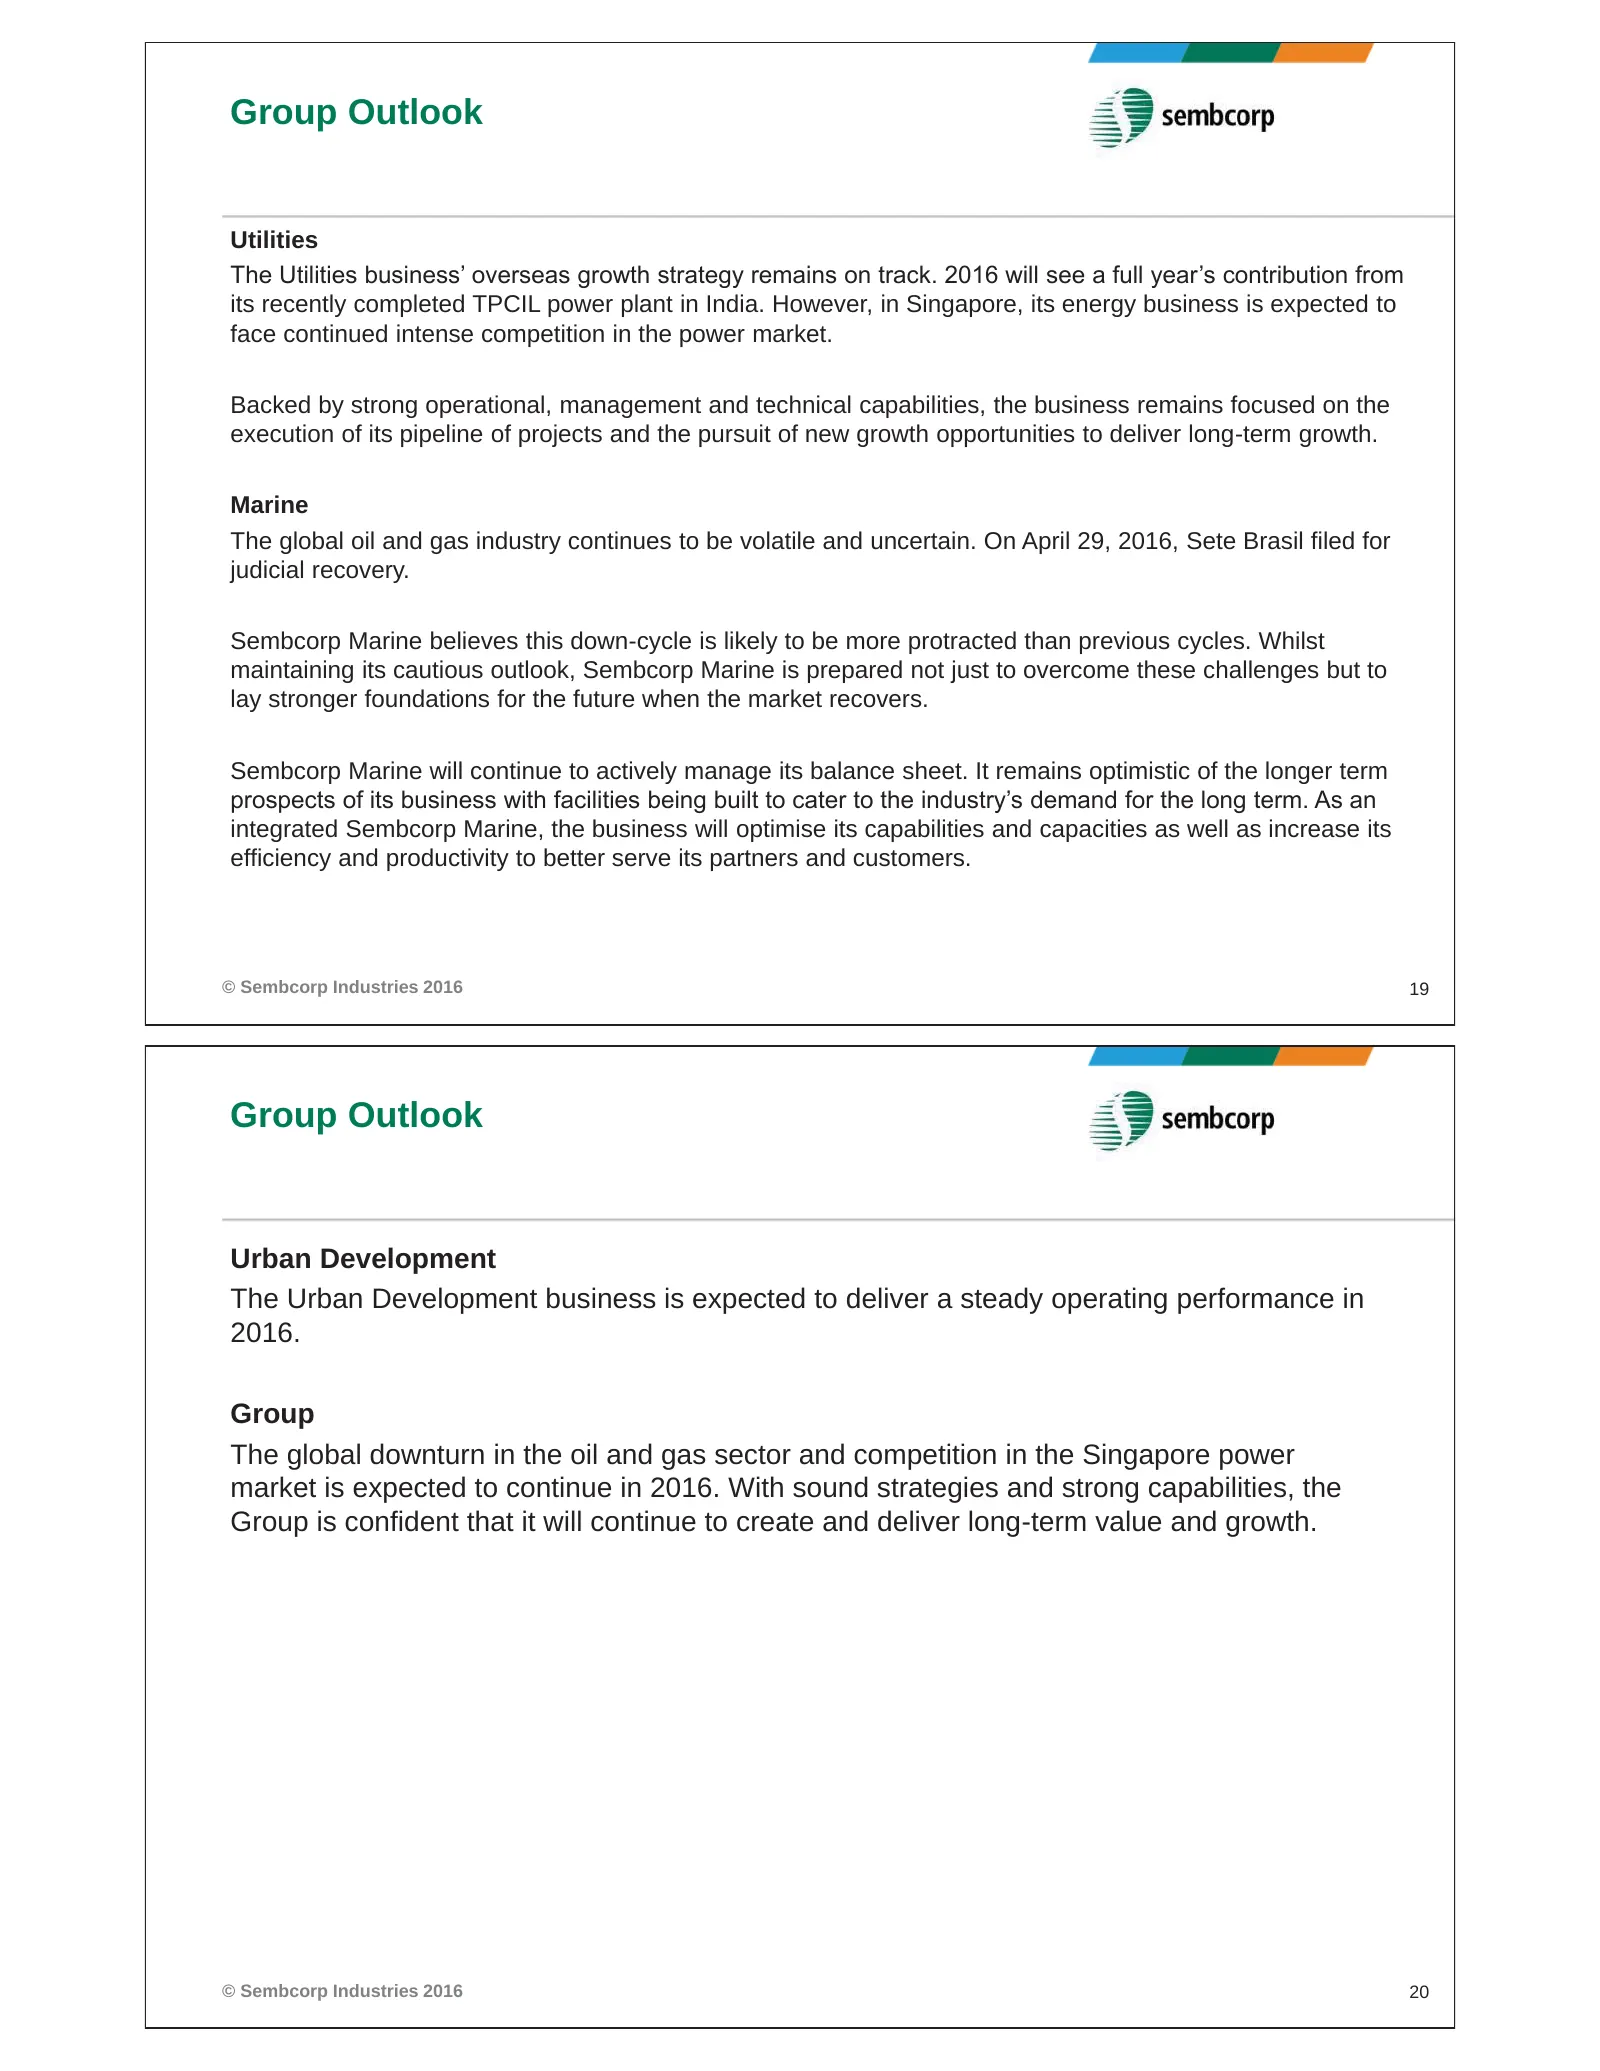
Group Outlook Utilities The Utilities business’ overseas growth strategy remains on track. 2016 will see a full year’s contribution from its recently completed TPCIL power plant in India. However, in Singapore, its energy business is expected to face continued intense competition in the power market
Slide 11: Disclaimer
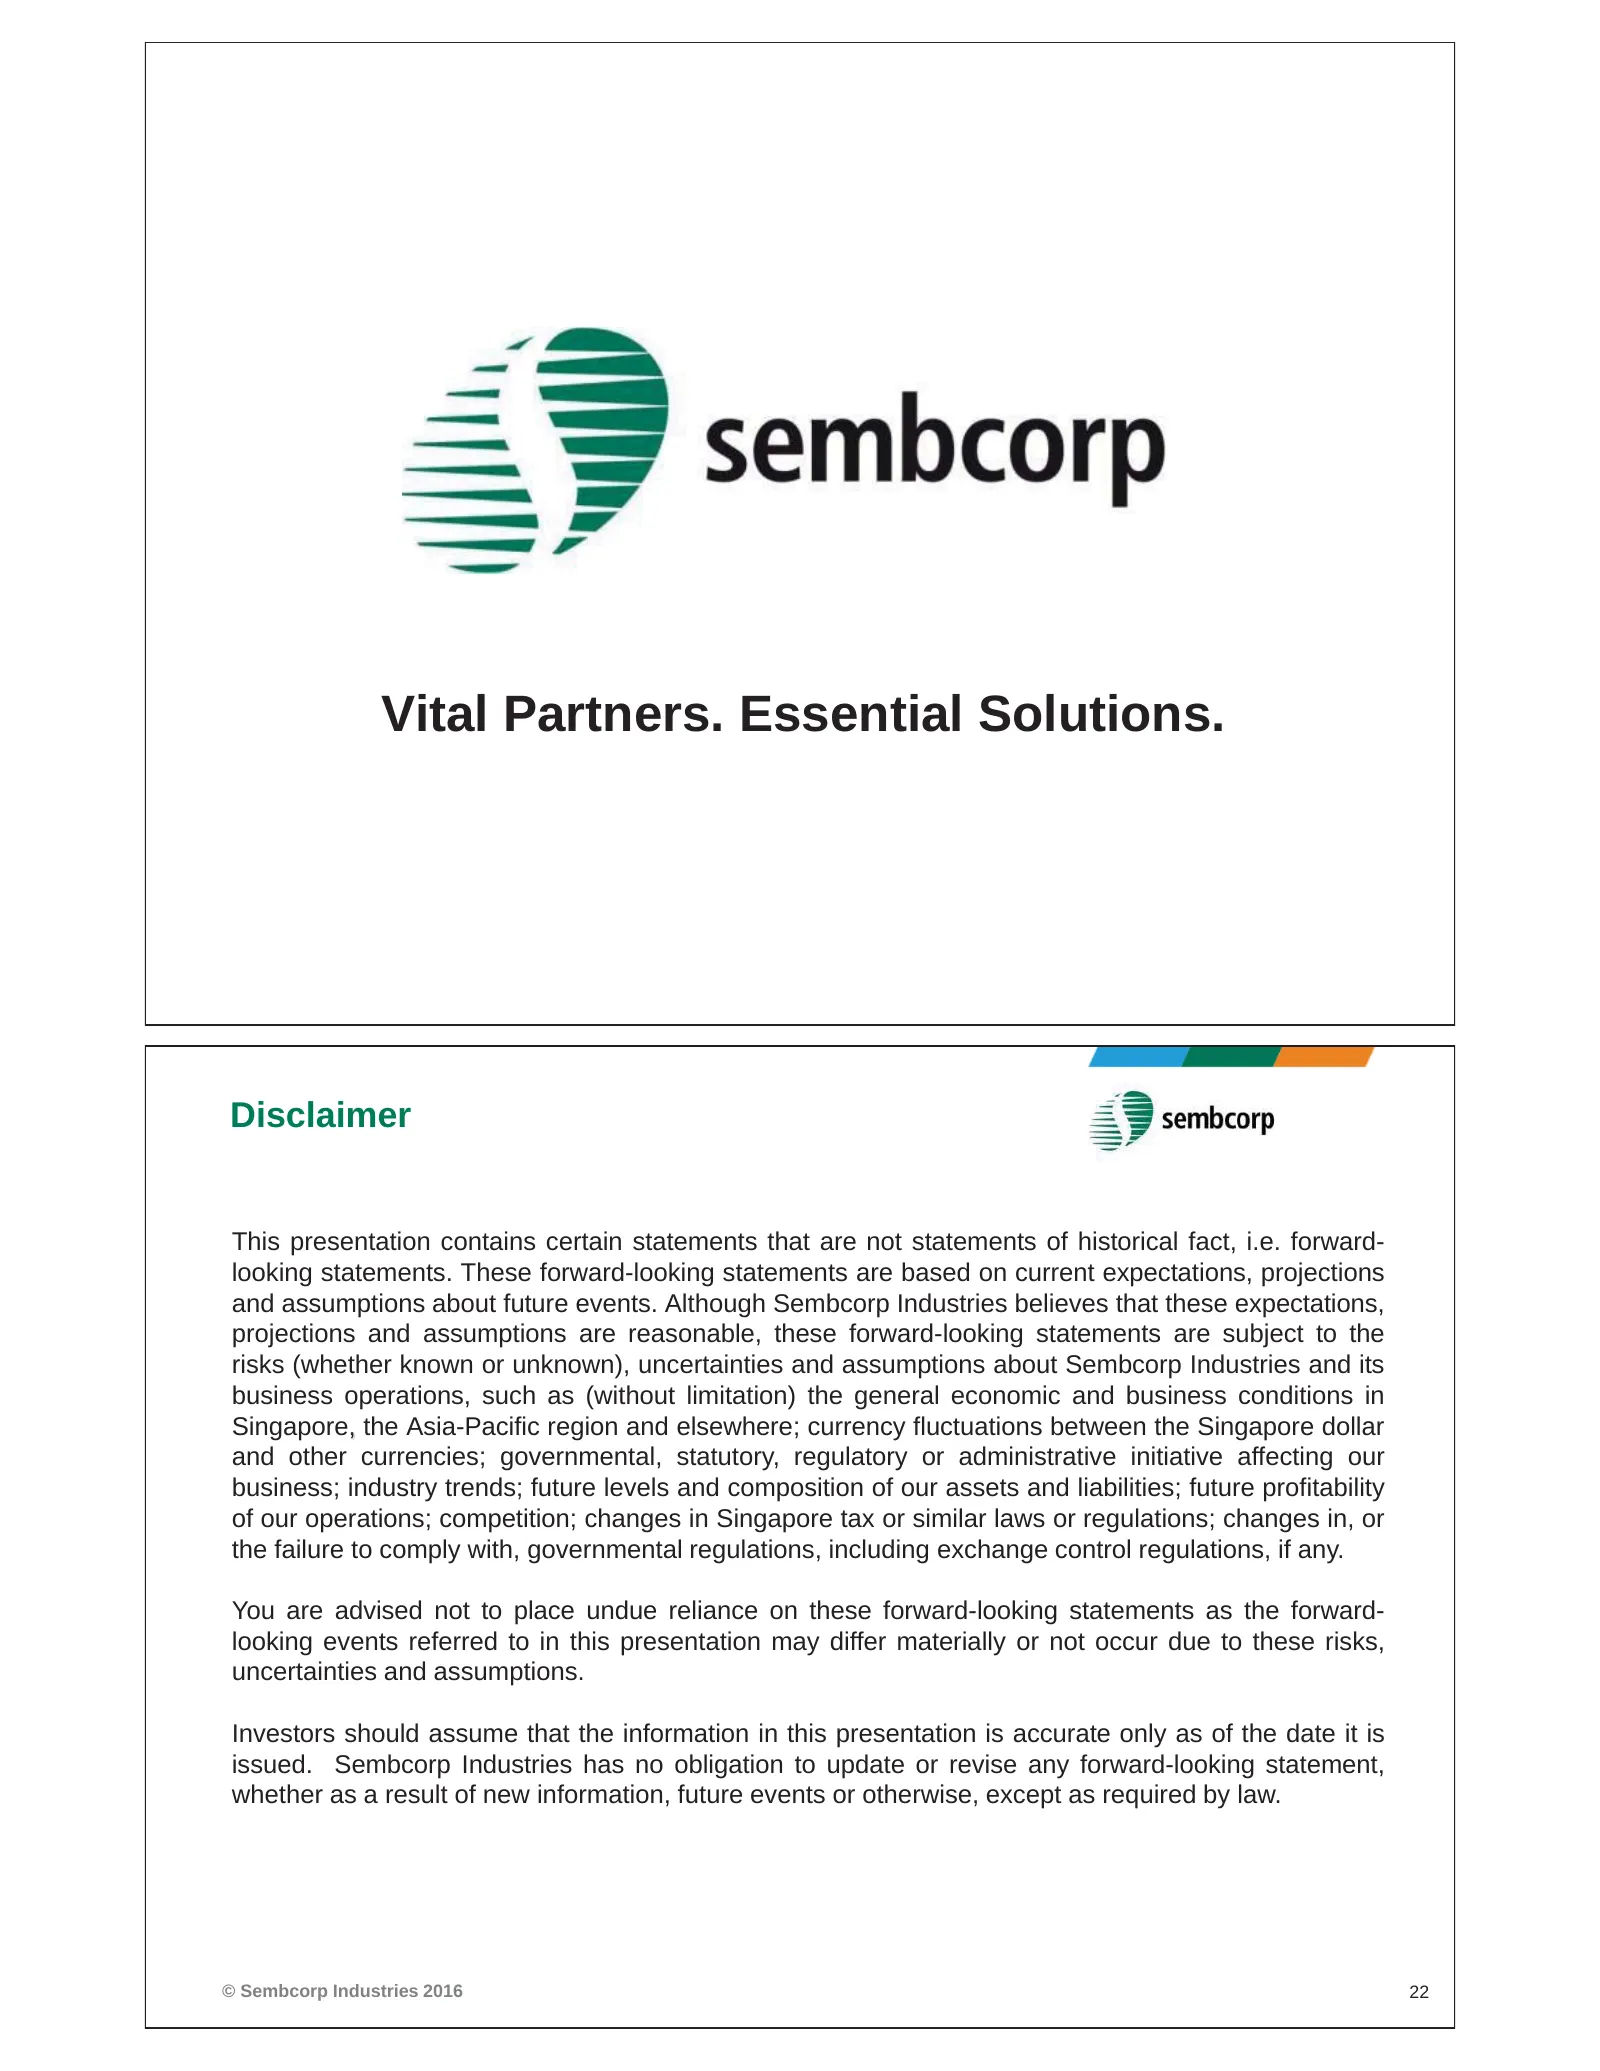
Vital Partners. Essential Solutions. Disclaimer This presentation contains certain statements that are not statements of historical fact, i.e. forward- looking statements. These forward-looking statements are based on current expectations, projections and assumptions about future events. Although Se
Slide 12: Appendix: Utilities Turnover by Geography
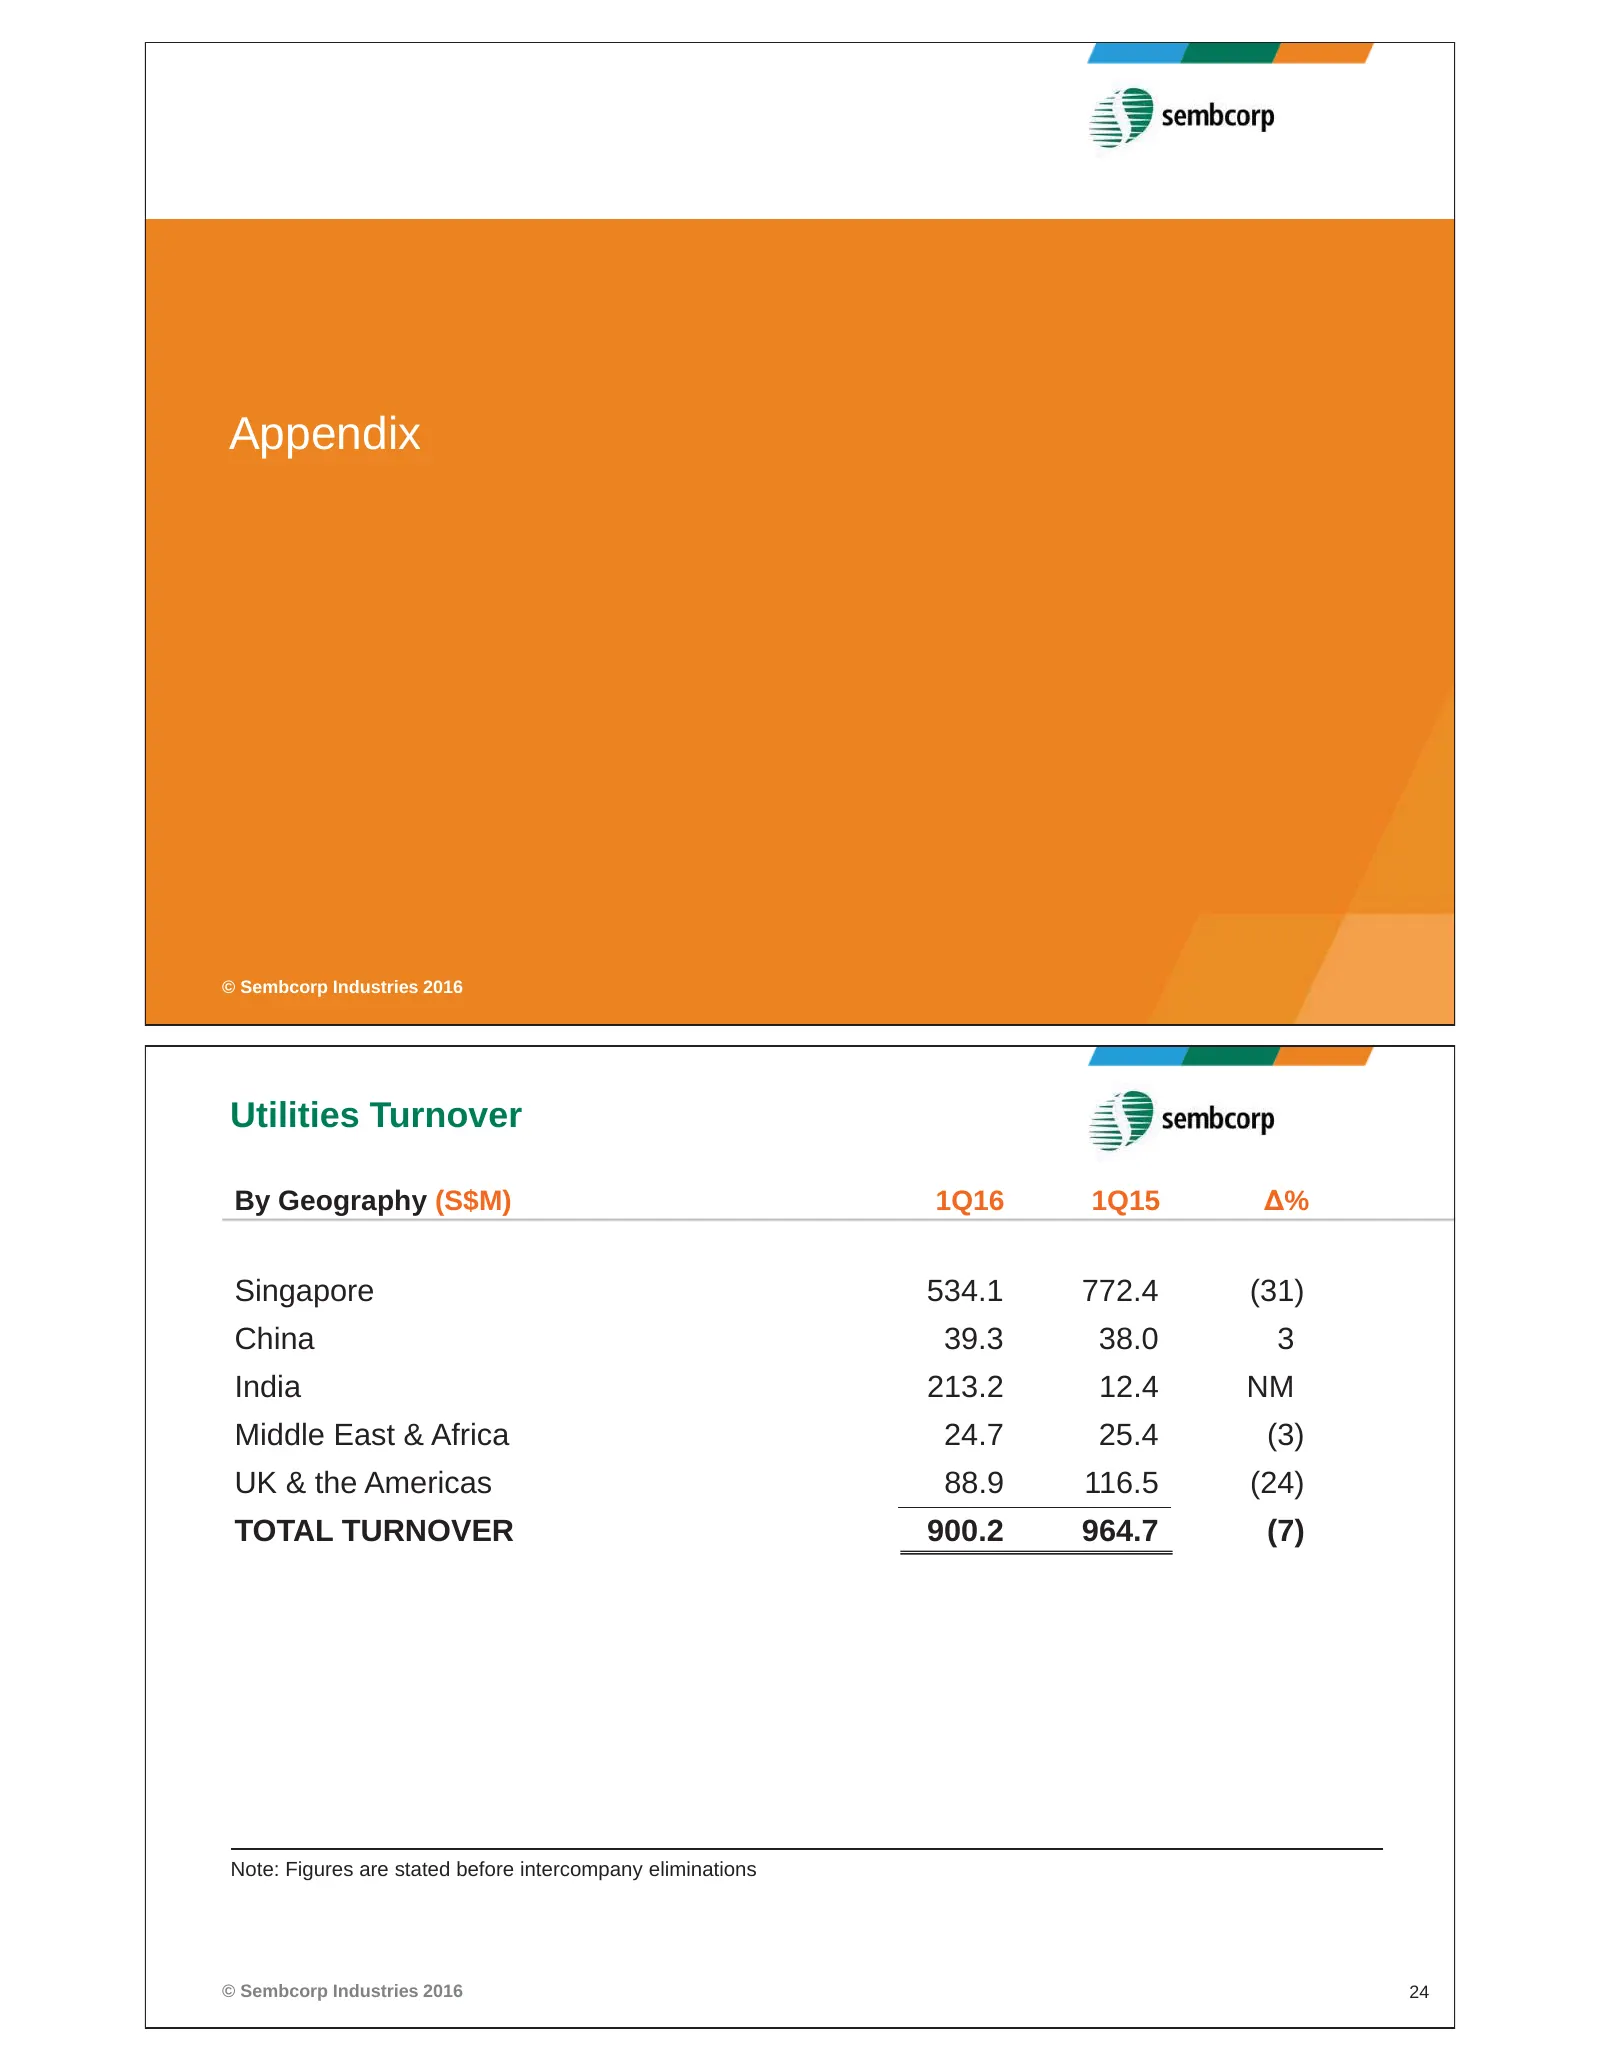
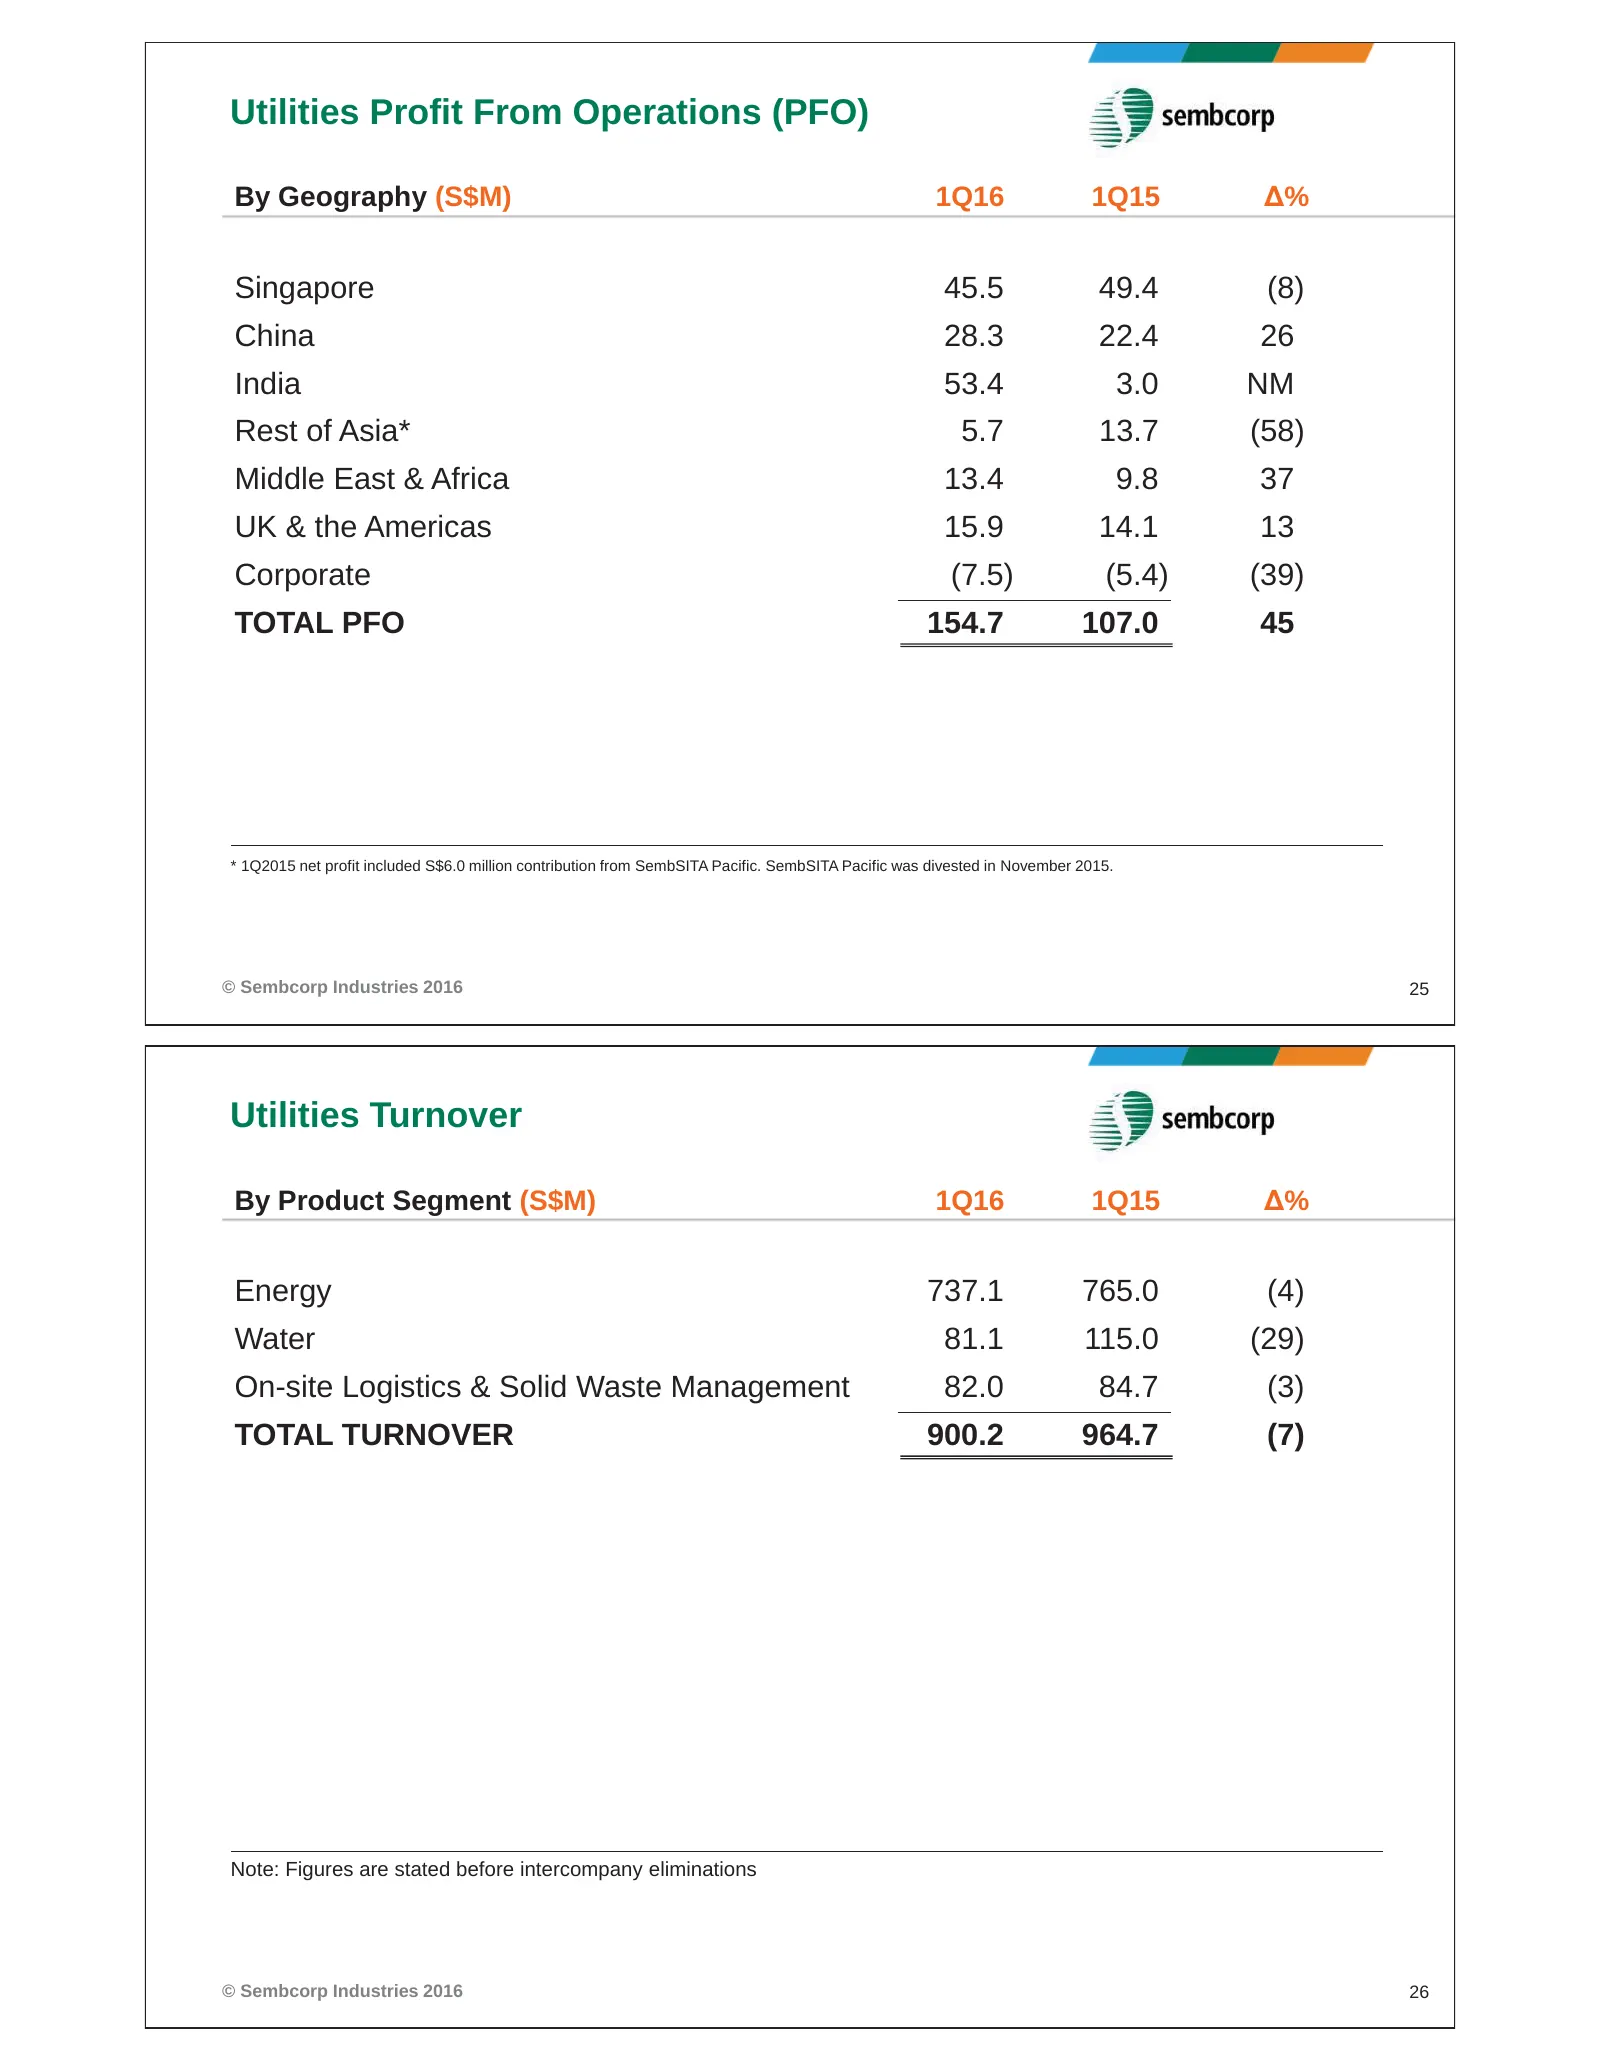
Appendix © Sembcorp Industries 2016 Utilities Turnover By Geography (S$M) 1Q16 1Q15 Δ% Singapore 534.1 772.4 (31) China 39.3 38.0 3 India 213.2 12.4 NM Middle East & Africa 24.7 25.4 (3) UK & the Americas 88.9 116.5 (24) TOTAL TURNOVER 900.2 964.7 (7) Note: Figures are stated before intercompany eli
Slide 13: Utilities Profit From Operations by Geography and Turnover
Utilities Profit From Operations (PFO) By Geography (S$M) 1Q16 1Q15 Δ% Singapore 45.5 49.4 (8) China 28.3 22.4 26 India 53.4 3.0 NM Rest of Asia* 5.7 13.7 (58) Middle East & Africa 13.4 9.8 37 UK & the Americas 15.9 14.1 13 Corporate (7.5) (5.4) (39) TOTAL PFO 154.7 107.0 45 * 1Q2015 net profit incl
Slide 14: Utilities Profit From Operations by Product Segment
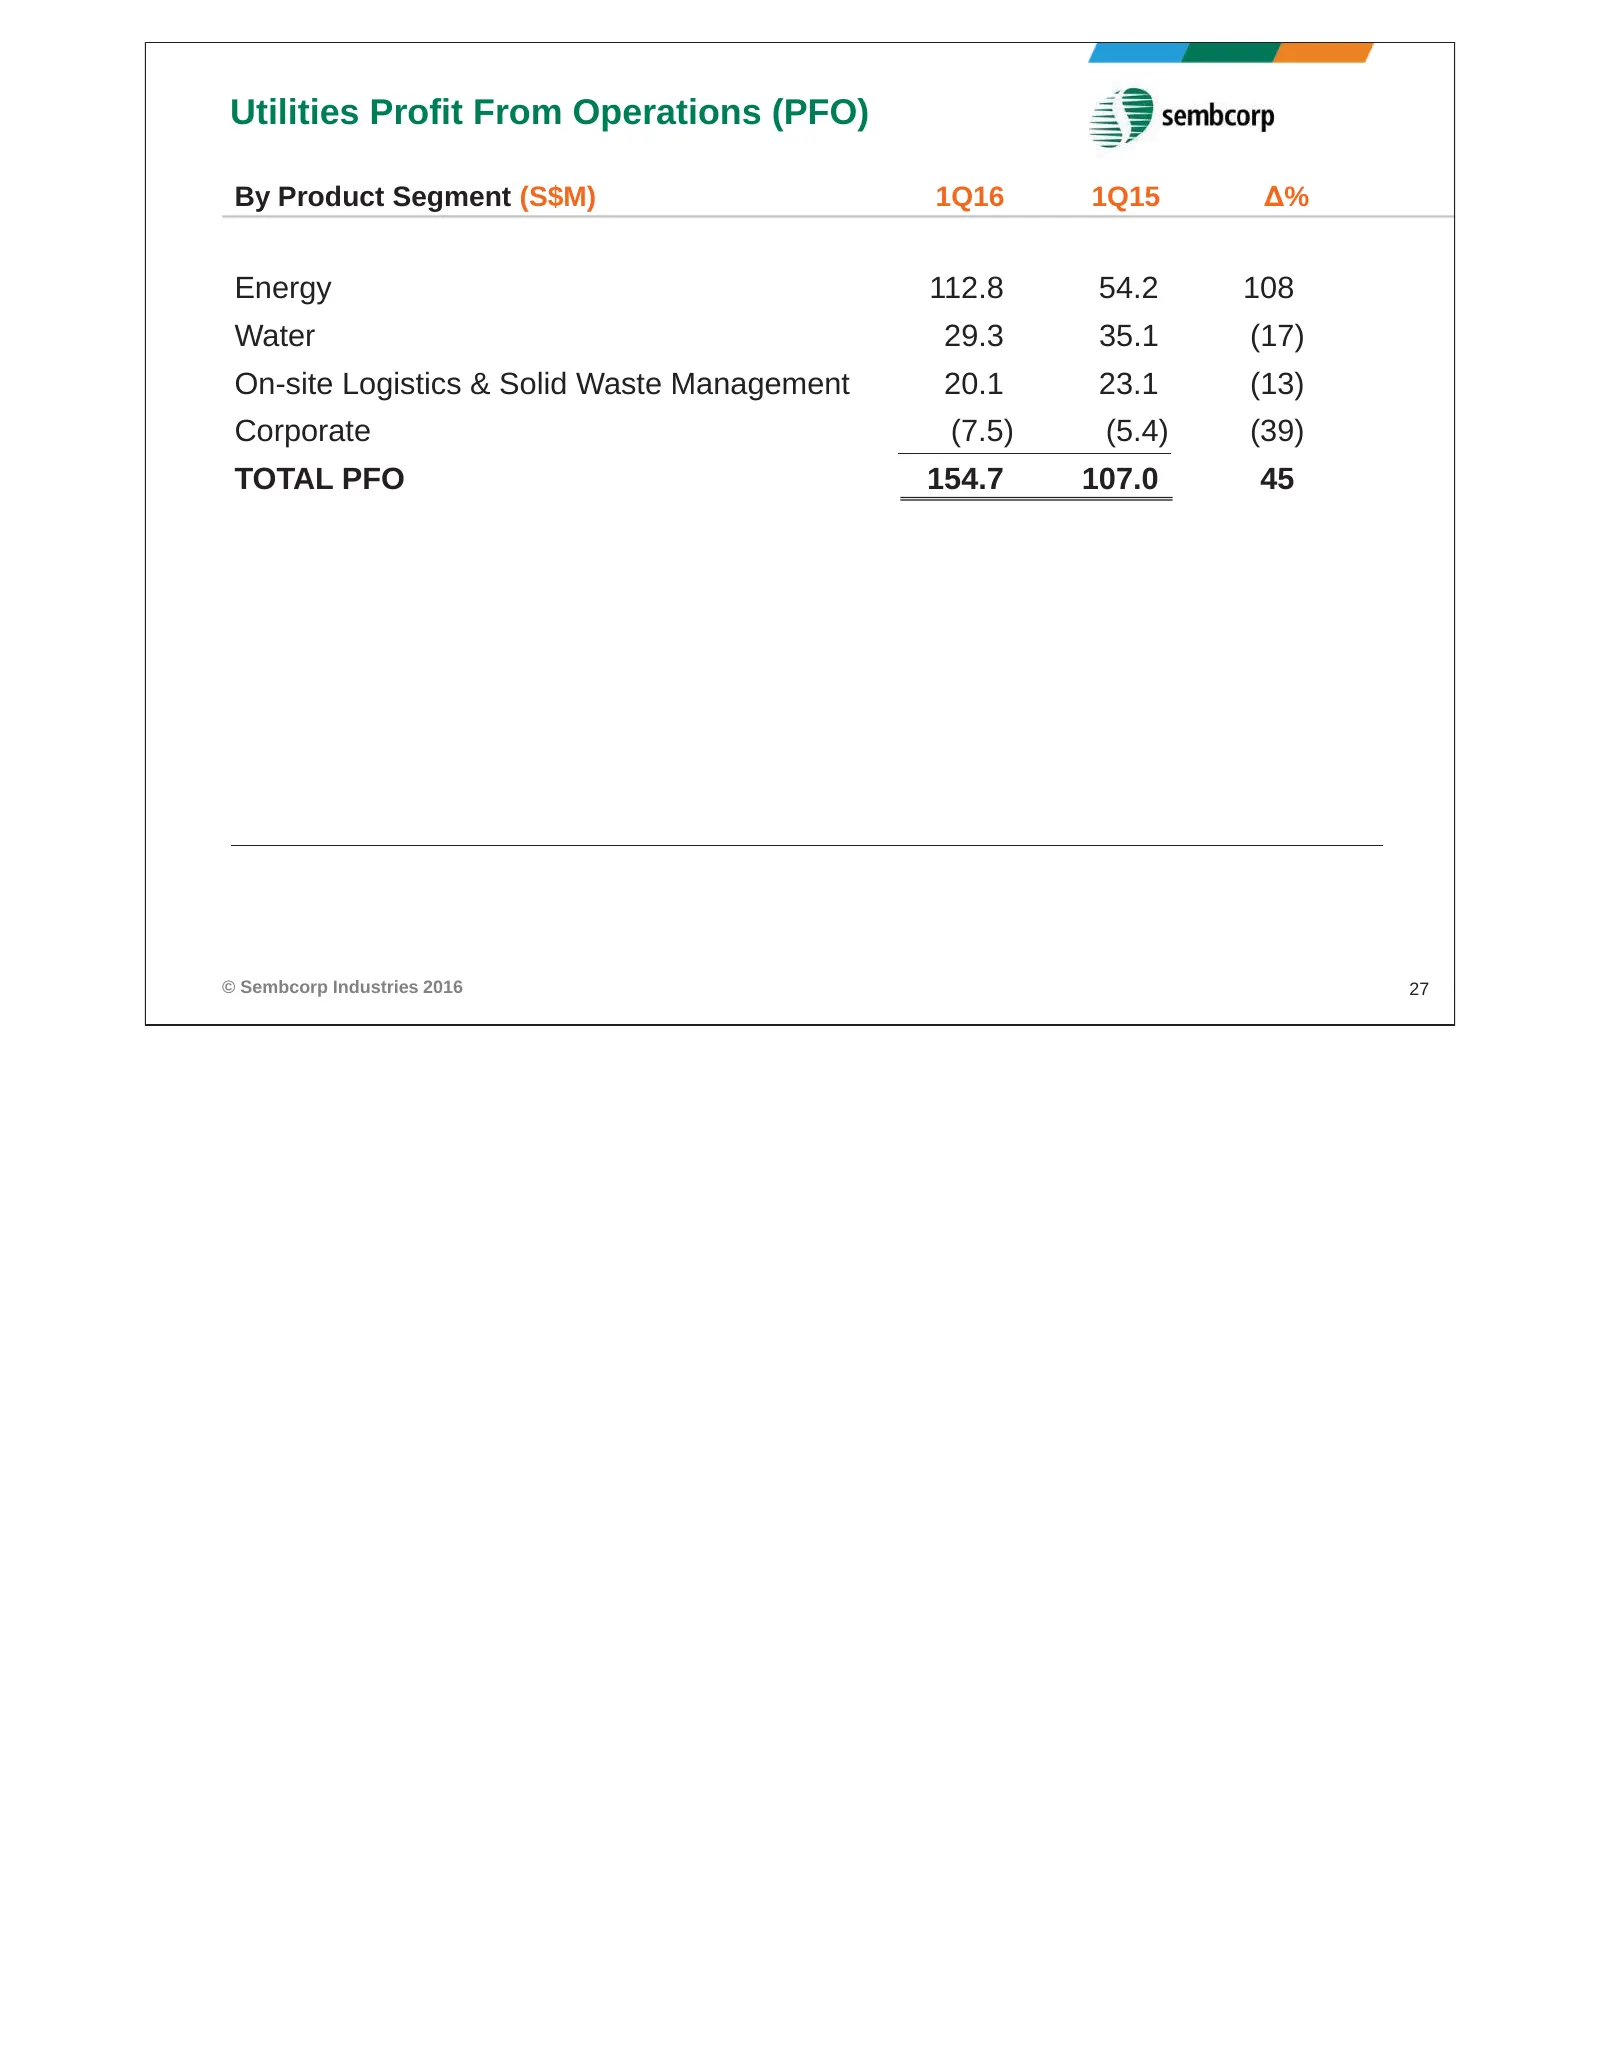
Utilities Profit From Operations (PFO) By Product Segment (S$M) 1Q16 1Q15 Δ% Energy 112.8 54.2 108 Water 29.3 35.1 (17) On-site Logistics & Solid Waste Management 20.1 23.1 (13) Corporate (7.5) (5.4) (39) TOTAL PFO 154.7 107.0 45 © Sembcorp Industries 2016 27
Source: Internet Archive copy of sembcorp.com
More decks from Sembcorp Industries Ltd.
 H1 2026 Earnings Presentation26 slides · Aug 13, 2026
 Investor Presentation (June 2026)52 slides · June 2026
 Shareholder Meeting (April 2026)11 slides · Apr 29, 2026
 FY2025 Earnings Presentation35 slides · Feb 25, 2026
 Merger or Acquisition (January 2026)13 slides · Jan 30, 2026
 Merger or Acquisition (December 2025)24 slides · Dec 11, 2025