ClubCorp — Q4 2014 Earnings Presentation
26 slides from ClubCorp's earnings presentation, Mar 12, 2015
Slide 1: Fiscal 2014 Q4 Performance
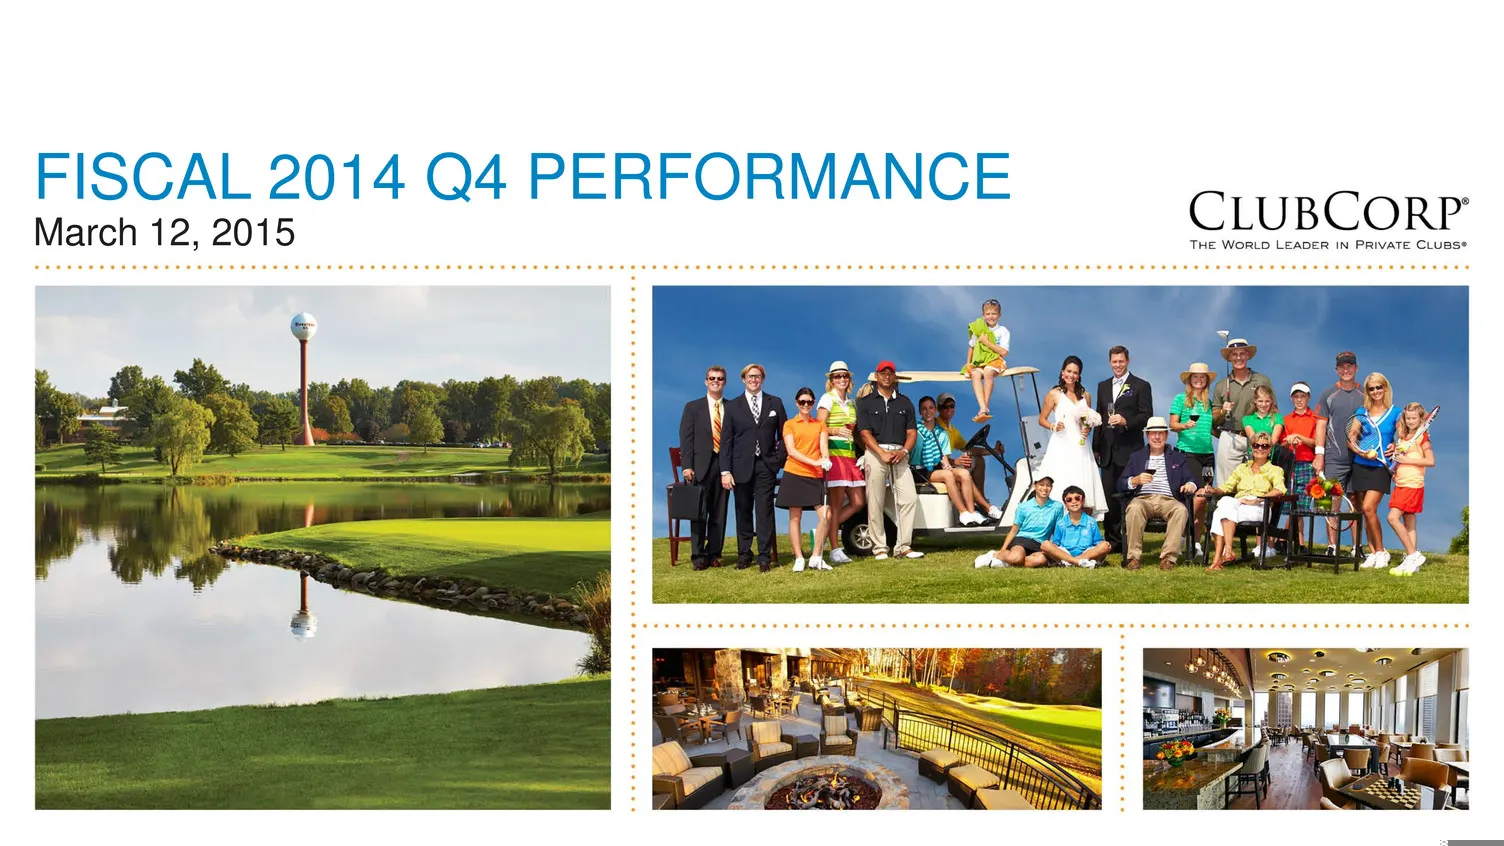
1 FISCAL 2014 Q4 PERFORMANCE March 12, 2015
Slide 2: Cautionary Statements
2 CAUTIONARY STATEMENTS Forward-Looking Statements Certain statements in this presentation may be considered forward-looking statements. Forward-looking statements generally relate to future events or our future financial or operating performance. In some cases, you can identify forward-looking stat
Slide 3: Business Overview
3 BUSINESS OVERVIEW Eric Affeldt, President and CEO
Slide 4: FY14 Performance
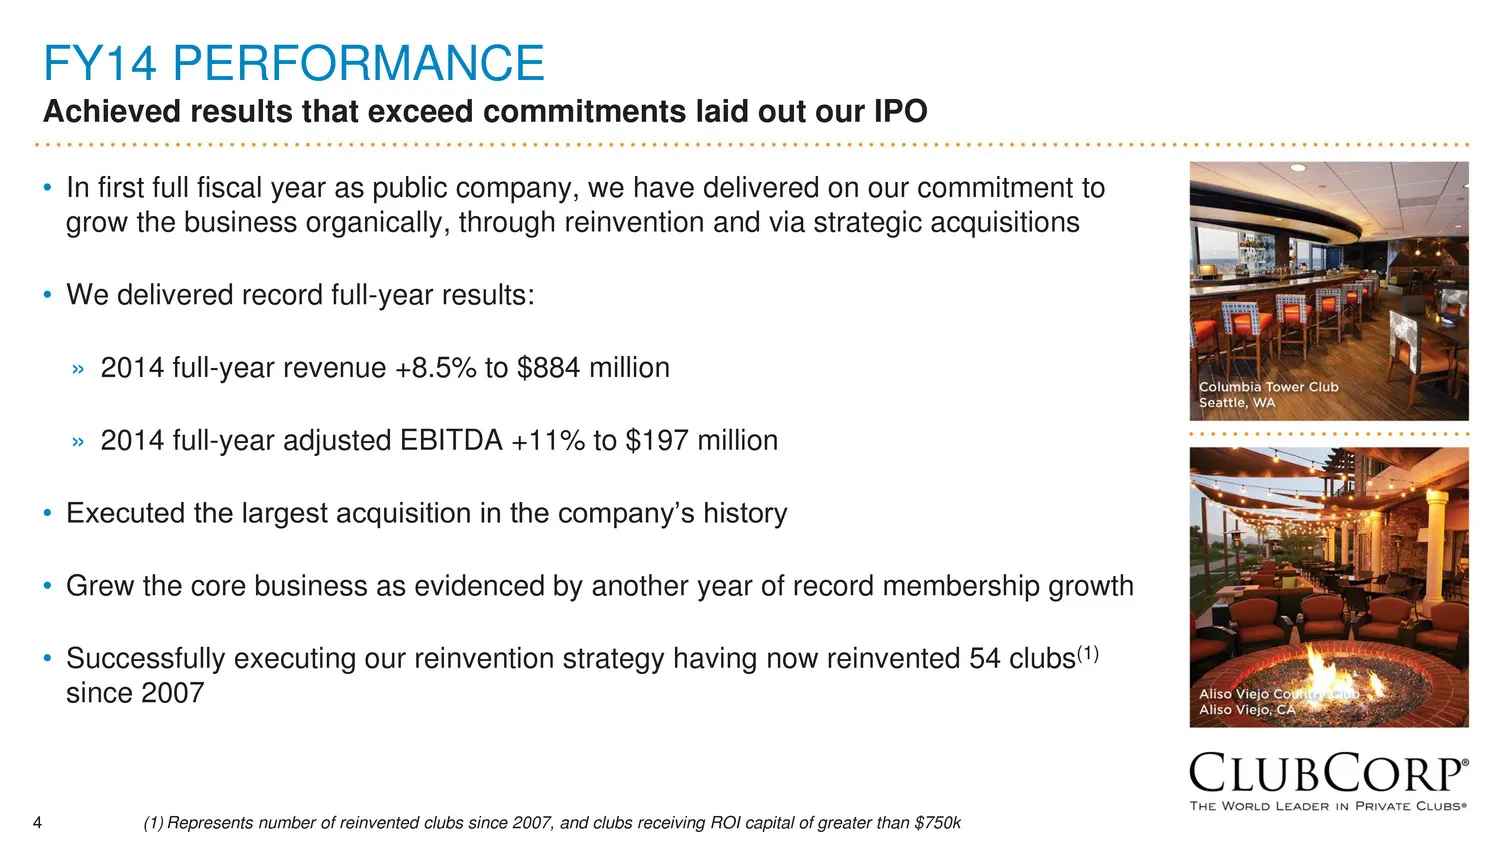
4 FY14 PERFORMANCE Achieved results that exceed commitments laid out our IPO • In first full fiscal year as public company, we have delivered on our commitment to grow the business organically, through reinvention and via strategic acquisitions • We delivered record full-year results: » 2014 full-ye
Slide 5: Executing Our Growth Strategy
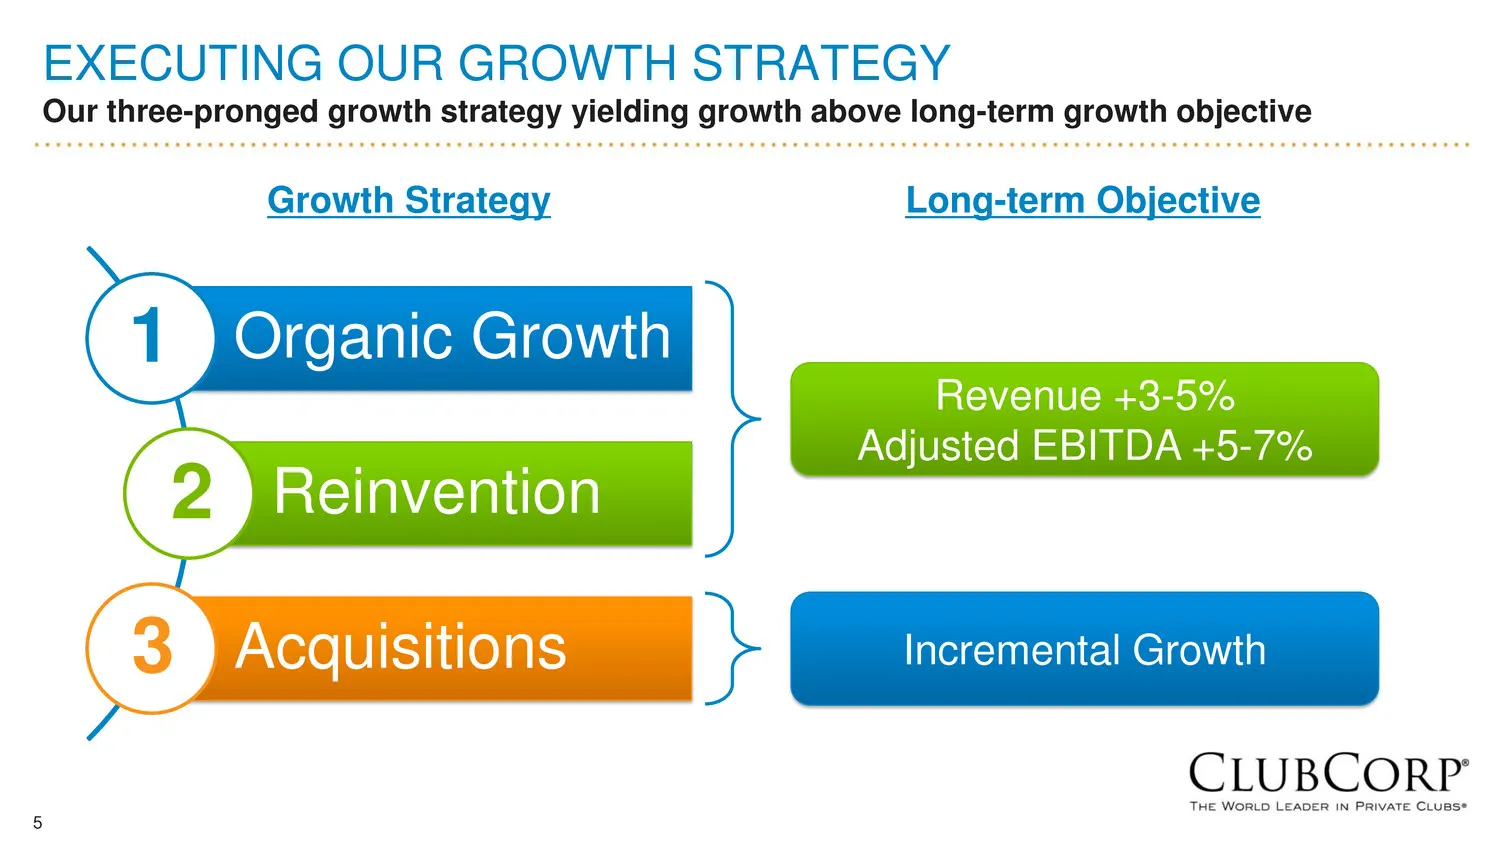
5 EXECUTING OUR GROWTH STRATEGY Our three-pronged growth strategy yielding growth above long-term growth objective Organic Growth Reinvention Acquisitions 1 2 3 Growth Strategy Long-term Objective Revenue +3-5% Adjusted EBITDA +5-7% Incremental Growth
Slide 6: Recent Acquisitions Accelerating Growth
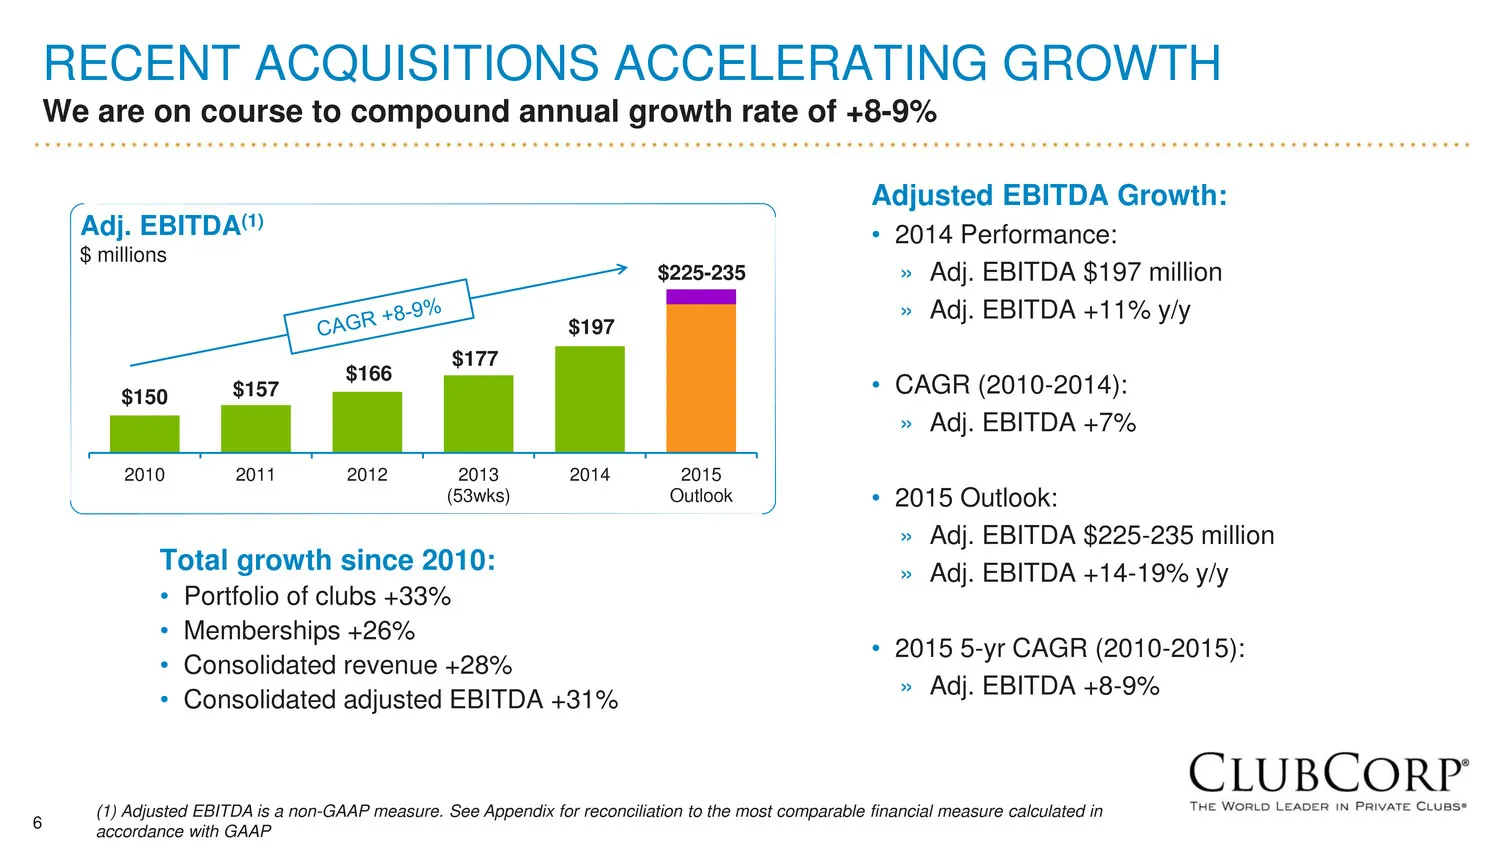
6 RECENT ACQUISITIONS ACCELERATING GROWTH We are on course to compound annual growth rate of +8-9% Adjusted EBITDA Growth: • 2014 Performance: » Adj. EBITDA $197 million » Adj. EBITDA +11% y/y • CAGR (2010-2014): » Adj. EBITDA +7% • 2015 Outlook: » Adj. EBITDA $225-235 million » Adj. EBITDA +14-19%
Slide 7: Economic Drivers of Growth
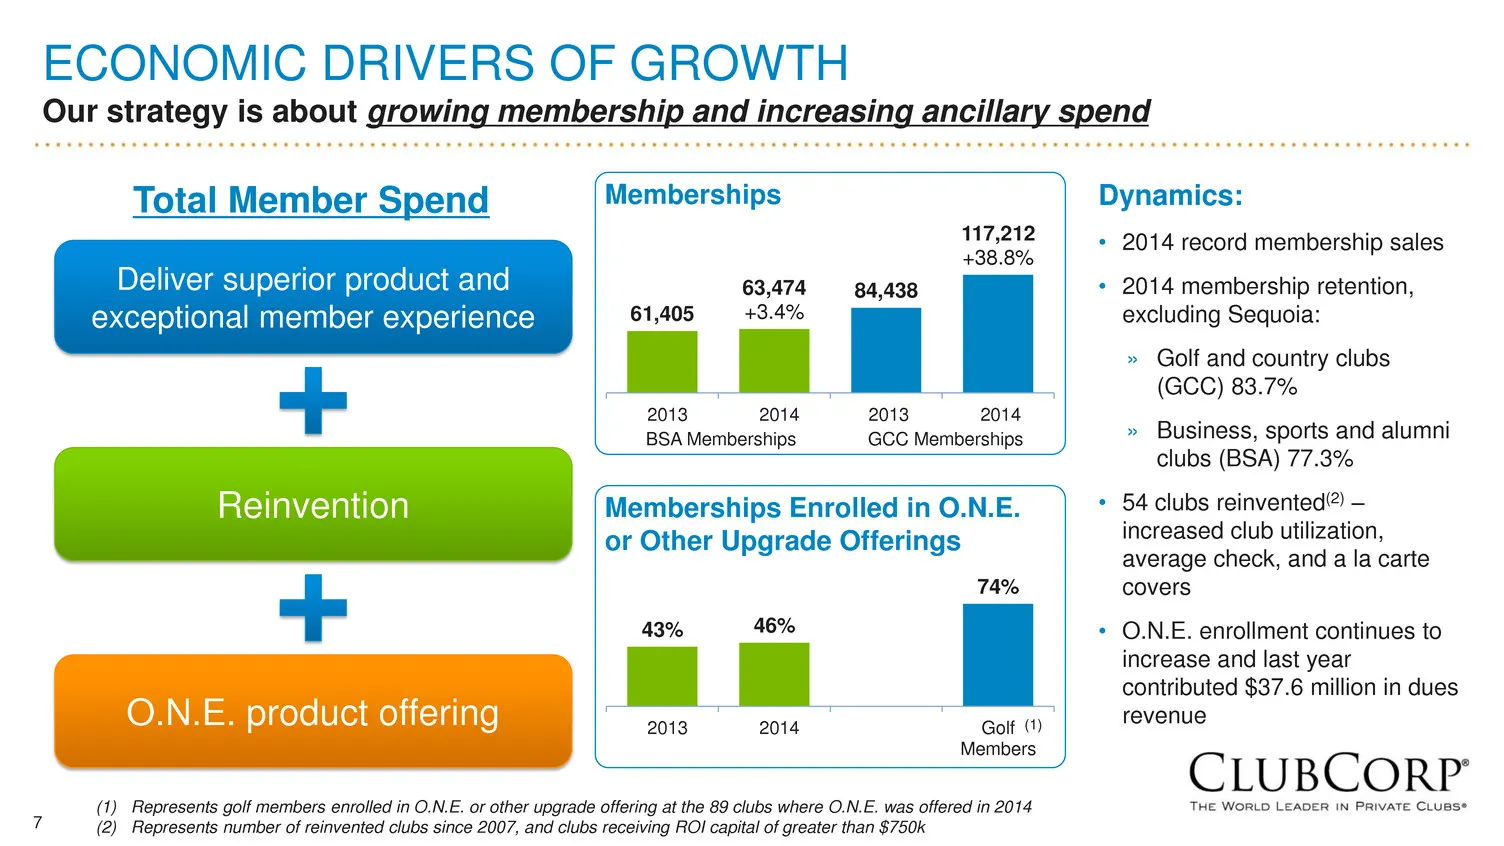
7 ECONOMIC DRIVERS OF GROWTH Our strategy is about growing membership and increasing ancillary spend Deliver superior product and exceptional member experience Reinvention O.N.E. product offering Total Member Spend Dynamics: • 2014 record membership sales • 2014 membership retention, excluding Sequo
Slide 8: Economic Drivers of Growth: Consolidating Market Share
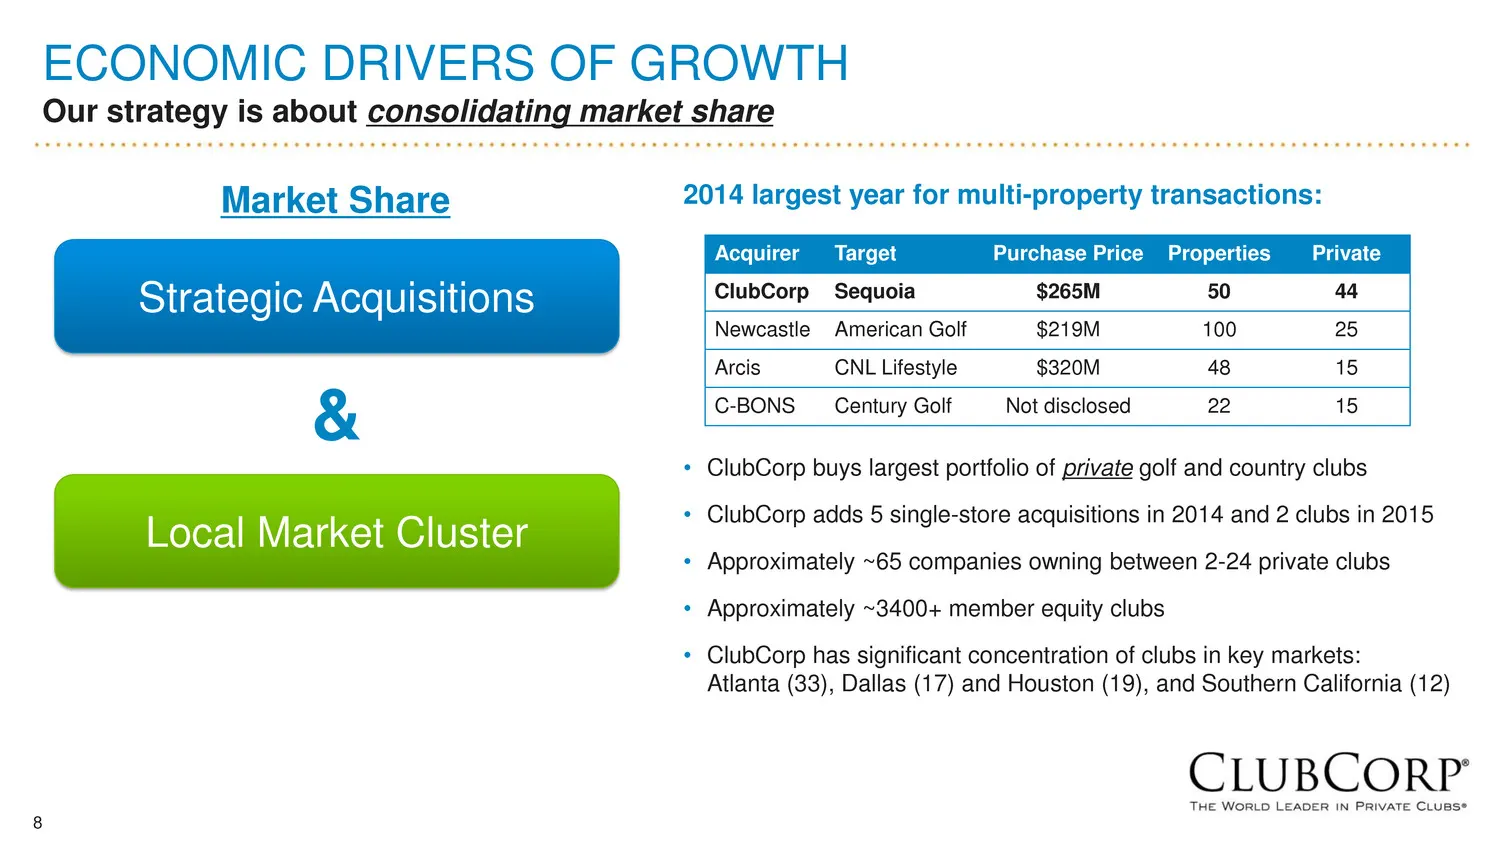
8 2014 largest year for multi-property transactions: • ClubCorp buys largest portfolio of private golf and country clubs • ClubCorp adds 5 single-store acquisitions in 2014 and 2 clubs in 2015 • Approximately ~65 companies owning between 2-24 private clubs • Approximately ~3400+ member equity clubs
Slide 9: Consistently Strong Financial Results
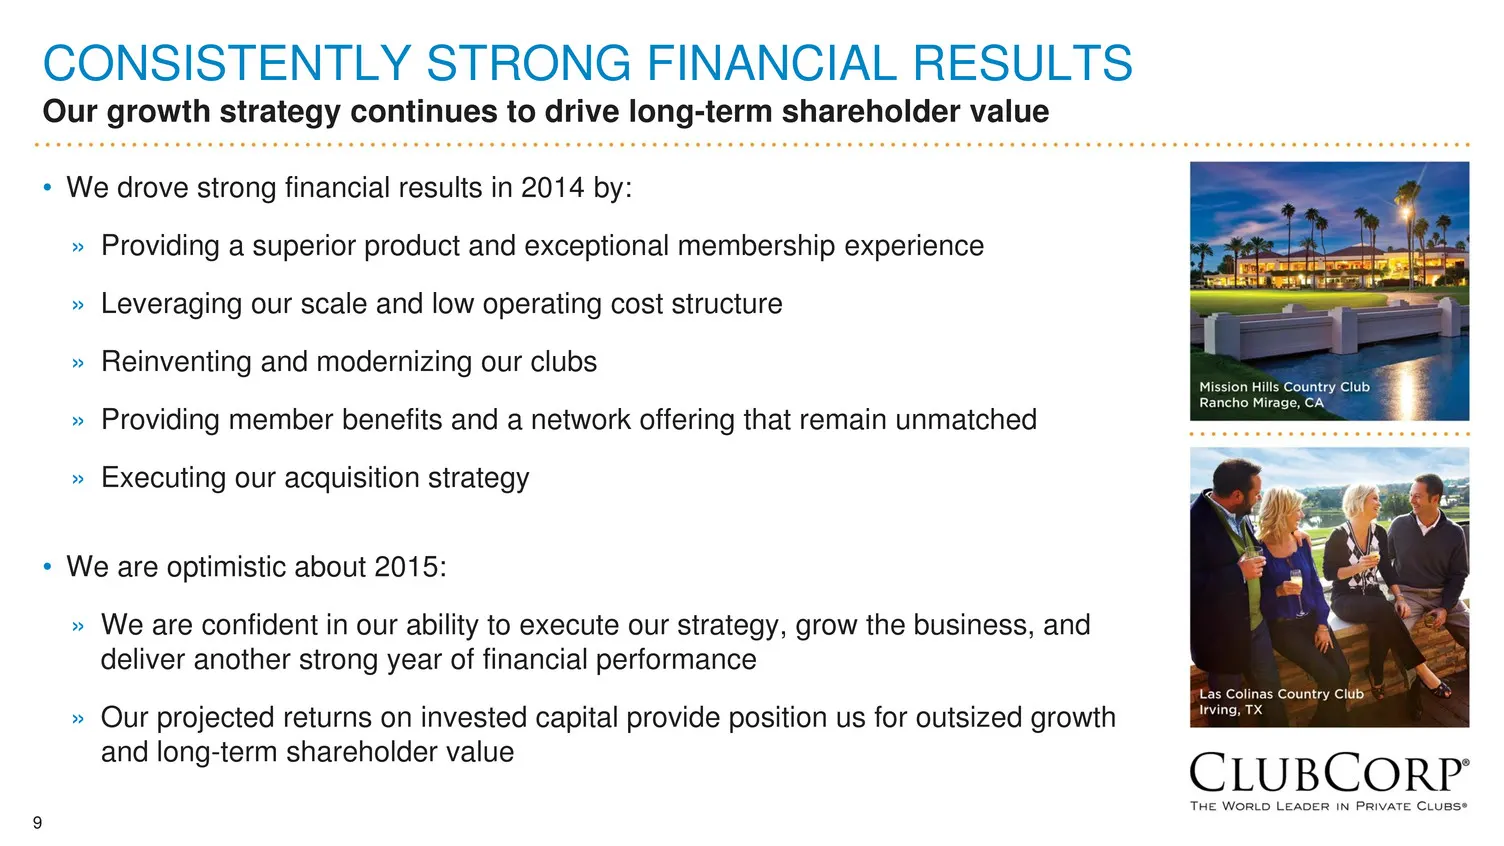
9 CONSISTENTLY STRONG FINANCIAL RESULTS Our growth strategy continues to drive long-term shareholder value • We drove strong financial results in 2014 by: » Providing a superior product and exceptional membership experience » Leveraging our scale and low operating cost structure » Reinventing and mo
Slide 10: Financial Overview
10 FINANCIAL OVERVIEW Curt McClellan, CFO
Slide 11: FY14 ClubCorp Consolidated Results
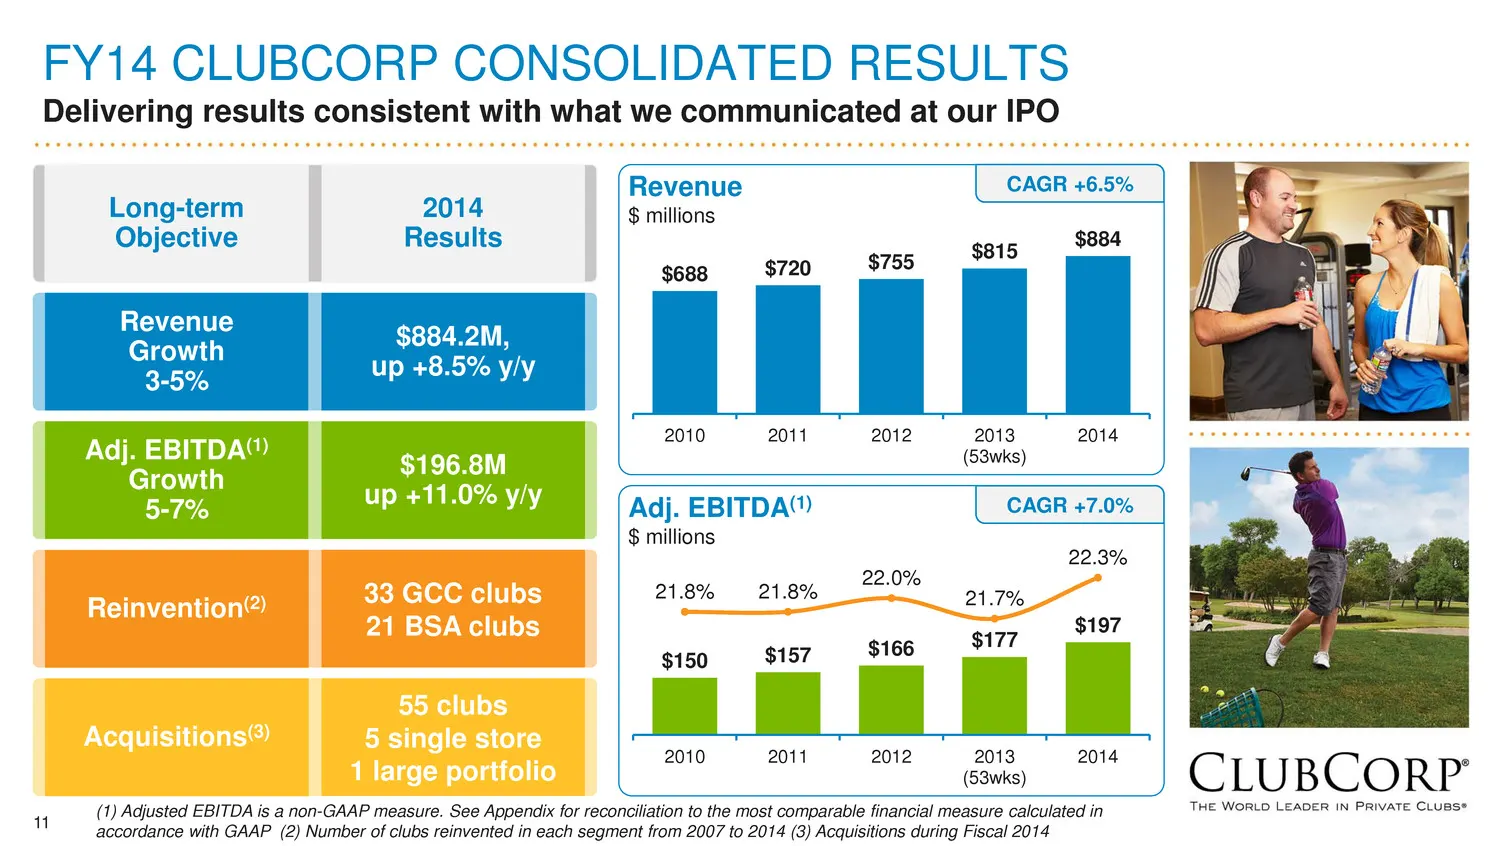
11 FY14 CLUBCORP CONSOLIDATED RESULTS Delivering results consistent with what we communicated at our IPO $688 $720 $755 $815 $884 2010 2011 2012 2013 (53wks) 2014 $150 $157 $166 $177 $197 21.8% 21.8% 22.0% 21.7% 22.3% 2010 2011 2012 2013 (53wks) 2014 Adj. EBITDA(1) Growth 5-7% $196.8M up +11.0% y/y
Slide 12: FY14 Golf & Country Clubs (GCC)
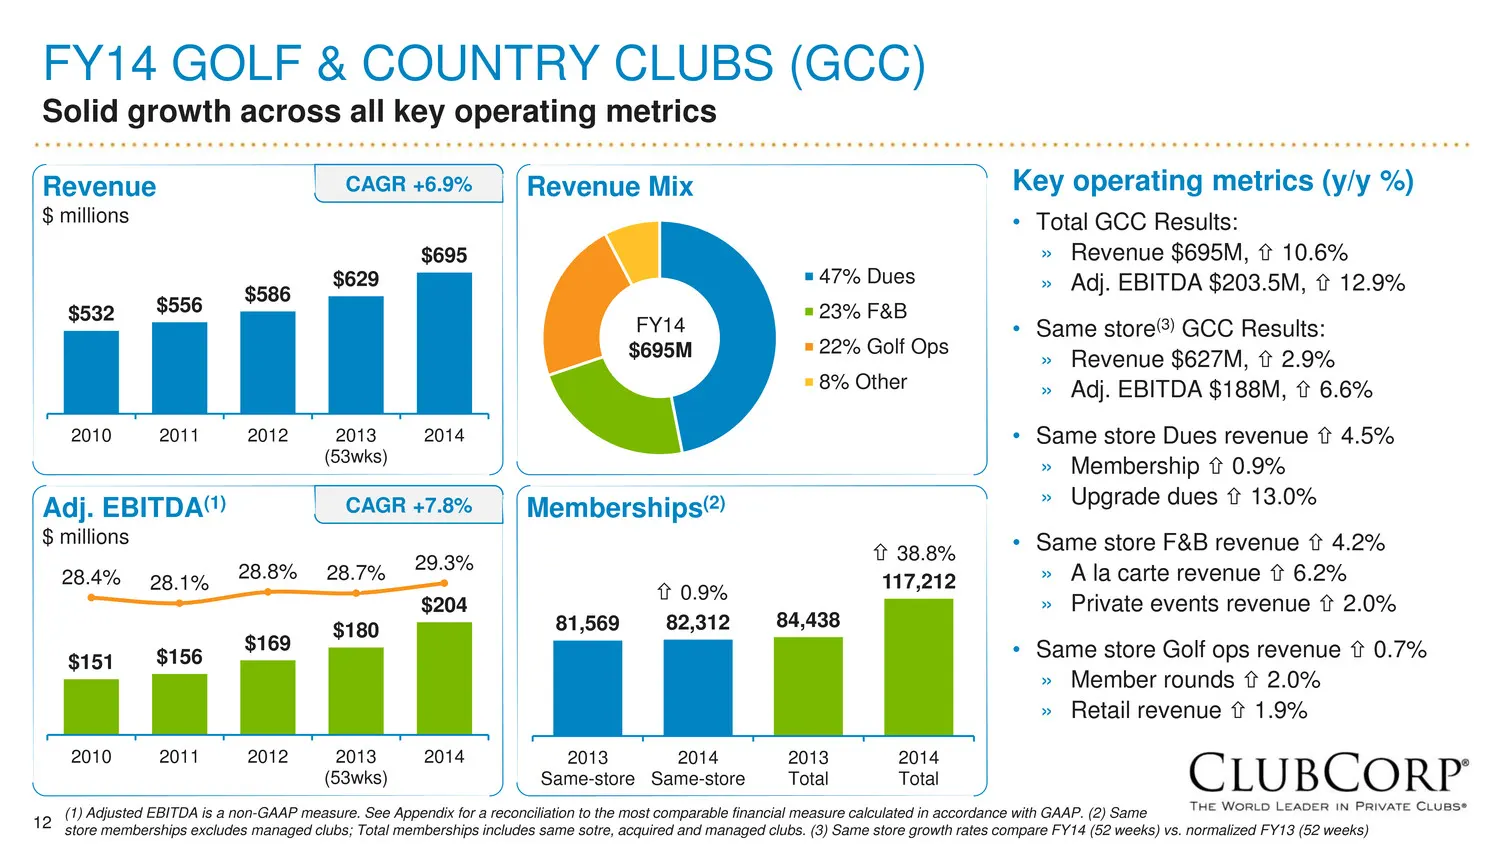
12 FY14 GOLF & COUNTRY CLUBS (GCC) Solid growth across all key operating metrics $532 $556 $586 $629 $695 2010 2011 2012 2013 (53wks) 2014 $151 $156 $169 $180 $204 28.4% 28.1% 28.8% 28.7% 29.3% 2010 2011 2012 2013 (53wks) 2014 81,569 82,312 84,438 117,212 2013 Same-store 2014 Same-store 2013 Total 2
Slide 13: FY14 Business, Sports & Alumni Clubs (BSA)
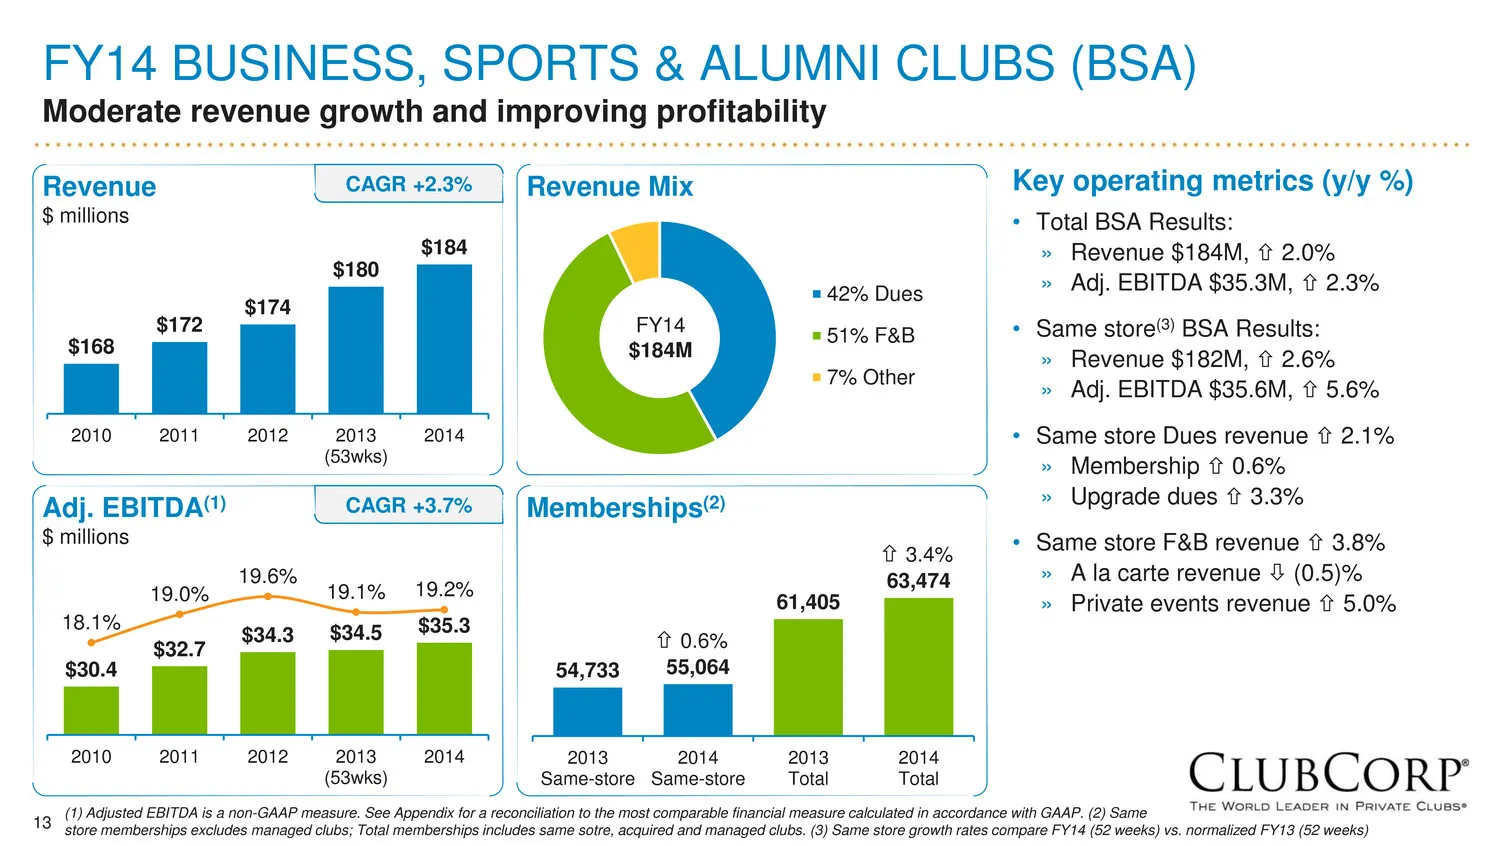
13 FY14 BUSINESS, SPORTS & ALUMNI CLUBS (BSA) Moderate revenue growth and improving profitability $168 $172 $174 $180 $184 2010 2011 2012 2013 (53wks) 2014 $30.4 $32.7 $34.3 $34.5 $35.3 18.1% 19.0% 19.6% 19.1% 19.2% 2010 2011 2012 2013 (53wks) 2014 42% Dues 51% F&B 7% Other FY14 $184M Revenue $ mill
Slide 14: 4Q14 Consolidated Results
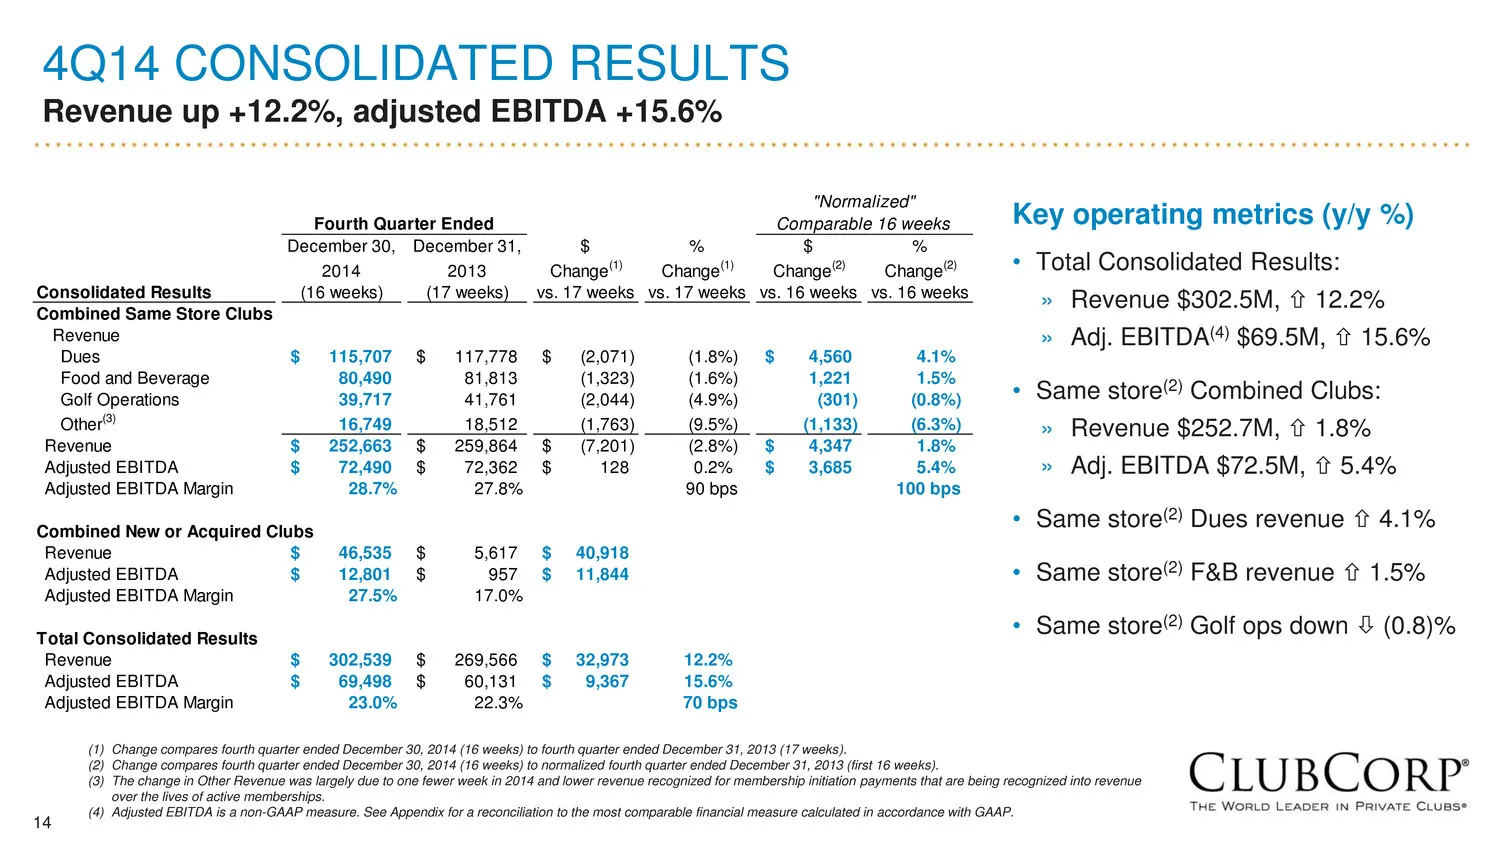
14 4Q14 CONSOLIDATED RESULTS Revenue up +12.2%, adjusted EBITDA +15.6% Key operating metrics (y/y %) • Total Consolidated Results: » Revenue $302.5M, 12.2% » Adj. EBITDA(4) $69.5M, 15.6% • Same store(2) Combined Clubs: » Revenue $252.7M, 1.8% » Adj. EBITDA $72.5M, 5.4% • Same store(2) Dues r
Slide 15: 4Q14 GCC Results
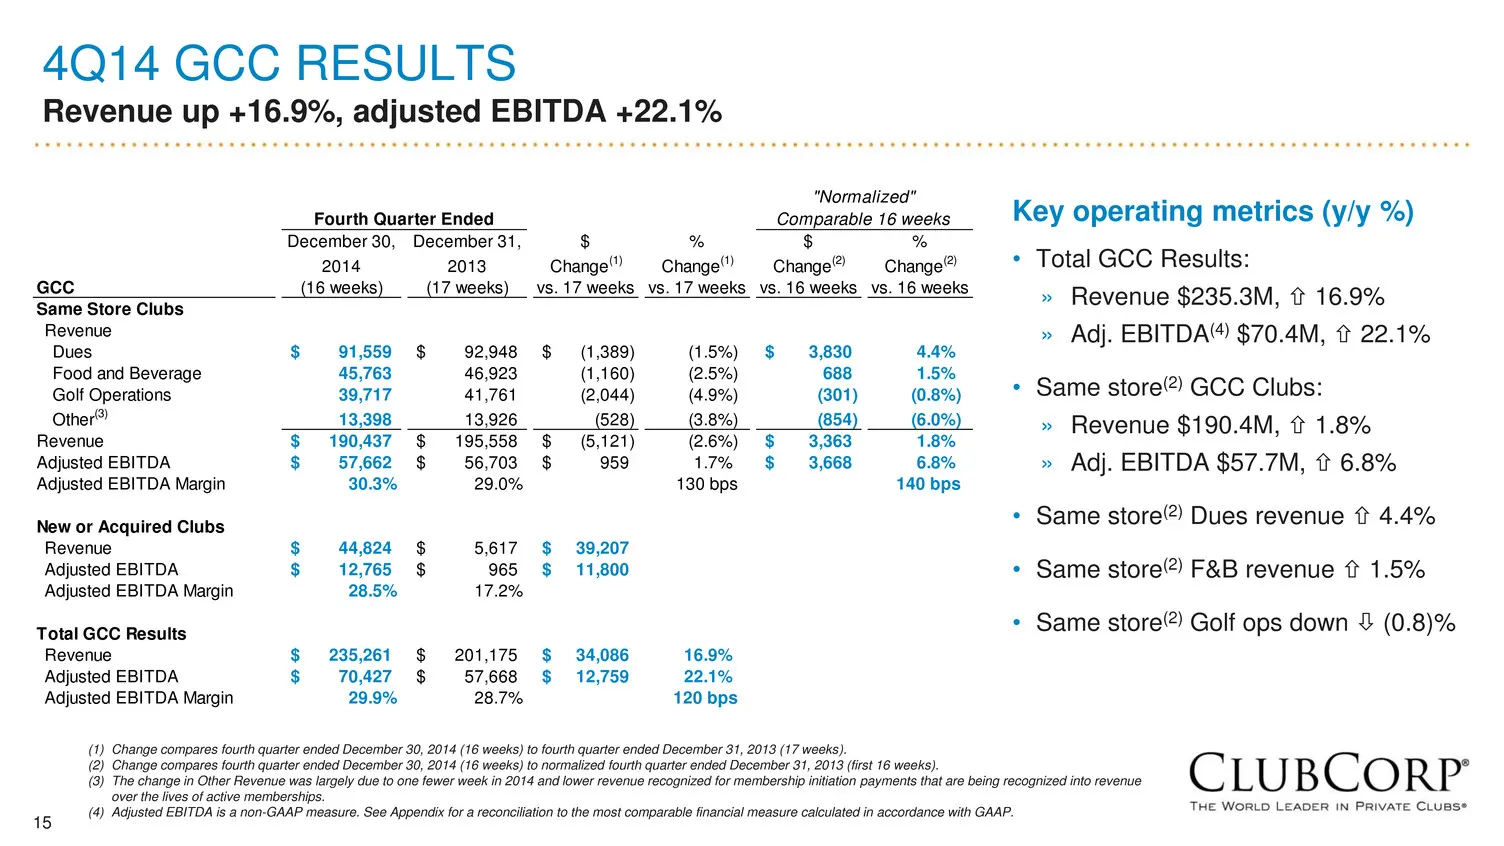
15 4Q14 GCC RESULTS Revenue up +16.9%, adjusted EBITDA +22.1% Key operating metrics (y/y %) • Total GCC Results: » Revenue $235.3M, 16.9% » Adj. EBITDA(4) $70.4M, 22.1% • Same store(2) GCC Clubs: » Revenue $190.4M, 1.8% » Adj. EBITDA $57.7M, 6.8% • Same store(2) Dues revenue 4.4% • Same st
Slide 16: 4Q14 BSA Results
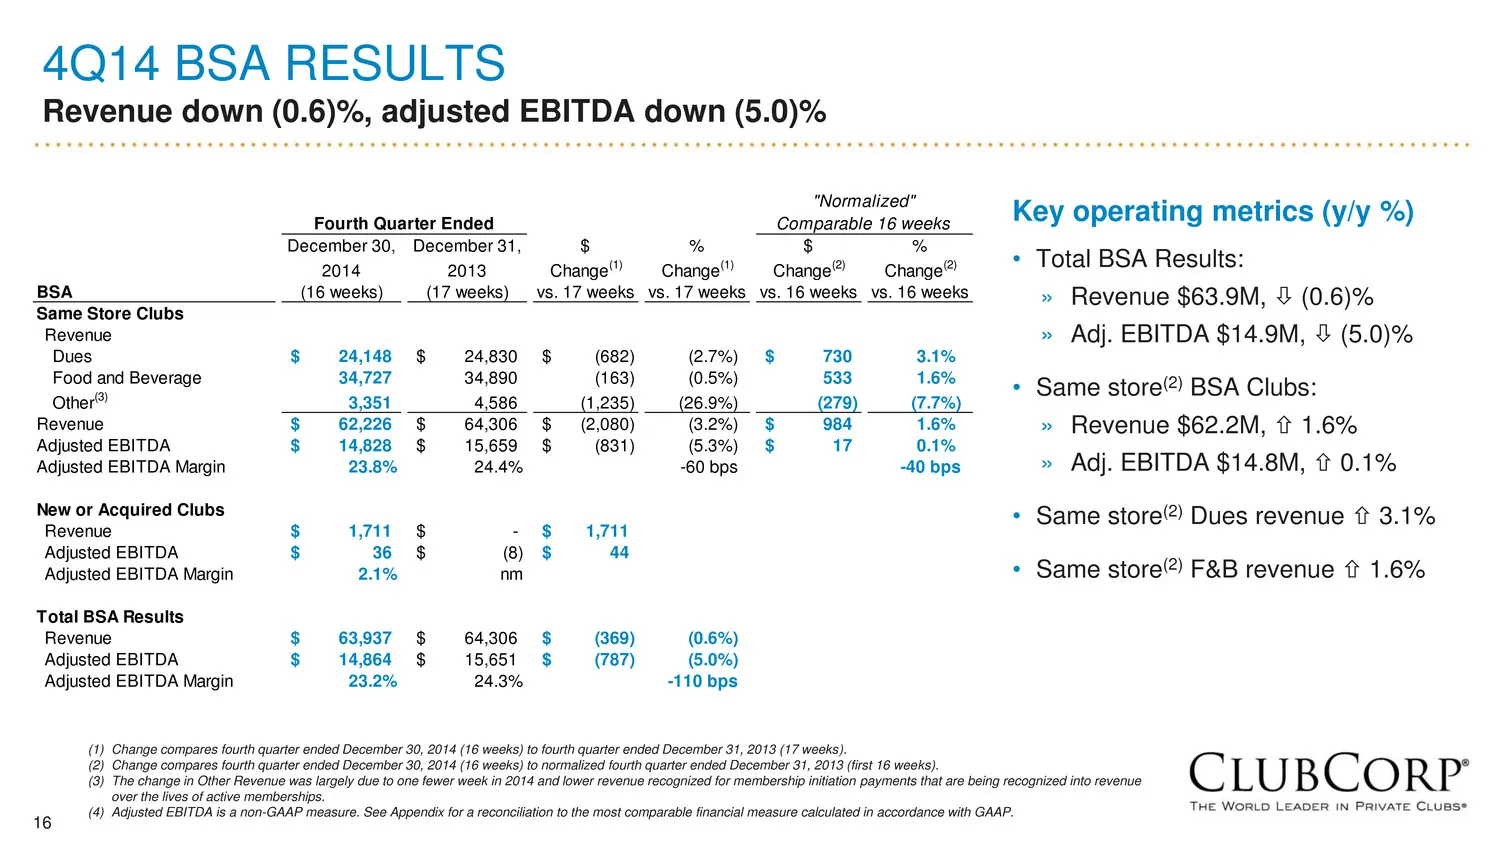
16 4Q14 BSA RESULTS Revenue down (0.6)%, adjusted EBITDA down (5.0)% Key operating metrics (y/y %) • Total BSA Results: » Revenue $63.9M, (0.6)% » Adj. EBITDA $14.9M, (5.0)% • Same store(2) BSA Clubs: » Revenue $62.2M, 1.6% » Adj. EBITDA $14.8M, 0.1% • Same store(2) Dues revenue 3.1% • Sam
Slide 17: FY14 Capex
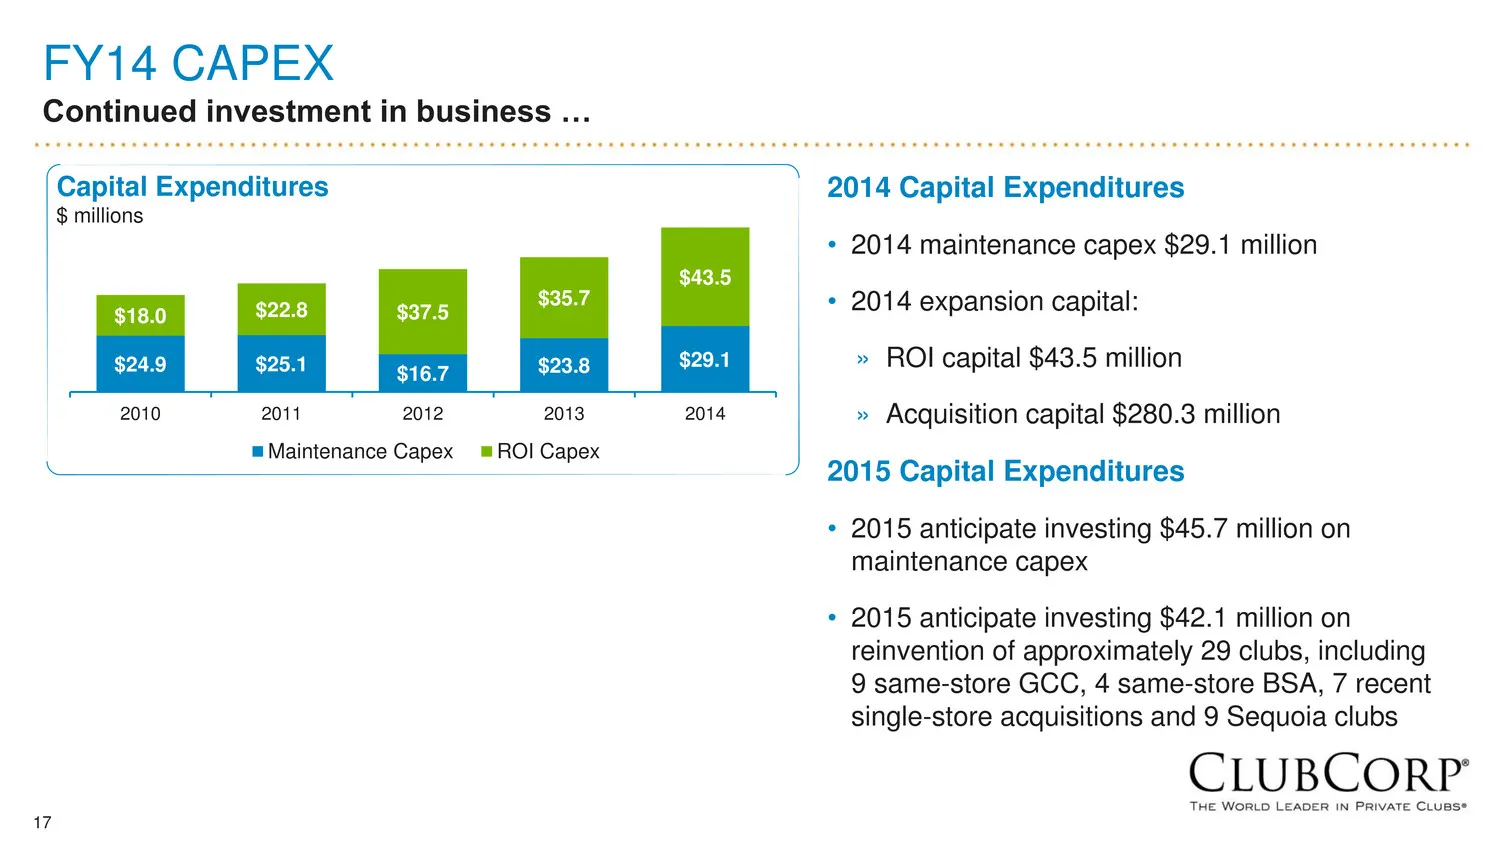
17 FY14 CAPEX Continued investment in business … 2014 Capital Expenditures • 2014 maintenance capex $29.1 million • 2014 expansion capital: » ROI capital $43.5 million » Acquisition capital $280.3 million 2015 Capital Expenditures • 2015 anticipate investing $45.7 million on maintenance capex • 2015
Slide 18: FY14 Free Cash Flow
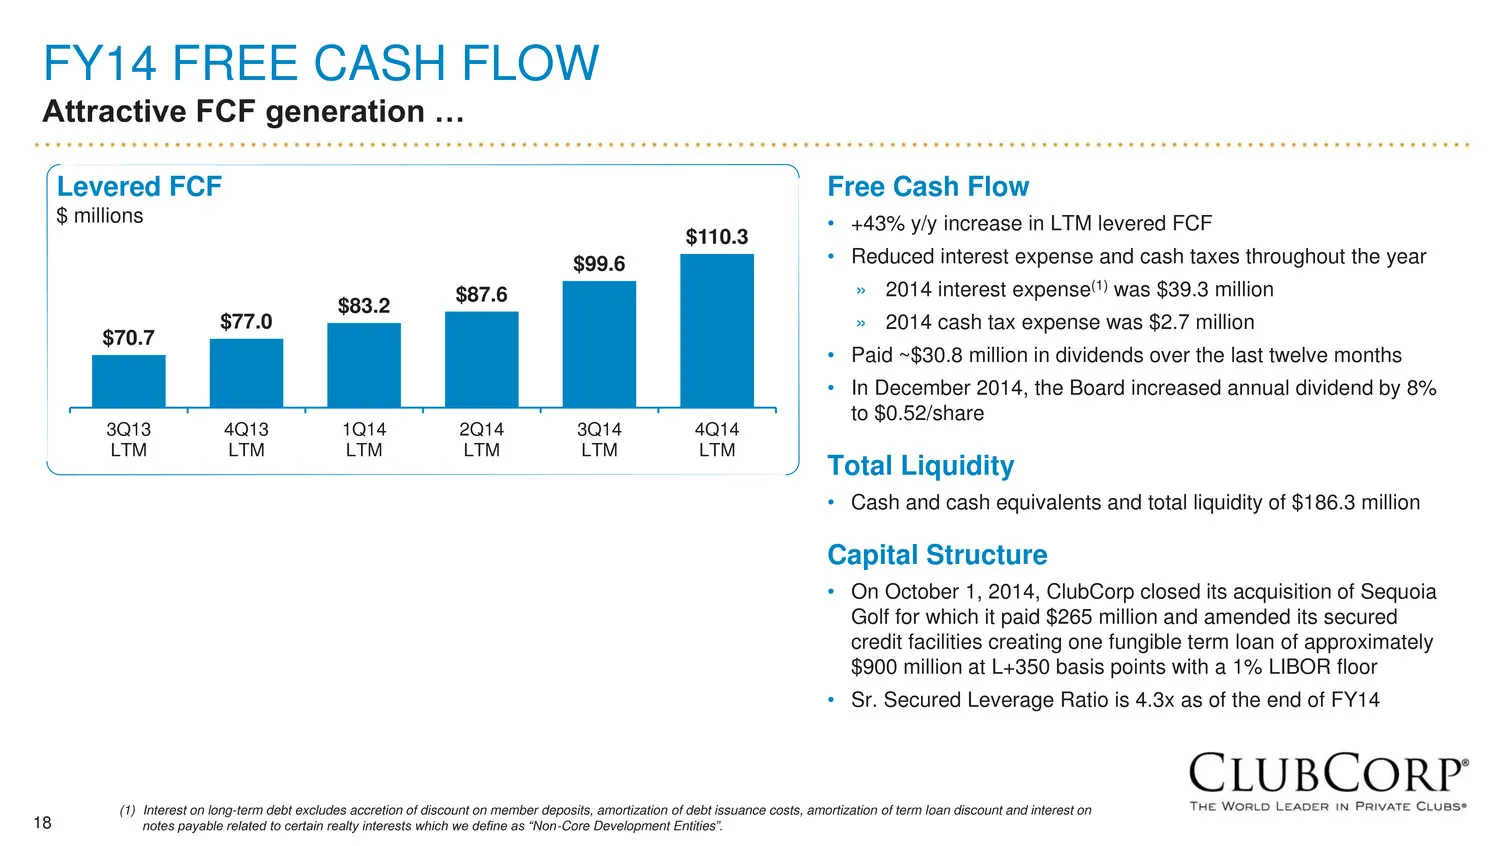
18 FY14 FREE CASH FLOW Attractive FCF generation … $70.7 $77.0 $83.2 $87.6 $99.6 $110.3 3Q13 LTM 4Q13 LTM 1Q14 LTM 2Q14 LTM 3Q14 LTM 4Q14 LTM Free Cash Flow • +43% y/y increase in LTM levered FCF • Reduced interest expense and cash taxes throughout the year » 2014 interest expense(1) was $39.3 milli
Slide 19: 2015 Outlook
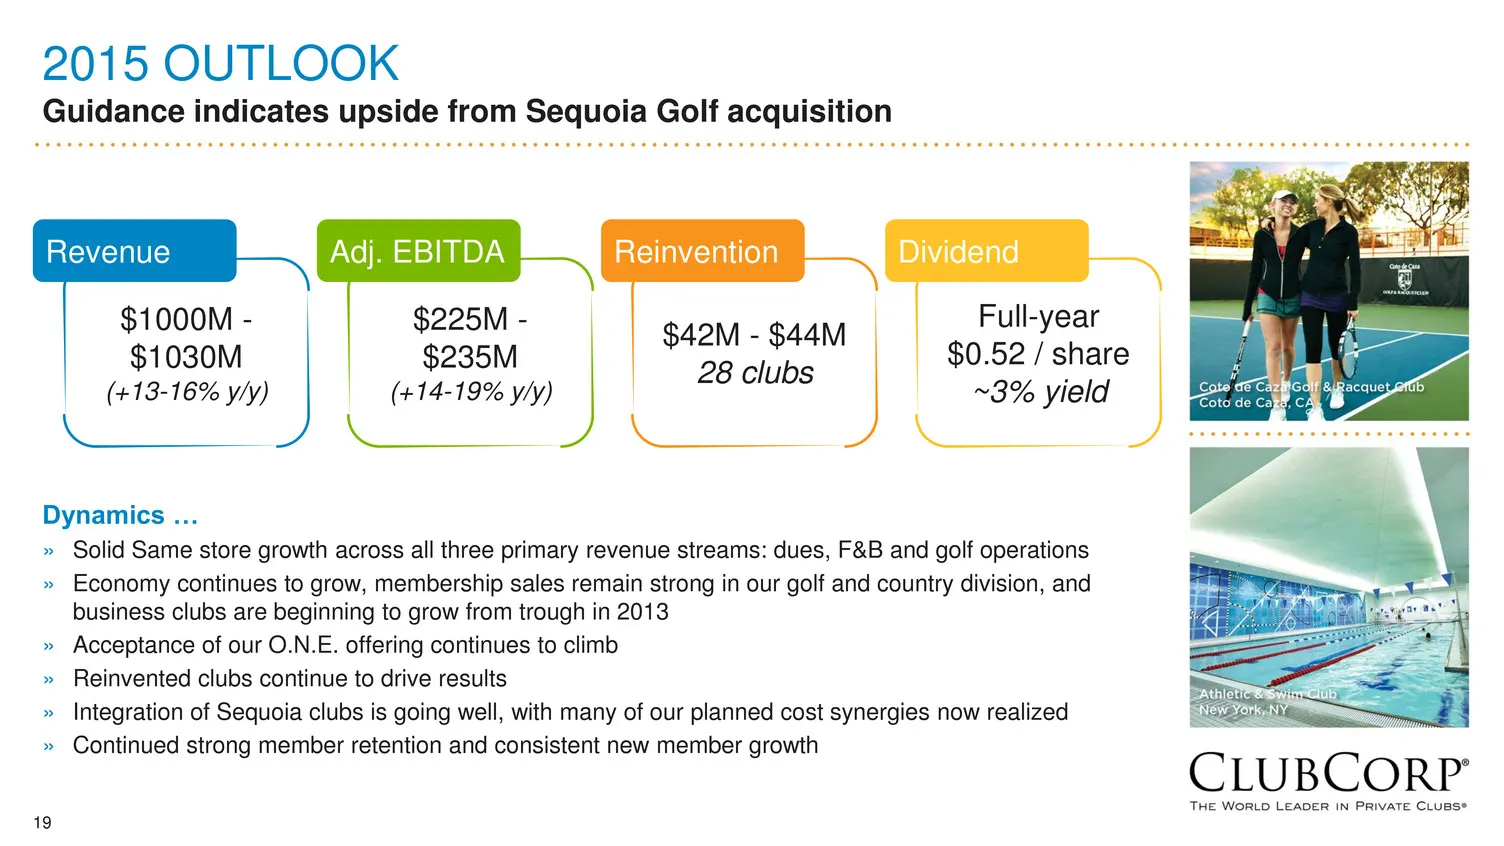
19 2015 OUTLOOK Guidance indicates upside from Sequoia Golf acquisition Dynamics … » Solid Same store growth across all three primary revenue streams: dues, F&B and golf operations » Economy continues to grow, membership sales remain strong in our golf and country division, and business clubs are be
Slide 20: Appendix
APPENDIX CLUBCORT’
Slide 21: FY14 Consolidated Results: Same Store Performance
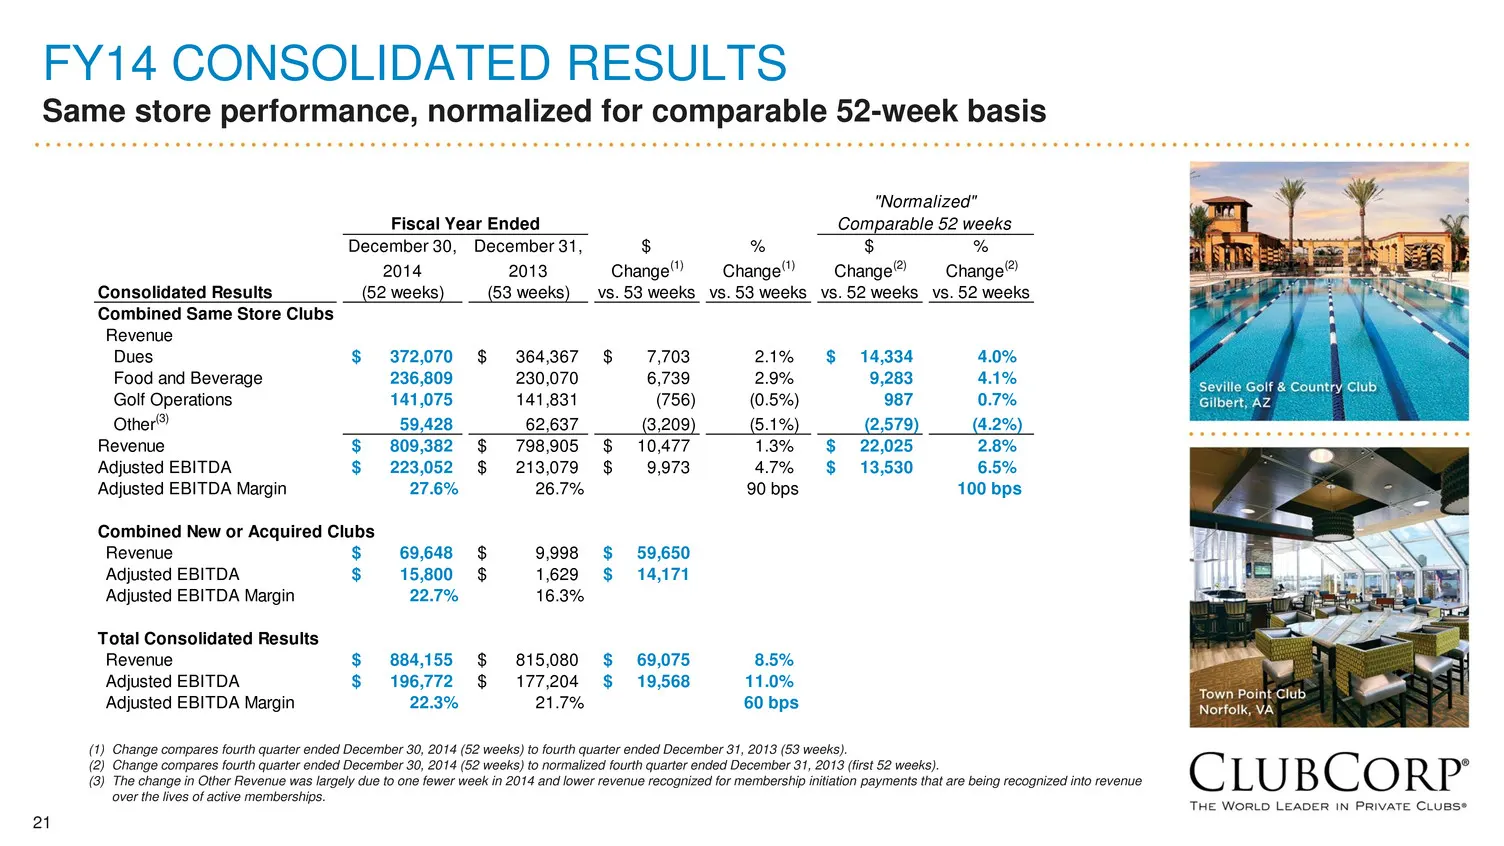
21 FY14 CONSOLIDATED RESULTS Same store performance, normalized for comparable 52-week basis (1) Change compares fourth quarter ended December 30, 2014 (52 weeks) to fourth quarter ended December 31, 2013 (53 weeks). (2) Change compares fourth quarter ended December 30, 2014 (52 weeks) to normalized
Slide 22: FY14 Golf & Country Clubs (GCC) Same Store Performance
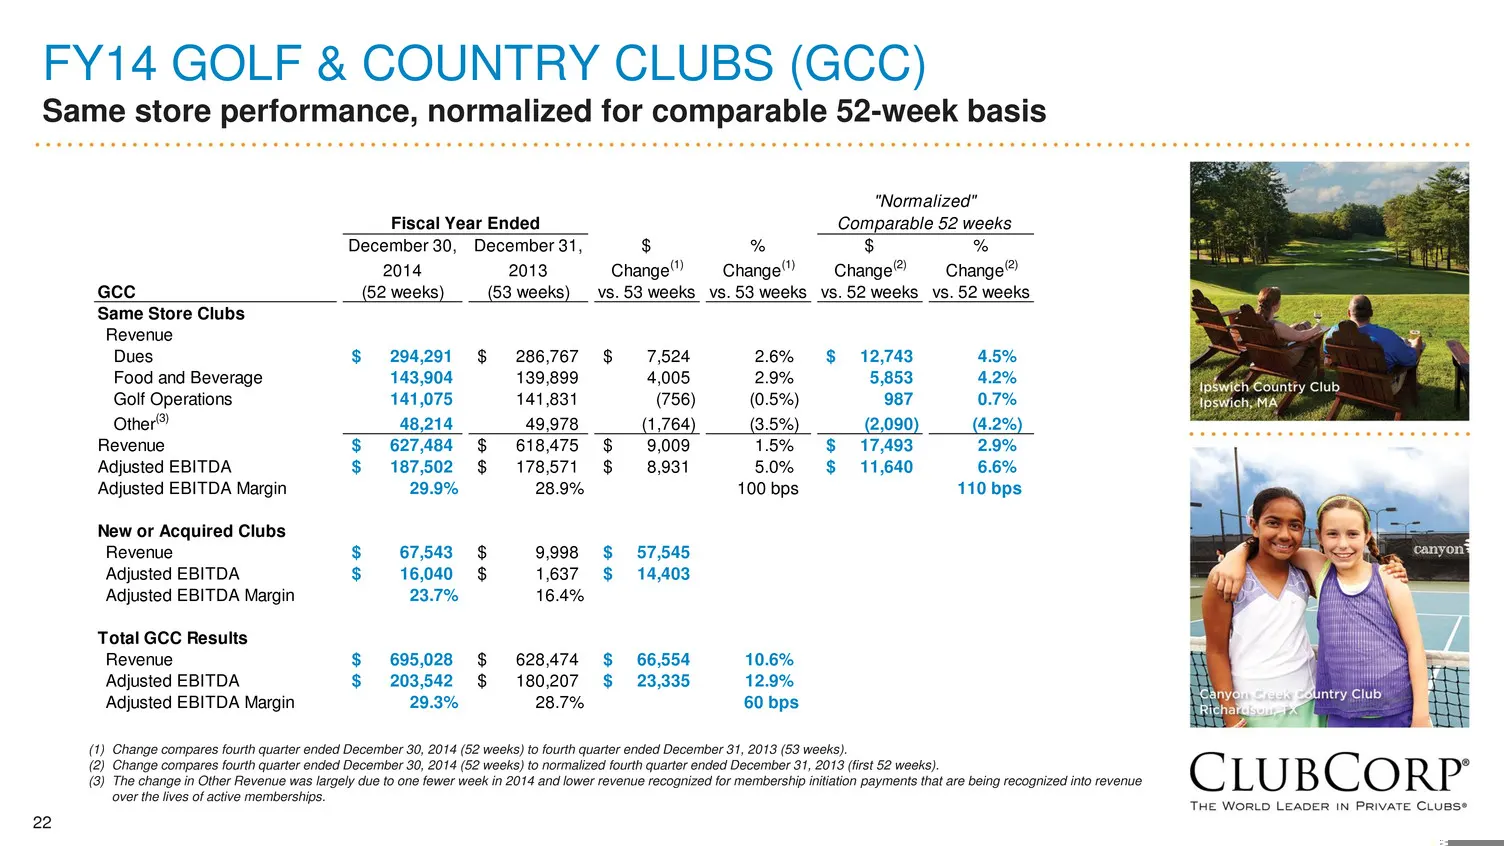
22 FY14 GOLF & COUNTRY CLUBS (GCC) Same store performance, normalized for comparable 52-week basis (1) Change compares fourth quarter ended December 30, 2014 (52 weeks) to fourth quarter ended December 31, 2013 (53 weeks). (2) Change compares fourth quarter ended December 30, 2014 (52 weeks) to norm
Slide 23: FY14 Business, Sports & Alumni Clubs (BSA) Same Store Performance
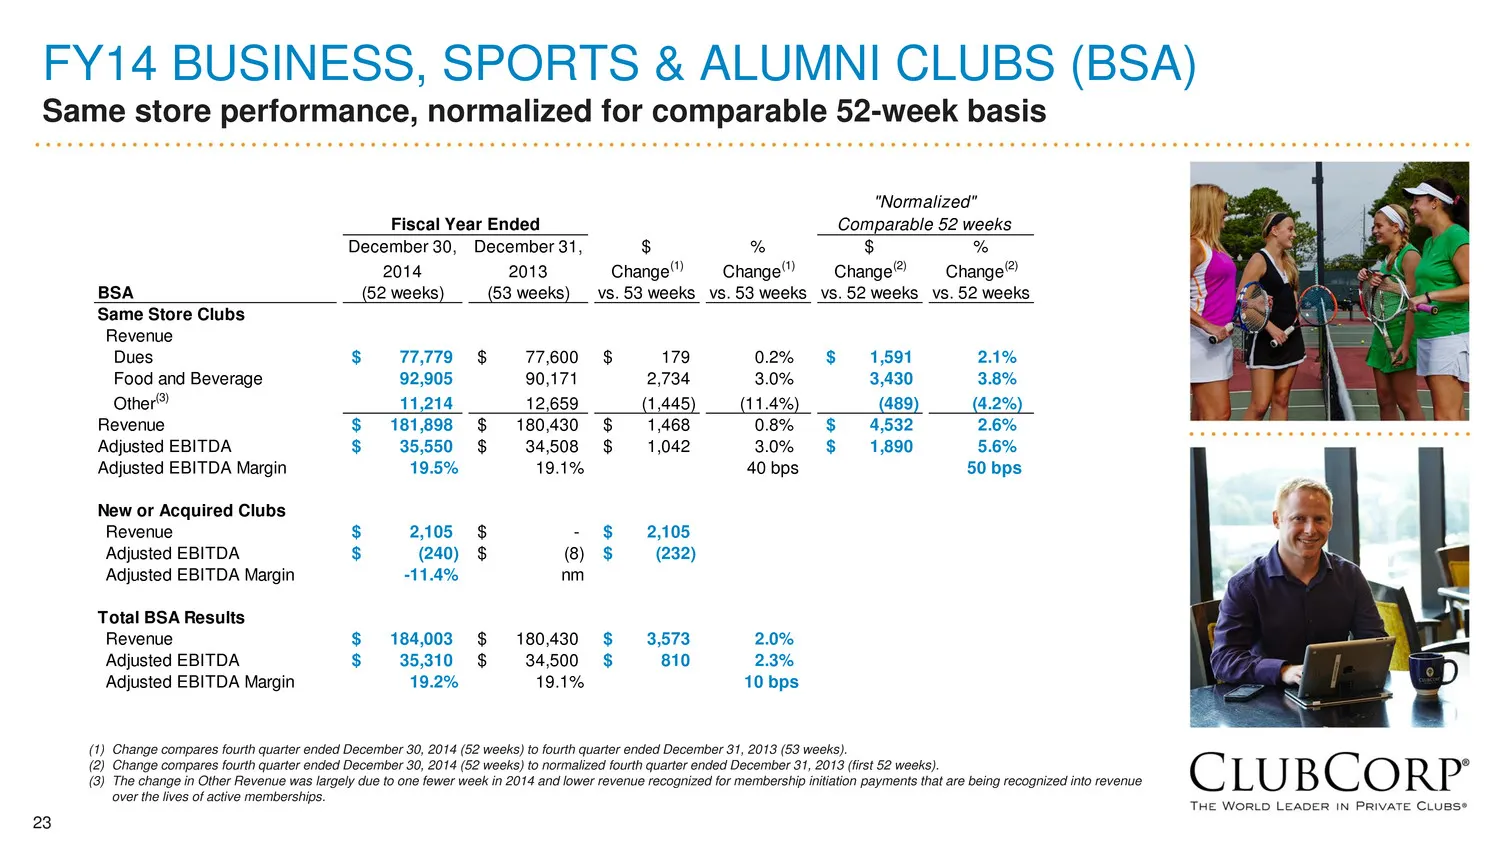
23 FY14 BUSINESS, SPORTS & ALUMNI CLUBS (BSA) Same store performance, normalized for comparable 52-week basis (1) Change compares fourth quarter ended December 30, 2014 (52 weeks) to fourth quarter ended December 31, 2013 (53 weeks). (2) Change compares fourth quarter ended December 30, 2014 (52 wee
Slide 24: Net Income to Adjusted EBITDA Reconciliation
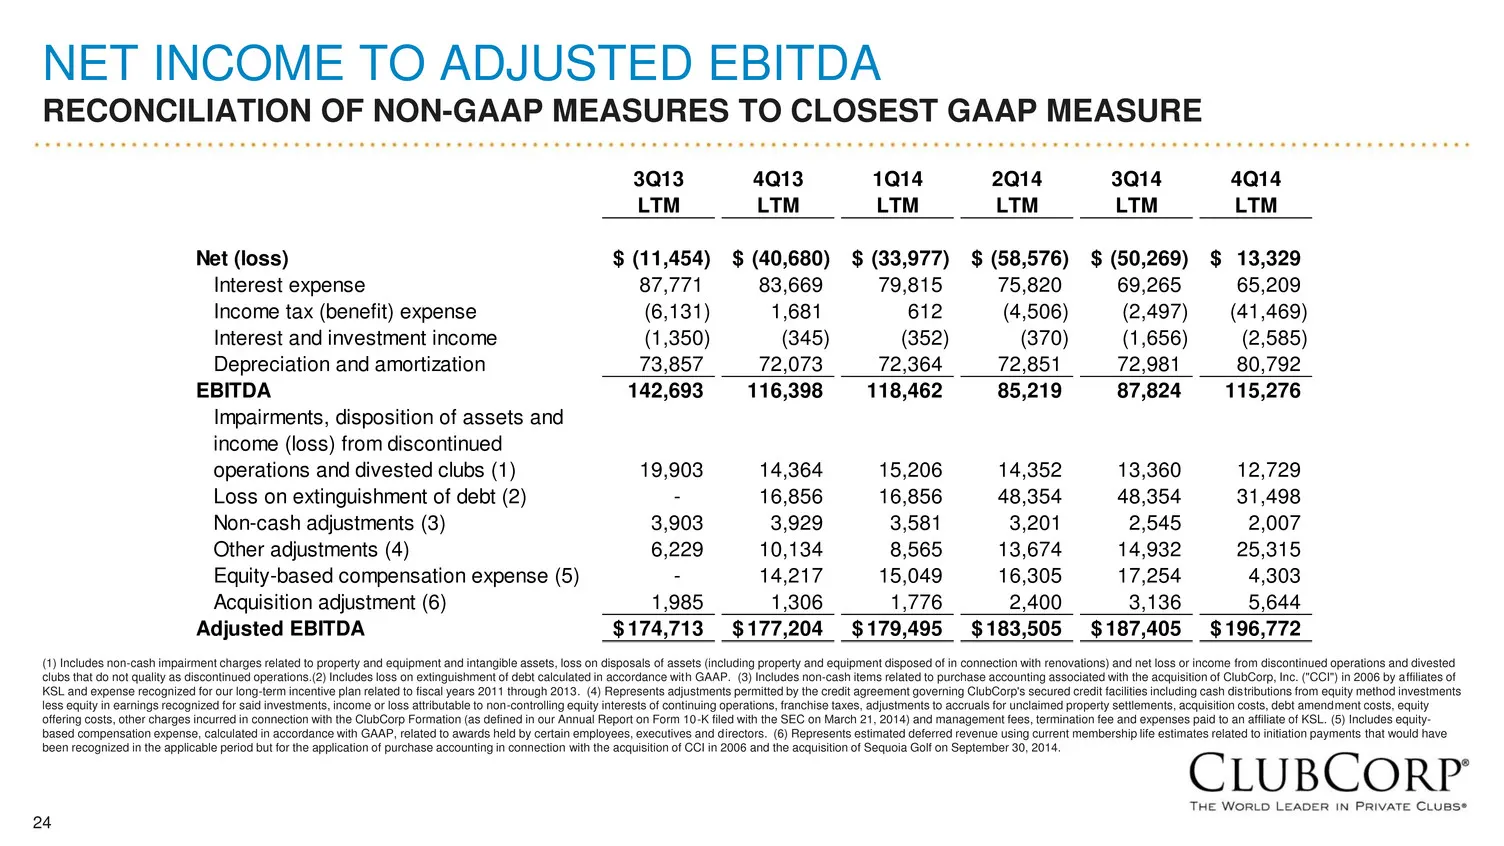
24 NET INCOME TO ADJUSTED EBITDA RECONCILIATION OF NON-GAAP MEASURES TO CLOSEST GAAP MEASURE (1) Includes non-cash impairment charges related to property and equipment and intangible assets, loss on disposals of assets (including property and equipment disposed of in connection with renovations) and
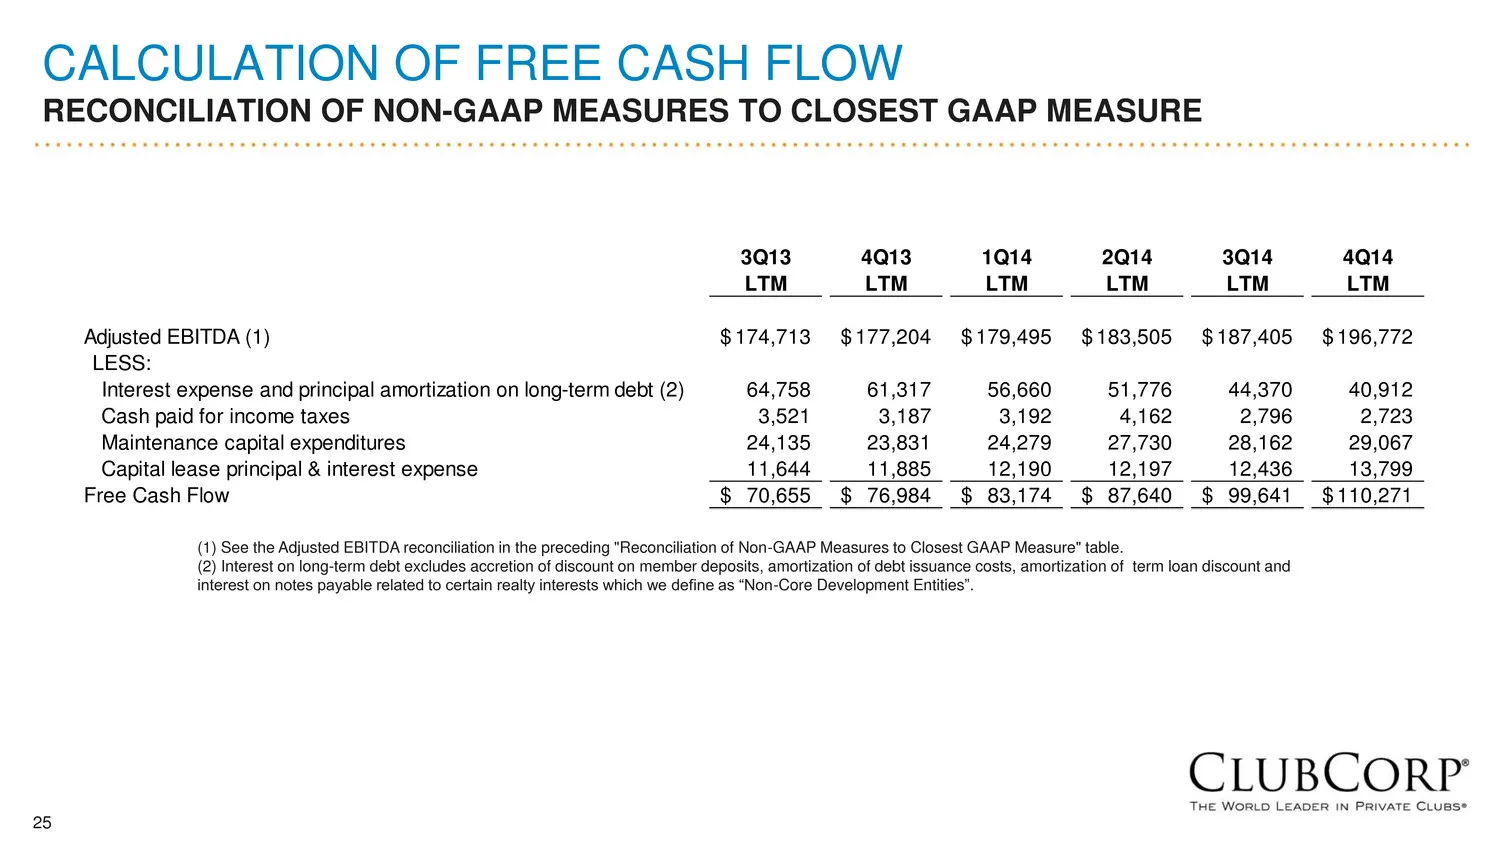
Slide 25: Calculation of Free Cash Flow
25 CALCULATION OF FREE CASH FLOW RECONCILIATION OF NON-GAAP MEASURES TO CLOSEST GAAP MEASURE (1) See the Adjusted EBITDA reconciliation in the preceding "Reconciliation of Non-GAAP Measures to Closest GAAP Measure" table. (2) Interest on long-term debt excludes accretion of discount on member deposi
Slide 26: ClubCorp: The World Leader in Private Clubs
CLUBCORP THE WORLD LEADER IN PRIVATE CLUBS®
Source: SEC EDGAR · 8-K filed Mar 12, 2015
More decks from ClubCorp Holdings Inc
 Q1 2016 Earnings Presentation38 slides · Apr 27, 2016
 Q4 2015 Earnings Presentation38 slides · Feb 24, 2016
 Q3 2015 Earnings Presentation30 slides · Oct 15, 2015
 Q2 2015 Earnings Presentation31 slides · Jul 23, 2015
 Q1 2015 Earnings Presentation25 slides · Apr 30, 2015
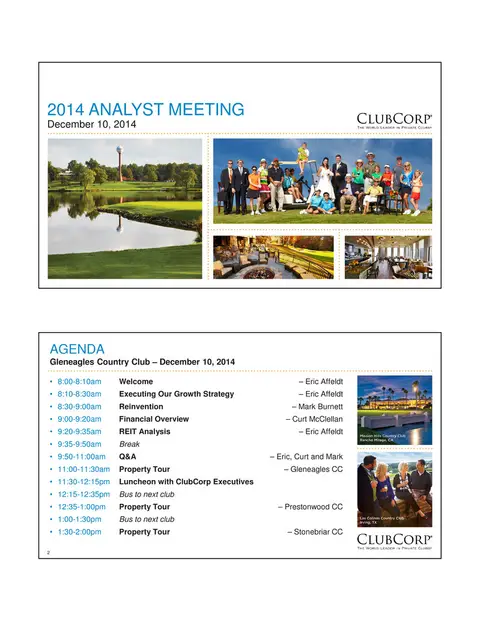 Investor Day (December 2014)34 slides · Dec 10, 2014