Fresnillo PLC · LSE:FRES
Fresnillo — BofA Merrill Lynch Global Metals & Mining Conference 2017
27 slides from Fresnillo's conference presentation, May 16, 2017
Slide 1: Dedicated to meeting our commitments
16 - 17 May 2017 Dedicated to meeting our commitments
Slide 2: Disclaimer
Disclaimer This document includes statements that are, or may be deemed to be, “forward-looking statements”. These forward-looking statements can be identified by the use of forward-looking terminology, including the terms “believes”, “estimates”, “plans”, “projects”, “anticipates”, “expects”, “inte
Slide 3: MITTIN LCL LRU CLL LLL
MITTIN LCL LRU CLL LLL HUA UUANSYLODUDEUEVOLEUEU ETP EV SET EEL
Slide 4: Fresnillo at a Glance – Value and Volume
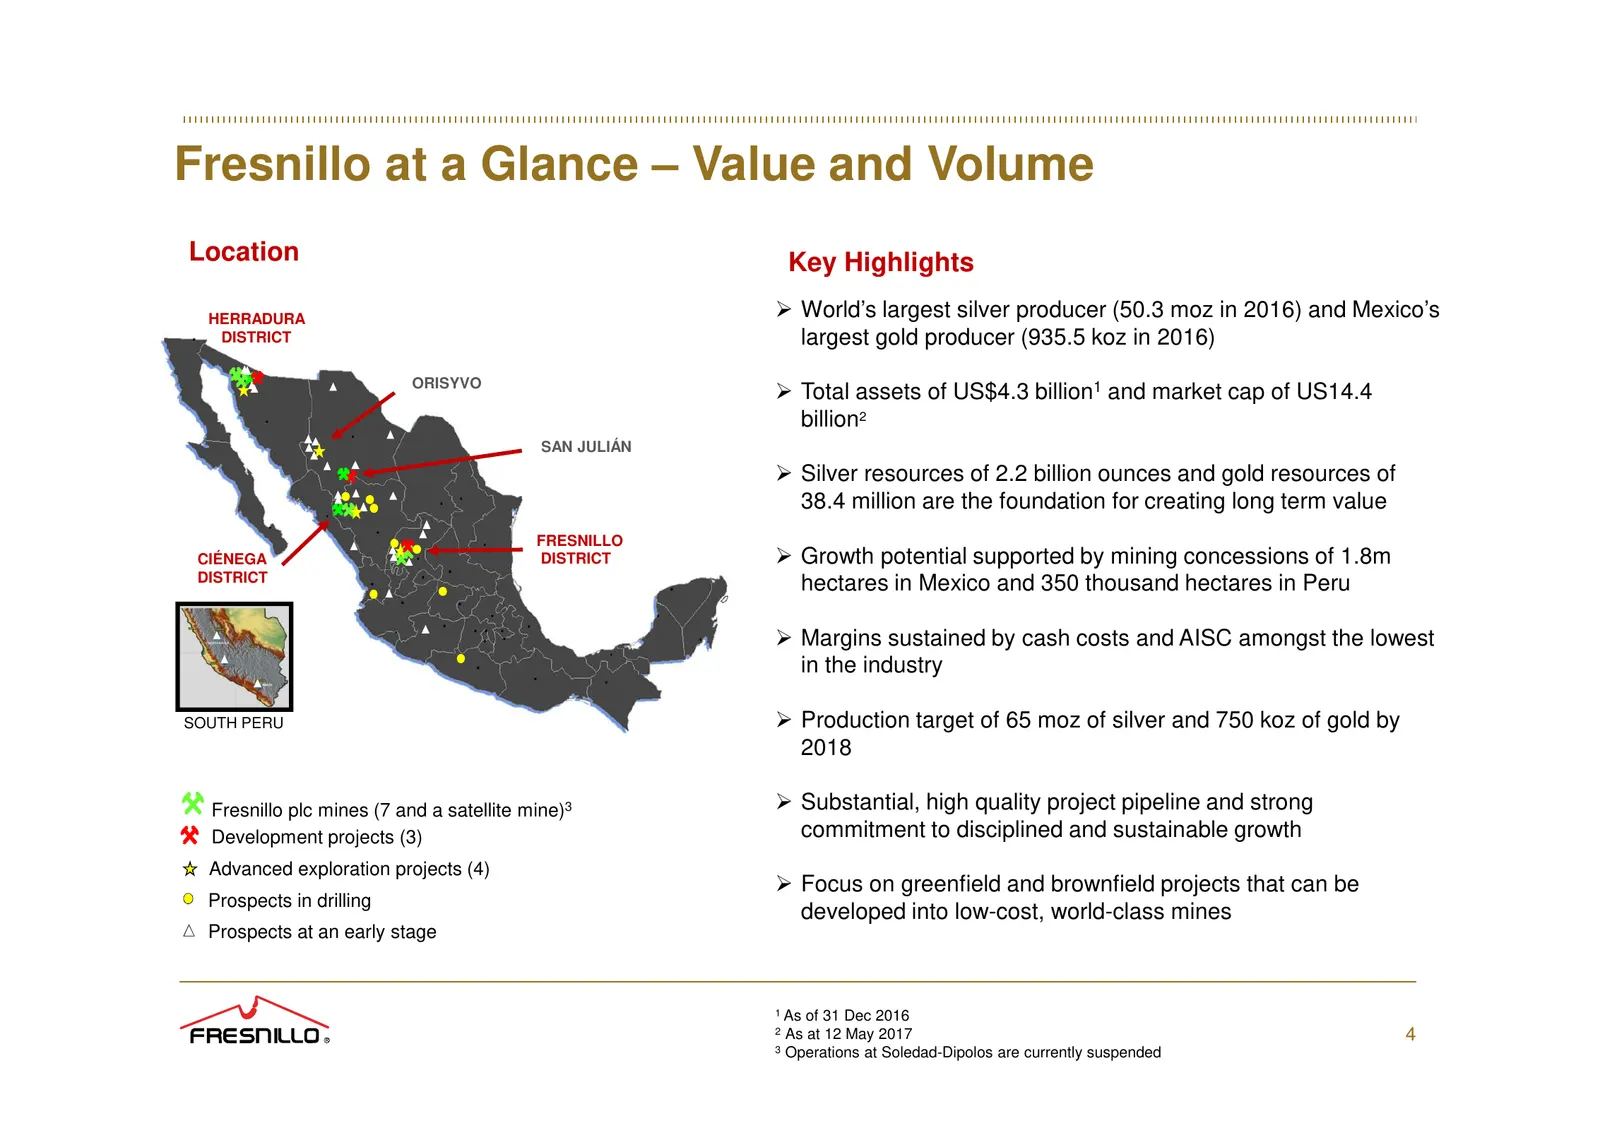
Fresnillo at a Glance – Value and Volume Location Key Highlights HERRADURA World’s largest silver producer (50.3 moz in 2016) and Mexico’s DISTRICT largest gold producer (935.5 koz in 2016) ORISYVO Total assets of US$4.3 billion1 and market cap of US14.4 billion2 SAN JULIÁN Silver resources of 2.2 b
Slide 5: Our Business Model and Strategy
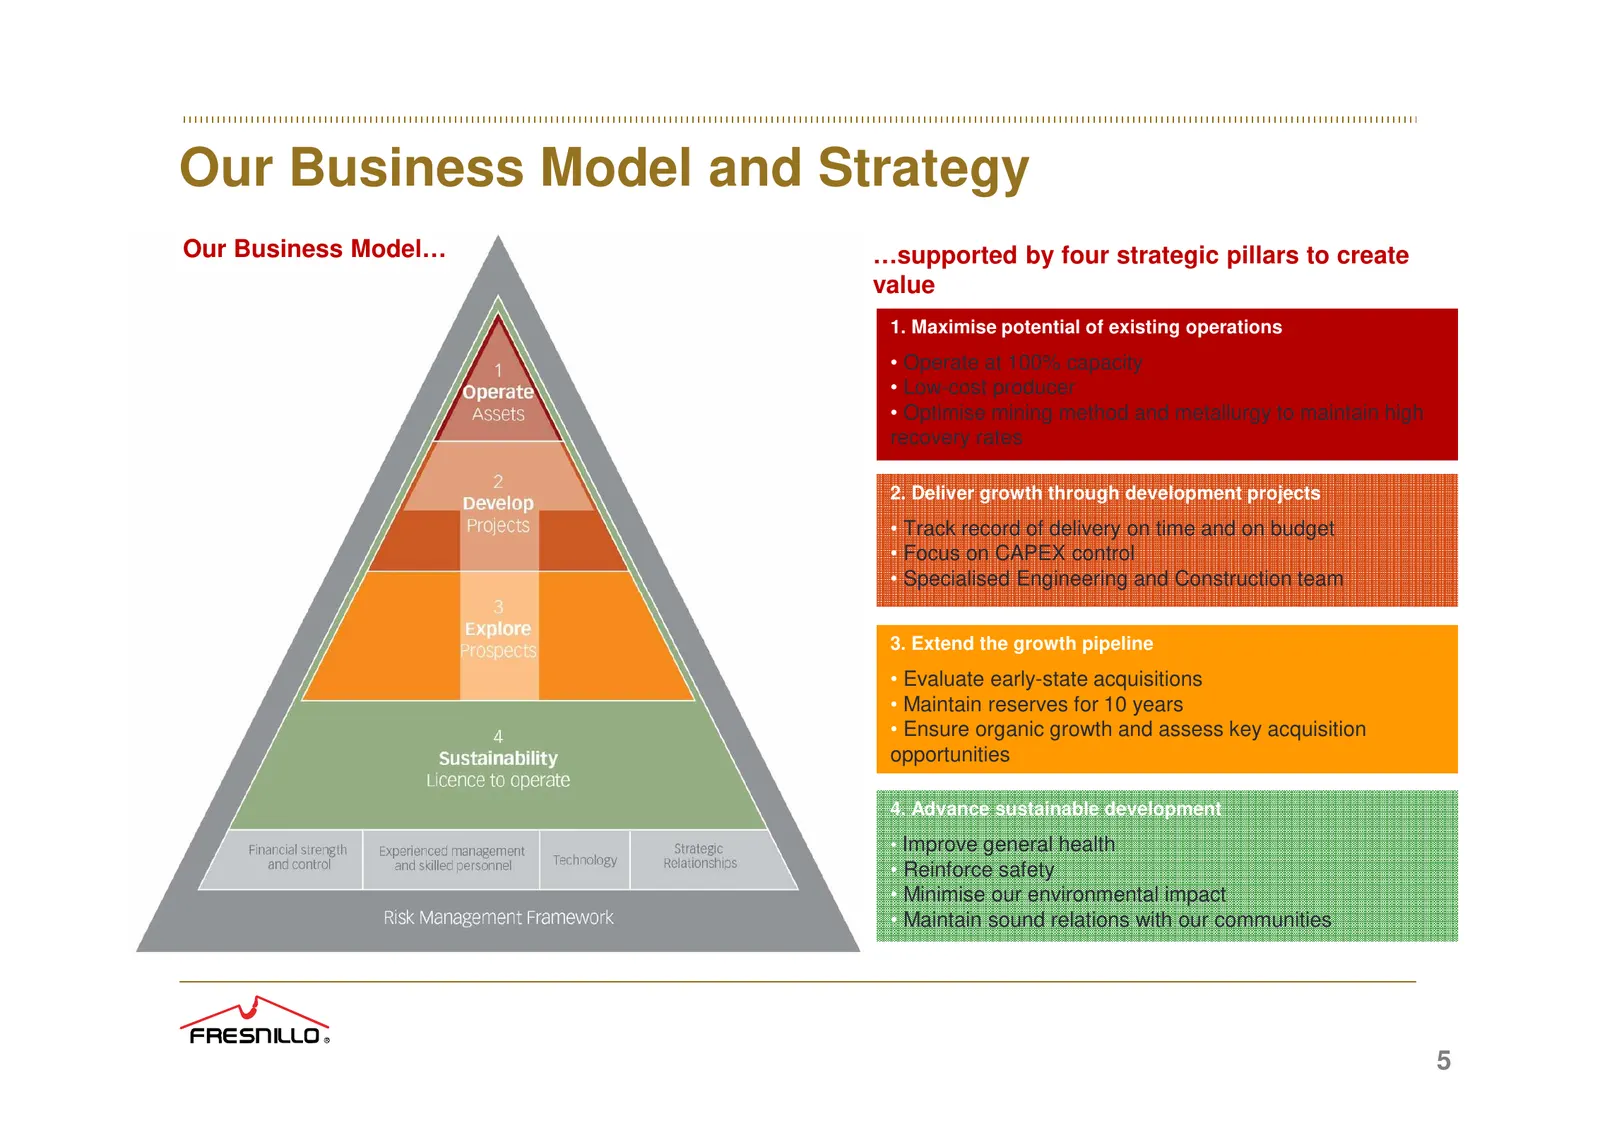
Our Business Model and Strategy Our Business Model… …supported by four strategic pillars to create value 1. Maximise potential of existing operations • Operate at 100% capacity • Low-cost producer • Optimise mining method and metallurgy to maintain high recovery rates 2. Deliver growth through devel
Slide 6: 2016 Highlights 2017 Updates
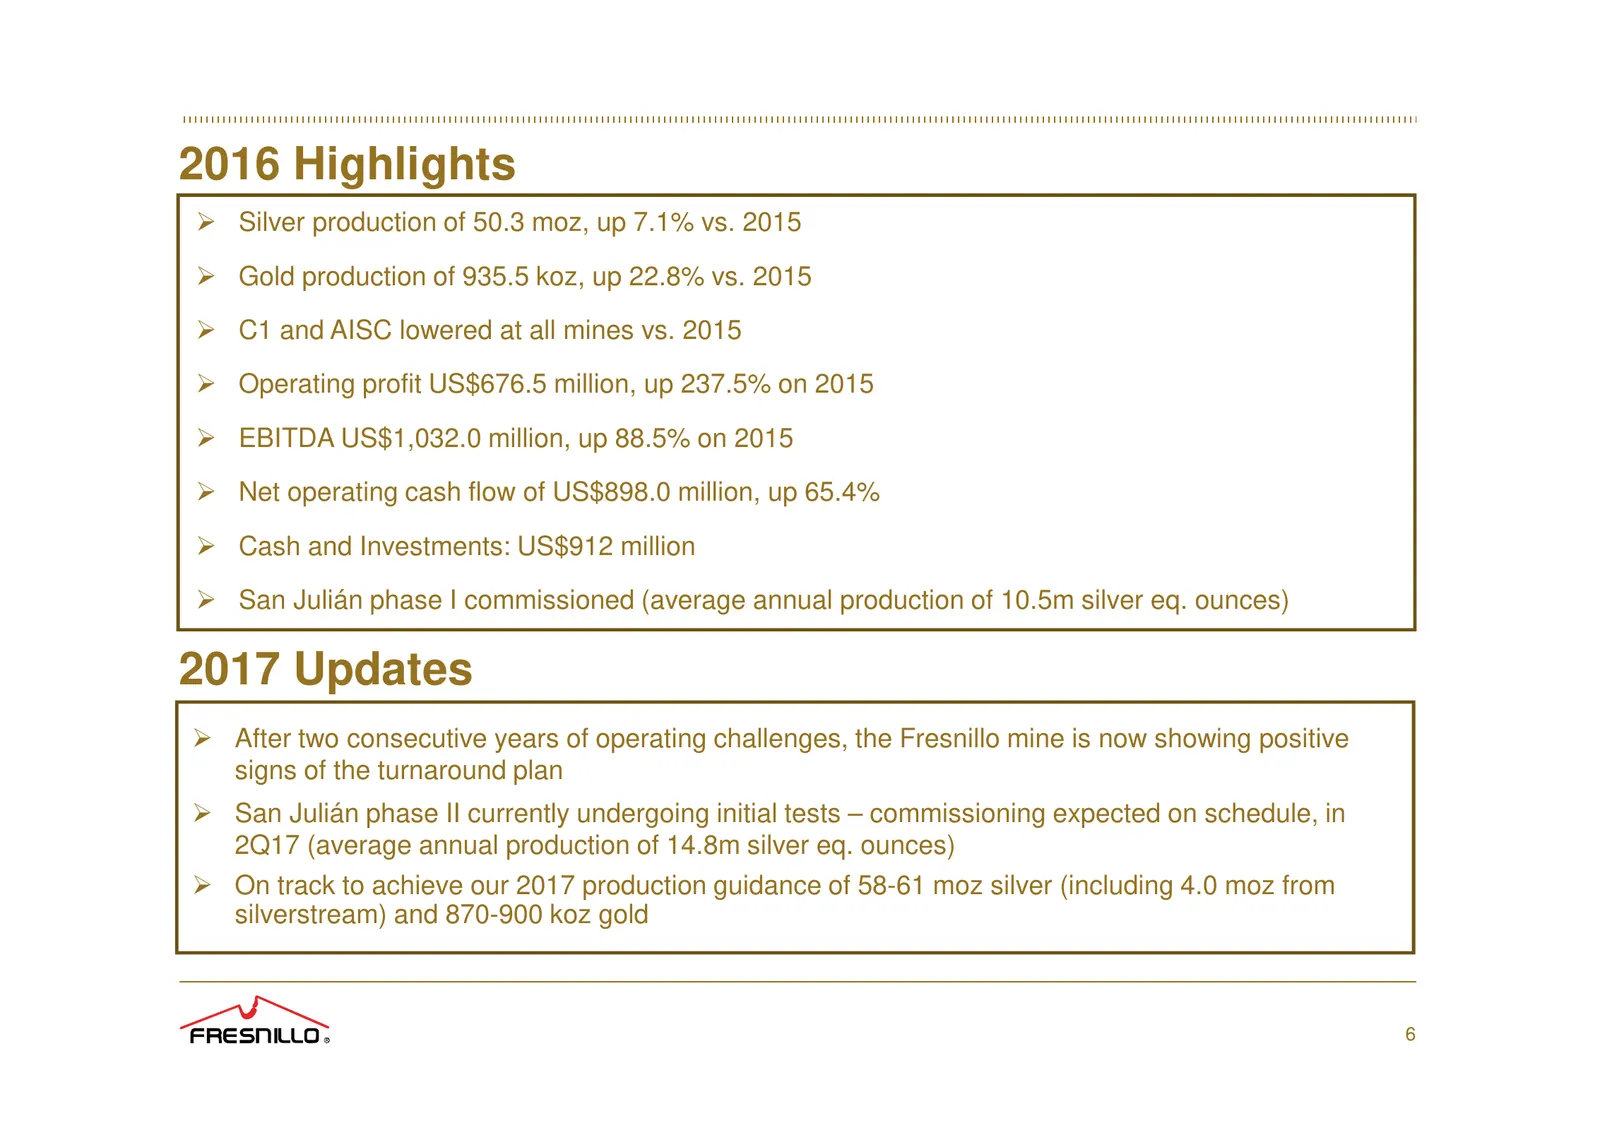
2016 Highlights Silver production of 50.3 moz, up 7.1% vs. 2015 Gold production of 935.5 koz, up 22.8% vs. 2015 C1 and AISC lowered at all mines vs. 2015 Operating profit US$676.5 million, up 237.5% on 2015 EBITDA US$1,032.0 million, up 88.5% on 2015 Net operating cash flow of US$898.0 million, up 6
Slide 7: Operations
Operations
Slide 8: Operations
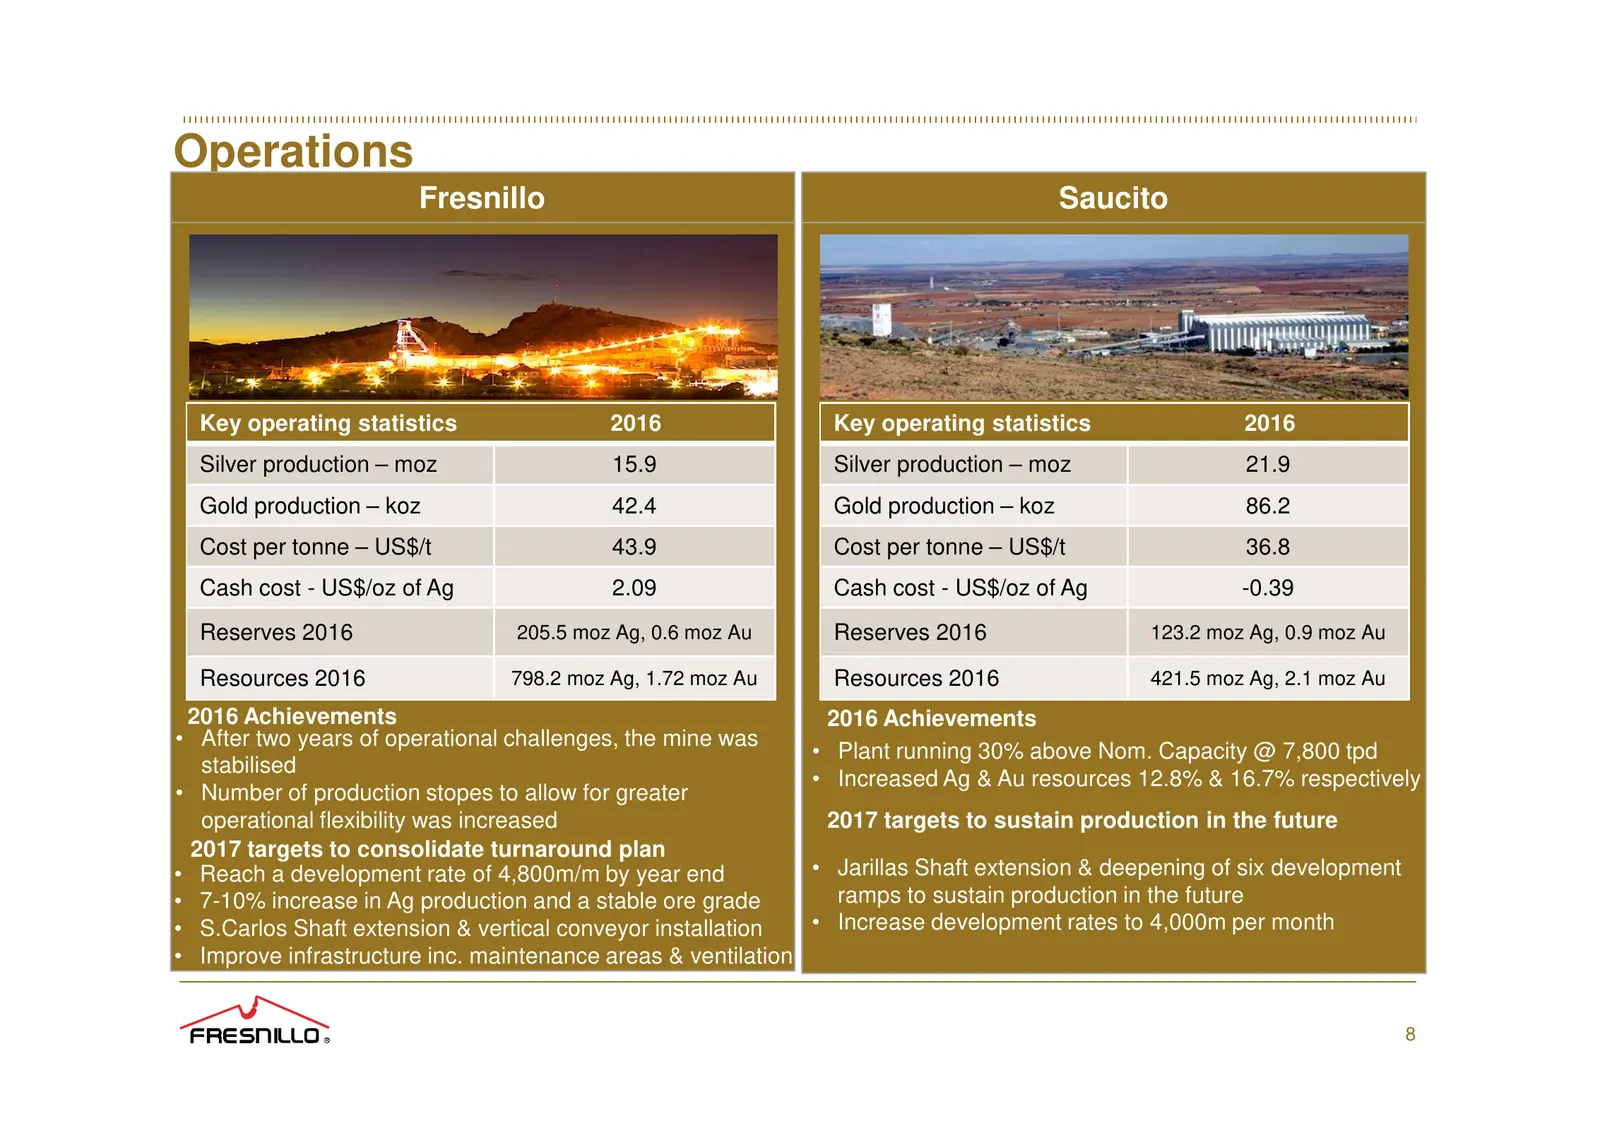
Operations Fresnillo Saucito Key operating statistics 2016 Key operating statistics 2016 Silver production – moz 15.9 Silver production – moz 21.9 Gold production – koz 42.4 Gold production – koz 86.2 Cost per tonne – US$/t 43.9 Cost per tonne – US$/t 36.8 Cash cost - US$/oz of Ag 2.09 Cash cost - U
Slide 9: Operations Cont.
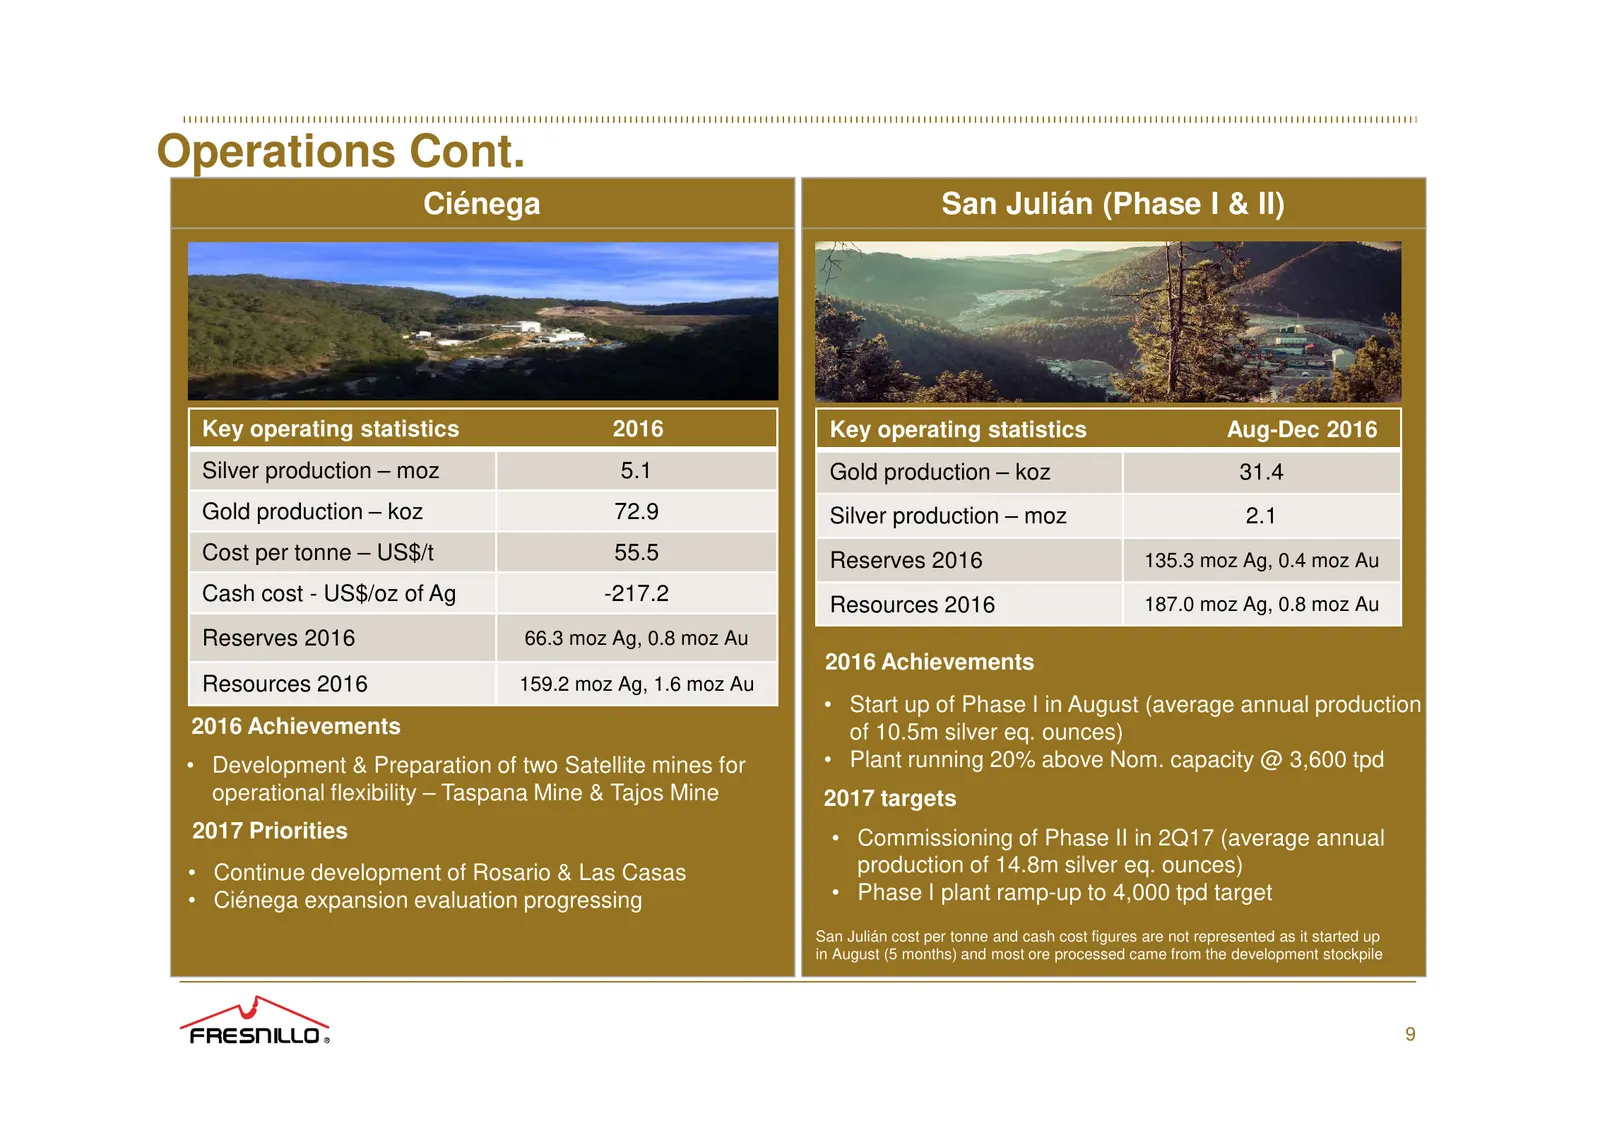
Operations Cont. Ciénega San Julián (Phase I & II) Key operating statistics 2016 Key operating statistics Aug-Dec 2016 Silver production – moz 5.1 Gold production – koz 31.4 Gold production – koz 72.9 Silver production – moz 2.1 Cost per tonne – US$/t 55.5 Reserves 2016 135.3 moz Ag, 0.4 moz Au Cash
Slide 10: Operations Cont.
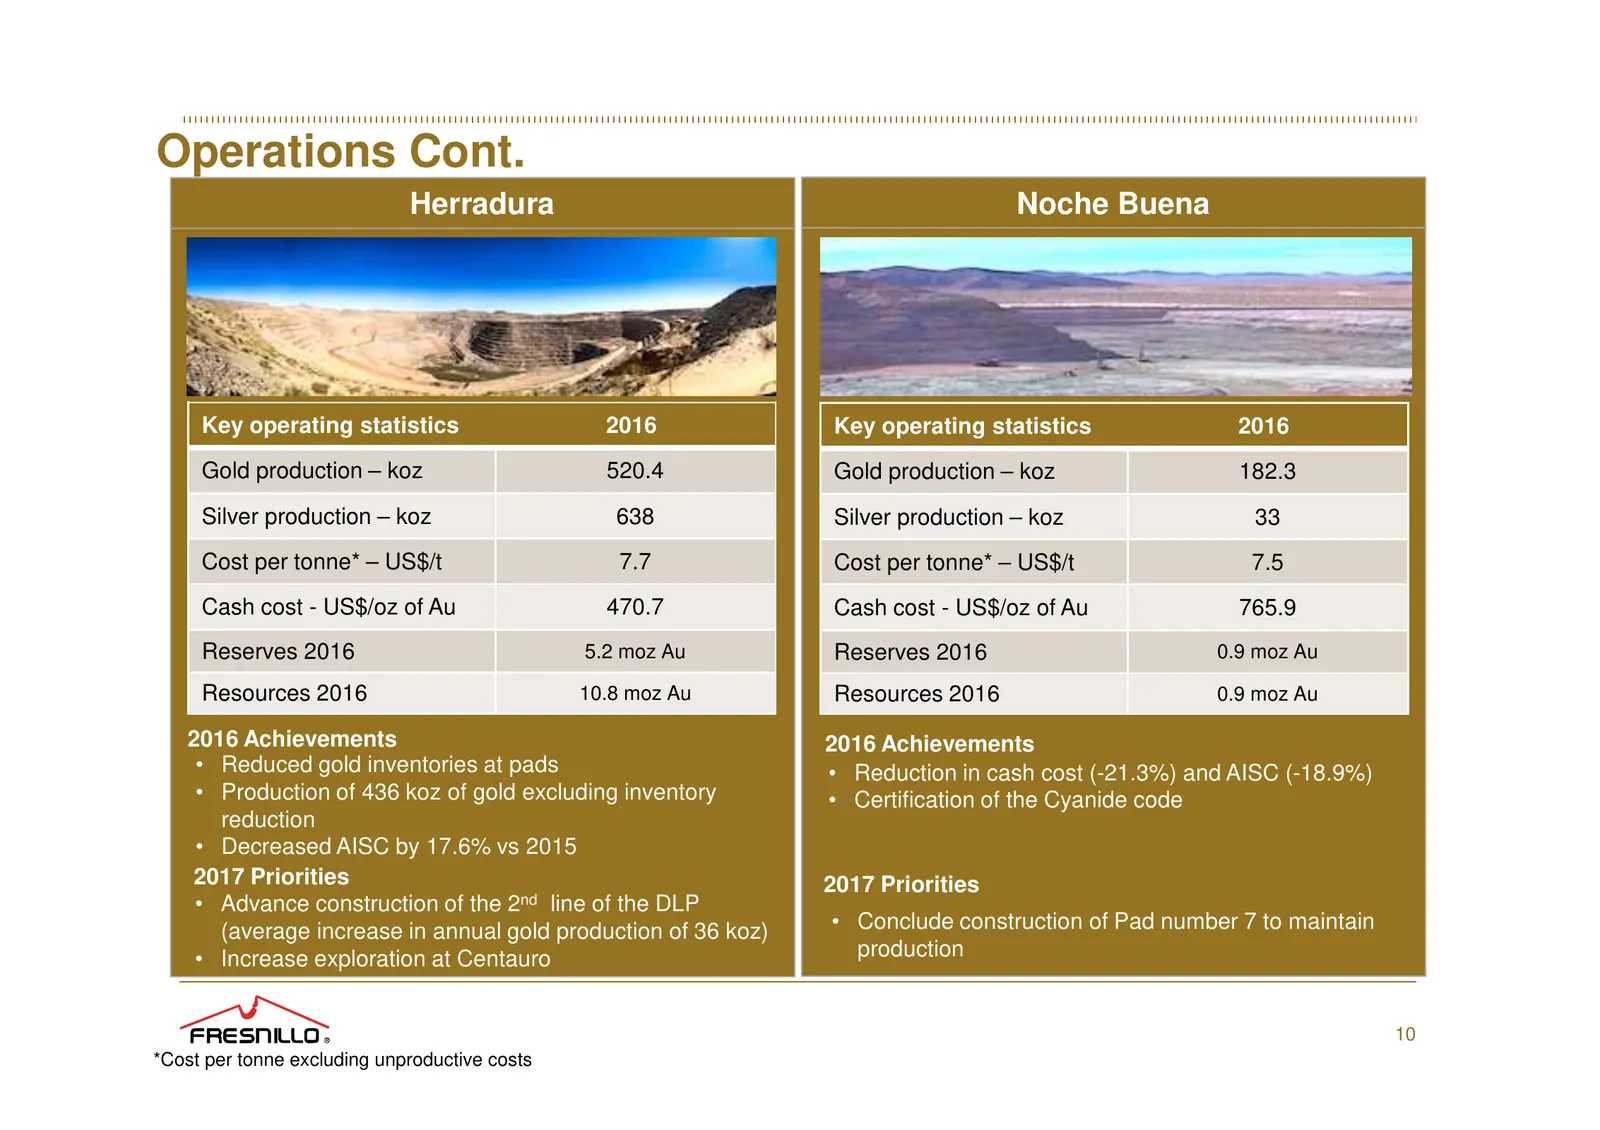
Operations Cont. Herradura Noche Buena Key operating statistics 2016 Key operating statistics 2016 Gold production – koz 520.4 Gold production – koz 182.3 Silver production – koz 638 Silver production – koz 33 Cost per tonne* – US$/t 7.7 Cost per tonne* – US$/t 7.5 Cash cost - US$/oz of Au 470.7 Cas
Slide 11: Group Consolidated Cash Cost & All In Sustaining Cost (US$/Oz)
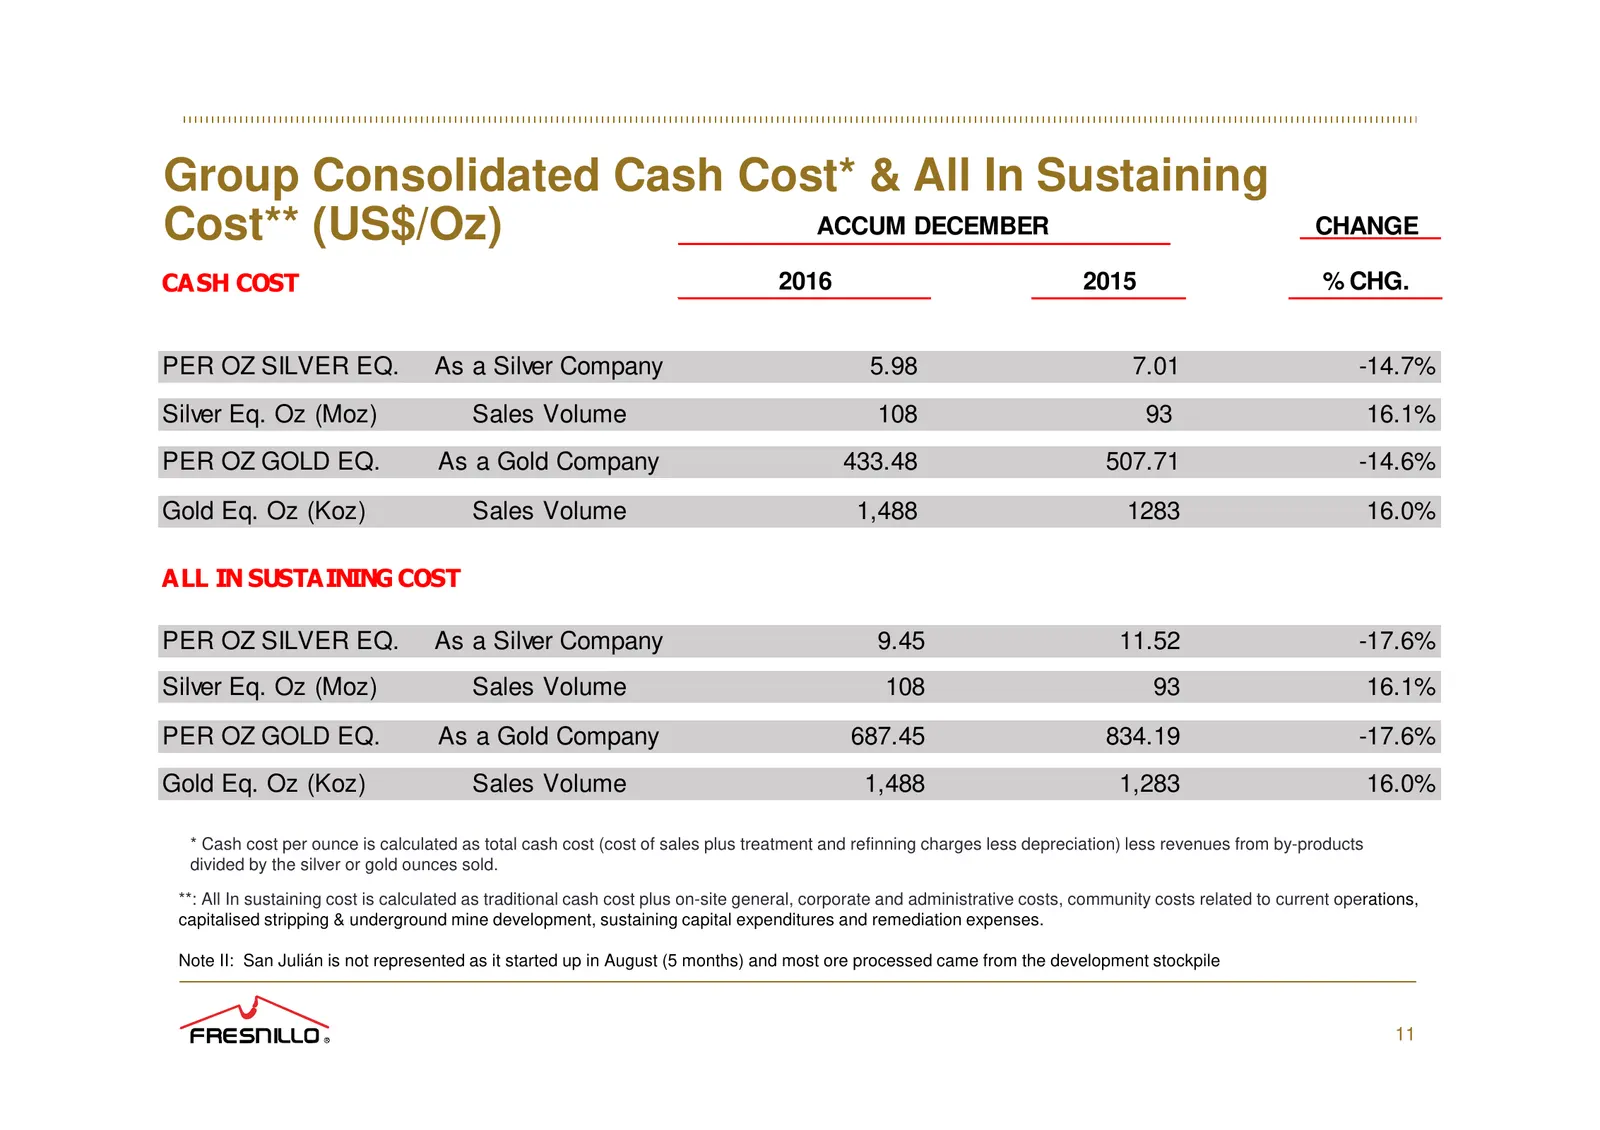
Group Consolidated Cash Cost* & All In Sustaining Cost** (US$/Oz) ACCUM DECEMBER CHANGE CASH COST 2016 2015 % CHG. PER OZ SILVER EQ. As a Silver Company 5.98 7.01 -14.7% Silver Eq. Oz (Moz) Sales Volume 108 93 16.1% PER OZ GOLD EQ. As a Gold Company 433.48 507.71 -14.6% Gold Eq. Oz (Koz) Sales Volum
Slide 12: Projects and Exploration
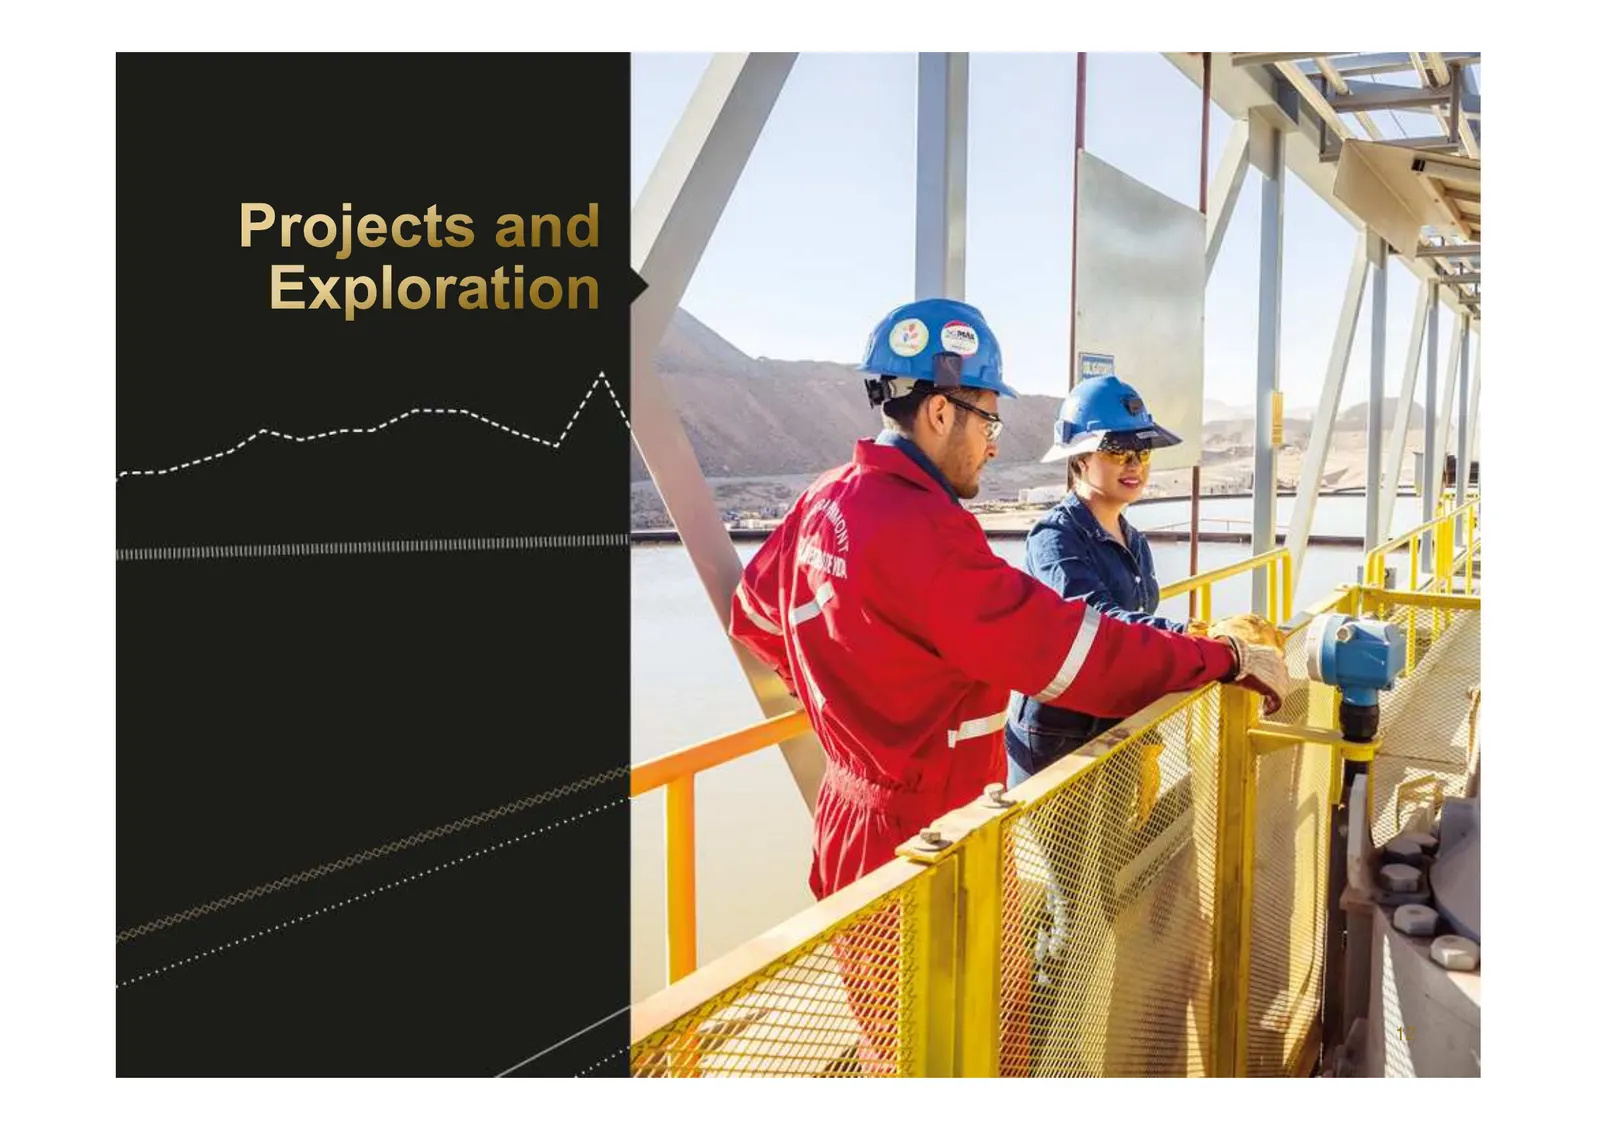
Projects and Exploration ay .YAUNUAUEVEODEOOODODORULEL EY PU POQUAVEUUEOCED DDE DPE ELL TTY ATUL LEER U LL With ‘ aM) LL LS TTL
Slide 13: Expected Delivery of Growth
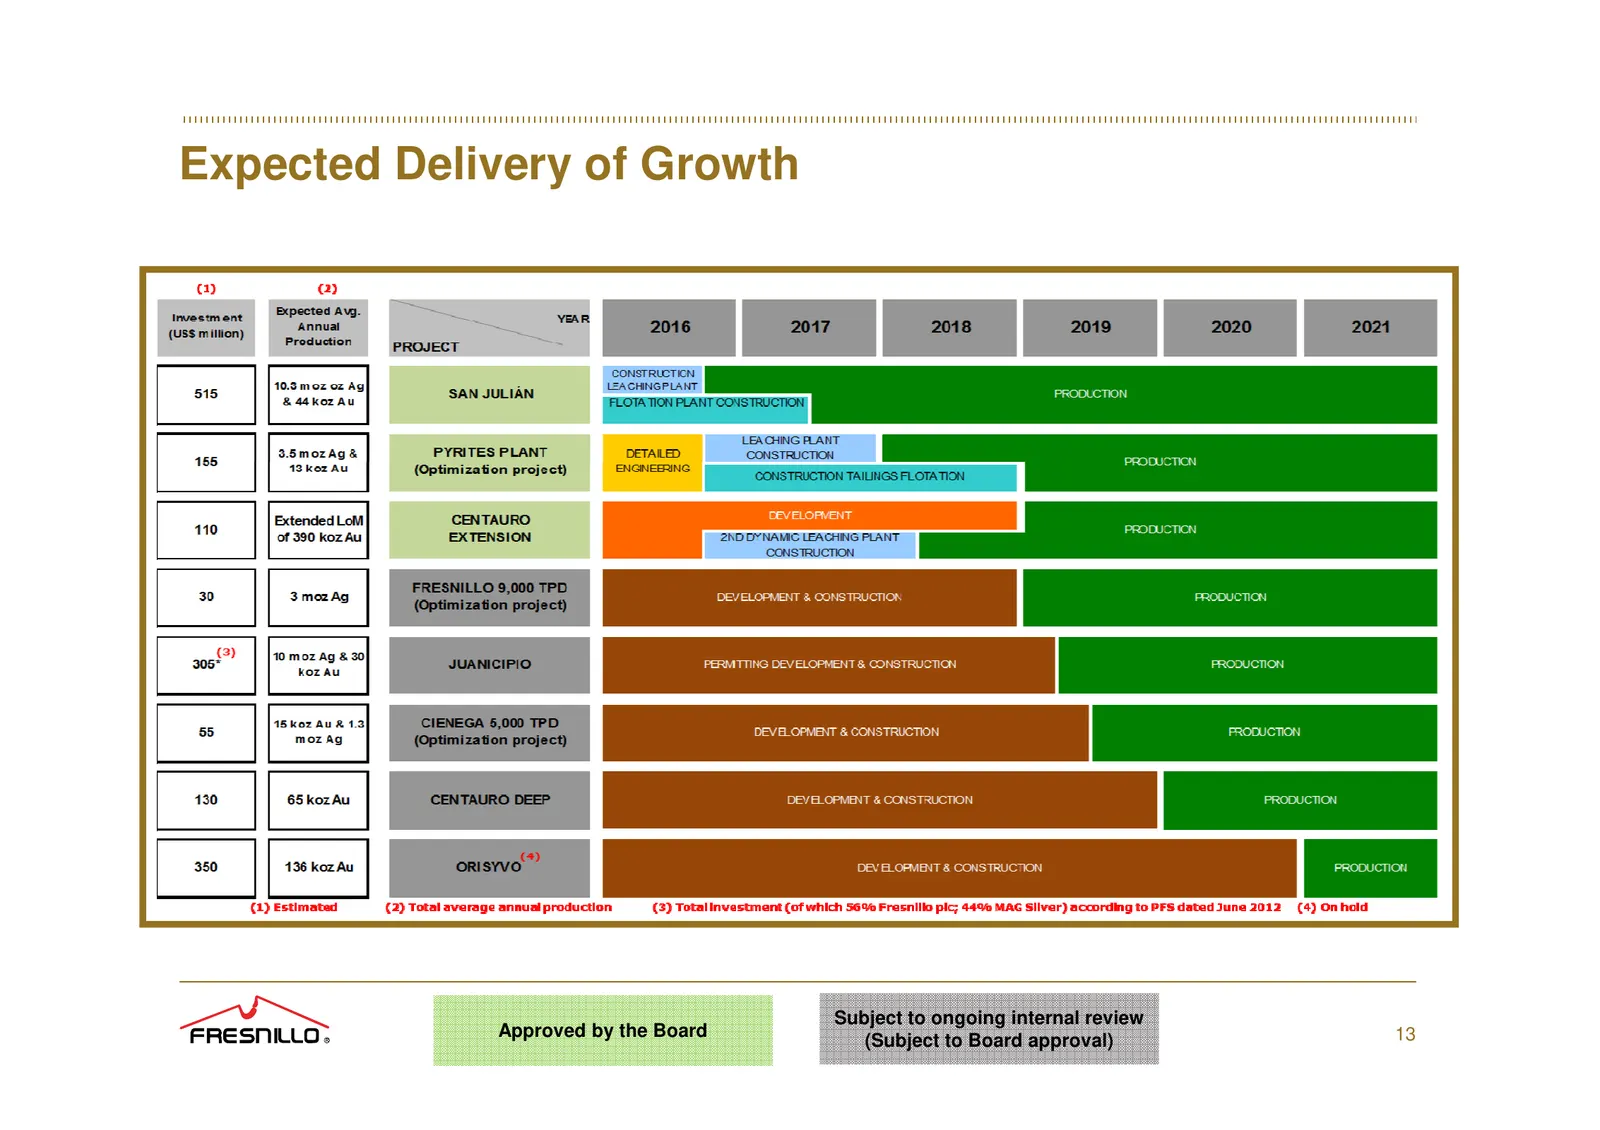
Expected Delivery of Growth Subject to ongoing internal review Approved by the Board 13 (Subject to Board approval)
Slide 14: Projects: San Julián (Phase I & II)
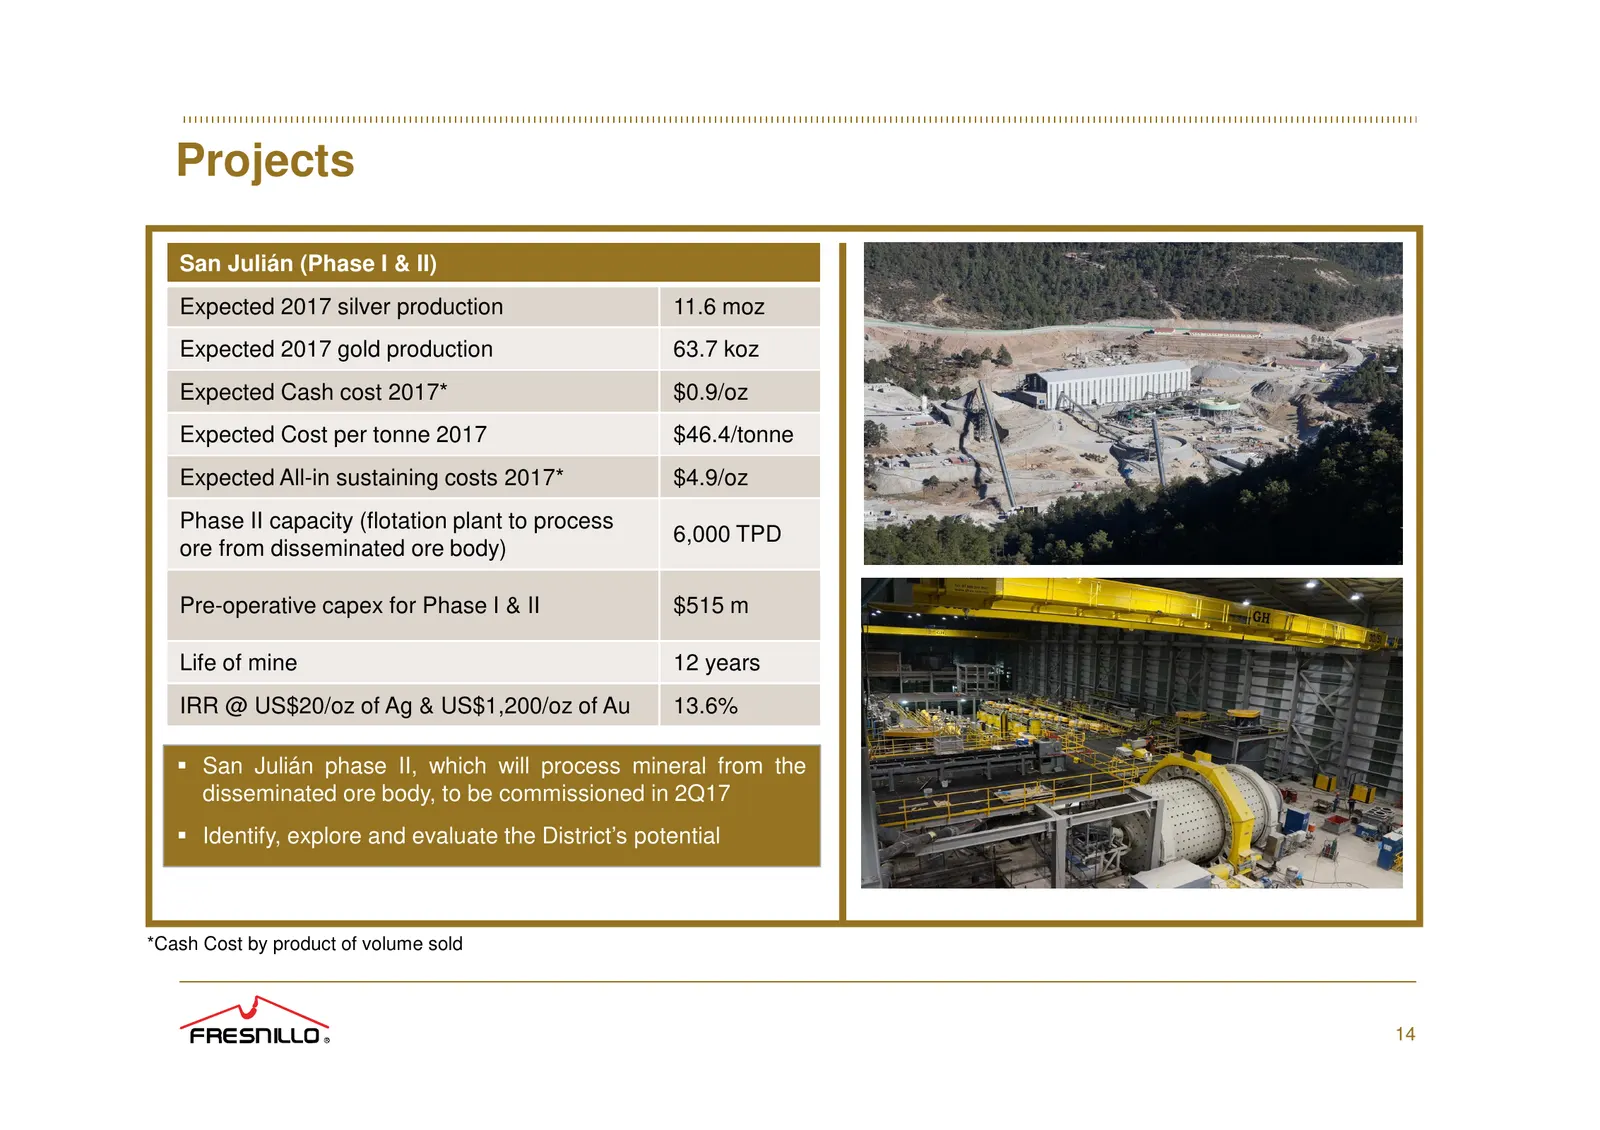
Projects San Julián (Phase I & II) Expected 2017 silver production 11.6 moz Expected 2017 gold production 63.7 koz Expected Cash cost 2017* $0.9/oz Expected Cost per tonne 2017 $46.4/tonne Expected All-in sustaining costs 2017* $4.9/oz Phase II capacity (flotation plant to process 6,000 TPD ore from
Slide 15: San Julián District Potential
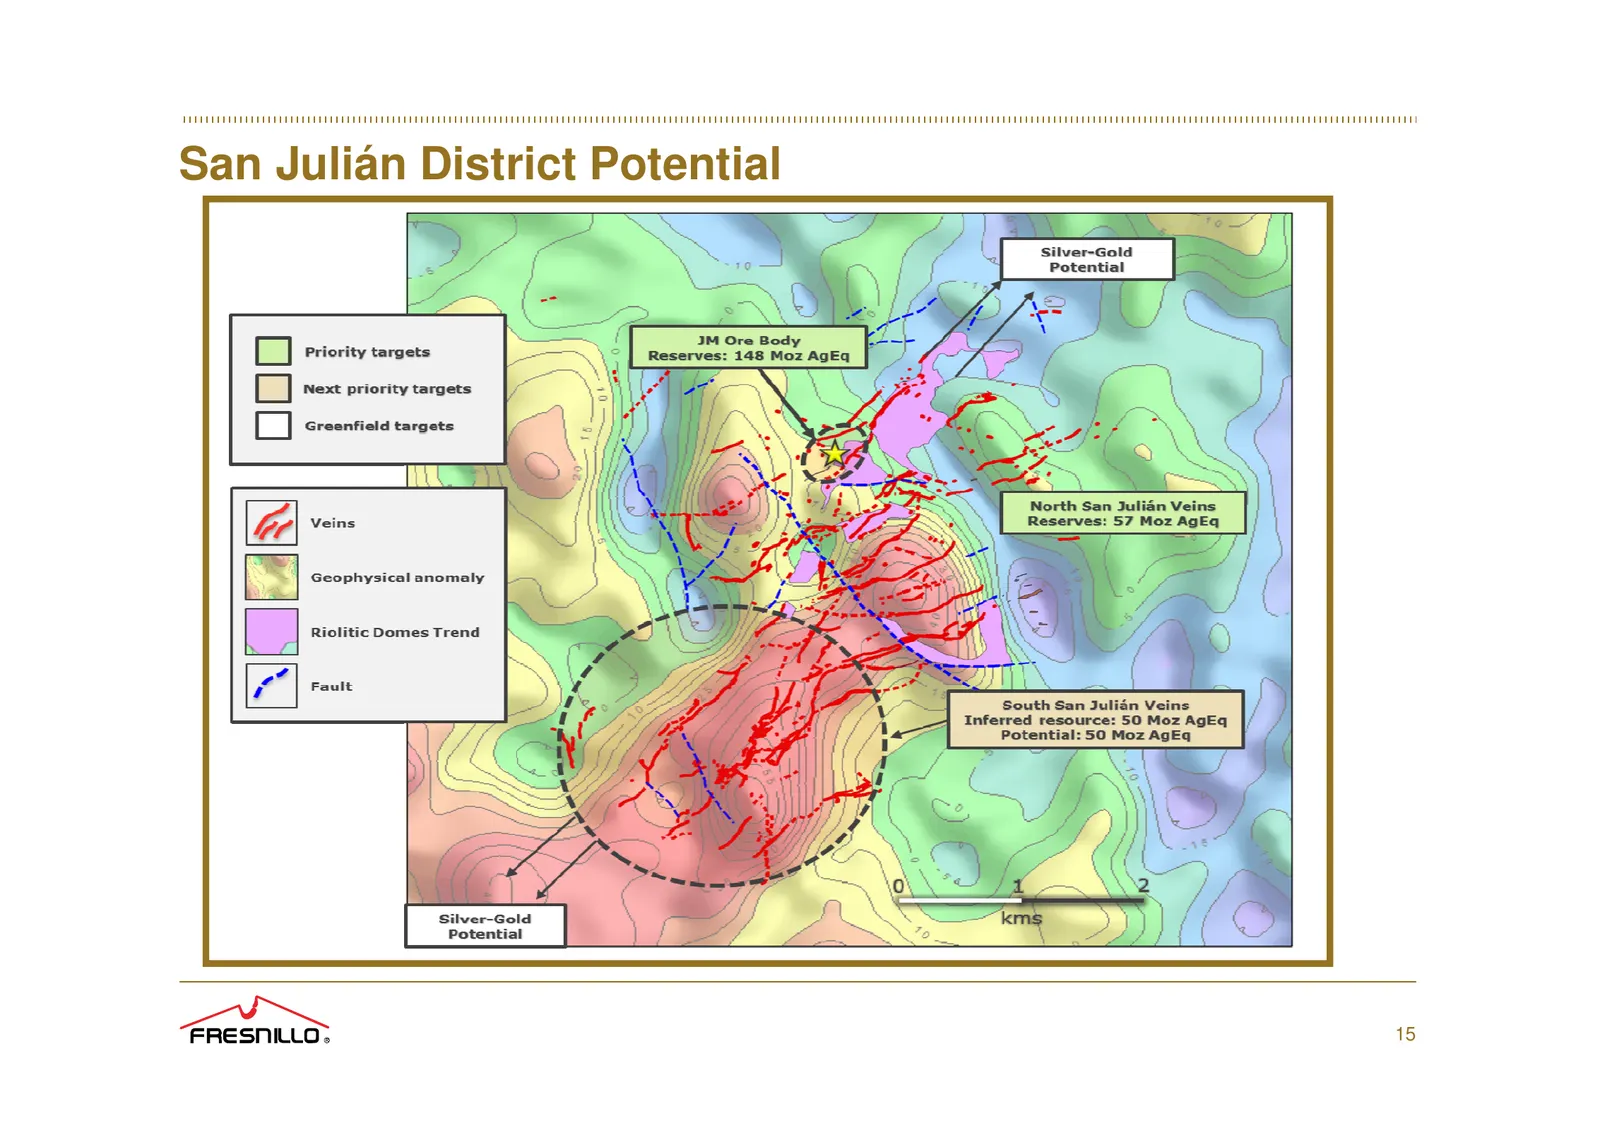
San Julián District Potential 15
Slide 16: Projects Cont.: Pyrites Plant Project
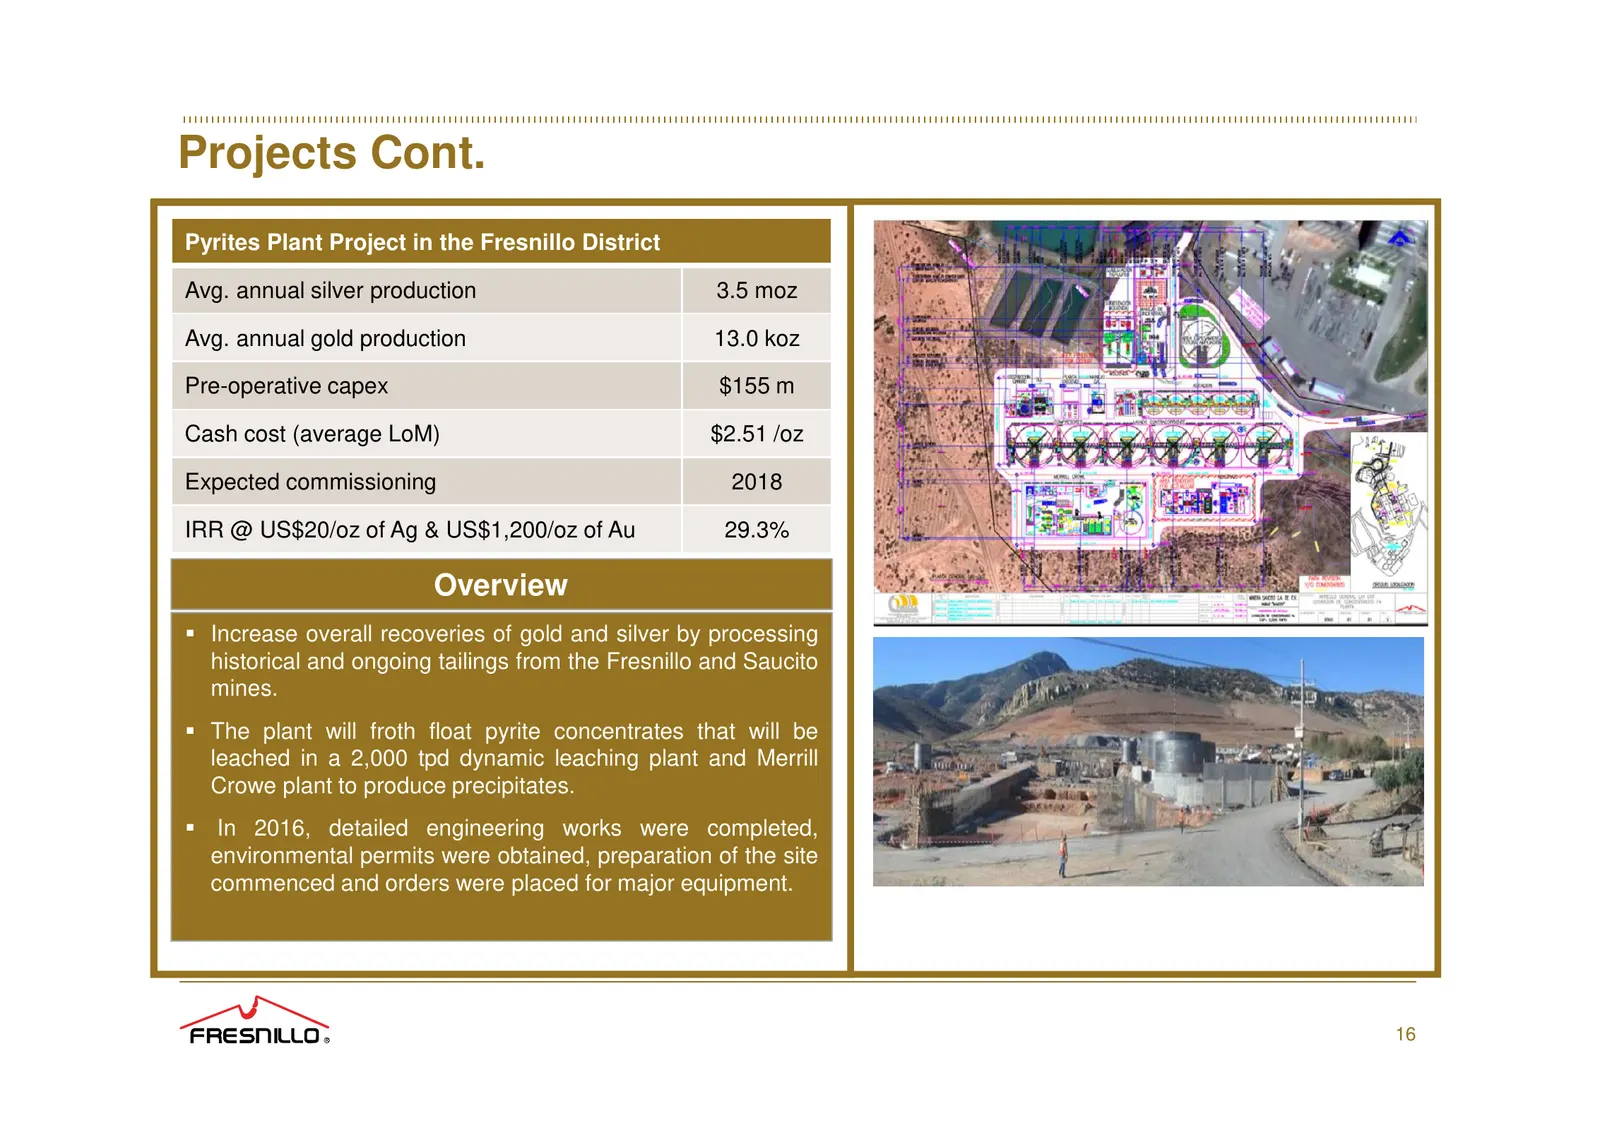
Projects Cont. Pyrites Plant Project in the Fresnillo District Avg. annual silver production 3.5 moz Avg. annual gold production 13.0 koz Pre-operative capex $155 m Cash cost (average LoM) $2.51 /oz Expected commissioning 2018 IRR @ US$20/oz of Ag & US$1,200/oz of Au 29.3% Overview Increase overall
Slide 17: Projects Cont.: 2nd Line of Dynamic Leaching Plant at Herradura
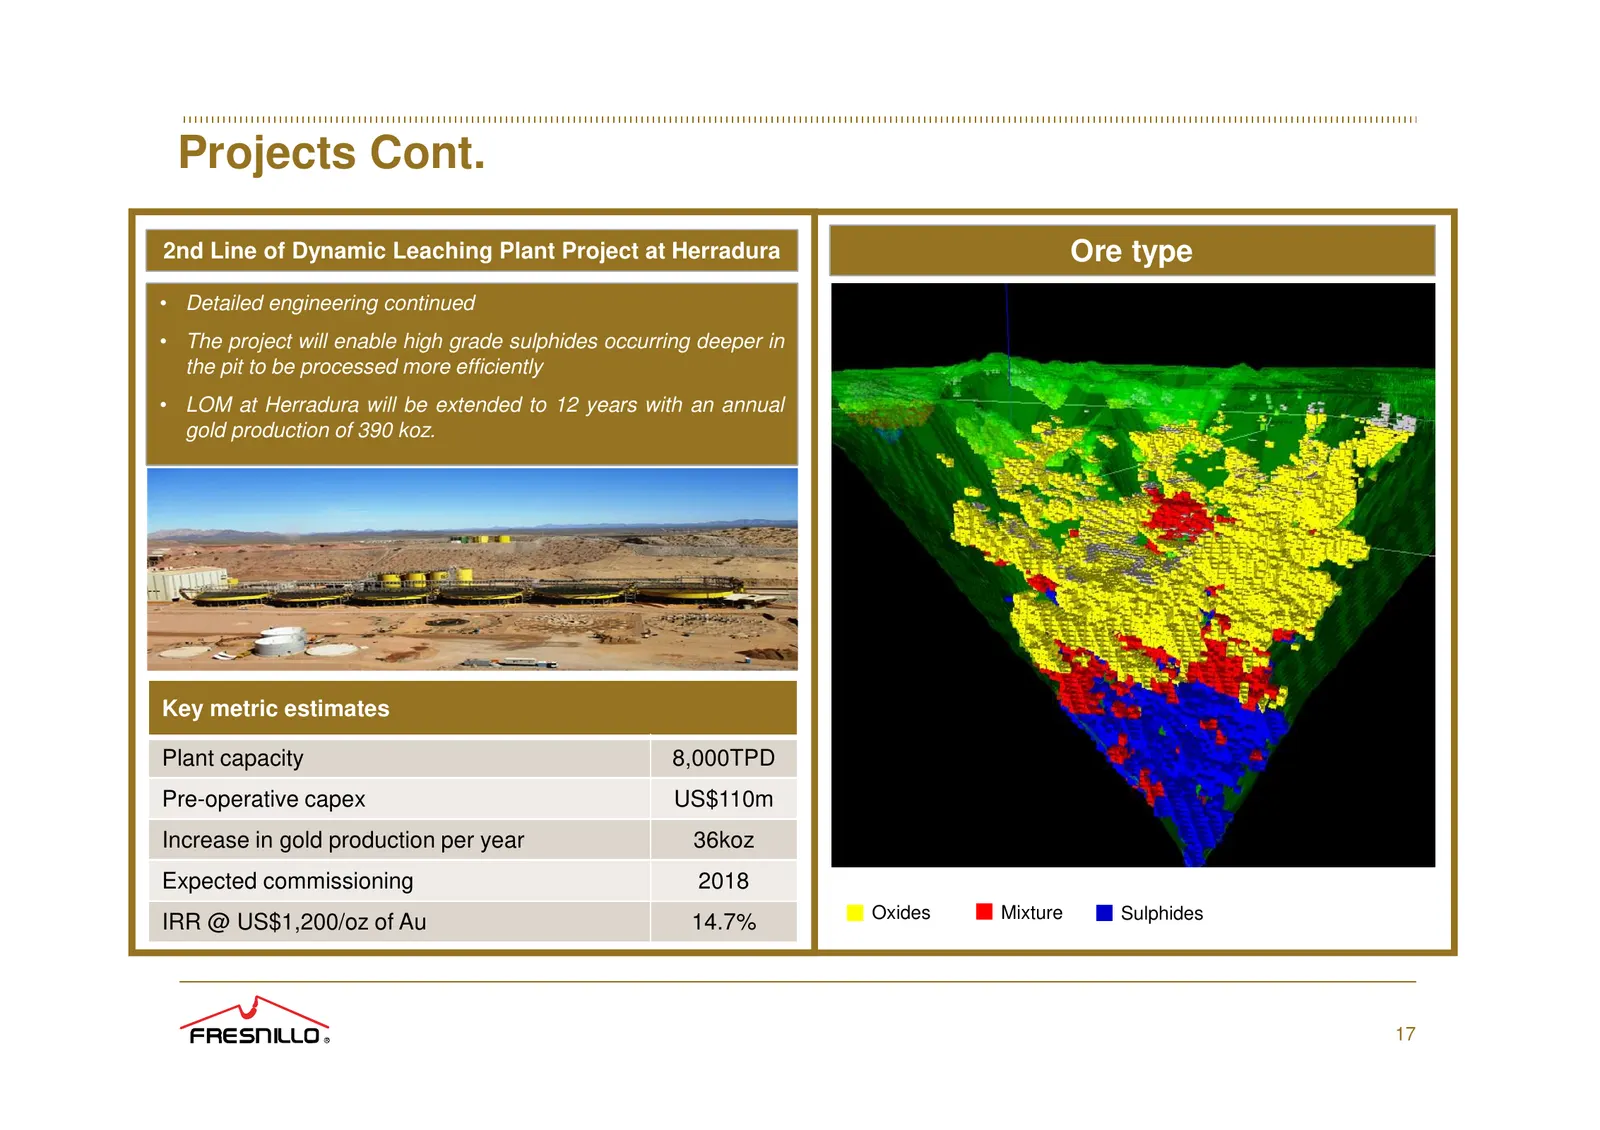
Projects Cont. 2nd Line of Dynamic Leaching Plant Project at Herradura Ore type • Detailed engineering continued • The project will enable high grade sulphides occurring deeper in the pit to be processed more efficiently • LOM at Herradura will be extended to 12 years with an annual gold production
Slide 18: Projects Cont.: Juanicipio
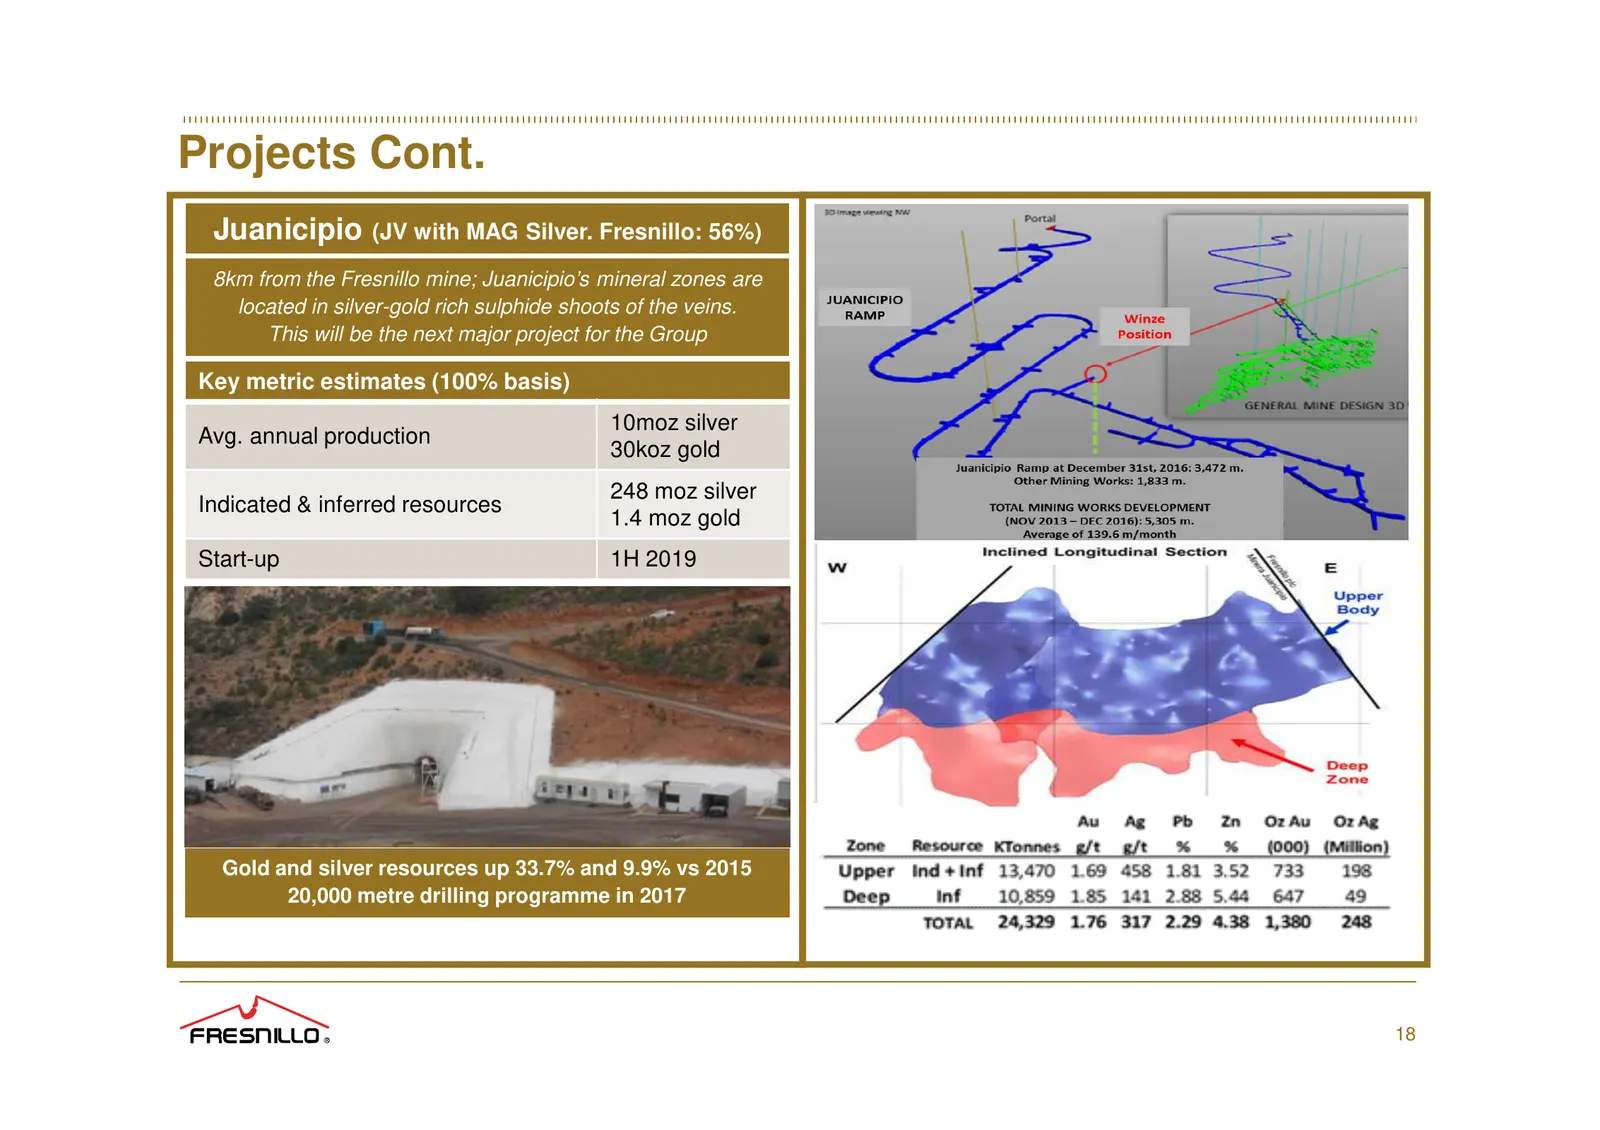
Projects Cont. Juanicipio (JV with MAG Silver. Fresnillo: 56%) 8km from the Fresnillo mine; Juanicipio’s mineral zones are located in silver-gold rich sulphide shoots of the veins. This will be the next major project for the Group Key metric estimates (100% basis) 10moz silver Avg. annual production
Slide 19: Strong Organic Growth Pipeline
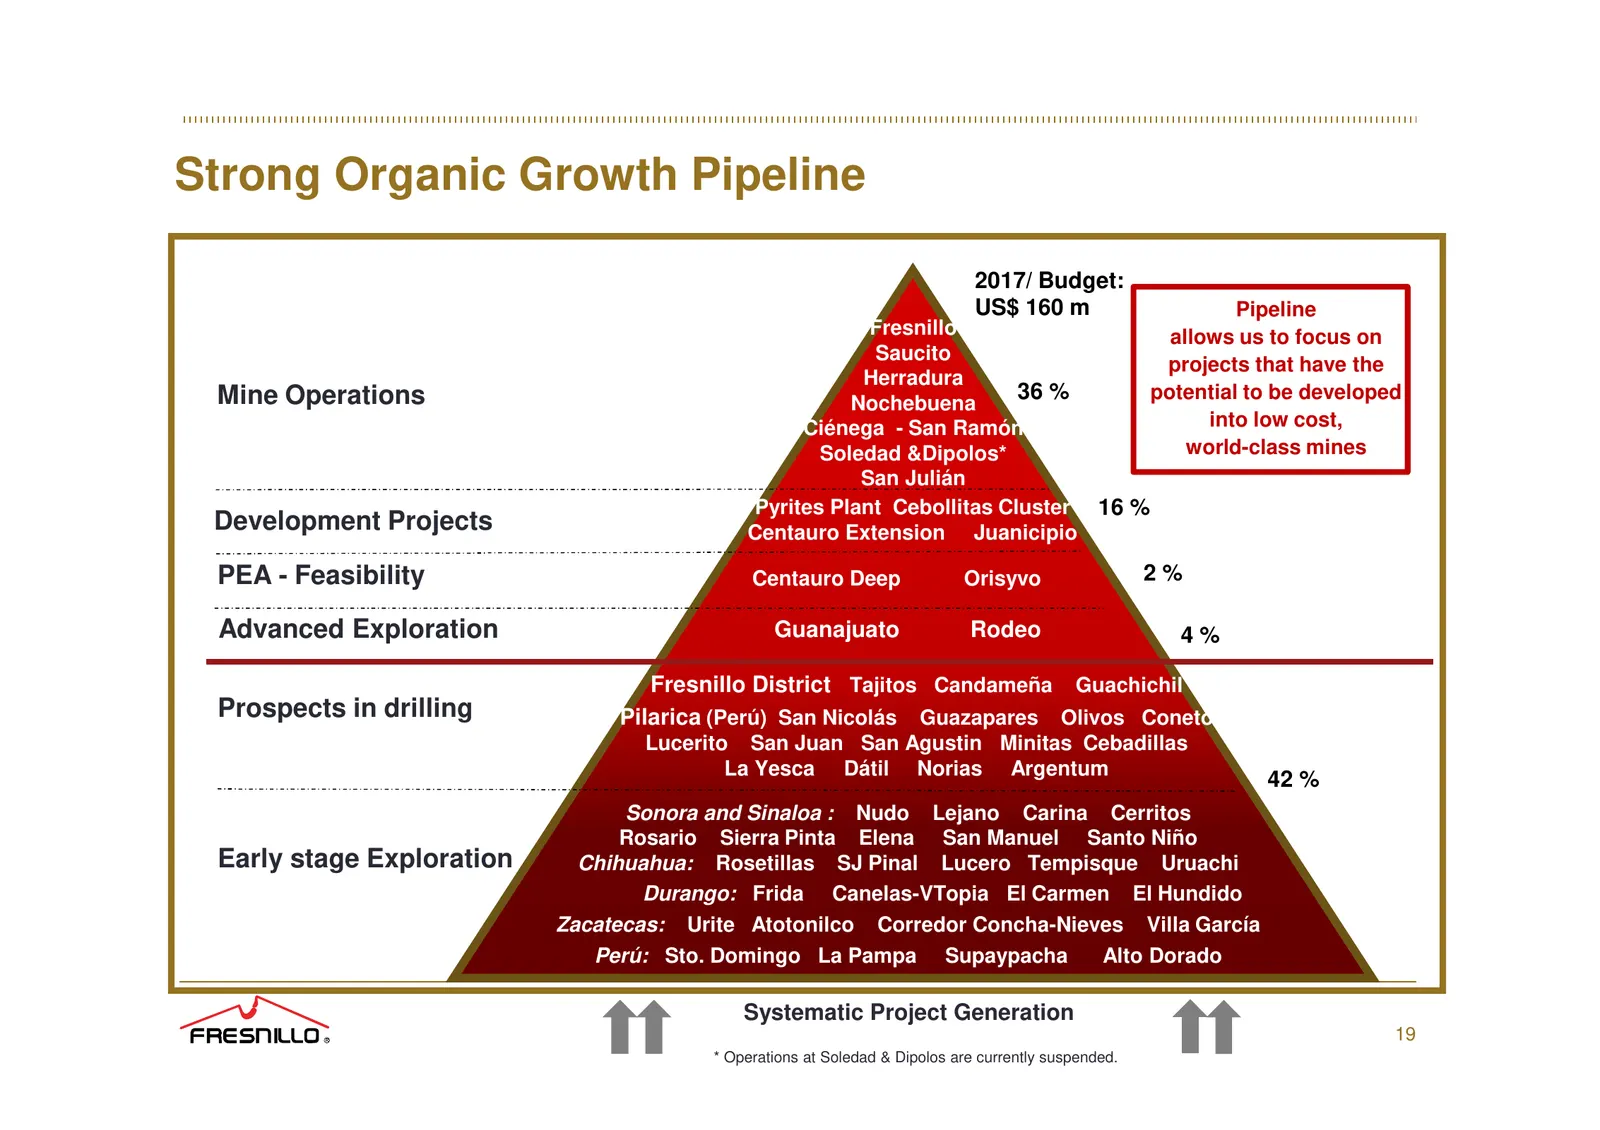
Strong Organic Growth Pipeline 2017/ Budget: US$ 160 m Pipeline Fresnillo allows us to focus on Saucito projects that have the Herradura Mine Operations 36 % potential to be developed Nochebuena Ciénega - San Ramón into low cost, Soledad &Dipolos* world-class mines San Julián Pyrites Plant Cebollita
Slide 20: Growth in Resources
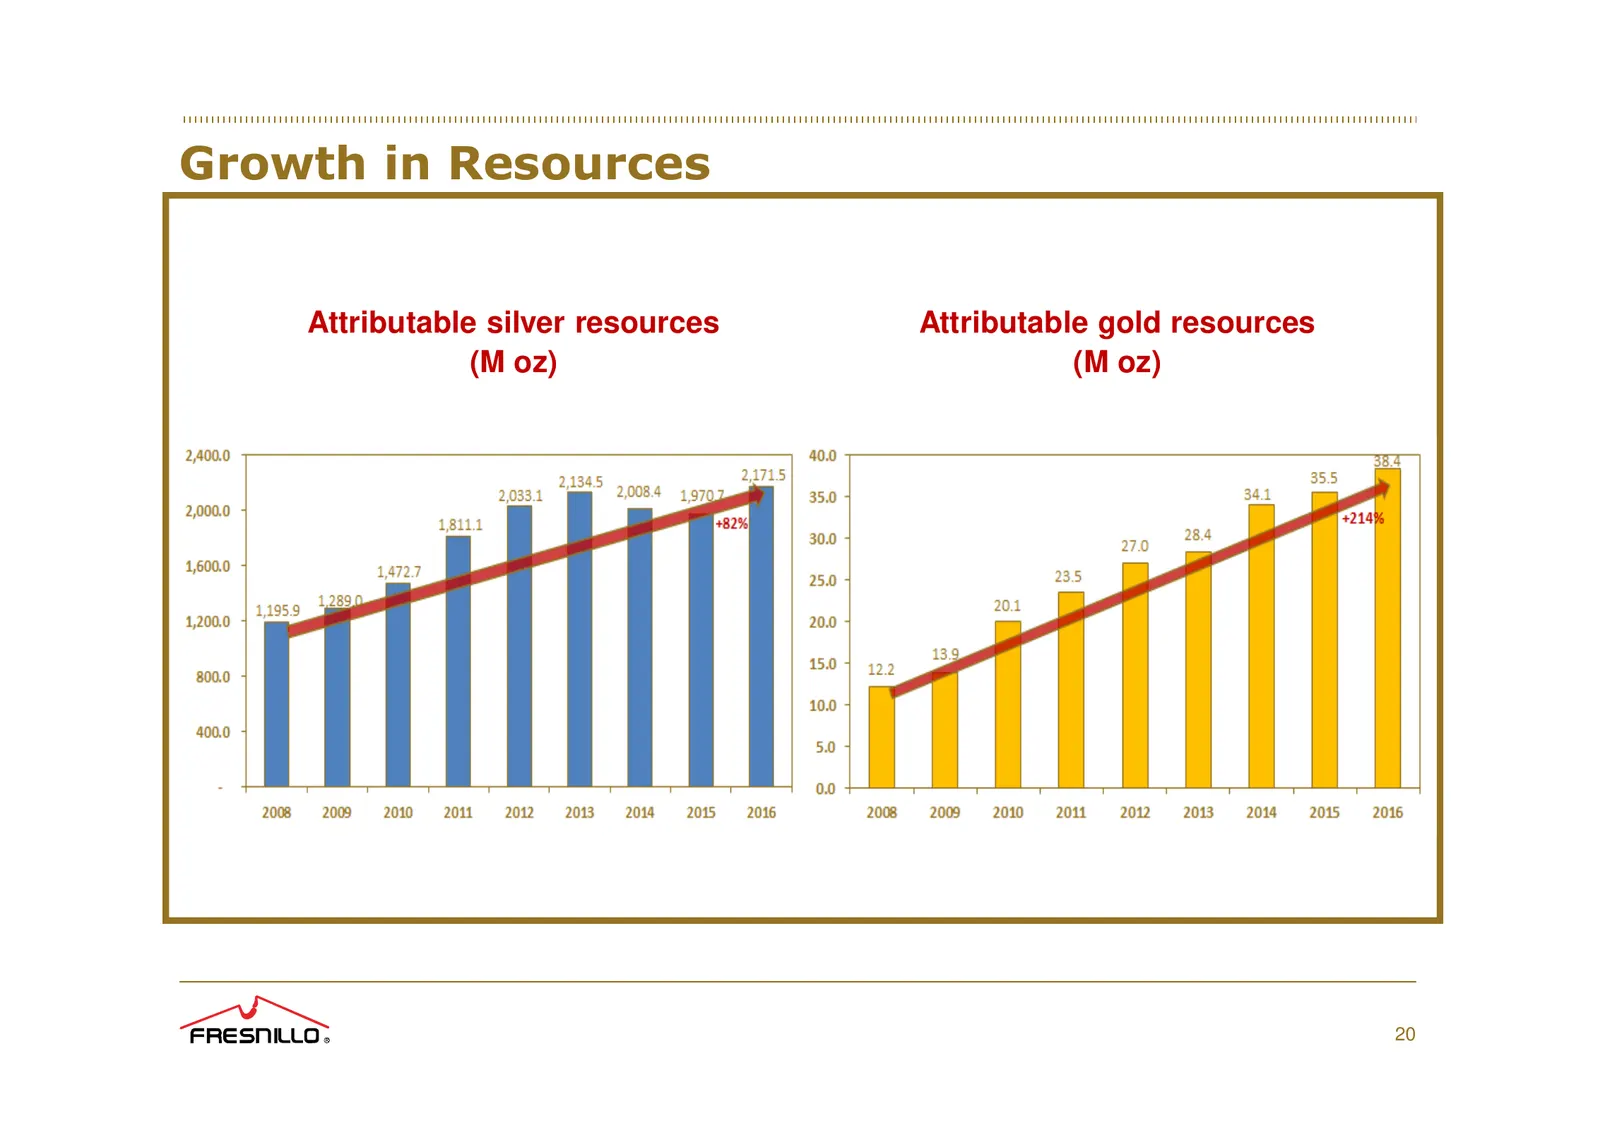
Growth in Resources Attributable silver resources Attributable gold resources (M oz) (M oz) 20
Slide 21: Strategy
° Strateay wee RNC ULL \N ~ \s i RSL THAN LTTTEELTTL INS
Slide 22: Expected Silver Production Profile
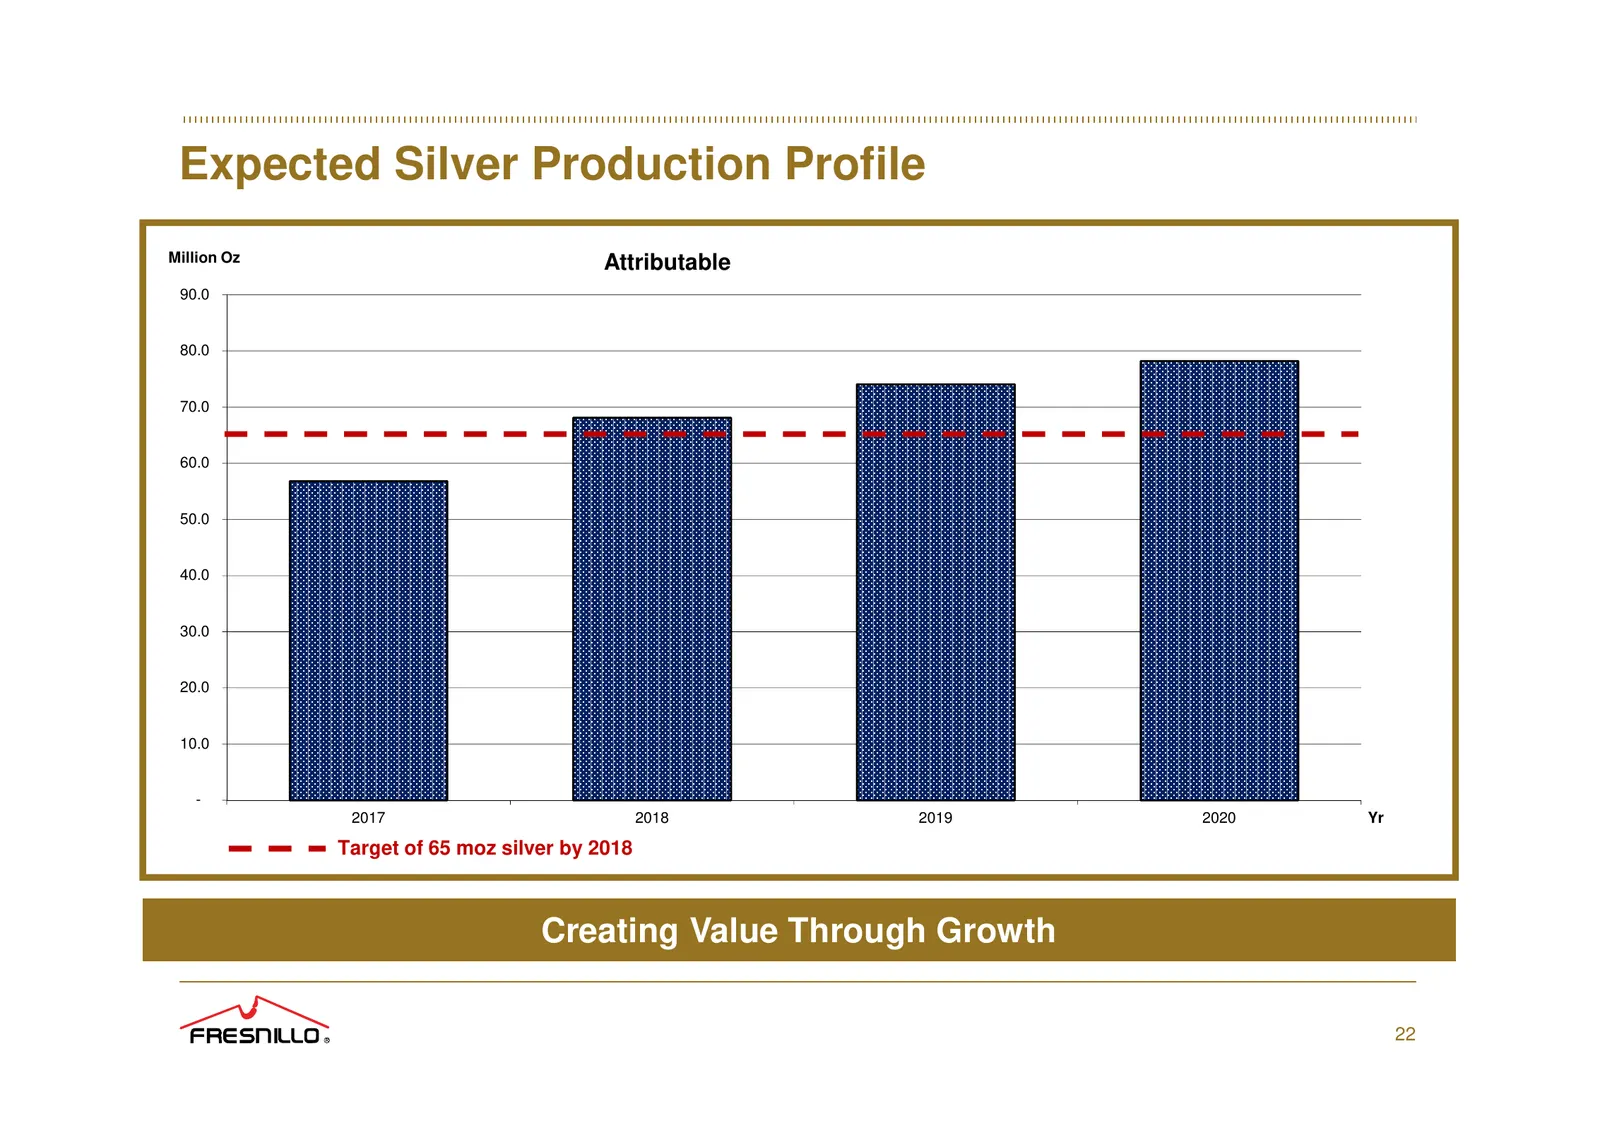
Expected Silver Production Profile Million Oz Attributable 90.0 80.0 70.0 60.0 50.0 40.0 30.0 20.0 10.0 - 2017 2018 2019 2020 Yr Target of 65 moz silver by 2018 Creating Value Through Growth 22
Slide 23: Expected Gold Production Profile
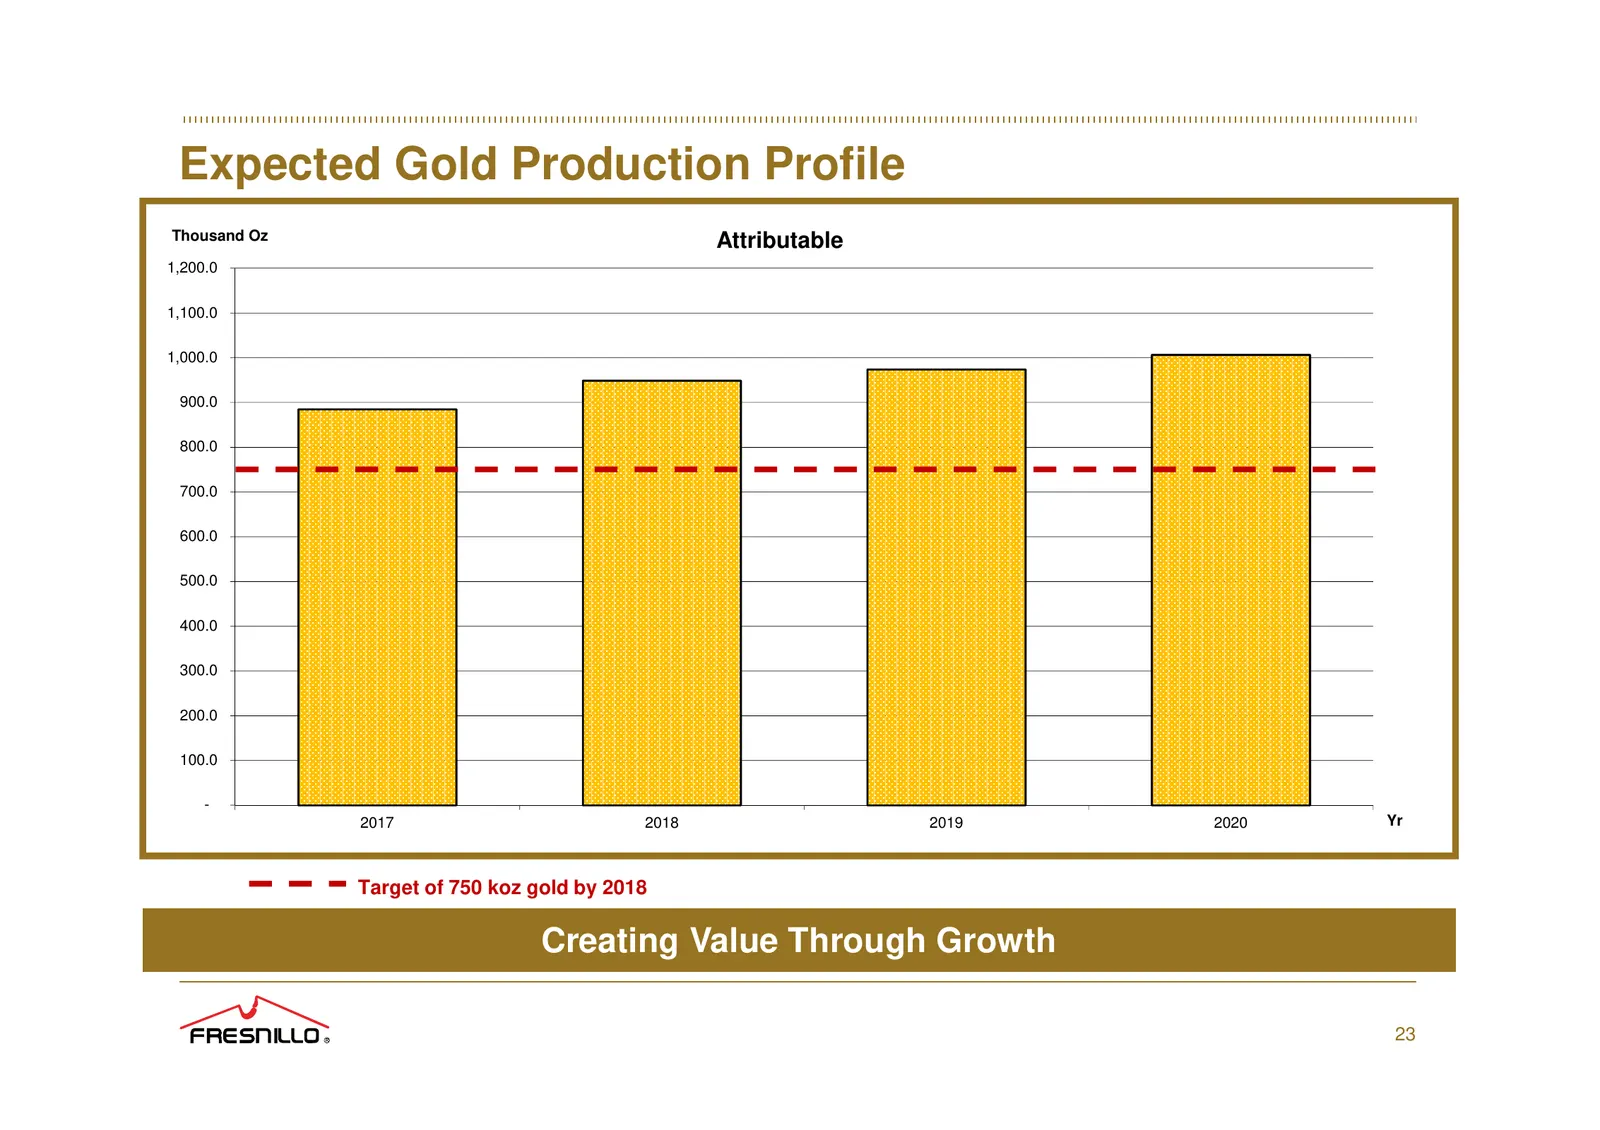
Expected Gold Production Profile Thousand Oz Attributable 1,200.0 1,100.0 1,000.0 900.0 800.0 700.0 600.0 500.0 400.0 300.0 200.0 100.0 - 2017 2018 2019 2020 Yr Target of 750 koz gold by 2018 Creating Value Through Growth 23
Slide 24: CAPEX Spend Expectations
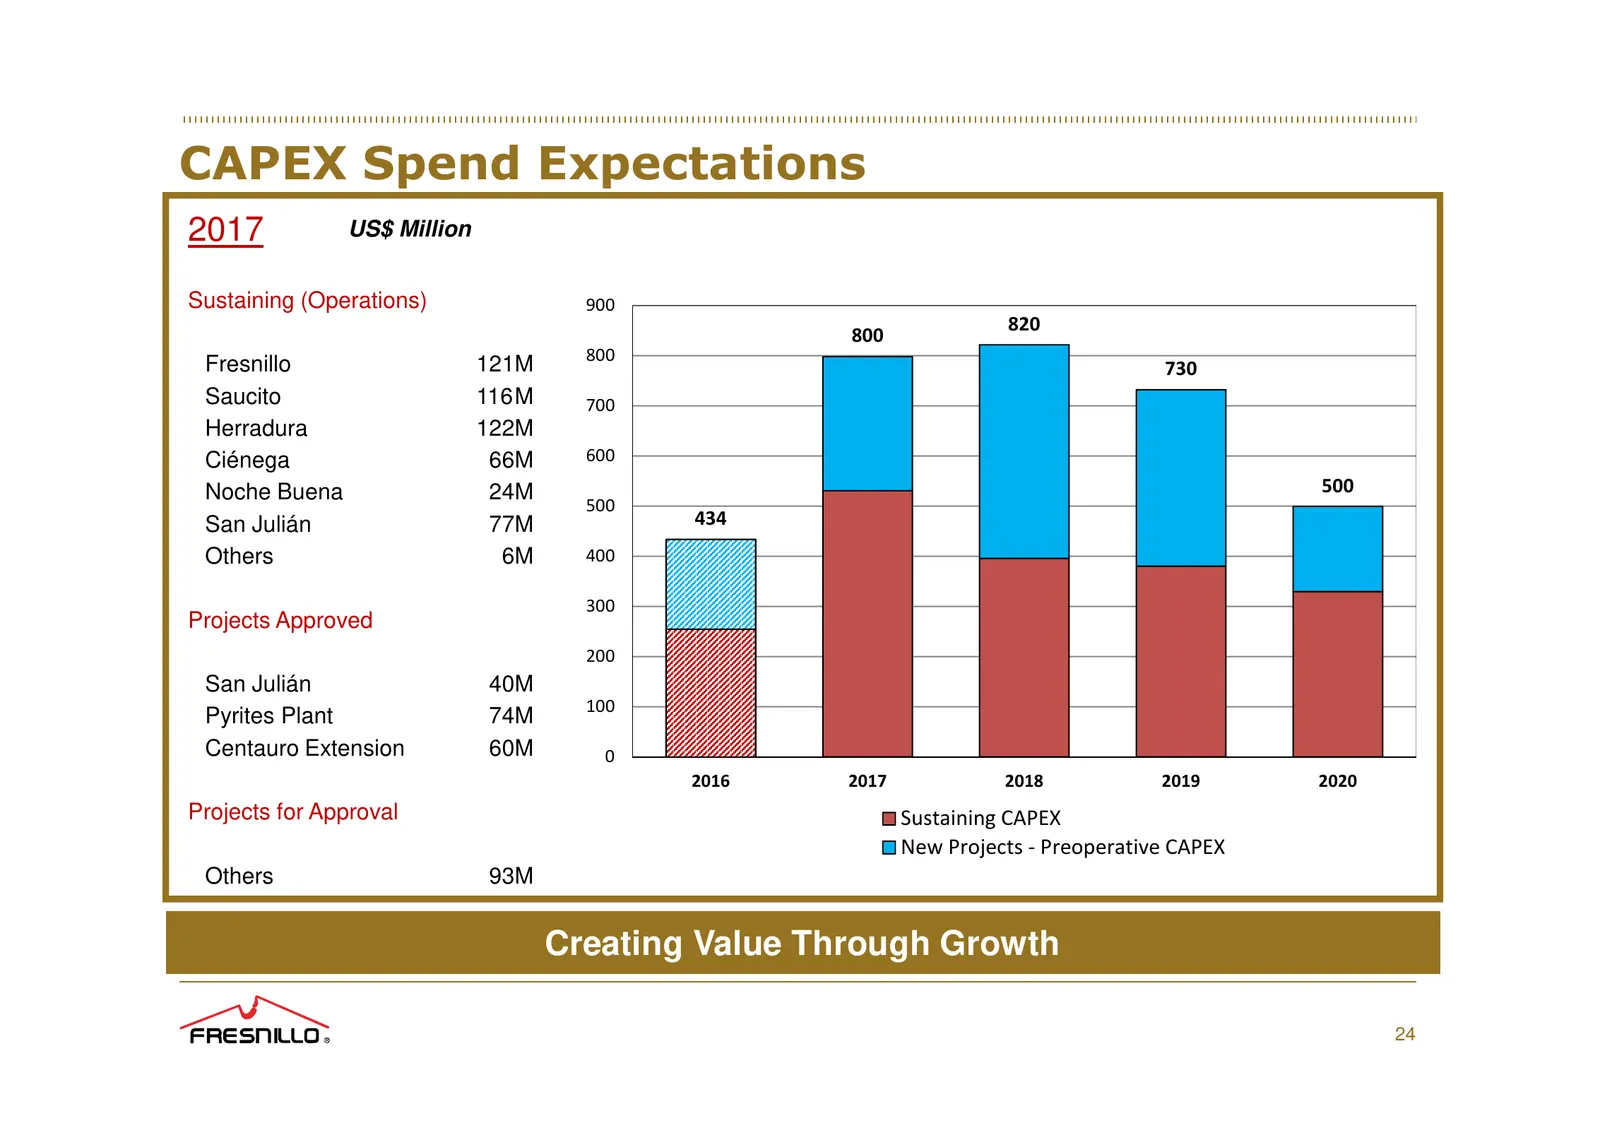
CAPEX Spend Expectations 2017 US$ Million Sustaining (Operations) 900 820 800 800 Fresnillo 121M 730 Saucito 116 M 700 Herradura 122M Ciénega 66M 600 Noche Buena 24M 500 500 San Julián 77M 434 Others 6M 400 300 Projects Approved 200 San Julián 40M 100 Pyrites Plant 74M Centauro Extension 60M 0 2016
Slide 25: Outlook
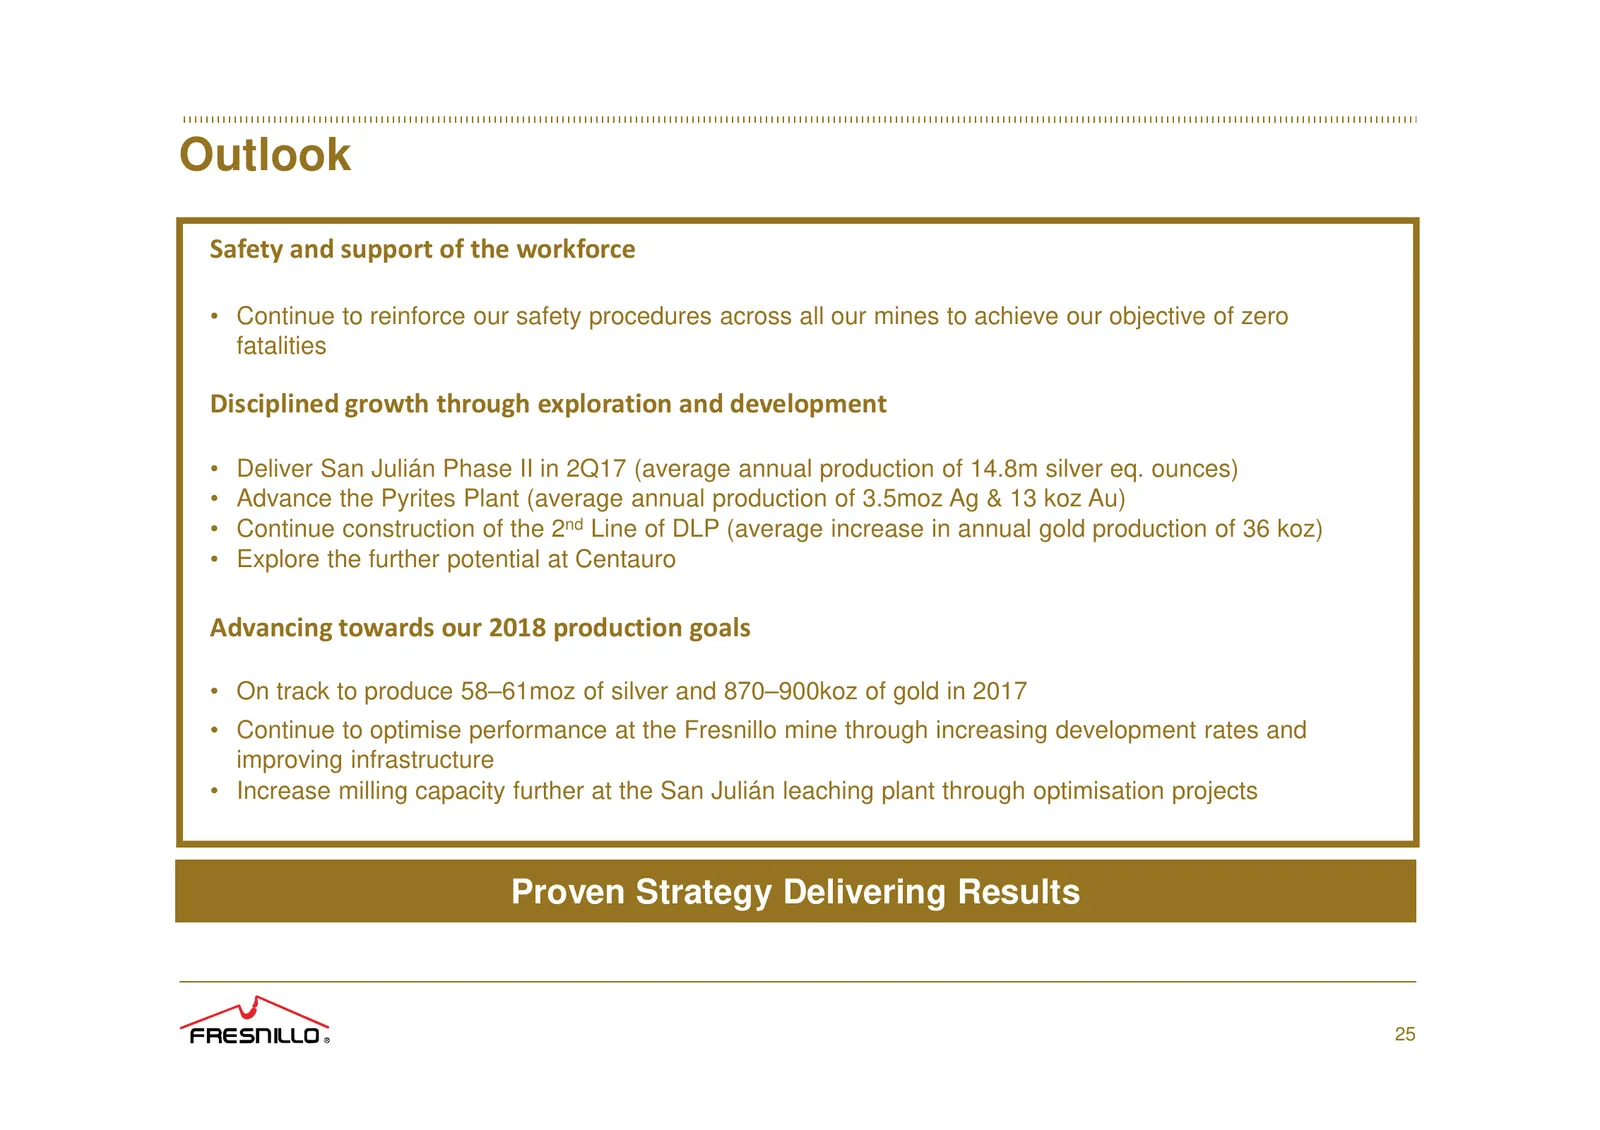
Outlook Safety and support of the workforce • Continue to reinforce our safety procedures across all our mines to achieve our objective of zero fatalities Disciplined growth through exploration and development • Deliver San Julián Phase II in 2Q17 (average annual production of 14.8m silver eq. ounce
Slide 26: Why you should buy Fresnillo
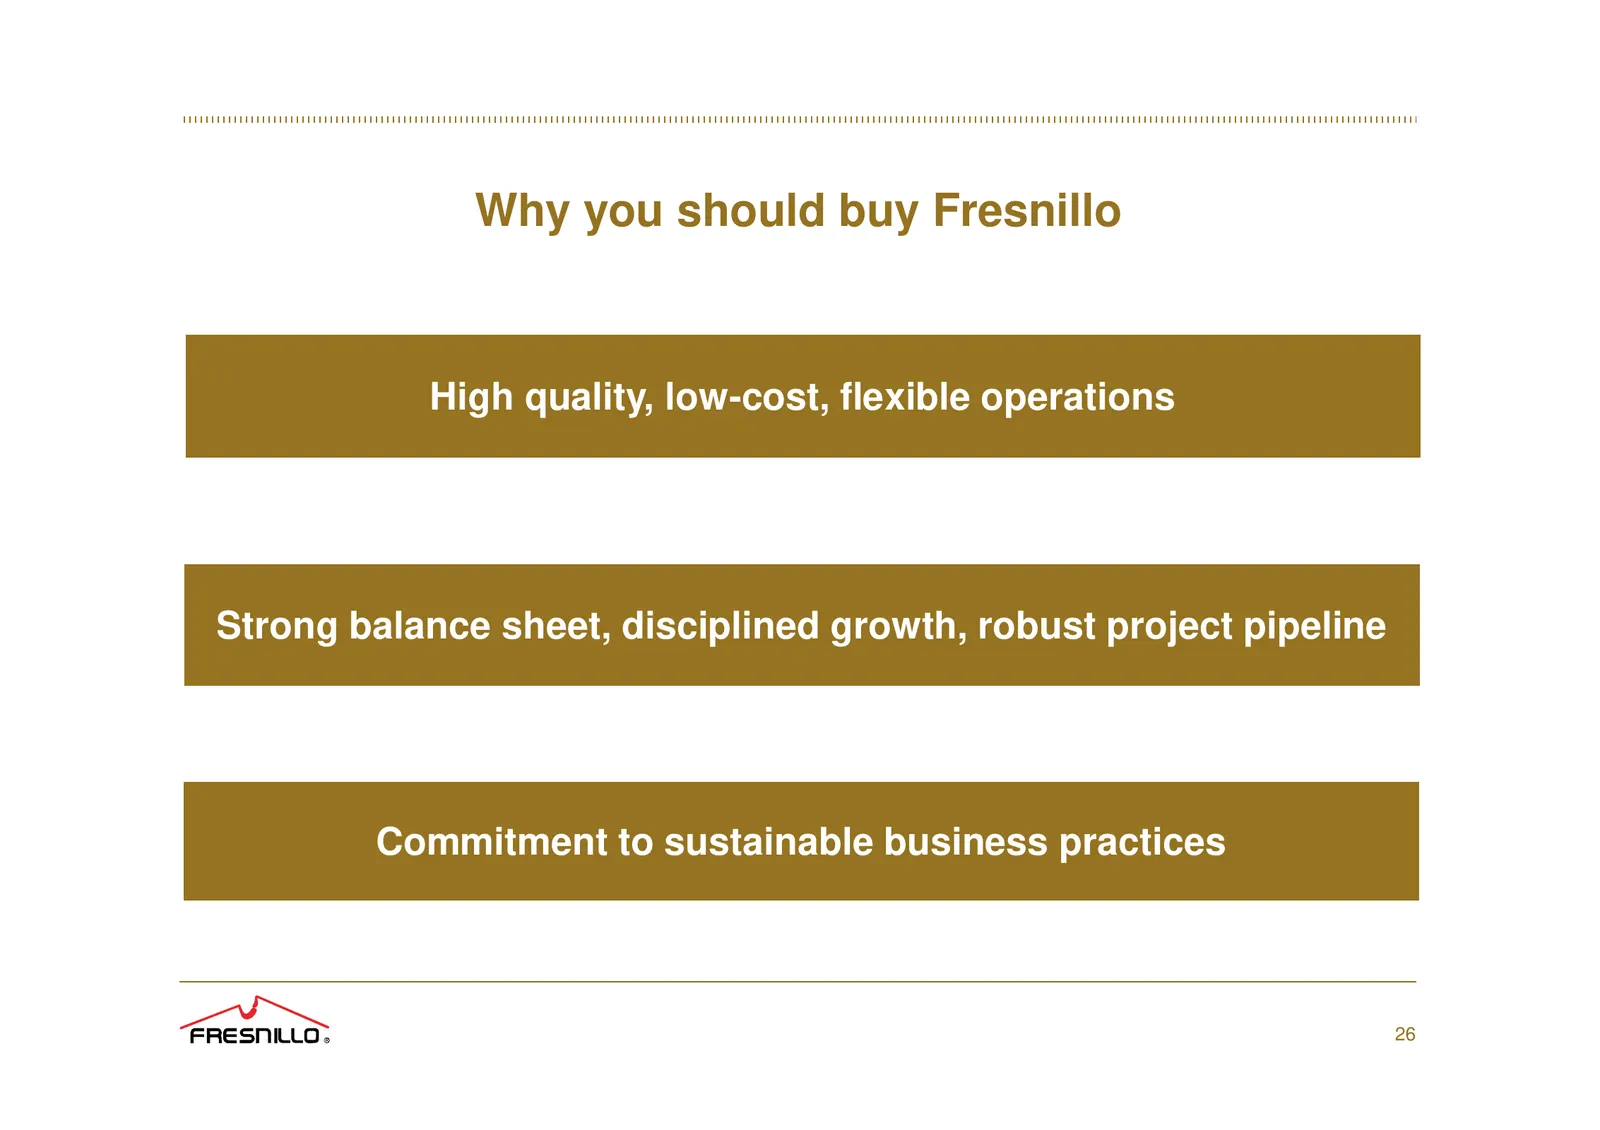
Why you should buy Fresnillo High quality, low-cost, flexible operations Strong balance sheet, disciplined growth, robust project pipeline Commitment to sustainable business practices 26
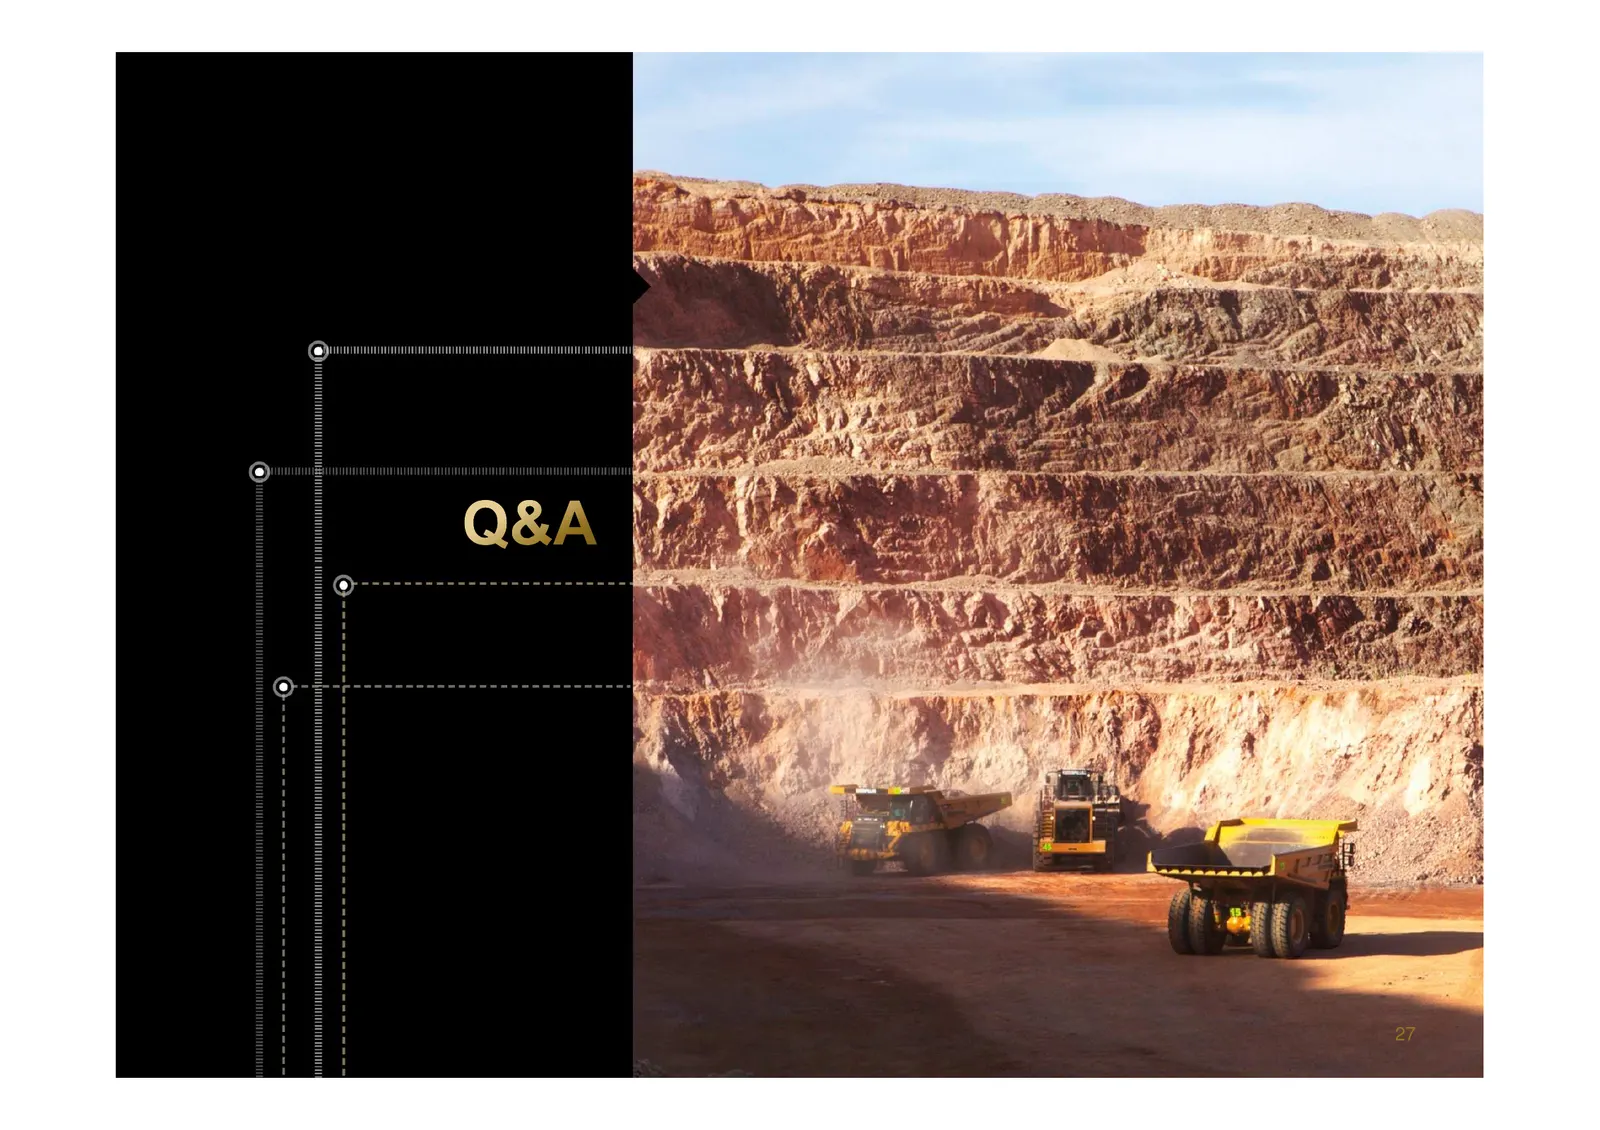
Slide 27: Y COO
Y COO TE
Source: company website
More decks from Fresnillo PLC
 Q2 2026 Earnings Presentation40 slides · Aug 4, 2026
 FY2025 Earnings Presentation51 slides · Mar 3, 2026
 Mining Forum Americas 202616 slides · 2026
 Merger or Acquisition (October 2025)15 slides · Oct 31, 2025
 Mining Forum Americas 202518 slides · Sep 15, 2025
 H1 2025 Earnings Presentation46 slides · Aug 5, 2025