SRV Yhtiot Oyj · OMXHEX:SRV1V
SRV Yhtiot Oyj — SRV Group — Investor Day (June 2016)
20 slides from SRV Yhtiot Oyj's investor day presentation, Jun 1, 2016

Slide 1: Capital Markets Day 1st June 2016
Capital Markets Day 1st June 2016 1 Ilkka Pitkänen, CFO

Slide 2: Content
Content • SRV Group 1-3/2016 and outlook • Financing • How to reach strategic targets

Slide 3: SRV Group 1-3/2016 and outlook
SRV Group 1-3/2016 and outlook 3
Slide 4: January-March 2016
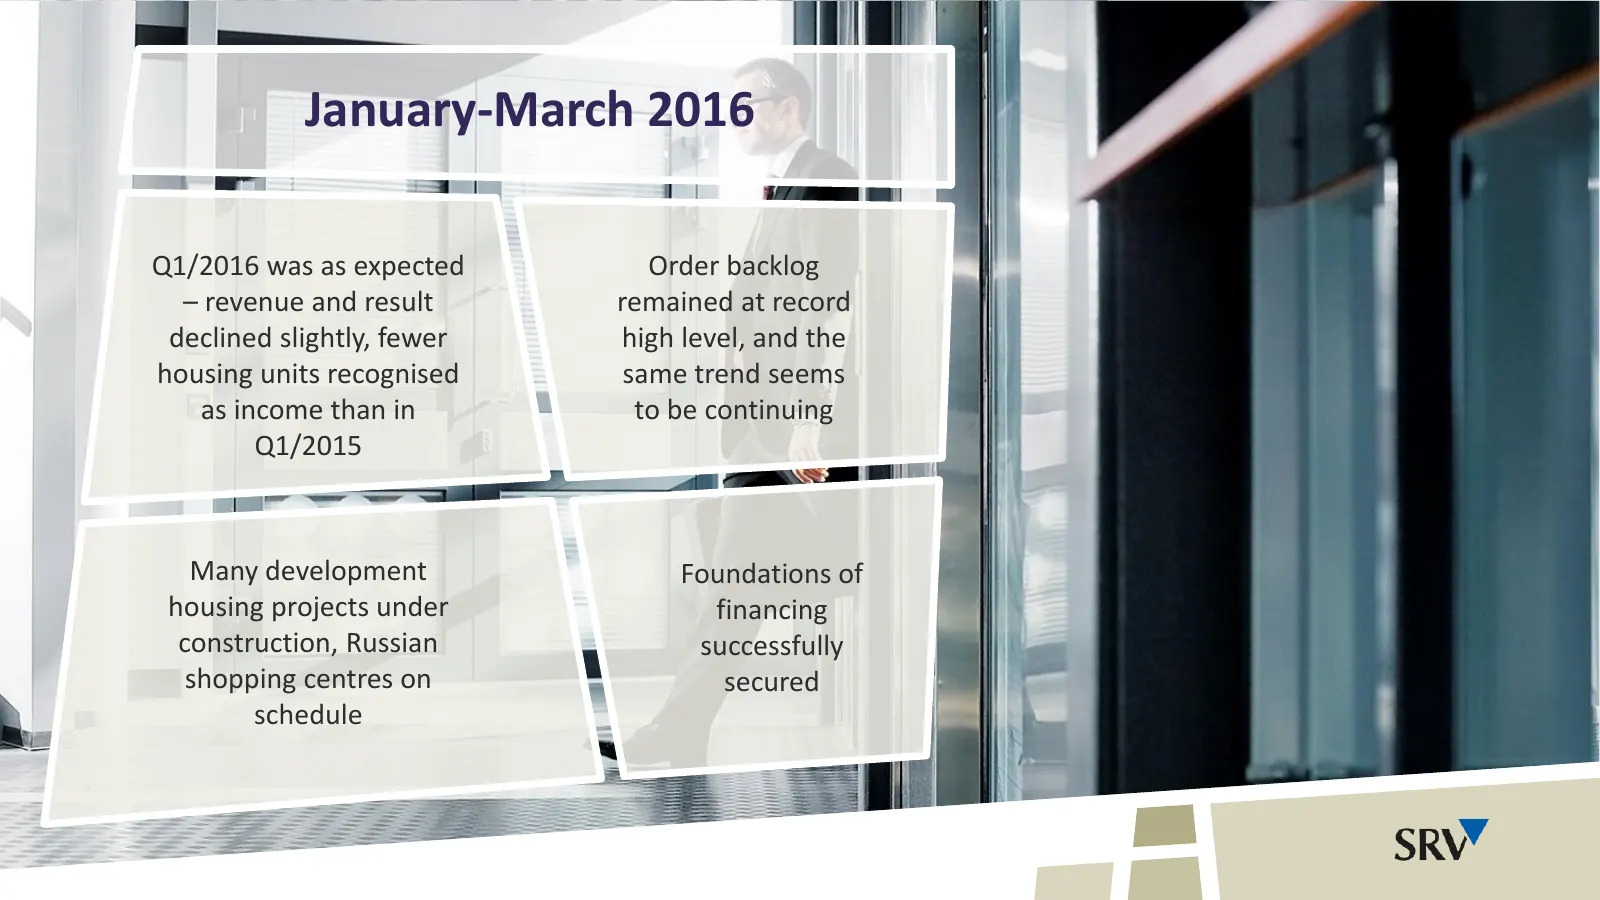
January-March 2016 Q1/2016 was as expected Order backlog – revenue and result remained at record declined slightly, fewer high level, and the housing units recognised same trend seems as income than in to be continuing Q1/2015 Many development Foundations of housing projects under financing construc
Slide 5: Outlook remains unchanged
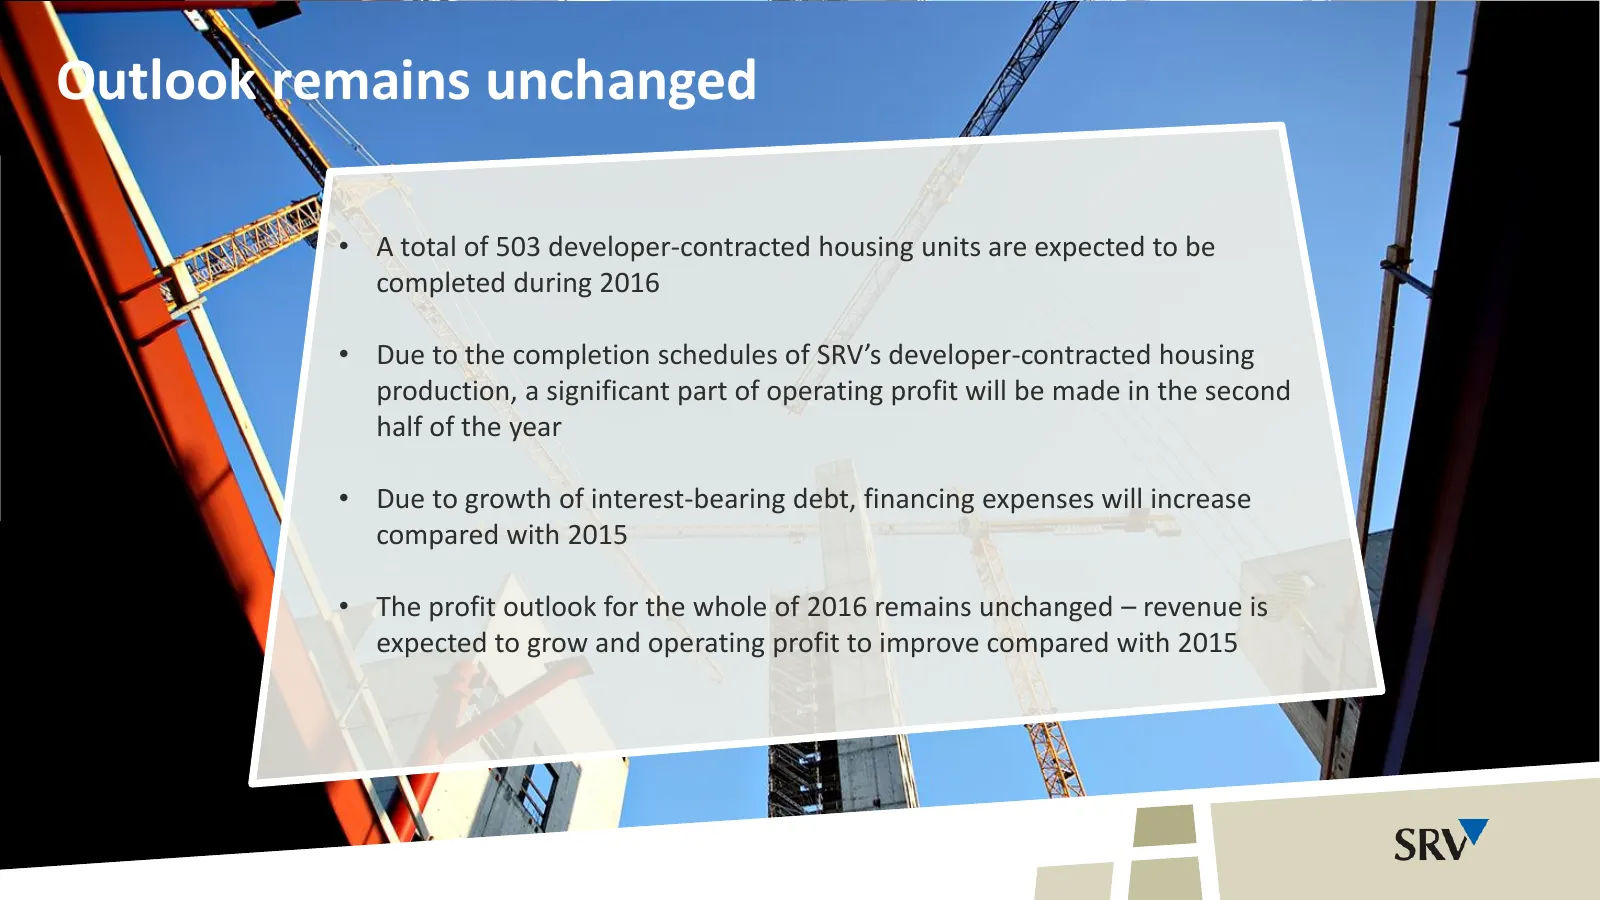
Outlook remains unchanged • A total of 503 developer-contracted housing units are expected to be completed during 2016 • Due to the completion schedules of SRV’s developer-contracted housing production, a significant part of operating profit will be made in the second half of the year • Due to growt

Slide 6: Financing
a Financing | | SRW
Slide 7: Debt portfolio is based mostly on bonds
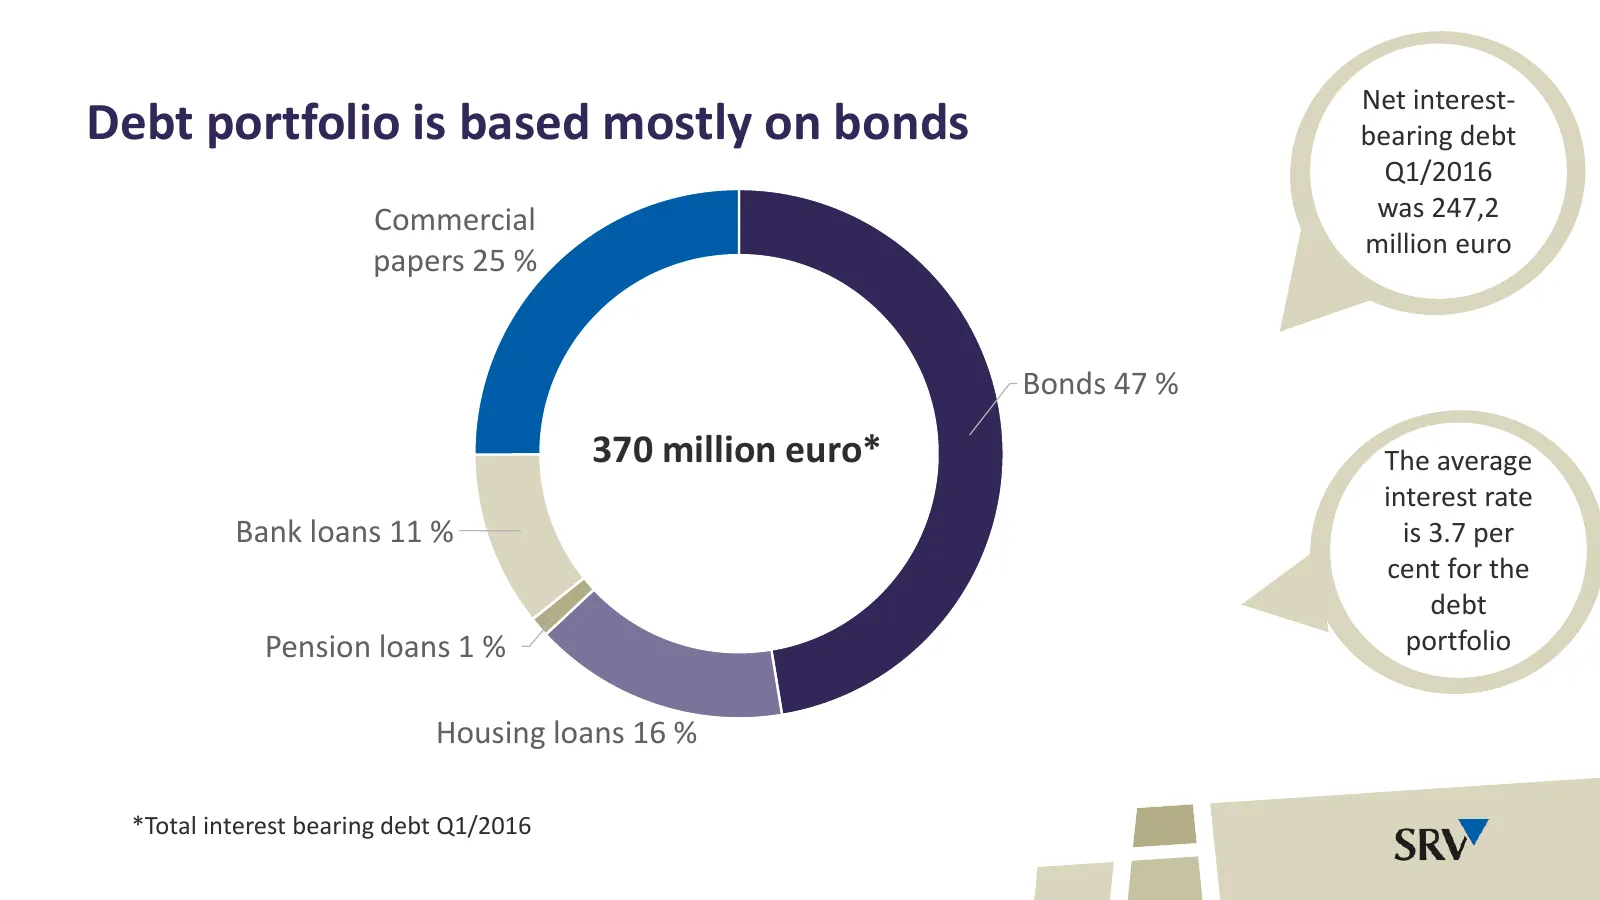
Net interest- Debt portfolio is based mostly on bonds bearing debt Q1/2016 Commercial was 247,2 million euro papers 25 % Bonds 47 % 370 million euro* The average interest rate Bank loans 11 % is 3.7 per cent for the debt Pension loans 1 % portfolio Housing loans 16 % *Total interest bearing debt Q1/
Slide 8: Cash and Undrawn credit lines
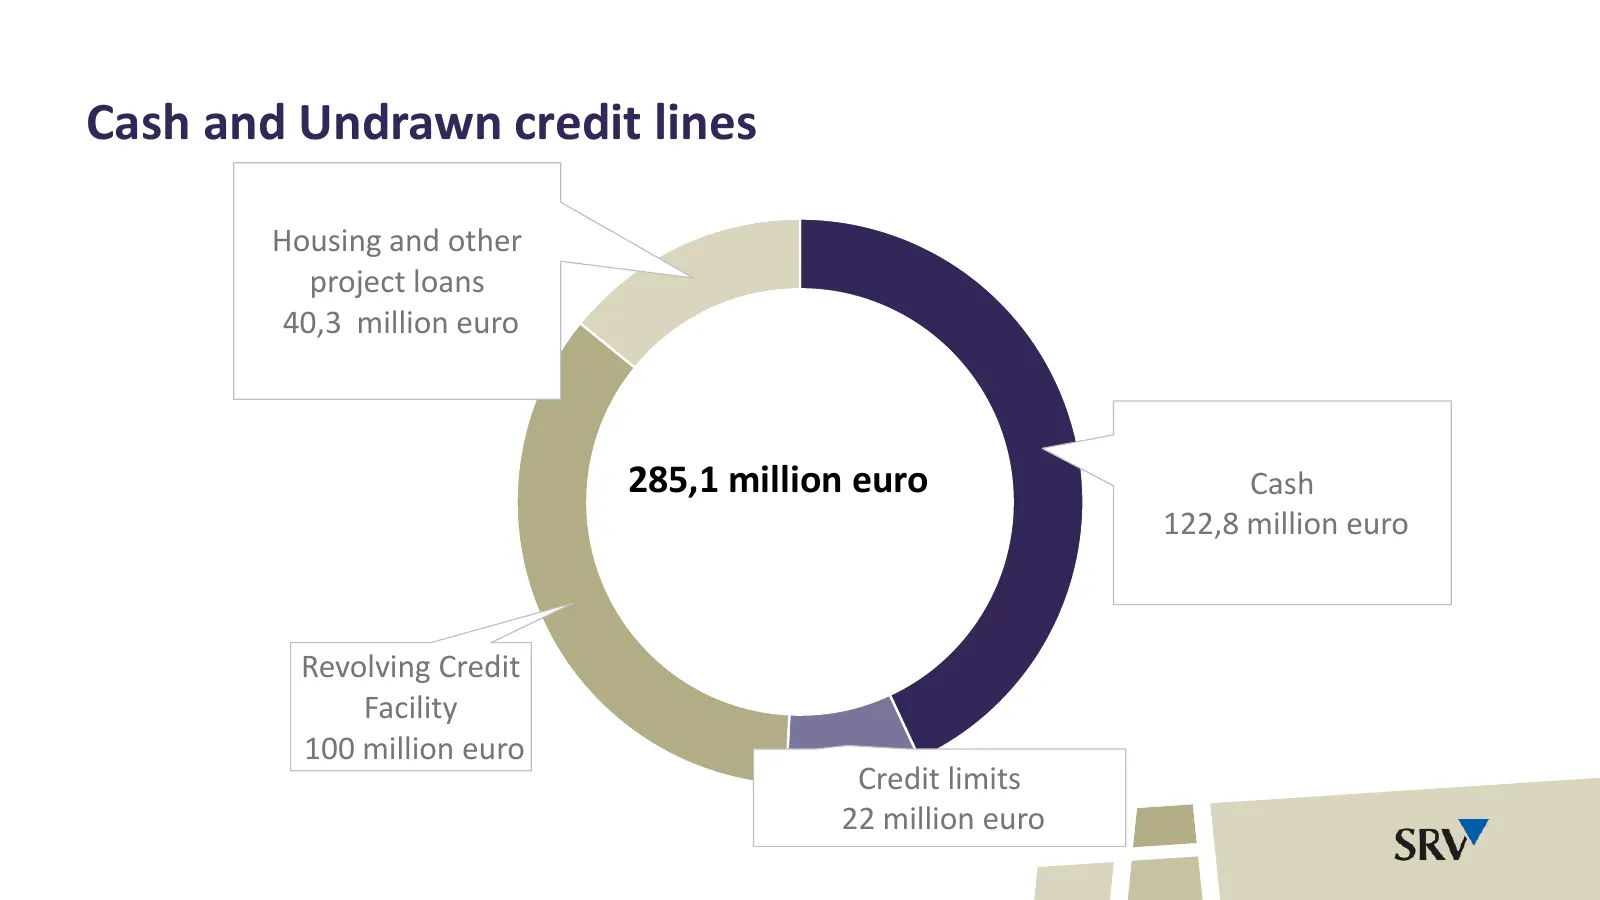
Cash and Undrawn credit lines Housing and other project loans 40,3 million euro 285,1 million euro Cash 122,8 million euro Revolving Credit Facility 100 million euro Credit limits 22 million euro
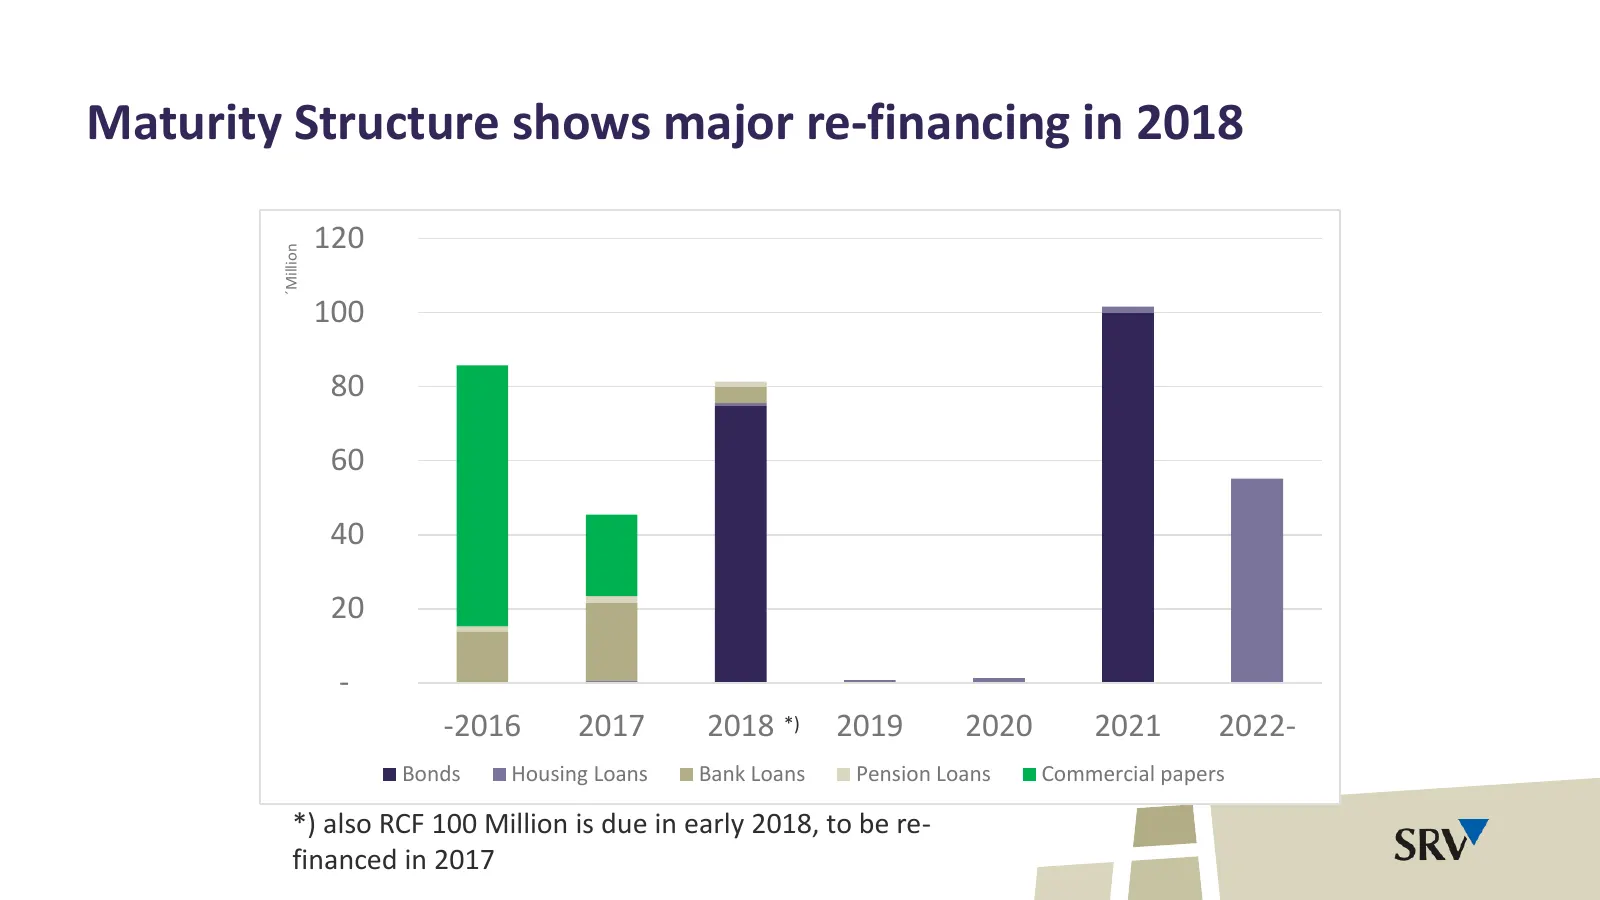
Slide 9: Maturity Structure shows major re-financing in 2018
Maturity Structure shows major re-financing in 2018 120 ´Million 100 80 60 40 20 - -2016 2017 2018 *) 2019 2020 2021 2022- Bonds Housing Loans Bank Loans Pension Loans Commercial papers *) also RCF 100 Million is due in early 2018, to be re- financed in 2017
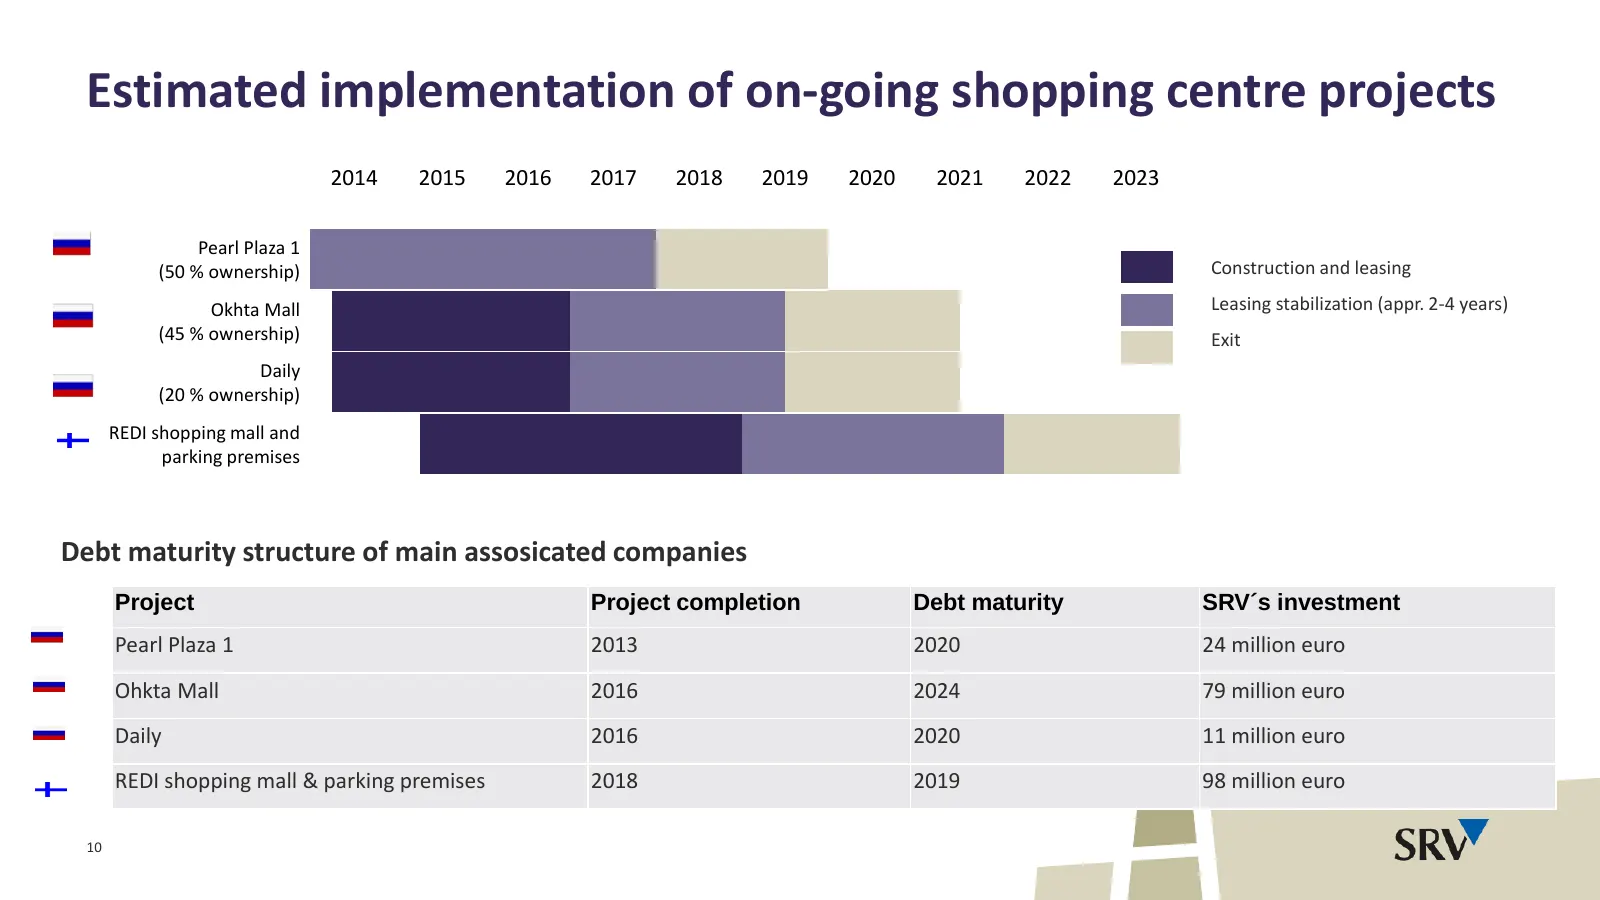
Slide 10: Estimated implementation of on-going shopping centre projects
Estimated implementation of on-going shopping centre projects 2014 2015 2016 2017 2018 2019 2020 2021 2022 2023 Pearl Plaza 1 (50 % ownership) Construction and leasing Okhta Mall Leasing stabilization (appr. 2-4 years) (45 % ownership) Exit Daily (20 % ownership) REDI shopping mall and parking premi
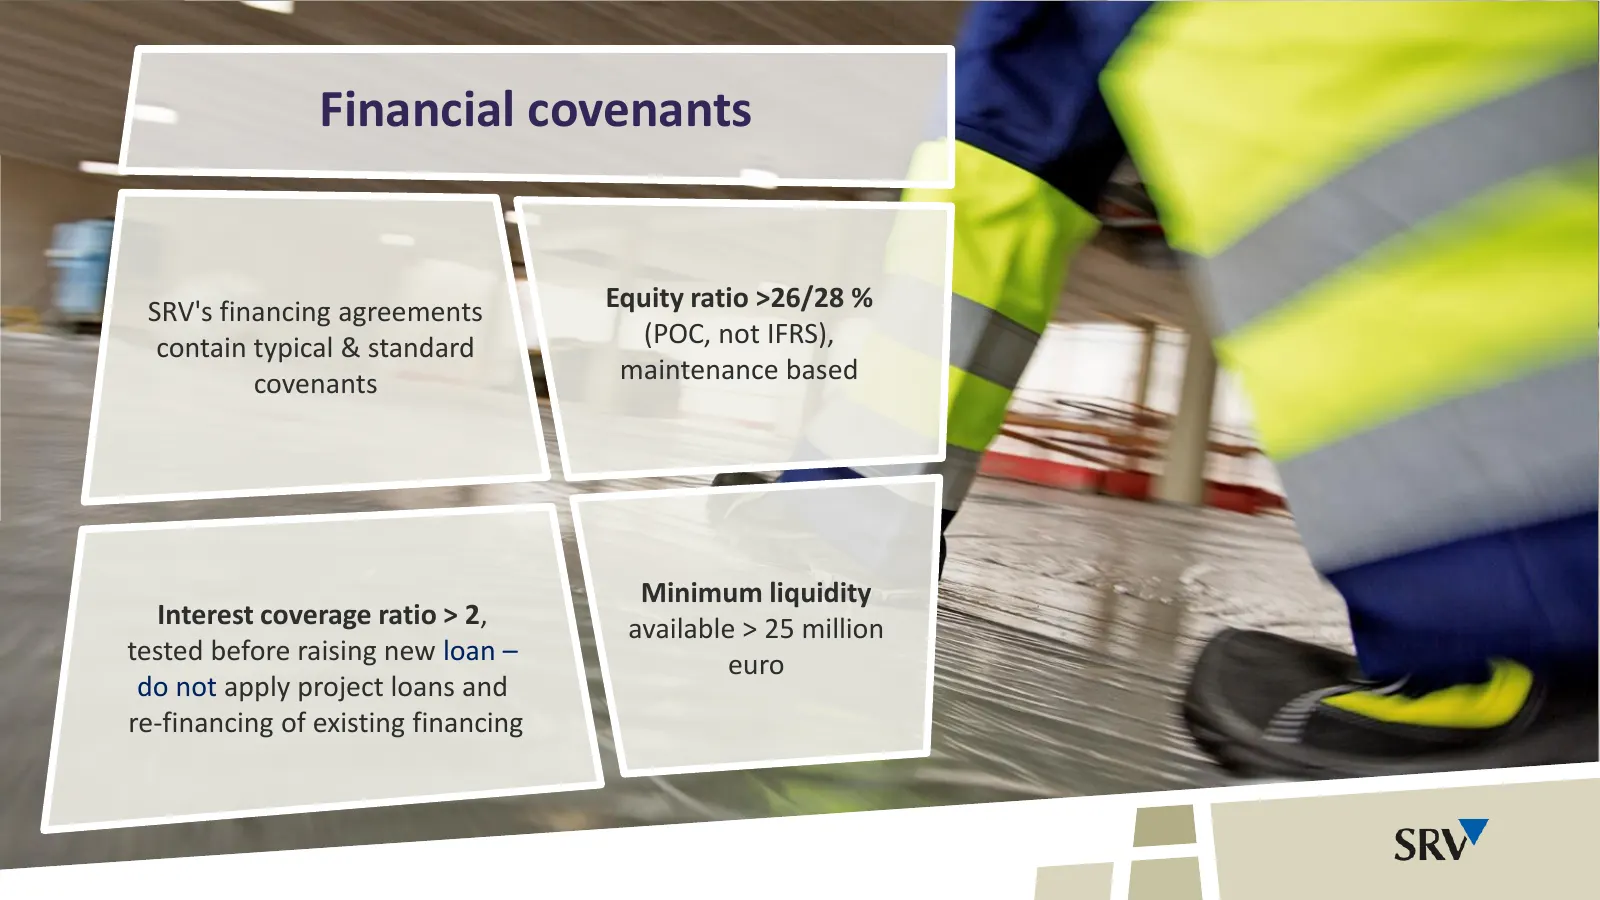
Slide 11: Financial covenants
Financial covenants SRV's financing agreements Equity ratio >26/28 % contain typical & standard (POC, not IFRS), covenants maintenance based Minimum liquidity Interest coverage ratio > 2, available > 25 million tested before raising new loan – euro do not apply project loans and re-financing of exis
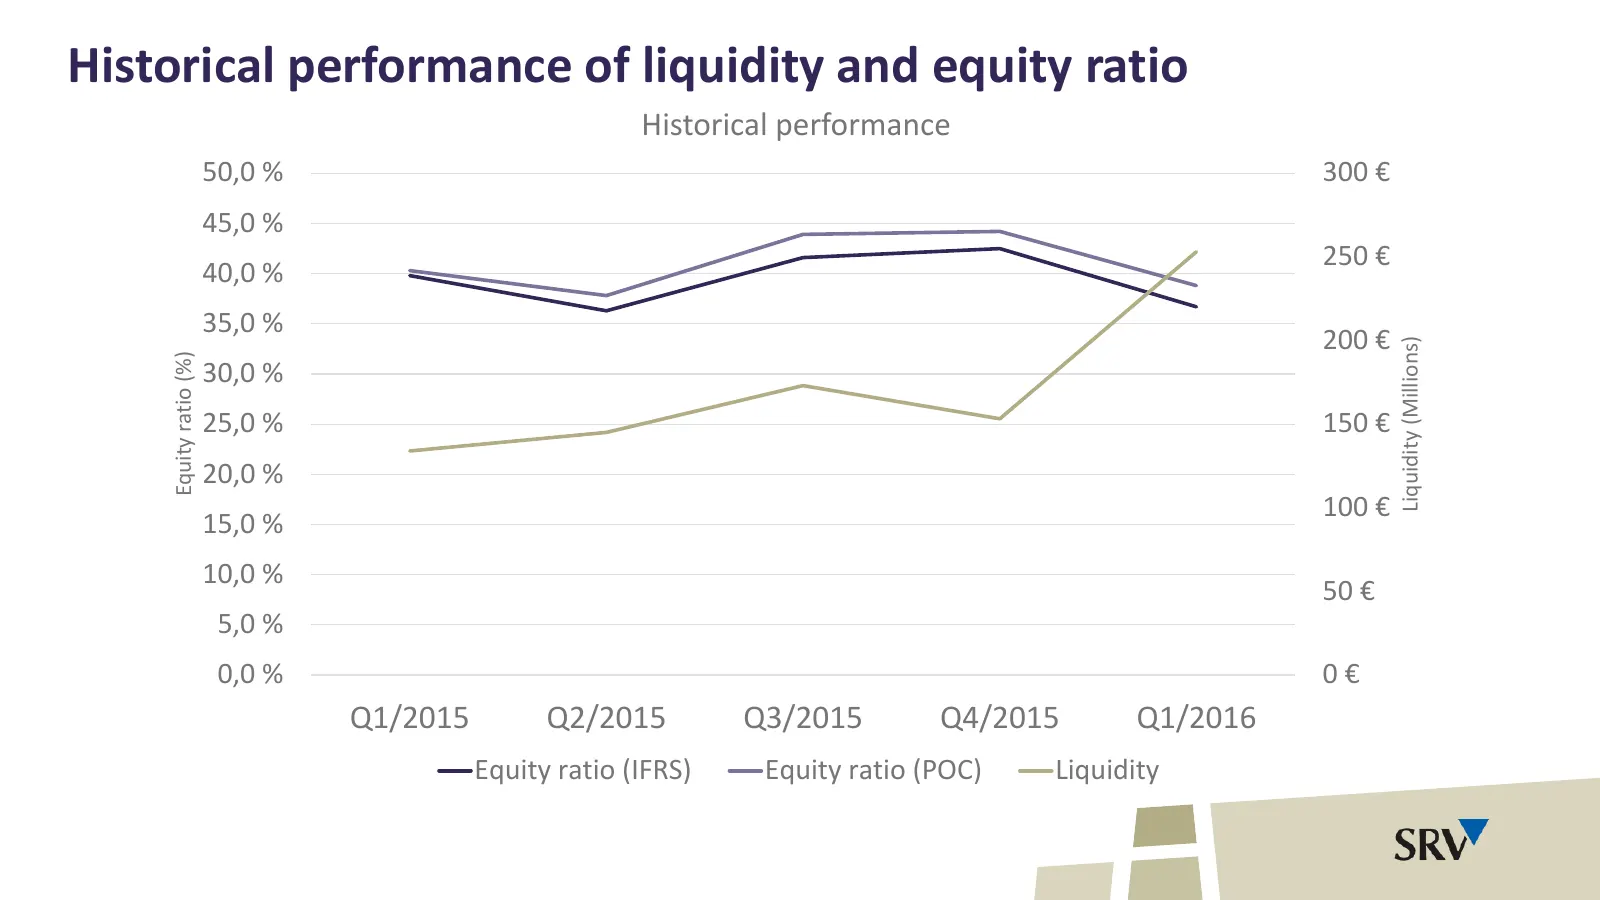
Slide 12: Historical performance of liquidity and equity ratio
Historical performance of liquidity and equity ratio Historical performance 50,0 % 300 € 45,0 % 250 € 40,0 % 35,0 % 200 € Liquidity (Millions) Equity ratio (%) 30,0 % 25,0 % 150 € 20,0 % 100 € 15,0 % 10,0 % 50 € 5,0 % 0,0 % 0€ Q1/2015 Q2/2015 Q3/2015 Q4/2015 Q1/2016 Equity ratio (IFRS) Equity ratio

Slide 13: How to reach strategic targets?
How to reach strategic targets? 13
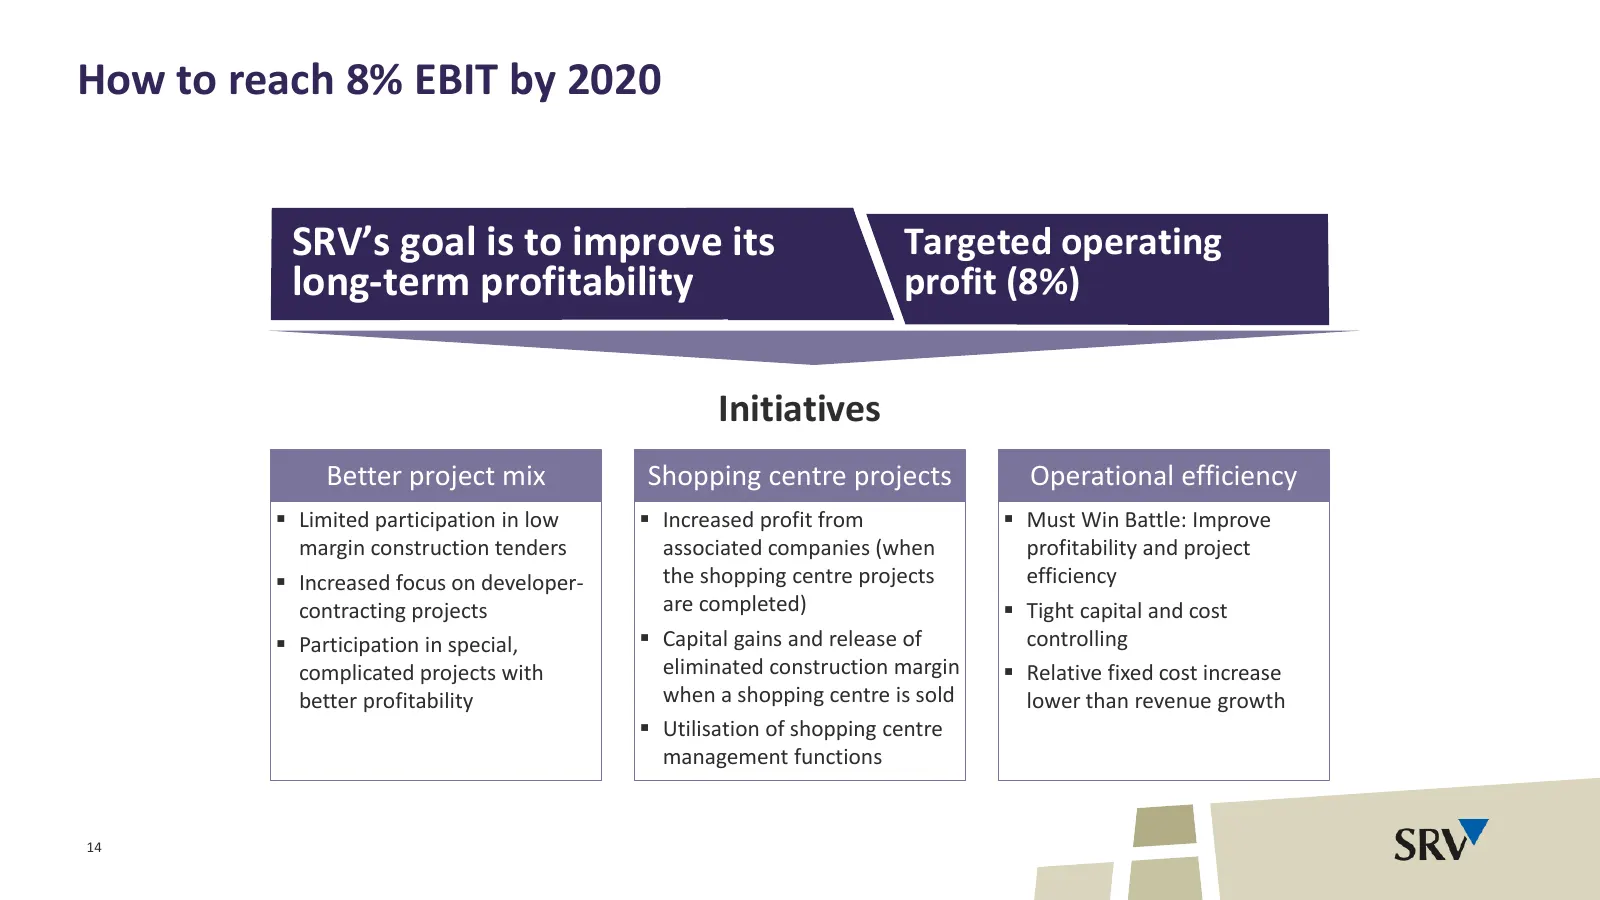
Slide 14: How to reach 8% EBIT by 2020
How to reach 8% EBIT by 2020 SRV’s goal is to improve its Targeted operating long-term profitability profit (8%) Initiatives Better project mix Shopping centre projects Operational efficiency Limited participation in low Increased profit from Must Win Battle: Improve margin construction tender
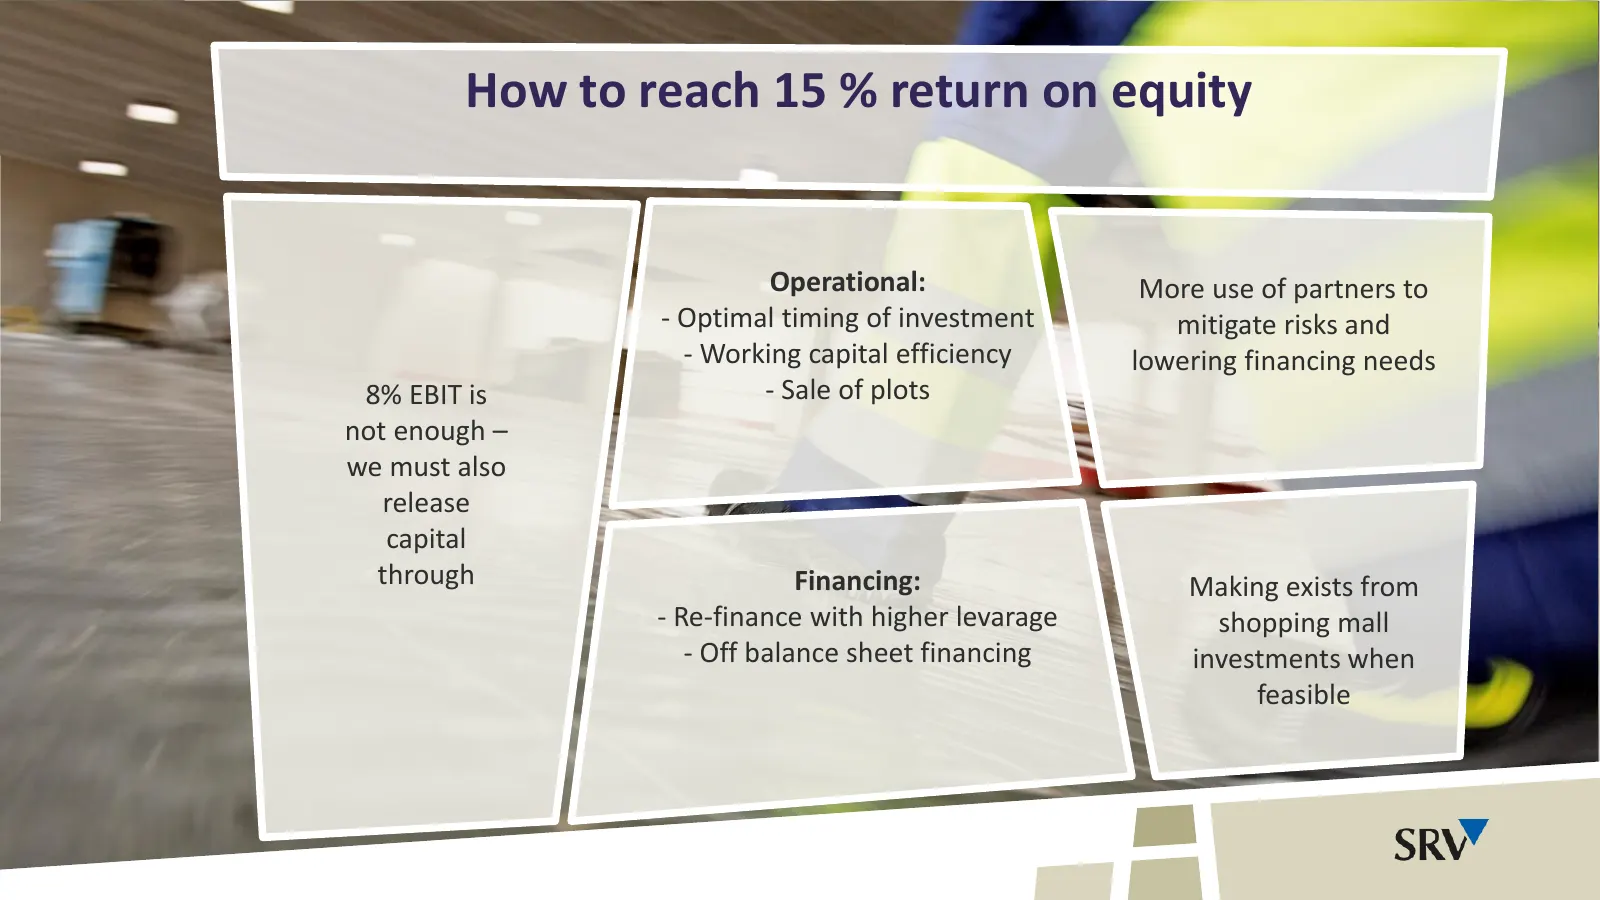
Slide 15: How to reach 15 % return on equity
How to reach 15 % return on equity Operational: More use of partners to - Optimal timing of investment mitigate risks and - Working capital efficiency lowering financing needs 8% EBIT is - Sale of plots not enough – we must also release capital through Financing: Making exists from - Re-finance with
Slide 16: Thank You!
Thank You! Next: Summary 16 Juha Pekka Ojala
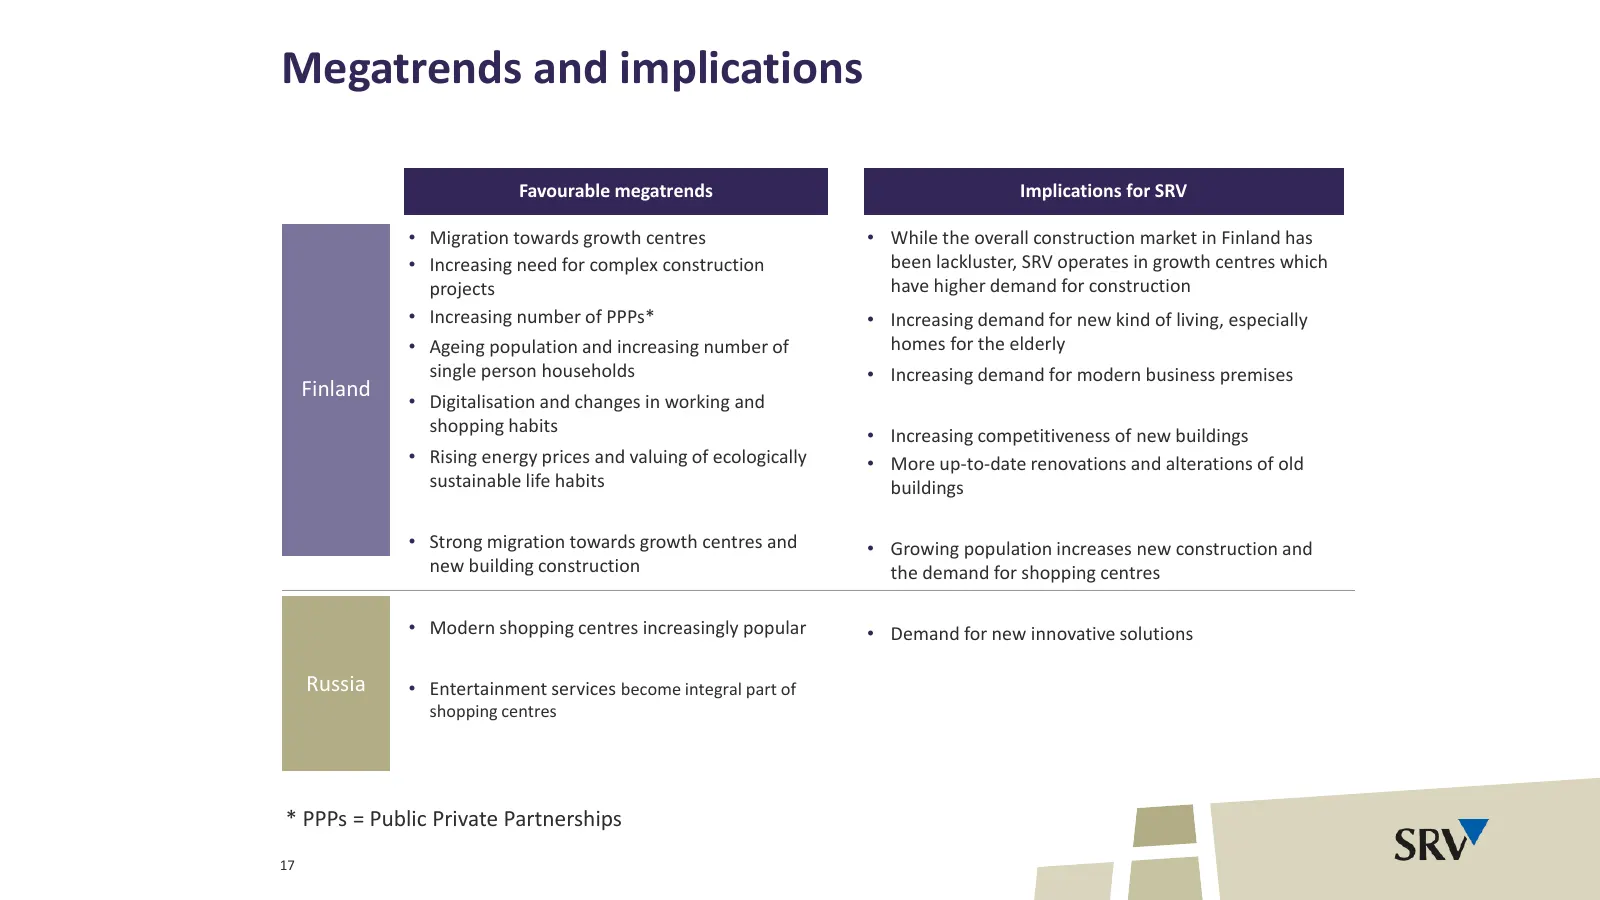
Slide 17: Megatrends and implications
Megatrends and implications Favourable megatrends Implications for SRV • Migration towards growth centres • While the overall construction market in Finland has • Increasing need for complex construction been lackluster, SRV operates in growth centres which projects have higher demand for constructi
Slide 18: First-quarter result bland as expected
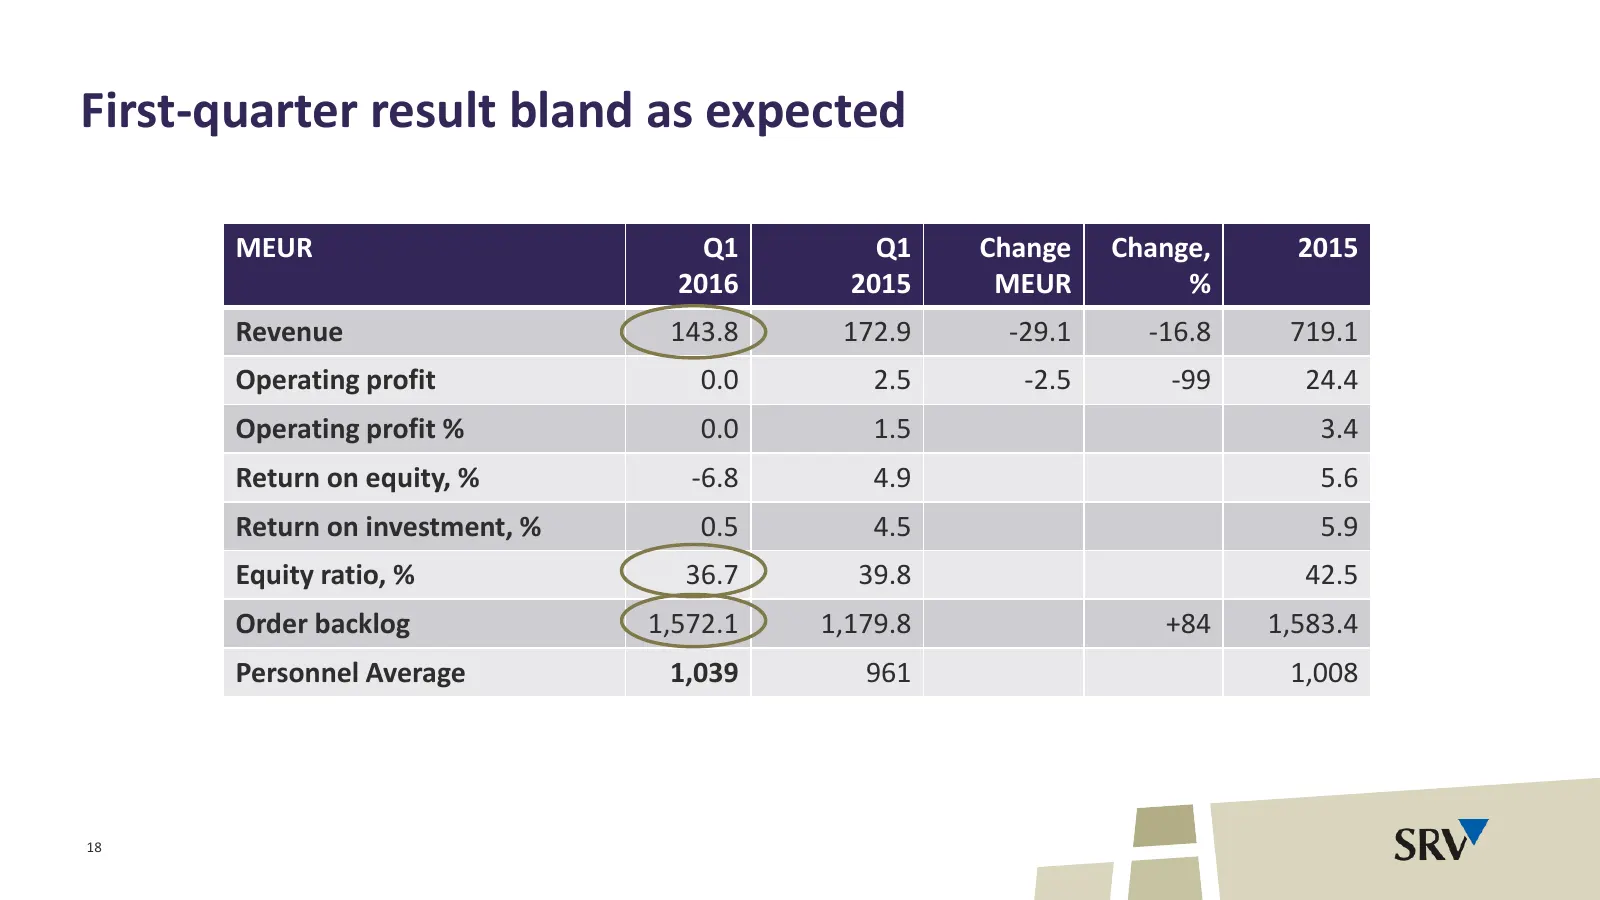
First-quarter result bland as expected MEUR Q1 Q1 Change Change, 2015 2016 2015 MEUR % Revenue 143.8 172.9 -29.1 -16.8 719.1 Operating profit 0.0 2.5 -2.5 -99 24.4 Operating profit % 0.0 1.5 3.4 Return on equity, % -6.8 4.9 5.6 Return on investment, % 0.5 4.5 5.9 Equity ratio, % 36.7 39.8 42.5 Order
Slide 19: Revenue decreased slightly from last year
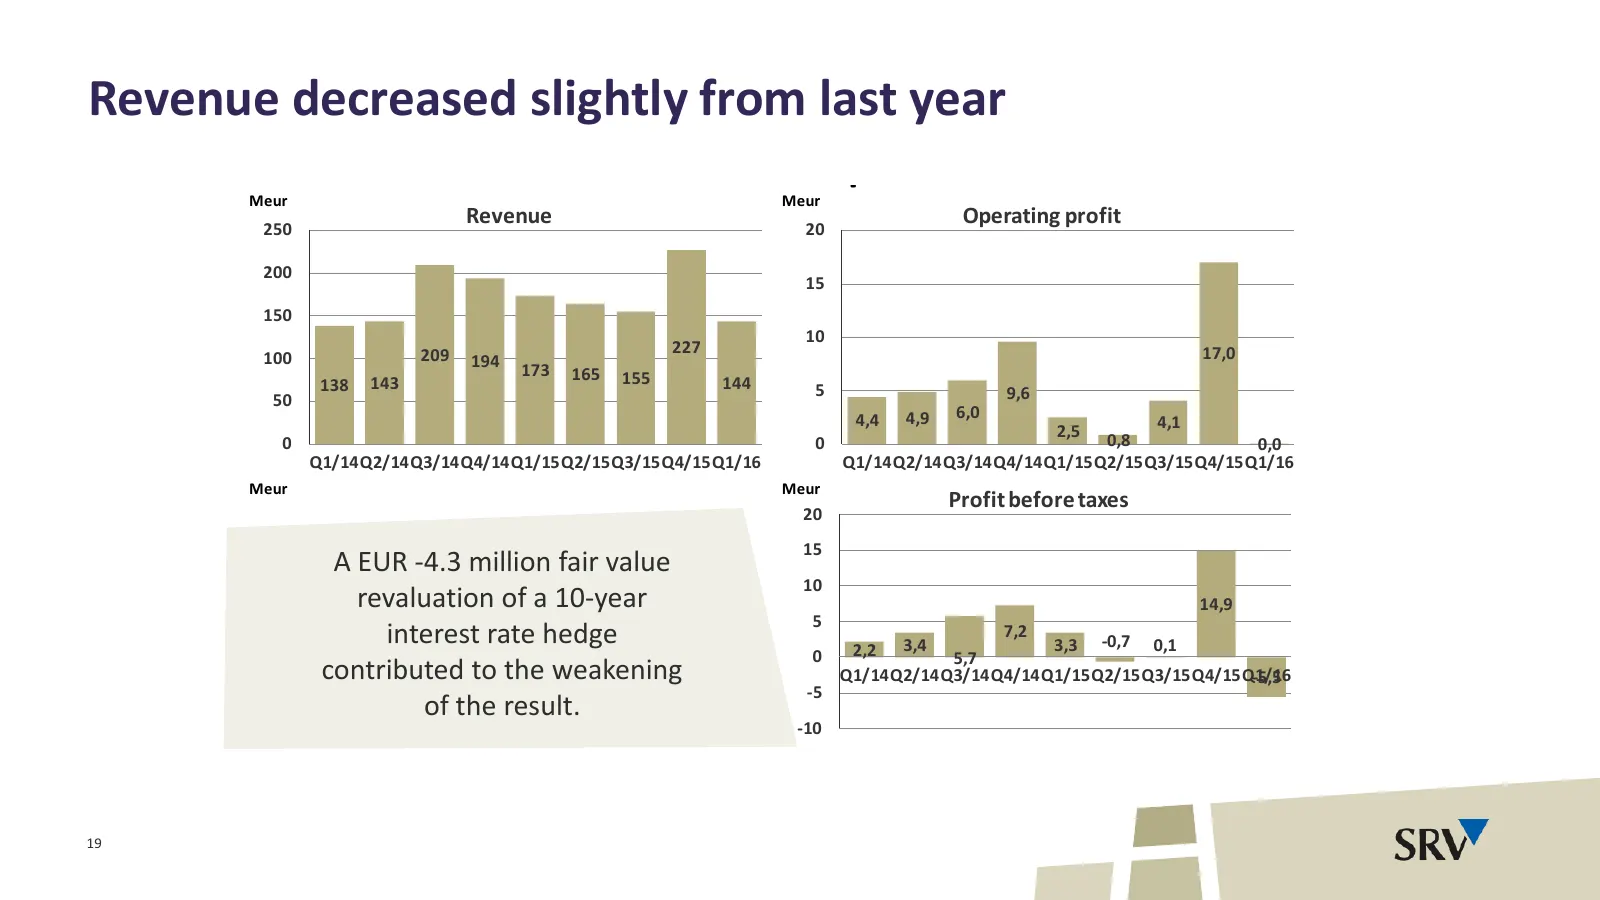
Revenue decreased slightly from last year SRV Group Meur Meur Revenue Operating profit 250 20 200 15 150 10 209 227 17,0 100 194 173 165 155 138 143 144 5 50 9,6 4,4 4,9 6,0 2,5 4,1 0 0 0,8 0,0 Q1/14Q2/14Q3/14Q4/14Q1/15Q2/15Q3/15Q4/15Q1/16 Q1/14Q2/14Q3/14Q4/14Q1/15Q2/15Q3/15Q4/15Q1/16 Meur Meur Prof
Slide 20: Indebtedness in detail
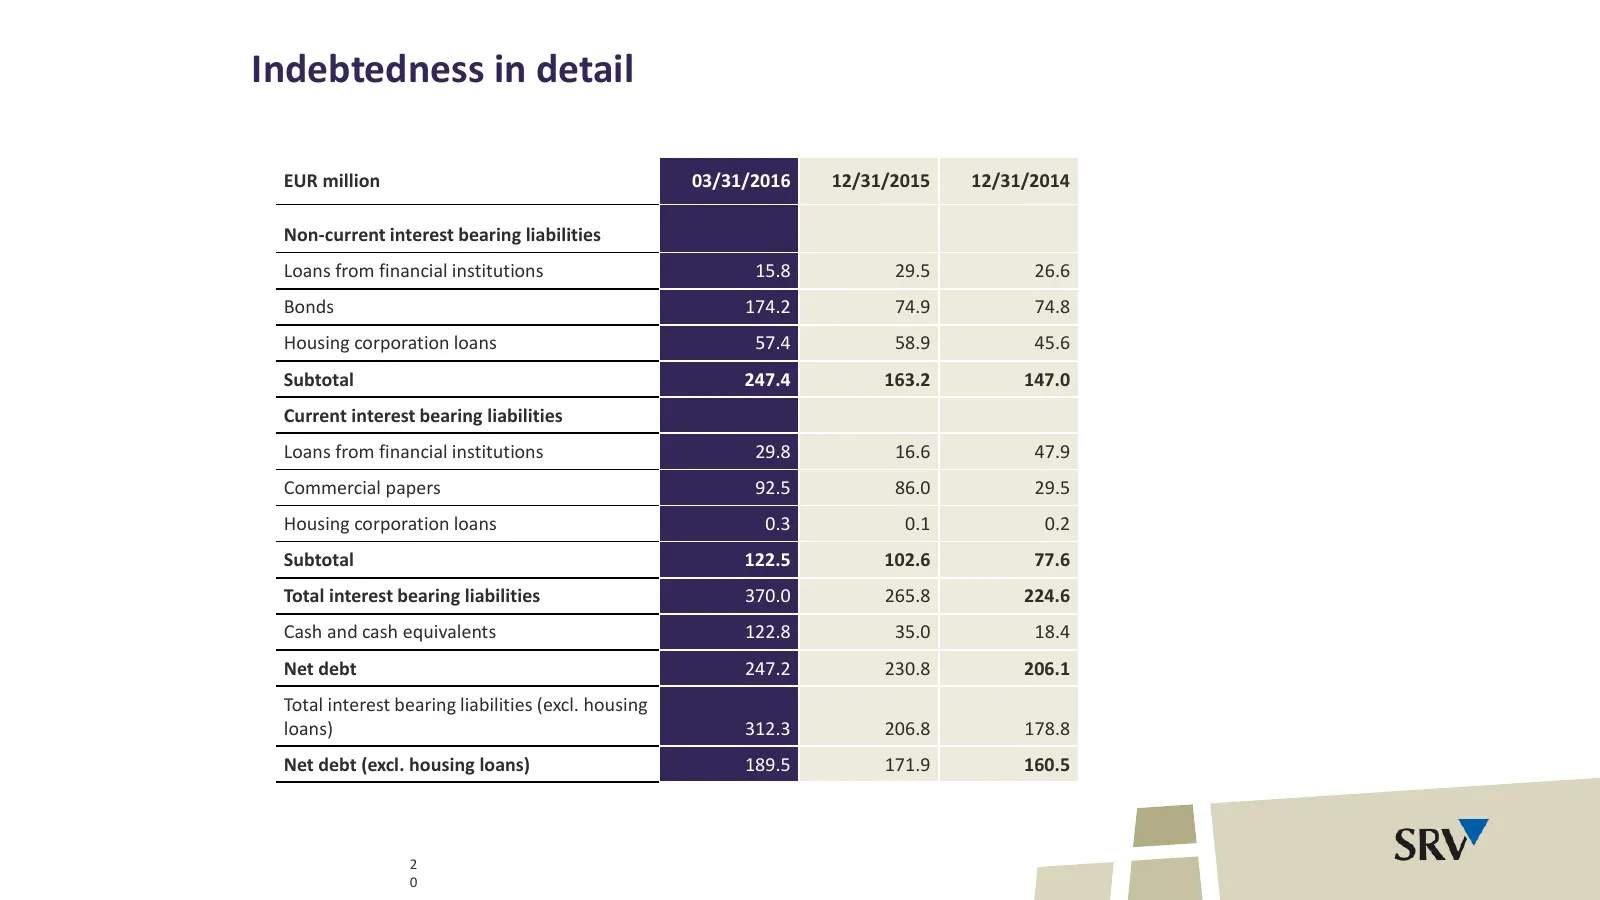
Indebtedness in detail EUR million 03/31/2016 12/31/2015 12/31/2014 Non-current interest bearing liabilities Loans from financial institutions 15.8 29.5 26.6 Bonds 174.2 74.9 74.8 Housing corporation loans 57.4 58.9 45.6 Subtotal 247.4 163.2 147.0 Current interest bearing liabilities Loans from fina
Source: Internet Archive copy of srv.fi
More decks from SRV Yhtiot Oyj
 Q1 2024 Earnings Presentation30 slides · Apr 25, 2024
 Q1 2022 Earnings Presentation30 slides · Apr 28, 2022
 Q3 2019 Earnings Presentation46 slides · Oct 31, 2019
 Q3 2016 Earnings Presentation40 slides · Nov 3, 2016
 H1 2016 Earnings Presentation26 slides · Jul 21, 2016
 H1 2016 Earnings Presentation26 slides · Jul 15, 2016