The Travelers Companies, Inc. · NYSE:TRV
The Travelers Companies — Q4 2017 Earnings Presentation
22 slides from The Travelers Companies's earnings presentation, Jan 23, 2018

Slide 1: Fourth Quarter 2017 Results
Fourth Quarter 2017 Results January 23, 2018 1
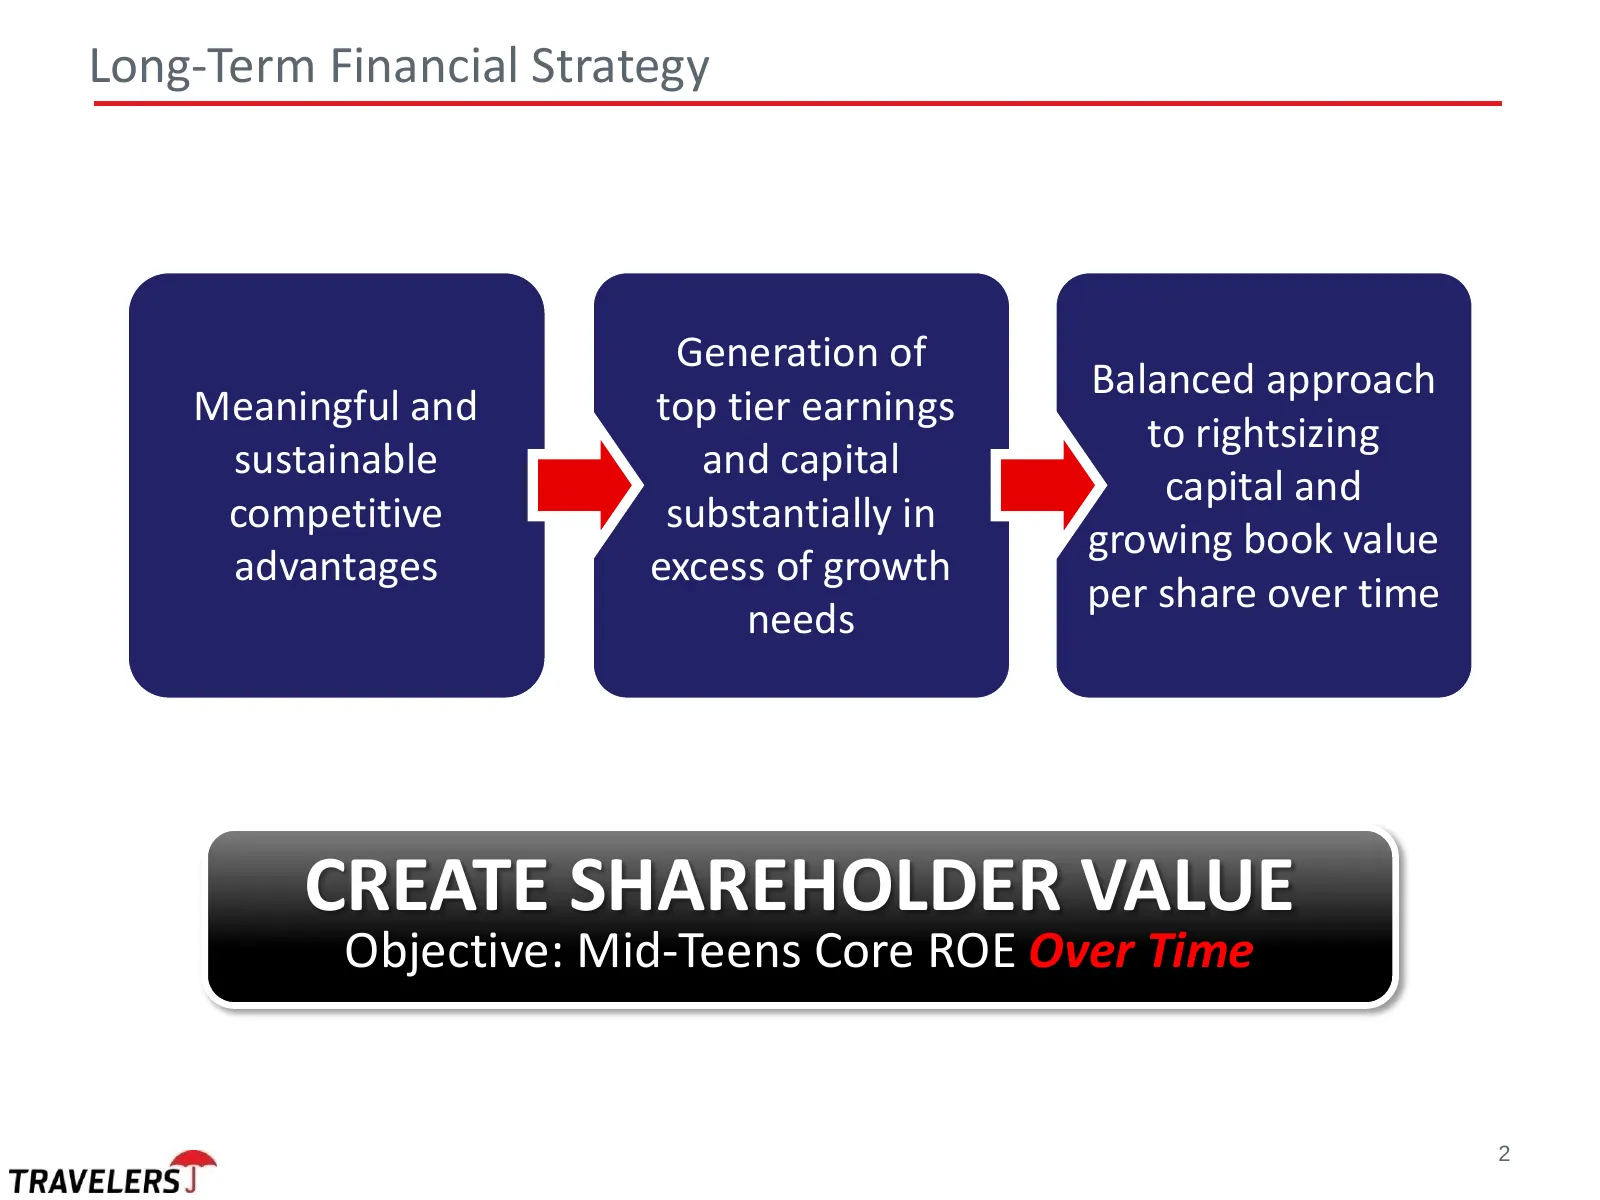
Slide 2: Long-Term Financial Strategy
Long-Term Financial Strategy Generation of Balanced approach Meaningful and top tier earnings to rightsizing sustainable and capital capital and competitive substantially in growing book value advantages excess of growth per share over time needs CREATE SHAREHOLDER VALUE Objective: Mid-Teens Core RO
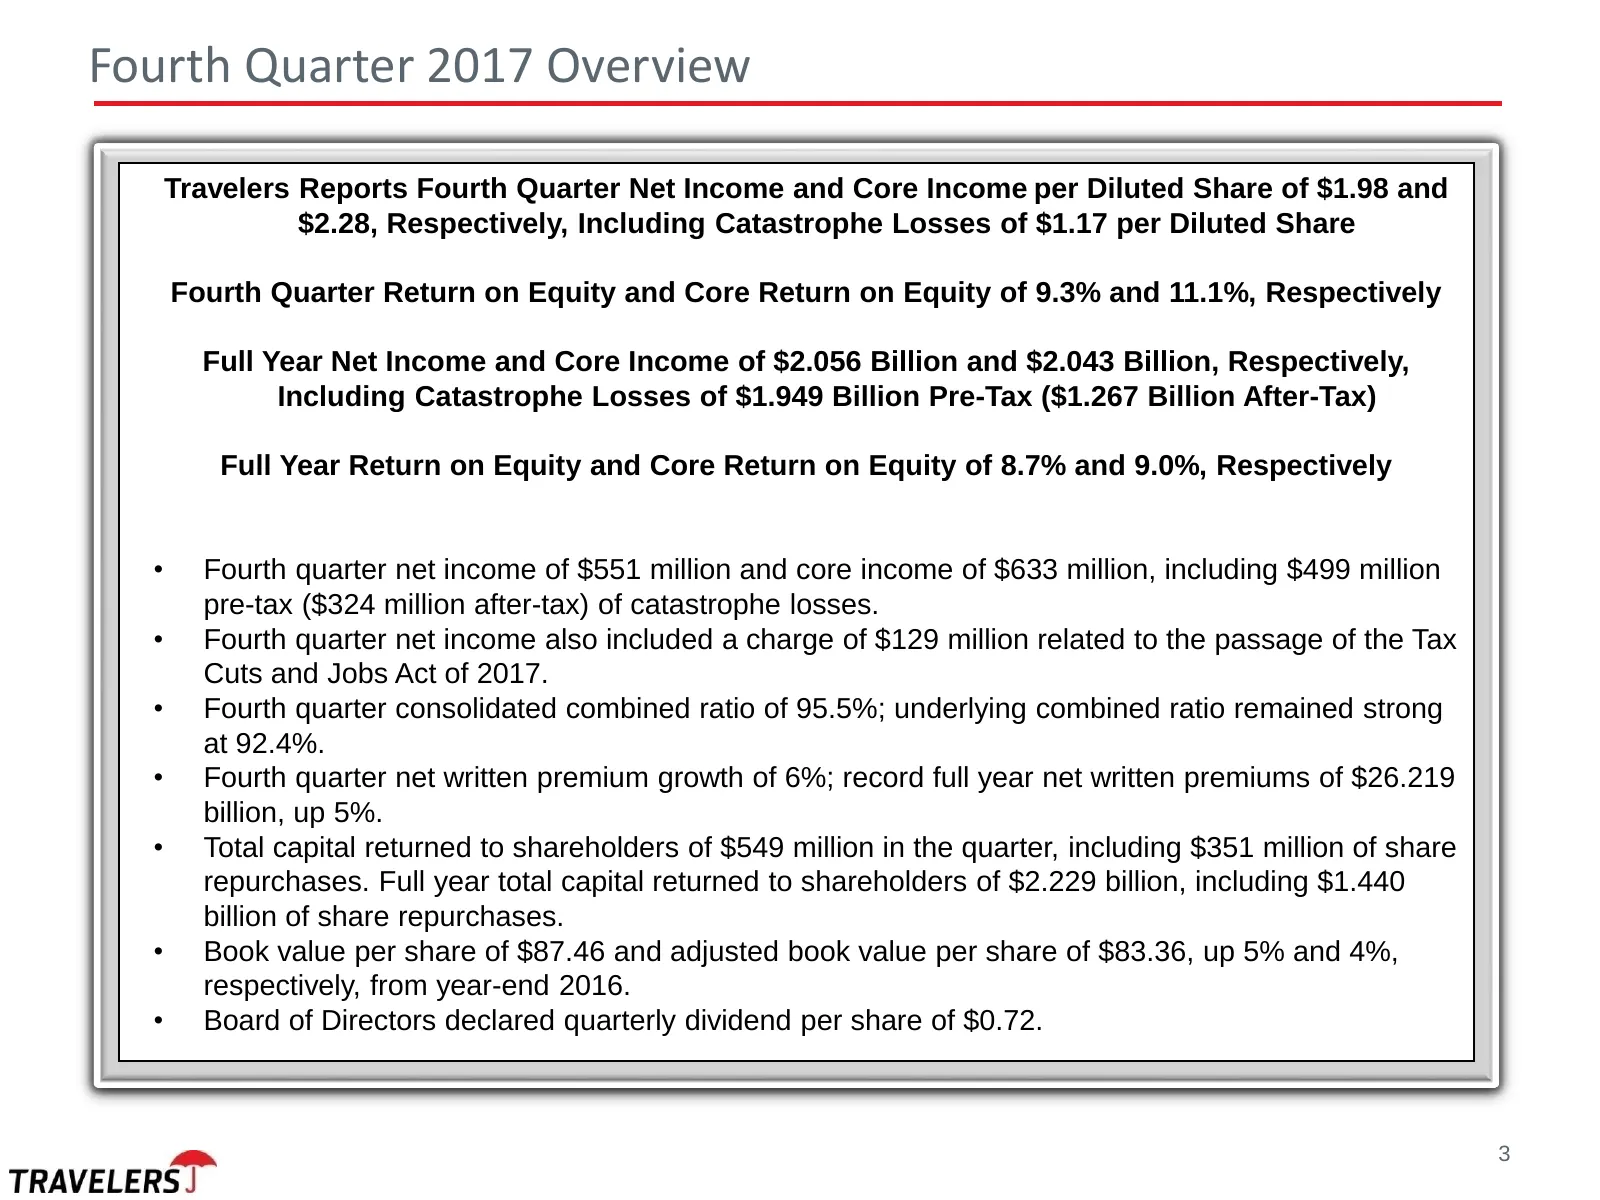
Slide 3: Fourth Quarter 2017 Overview
Fourth Quarter 2017 Overview Travelers Reports Fourth Quarter Net Income and Core Income per Diluted Share of $1.98 and $2.28, Respectively, Including Catastrophe Losses of $1.17 per Diluted Share Fourth Quarter Return on Equity and Core Return on Equity of 9.3% and 11.1%, Respectively Full Year Net
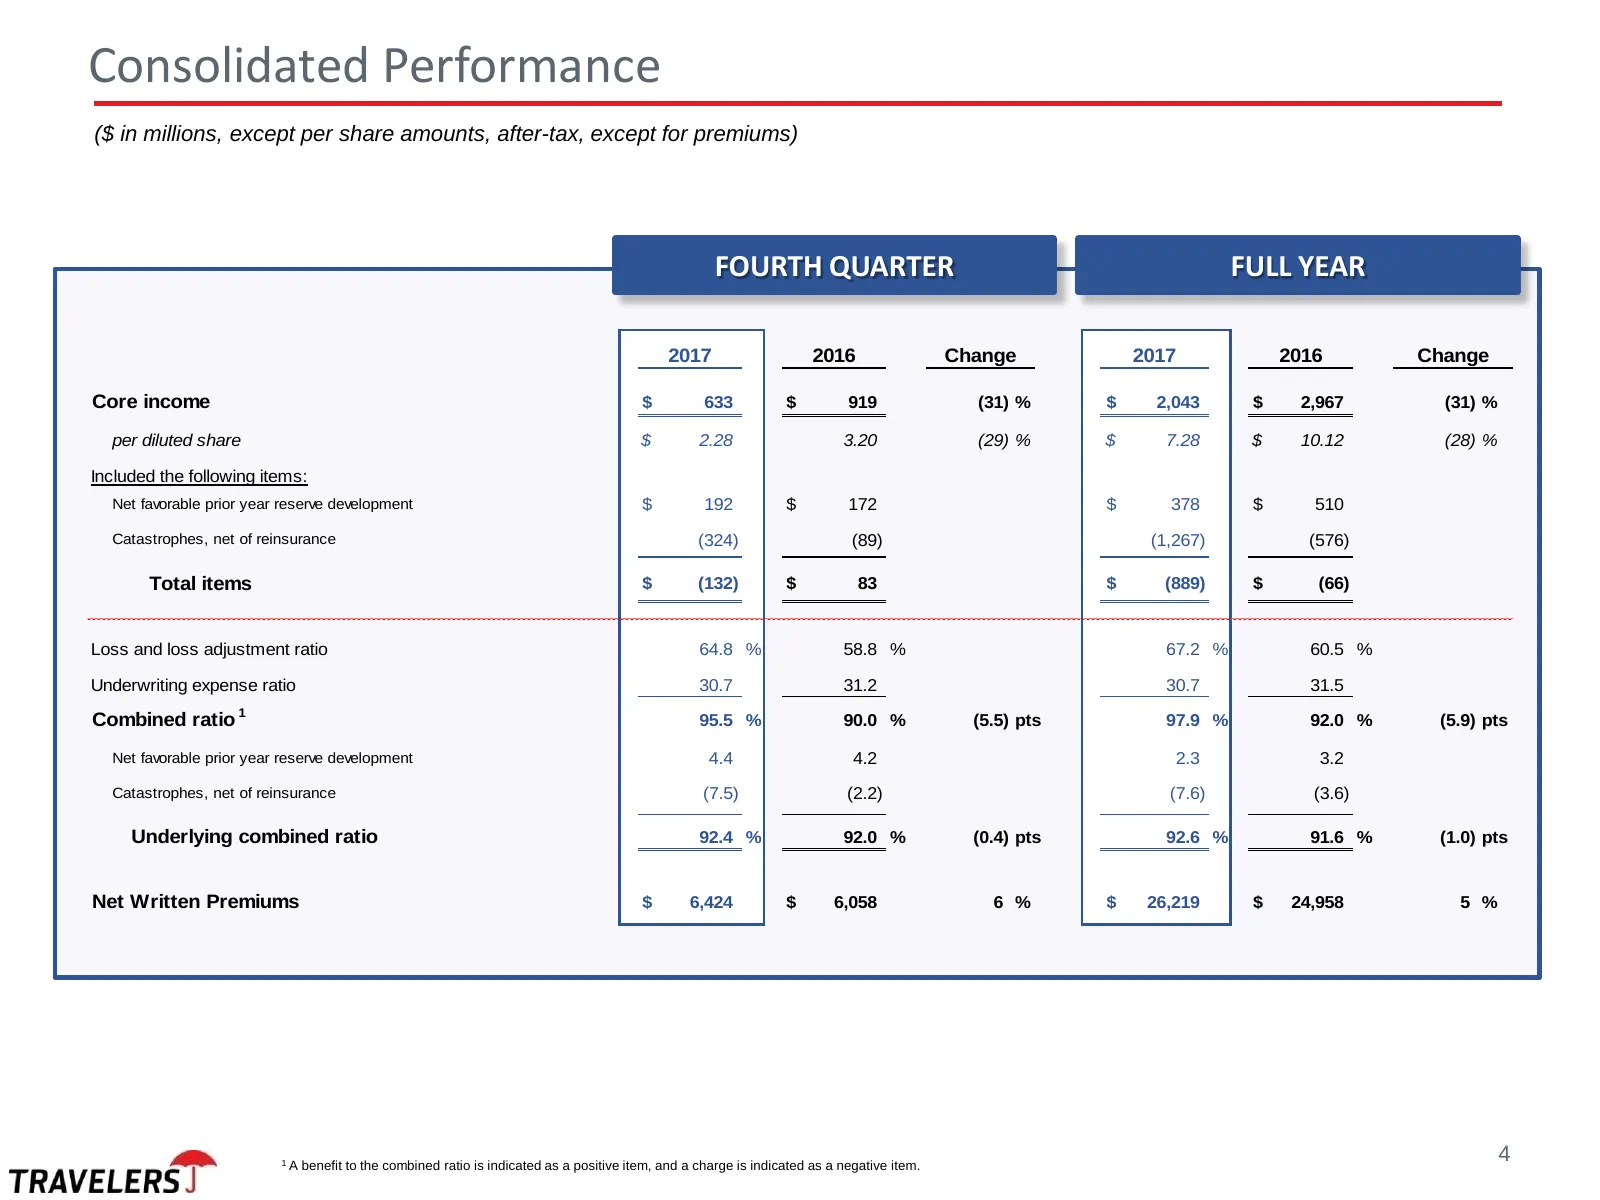
Slide 4: Consolidated Performance
Consolidated Performance ($ in millions, except per share amounts, after-tax, except for premiums) FOURTH QUARTER FULL YEAR 2017 2016 Change 2017 2016 Change Core income $ 633 $ 919 (31) % $ 2,043 $ 2,967 (31) % per diluted share $ 2.28 3.20 (29) % $ 7.28 $ 10.12 (28) % Included the following items:
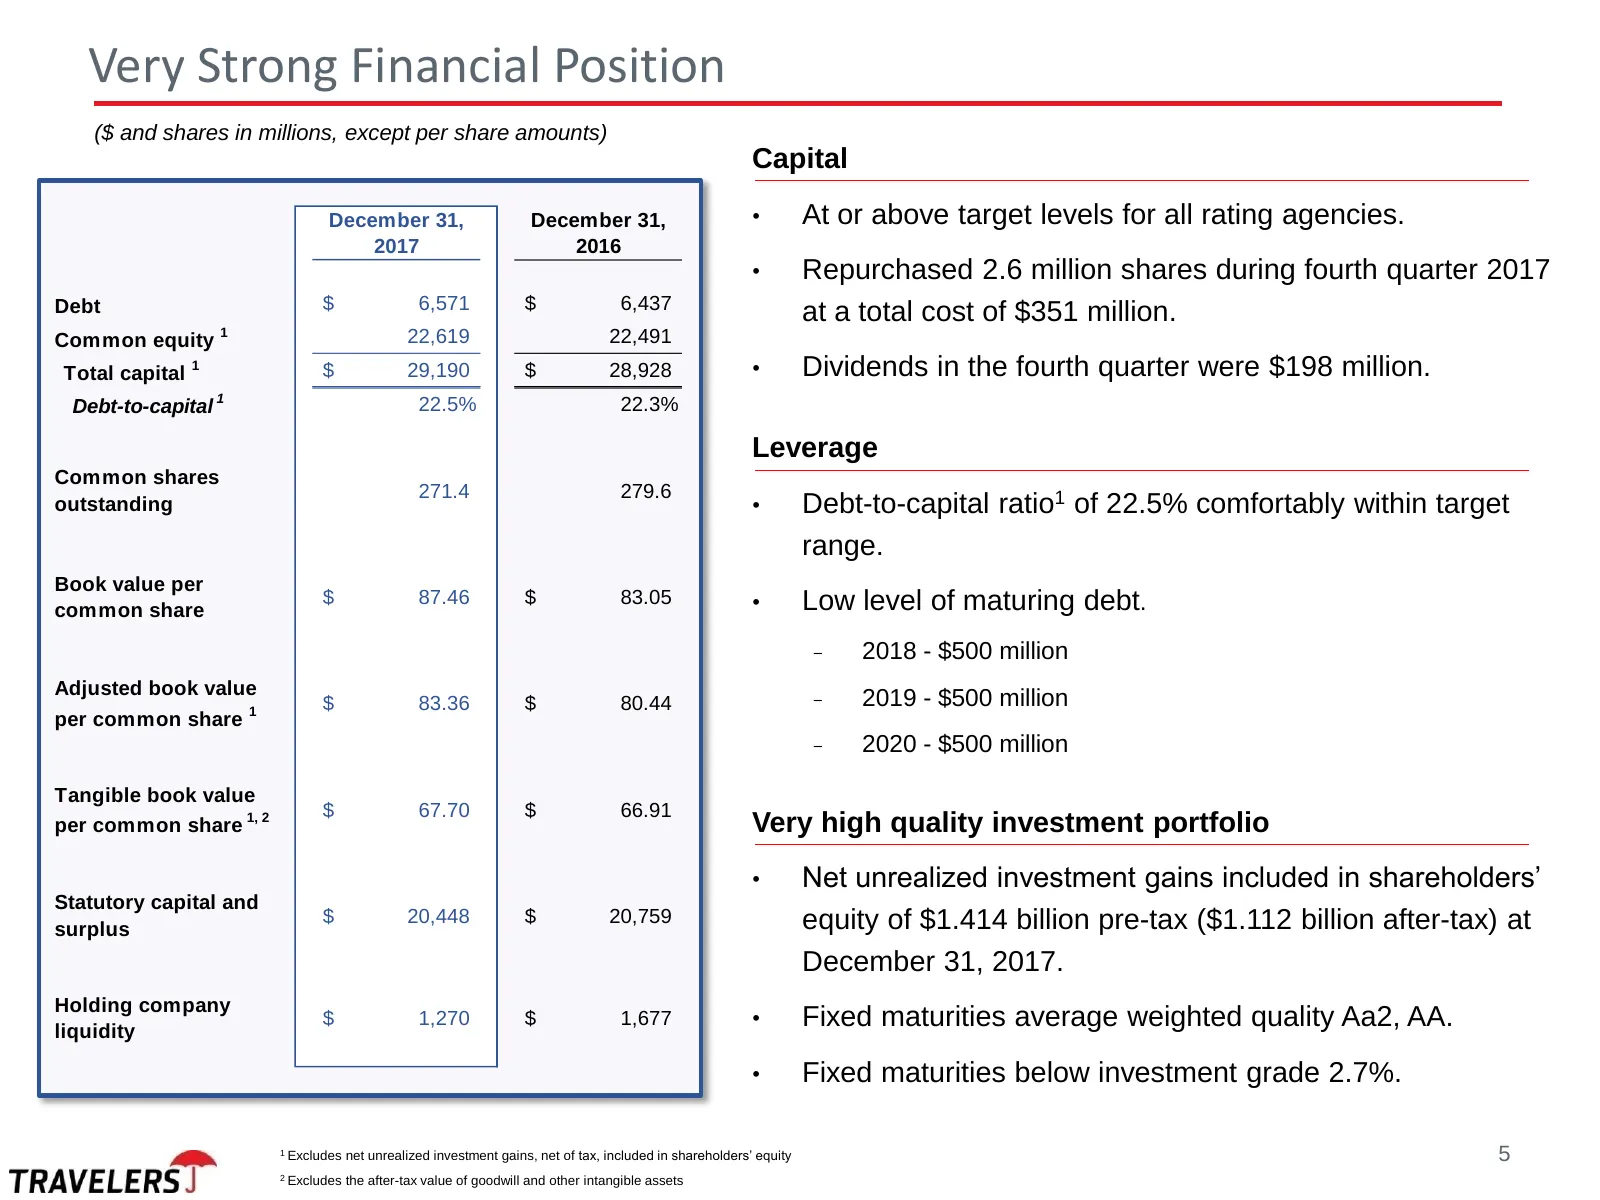
Slide 5: Very Strong Financial Position
Very Strong Financial Position ($ and shares in millions, except per share amounts) Capital December 31, December 31, • At or above target levels for all rating agencies. 2017 2016 • Repurchased 2.6 million shares during fourth quarter 2017 Debt $ 6,571 $ 6,437 at a total cost of $351 million. Commo
Slide 6: Combined Net Investment Income - After-tax
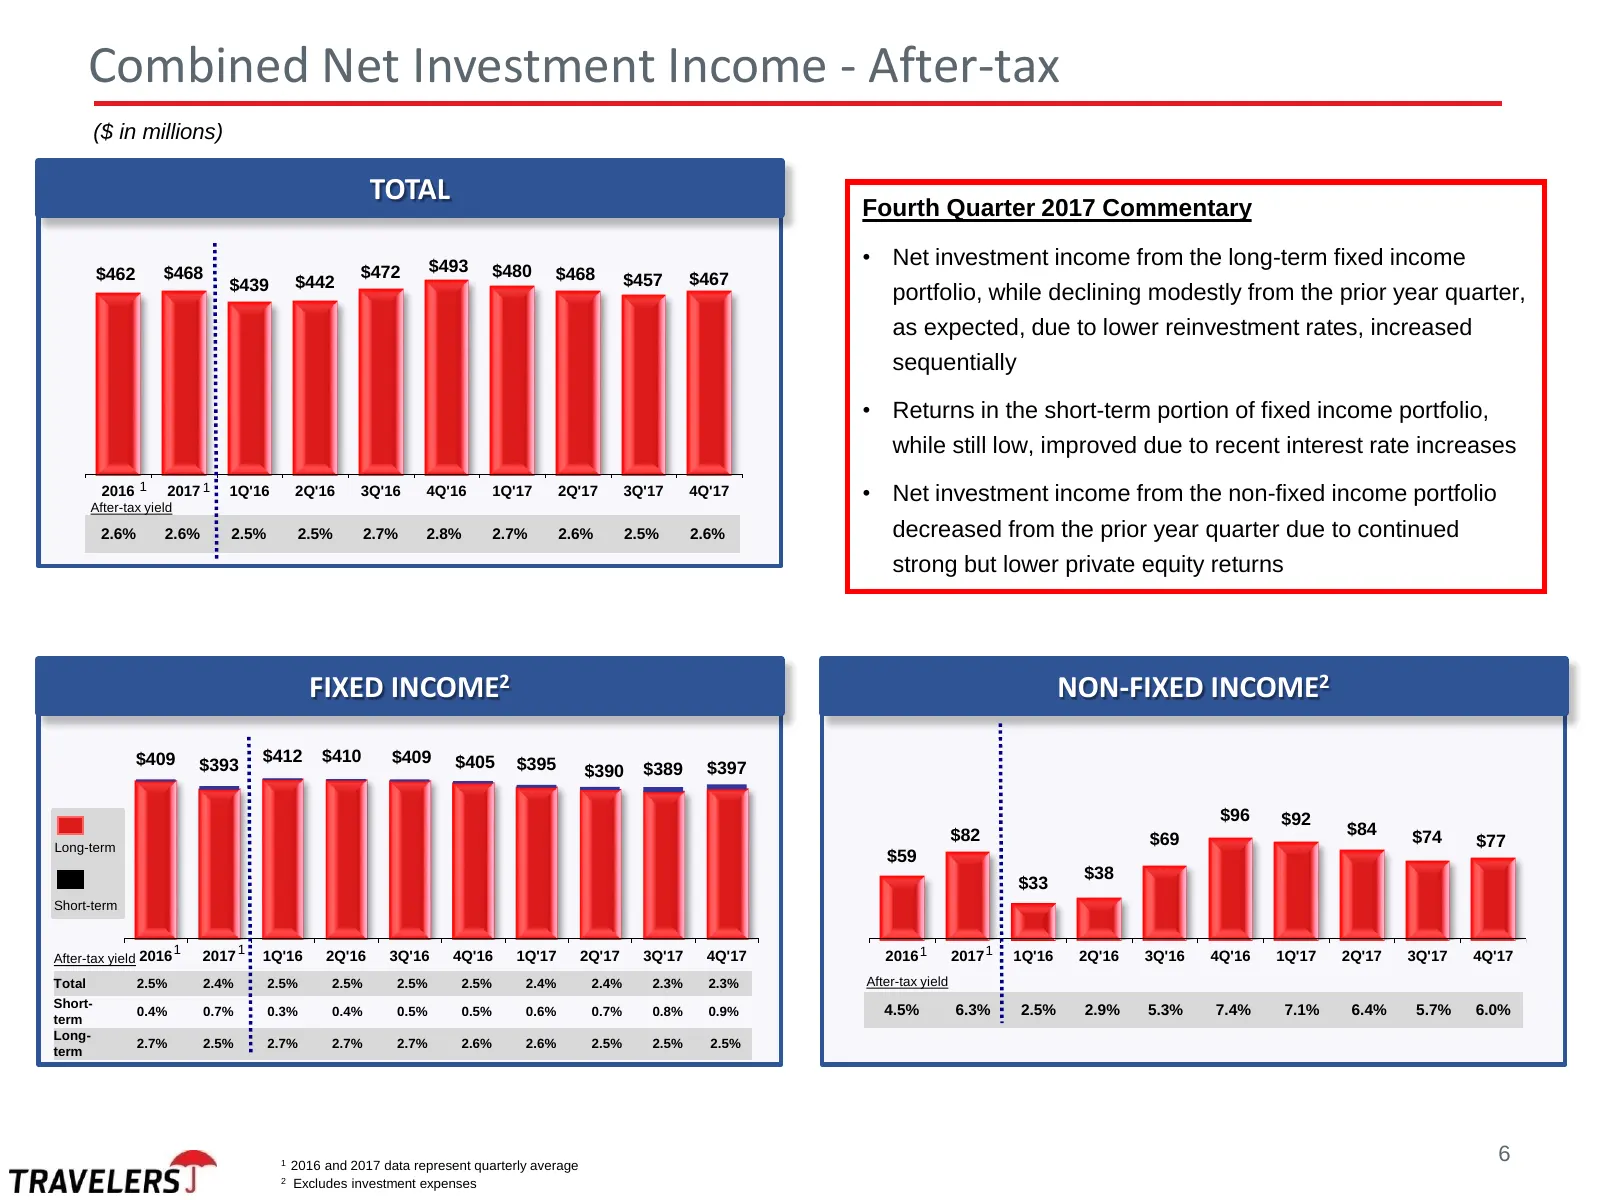
Combined Net Investment Income - After-tax ($ in millions) TOTAL Fourth Quarter 2017 Commentary $493 • Net investment income from the long-term fixed income $462 $468 $472 $480 $468 $467 $439 $442 $457 portfolio, while declining modestly from the prior year quarter, as expected, due to lower reinves
Slide 7: Components of Core Return on Equity
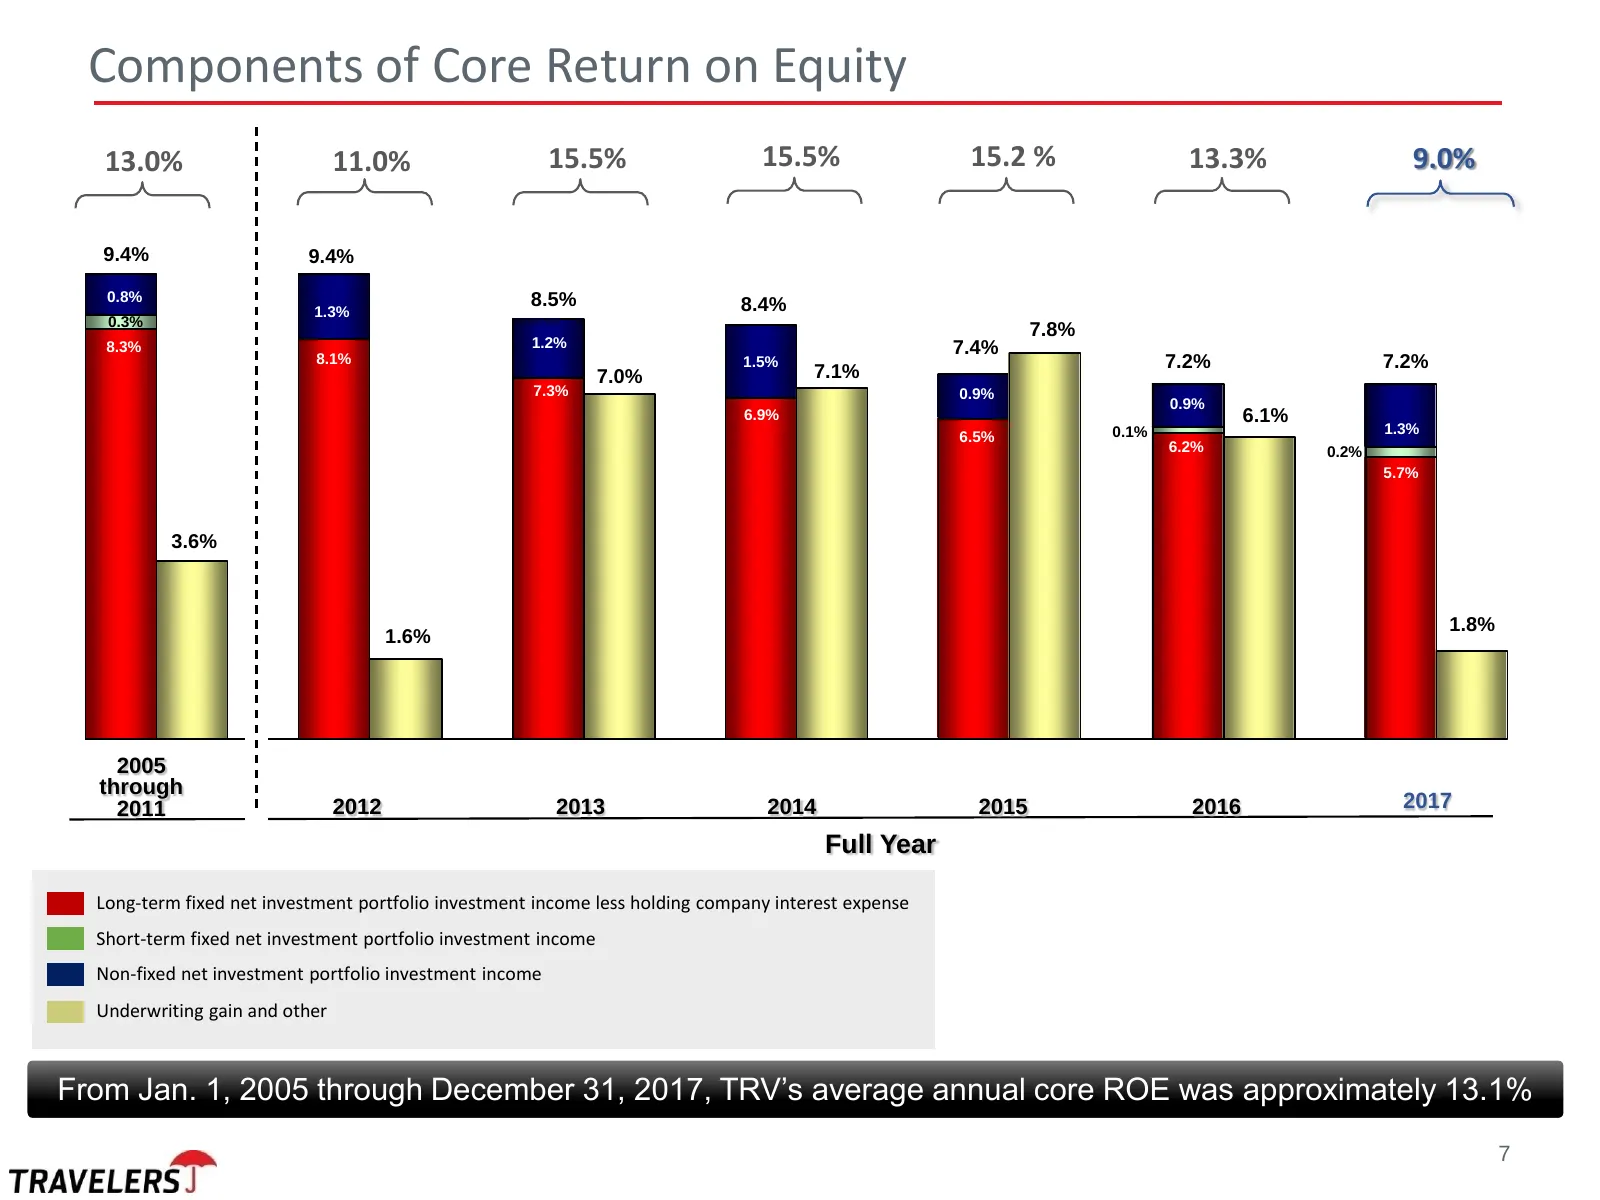
Components of Core Return on Equity 13.0% 11.0% 15.5% 15.5% 15.2 % 13.3% 9.0% 9.4% 9.4% 0.8% 8.5% 1.3% 8.4% 1.3% 0.3% 7.8% 8.3% 1.2% 7.4% 8.1% 1.5% 1.5% 7.1% 7.2% 7.2% 1.5% 7.0% 7.3% 0.9% 0.9% 6.9% 6.1% 0.1% 1.3% 6.5% 6.2% 0.2% 5.7% 3.6% 1.8% 1.6% 2005 through 2011 2012 2013 2014 2015 2016 2017 Full
Slide 8: Business Insurance Performance
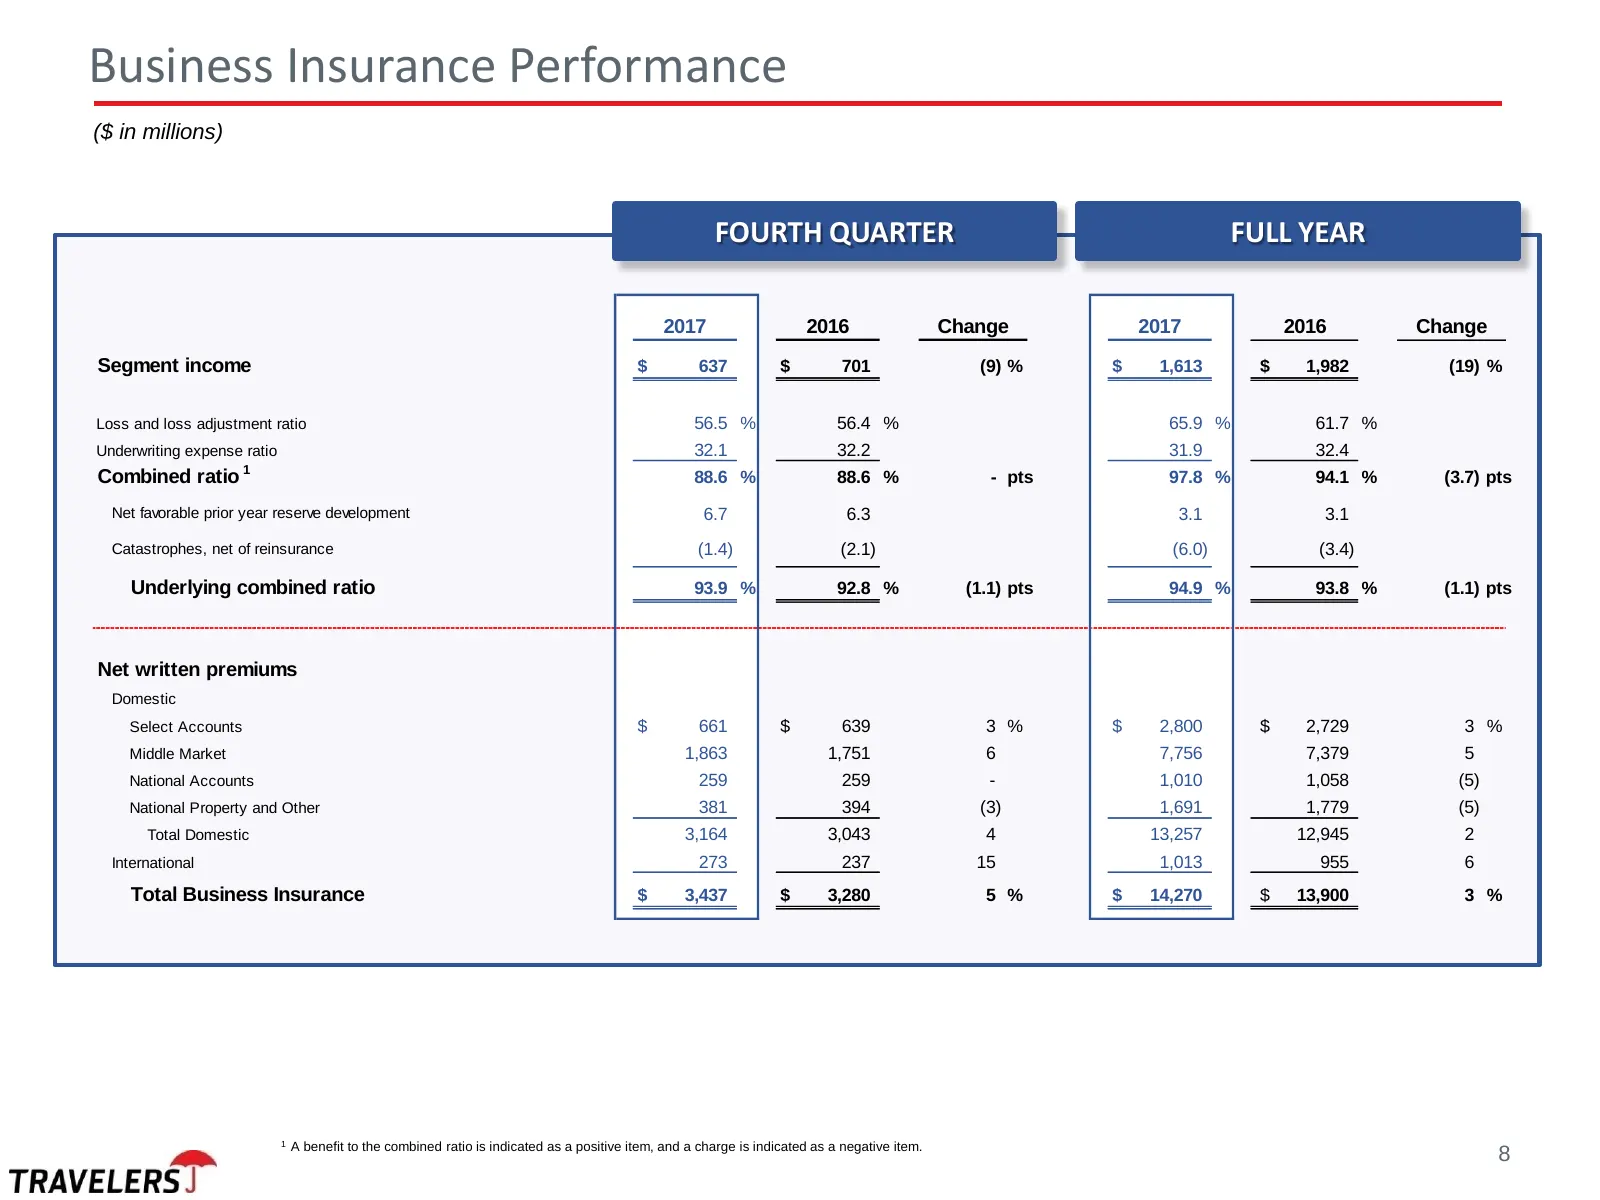
Business Insurance Performance ($ in millions) FOURTH QUARTER FULL YEAR 2017 2016 Change 2017 2016 Change Segment income $ 637 $ 701 (9) % $ 1,613 $ 1,982 (19) % Loss and loss adjustment ratio 56.5 % 56.4 % 65.9 % 61.7 % Underwriting expense ratio 32.1 32.2 31.9 32.4 Combined ratio 1 88.6 % 88.6 % -
Slide 9: Domestic Business Insurance (Ex. National Accounts)
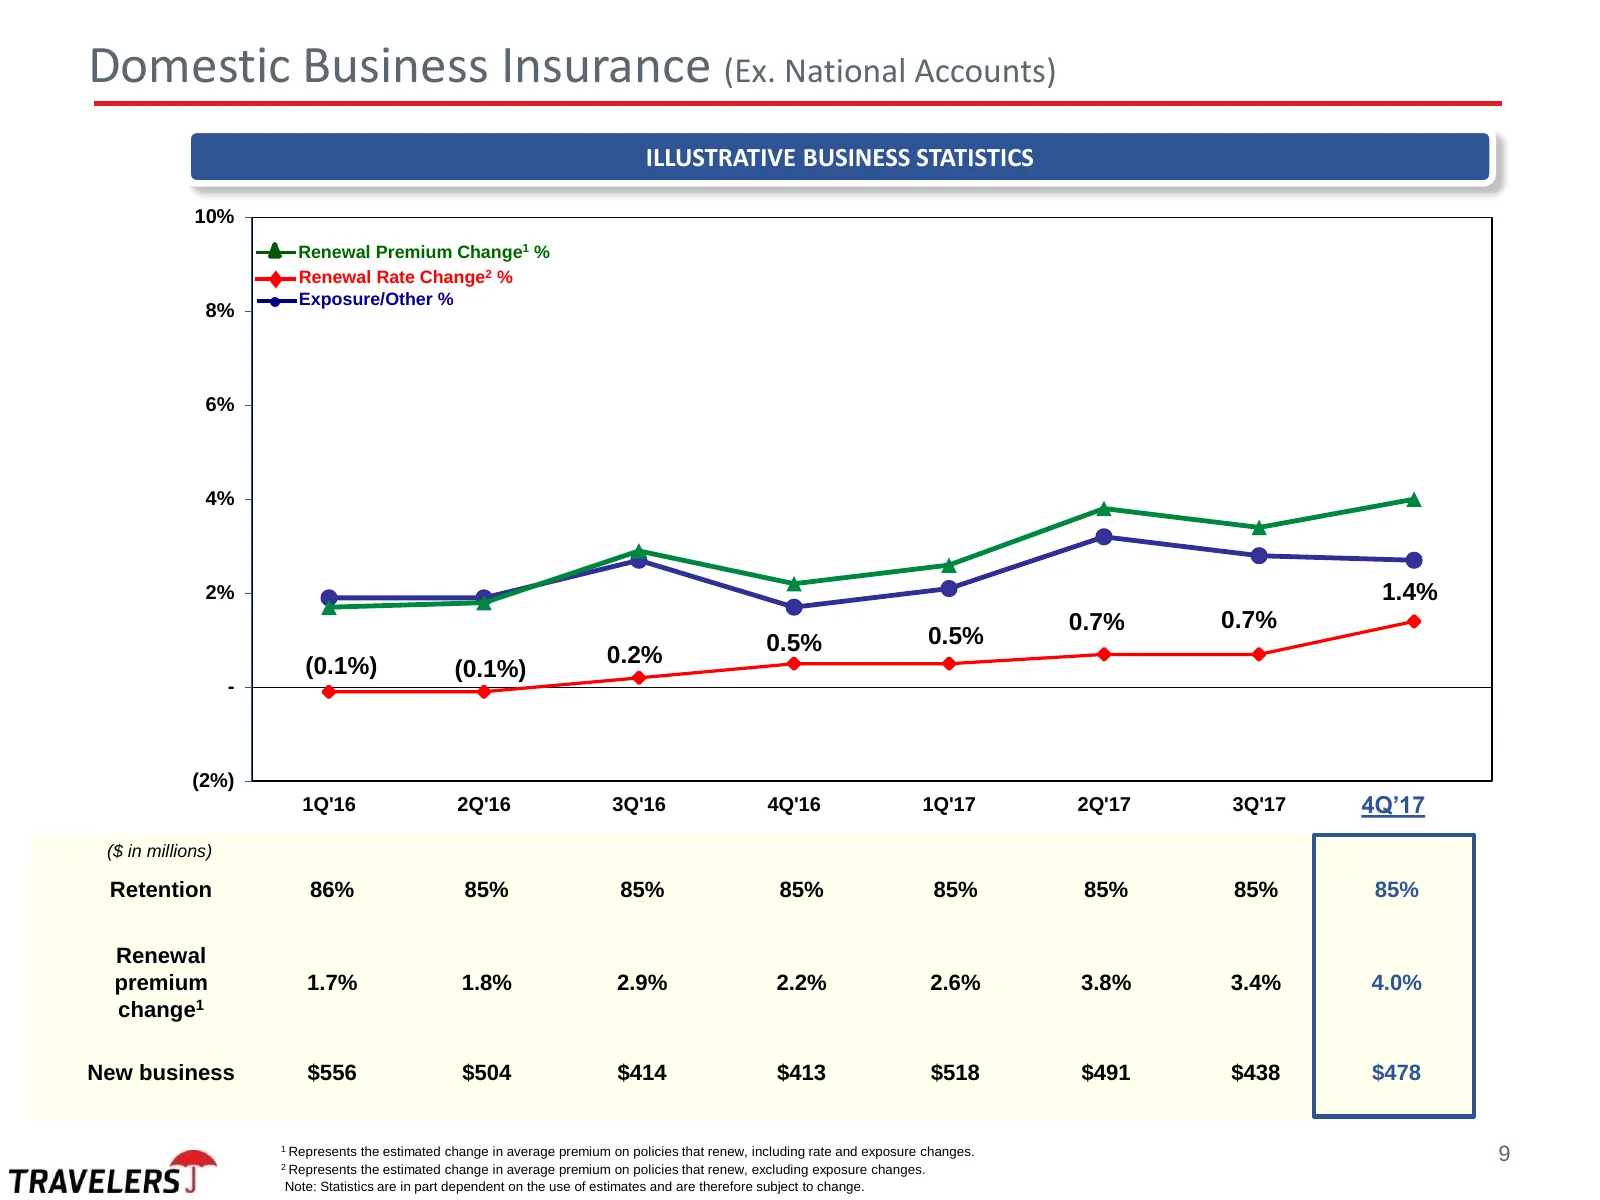
Domestic Business Insurance (Ex. National Accounts) ILLUSTRATIVE BUSINESS STATISTICS 10% ▲ Renewal Premium Change1 % Renewal Rate Change2 % 8% • Exposure/Other % 6% 4% 2% 1.4% 0.7% 0.7% 0.5% 0.5% (0.1%) 0.2% (0.1%) - (2%) 1Q'16 2Q'16 3Q'16 4Q'16 1Q'17 2Q'17 3Q'17 4Q’17 ($ in millions) Retention 86
Slide 10: Domestic Business Insurance: Select Accounts
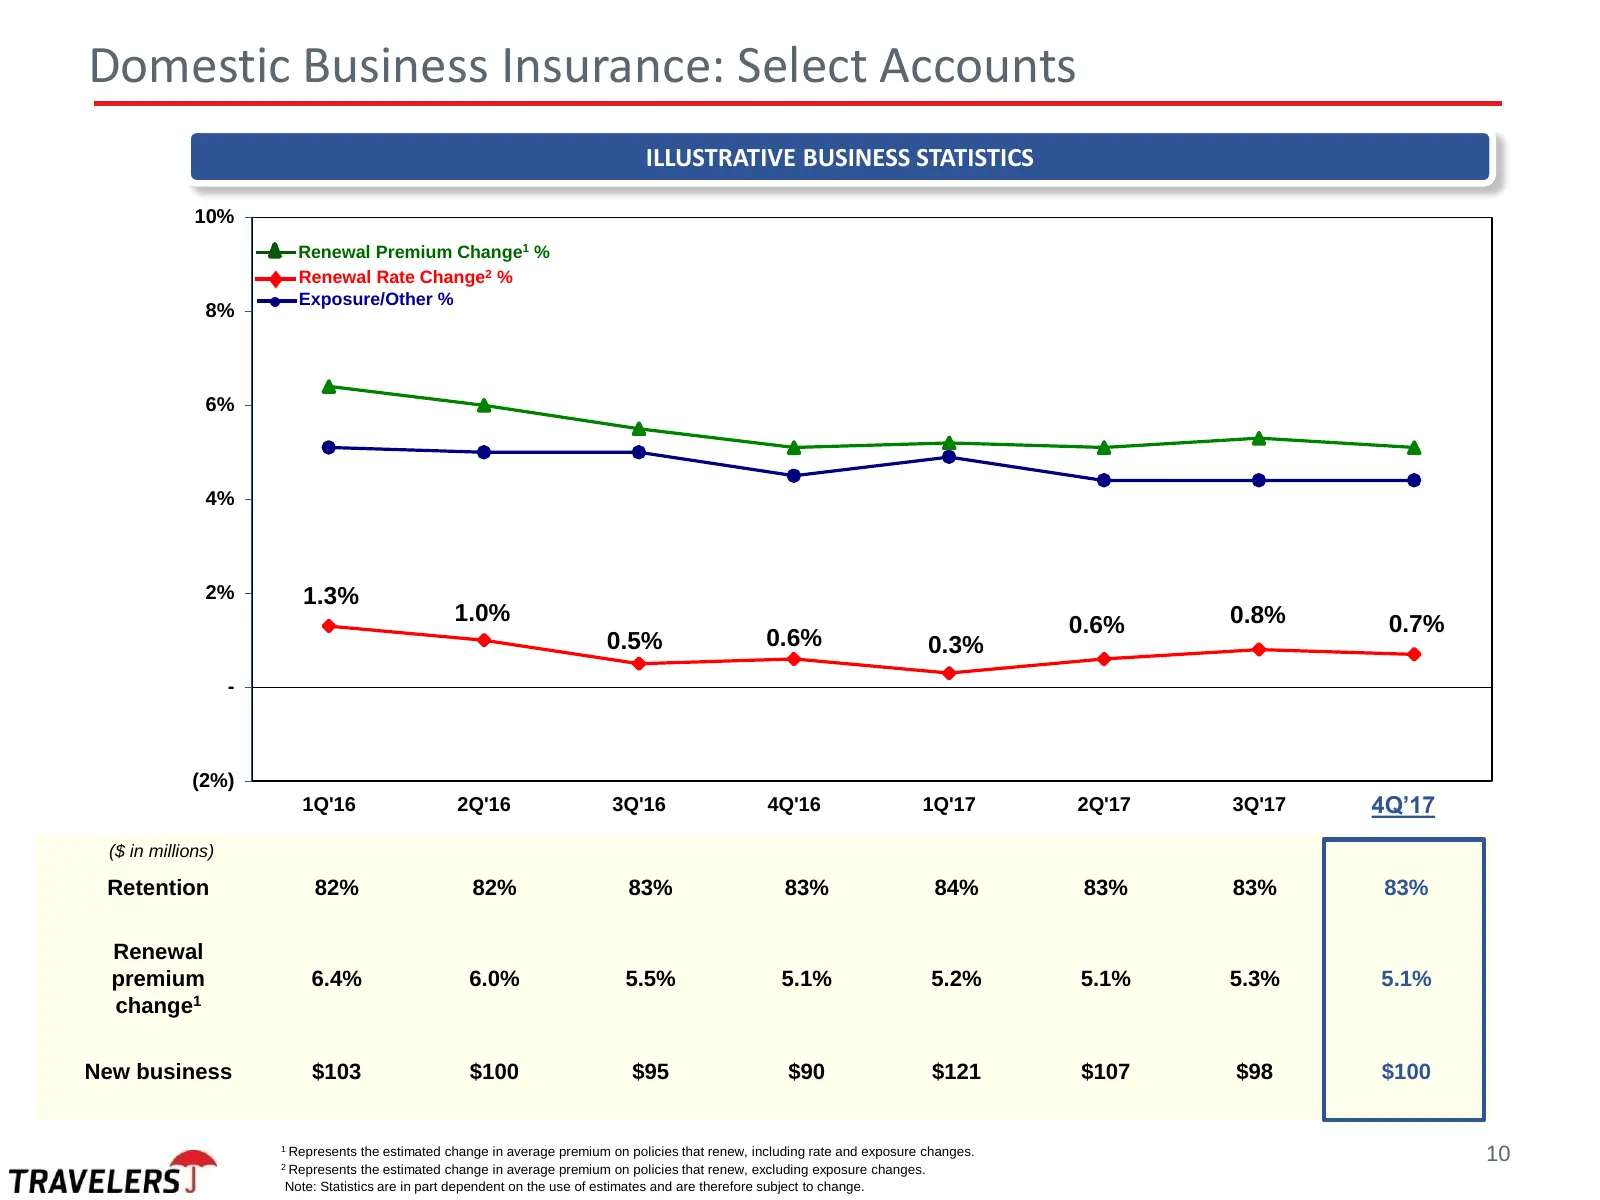
Domestic Business Insurance: Select Accounts ILLUSTRATIVE BUSINESS STATISTICS 10% ▲ Renewal Premium Change1 % Renewal Rate Change2 % 8% • Exposure/Other % 6% 4% 2% 1.3% 1.0% 0.6% 0.8% 0.7% 0.5% 0.6% 0.3% - (2%) 1Q'16 2Q'16 3Q'16 4Q'16 1Q'17 2Q'17 3Q'17 4Q’17 ($ in millions) Retention 82% 82% 83% 8
Slide 11: Domestic Business Insurance: Middle Market
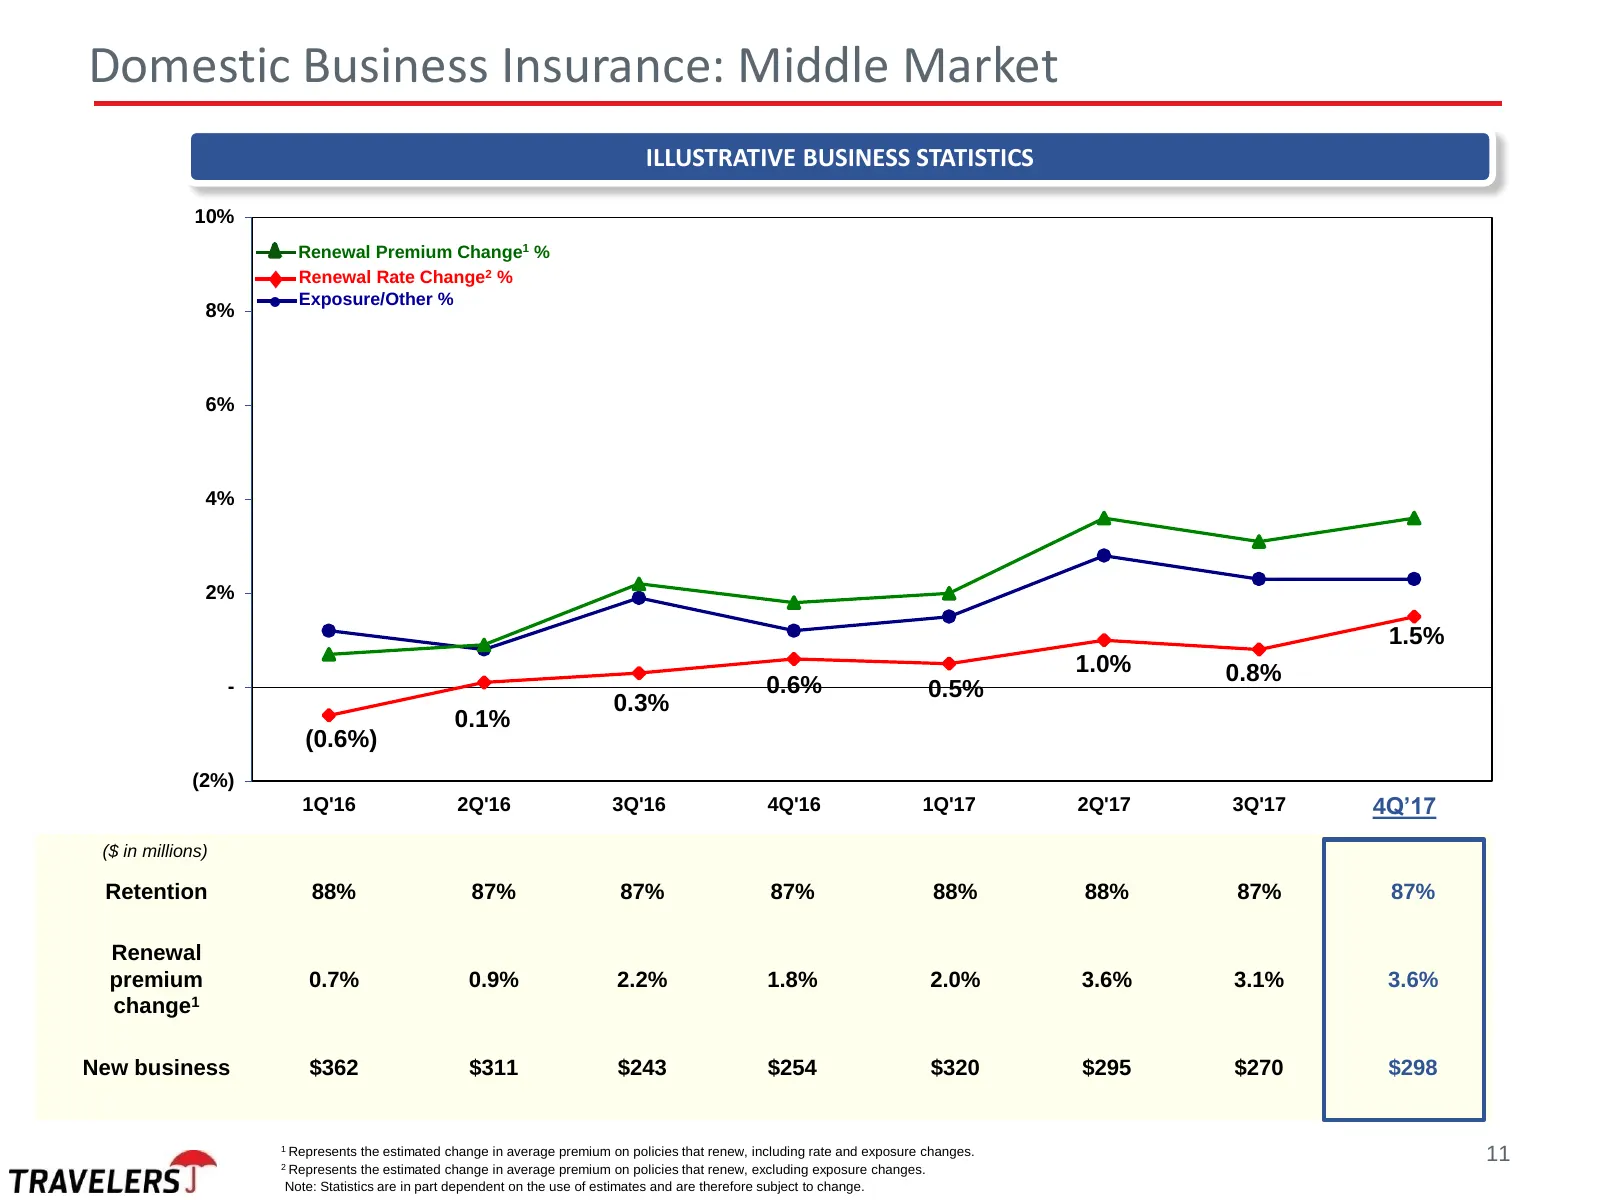
Domestic Business Insurance: Middle Market ILLUSTRATIVE BUSINESS STATISTICS 10% ▲ Renewal Premium Change1 % Renewal Rate Change2 % 8% • Exposure/Other % 6% 4% 2% 1.5% 1.0% 0.8% - 0.6% 0.5% 0.3% 0.1% (0.6%) (2%) 1Q'16 2Q'16 3Q'16 4Q'16 1Q'17 2Q'17 3Q'17 4Q’17 ($ in millions) Retention 88% 87% 87% 8
Slide 12: Bond & Specialty Insurance Performance
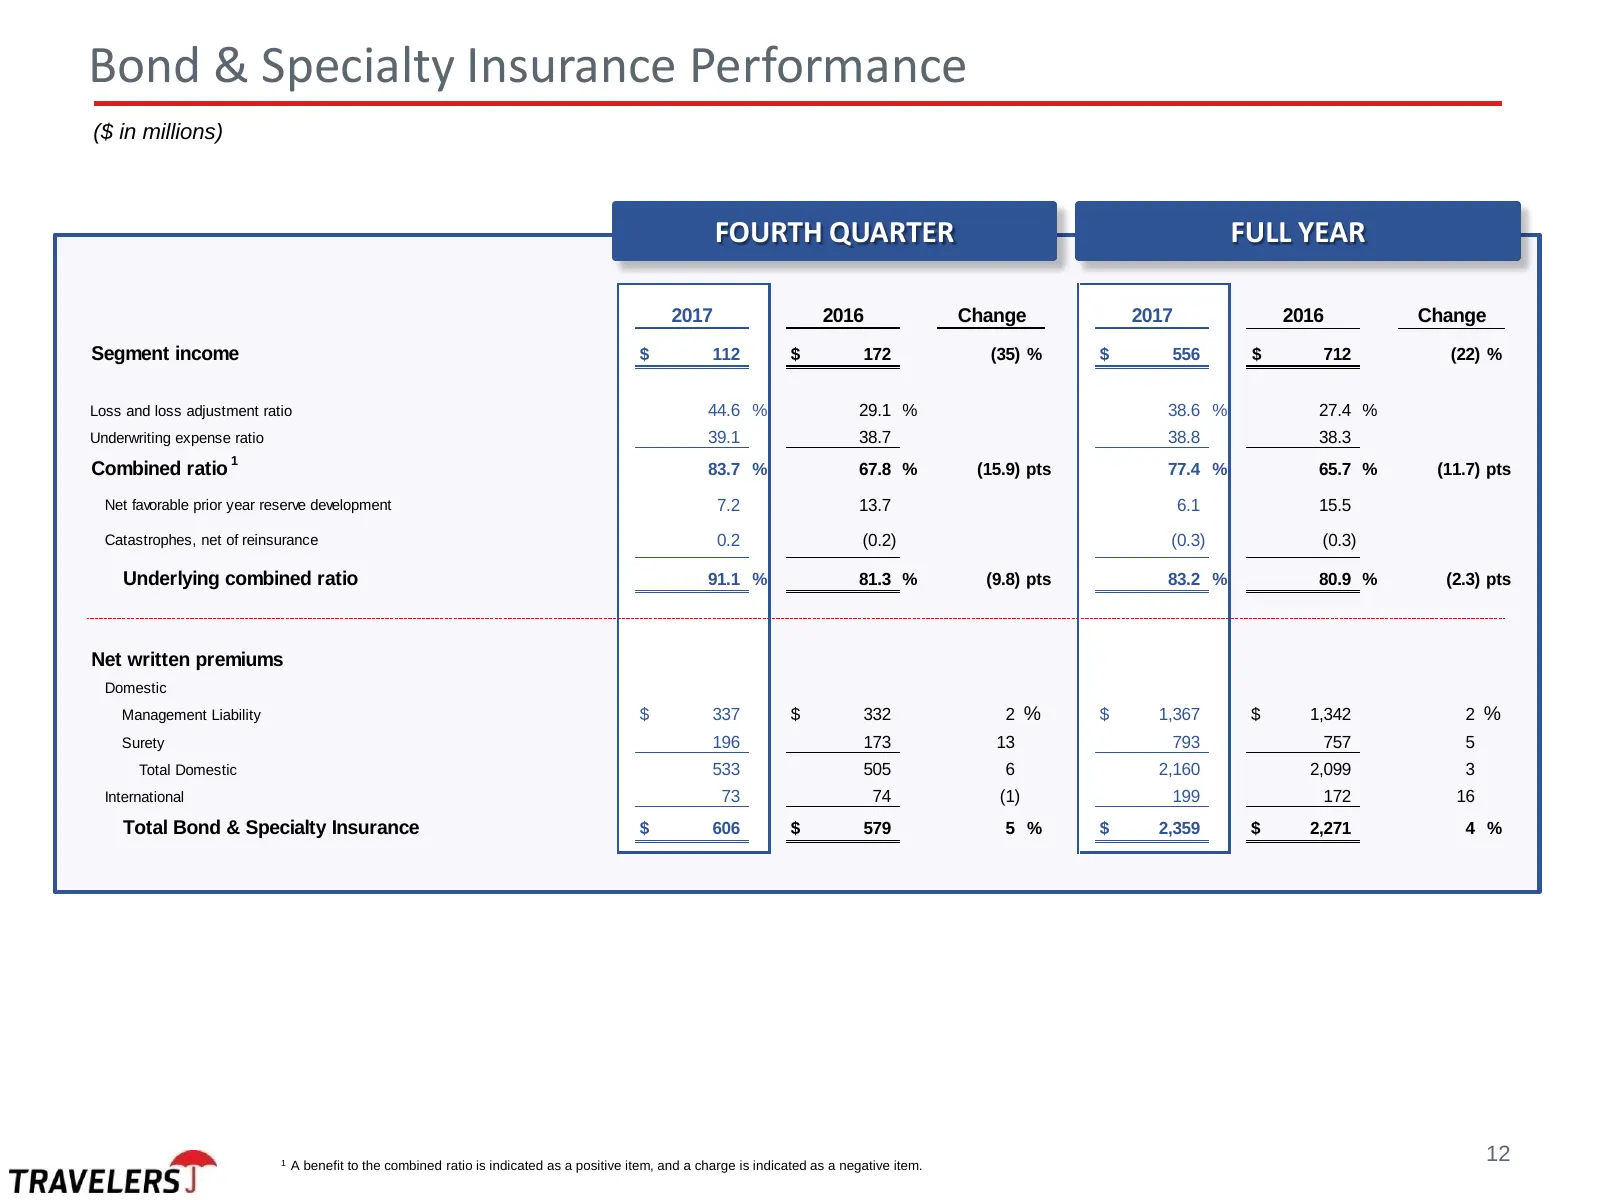
Bond & Specialty Insurance Performance ($ in millions) FOURTH QUARTER FULL YEAR 2017 2016 Change 2017 2016 Change Segment income $ 112 $ 172 (35) % $ 556 $ 712 (22) % Loss and loss adjustment ratio 44.6 % 29.1 % 38.6 % 27.4 % Underwriting expense ratio 39.1 38.7 38.8 38.3 1 Combined ratio 83.7 % 67.
Slide 13: Domestic Bond & Specialty Insurance
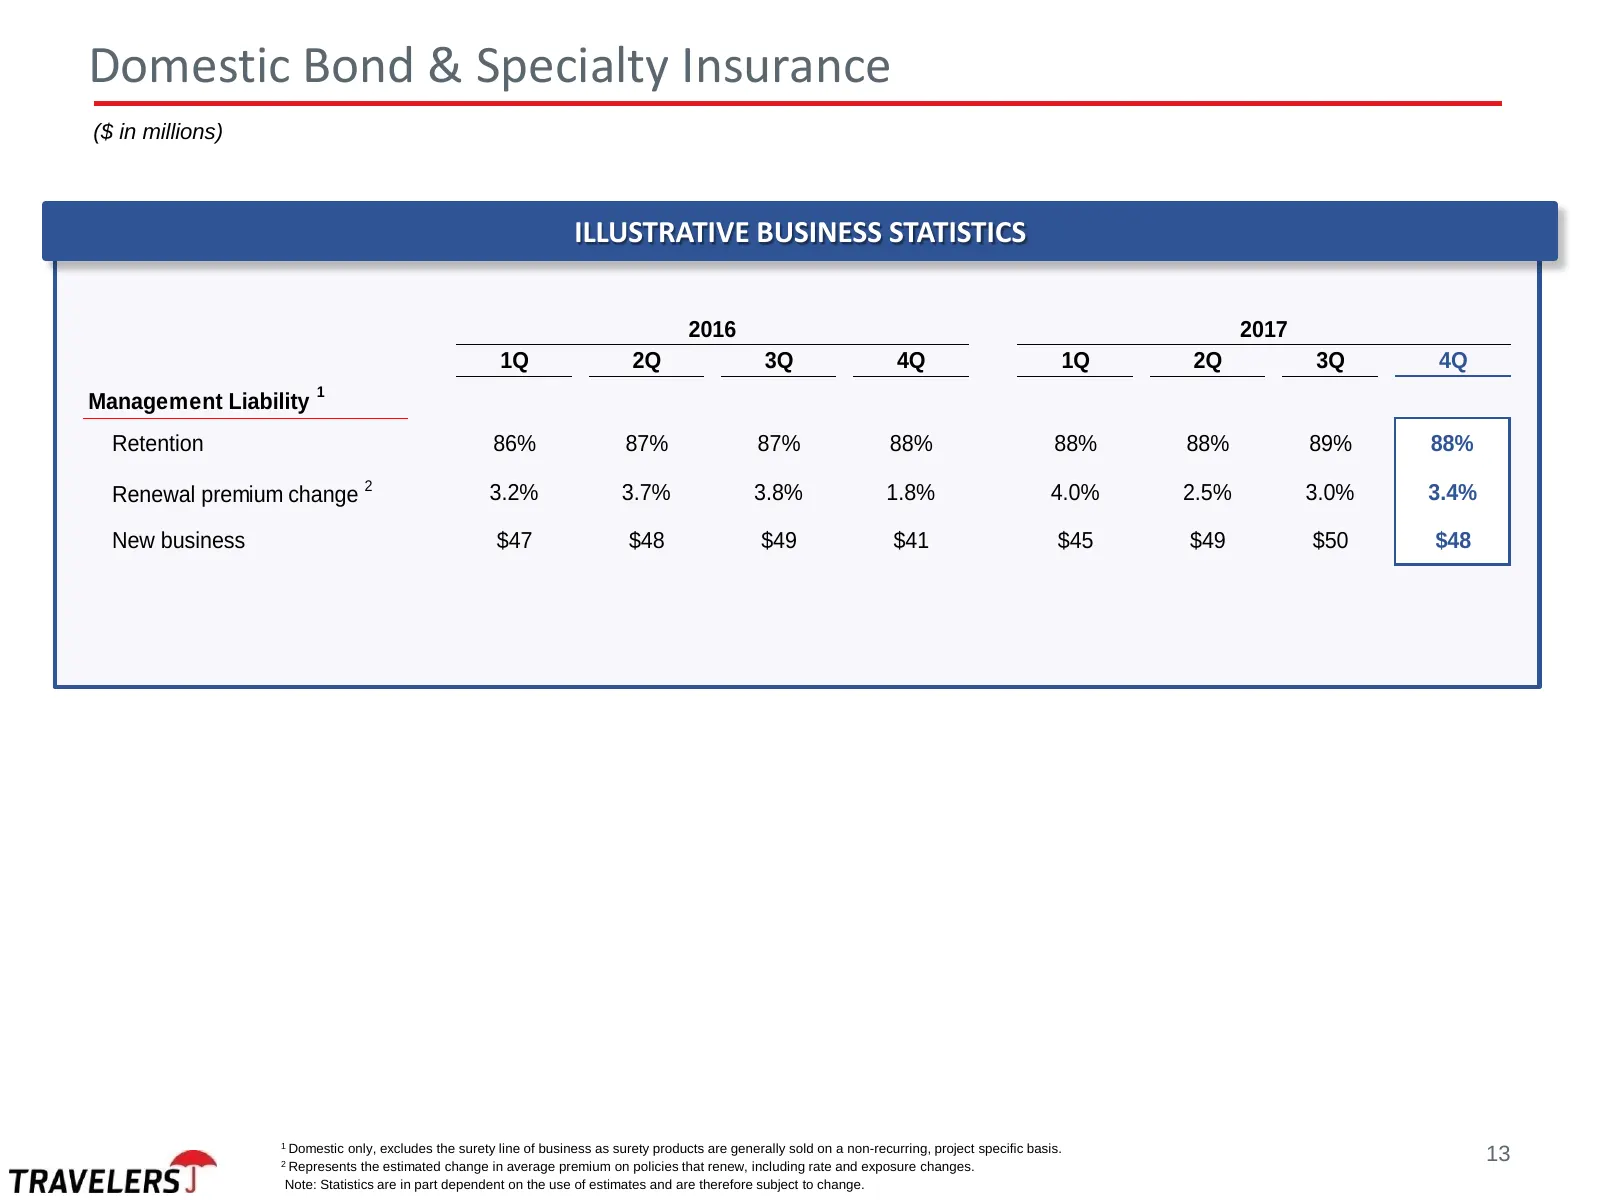
Domestic Bond & Specialty Insurance ($ in millions) ILLUSTRATIVE BUSINESS STATISTICS 2016 2017 1Q 2Q 3Q 4Q 1Q 2Q 3Q 4Q 1 Management Liability Retention 86% 87% 87% 88% 88% 88% 89% 88% Renewal premium change 2 3.2% 3.7% 3.8% 1.8% 4.0% 2.5% 3.0% 3.4% New business $47 $48 $49 $41 $45 $49 $50 $48 1 Dome
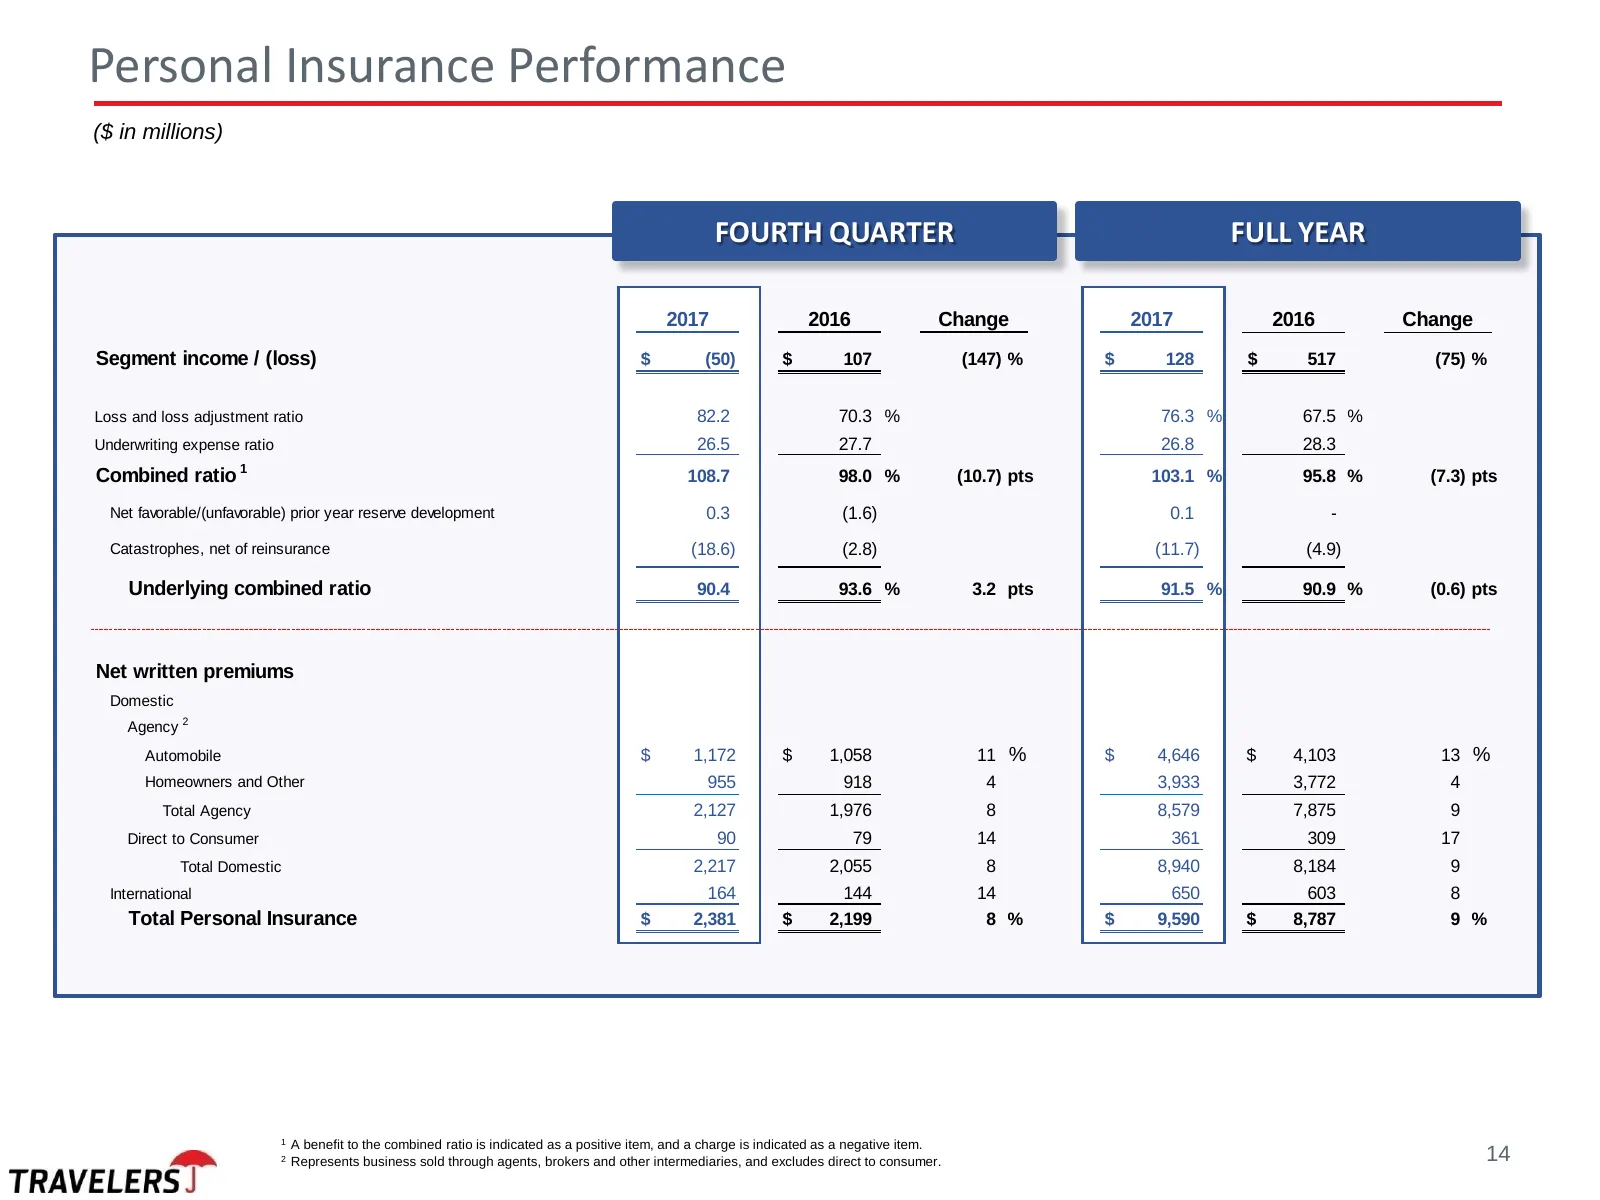
Slide 14: Personal Insurance Performance
Personal Insurance Performance ($ in millions) FOURTH QUARTER FULL YEAR 2017 2016 Change 2017 2016 Change Segment income / (loss) $ (50) $ 107 (147) % $ 128 $ 517 (75) % Loss and loss adjustment ratio 82.2 70.3 % 76.3 % 67.5 % Underwriting expense ratio 26.5 27.7 26.8 28.3 1 Combined ratio 108.7 98.
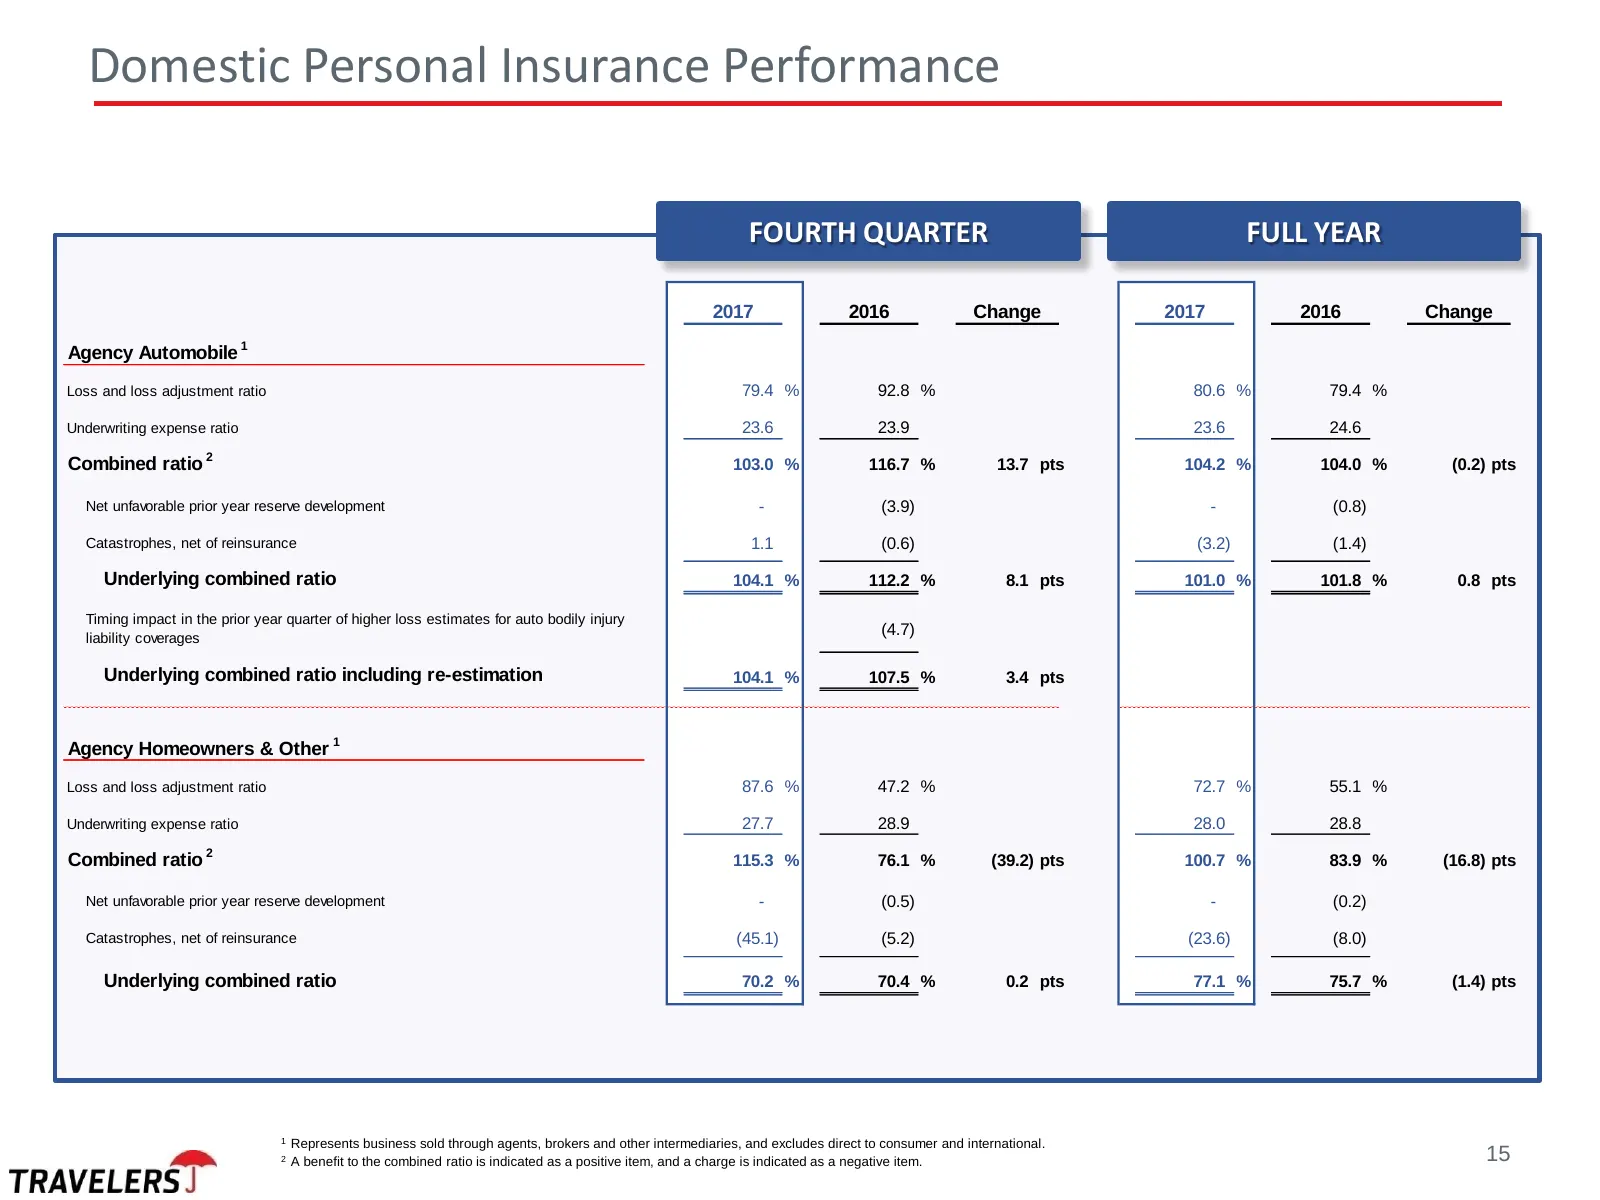
Slide 15: Domestic Personal Insurance Performance
Domestic Personal Insurance Performance FOURTH QUARTER FULL YEAR 2017 2016 Change 2017 2016 Change Agency Automobile 1 Loss and loss adjustment ratio 79.4 % 92.8 % 80.6 % 79.4 % Underwriting expense ratio 23.6 23.9 23.6 24.6 2 Combined ratio 103.0 % 116.7 % 13.7 pts 104.2 % 104.0 % (0.2) pts Net unf
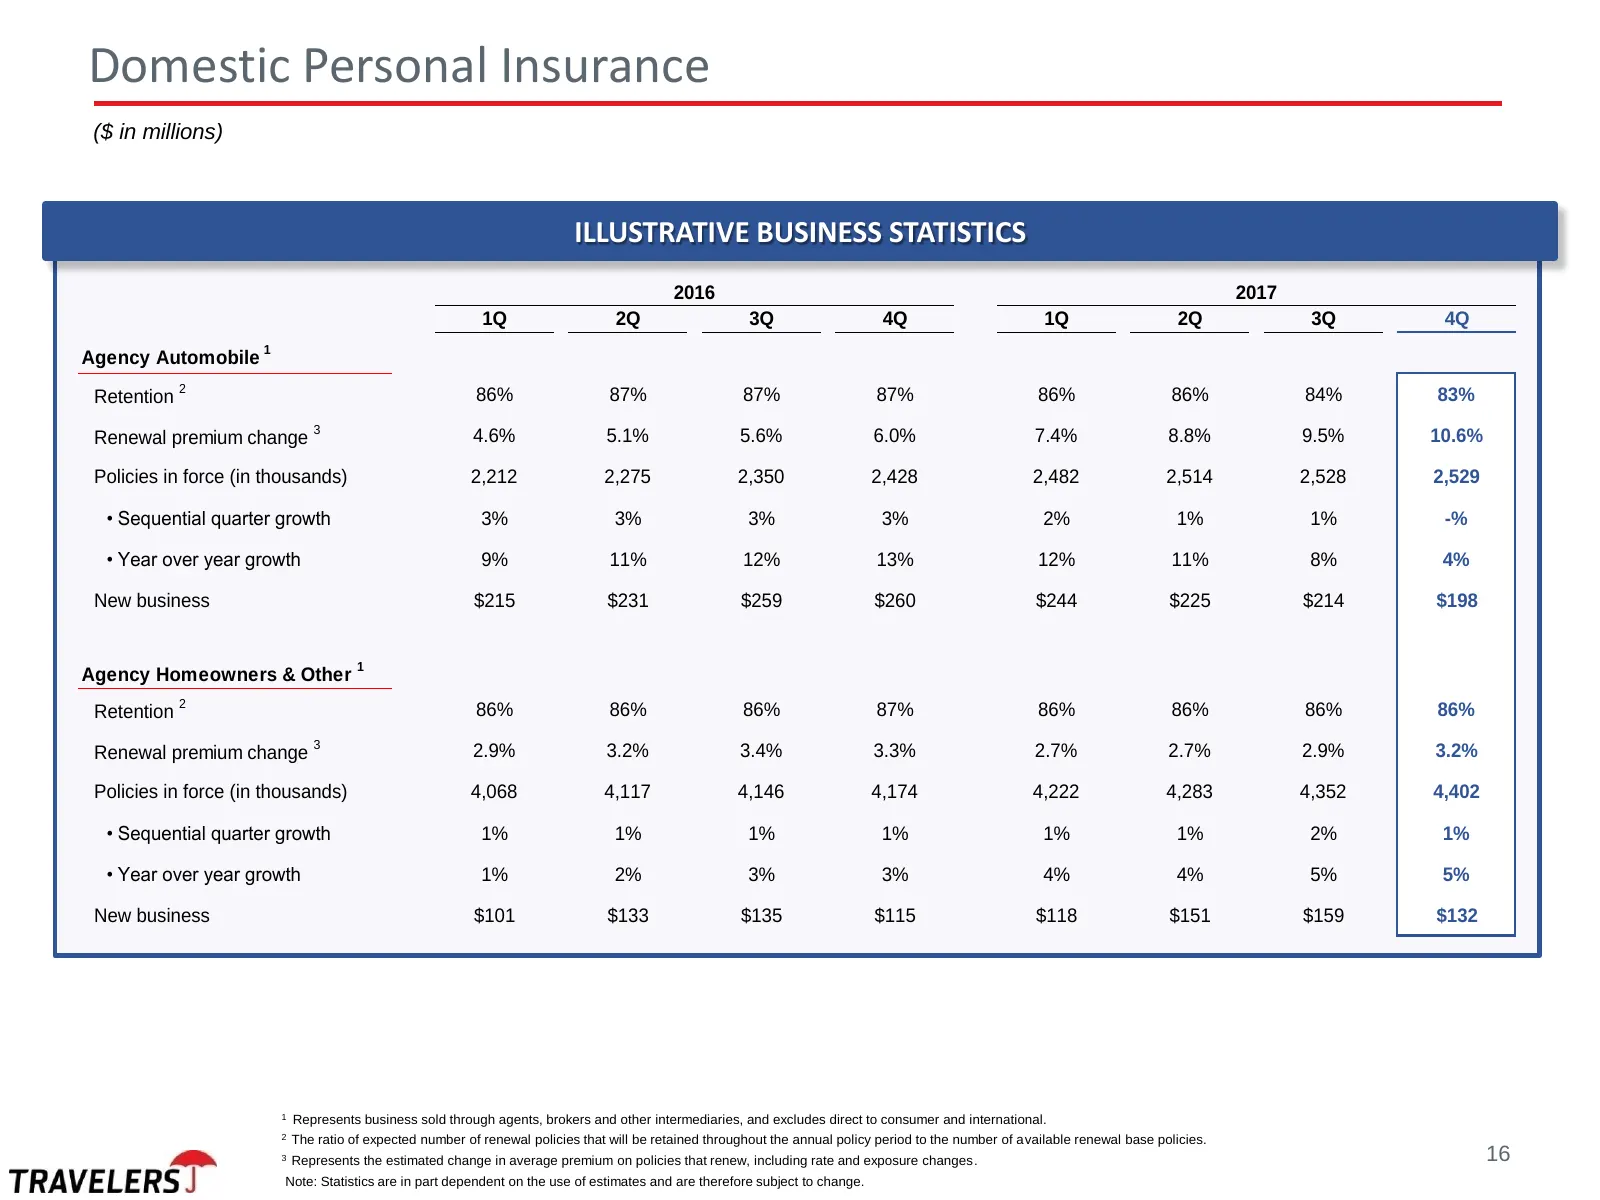
Slide 16: Domestic Personal Insurance
Domestic Personal Insurance ($ in millions) ILLUSTRATIVE BUSINESS STATISTICS 2016 2017 1Q 2Q 3Q 4Q 1Q 2Q 3Q 4Q 1 Agency Automobile Retention 2 86% 87% 87% 87% 86% 86% 84% 83% 3 Renewal premium change 4.6% 5.1% 5.6% 6.0% 7.4% 8.8% 9.5% 10.6% Policies in force (in thousands) 2,212 2,275 2,350 2,428 2,
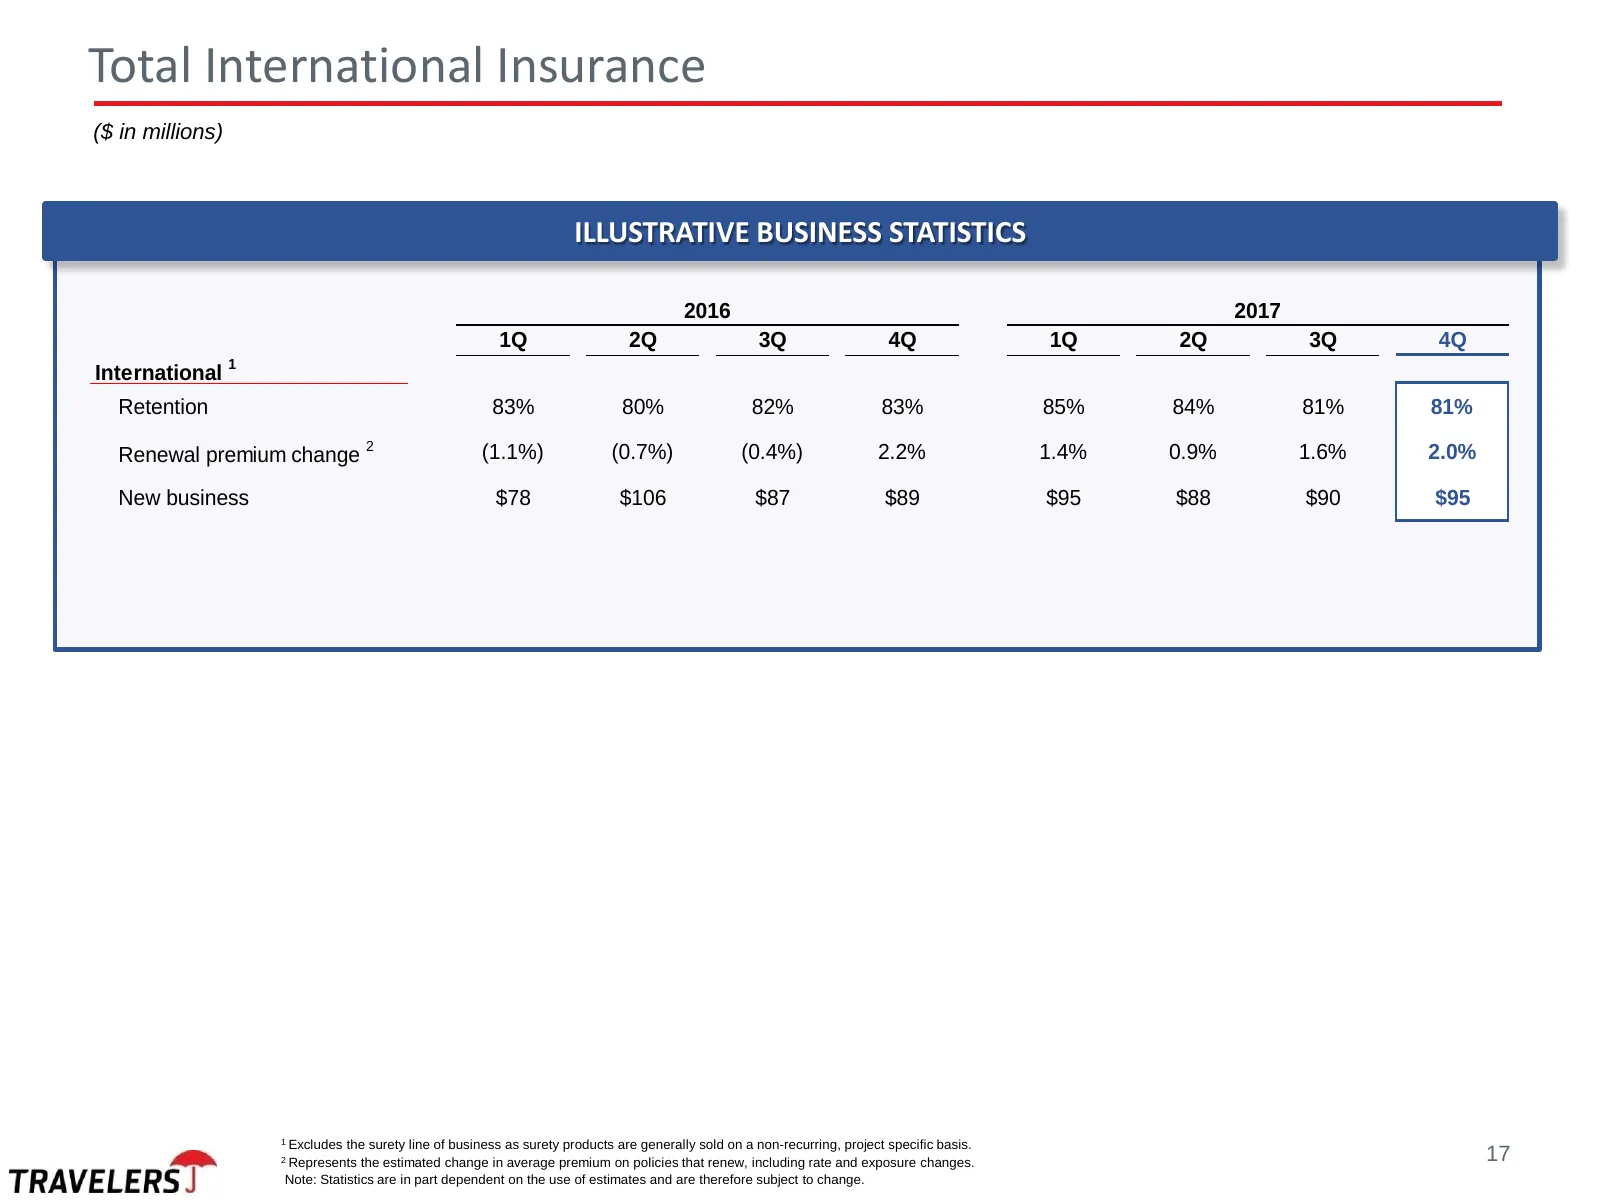
Slide 17: Total International Insurance
Total International Insurance ($ in millions) ILLUSTRATIVE BUSINESS STATISTICS 2016 2017 1Q 2Q 3Q 4Q 1Q 2Q 3Q 4Q International 1 Retention 83% 80% 82% 83% 85% 84% 81% 81% Renewal premium change 2 (1.1%) (0.7%) (0.4%) 2.2% 1.4% 0.9% 1.6% 2.0% New business $78 $106 $87 $89 $95 $88 $90 $95 1 Excludes t

Slide 18: Appendix
Appendix Additional Information Additional Information 18
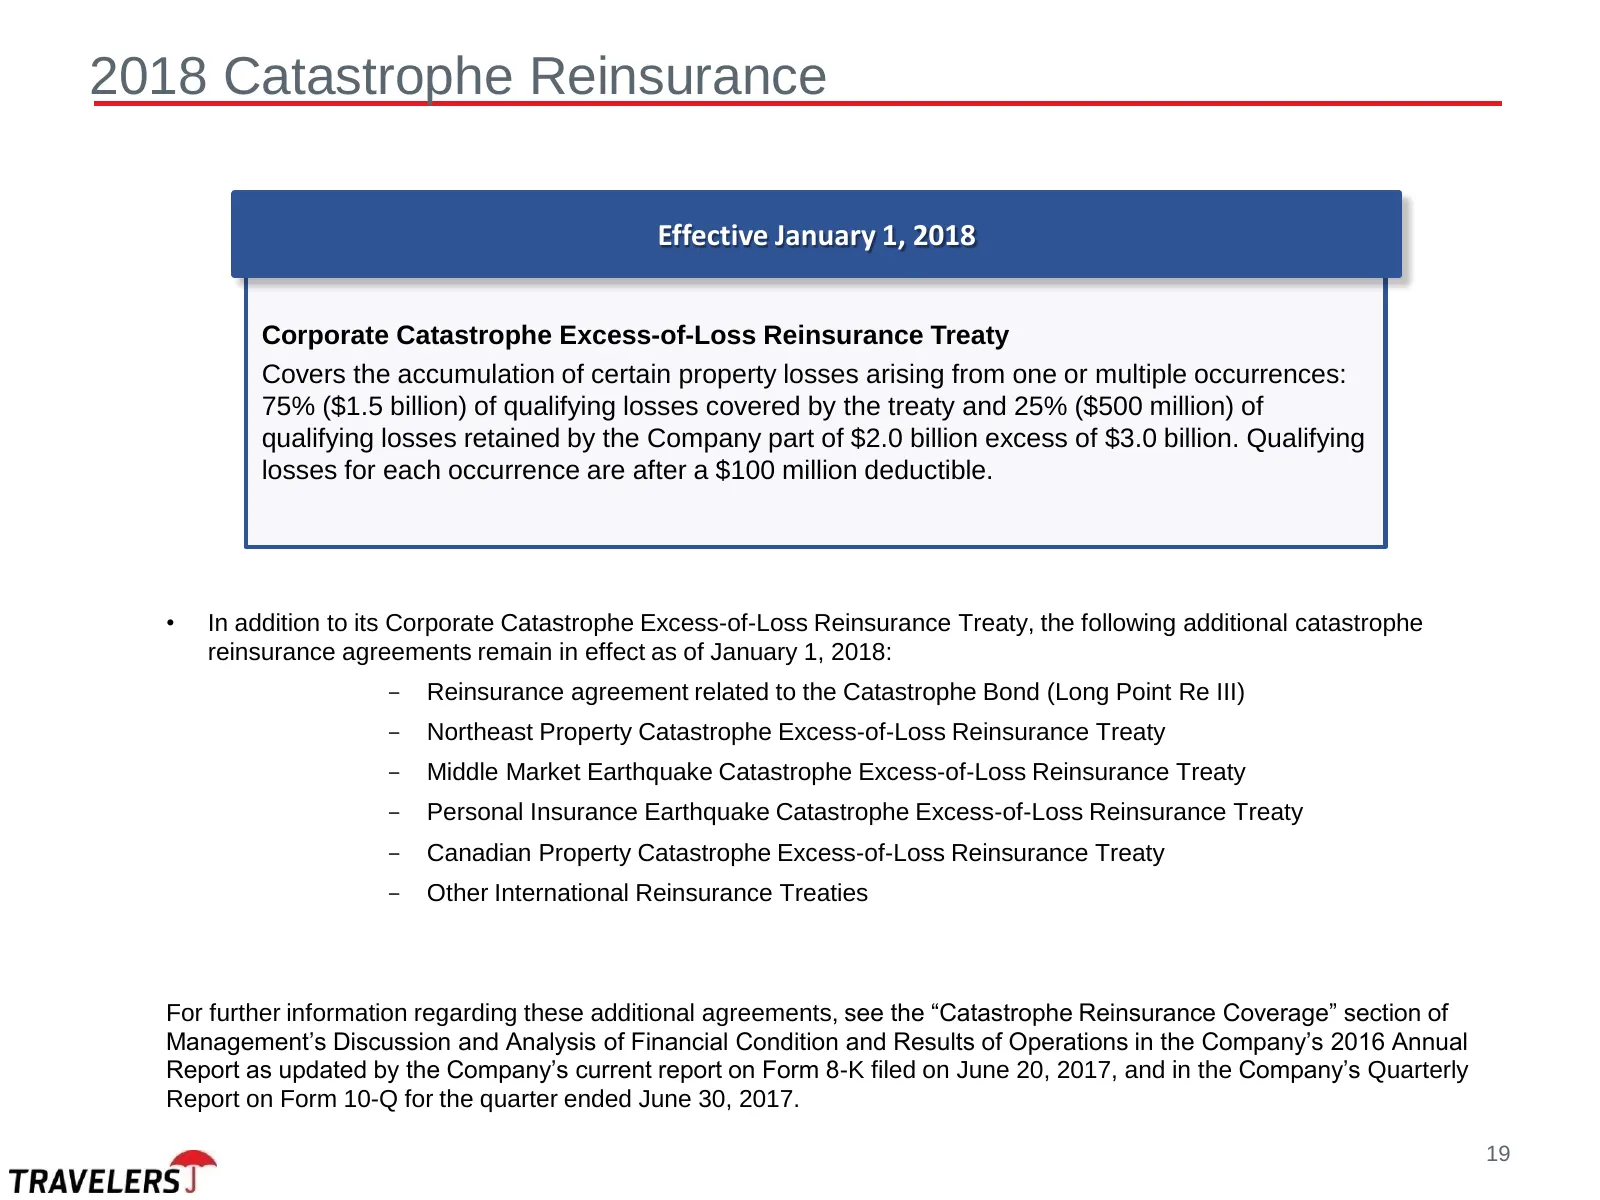
Slide 19: 2018 Catastrophe Reinsurance
2018 Catastrophe Reinsurance Effective January 1, 2018 Corporate Catastrophe Excess-of-Loss Reinsurance Treaty Covers the accumulation of certain property losses arising from one or multiple occurrences: 75% ($1.5 billion) of qualifying losses covered by the treaty and 25% ($500 million) of qualifyi
Slide 20: Explanatory Note
Explanatory Note This presentation contains, and management may make, certain “forward-looking statements” within the meaning of the Private Securities Litigation Reform Act of 1995. All statements, other than statements of historical facts, may be forward-looking statements. Words such as “may,” “w
Slide 21: Disclosure
Disclosure In this presentation, we may refer to some non-GAAP financial measures. For a reconciliation of these measures to the most comparable GAAP measures and a glossary of financial measures, we refer you to the press release and financial supplement that we have made available in connection wi

Slide 22: investor.travelers.com
investor.travelers.com
Source: company website
More decks from The Travelers Companies, Inc.
 Q3 2026 Earnings Presentation22 slides · Oct 16, 2026
 Q2 2026 Earnings Presentation24 slides · Jul 17, 2026
 Q1 2026 Earnings Presentation22 slides · Apr 16, 2026
 Q4 2025 Earnings Presentation27 slides · Jan 21, 2026
 Q3 2025 Earnings Presentation21 slides · Oct 16, 2025
 Q2 2025 Earnings Presentation22 slides · Jul 17, 2025