SGL Carbon SE · XETR:SGL
SGL Carbon — FY2021 Earnings Presentation
35 slides from SGL Carbon's earnings presentation, Mar 24, 2022
Slide 1: 2021 Results Investor & Analyst Conference Call
2021 Results Investor & Analyst Conference Call Dr. Torsten Derr (CEO) Thomas Dippold (CFO) Wiesbaden I March 24, 2022
Slide 2: Agenda
Agenda 1. Results 2021 2. Restructuring Program 3. Challenges 4. Outlook 2022 5. Mid-Term Plan 6. Summary 7. Backup 2
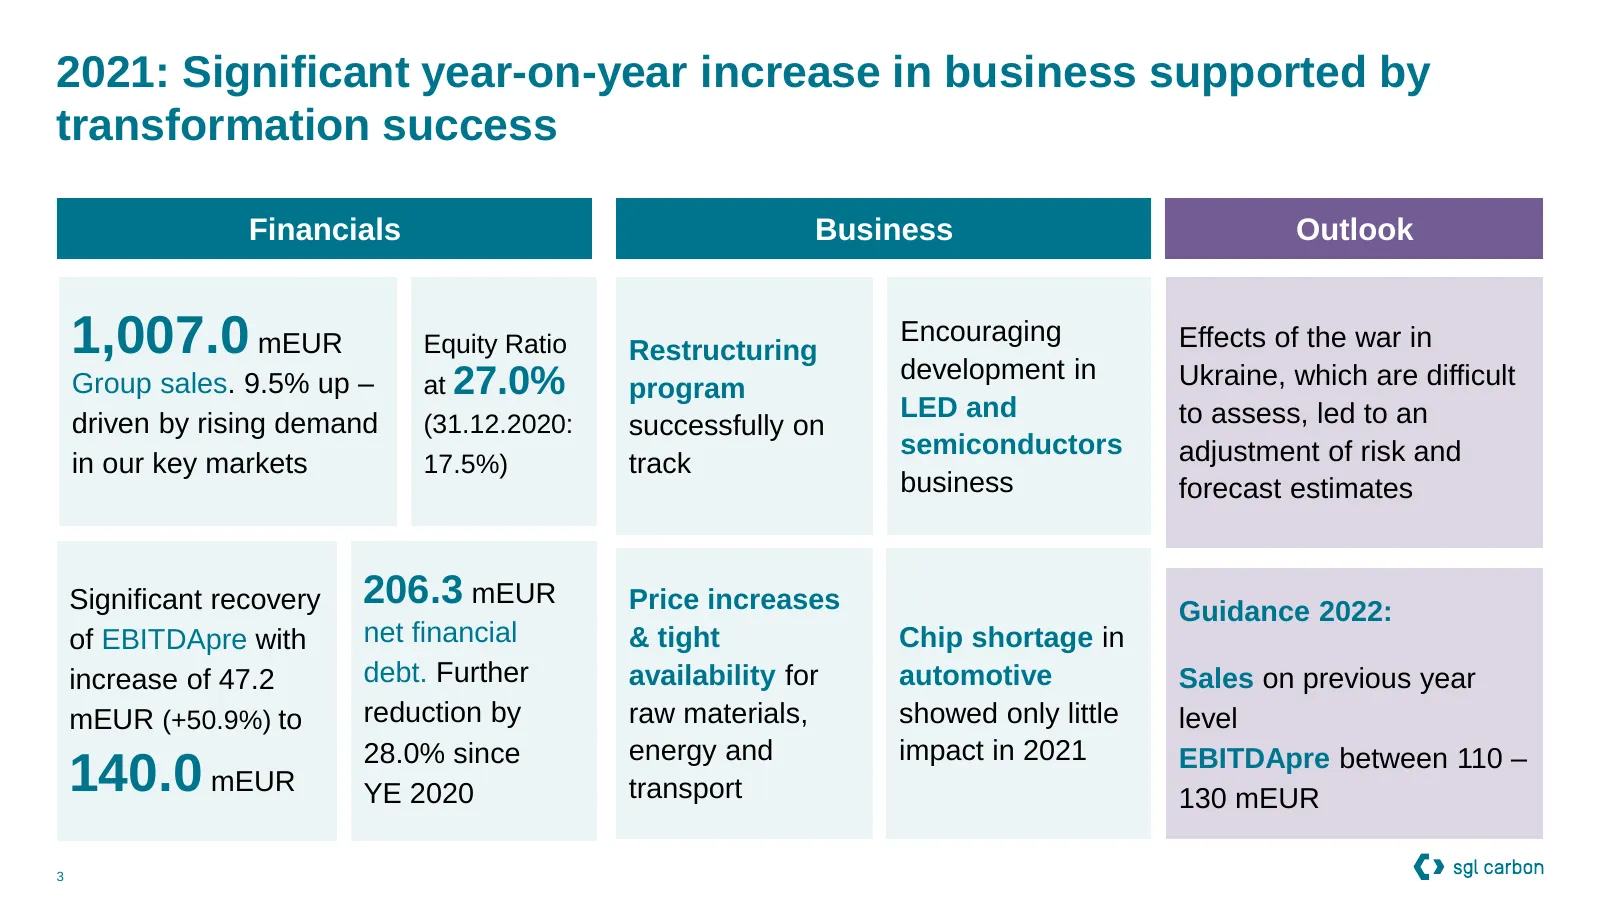
Slide 3: 2021: Significant year-on-year increase in business supported by transformation success
2021: Significant year-on-year increase in business supported by transformation success Financials Business Outlook 1,007.0 mEUR Equity Ratio Restructuring Encouraging development in Effects of the war in Group sales. 9.5% up – at 27.0% program Ukraine, which are difficult LED and to assess, led to
Slide 4: Results 2021
1 Results 2021 „Increased guidance achieved“ 4
Slide 5: 2021: Significant year-on-year increase in business supported by transformation success
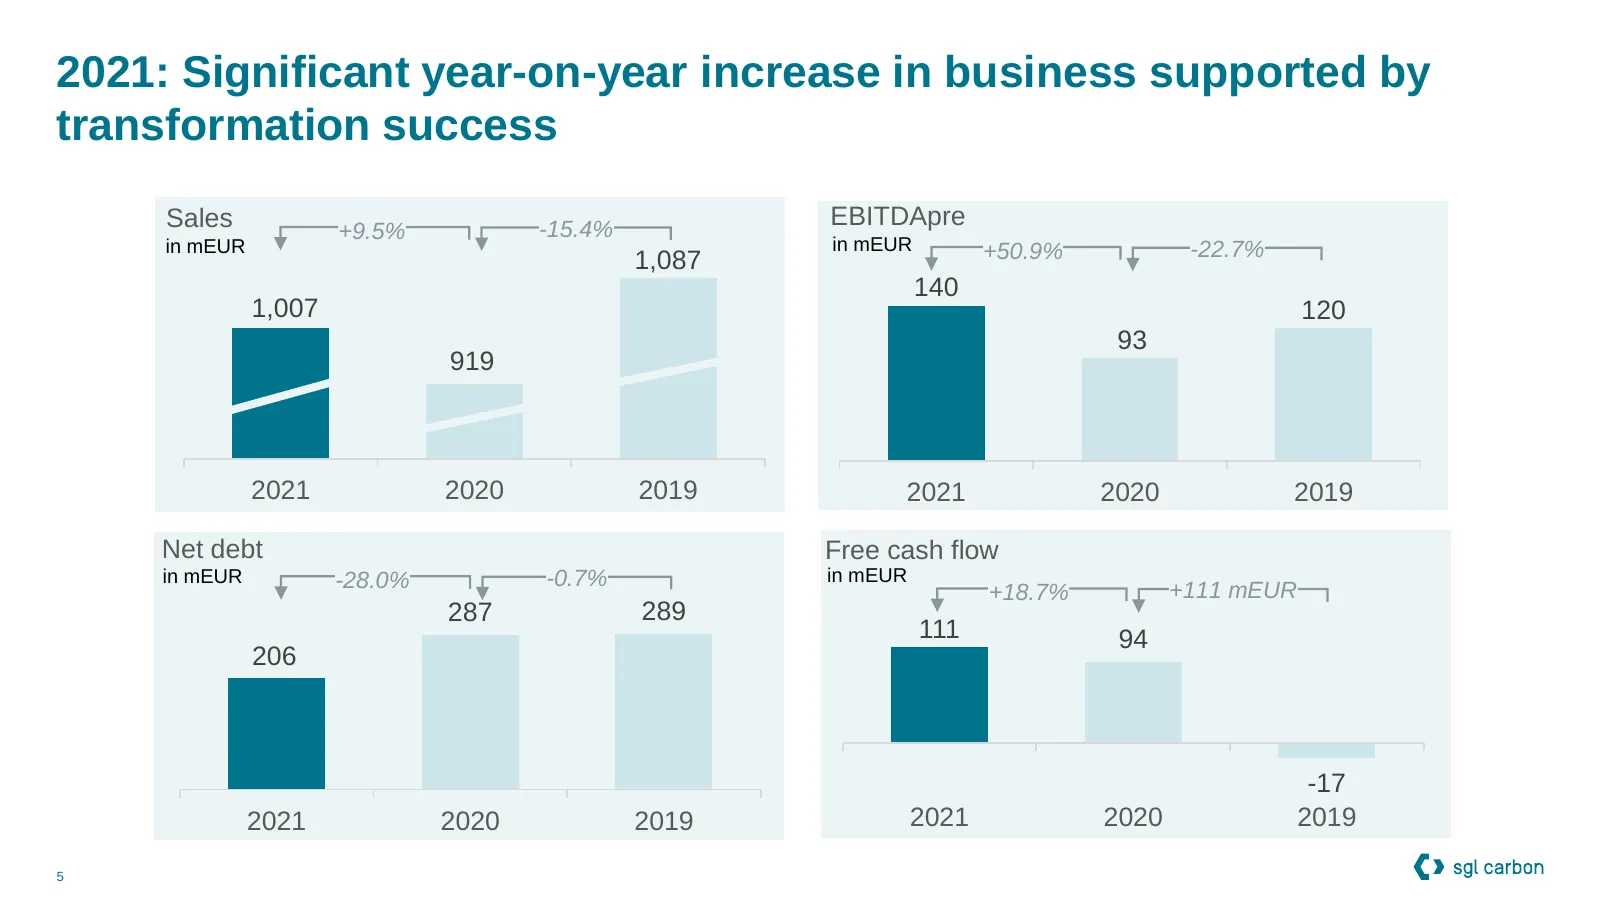
2021: Significant year-on-year increase in business supported by transformation success Sales -15.4% EBITDApre +9.5% in mEUR in mEUR +50.9% -22.7% 1,087 140 1,007 120 93 919 2021 2020 2019 2021 2020 2019 Net debt Free cash flow in mEUR -28.0% -0.7% in mEUR +18.7% +111 mEUR 287 289 111 94 206 -17 202
Slide 6: SGL Carbon – Profitability growth exceeds sales growth
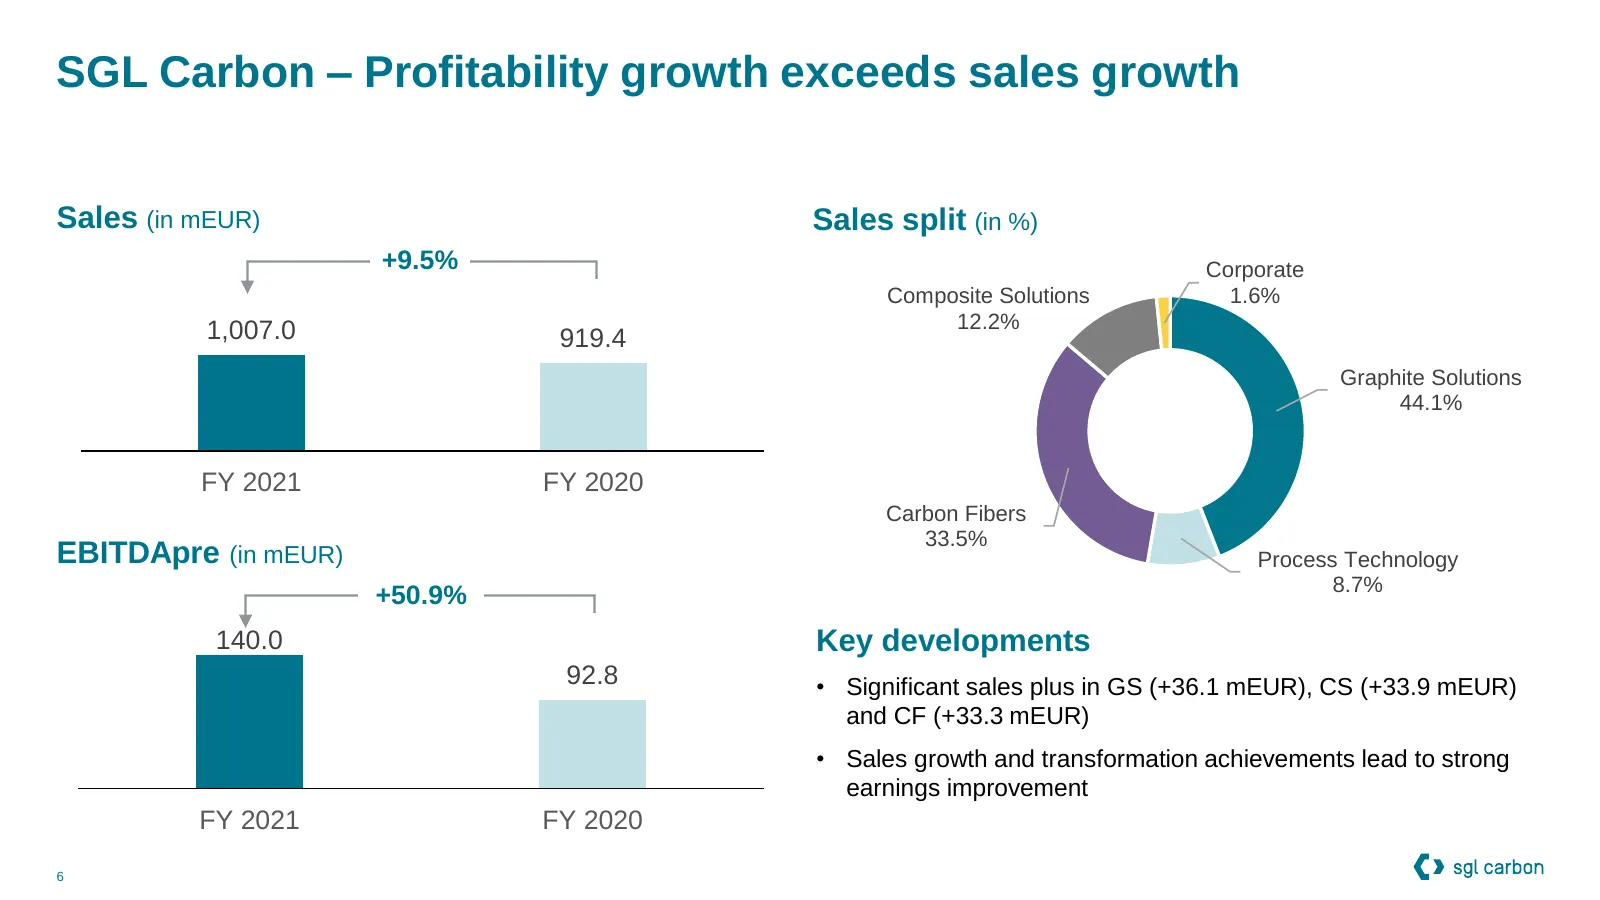
SGL Carbon – Profitability growth exceeds sales growth Sales (in mEUR) Sales split (in %) +9.5% Corporate Composite Solutions 1.6% 1,007.0 12.2% 919.4 Graphite Solutions 44.1% FY 2021 FY 2020 Carbon Fibers 33.5% EBITDApre (in mEUR) Process Technology 8.7% +50.9% 140.0 Key developments 92.8 • Signifi
Slide 7: Graphite Solutions (GS) – Semiconductor strong
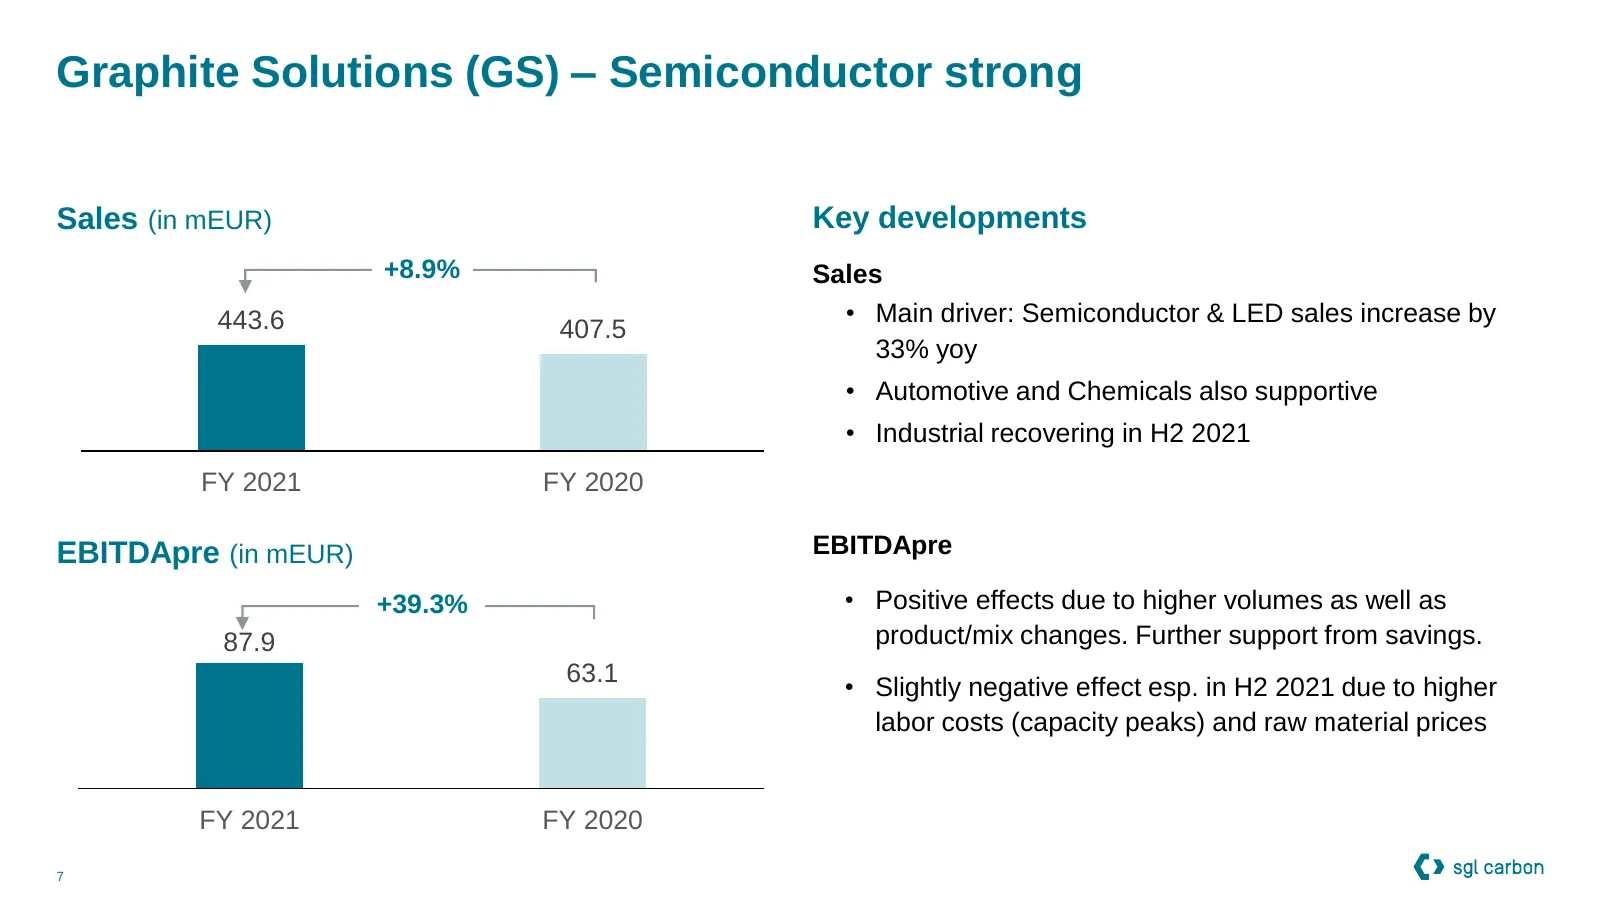
Graphite Solutions (GS) – Semiconductor strong Sales (in mEUR) Key developments +8.9% Sales 443.6 • Main driver: Semiconductor & LED sales increase by 407.5 33% yoy • Automotive and Chemicals also supportive • Industrial recovering in H2 2021 FY 2021 FY 2020 EBITDApre (in mEUR) EBITDApre +39.3% • Po
Slide 8: Process Technology (PT) – Demand remains on prior year level
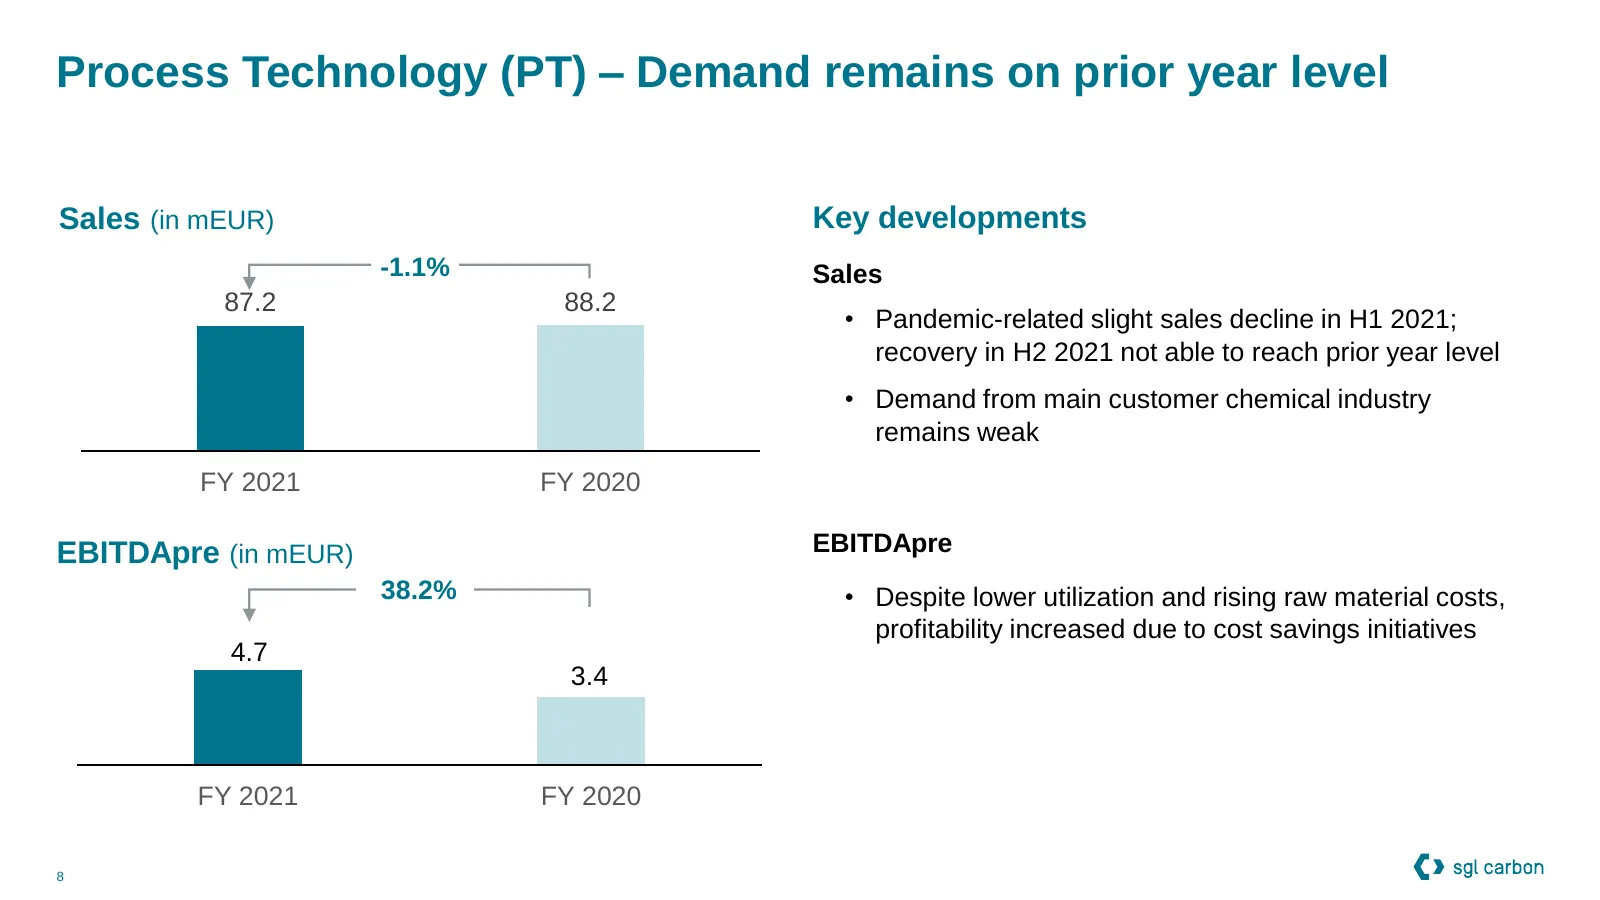
Process Technology (PT) – Demand remains on prior year level Sales (in mEUR) Key developments -1.1% Sales 87.2 88.2 • Pandemic-related slight sales decline in H1 2021; recovery in H2 2021 not able to reach prior year level • Demand from main customer chemical industry remains weak FY 2021 FY 2020 EB
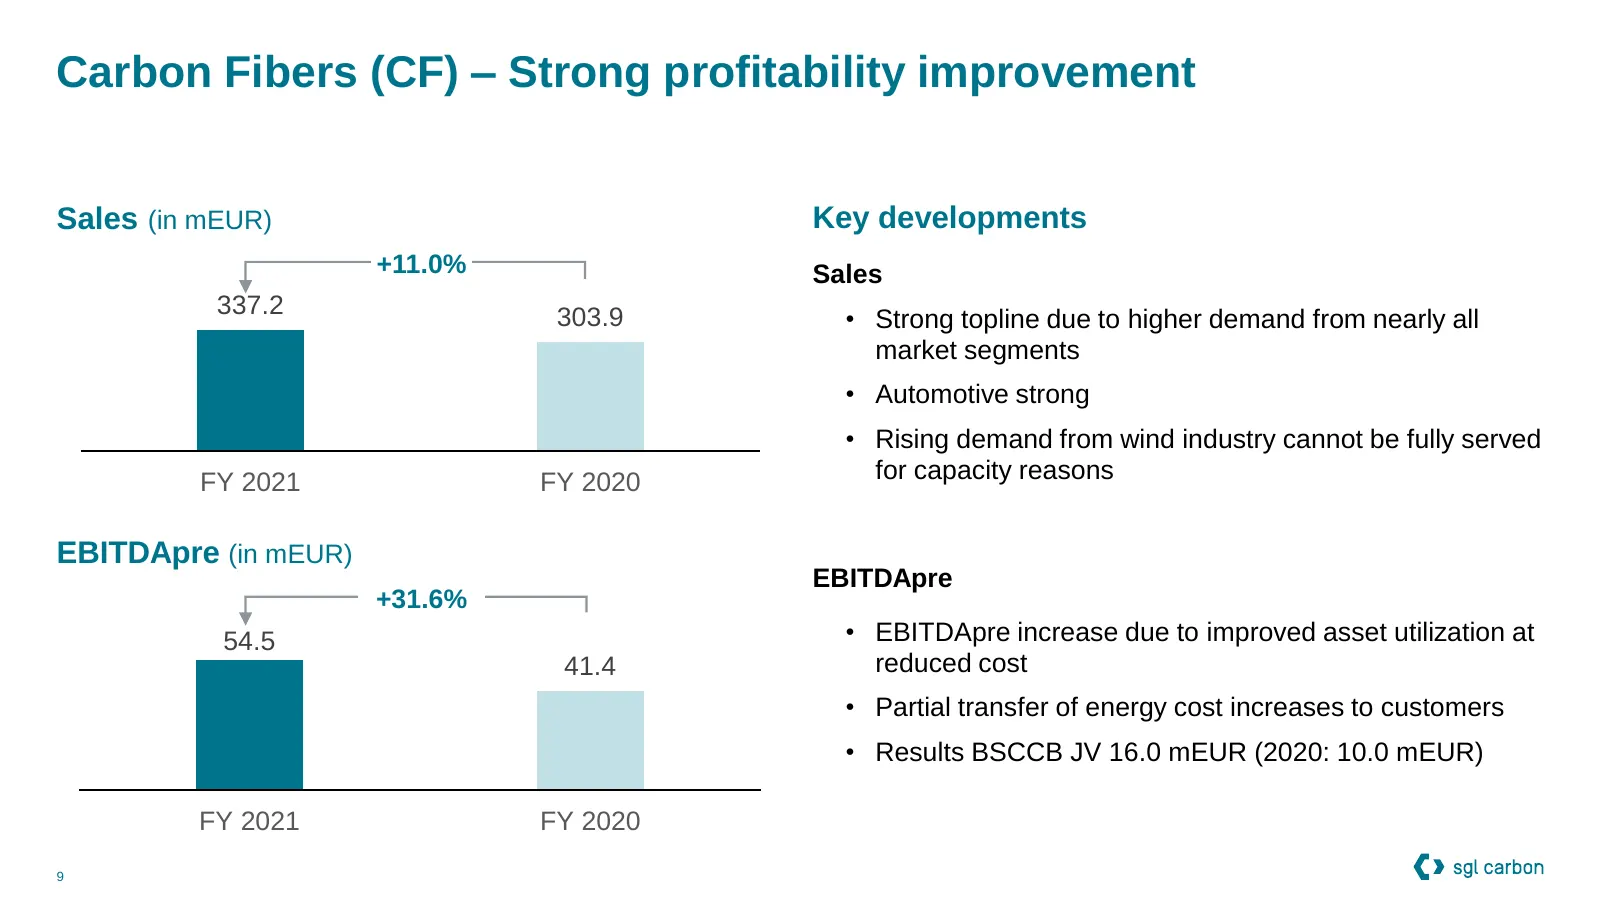
Slide 9: Carbon Fibers (CF) – Strong profitability improvement
Carbon Fibers (CF) – Strong profitability improvement Sales (in mEUR) Key developments +11.0% Sales 337.2 303.9 • Strong topline due to higher demand from nearly all market segments • Automotive strong • Rising demand from wind industry cannot be fully served FY 2021 FY 2020 for capacity reasons EBI
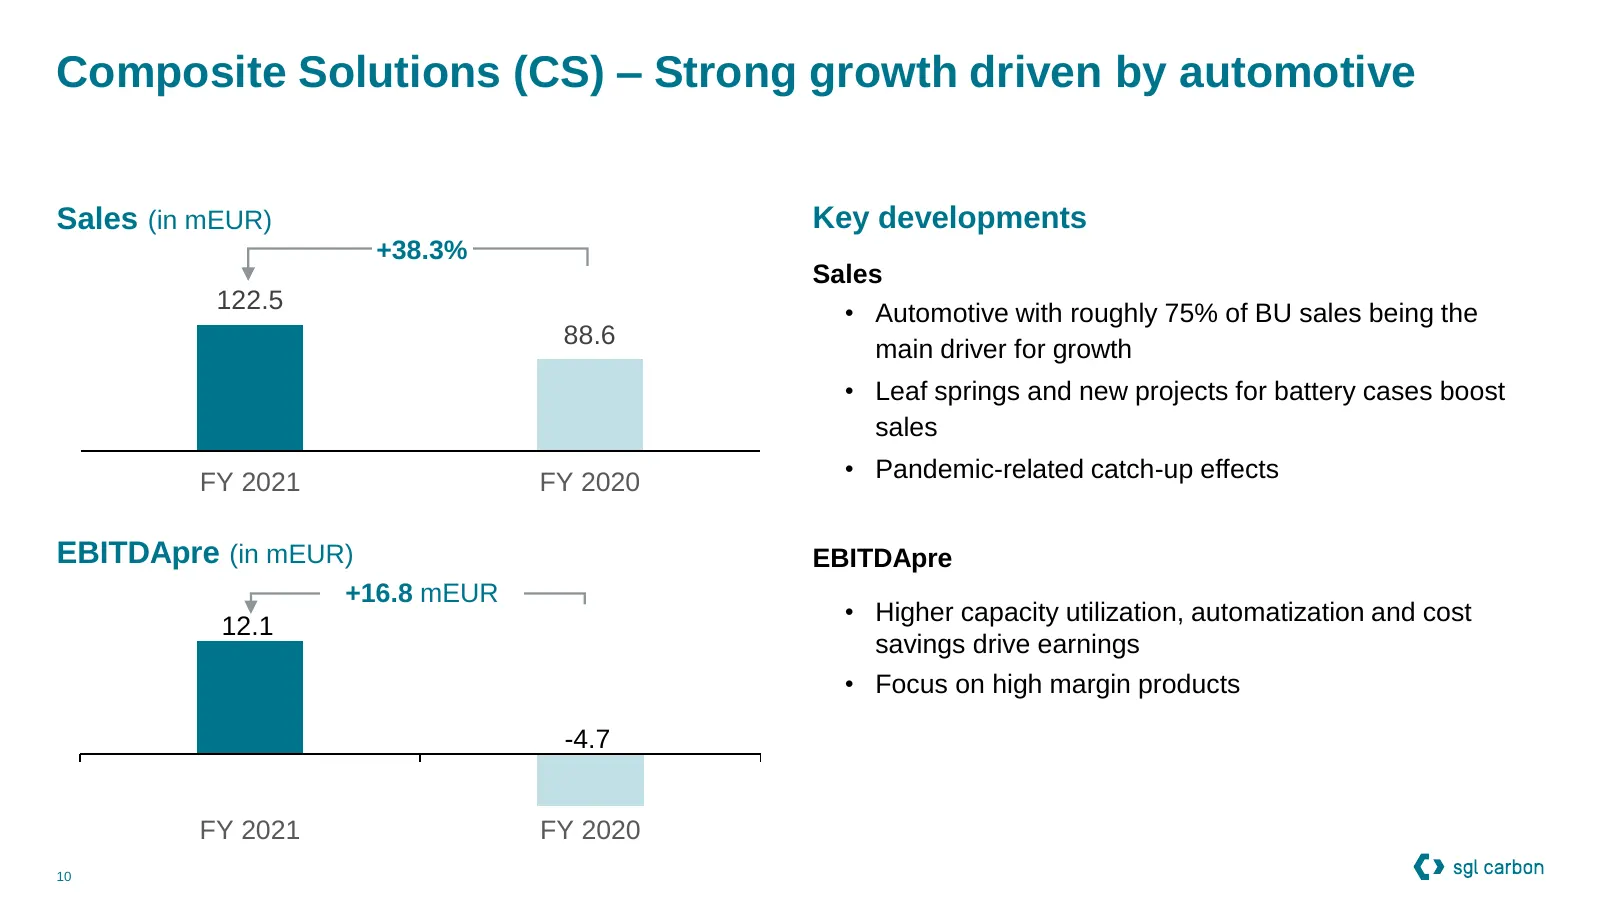
Slide 10: Composite Solutions (CS) – Strong growth driven by automotive
Composite Solutions (CS) – Strong growth driven by automotive Sales (in mEUR) Key developments +38.3% Sales 122.5 • Automotive with roughly 75% of BU sales being the 88.6 main driver for growth • Leaf springs and new projects for battery cases boost sales FY 2021 FY 2020 • Pandemic-related catch-up
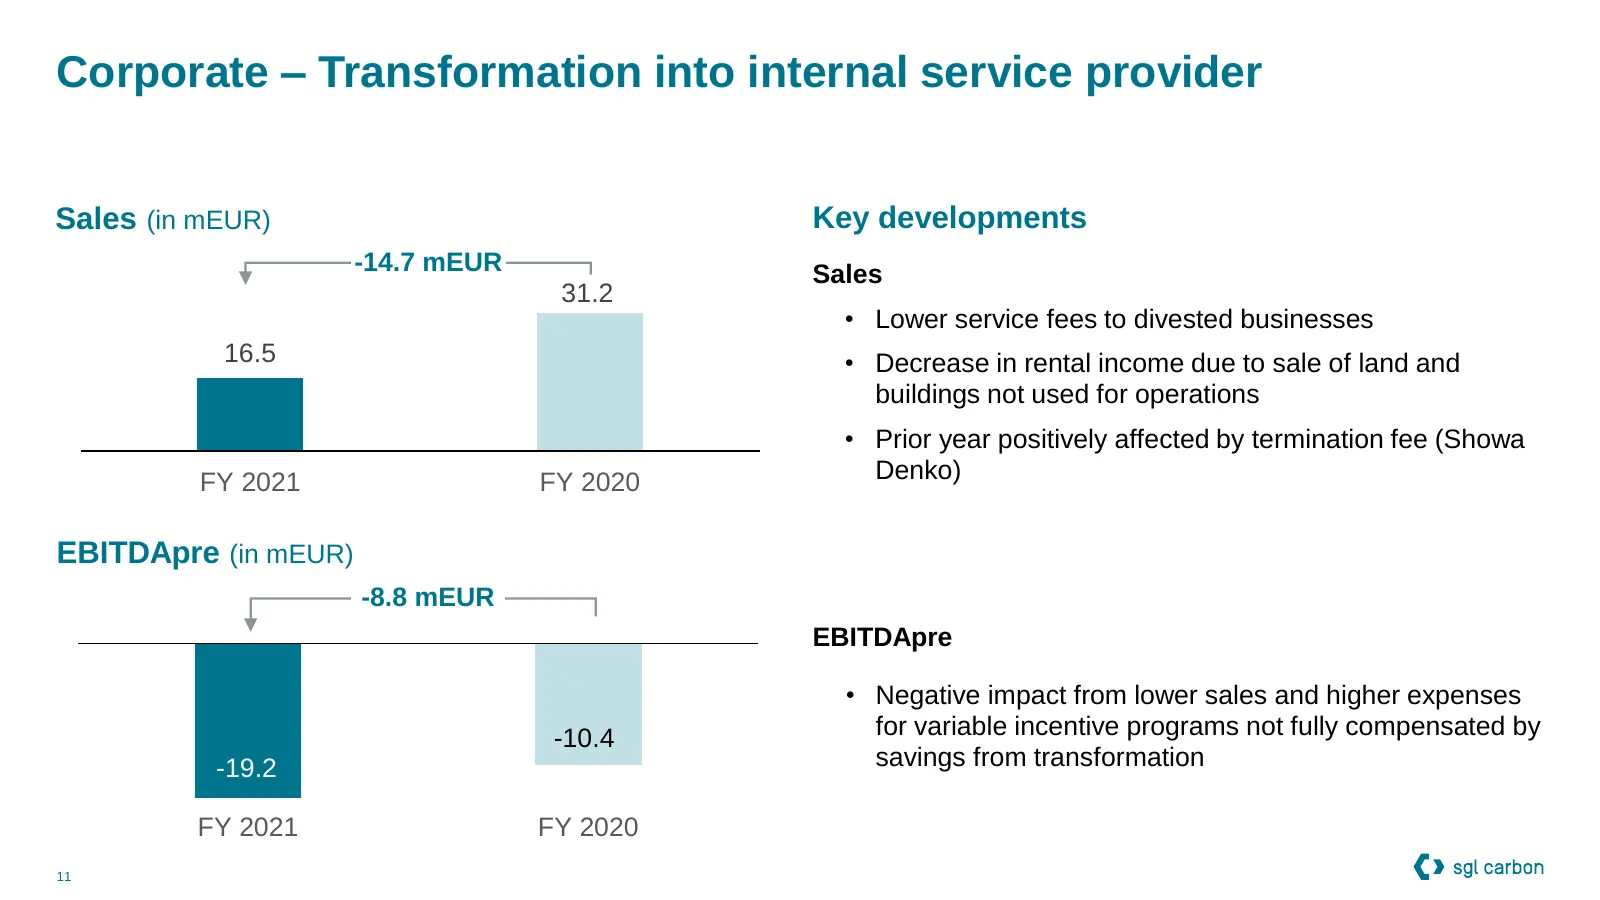
Slide 11: Corporate – Transformation into internal service provider
Corporate – Transformation into internal service provider Sales (in mEUR) Key developments -14.7 mEUR Sales 31.2 • Lower service fees to divested businesses 16.5 • Decrease in rental income due to sale of land and buildings not used for operations • Prior year positively affected by termination fee
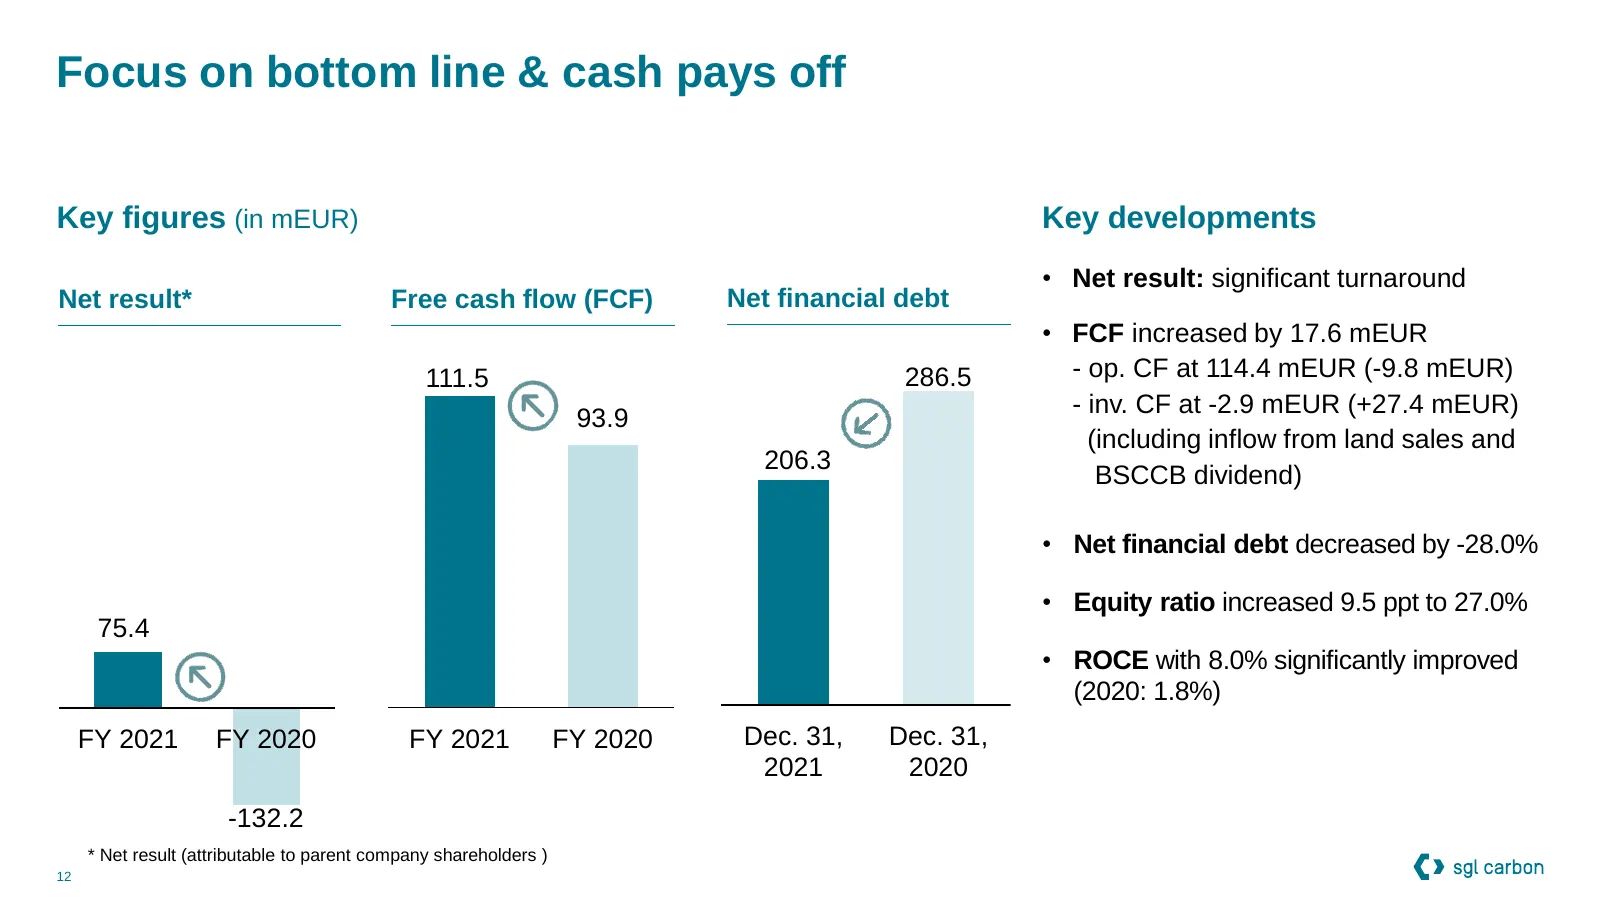
Slide 12: Focus on bottom line & cash pays off
Focus on bottom line & cash pays off Key figures (in mEUR) Key developments • Net result: significant turnaround Net result* Free cash flow (FCF) Net financial debt • FCF increased by 17.6 mEUR 111.5 286.5 - op. CF at 114.4 mEUR (-9.8 mEUR) - inv. CF at -2.9 mEUR (+27.4 mEUR) 93.9 (including inflow
Slide 13: Reconciliation between EBITDApre and EBIT
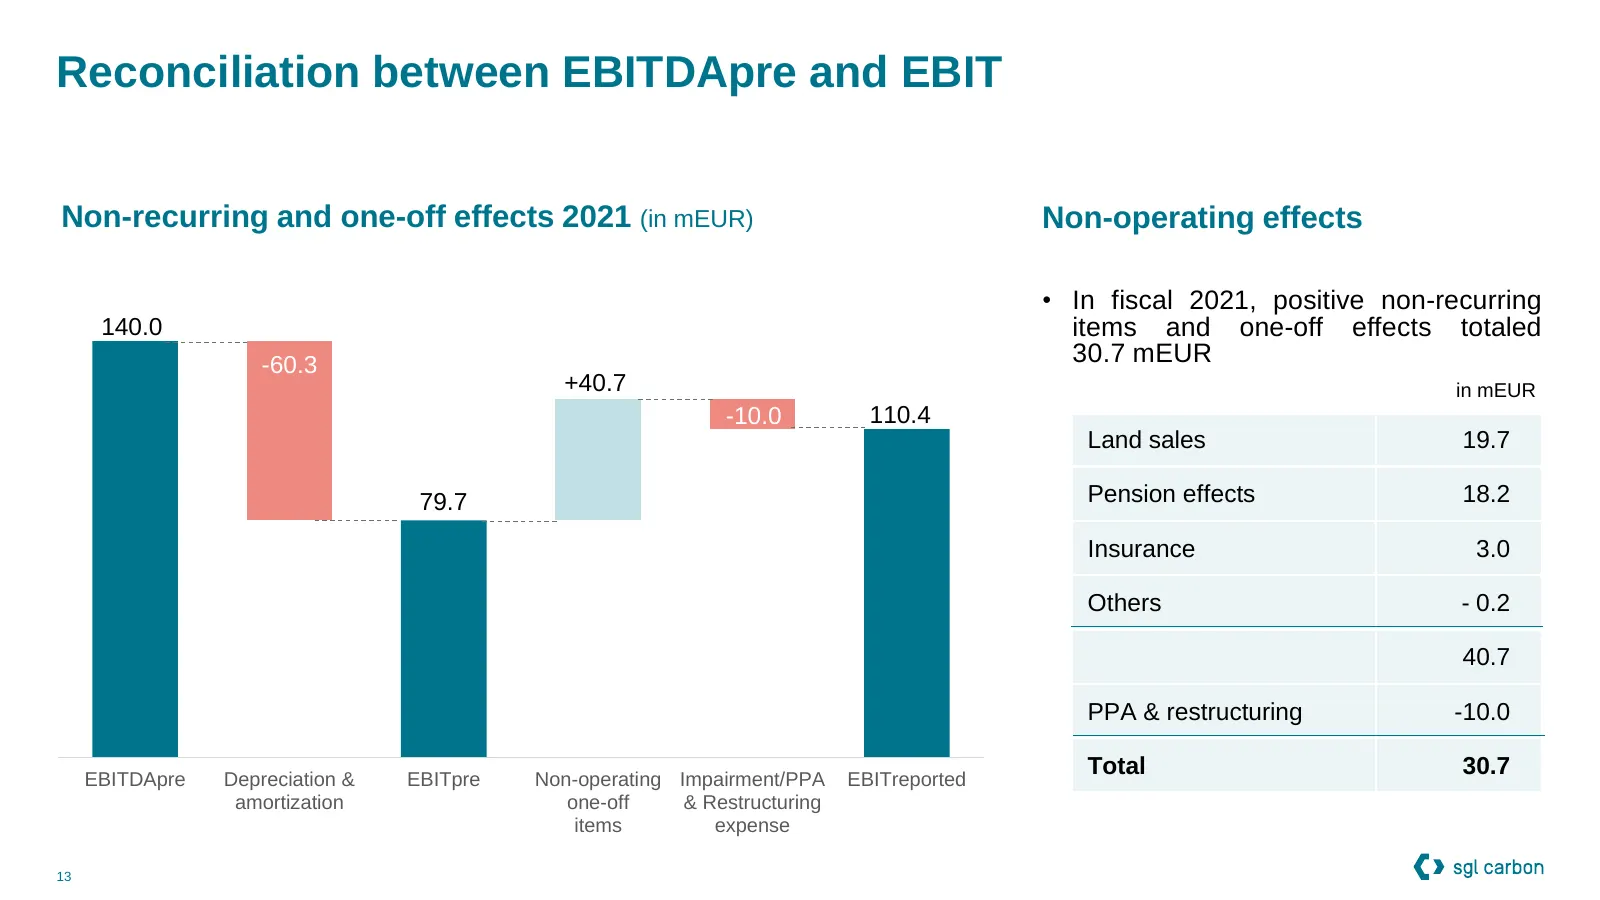
Reconciliation between EBITDApre and EBIT Non-recurring and one-off effects 2021 (in mEUR) Non-operating effects • In fiscal 2021, positive non-recurring 140.0 items and one-off effects totaled -60.3 30.7 mEUR +40.7 -10.0 in mEUR -60.3 -10.0 110.4 Land sales 19.7 79.7 Pension effects 18.2 Insurance
Slide 14: All set targets for 2021 exceeded
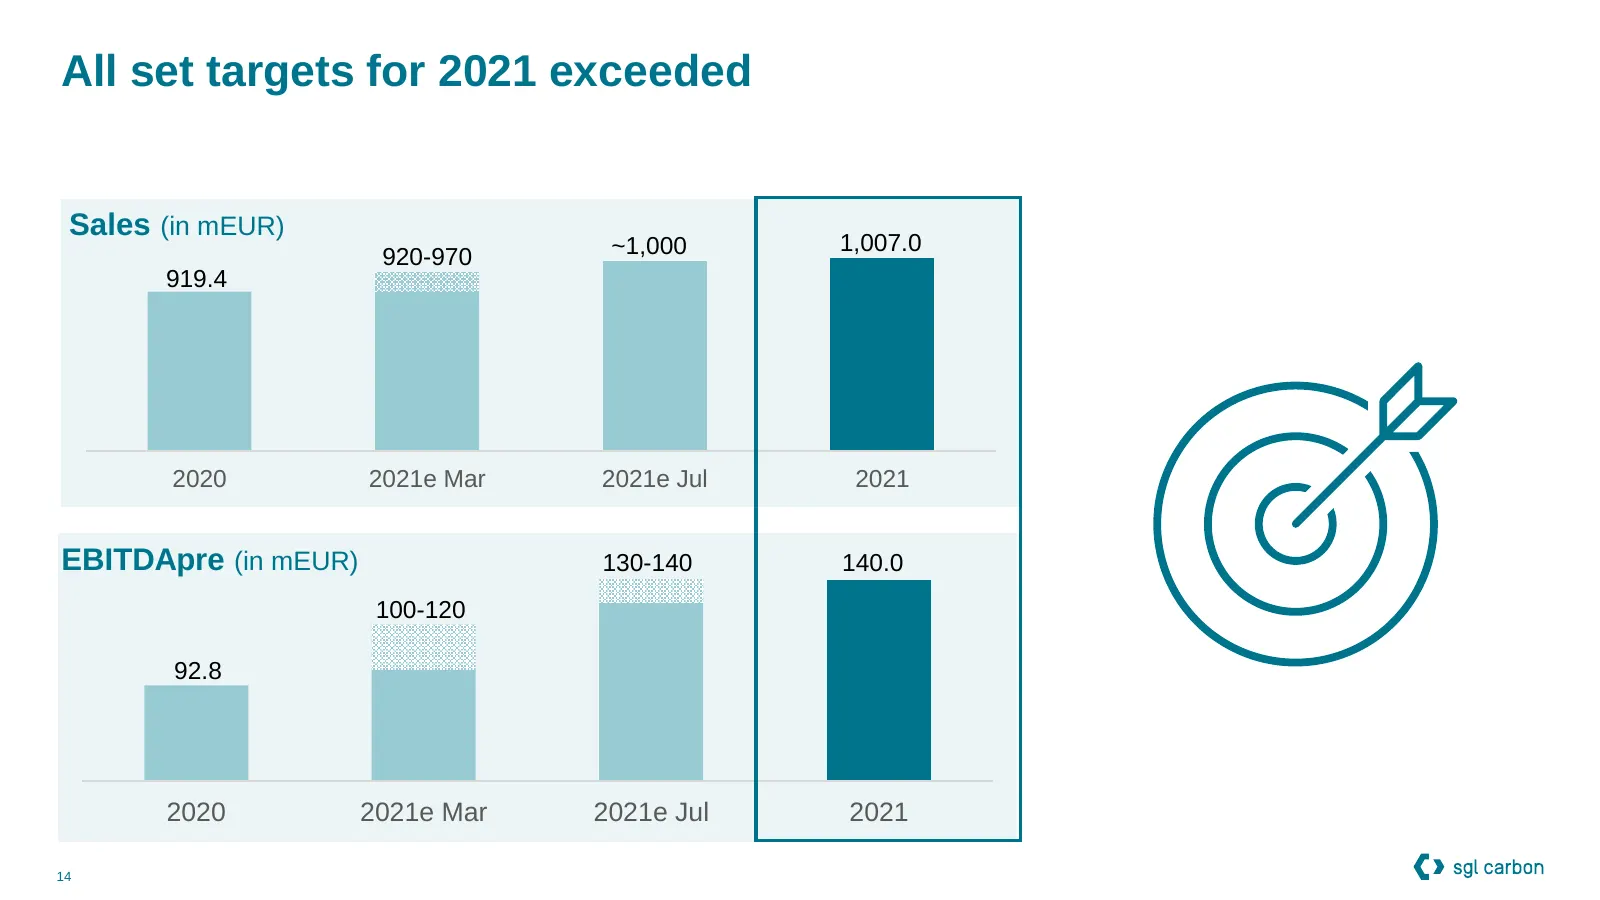
All set targets for 2021 exceeded Sales (in mEUR) 1,007.0 920-970 ~1,000 919.4 2020 2021e Mar 2021e Jul 2021 EBITDApre (in mEUR) 130-140 140.0 100-120 92.8 2020 2021e Mar 2021e Jul 2021 14
Slide 15: Restructuring Program
2 Restructuring Program “Transformation on track” 15
Slide 16: Transformation targets achieved
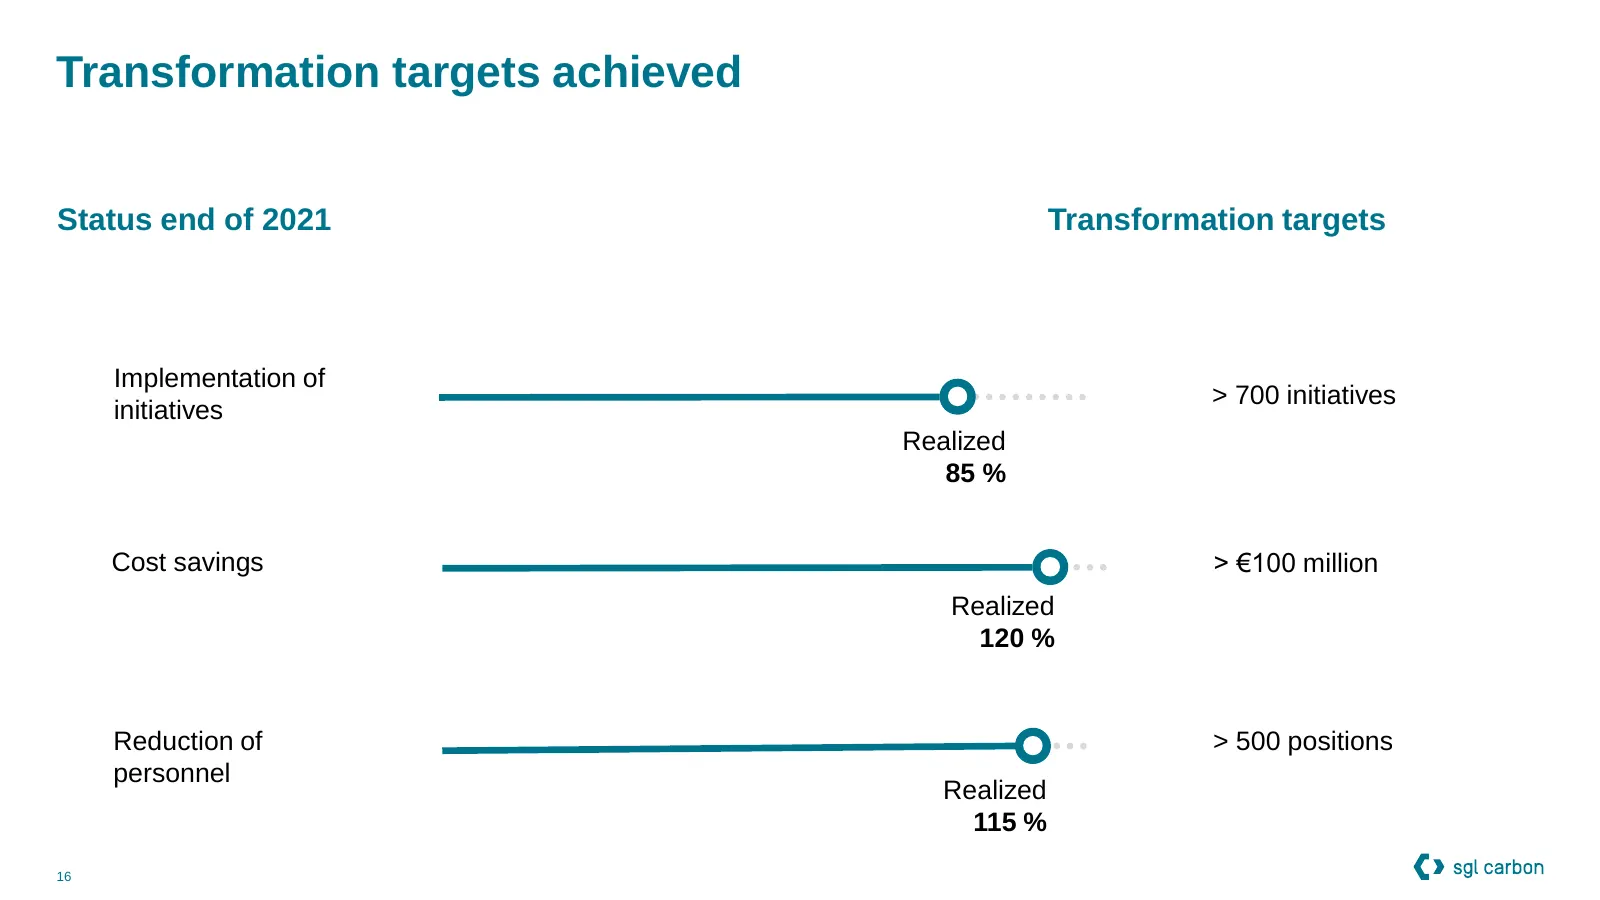
Transformation targets achieved Status end of 2021 Transformation targets Implementation of > 700 initiatives initiatives Realized 85 % Cost savings > €100 million Realized 120 % Reduction of > 500 positions personnel Realized 115 % 16
Slide 17: Challenges 2022
3 Challenges 2022 “Operational challenges manageable, geopolitical effects difficult to predict“ 17
Slide 18: Input costs rising strongly
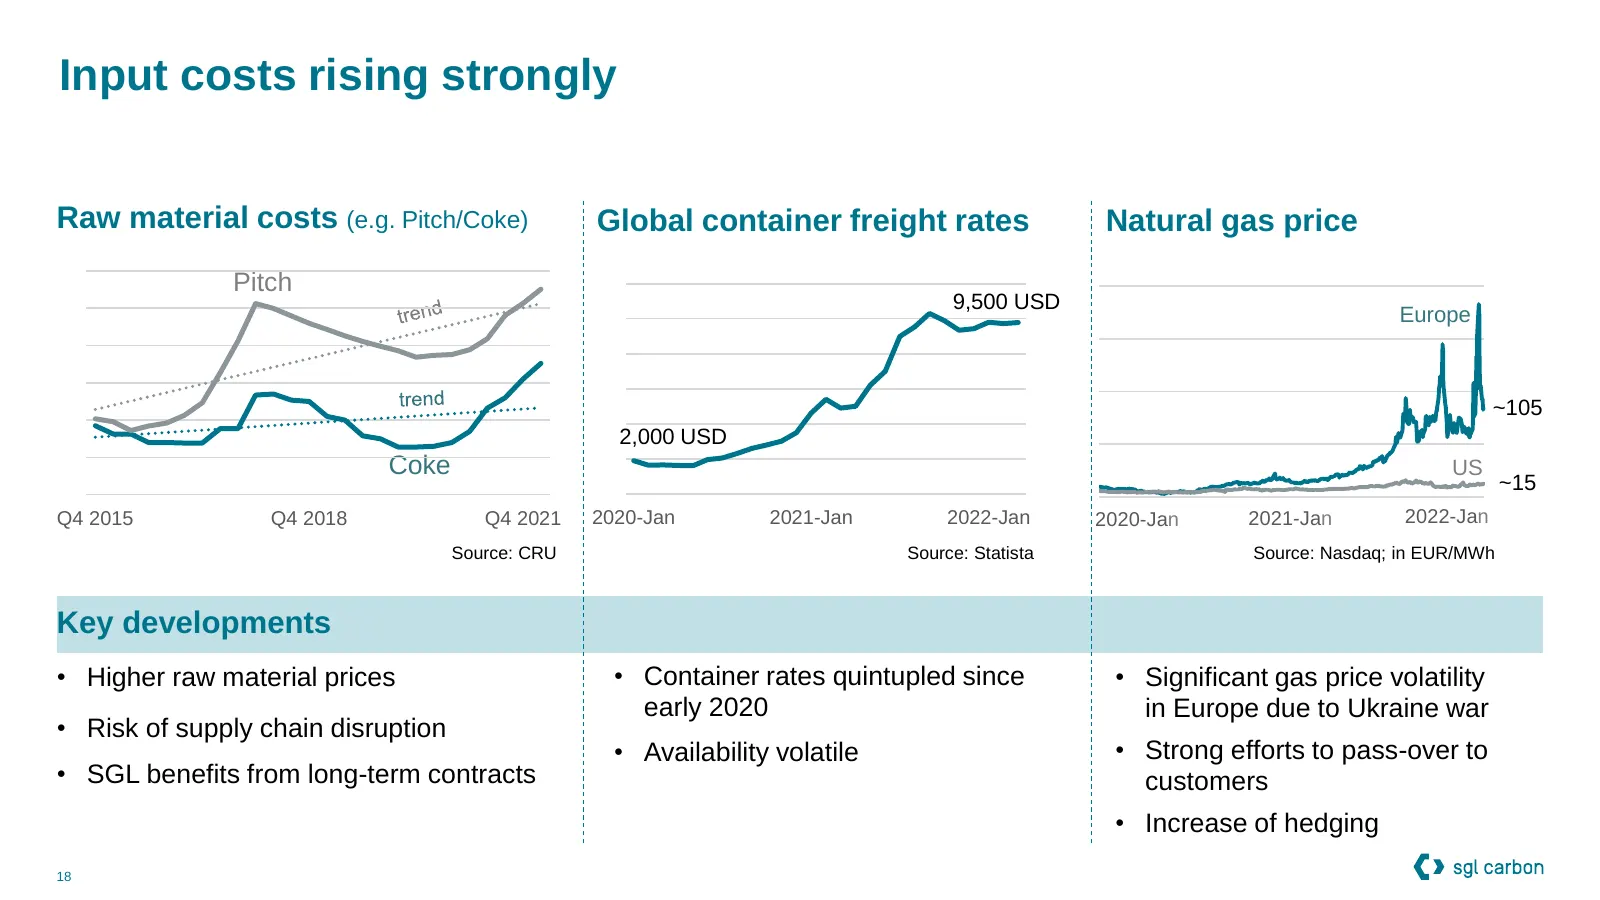
Input costs rising strongly Raw material costs (e.g. Pitch/Coke) Global container freight rates Natural gas price Pitch 9,500 USD Europe ~105 2,000 USD Coke US ~15 Q4 2015 Q4 2018 Q4 2021 2020-Jan 2021-Jan 2022-Jan 2020-Jan 2021-Jan 2022-Jan Source: CRU Source: Statista Source: Nasdaq; in EUR/MWh Ke
Slide 19: More than 80% of SGL's 2022 energy consumption is hedged
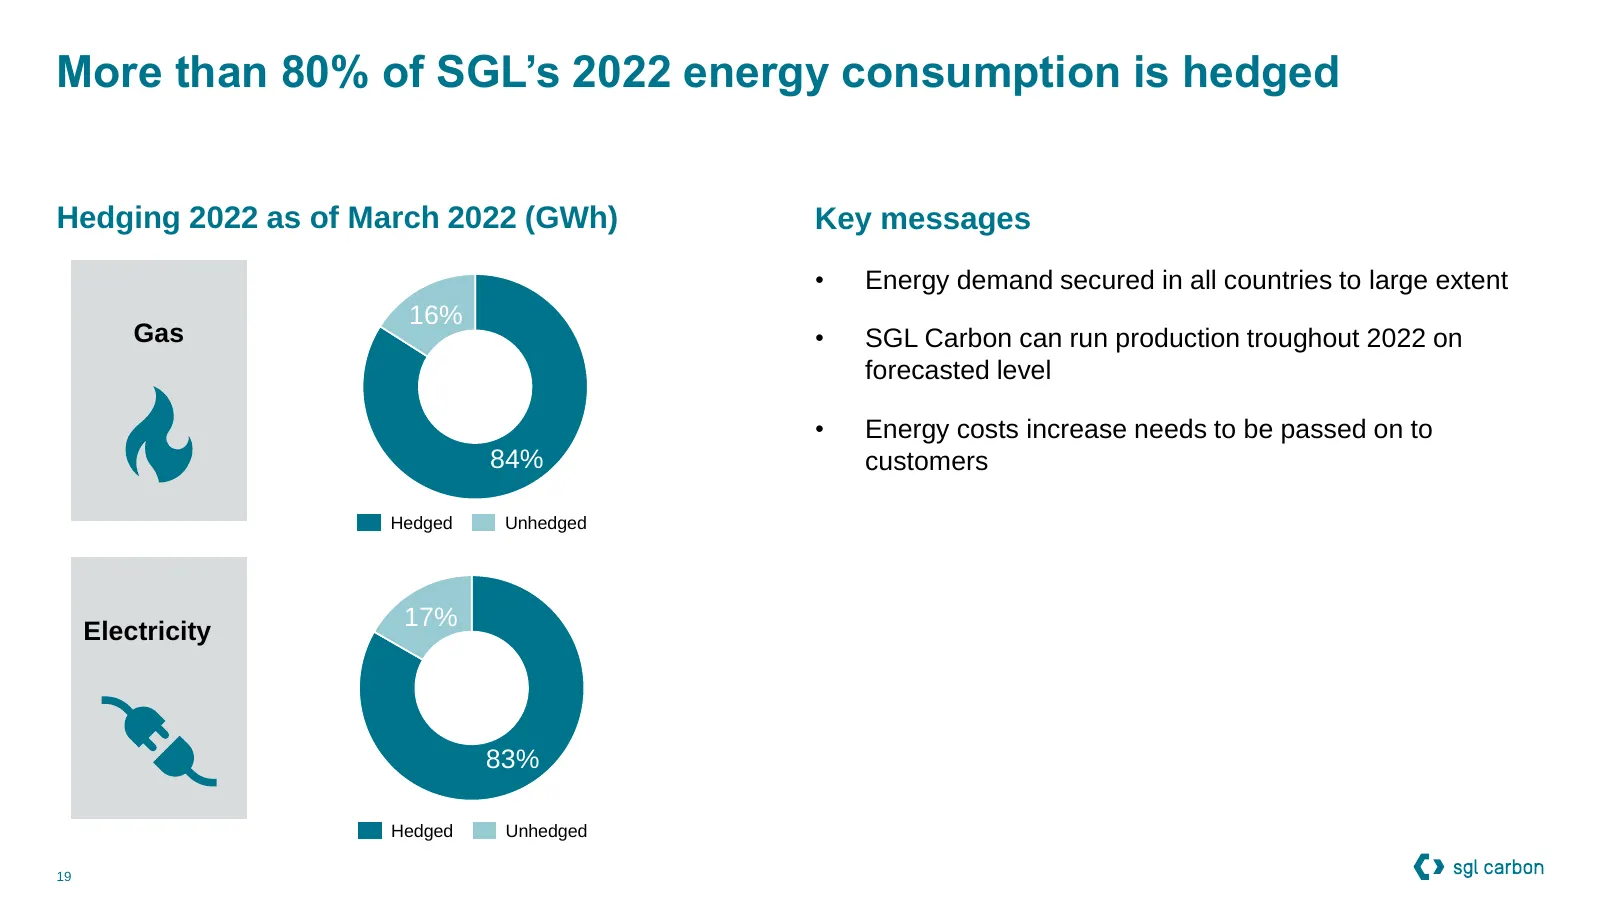
More than 80% of SGL’s 2022 energy consumption is hedged Hedging 2022 as of March 2022 (GWh) Key messages • Energy demand secured in all countries to large extent 16% Gas • SGL Carbon can run production troughout 2022 on forecasted level • Energy costs increase needs to be passed on to 84% customers
Slide 20: Outlook 2022
4 Outlook 2022 “Solid - based on existing business, but possible effects of the war in Ukraine led to an adjustment of risk and forecast assessment“ 20
Slide 21: Current drivers and challenges - SGL is well prepared
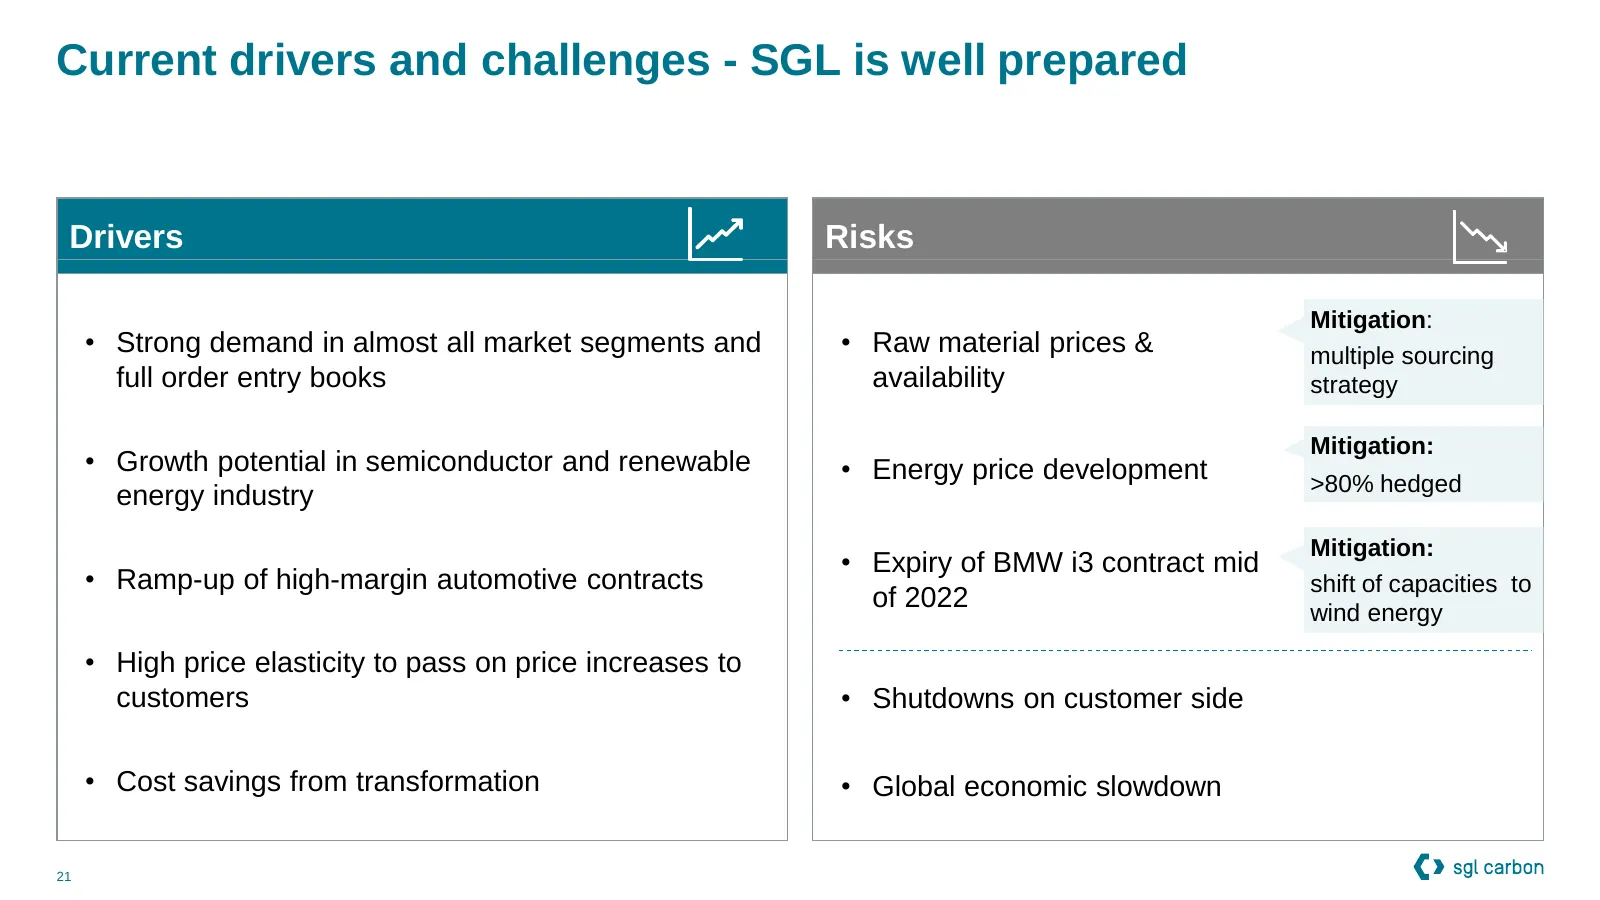
Current drivers and challenges - SGL is well prepared Drivers Risks Mitigation: • Strong demand in almost all market segments and • Raw material prices & multiple sourcing full order entry books availability strategy Mitigation: • Growth potential in semiconductor and renewable • Energy price develo
Slide 22: Stable sales, but earnings outlook impacted by effects of Ukraine war
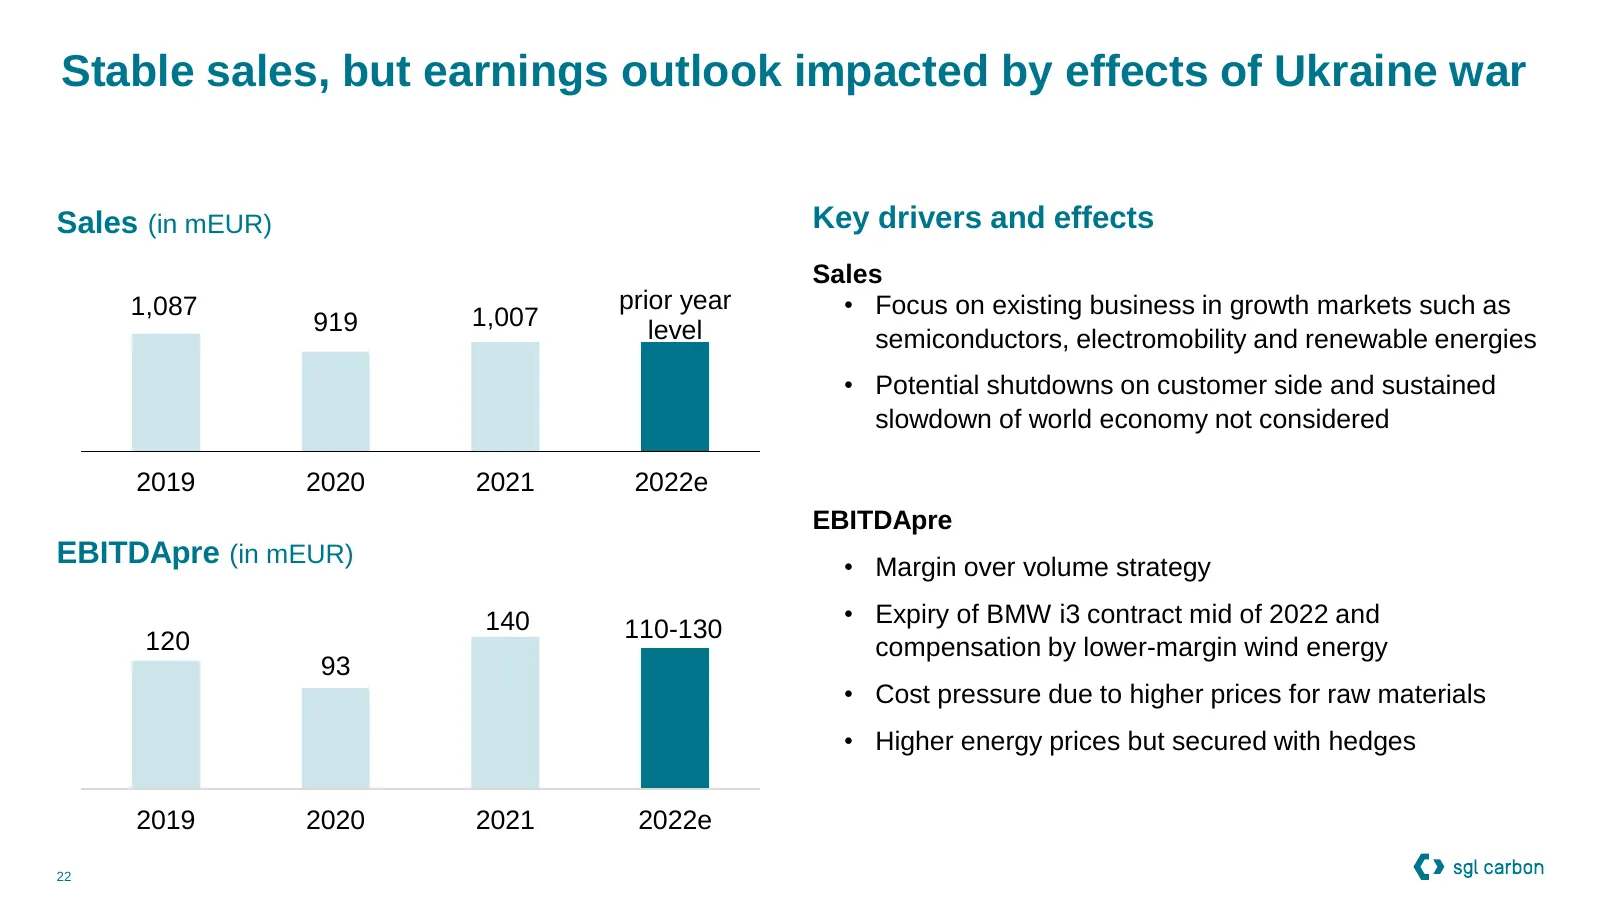
Stable sales, but earnings outlook impacted by effects of Ukraine war Sales (in mEUR) Key drivers and effects Sales 1,087 prior year • Focus on existing business in growth markets such as 919 1,007 level semiconductors, electromobility and renewable energies • Potential shutdowns on customer side an
Slide 23: Mid-term Plan
5 Mid-term Plan “Mid-term planning remains unchanged“ 23
Slide 24: Parts of the expected sales and earnings growth in 2022 already realized in 2021
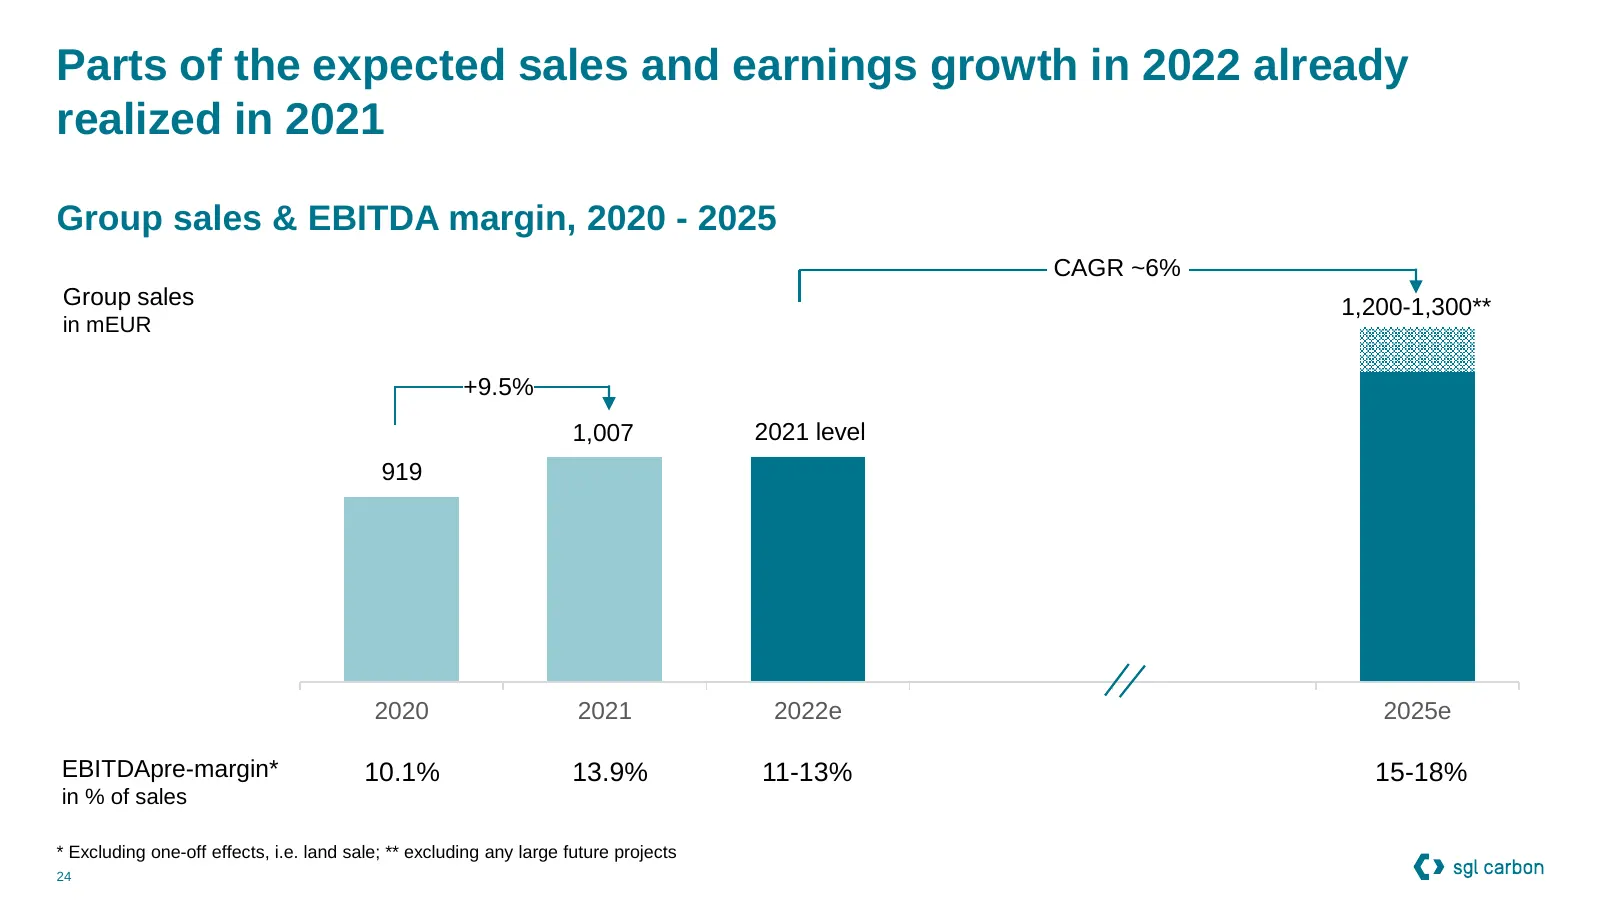
Parts of the expected sales and earnings growth in 2022 already realized in 2021 Group sales & EBITDA margin, 2020 - 2025 CAGR ~6% Group sales 1,200-1,300** in mEUR +9.5% 1,007 2021 level 919 2020 2021 2022e 2025e EBITDApre-margin* 10.1% 13.9% 11-13% 15-18% in % of sales * Excluding one-off effects,
Slide 25: Summary
6 Summary “Significantly better financial basis to meet emerging challenges – mid-term outlook on track“ 25
Slide 26: Key Messages - drivers and challenges
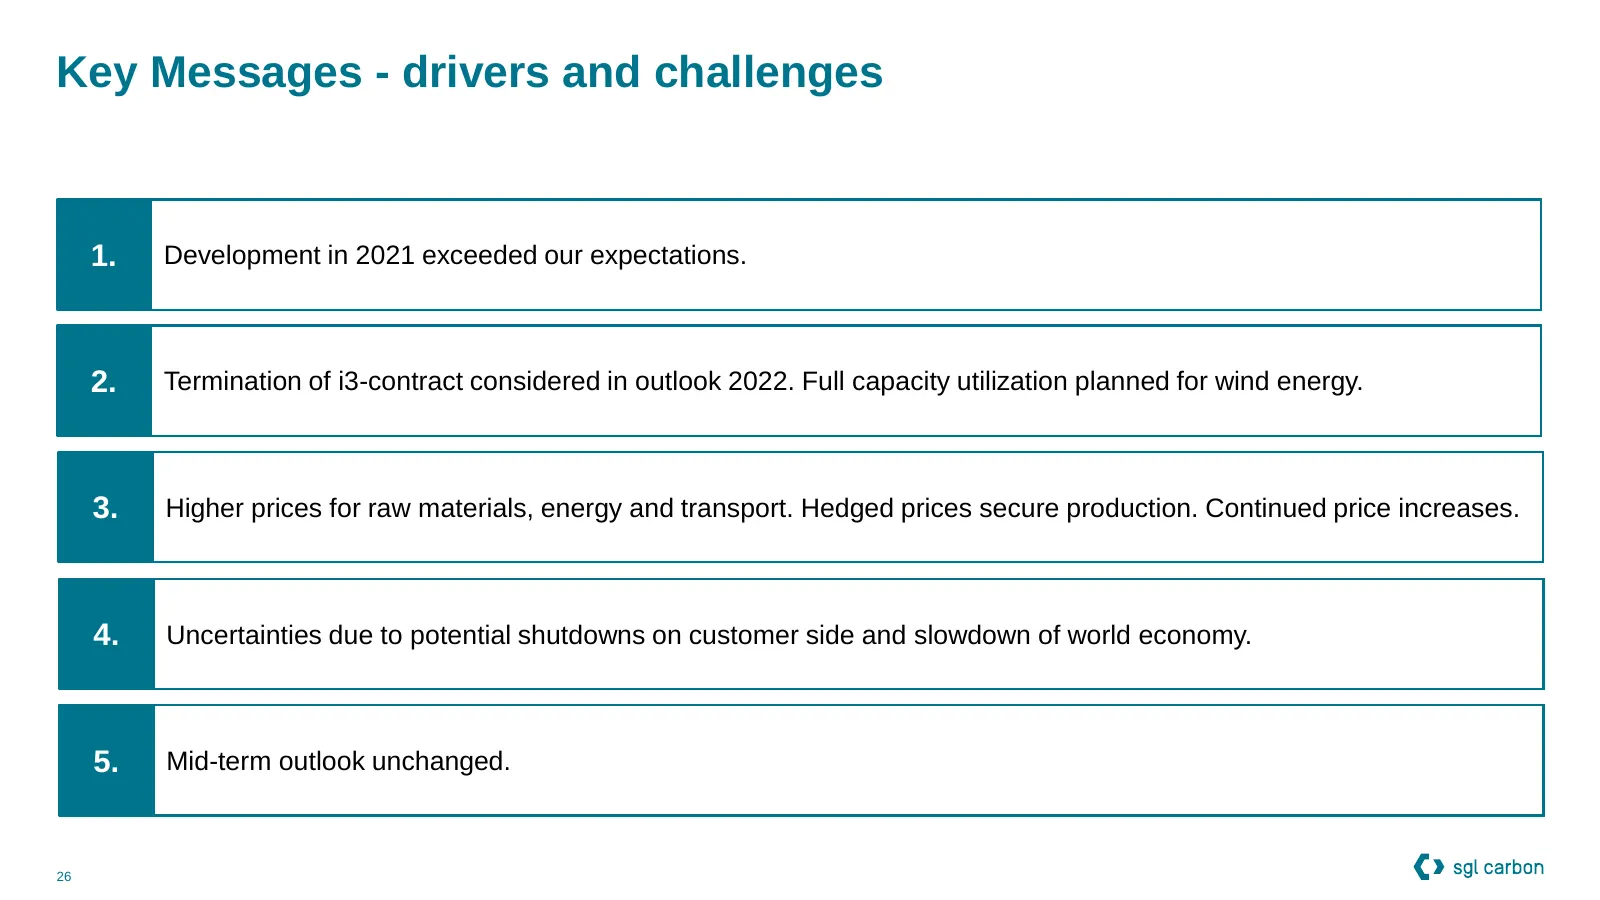
Key Messages - drivers and challenges 1. Development in 2021 exceeded our expectations. 2. Termination of i3-contract considered in outlook 2022. Full capacity utilization planned for wind energy. 3. Higher prices for raw materials, energy and transport. Hedged prices secure production. Continued pr

Slide 27: Q&A We are looking forward to your questions
Q&A We are looking forward to your questions © Copyright SGL Carbon SE ® Registered trademarks of SGL Carbon SE
Slide 28: Financial calendar and IR contact details
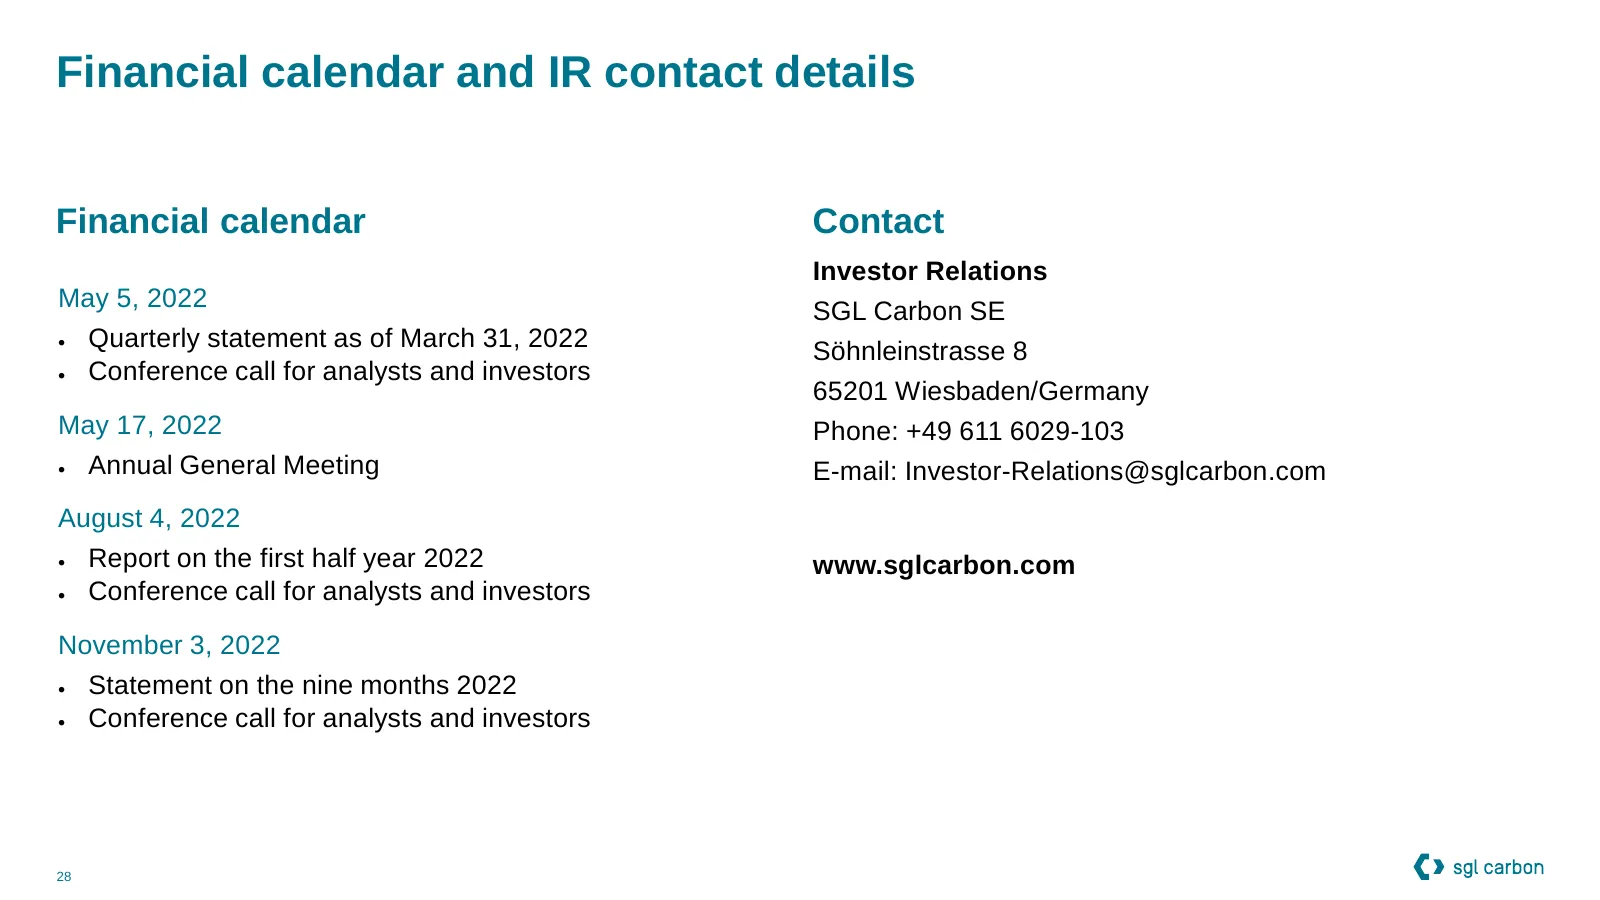
Financial calendar and IR contact details Financial calendar Contact Investor Relations May 5, 2022 SGL Carbon SE • Quarterly statement as of March 31, 2022 Söhnleinstrasse 8 • Conference call for analysts and investors 65201 Wiesbaden/Germany May 17, 2022 Phone: +49 611 6029-103 • Annual General Me

Slide 29: Backup
7 Backup Pa €» sgl carbon
Slide 30: Outlook 2022 on Business Unit level
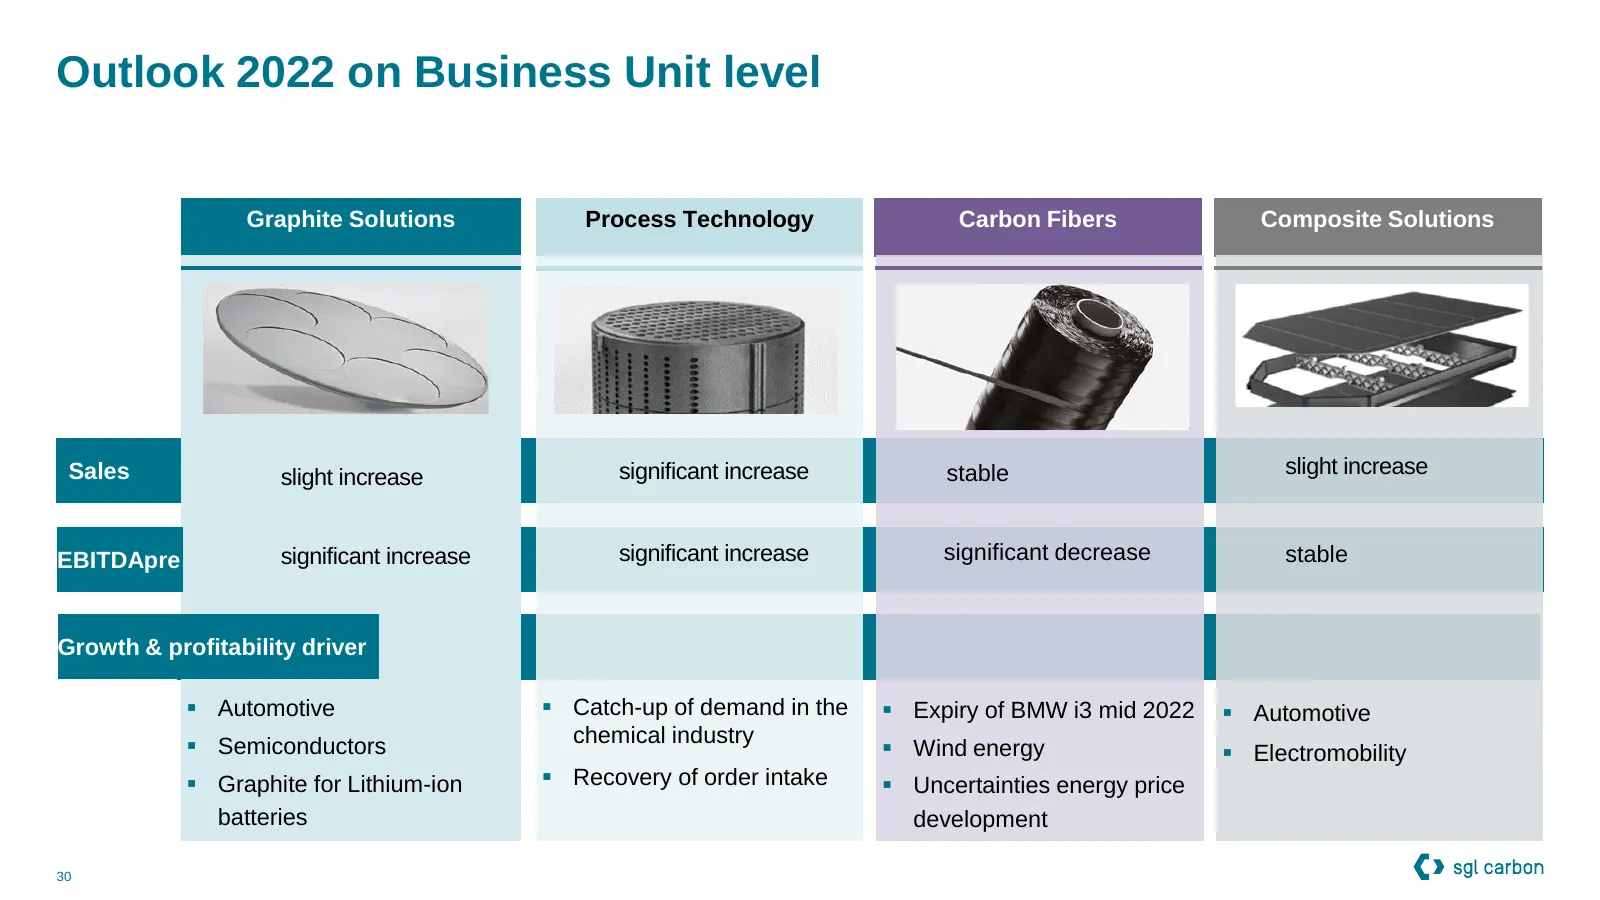
Outlook 2022 on Business Unit level Graphite Solutions Process Technology Carbon Fibers Composite Solutions Sales slight increase significant increase stable slight increase EBITDApre significant increase significant increase significant decrease stable Growth & profitability driver ▪ Automotive ▪ C
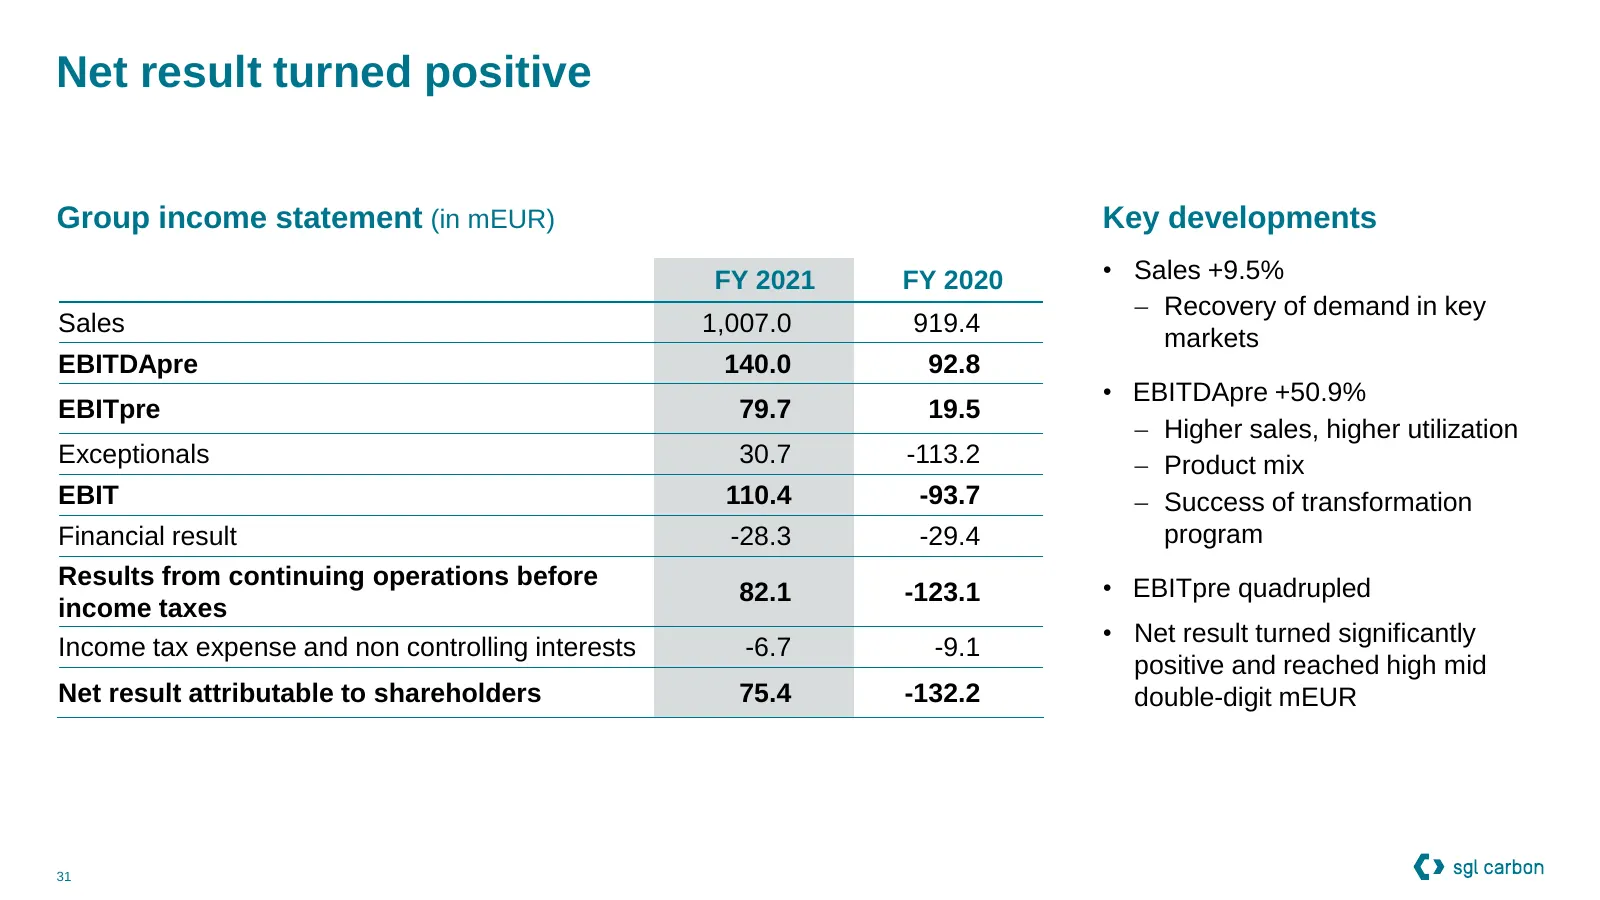
Slide 31: Net result turned positive
Net result turned positive Group income statement (in mEUR) Key developments FY 2021 FY 2020 • Sales +9.5% − Recovery of demand in key Sales 1,007.0 919.4 markets EBITDApre 140.0 92.8 • EBITDApre +50.9% EBITpre 79.7 19.5 − Higher sales, higher utilization Exceptionals 30.7 -113.2 − Product mix EBIT
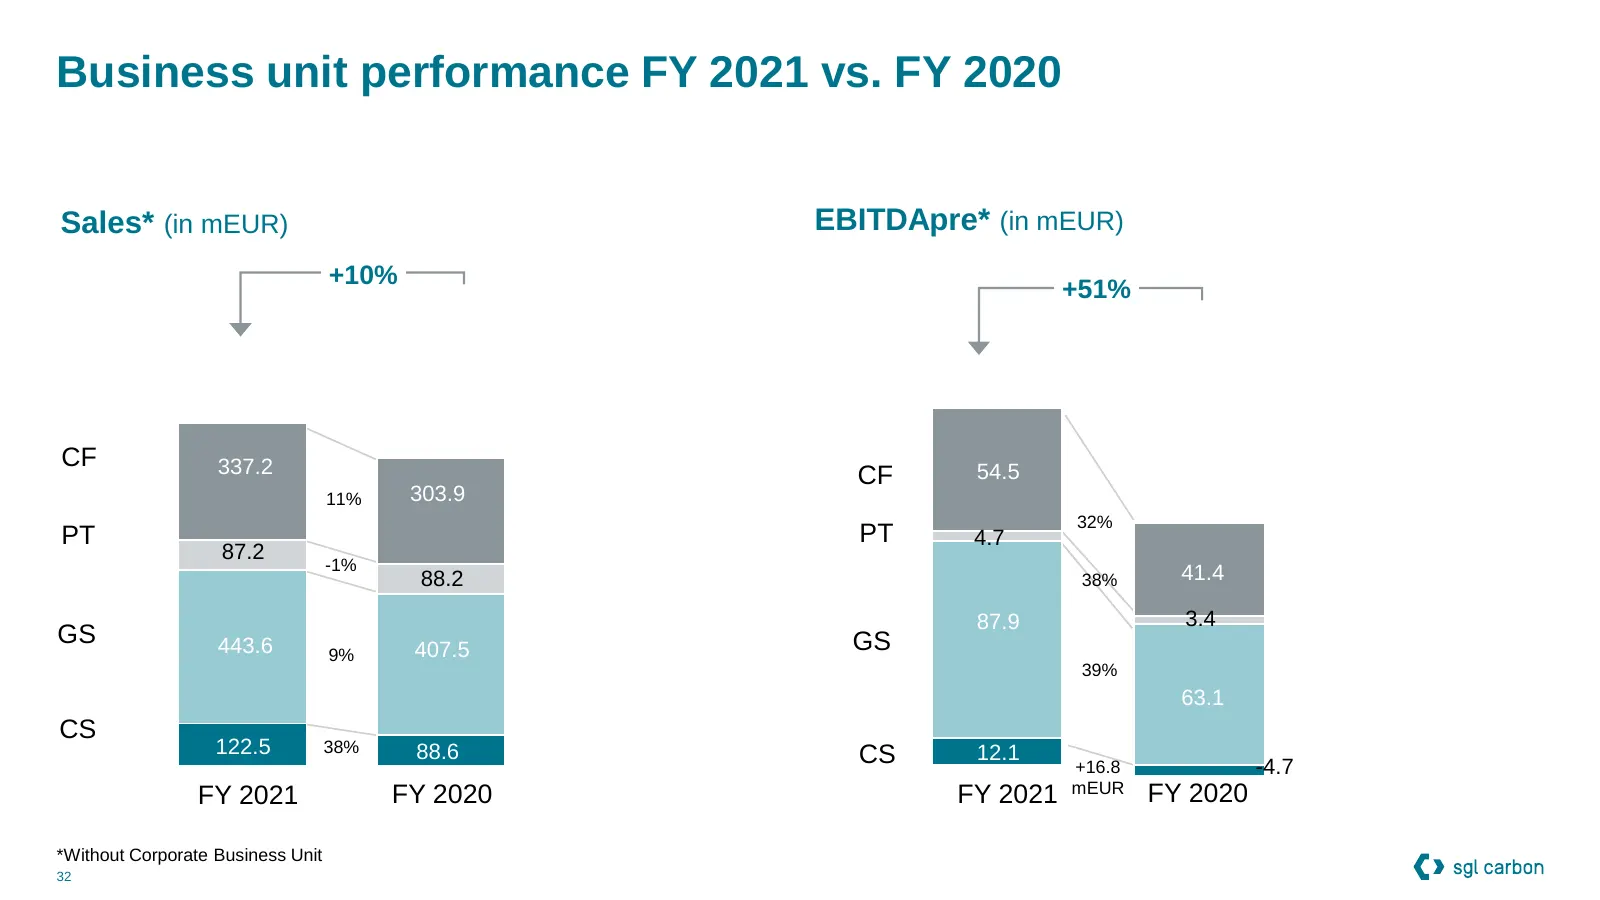
Slide 32: Business unit performance FY 2021 vs. FY 2020
Business unit performance FY 2021 vs. FY 2020 Sales* (in mEUR) EBITDApre* (in mEUR) +10% +51% CF 337.2 54.5 CF 11% 303.9 32% PT PT 4.7 87.2 -1% 88.2 38% 41.4 87.9 3.4 GS 443.6 GS 9% 407.5 39% 63.1 CS 122.5 38% 88.6 CS 12.1 +16.8 -4.7 FY 2021 FY 2020 FY 2021 mEUR FY 2020 *Without Corporate Business U
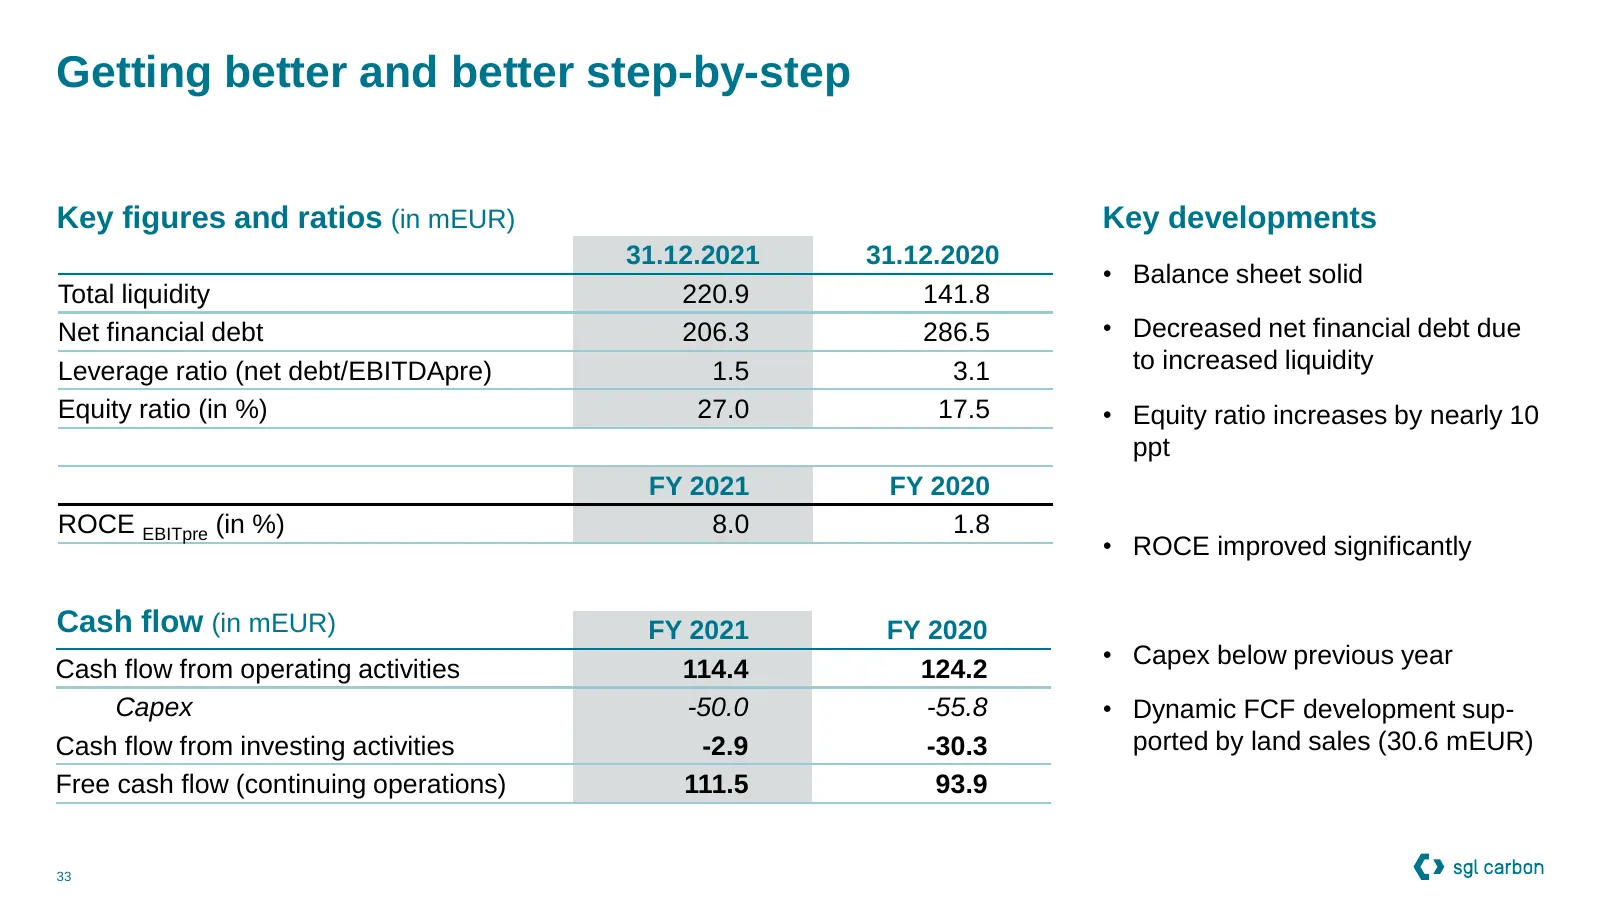
Slide 33: Getting better and better step-by-step
Getting better and better step-by-step Key figures and ratios (in mEUR) Key developments 31.12.2021 31.12.2020 • Balance sheet solid Total liquidity 220.9 141.8 Net financial debt 206.3 286.5 • Decreased net financial debt due Leverage ratio (net debt/EBITDApre) 1.5 3.1 to increased liquidity Equity
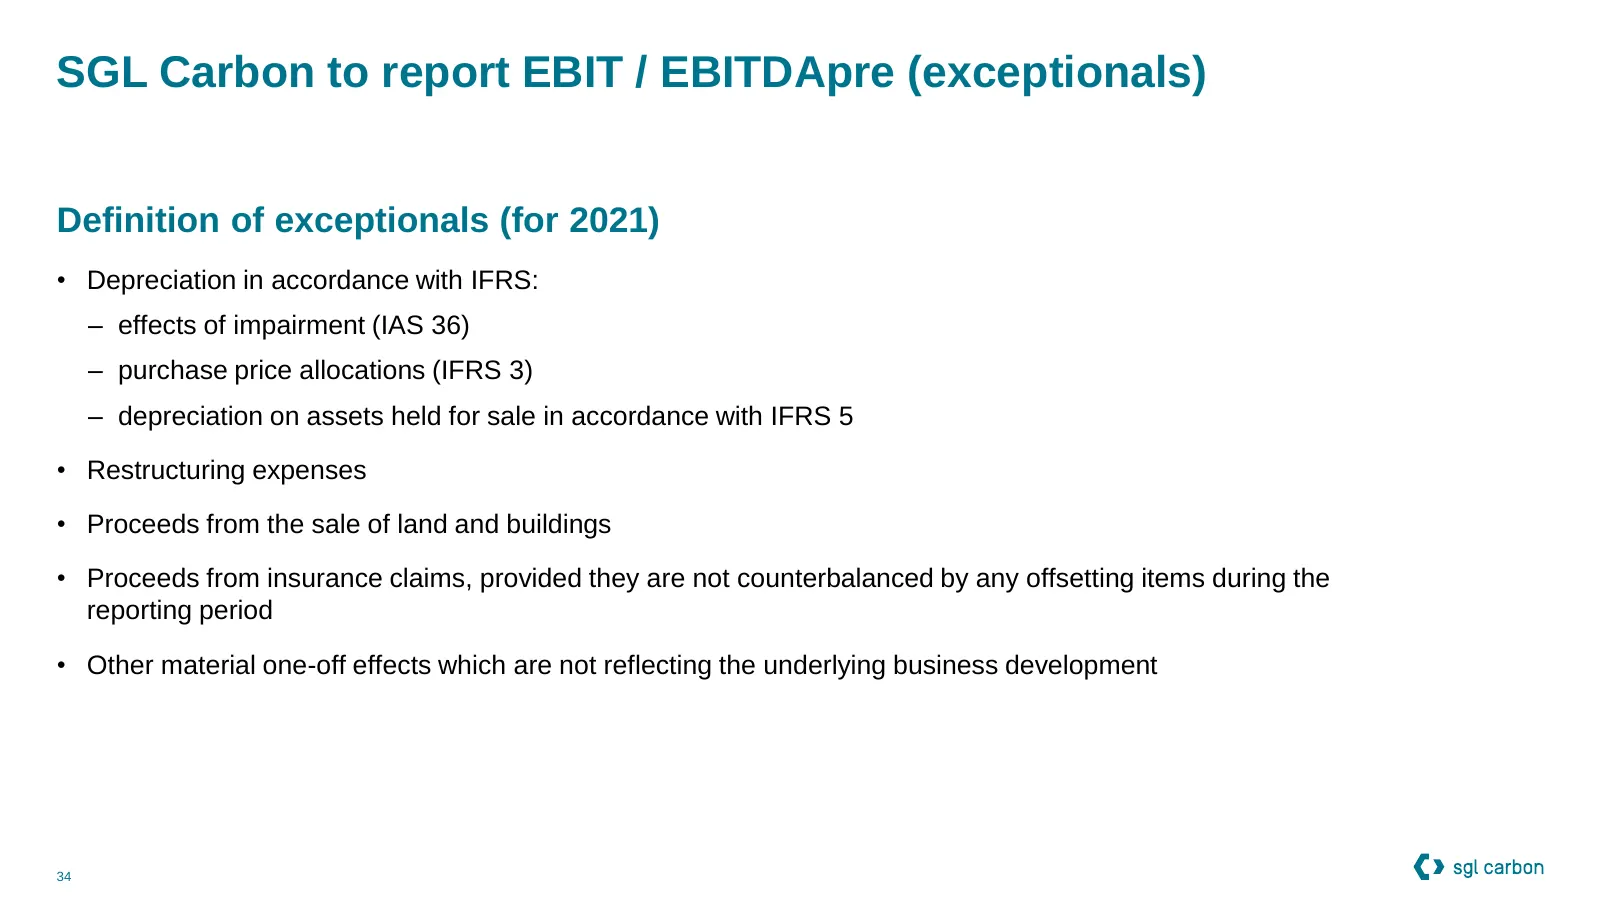
Slide 34: SGL Carbon to report EBIT / EBITDApre (exceptionals)
SGL Carbon to report EBIT / EBITDApre (exceptionals) Definition of exceptionals (for 2021) • Depreciation in accordance with IFRS: ‒ effects of impairment (IAS 36) ‒ purchase price allocations (IFRS 3) ‒ depreciation on assets held for sale in accordance with IFRS 5 • Restructuring expenses • Procee
Slide 35: Important Note
Important Note This presentation contains statements relating to certain projections and business trends that are forward-looking, including statements with respect to SGL Carbon’s outlook and business development, including developments in SGL Carbon’s Graphite Solutions (GS), Process Technology (P
Source: Internet Archive copy of sglcarbon.com
More decks from SGL Carbon SE
 9M 2026 Earnings Presentation30 slides · Nov 5, 2026
 9M 2026 Earnings Presentation17 slides · Nov 5, 2026
 Q3 2024 Earnings Presentation28 slides · Nov 7, 2024
 H1 2024 Earnings Presentation18 slides · Aug 8, 2024
 Q1 2024 Earnings Presentation19 slides · May 8, 2024
 ESG Presentation (March 2024)7 slides · Mar 22, 2024