Ascom Holding AG · SIX:ASCN
Ascom — FY2012 Earnings Presentation
45 slides from Ascom's earnings presentation, Mar 20, 2013

Slide 1: Welcome to the Ascom Media and Analyst Conference 2012 Annual Results
WELCOME TO THE ASCOM MEDIA AND ANALYST CONFERENCE 2012 ANNUAL RESULTS

Slide 2: Ascom: Mission-Critical Wireless Communication
ASCOM MISSION-CRITICAL WIRELESS COMMUNICATION
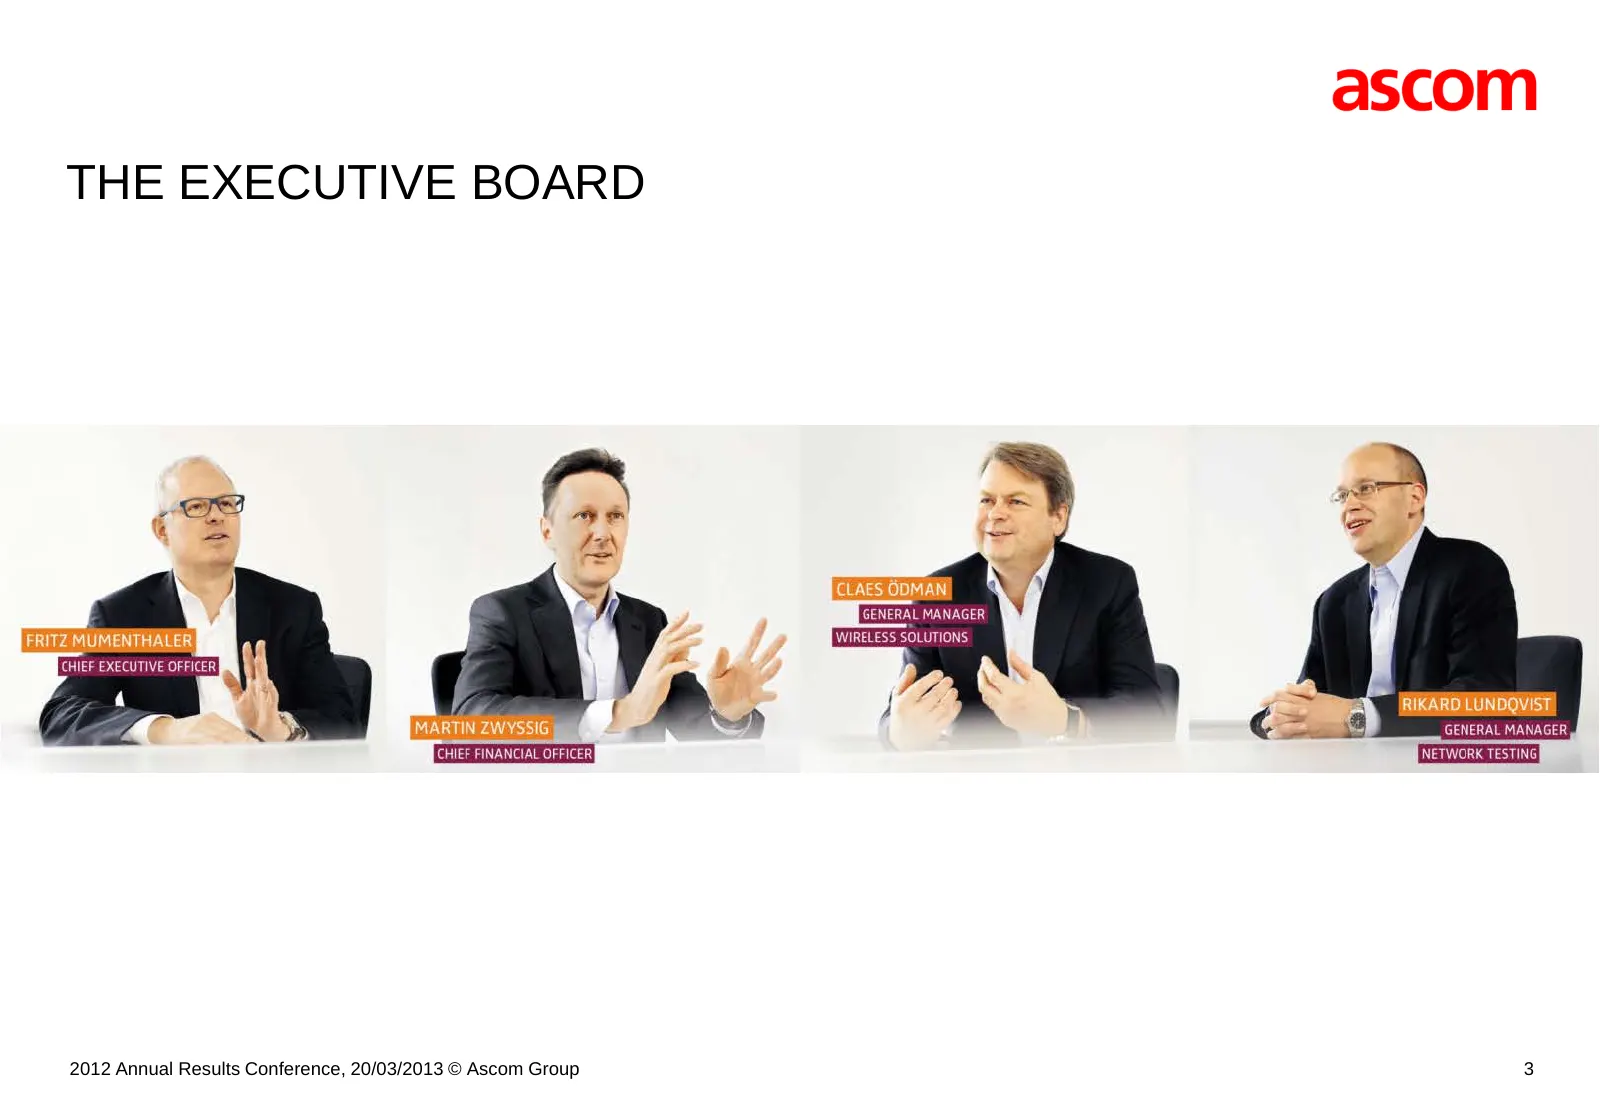
Slide 3: The Executive Board
THE EXECUTIVE BOARD 2012 Annual Results Conference, 20/03/2013 © Ascom Group 3

Slide 4: Agenda 20 March 2013
[ ] AGENDA 20 MARCH 2013 Business Review 2012 2012 Financial Statements Ascom Wireless Solutions Ascom Network Testing Outlook
Slide 5: Business Review 2012
[ ] BUSINESS REVIEW 2012 FRITZ MUMENTHALER 2012 Annual Results Conference, 20/03/2013 © Ascom Group 5
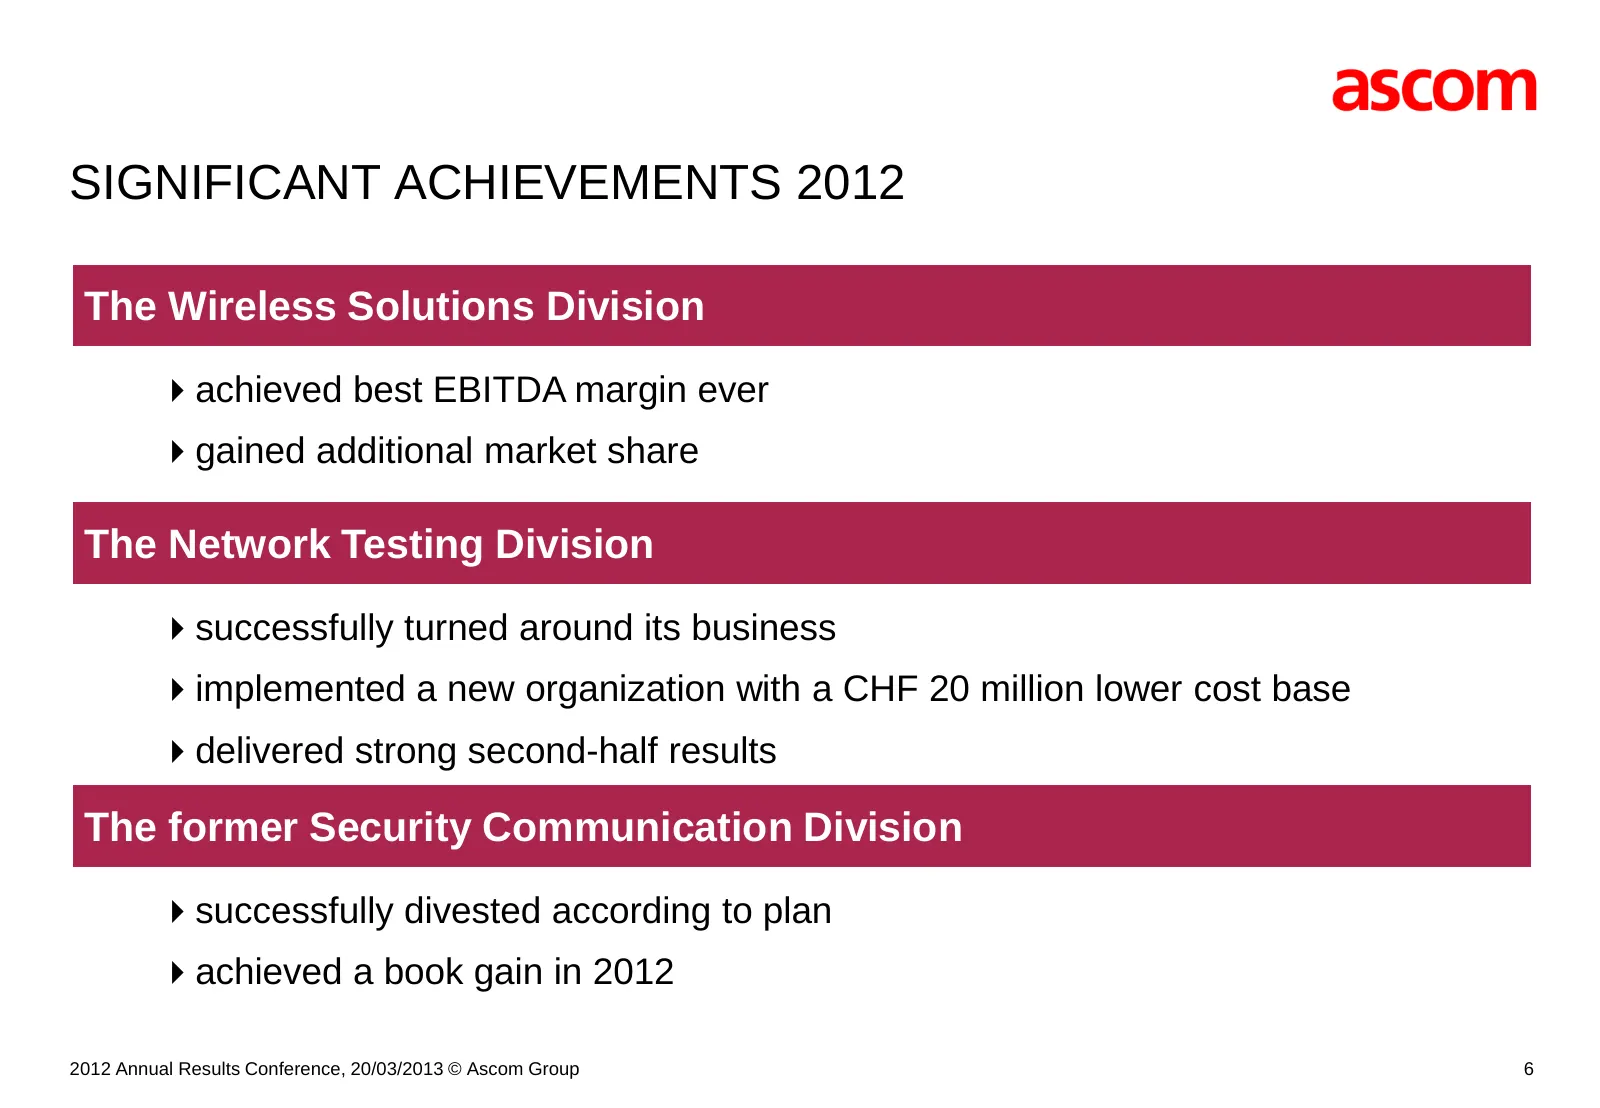
Slide 6: Significant Achievements 2012
SIGNIFICANT ACHIEVEMENTS 2012 The Wireless Solutions Division achieved best EBITDA margin ever gained additional market share The Network Testing Division successfully turned around its business implemented a new organization with a CHF 20 million lower cost base delivered strong second-half re
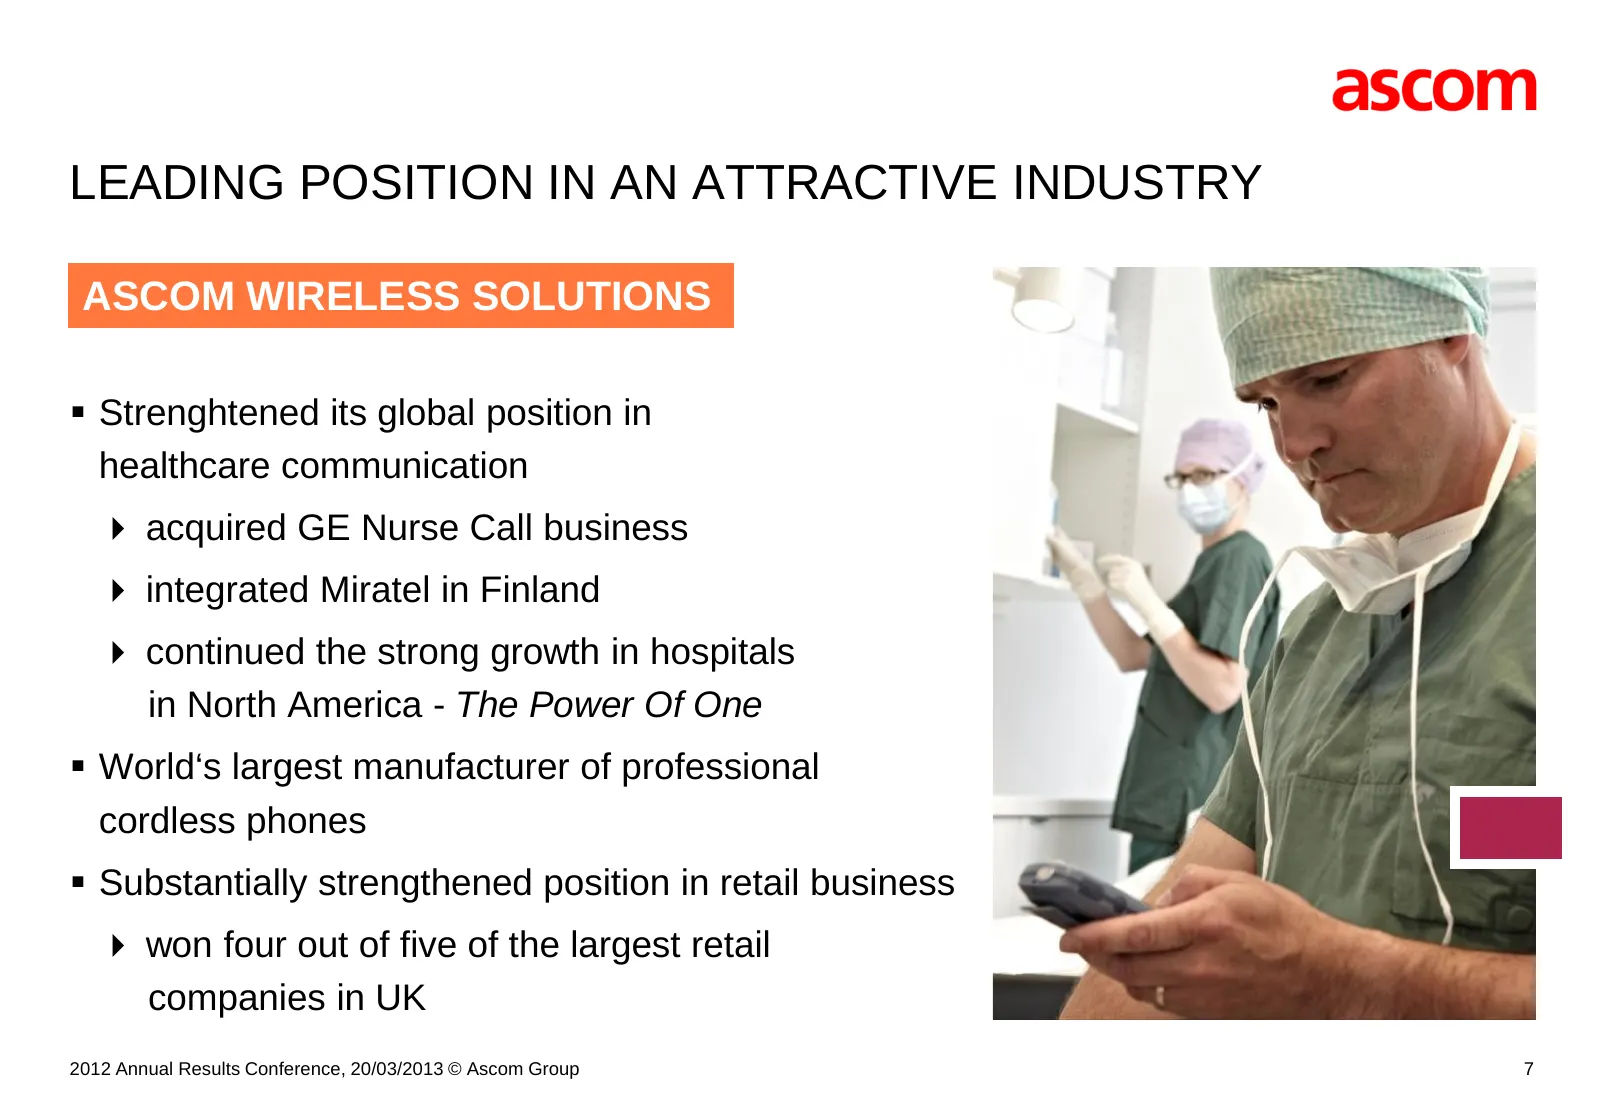
Slide 7: Leading Position in an Attractive Industry: Wireless Solutions
LEADING POSITION IN AN ATTRACTIVE INDUSTRY ASCOM ASCOMWIRELESS WIRELESSSOLUTIONS SOLUTIONS Strenghtened its global position in healthcare communication acquired GE Nurse Call business integrated Miratel in Finland continued the strong growth in hospitals in North America - The Power Of One
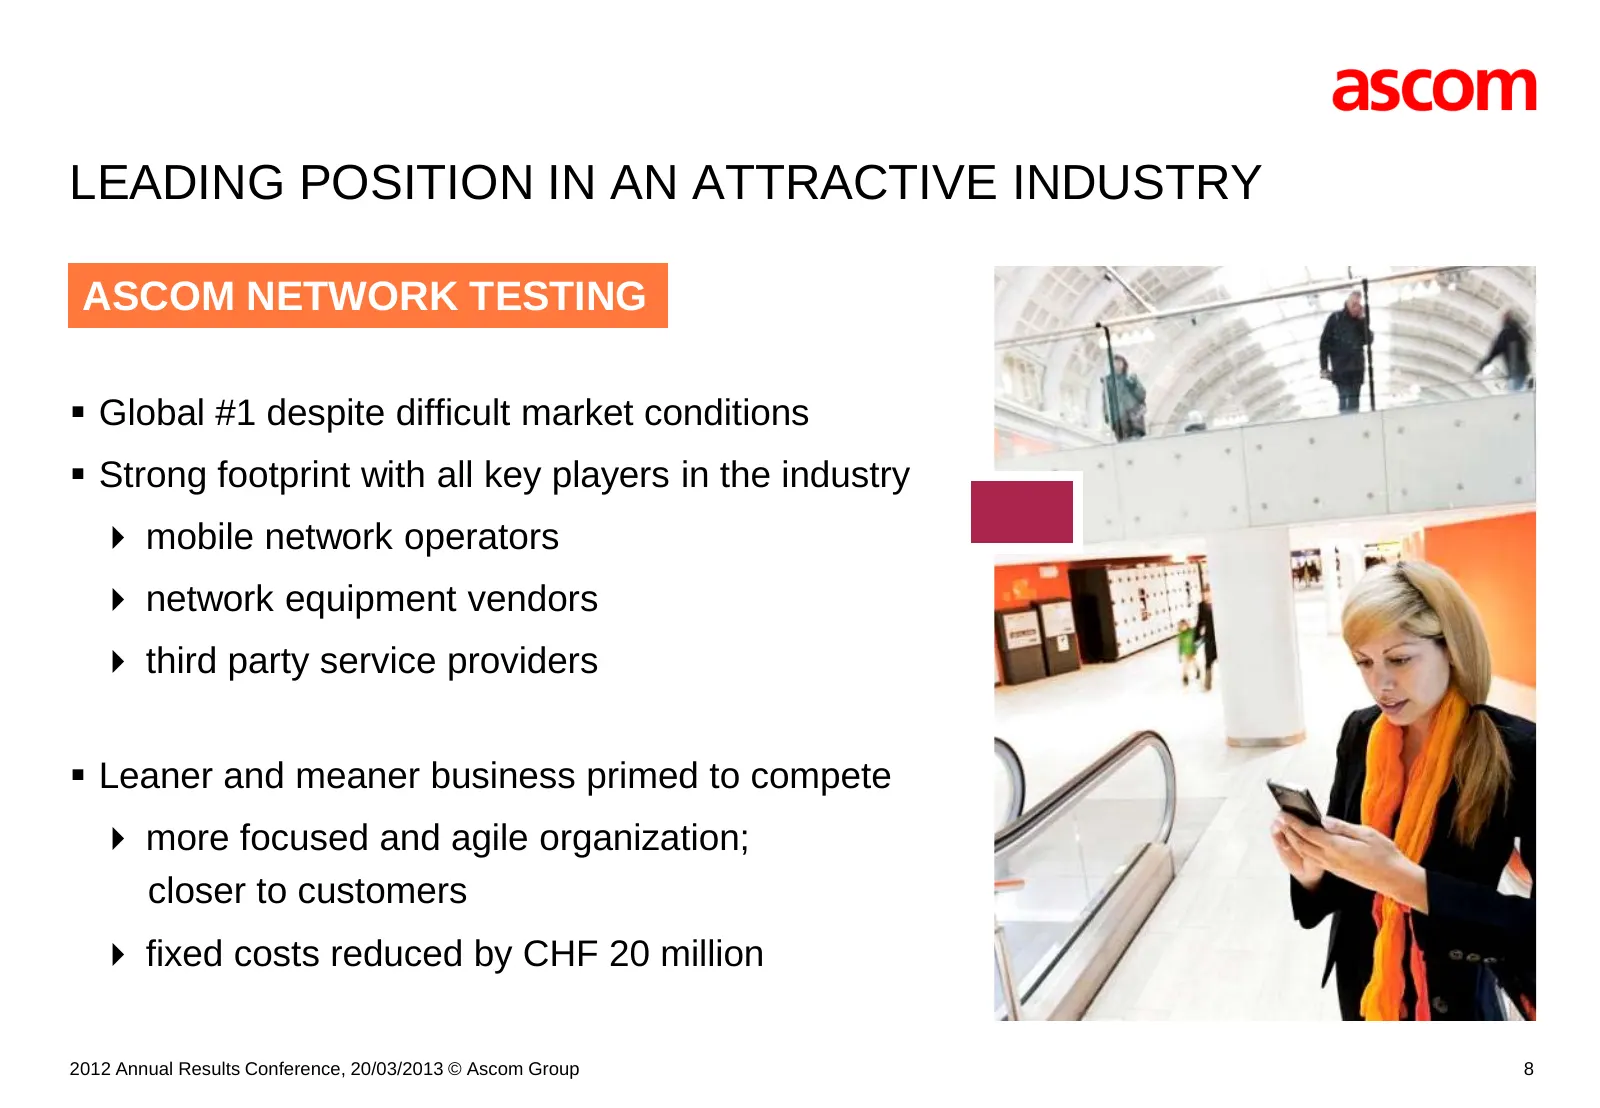
Slide 8: Leading Position in an Attractive Industry: Network Testing
LEADING POSITION IN AN ATTRACTIVE INDUSTRY ASCOM ASCOMNETWORK NETWORKTESTING TESTING Global #1 despite difficult market conditions Strong footprint with all key players in the industry mobile network operators network equipment vendors third party service providers Leaner and meaner busi
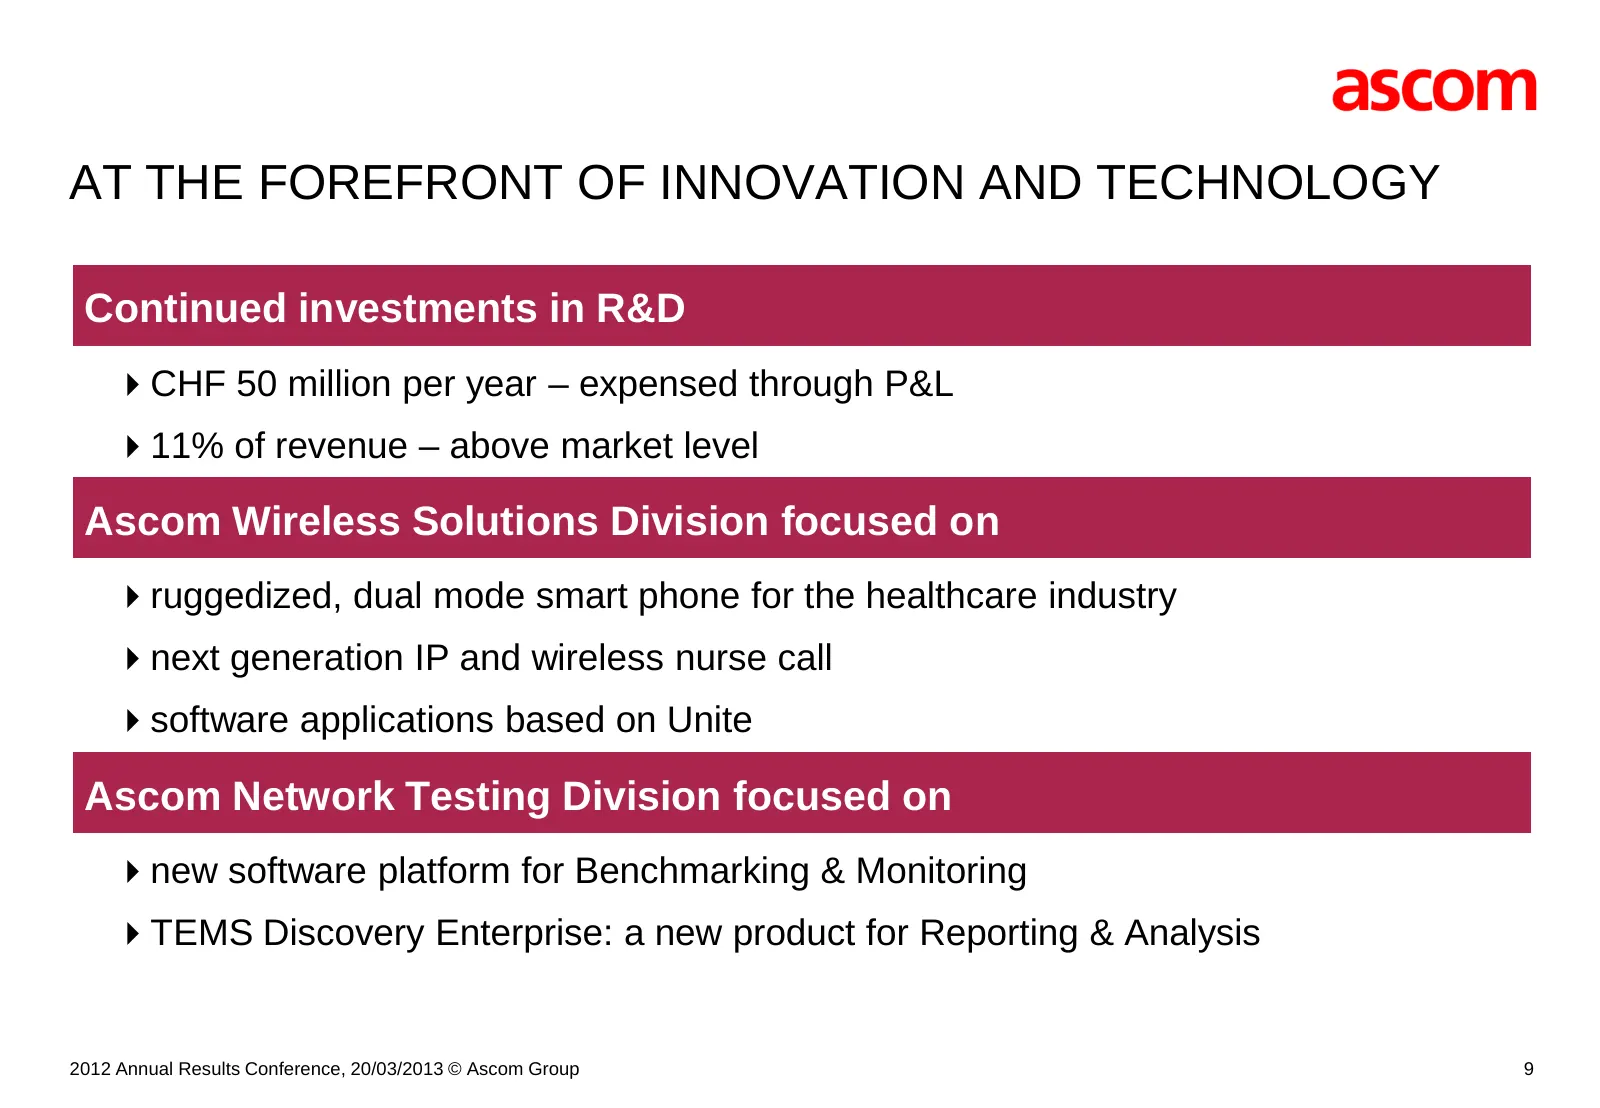
Slide 9: At the Forefront of Innovation and Technology
AT THE FOREFRONT OF INNOVATION AND TECHNOLOGY Continued investments in R&D CHF 50 million per year – expensed through P&L 11% of revenue – above market level Ascom Wireless Solutions Division focused on ruggedized, dual mode smart phone for the healthcare industry next generation IP and wireless
Slide 10: 2012 Financial Statements
[ ] 2012 FINANCIAL STATEMENTS MARTIN ZWYSSIG 2012 Annual Results Conference, 20/03/2013 © Ascom Group 10
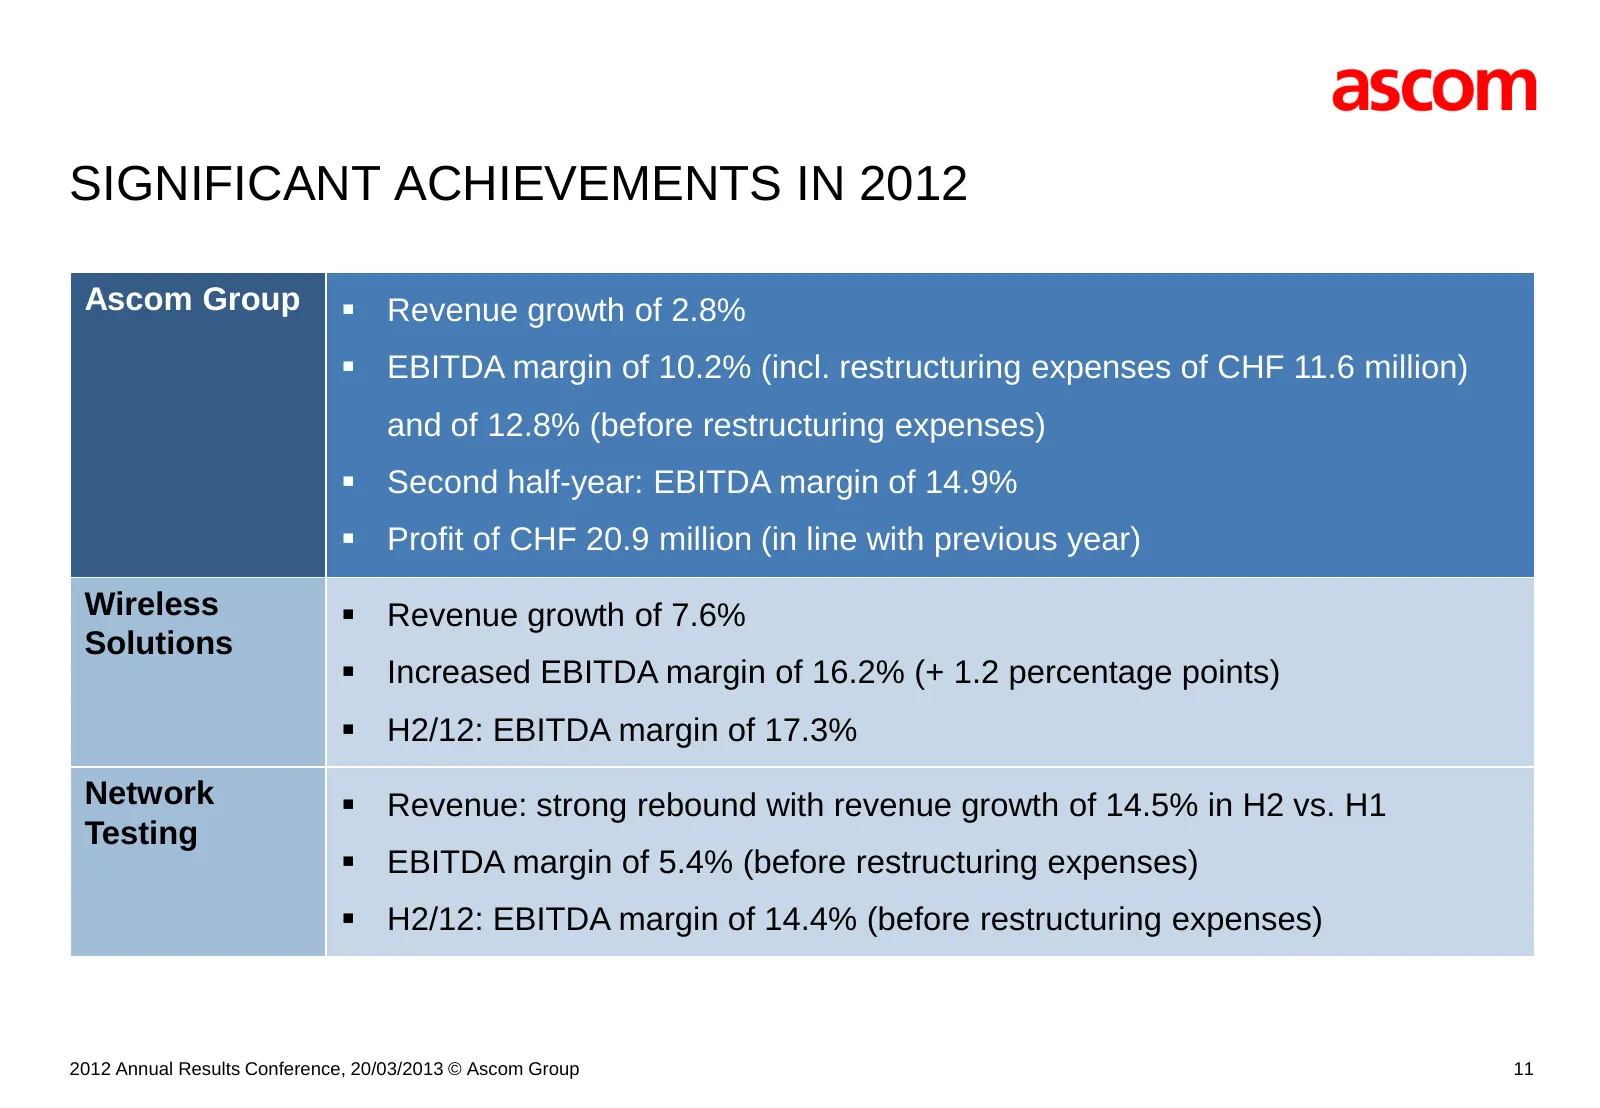
Slide 11: Significant Achievements in 2012
SIGNIFICANT ACHIEVEMENTS IN 2012 Ascom Group Revenue growth of 2.8% EBITDA margin of 10.2% (incl. restructuring expenses of CHF 11.6 million) and of 12.8% (before restructuring expenses) Second half-year: EBITDA margin of 14.9% Profit of CHF 20.9 million (in line with previous year) Wireless
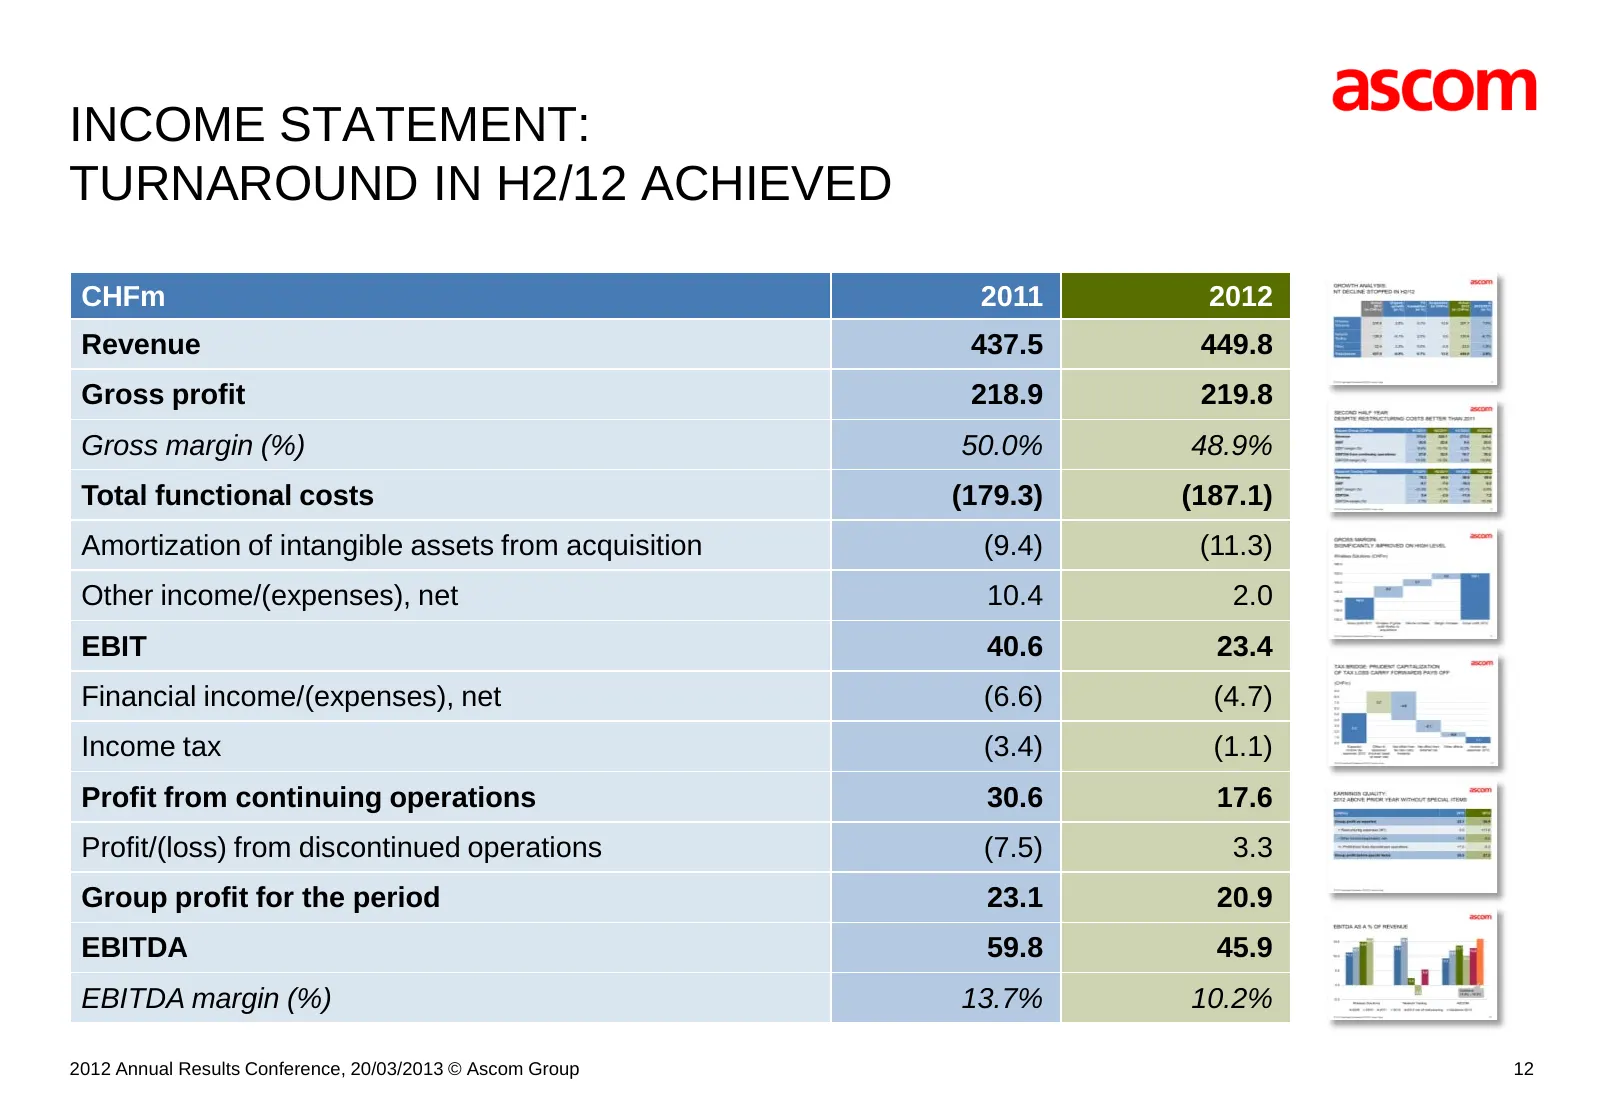
Slide 12: Income Statement: Turnaround in H2/12 Achieved
INCOME STATEMENT: TURNAROUND IN H2/12 ACHIEVED CHFm 2011 2012 Revenue 437.5 449.8 Gross profit 218.9 219.8 Gross margin (%) 50.0% 48.9% Total functional costs (179.3) (187.1) Amortization of intangible assets from acquisition (9.4) (11.3) Other income/(expenses), net 10.4 2.0 EBIT 40.6 23.4 Financia
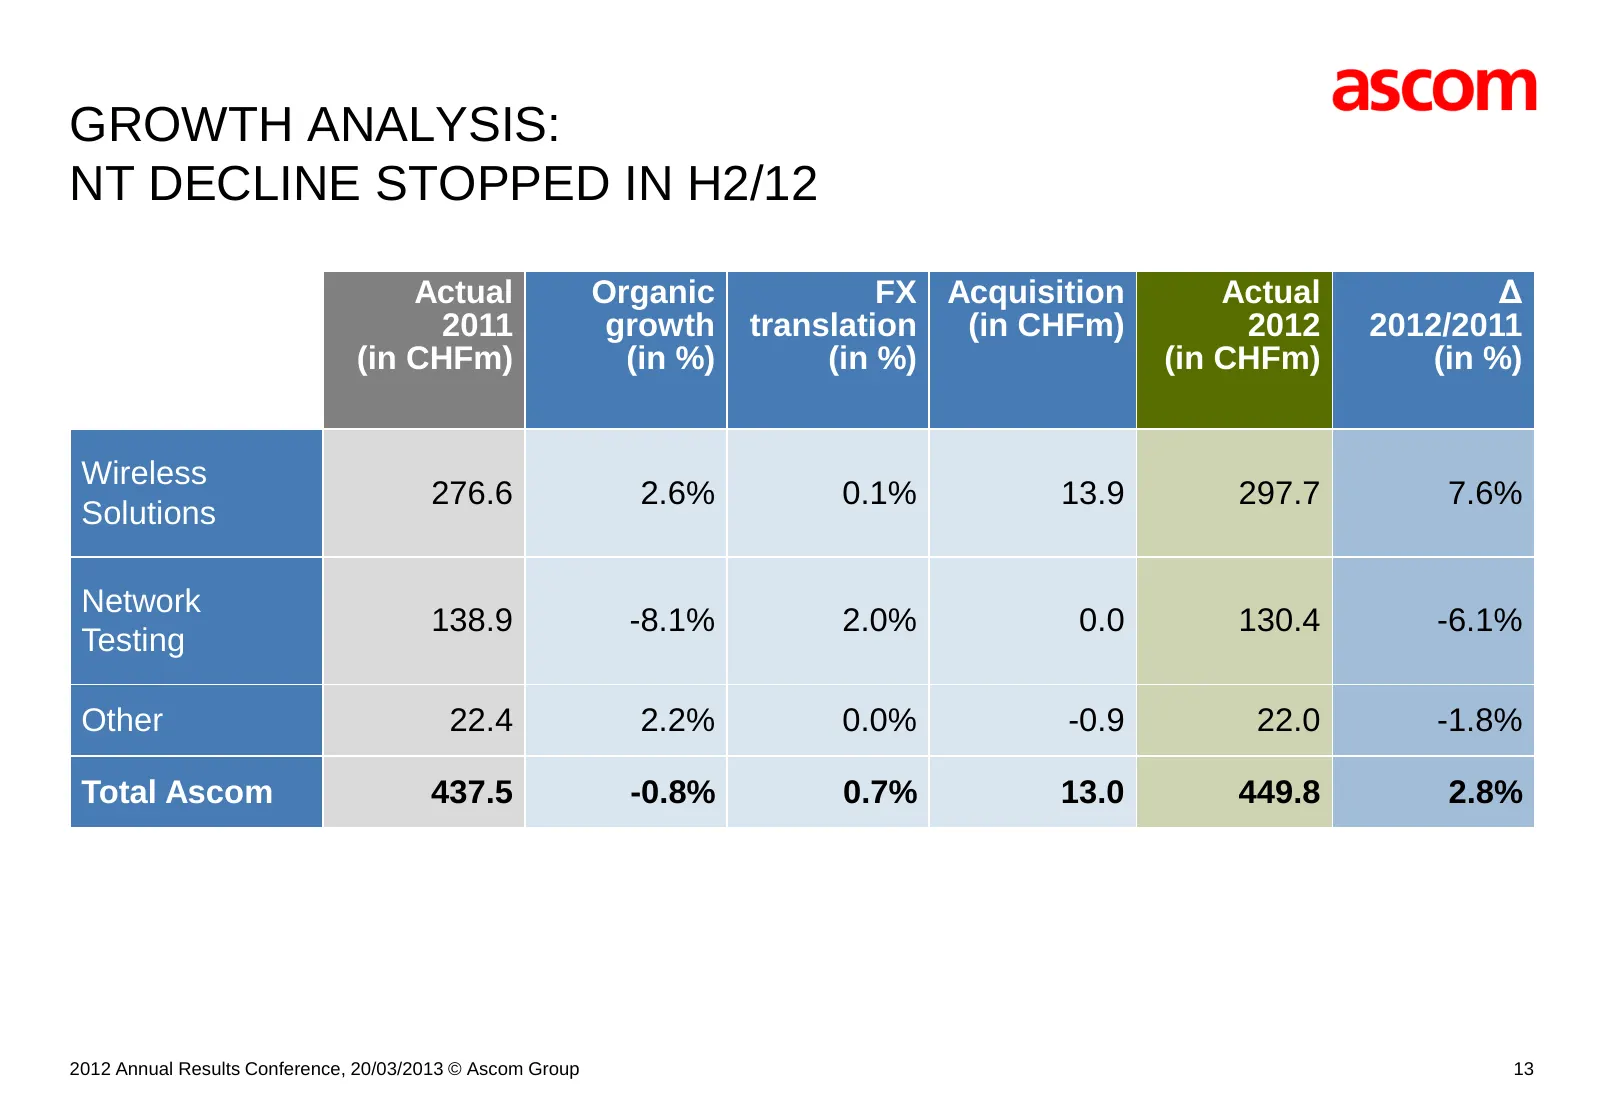
Slide 13: Growth Analysis: NT Decline Stopped in H2/12
GROWTH ANALYSIS: NT DECLINE STOPPED IN H2/12 Actual Organic FX Acquisition Actual Δ 2011 growth translation (in CHFm) 2012 2012/2011 (in CHFm) (in %) (in %) (in CHFm) (in %) Wireless 276.6 2.6% 0.1% 13.9 297.7 7.6% Solutions Network 138.9 -8.1% 2.0% 0.0 130.4 -6.1% Testing Other 22.4 2.2% 0.0% -0.9
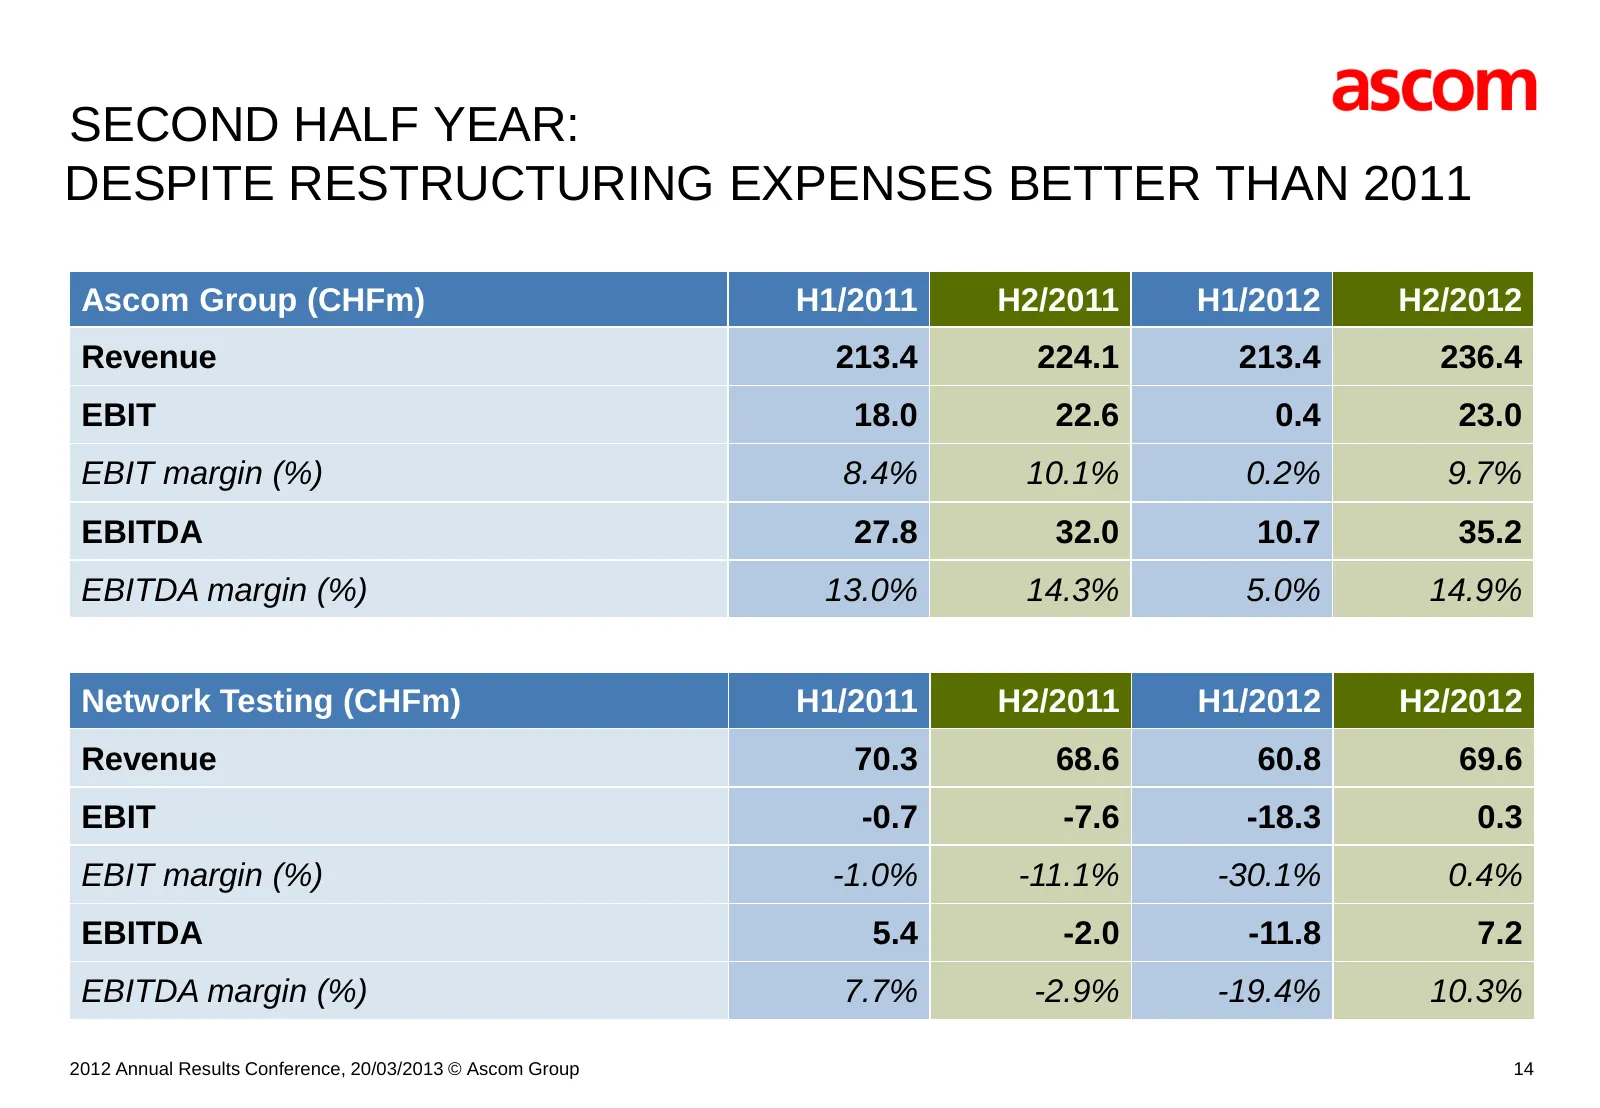
Slide 14: Second Half Year: Better Than 2011 Despite Restructuring
SECOND HALF YEAR: DESPITE RESTRUCTURING EXPENSES BETTER THAN 2011 Ascom Group (CHFm) H1/2011 H2/2011 H1/2012 H2/2012 Revenue 213.4 224.1 213.4 236.4 EBIT 18.0 22.6 0.4 23.0 EBIT margin (%) 8.4% 10.1% 0.2% 9.7% EBITDA 27.8 32.0 10.7 35.2 EBITDA margin (%) 13.0% 14.3% 5.0% 14.9% Network Testing (CHFm)
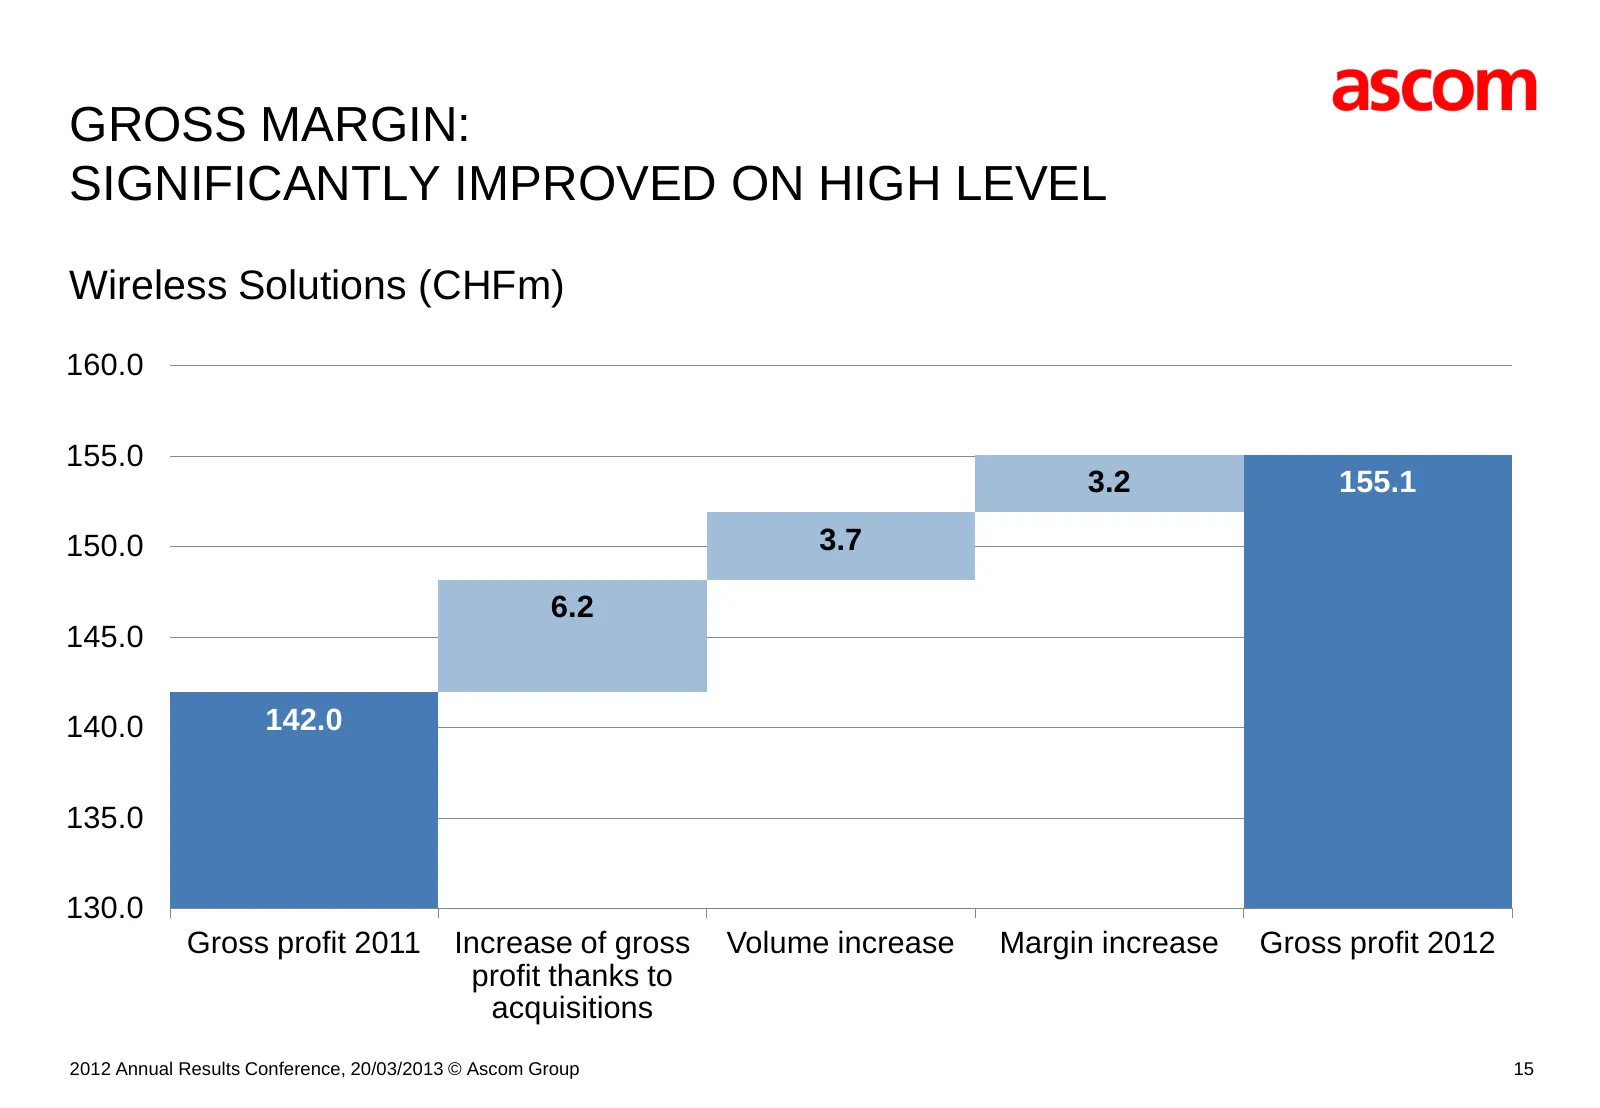
Slide 15: Gross Margin: Significantly Improved on High Level
GROSS MARGIN: SIGNIFICANTLY IMPROVED ON HIGH LEVEL Wireless Solutions (CHFm) 160.0 155.0 3.2 155.1 150.0 3.7 6.2 145.0 140.0 142.0 135.0 130.0 Gross profit 2011 Increase of gross Volume increase Margin increase Gross profit 2012 profit thanks to acquisitions 2012 Annual Results Conference, 20/03/201
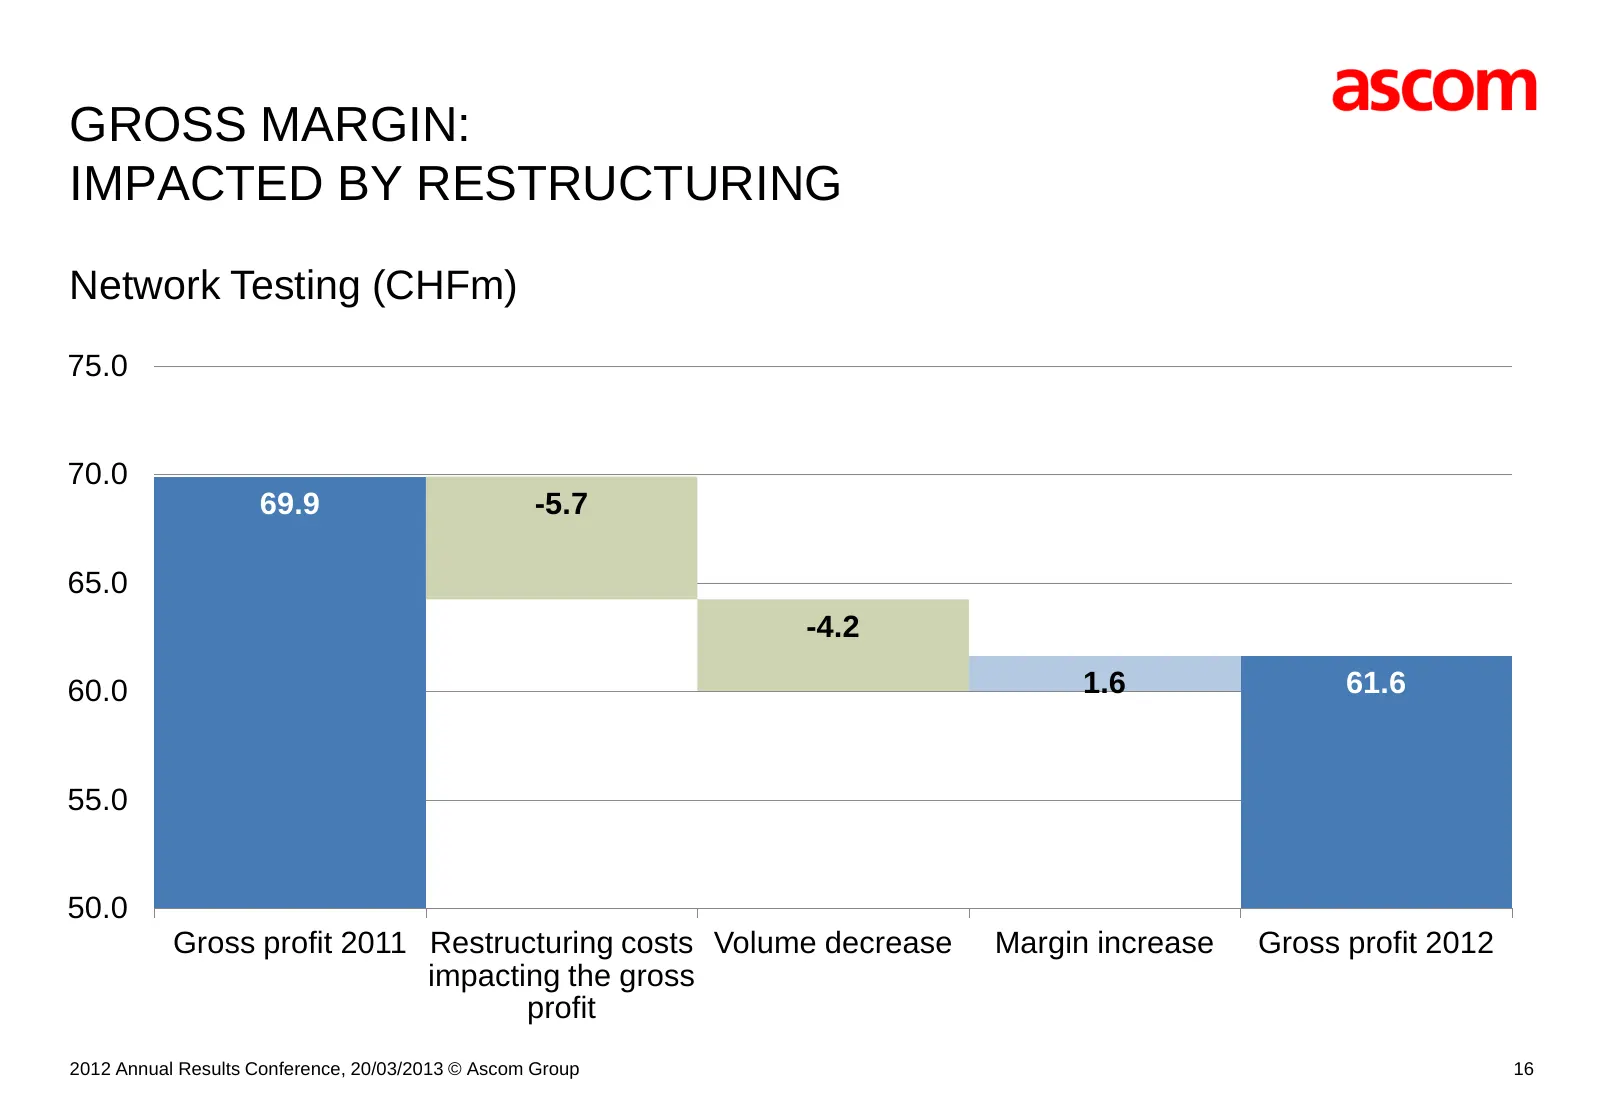
Slide 16: Gross Margin: Impacted by Restructuring
GROSS MARGIN: IMPACTED BY RESTRUCTURING Network Testing (CHFm) 75.0 70.0 69.9 -5.7 65.0 -4.2 60.0 1.6 61.6 55.0 50.0 Gross profit 2011 Restructuring costs Volume decrease Margin increase Gross profit 2012 impacting the gross profit 2012 Annual Results Conference, 20/03/2013 © Ascom Group 16
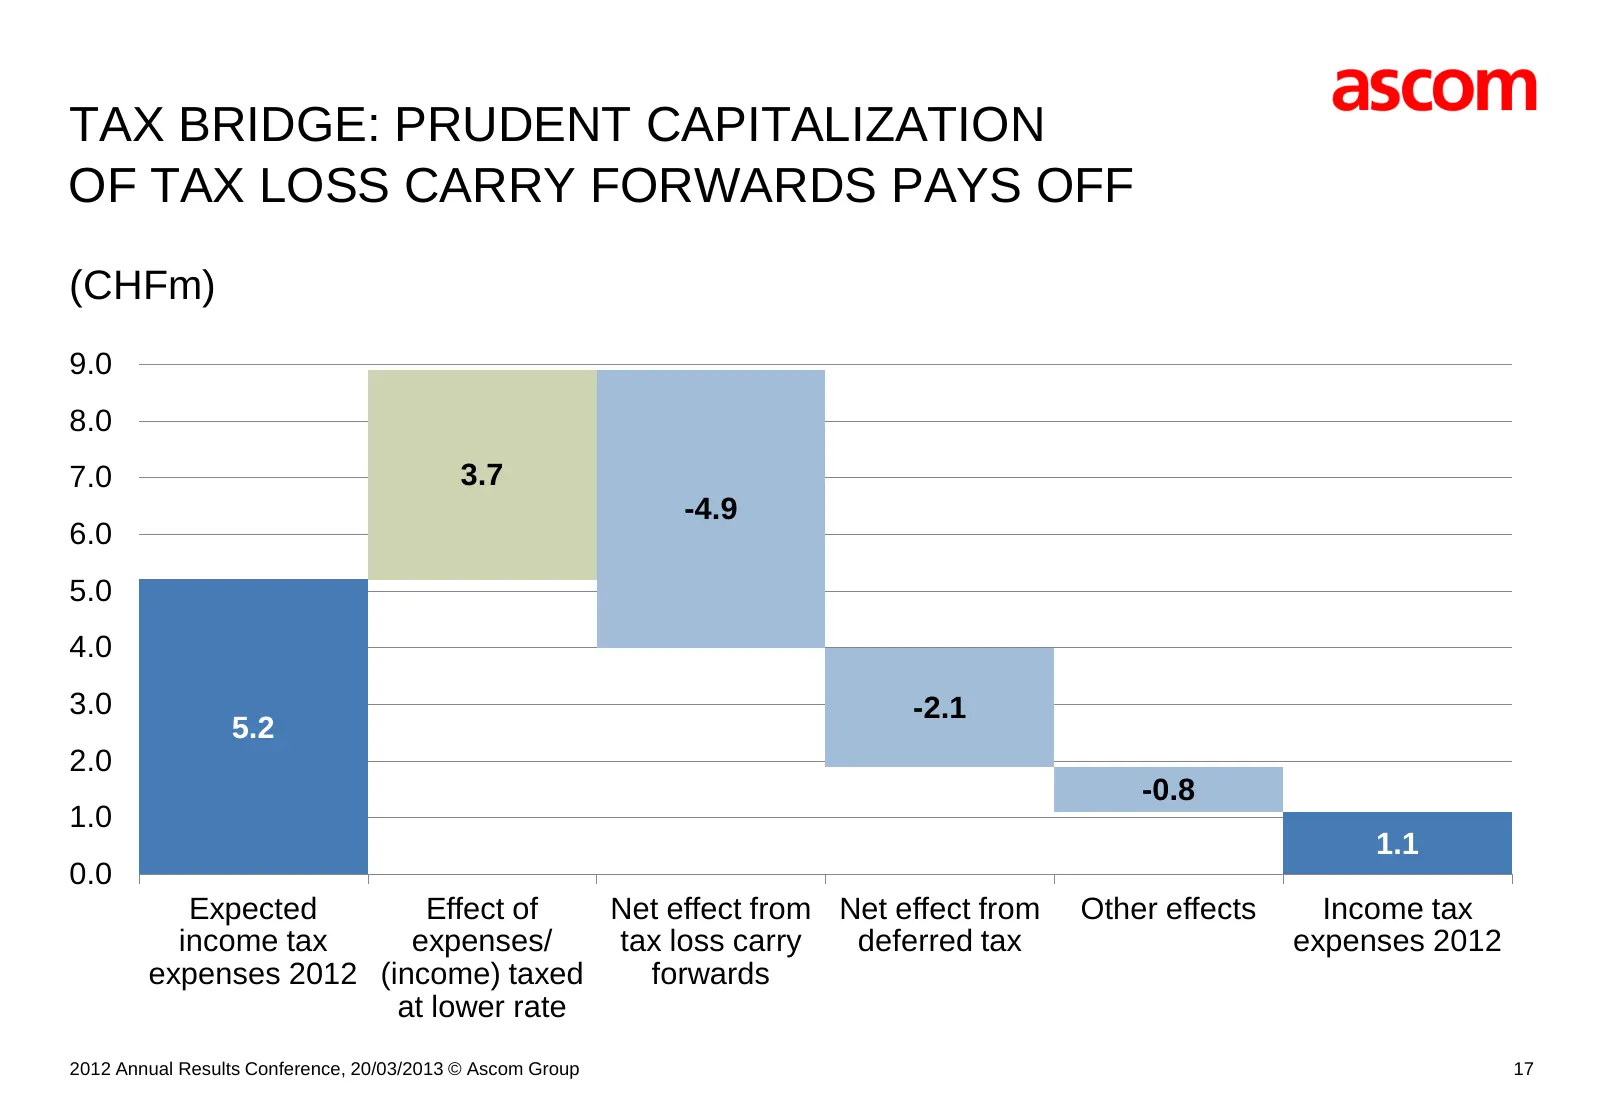
Slide 17: Tax Bridge: Prudent Capitalization of Tax Loss Carry Forwards
TAX BRIDGE: PRUDENT CAPITALIZATION OF TAX LOSS CARRY FORWARDS PAYS OFF (CHFm) 9.0 8.0 7.0 3.7 -4.9 6.0 5.0 4.0 3.0 -2.1 5.2 2.0 -0.8 1.0 1.1 0.0 Expected Effect of Net effect from Net effect from Other effects Income tax income tax expenses/ tax loss carry deferred tax expenses 2012 expenses 2012 (i
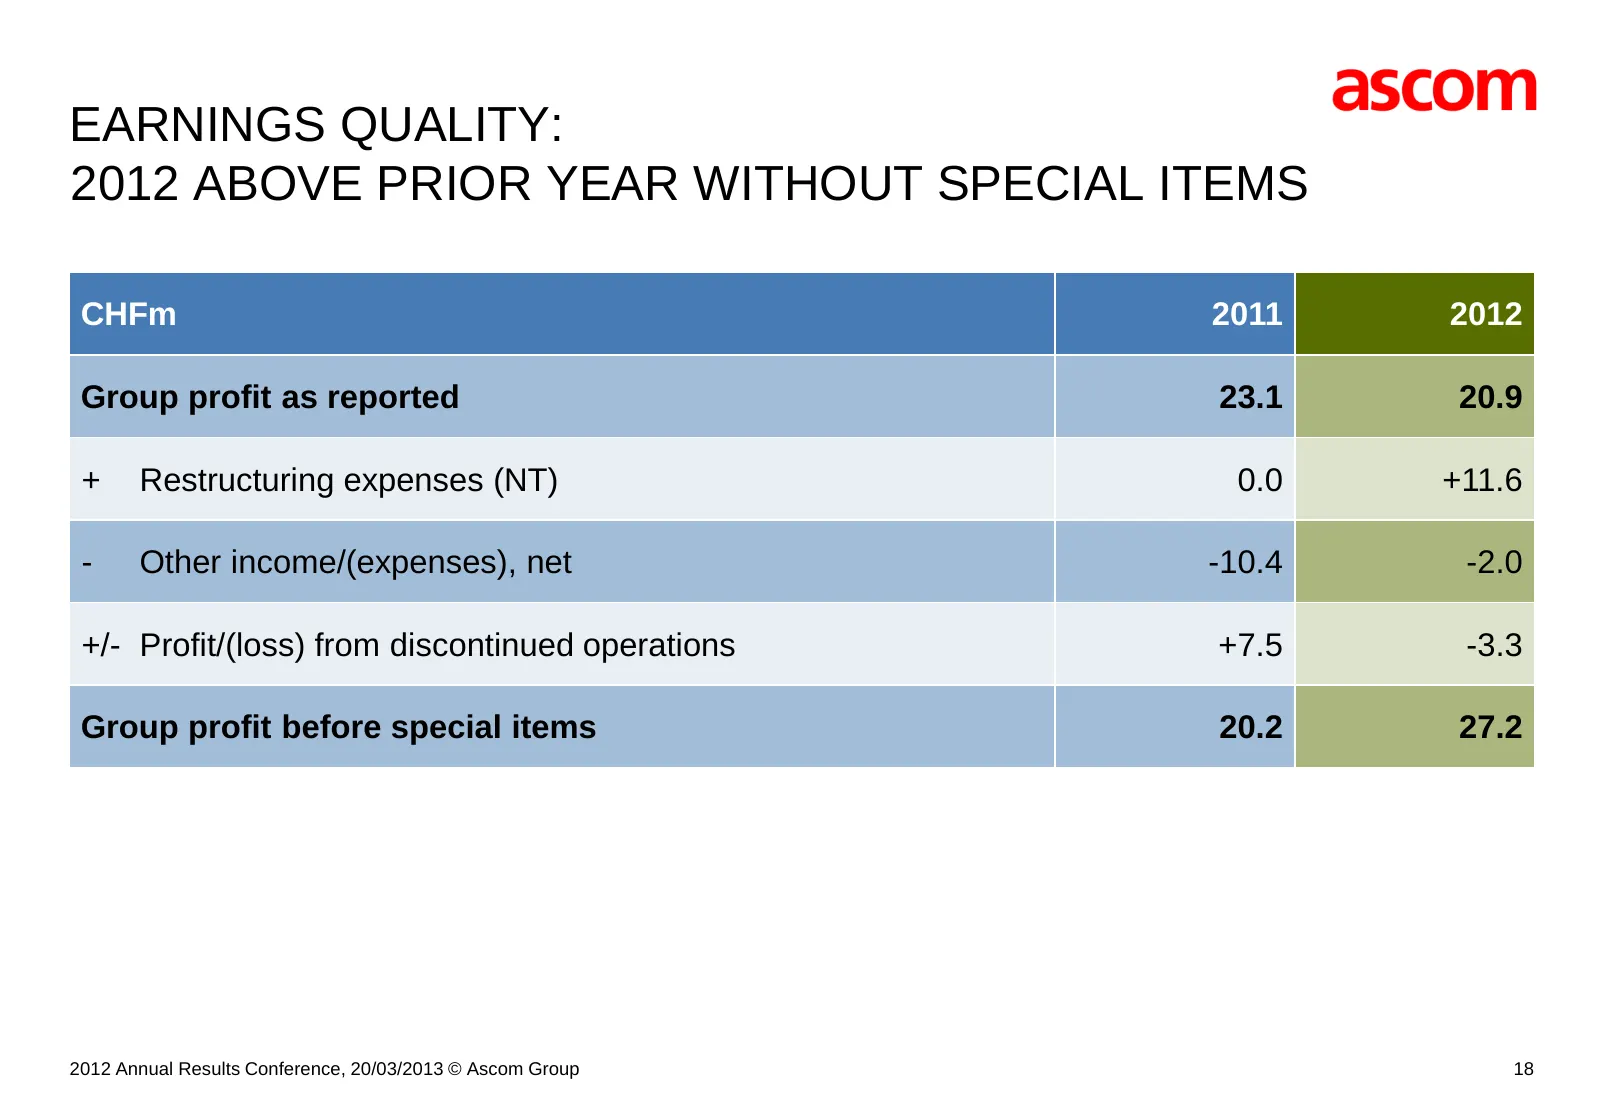
Slide 18: Earnings Quality: 2012 Above Prior Year Without Special Items
EARNINGS QUALITY: 2012 ABOVE PRIOR YEAR WITHOUT SPECIAL ITEMS CHFm 2011 2012 Group profit as reported 23.1 20.9 + Restructuring expenses (NT) 0.0 +11.6 - Other income/(expenses), net -10.4 -2.0 +/- Profit/(loss) from discontinued operations +7.5 -3.3 Group profit before special items 20.2 27.2 2012
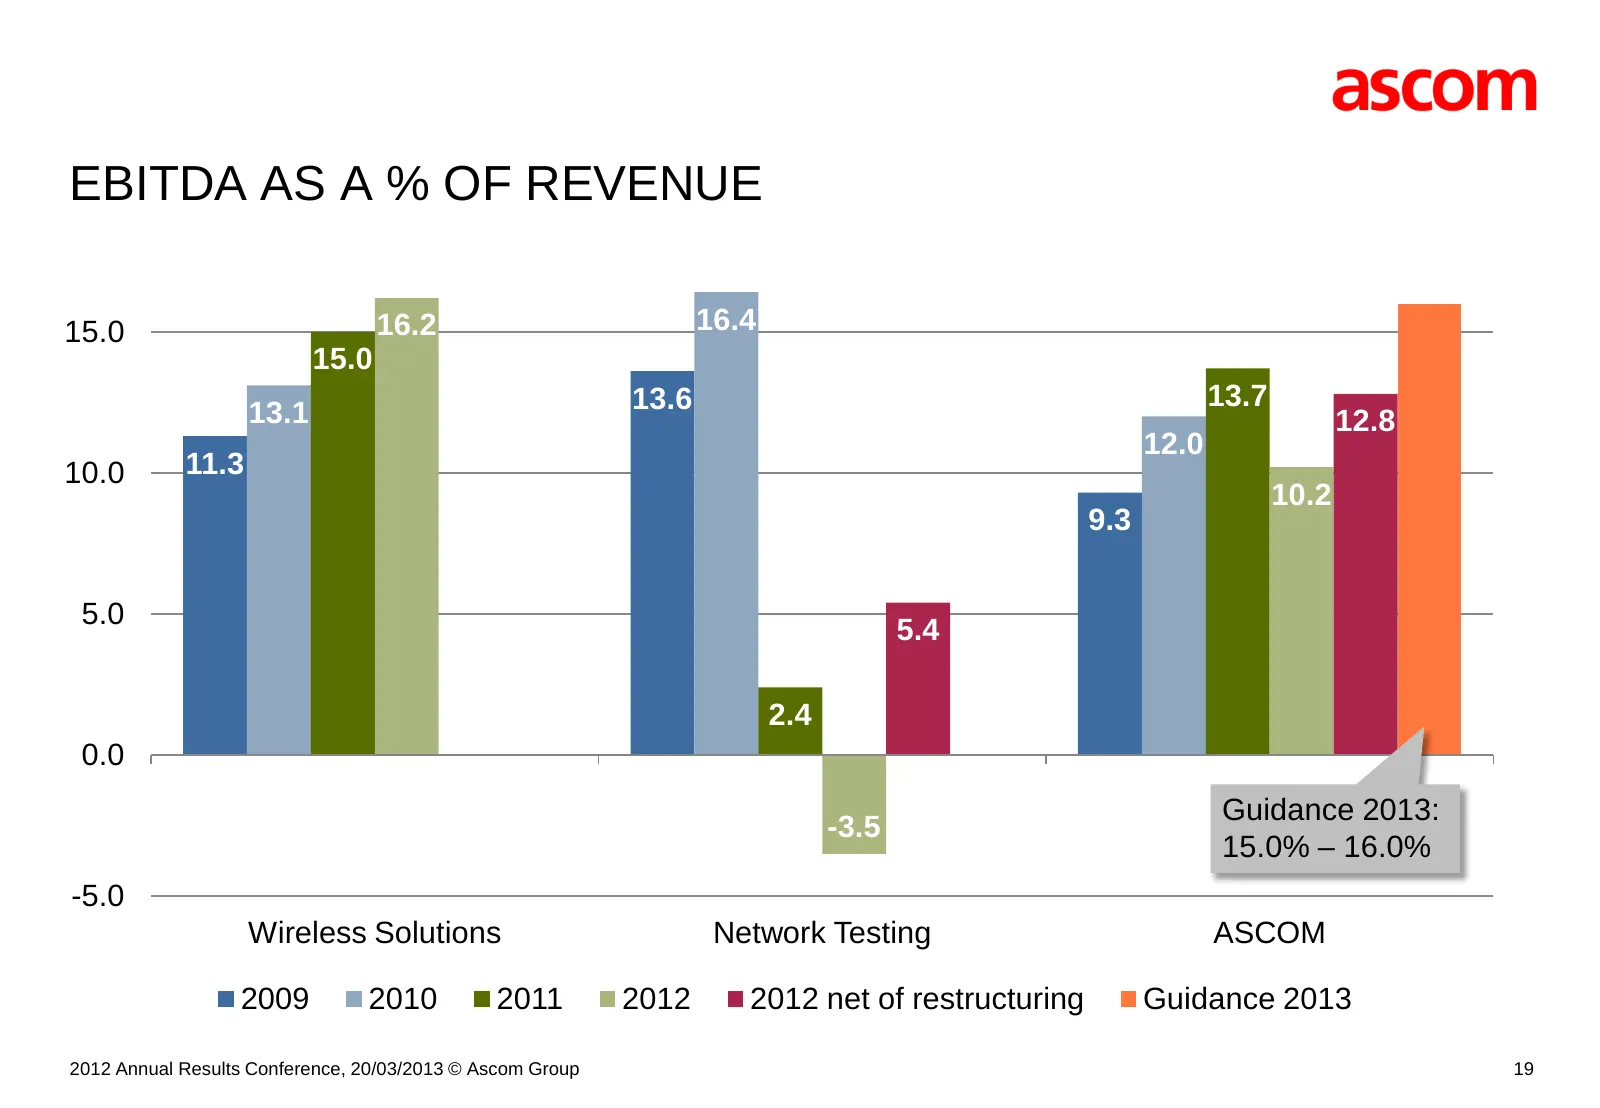
Slide 19: EBITDA as a % of Revenue
EBITDA AS A % OF REVENUE 15.0 16.2 16.4 15.0 13.6 13.7 13.1 12.8 12.0 10.0 11.3 10.2 9.3 5.0 5.4 2.4 0.0 Guidance 2013: -3.5 15.0% – 16.0% -5.0 Wireless Solutions Network Testing ASCOM 2009 2010 2011 2012 2012 net of restructuring Guidance 2013 2012 Annual Results Conference, 20/03/2013 © Ascom Grou
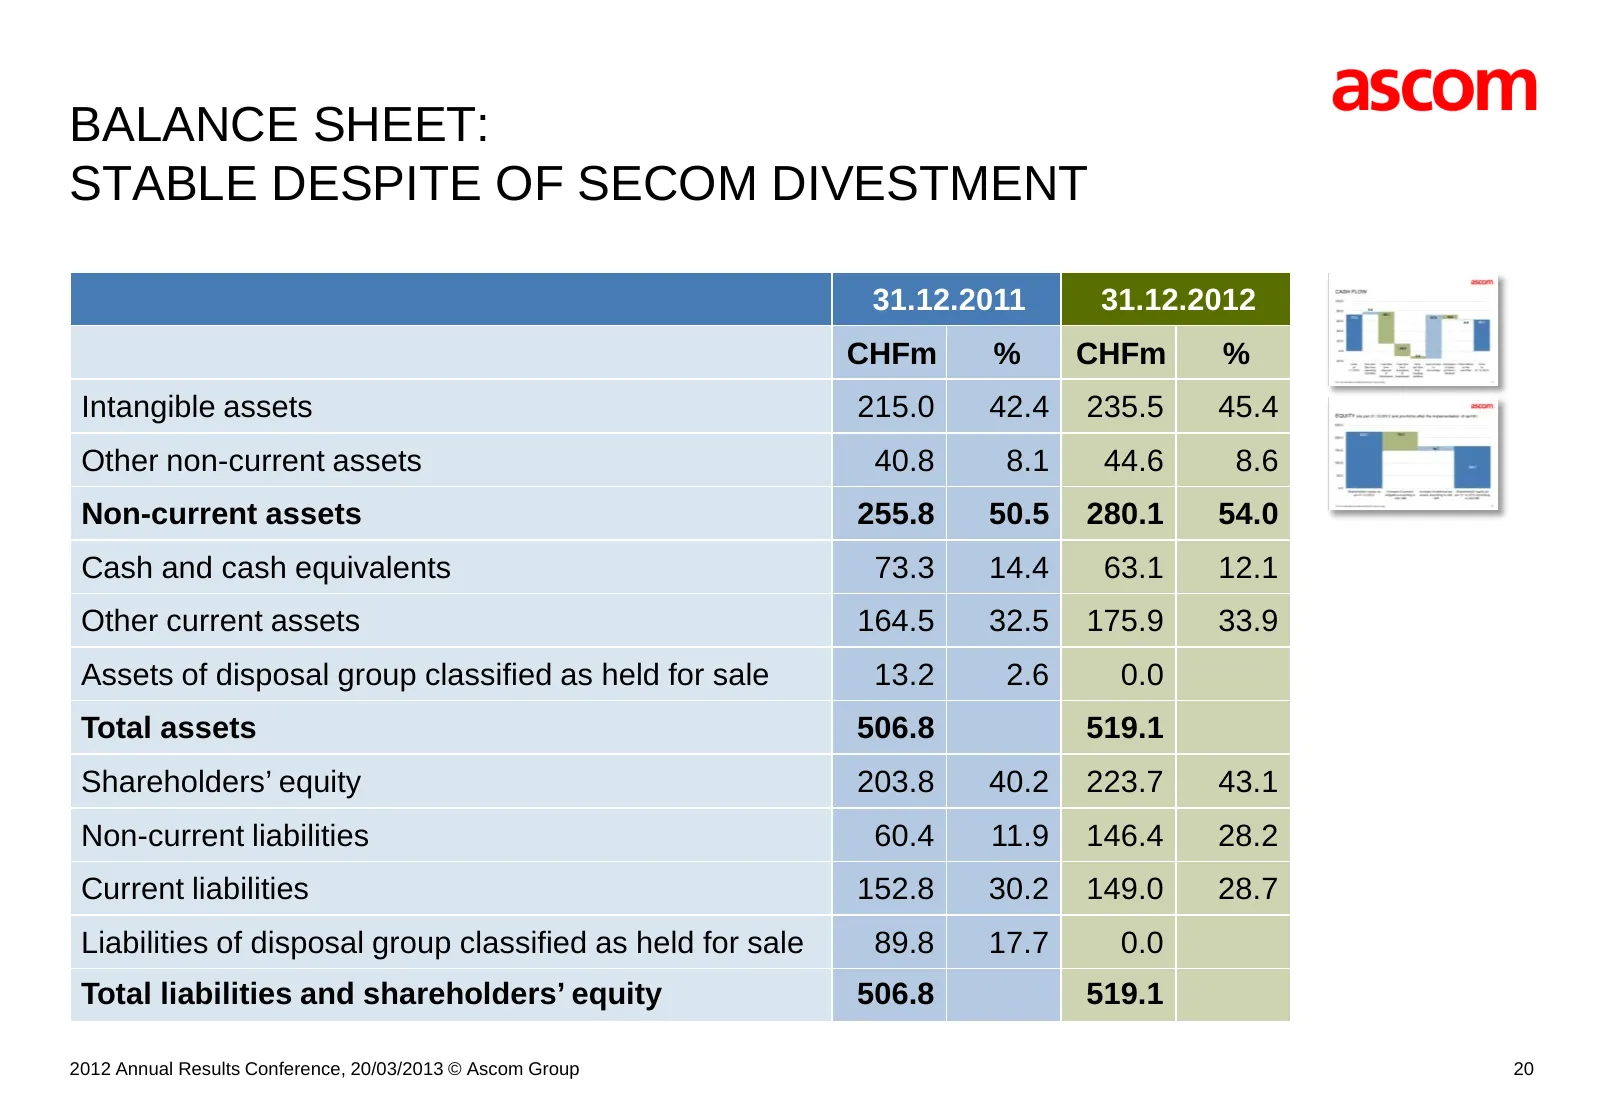
Slide 20: Balance Sheet: Stable Despite Secom Divestment
BALANCE SHEET: STABLE DESPITE OF SECOM DIVESTMENT 31.12.2011 31.12.2012 CHFm % CHFm % Intangible assets 215.0 42.4 235.5 45.4 Other non-current assets 40.8 8.1 44.6 8.6 Non-current assets 255.8 50.5 280.1 54.0 Cash and cash equivalents 73.3 14.4 63.1 12.1 Other current assets 164.5 32.5 175.9 33.9 A
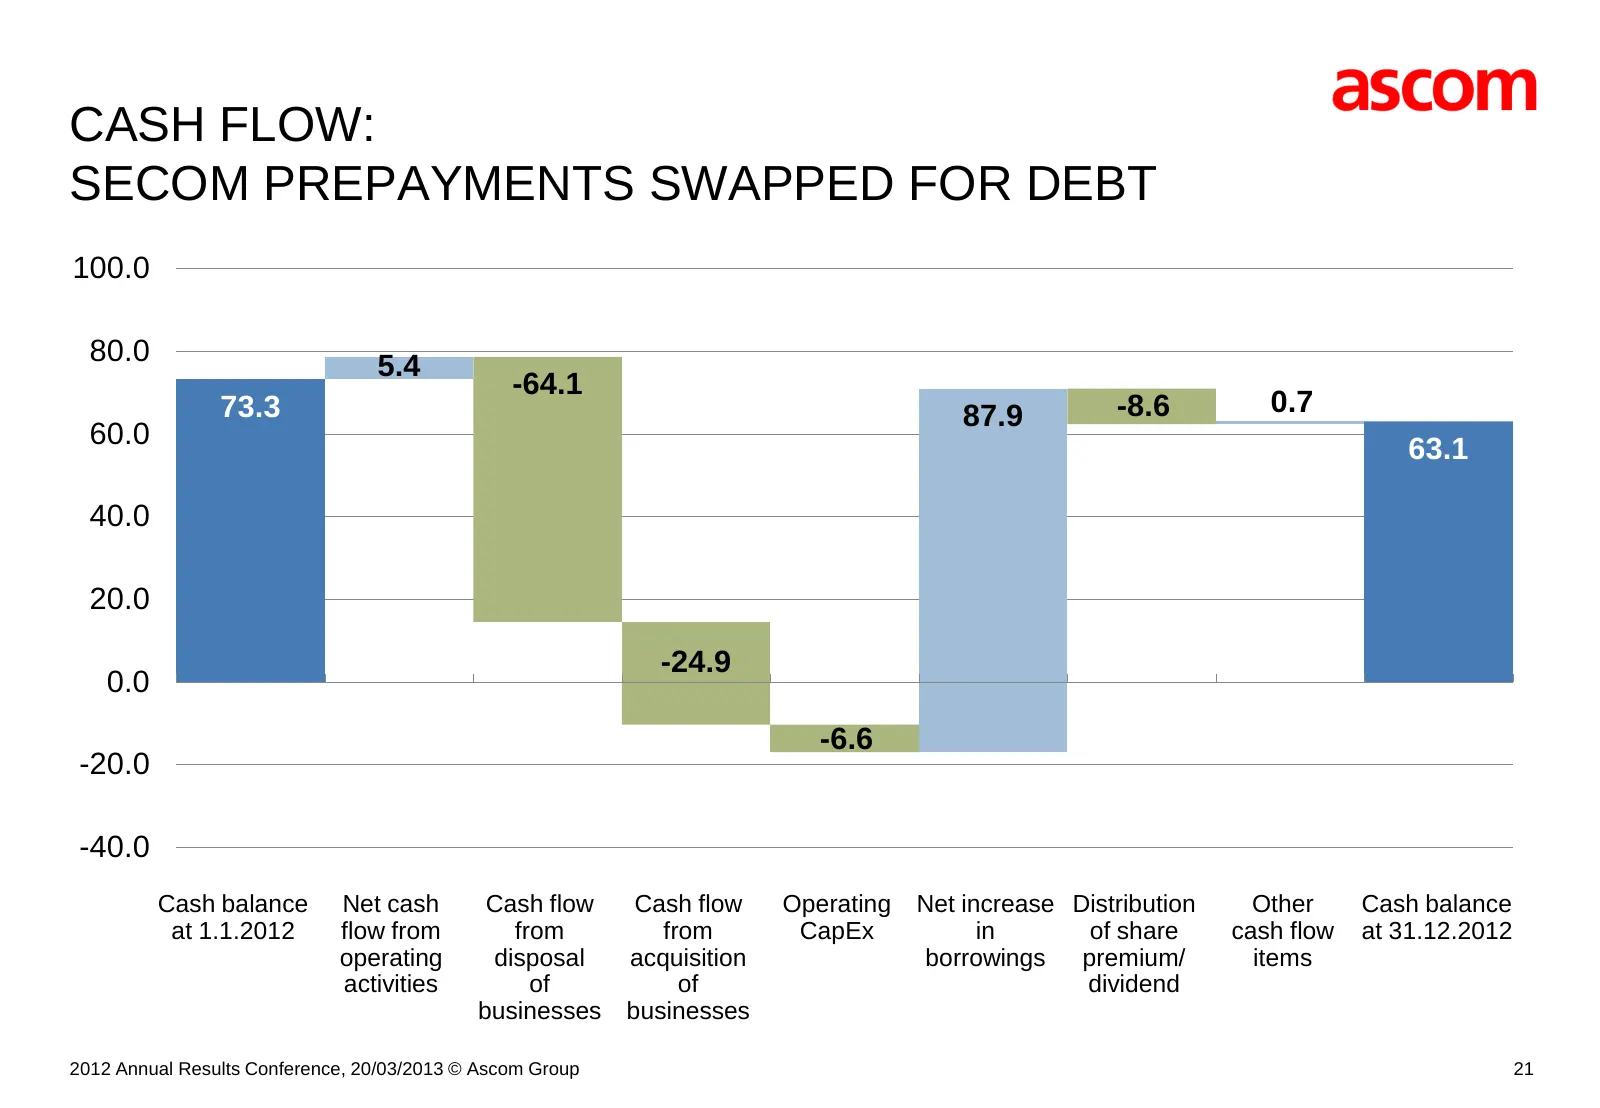
Slide 21: Cash Flow: Secom Prepayments Swapped for Debt
CASH FLOW: SECOM PREPAYMENTS SWAPPED FOR DEBT 100.0 80.0 5.4 -64.1 73.3 87.9 -8.6 0.7 60.0 63.1 40.0 20.0 -24.9 0.0 -6.6 -20.0 -40.0 Cash balance Net cash Cash flow Cash flow Operating Net increase Distribution Other Cash balance at 1.1.2012 flow from from from CapEx in of share cash flow at 31.12.2
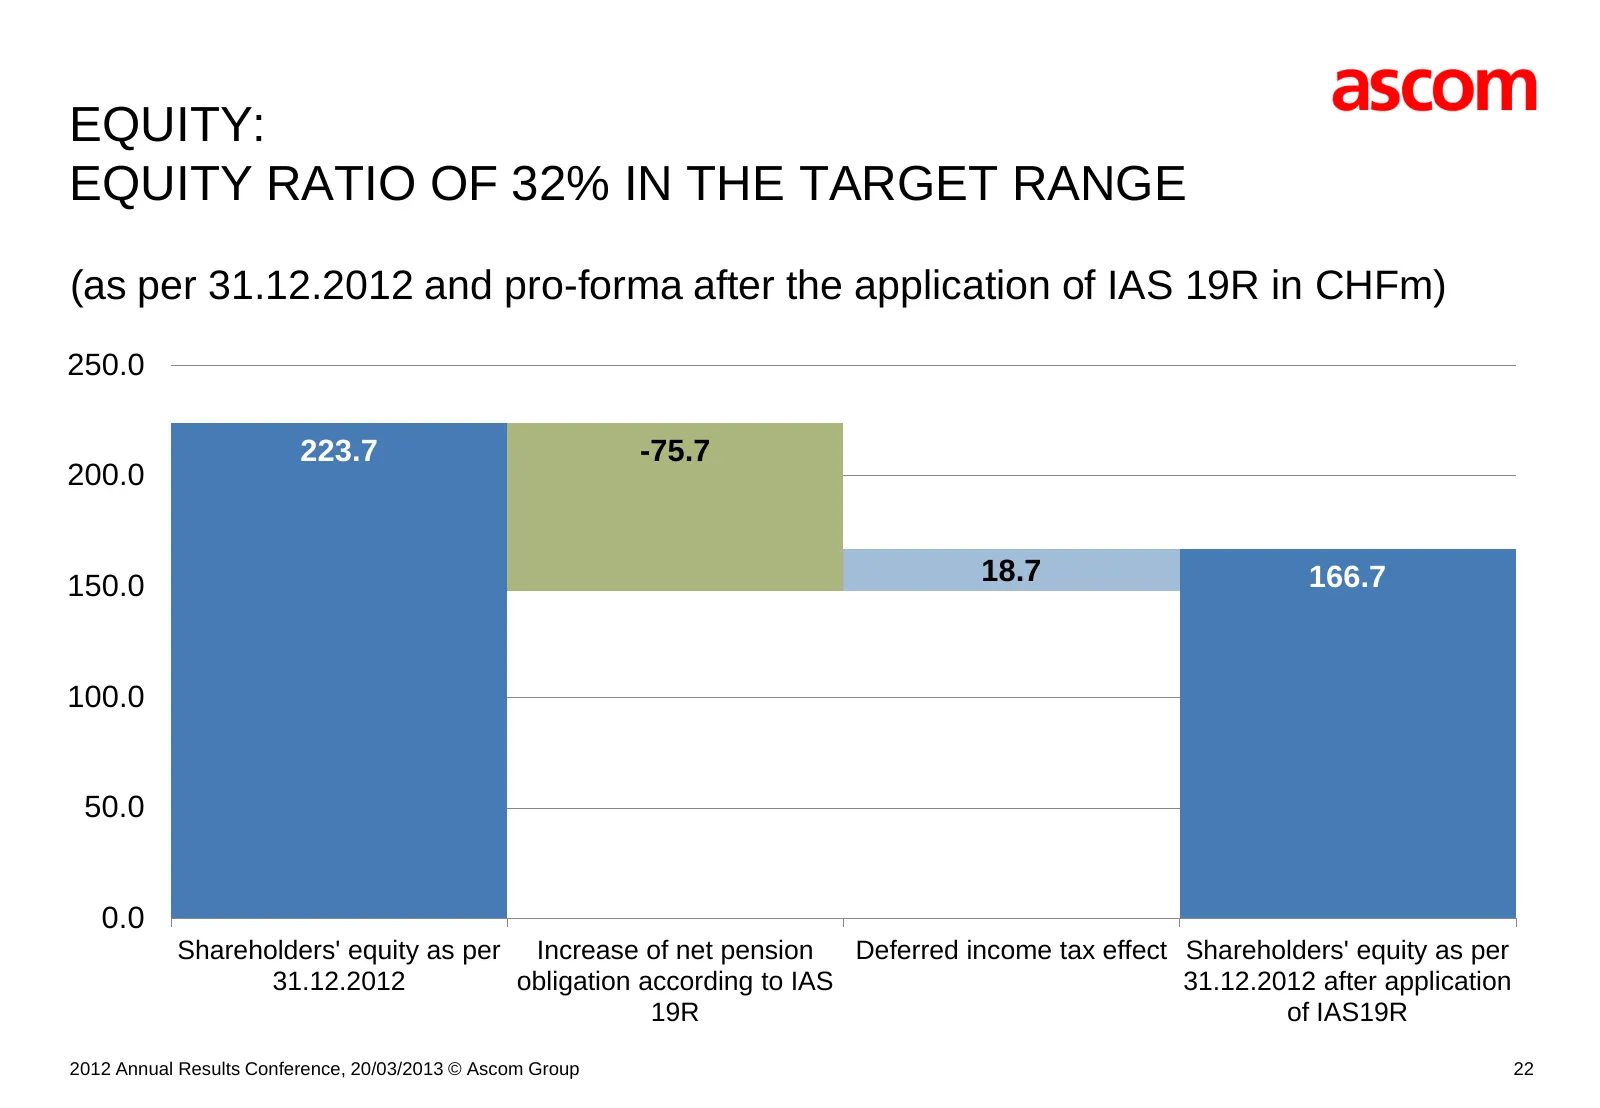
Slide 22: Equity: Equity Ratio of 32% in the Target Range
EQUITY: EQUITY RATIO OF 32% IN THE TARGET RANGE (as per 31.12.2012 and pro-forma after the application of IAS 19R in CHFm) 250.0 223.7 -75.7 200.0 150.0 18.7 166.7 100.0 50.0 0.0 Shareholders' equity as per Increase of net pension Deferred income tax effect Shareholders' equity as per 31.12.2012 obl
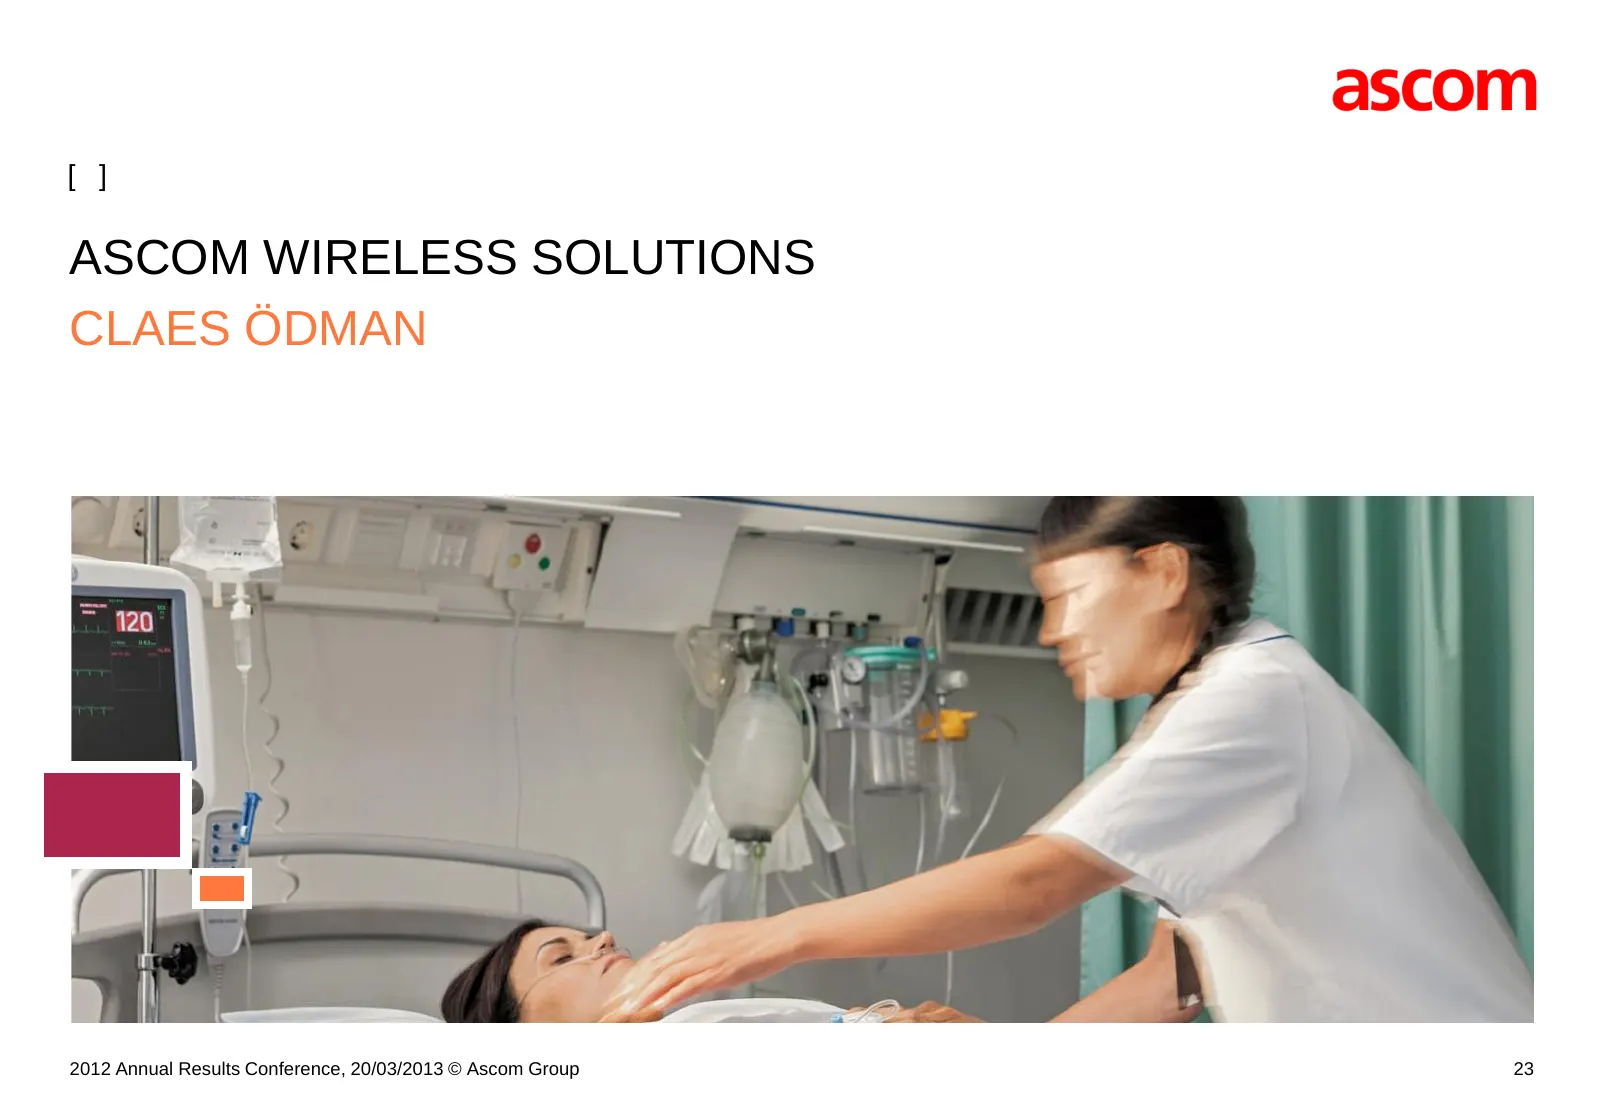
Slide 23: Ascom Wireless Solutions
[ ] ASCOM WIRELESS SOLUTIONS CLAES ÖDMAN 2012 Annual Results Conference, 20/03/2013 © Ascom Group 23
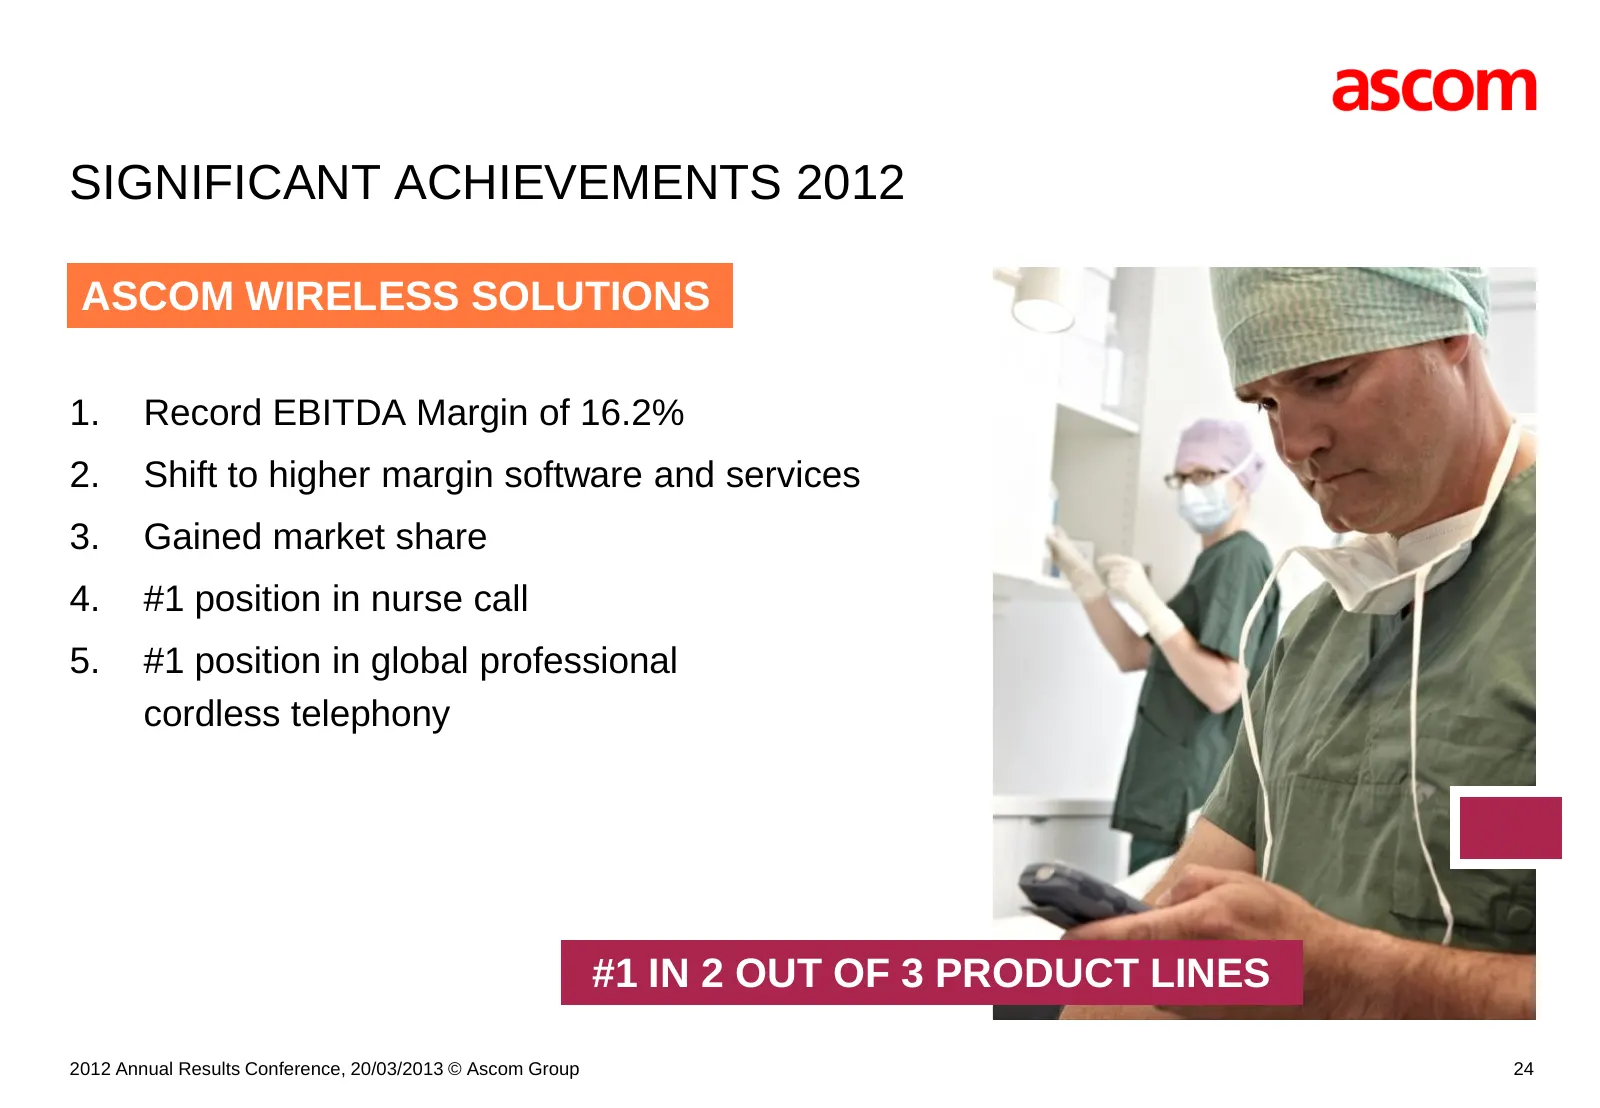
Slide 24: Significant Achievements 2012
SIGNIFICANT ACHIEVEMENTS 2012 ASCOM ASCOMWIRELESS WIRELESSSOLUTIONS SOLUTIONS 1. Record EBITDA Margin of 16.2% 2. Shift to higher margin software and services 3. Gained market share 4. #1 position in nurse call 5. #1 position in global professional cordless telephony #1 IN 2 OUT OF 3 PRODUCT LINES 2
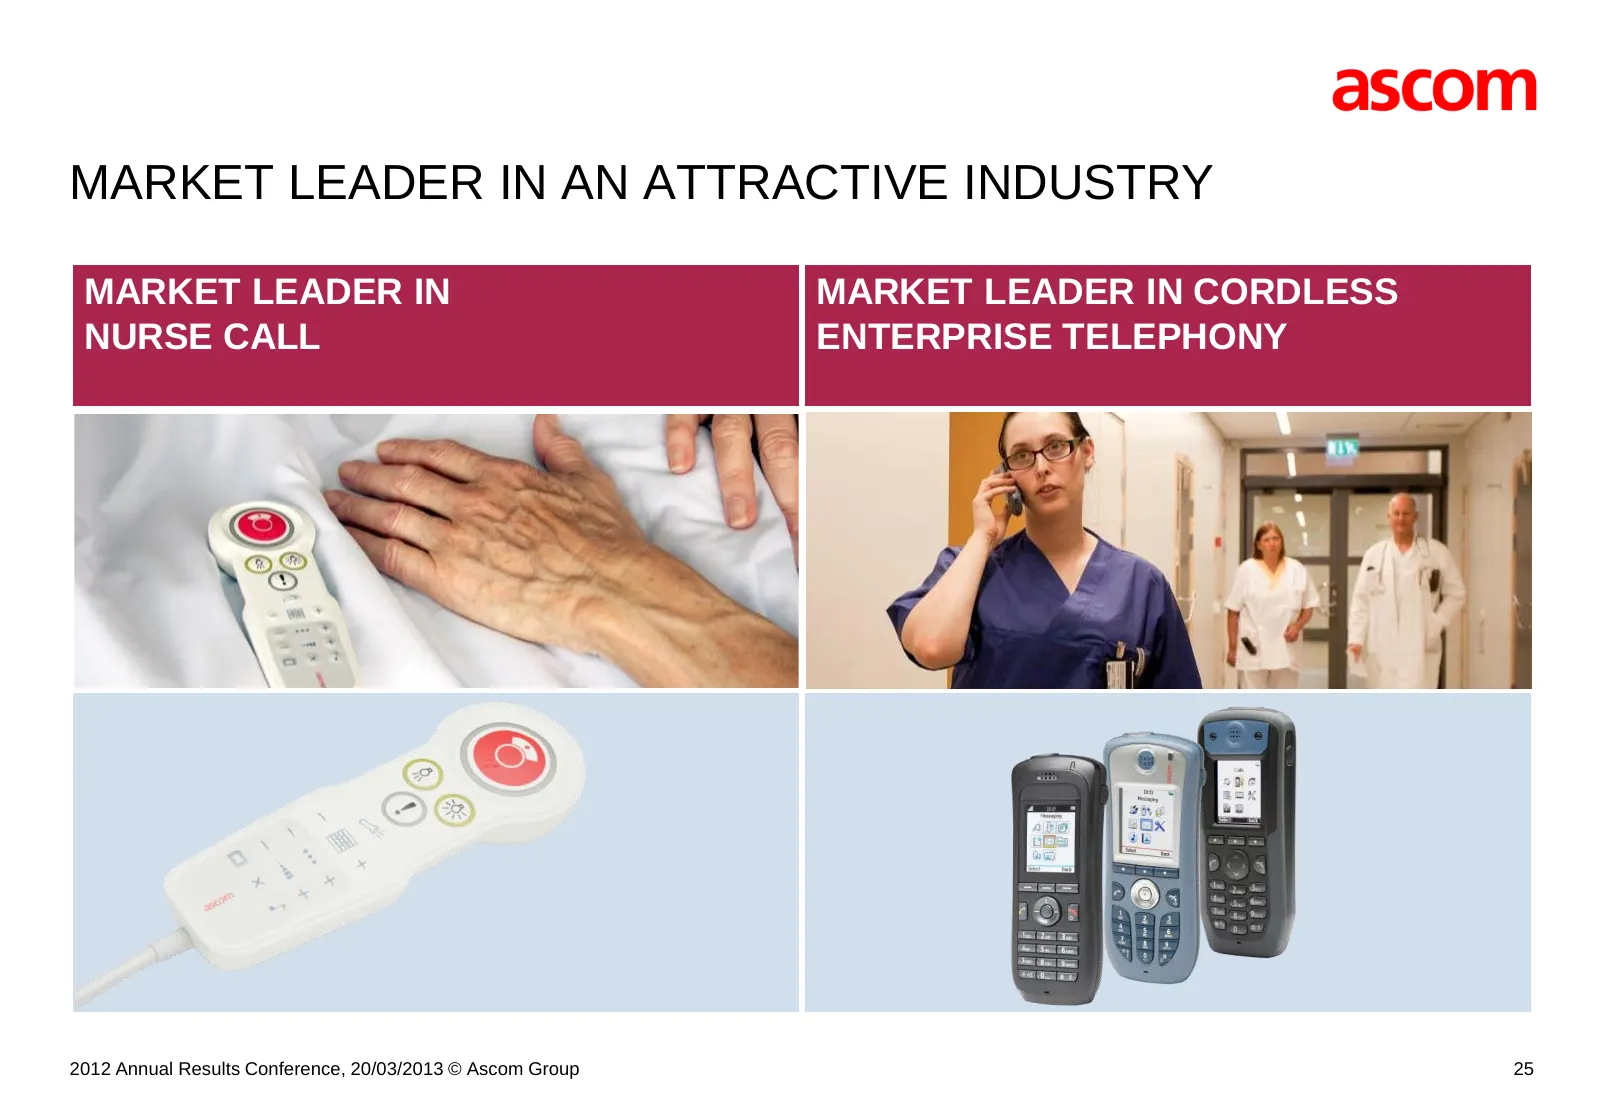
Slide 25: Market Leader in an Attractive Industry
MARKET LEADER IN AN ATTRACTIVE INDUSTRY MARKET LEADER IN MARKET LEADER IN CORDLESS NURSE CALL ENTERPRISE TELEPHONY 2012 Annual Results Conference, 20/03/2013 © Ascom Group 25
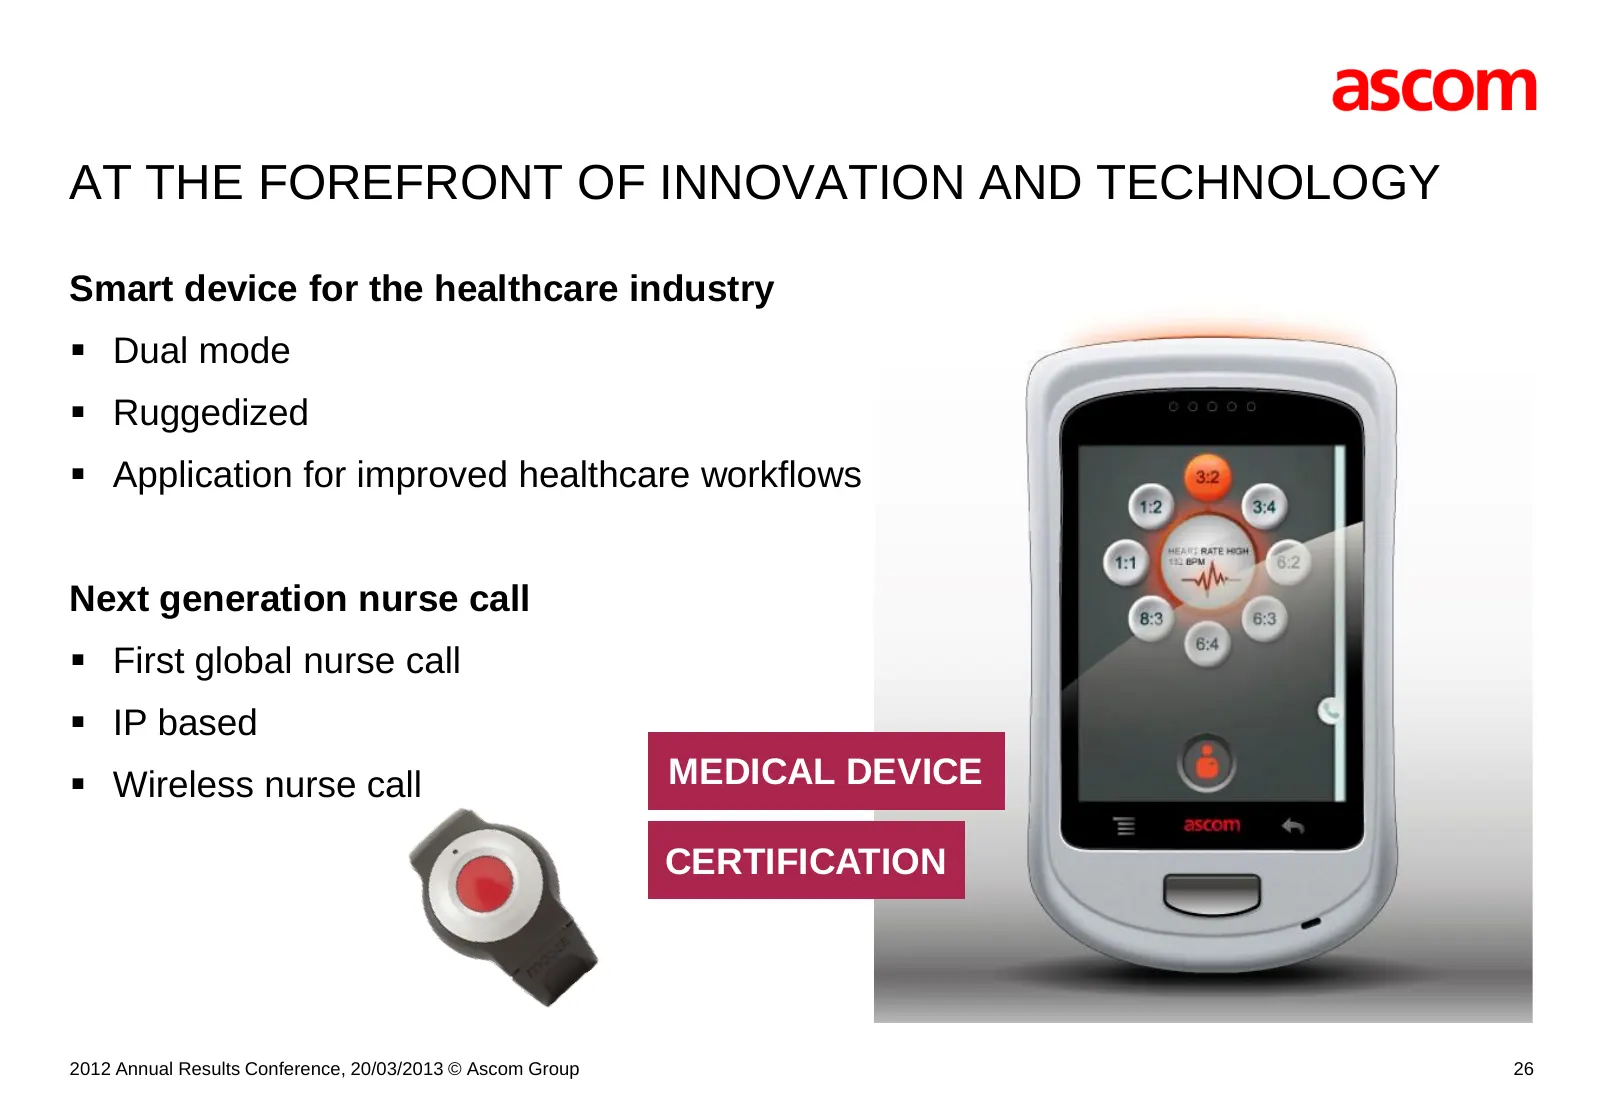
Slide 26: At the Forefront of Innovation and Technology
AT THE FOREFRONT OF INNOVATION AND TECHNOLOGY Smart device for the healthcare industry Dual mode Ruggedized Application for improved healthcare workflows Next generation nurse call First global nurse call IP based Wireless nurse call MEDICAL DEVICE CERTIFICATION 2012 Annual Results Confe
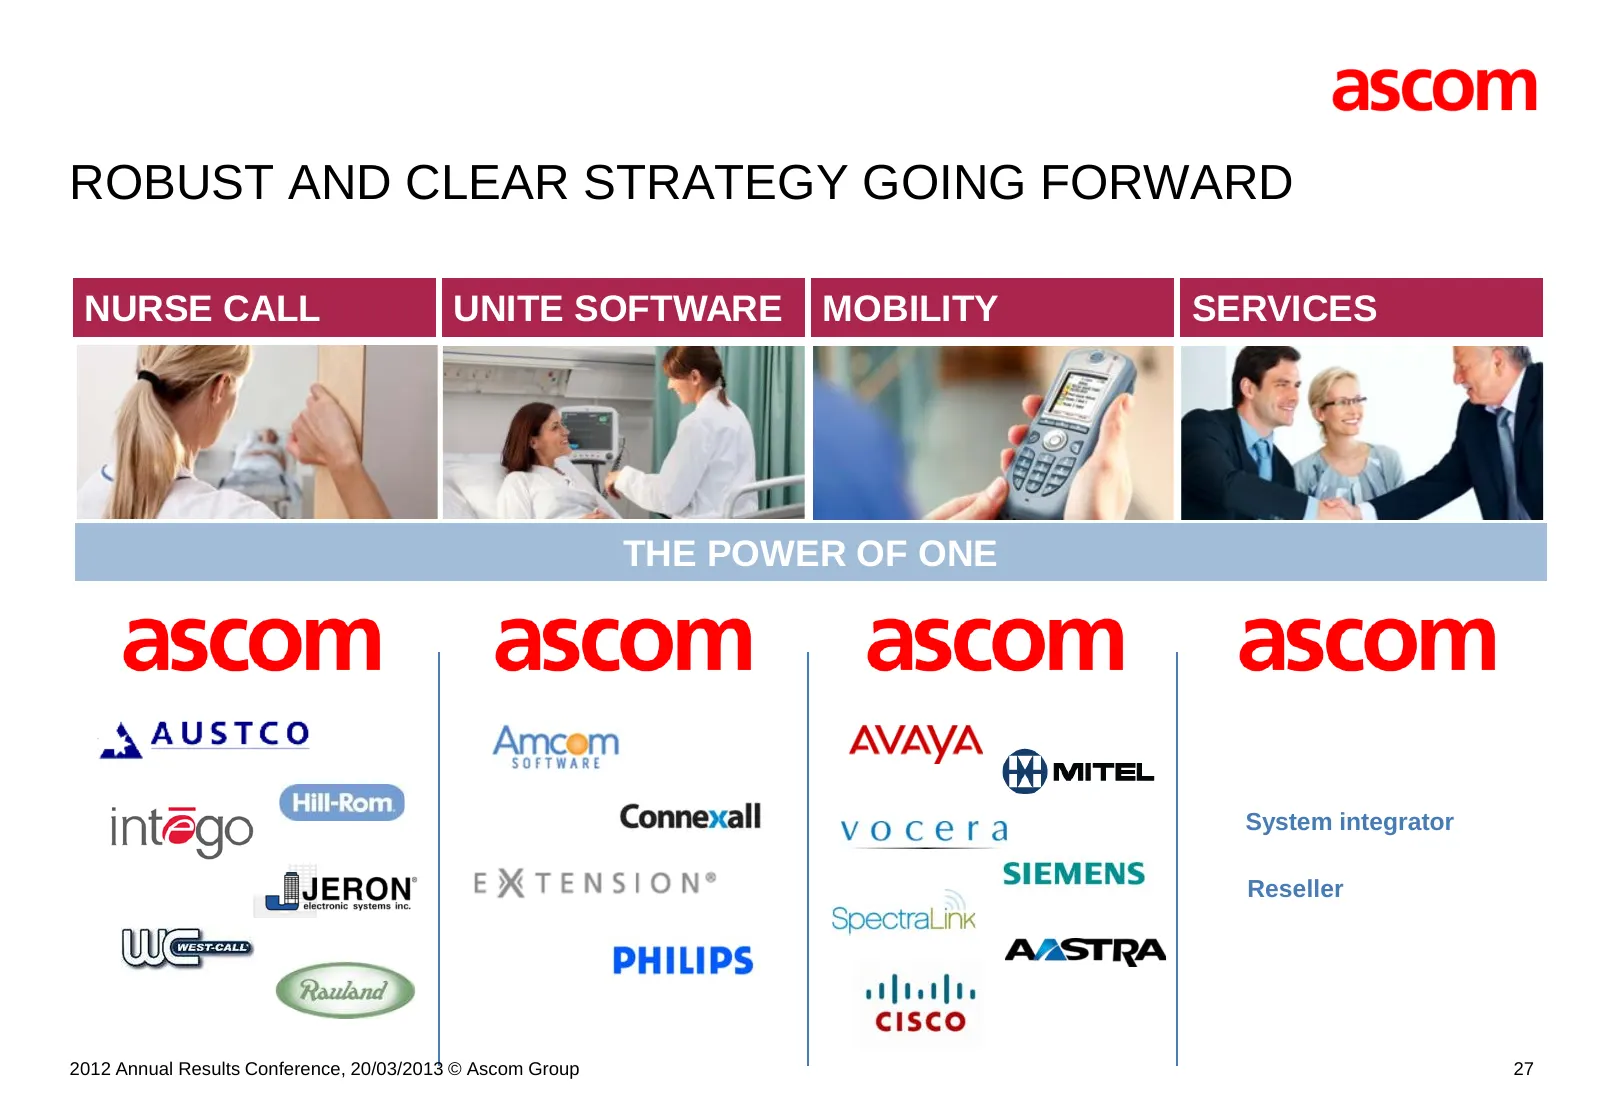
Slide 27: Robust and Clear Strategy Going Forward
ROBUST AND CLEAR STRATEGY GOING FORWARD NURSE CALL UNITE SOFTWARE MOBILITY SERVICES THE POWER OF ONE System integrator Reseller 2012 Annual Results Conference, 20/03/2013 © Ascom Group 27
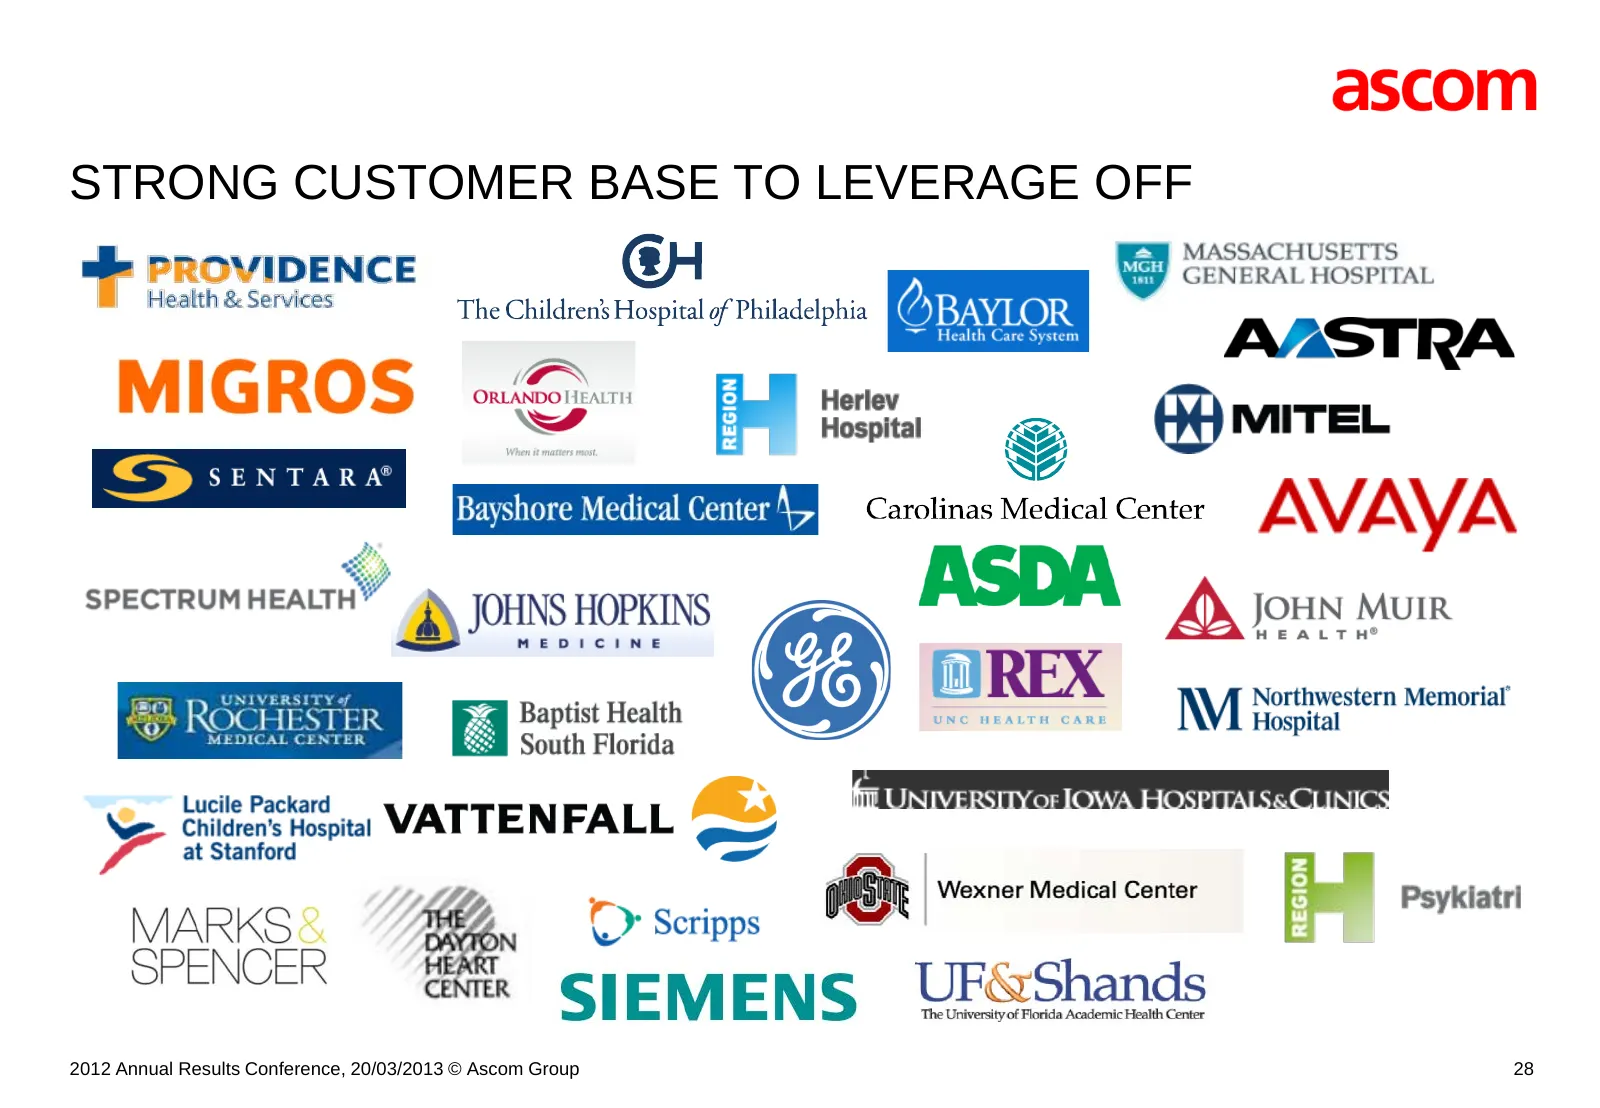
Slide 28: Strong Customer Base to Leverage Off
STRONG CUSTOMER BASE TO LEVERAGE OFF 2012 Annual Results Conference, 20/03/2013 © Ascom Group 28
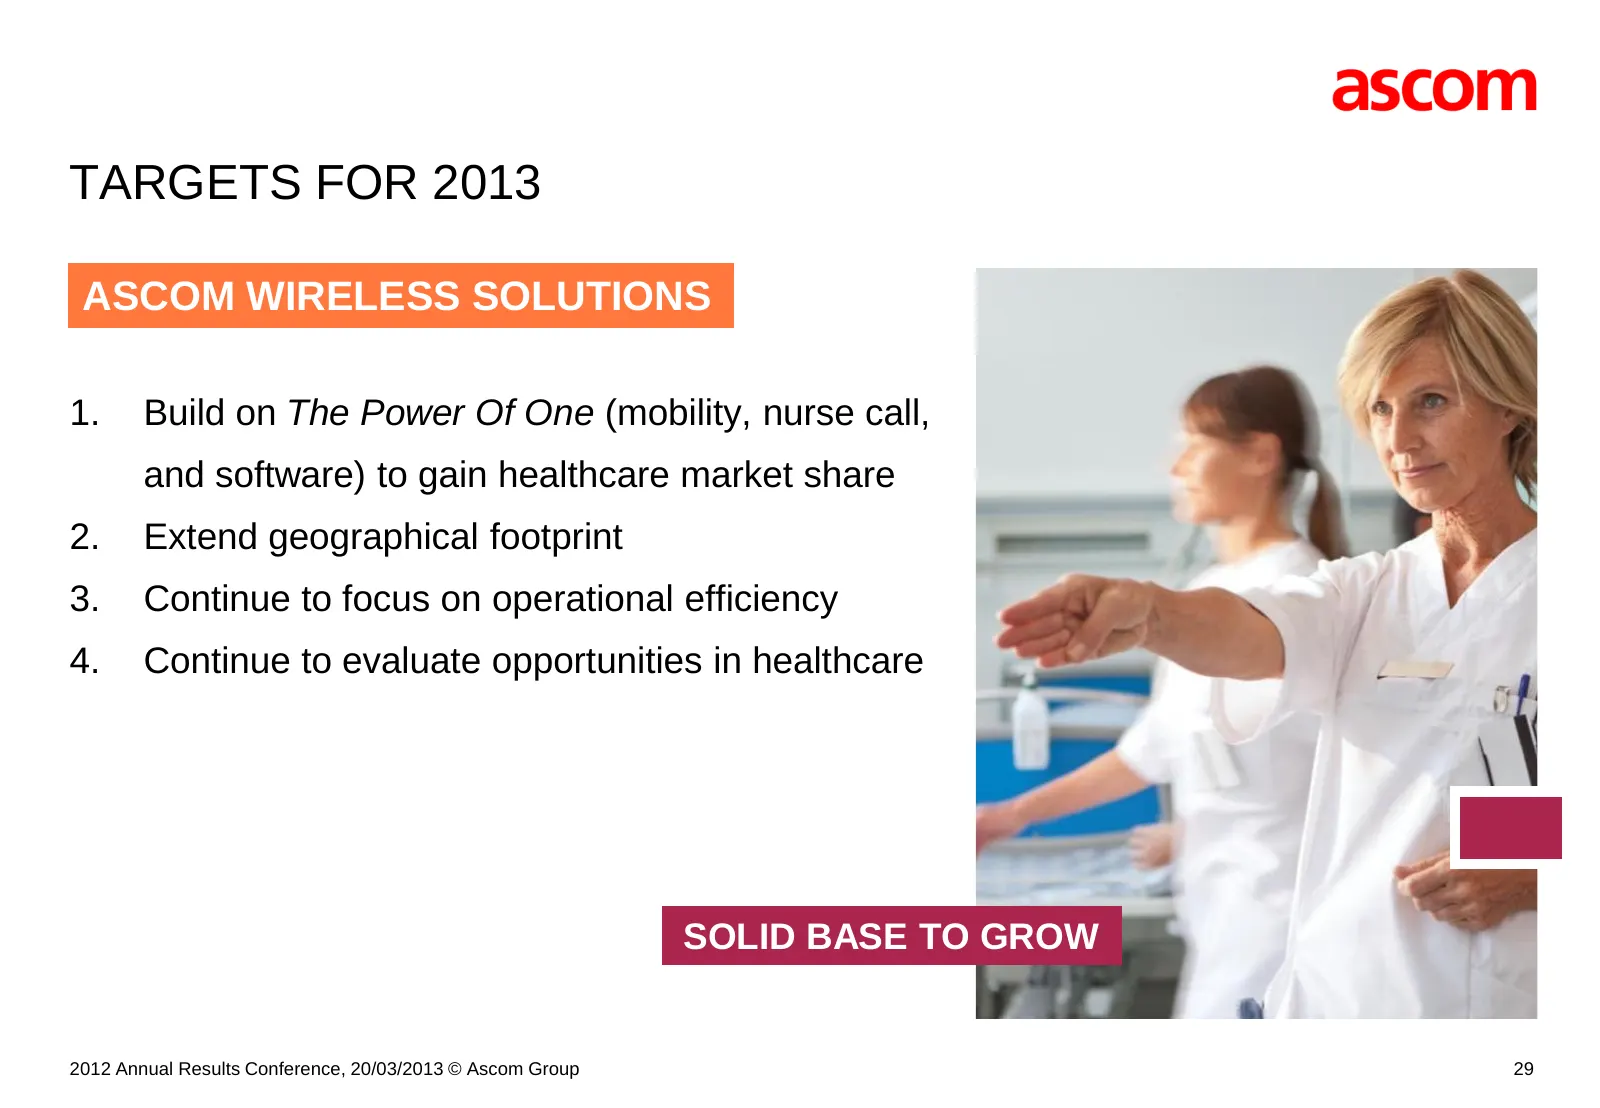
Slide 29: Targets for 2013
TARGETS FOR 2013 ASCOM ASCOMWIRELESS WIRELESSSOLUTIONS SOLUTIONS 1. Build on The Power Of One (mobility, nurse call, and software) to gain healthcare market share 2. Extend geographical footprint 3. Continue to focus on operational efficiency 4. Continue to evaluate opportunities in healthcare SOLID
Slide 30: Ascom Network Testing
[ ] ASCOM NETWORK TESTING RIKARD LUNDQVIST 2012 Annual Results Conference, 20/03/2013 © Ascom Group 30
Slide 31: Significant Achievements 2012
SIGNIFICANT ACHIEVEMENTS 2012 ASCOM NETWORK TESTING 1. Diligently and timely executed restructuring plan resulting in CHF 20 million annualized savings 2. Implemented a new organization more focused on, and closer to the customers 3. Secured world’s largest benchmarking project 4. Maintained global
Slide 32: Market Leader in an Attractive Industry
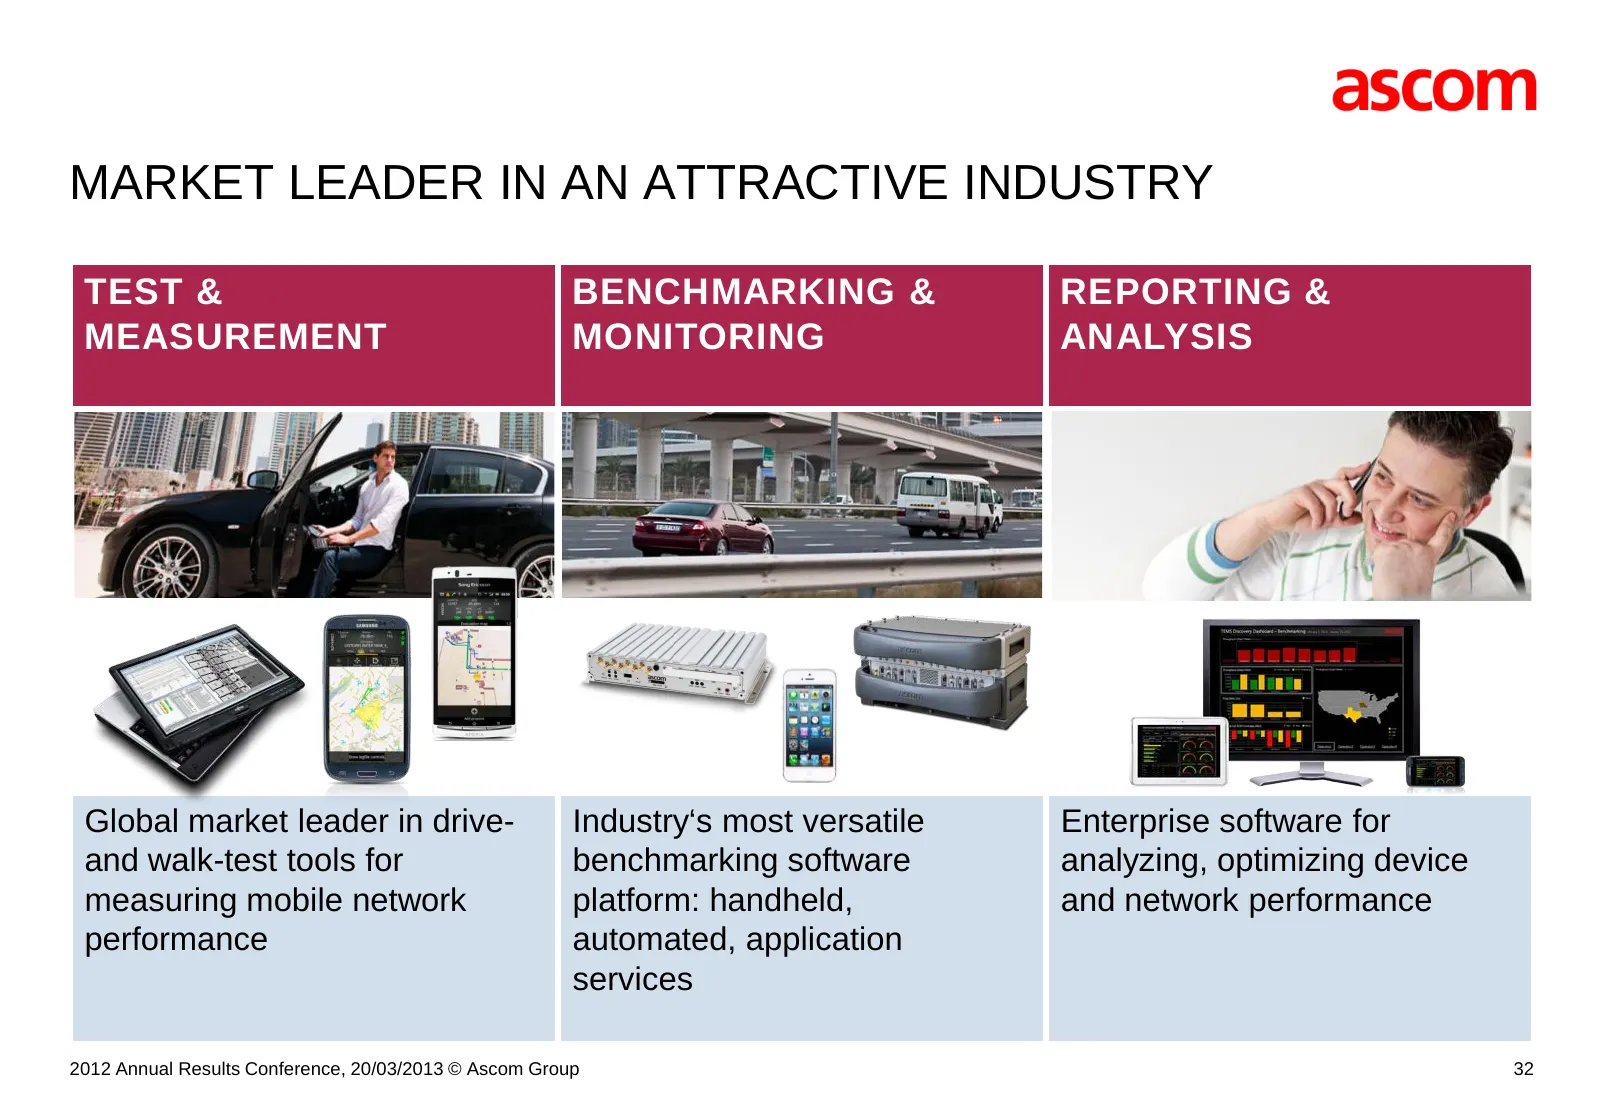
MARKET LEADER IN AN ATTRACTIVE INDUSTRY TEST & BENCHMARKING & REPORTING & MEASUREMENT MONITORING ANALYSIS Global market leader in drive- Industry‘s most versatile Enterprise software for and walk-test tools for benchmarking software analyzing, optimizing device measuring mobile network platform: han
Slide 33: At the Forefront of Innovation and Technology
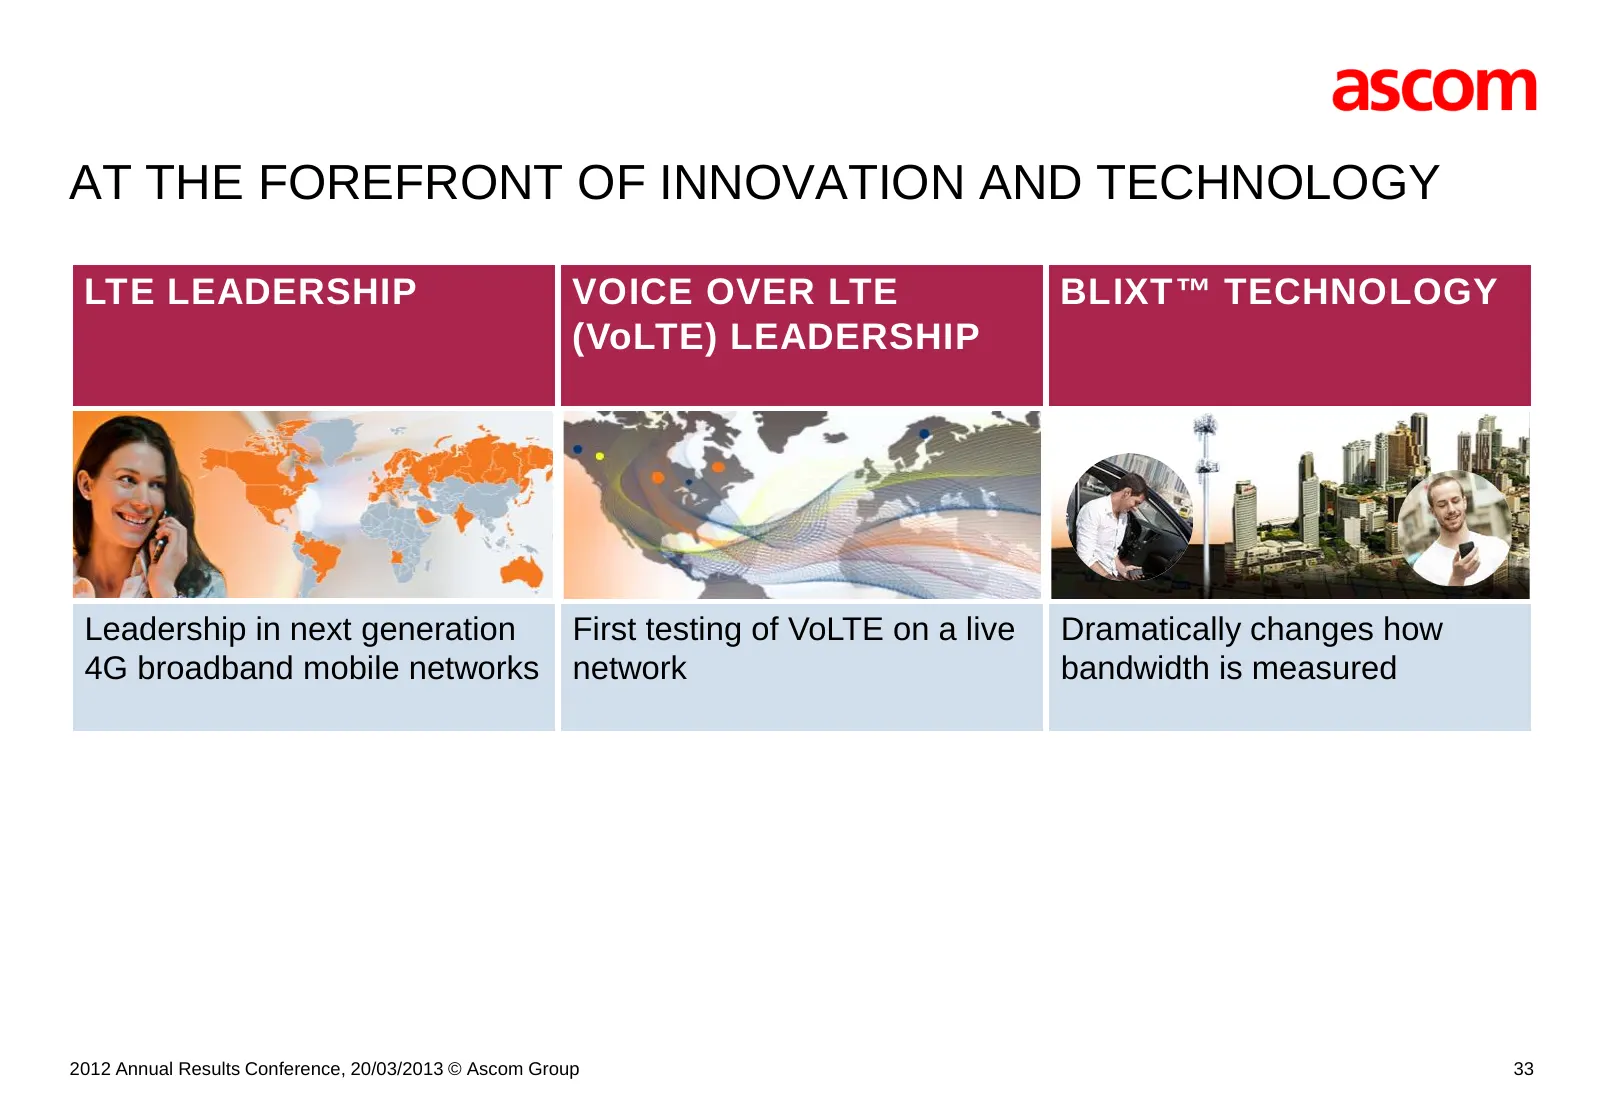
AT THE FOREFRONT OF INNOVATION AND TECHNOLOGY LTE LEADERSHIP VOICE OVER LTE BLIXT™ TECHNOLOGY (VoLTE) LEADERSHIP Leadership in next generation First testing of VoLTE on a live Dramatically changes how 4G broadband mobile networks network bandwidth is measured 2012 Annual Results Conference, 20/03/20
Slide 34: Robust and Clear Strategy Going Forward
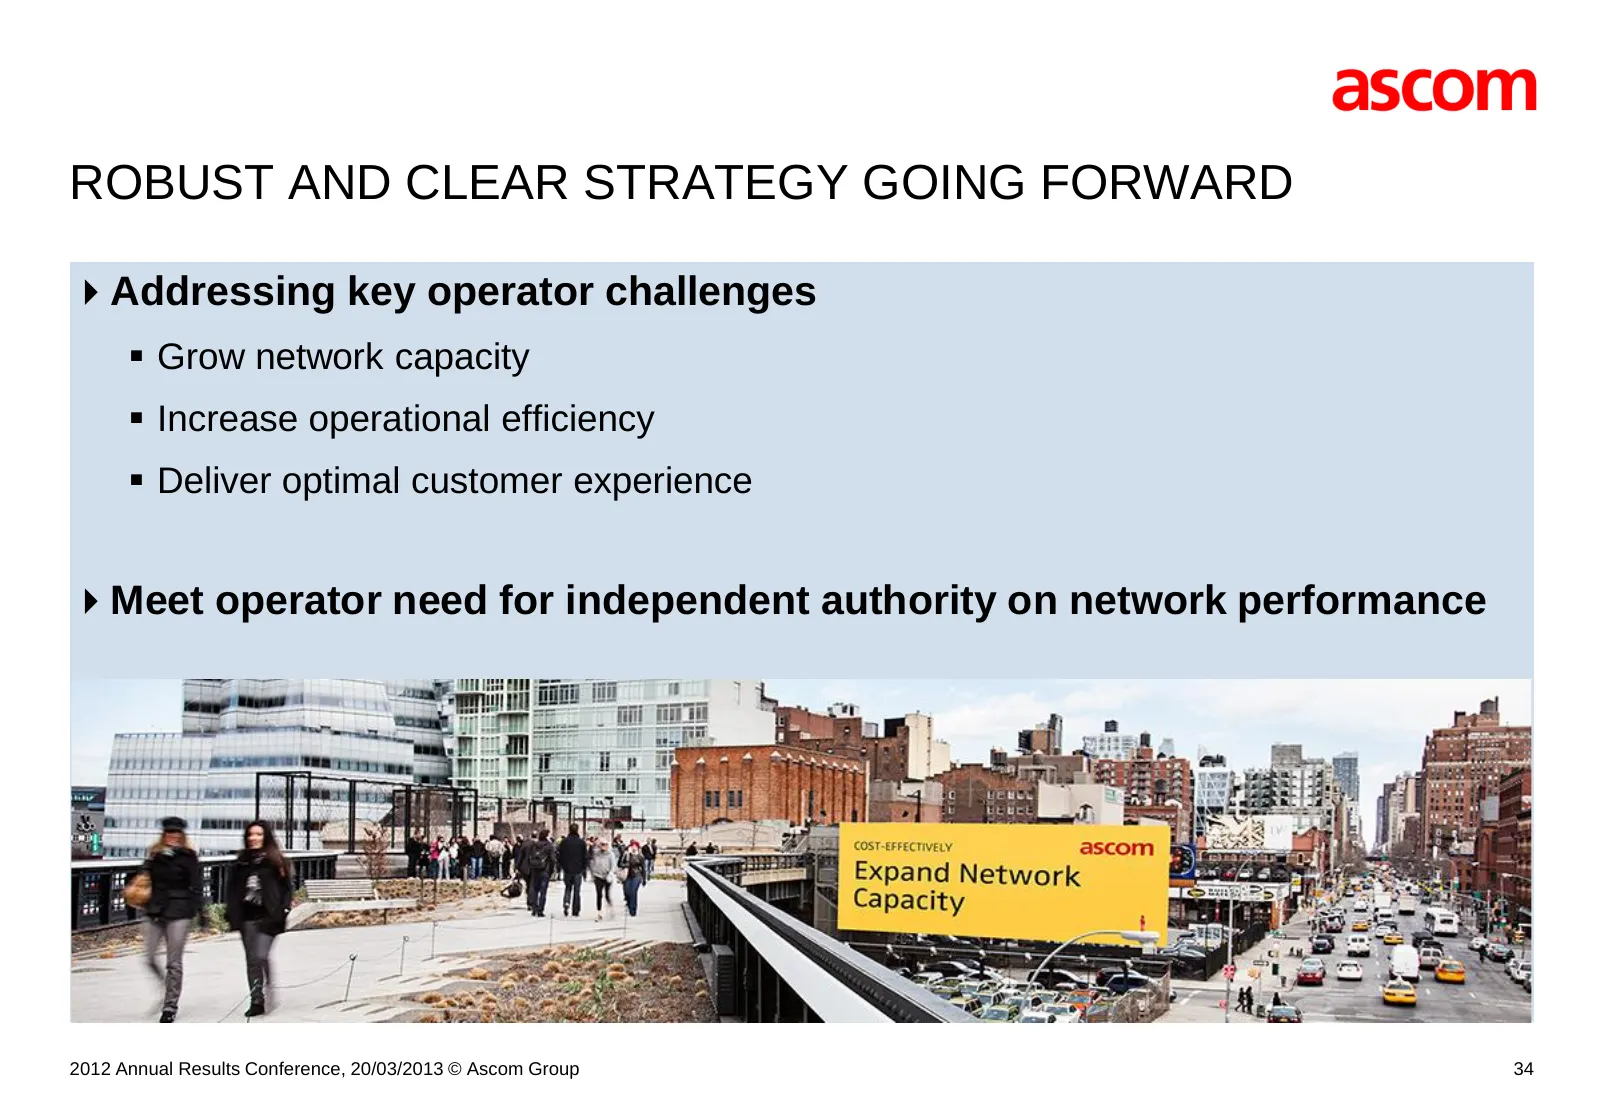
ROBUST AND CLEAR STRATEGY GOING FORWARD Addressing key operator challenges Grow network capacity Increase operational efficiency Deliver optimal customer experience Meet operator need for independent authority on network performance 2012 Annual Results Conference, 20/03/2013 © Ascom Group 34
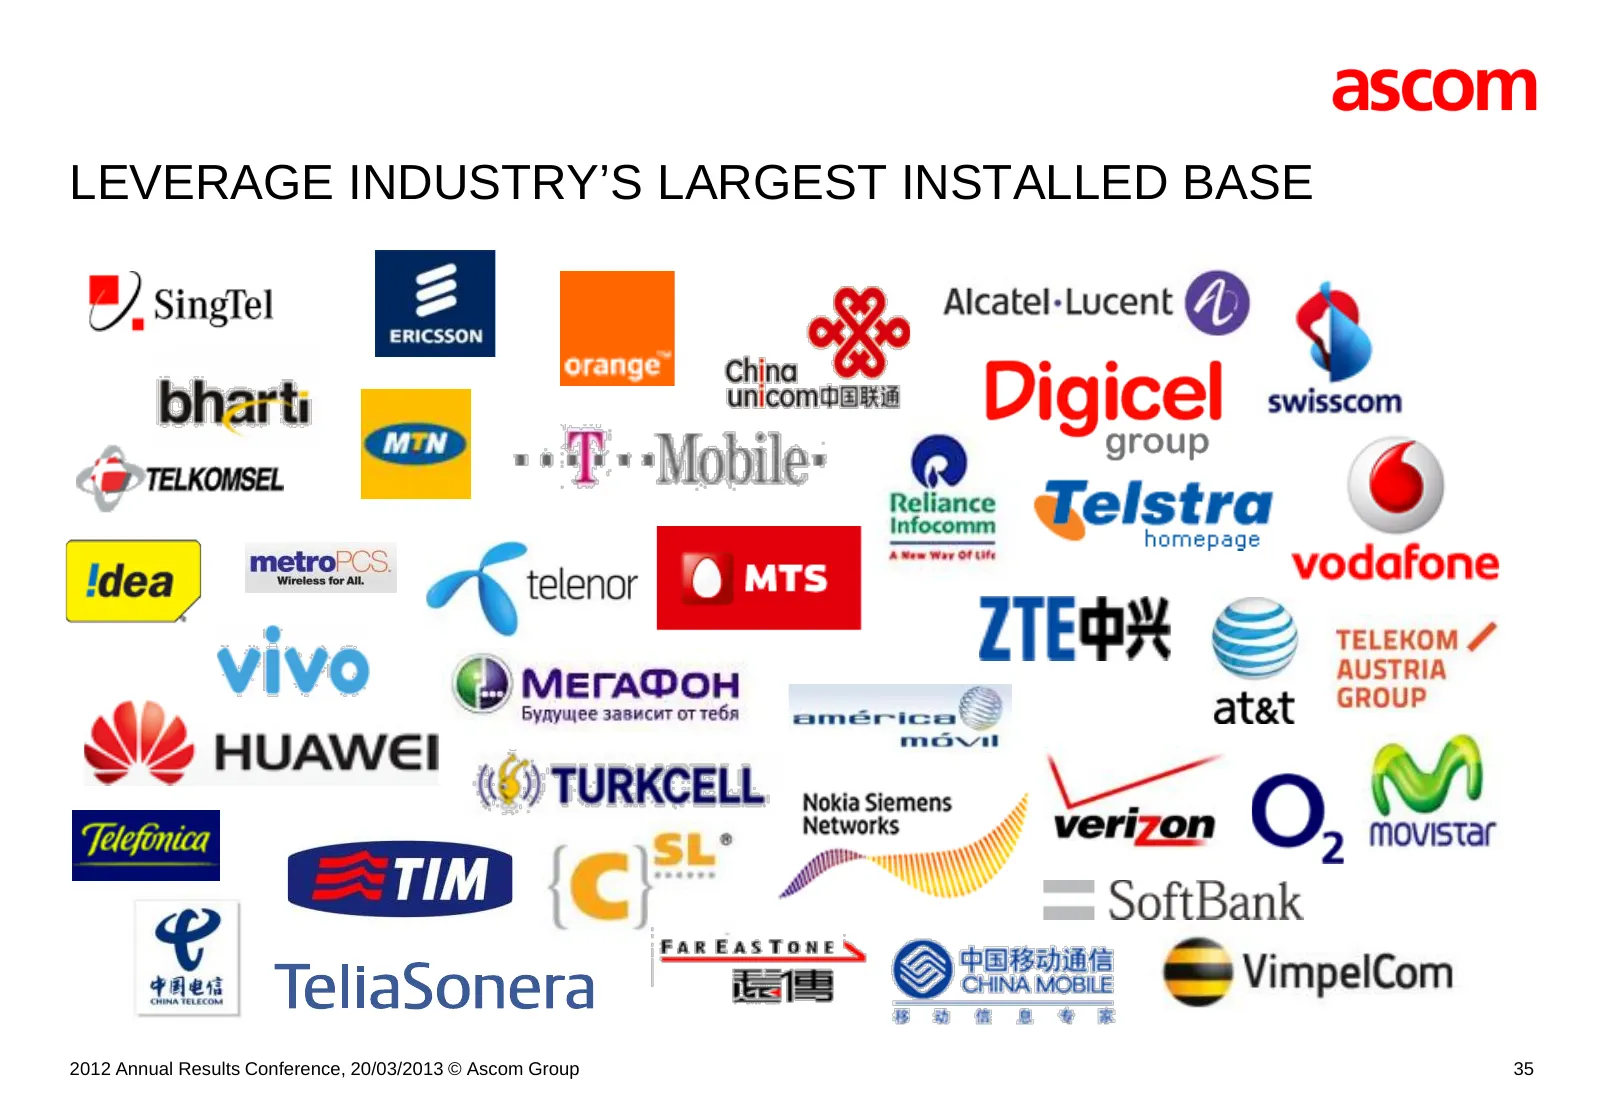
Slide 35: Leverage Industry's Largest Installed Base
LEVERAGE INDUSTRY’S LARGEST INSTALLED BASE 2012 Annual Results Conference, 20/03/2013 © Ascom Group 35
Slide 36: Targets for 2013
TARGETS FOR 2013 ASCOM NETWORK TESTING 1. Leverage new organization, new product platforms and lower cost basis for increased competitiveness & market share 2. Focus on innovative solutions to grow business with installed base 3. Capture growth opportunities in the emerging markets (Central America/

Slide 37: Outlook
[ ] OUTLOOK FRITZ MUMENTHALER 2012 Annual Results Conference, 20/03/2013 © Ascom Group 37
Slide 38: A Robust and Clear Strategy Going Forward
A ROBUST AND CLEAR STRATEGY GOING FORWARD Focused on two businesses in the wireless industry Both market leader in their selected niche Software and services Global market presence and a large installed base support the growth potential Megatrends support the growth strategy Aging populatio
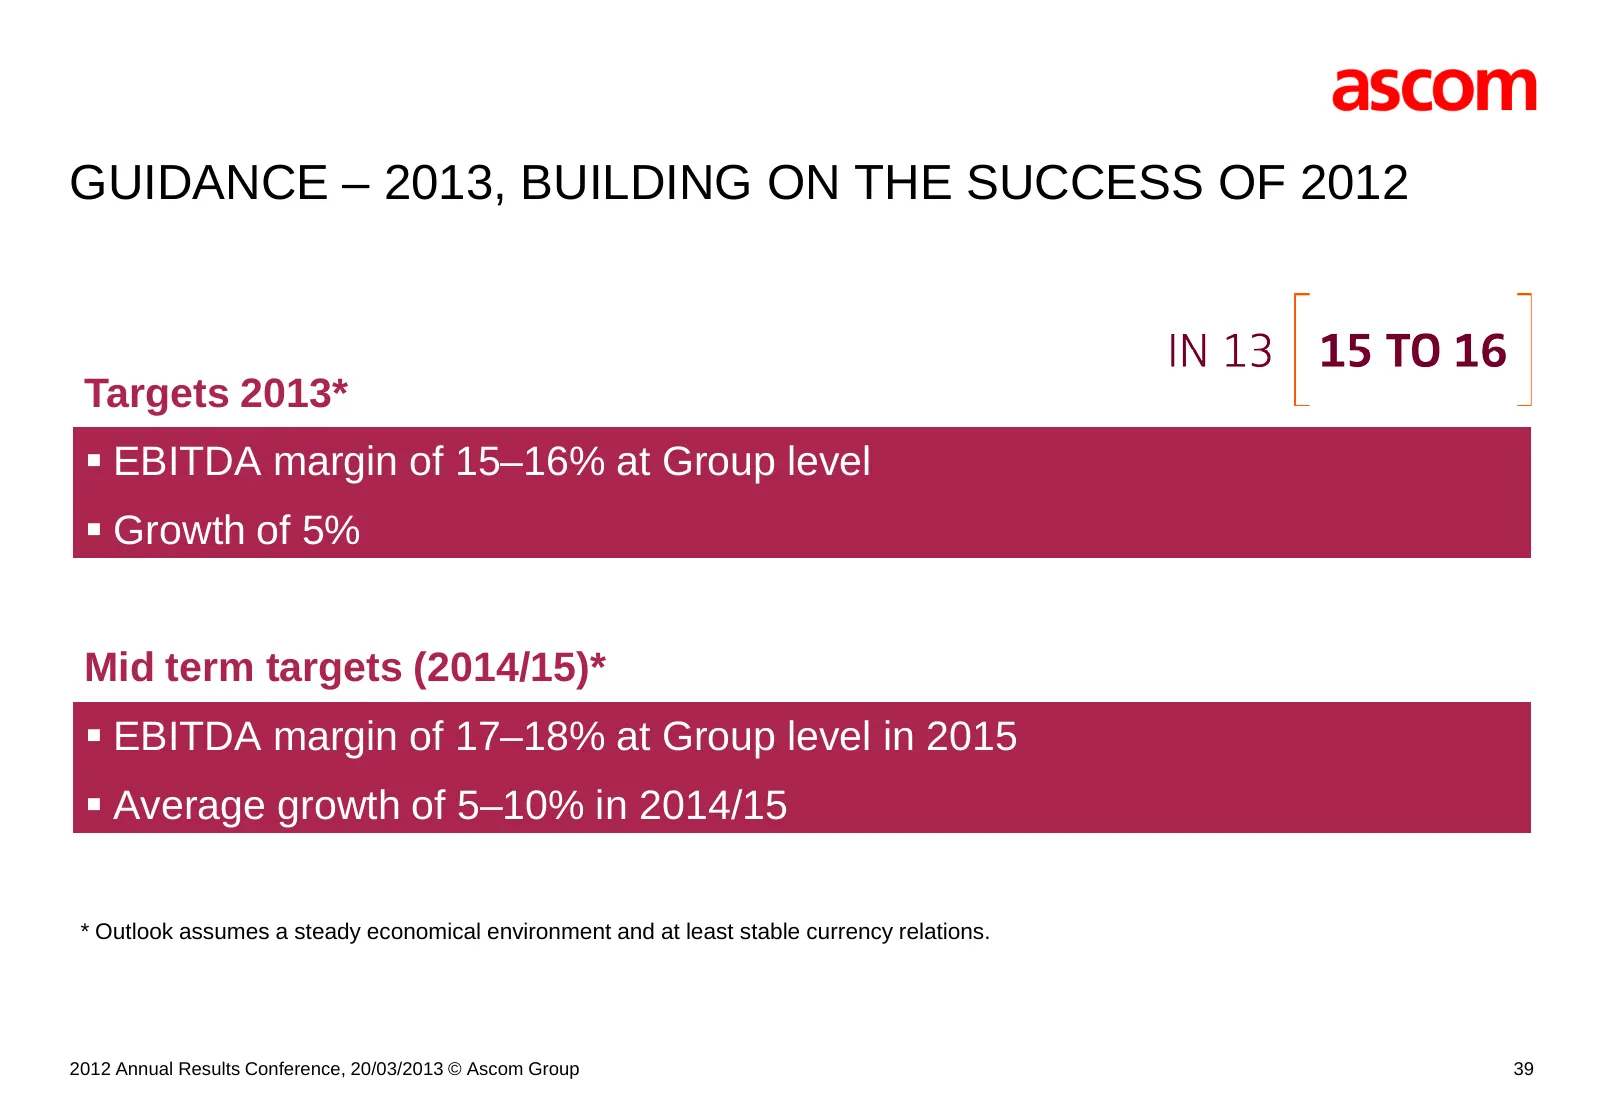
Slide 39: Guidance 2013, Building on the Success of 2012
GUIDANCE – 2013, BUILDING ON THE SUCCESS OF 2012 Targets 2013* EBITDA margin of 15–16% at Group level Growth of 5% Mid term targets (2014/15)* EBITDA margin of 17–18% at Group level in 2015 Average growth of 5–10% in 2014/15 * Outlook assumes a steady economical environment and at least stab
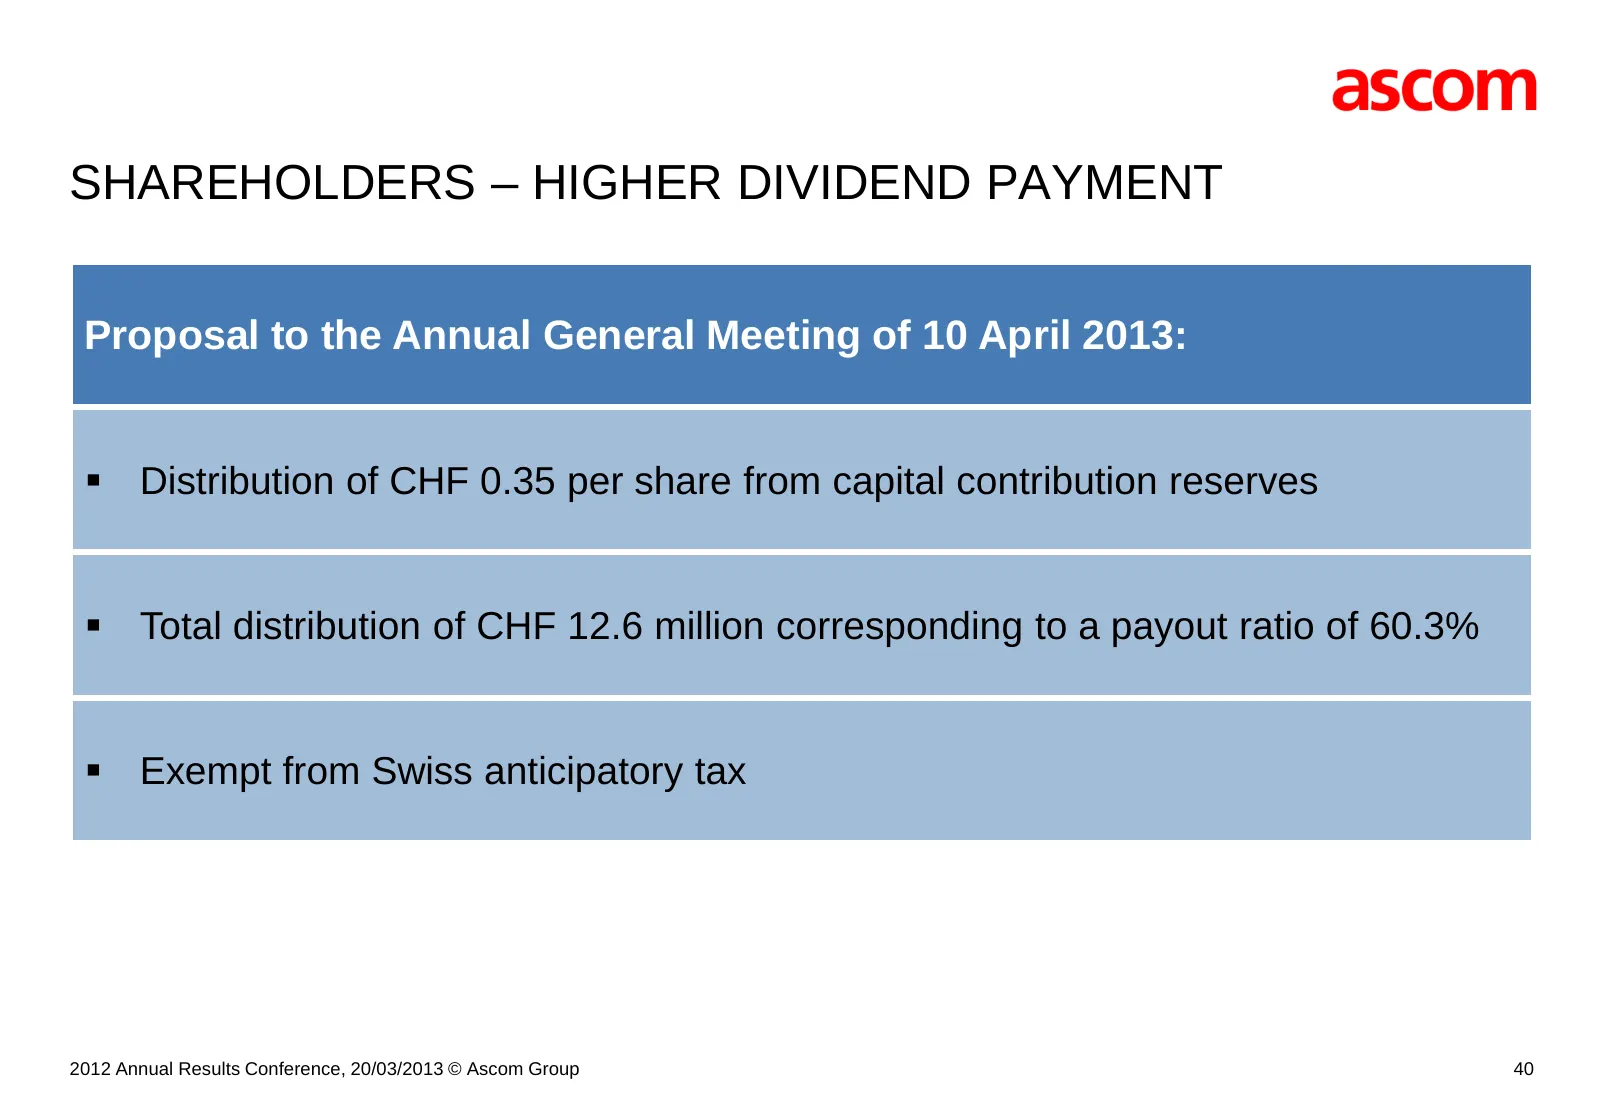
Slide 40: Shareholders: Higher Dividend Payment
SHAREHOLDERS – HIGHER DIVIDEND PAYMENT Proposal to the Annual General Meeting of 10 April 2013: Distribution of CHF 0.35 per share from capital contribution reserves Total distribution of CHF 12.6 million corresponding to a payout ratio of 60.3% Exempt from Swiss anticipatory tax 2012 Annual R
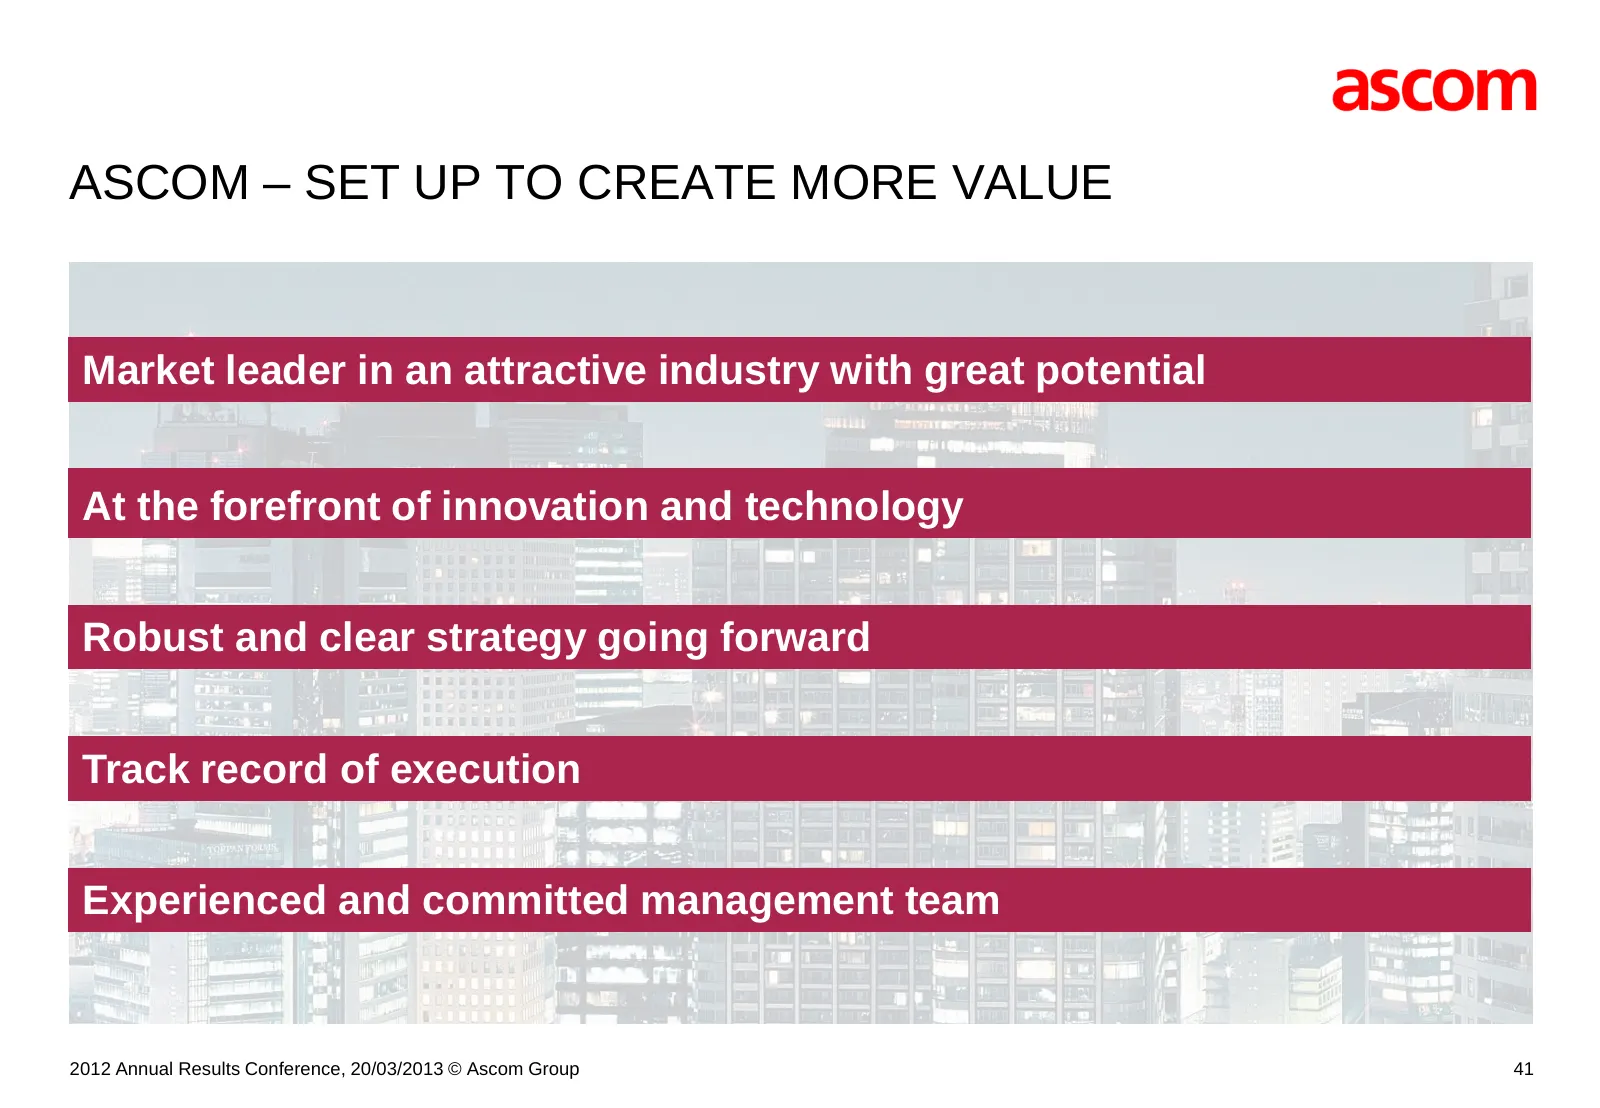
Slide 41: Ascom: Set Up to Create More Value
ASCOM – SET UP TO CREATE MORE VALUE Market leader in an attractive industry with great potential At the forefront of innovation and technology Robust and clear strategy going forward Track record of execution Experienced and committed management team 2012 Annual Results Conference, 20/03/2013 © Asco

Slide 42: Mission-Critical Wireless Communication
[ ] MISSION-CRITICAL WIRELESS COMMUNICATION
Slide 43: Group Contact
[ ] GROUP CONTACT Ascom Holding AG Investor Relations T +41 31 999 11 11 Stettbachstrasse 6 F +41 44 823 13 21 CH-8600 Dübendorf investor@ascom.com 2012 Annual Results Conference, 20/03/2013 © Ascom Group 43
Slide 44: Legal Disclaimer
LEGAL DISCLAIMER This document contains specific forward-looking statements, e.g. statements including terms like “believe”, “expect” or similar expressions. Such forward-looking statements are subject to known and unknown risks, uncertainties and other factors which may result in a substantial dive

Slide 45: Thank You!
THANK YOU!
Source: Internet Archive copy of ascom.com