Detection Technology Oy · OMXHEX:DETEC
Detection Technology Oy — Q1 2021 Earnings Presentation
12 slides from Detection Technology Oy's earnings presentation, Apr 27, 2021

Slide 1: January–March 2021 Business Review
January–March 2021 BUSINESS REVIEW President and CEO Hannu Martola | 27 April 2021
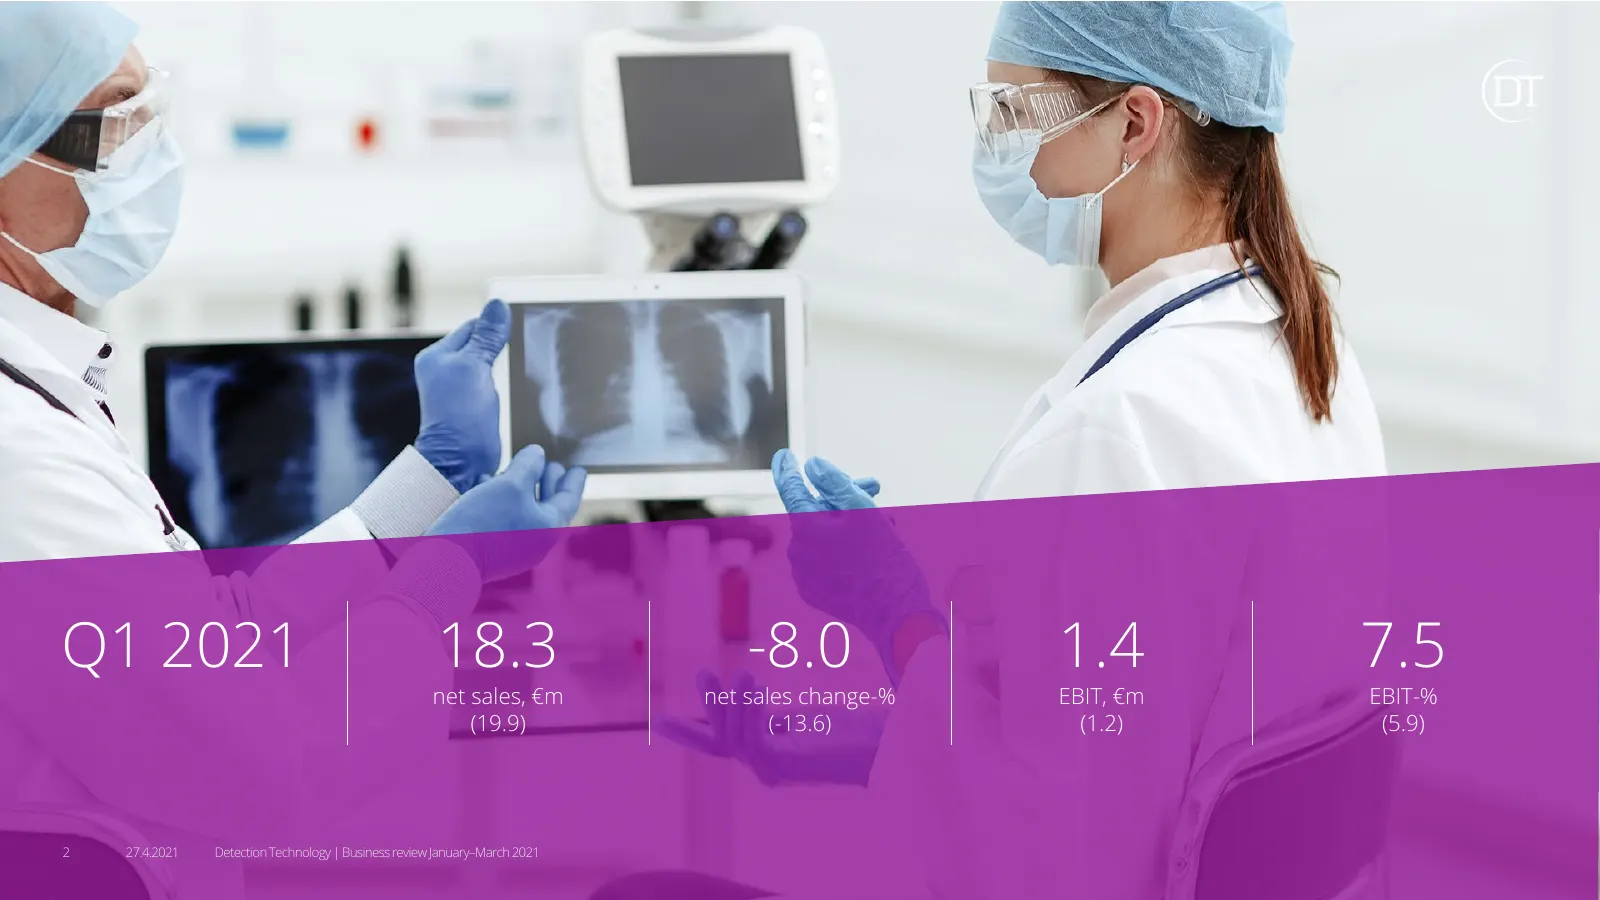
Slide 2: Q1 2021 key figures
Q1 2021 18.3 -8.0 1.4 7.5 net sales, €m net sales change-% EBIT, €m EBIT-% (19.9) (-13.6) (1.2) (5.9) 2 27.4.2021 Detection Technology | Business review January–March 2021

Slide 3: Q1 2021 summary
Q1 2021 Despite the double-digit increase in medical and industrial sales, the beginning of the year was slow as COVID-19 did not loosen its grip on the security market Demand was good for medical CT applications, and continued to be stable in the food, pharmaceutical, and mining industries Stagnati
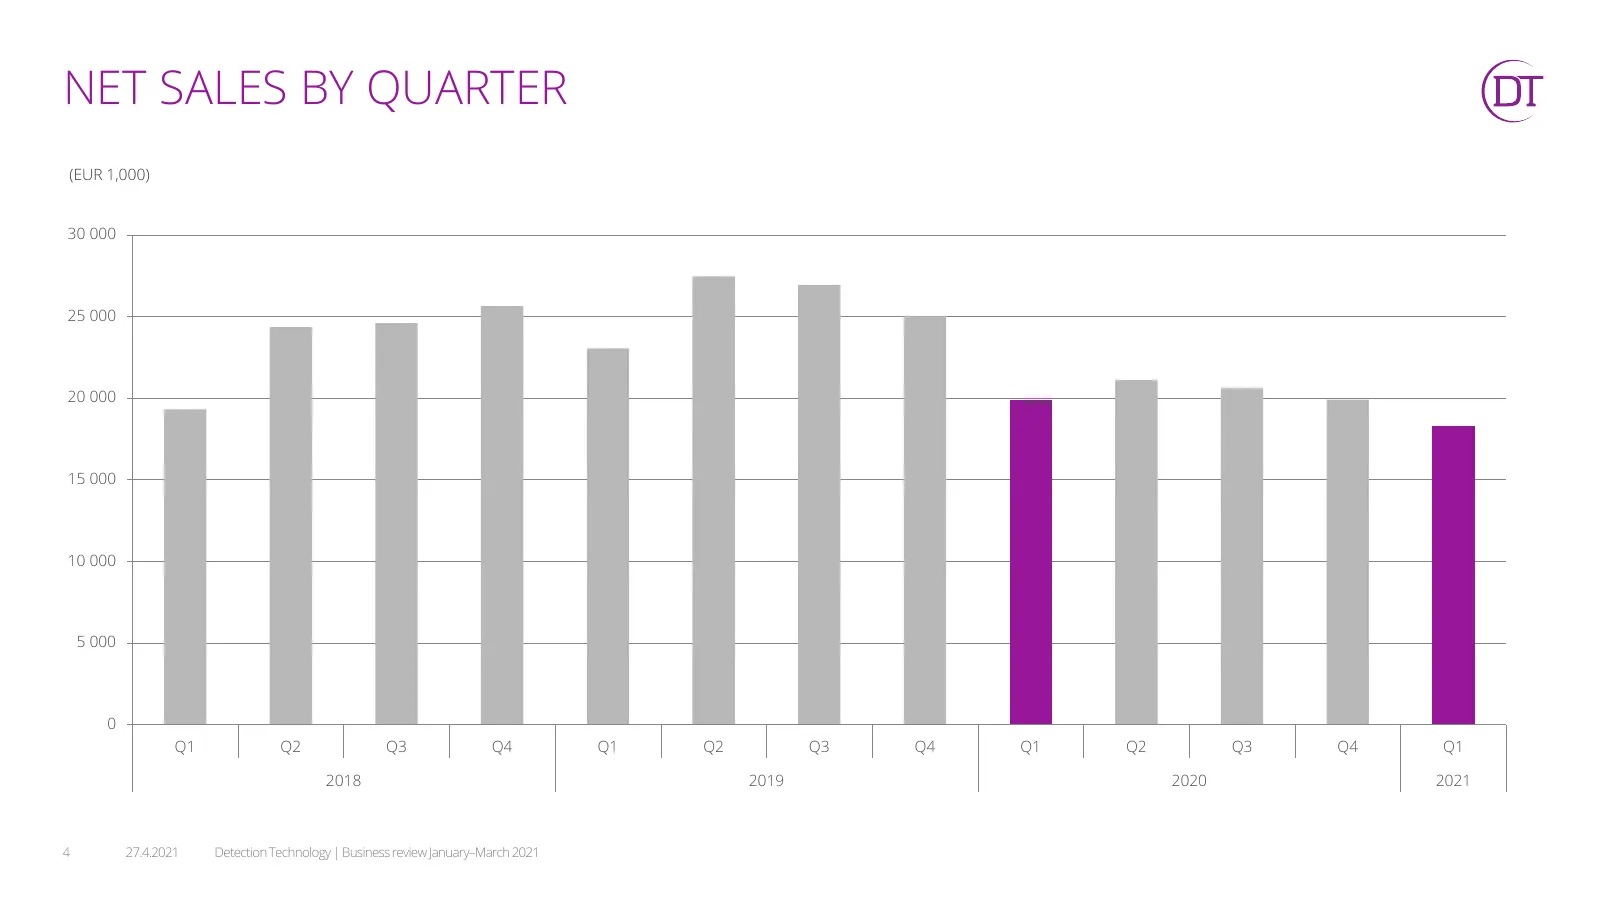
Slide 4: Net sales by quarter
NET SALES BY QUARTER (EUR 1,000) 30 000 25 000 20 000 15 000 10 000 5 000 0 Q1 Q2 Q3 Q4 Q1 Q2 Q3 Q4 Q1 Q2 Q3 Q4 Q1 2018 2019 2020 2021 4 27.4.2021 Detection Technology | Business review January–March 2021
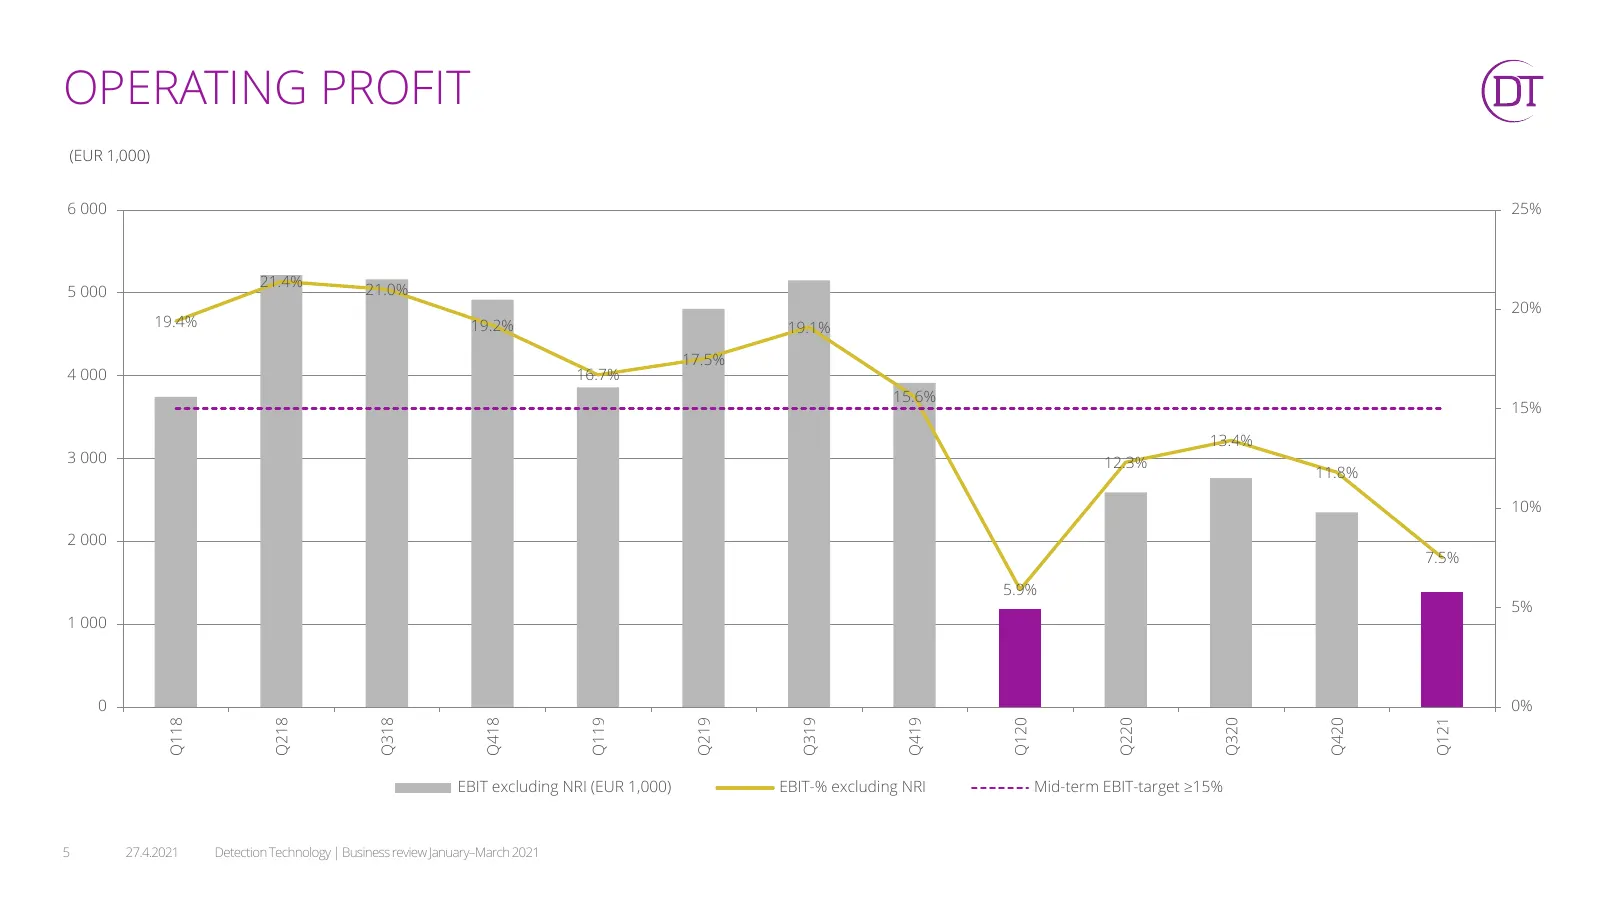
Slide 5: Operating profit
OPERATING PROFIT (EUR 1,000) 6 000 25% 21.4% 5 000 21.0% 20% 19.4% 19.2% 19.1% 17.5% 4 000 16.7% 15.6% 15% 13.4% 3 000 12.3% 11.8% 10% 2 000 7.5% 5.9% 5% 1 000 0 0% Q118 Q218 Q318 Q418 Q119 Q219 Q319 Q419 Q120 Q220 Q320 Q420 Q121 EBIT excluding NRI (EUR 1,000) EBIT-% excluding NRI Mid-term EBIT-targ
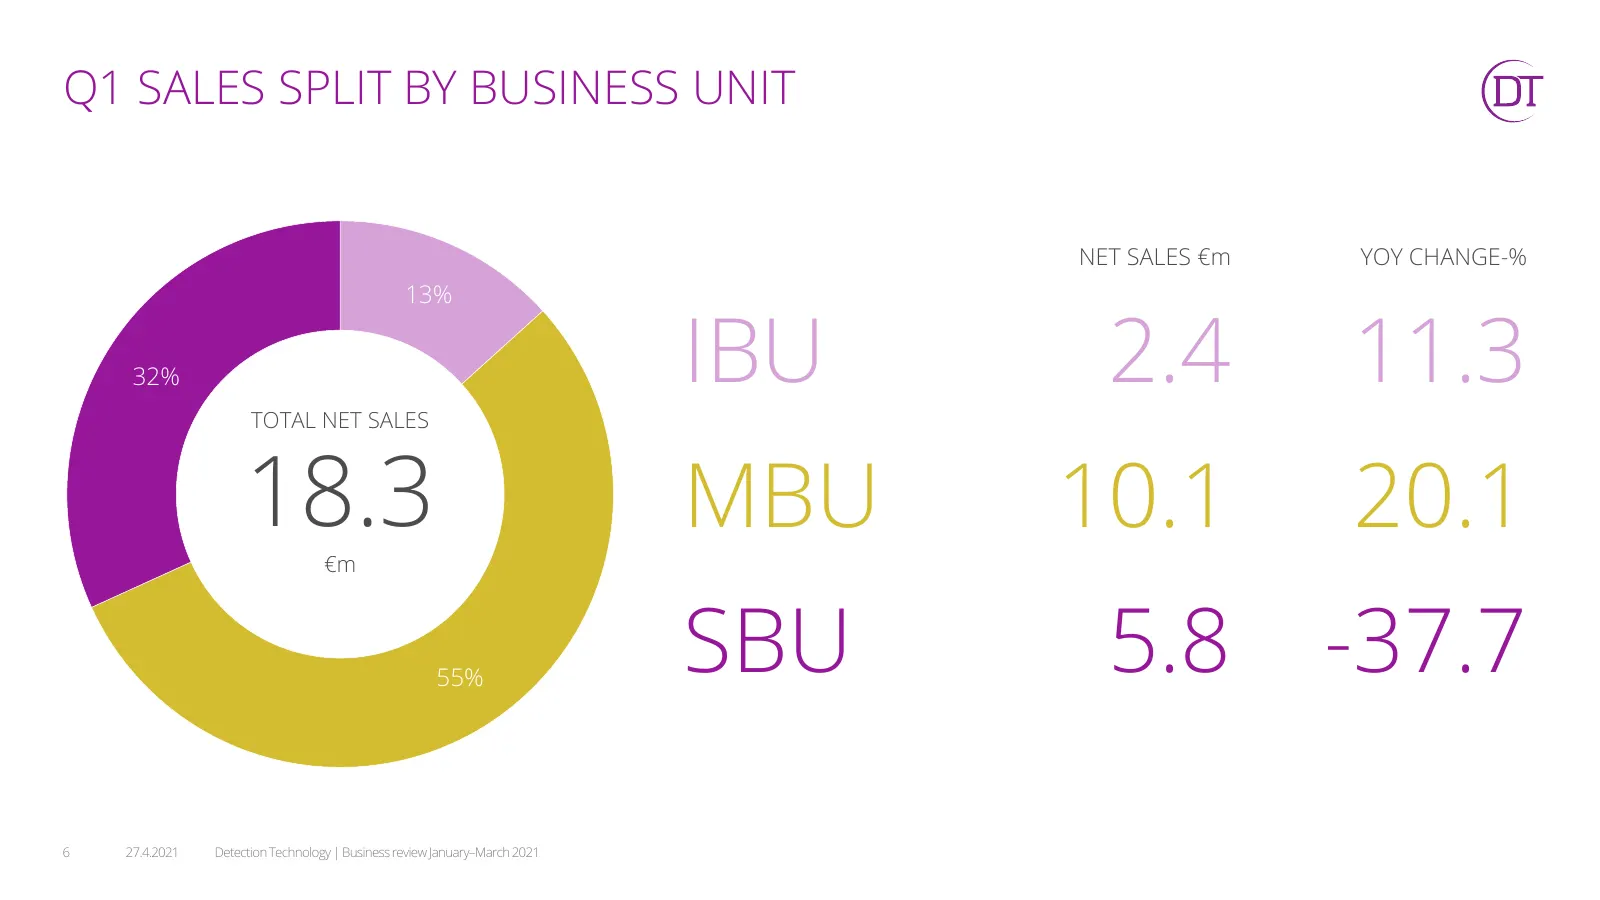
Slide 6: Q1 sales split by business unit
Q1 SALES SPLIT BY BUSINESS UNIT NET SALES €m YOY CHANGE-% 13% 32% IBU 2.4 11.3 TOTAL NET SALES 18.3 €m MBU 10.1 20.1 55% SBU 5.8 -37.7 6 27.4.2021 Detection Technology | Business review January–March 2021
Slide 7: Q1 sales split by region
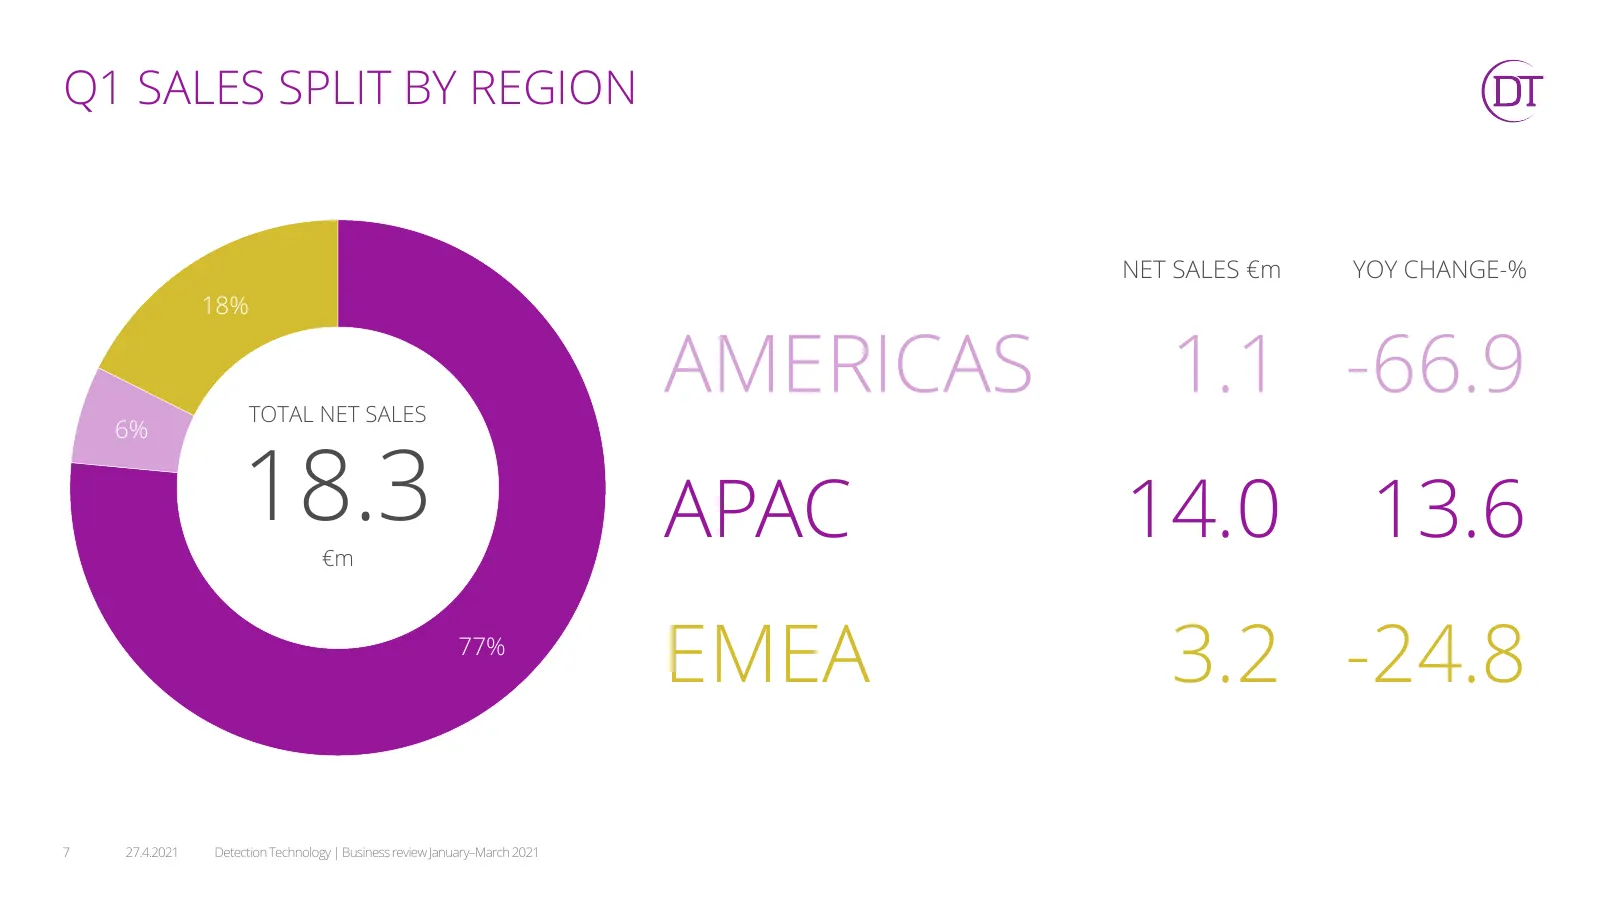
Q1 SALES SPLIT BY REGION NET SALES €m YOY CHANGE-% 18% TOTAL NET SALES AMERICAS 1.1 -66.9 6% 18.3 €m APAC 14.0 13.6 77% EMEA 3.2 -24.8 7 27.4.2021 Detection Technology | Business review January–March 2021
Slide 8: Key figures
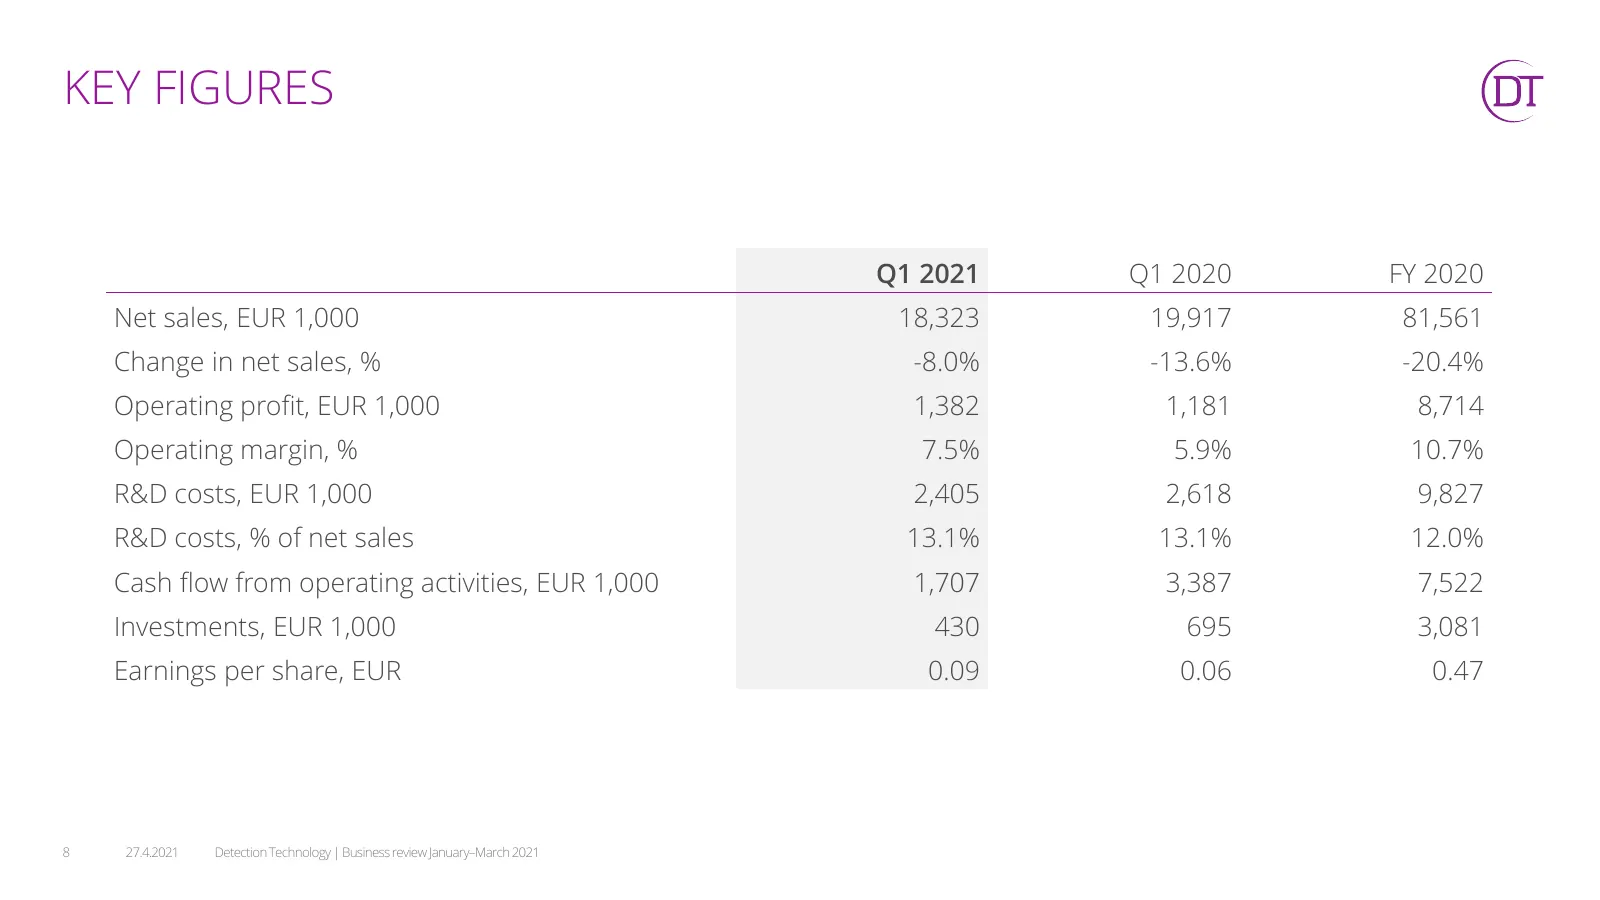
KEY FIGURES Q1 2021 Q1 2020 FY 2020 Net sales, EUR 1,000 18,323 19,917 81,561 Change in net sales, % -8.0% -13.6% -20.4% Operating profit, EUR 1,000 1,382 1,181 8,714 Operating margin, % 7.5% 5.9% 10.7% R&D costs, EUR 1,000 2,405 2,618 9,827 R&D costs, % of net sales 13.1% 13.1% 12.0% Cash flow from

Slide 9: Strategy
STRATEGY Focused on • Customer acquisition, managing the record number of customers won in 2020, and further improving customer service. • The development of its product portfolio and new product solutions, and acceleration of the product development cycle. • Arranging its organization in compliance
Slide 10: Business outlook
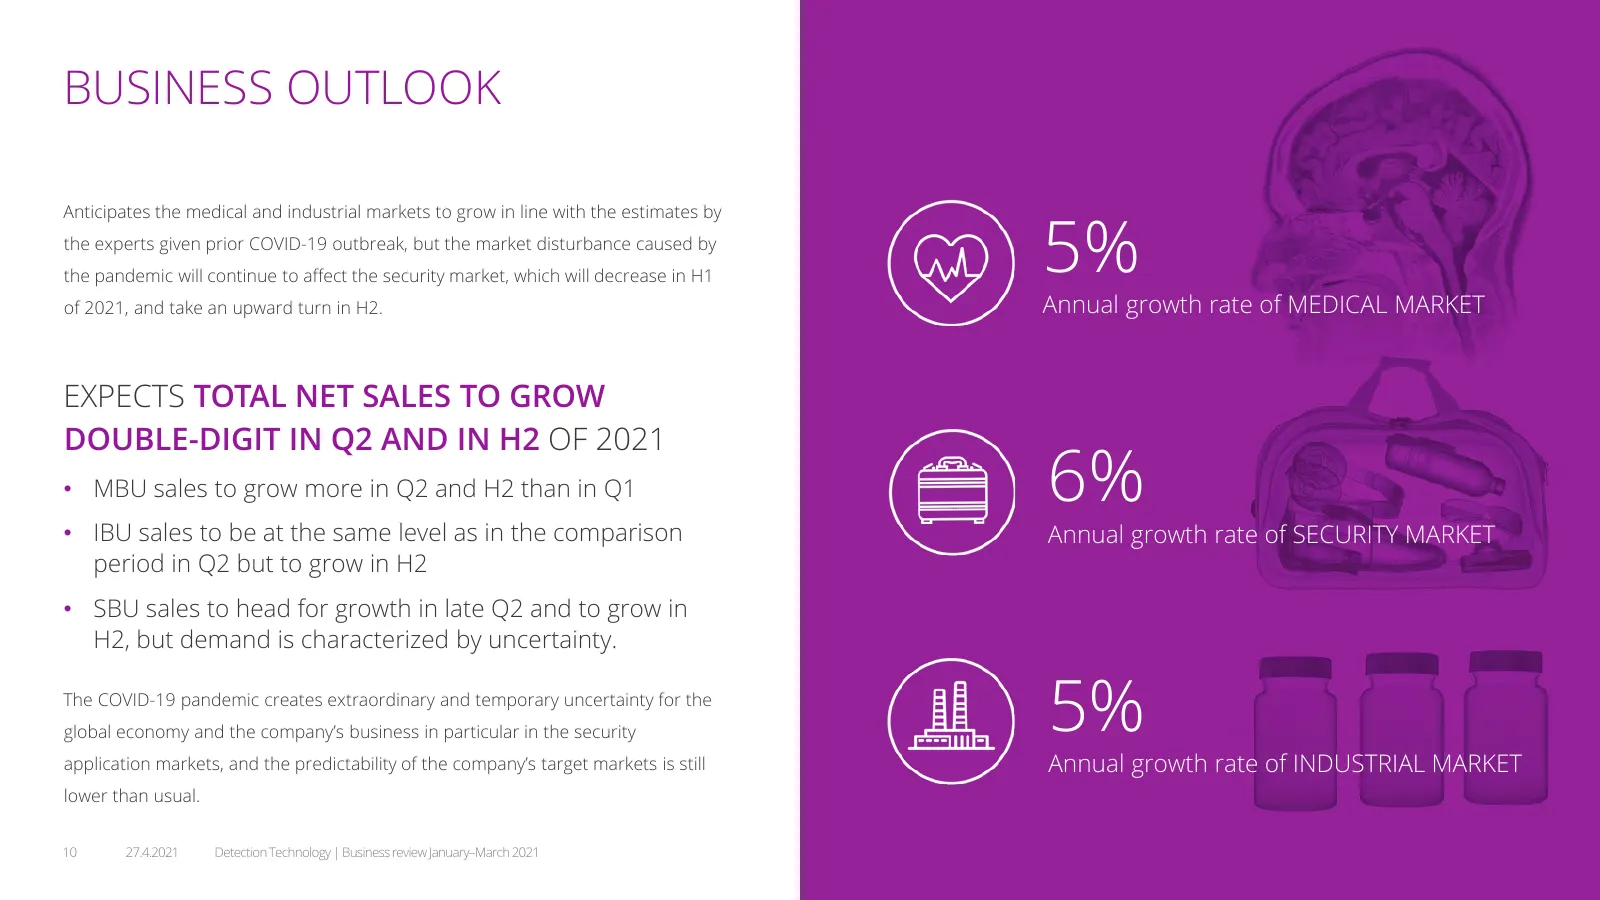
BUSINESS OUTLOOK 5% Anticipates the medical and industrial markets to grow in line with the estimates by the experts given prior COVID-19 outbreak, but the market disturbance caused by the pandemic will continue to affect the security market, which will decrease in H1 of 2021, and take an upward tur
Slide 11: Financial targets
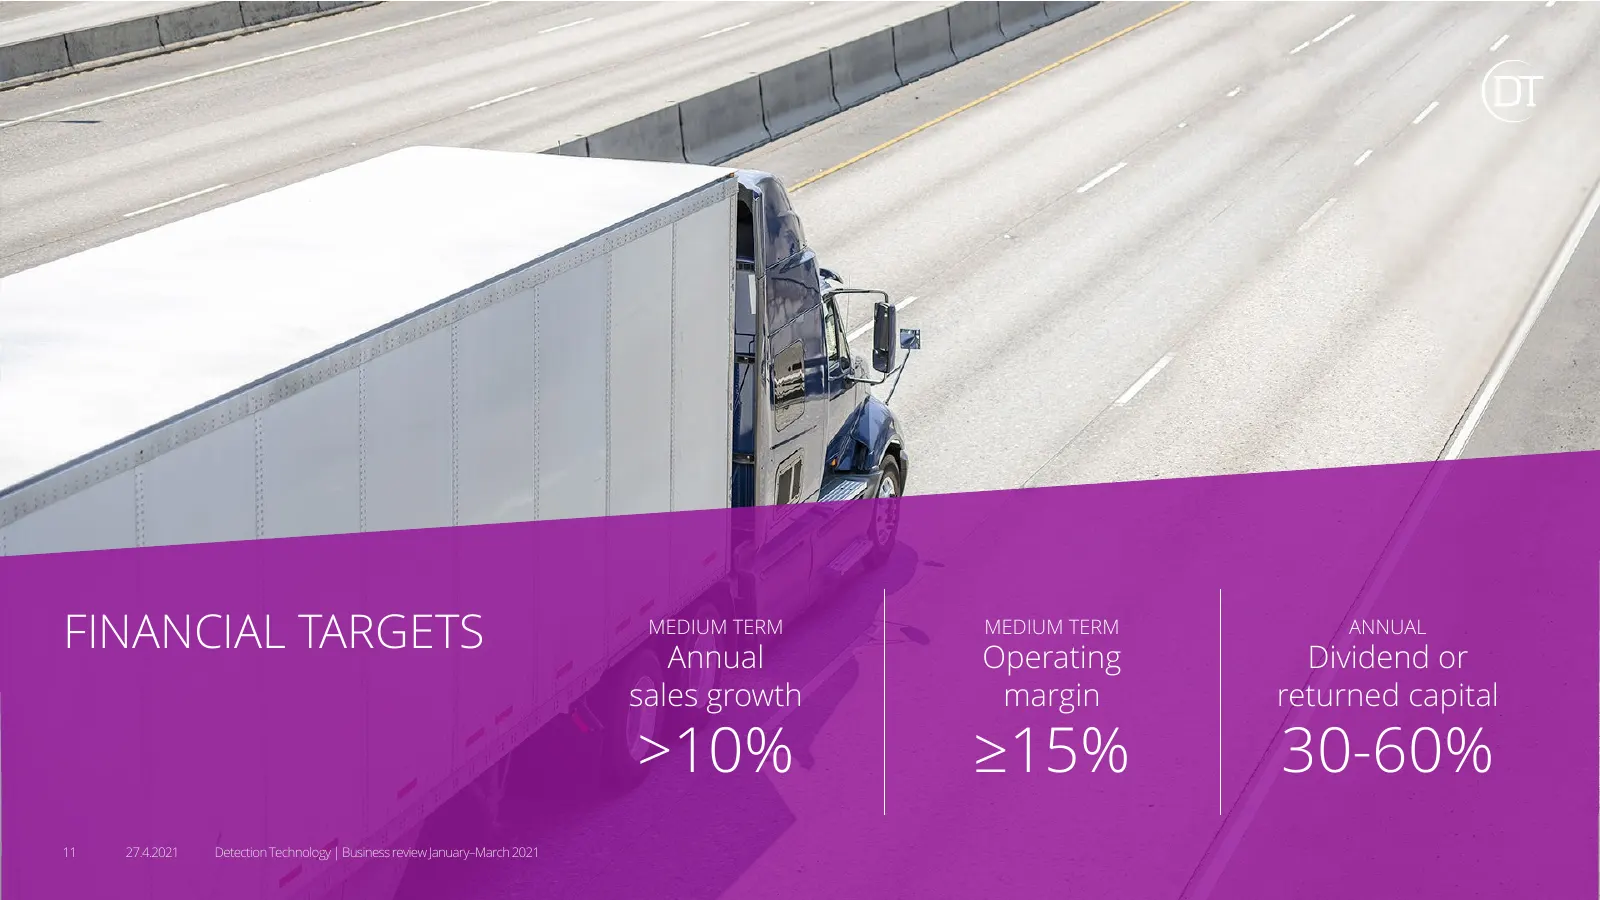
FINANCIAL TARGETS MEDIUM TERM Annual MEDIUM TERM Operating ANNUAL Dividend or sales growth margin returned capital >10% ≥15% 30-60% 11 27.4.2021 Detection Technology | Business review January–March 2021

Slide 12: Detection Technology
Detection Technolo: FOREKNOW. FORESAVE® -
Source: Internet Archive copy of deetee.com
More decks from Detection Technology Oy
 Q1 2026 Earnings Presentation15 slides · Apr 23, 2026
 Investor Day (November 2025)79 slides · Nov 18, 2025
 Q3 2025 Earnings Presentation17 slides · Oct 30, 2025
 Q1 2025 Earnings Presentation13 slides · Apr 24, 2025
 Q3 2024 Earnings Presentation17 slides · Oct 29, 2024
 Q1 2024 Earnings Presentation13 slides · Apr 25, 2024