1st Pacific Bancorp — 2007 Wunderlich Securities West Coast Bank Conference
26 slides from 1st Pacific Bancorp's conference presentation, Feb 27, 2007
Slide 1: 2007 Wunderlich Securities West Coast Bank Conference
2007 WUNDERLICH SECURITIES West Coast Bank Conference February 26, 2007
Slide 2: Forward-Looking Statements
Forward-Looking Statements This presentation contains forward-looking statements, as defined by federal securities laws, relating to present or future trends or factors affecting the operations, markets and products of 1st Pacific Bancorp, Inc. These statements are provided to assist in the understa
Slide 3: 1st Pacific Profile
1st Pacific Profile A community business bank headquartered in San Diego, California Founded in November 2000 after $11.5 MM IPO 5 full-service banking offices in San Diego County Assets of $318 million * Market capitalization of $62.3 MM ** OTC BB: FPBN * As of December 31, 2006 ** As of January 19
Slide 4: 1st Pacific's Franchise: San Diego County
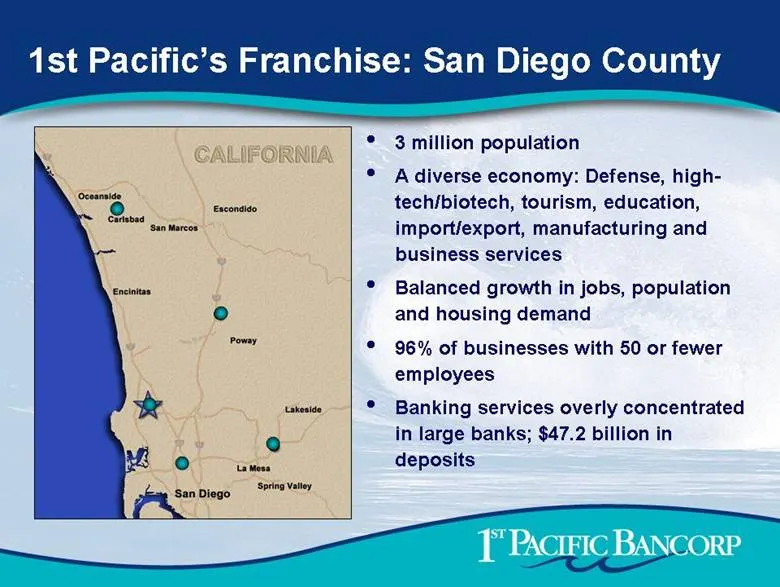
1st Pacific’s Franchise: San Diego County 3 million population A diverse economy: Defense, high-tech/biotech, tourism, education, import/export, manufacturing and business services Balanced growth in jobs, population and housing demand 96% of businesses with 50 or fewer employees Banking services ov
Slide 5: San Diego County: The Nation's 6th Largest County
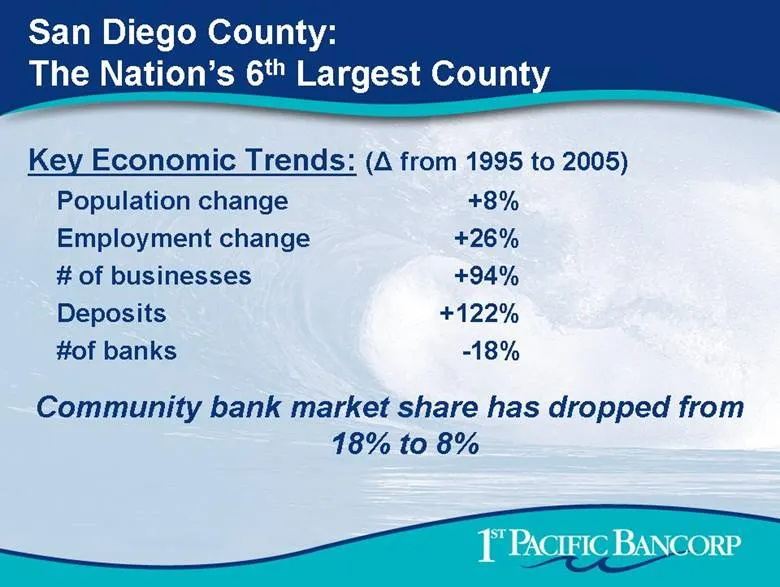
San Diego County: The Nation’s 6th Largest County Key Economic Trends: (Δ from 1995 to 2005) Population change +8% Employment change +26% # of businesses +94% Deposits +122% #of banks -18% Community bank market share has dropped from 18% to 8%
Slide 6: 1st Pacific Led the Wave of San Diego Community Banks
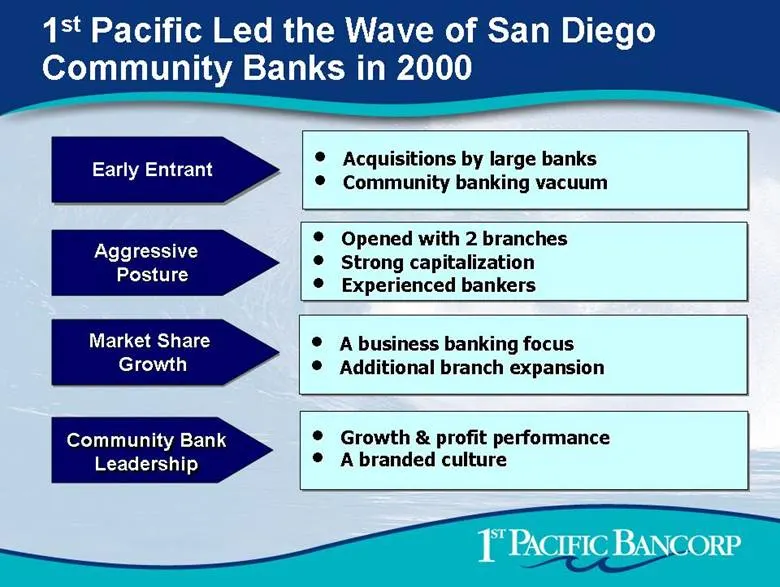
1st Pacific Led the Wave of San Diego Community Banks in 2000 Acquisitions by large banks Community banking vacuum Early Entrant Opened with 2 branches Strong capitalization Experienced bankers Aggressive Posture A business banking focus Additional branch expansion Market Share Growth Growth & profi
Slide 7: What Makes Us Different?
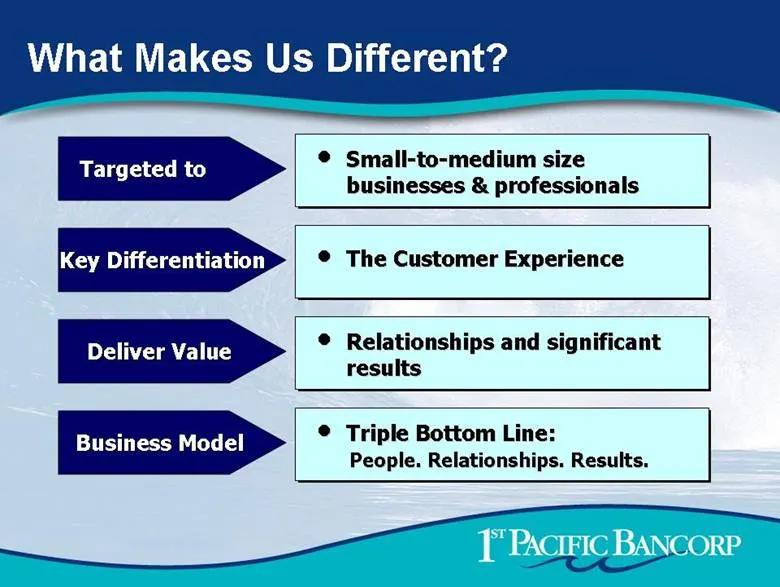
What Makes Us Different? Small-to-medium size businesses & professionals Key Differentiation The Customer Experience Deliver Value Relationships and significant results Business Model Triple Bottom Line: People. Relationships. Results. Targeted to
Slide 8: Triple Bottom Line
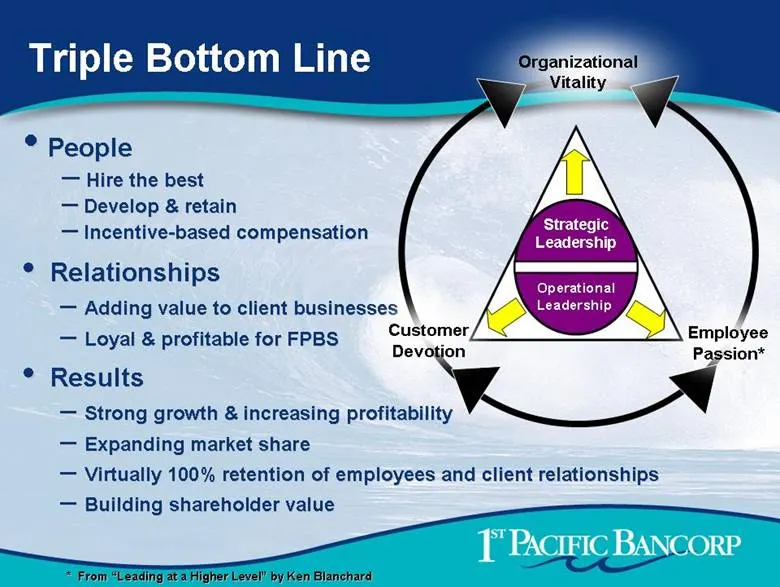
Triple Bottom Line Relationships Adding value to client businesses Loyal & profitable for FPBS Results Strong growth & increasing profitability Expanding market share Virtually 100% retention of employees and client relationships Building shareholder value Operational Leadership Strategic Leadership
Slide 9: Initial Phase: Build Market Share 2001-2006
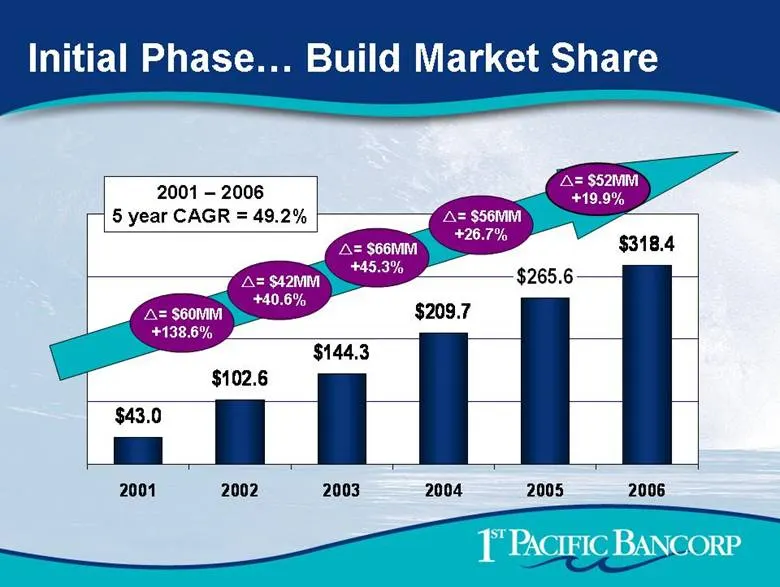
Initial Phase Build Market Share 2001 – 2006 5 year CAGR = 49.2% = $60MM +138.6% = $42MM +40.6% = $66MM +45.3% = $56MM +26.7% = $52MM +19.9% $43.0 $102.6 $144.3 $209.7 $318.4 $265.6 2001 2002 2003 2004 2005 2006
Slide 10: Current Phase: Balancing Growth & Profitability
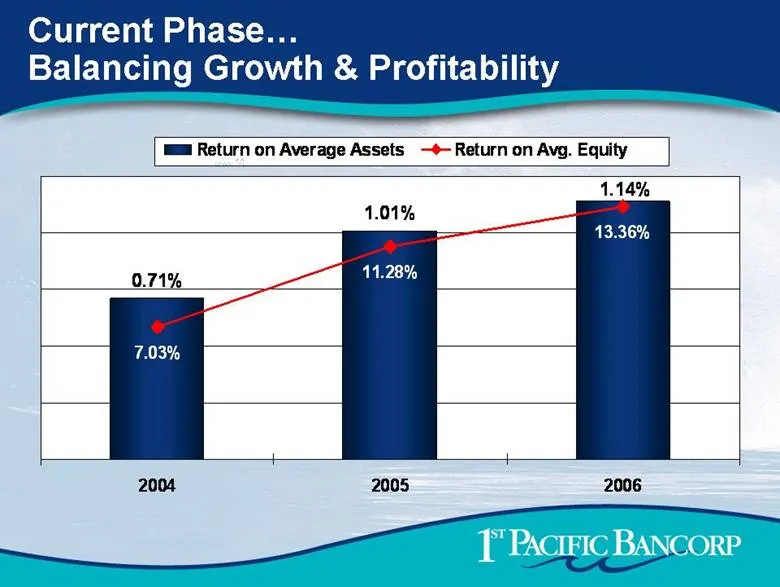
Current Phase Balancing Growth & Profitability 0.71% 1.01% 1.14% 7.03% 11.28% 13.36% 2004 2005 2006 Return on Average Assets Return on Avg. Equity Line 3
Slide 11: A Commercial Bank with an RE Focus
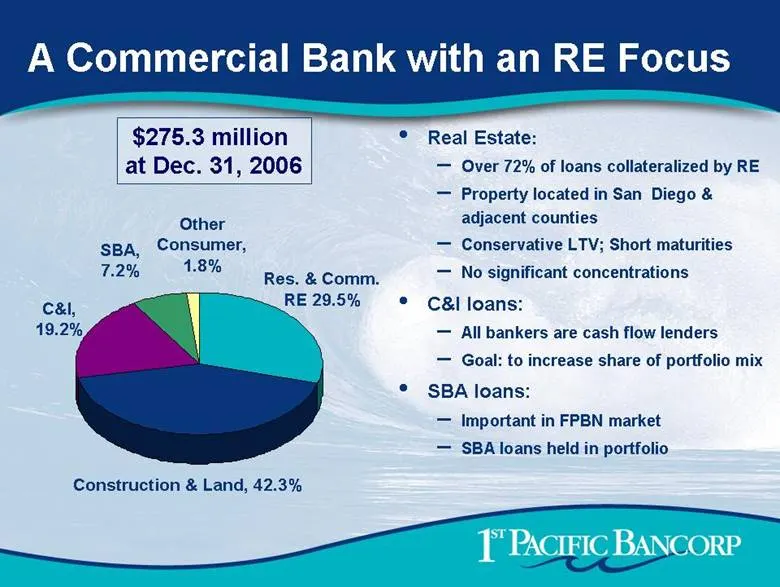
$275.3 million at Dec. 31, 2006 A Commercial Bank with an RE Focus Real Estate: Over 72% of loans collateralized by RE Property located in San Diego & adjacent counties Conservative LTV; Short maturities No significant concentrations C&I loans: All bankers are cash flow lenders Goal: to increase sha
Slide 12: Performance: Excellent Asset Quality
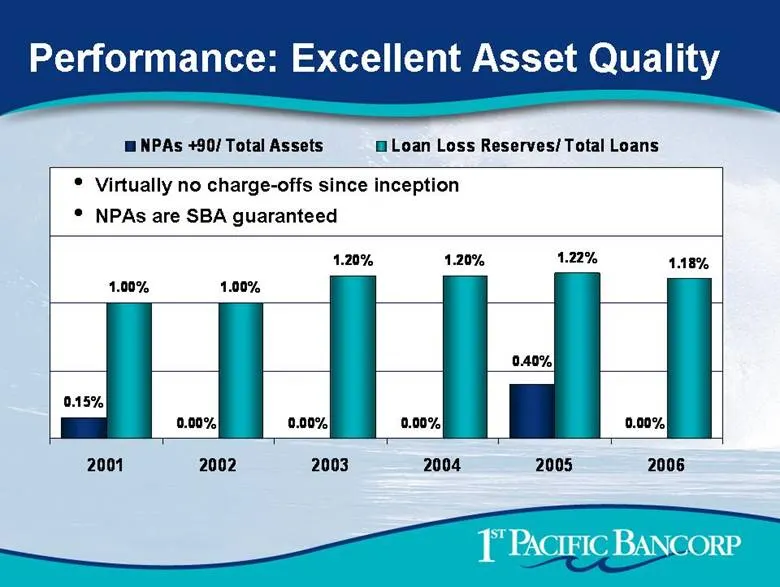
Performance: Excellent Asset Quality 0.15% 0.00% 0.00% 0.00% 0.00% 1.00% 1.00% 1.20% 1.20% 1.22% 1.18% 0.40% 2001 2002 2003 2004 2005 2006 NPAs +90/ Total Assets Loan Loss Reserves/ Total Loans Virtually no charge-offs since inception NPAs are SBA guaranteed
Slide 13: Deposit Mix
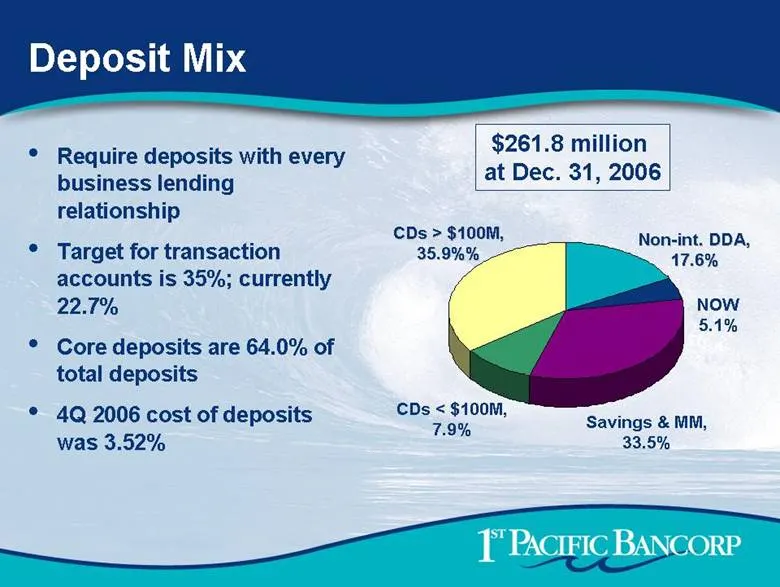
Deposit Mix Require deposits with every business lending relationship Target for transaction accounts is 35%; currently 22.7% Core deposits are 64.0% of total deposits 4Q 2006 cost of deposits was 3.52% CDs < $100M, 7.9% Savings & MM, 33.5% NOW 5.1% Non-int. DDA, 17.6% $261.8 million at Dec. 31, 200
Slide 14: Net Interest Margin
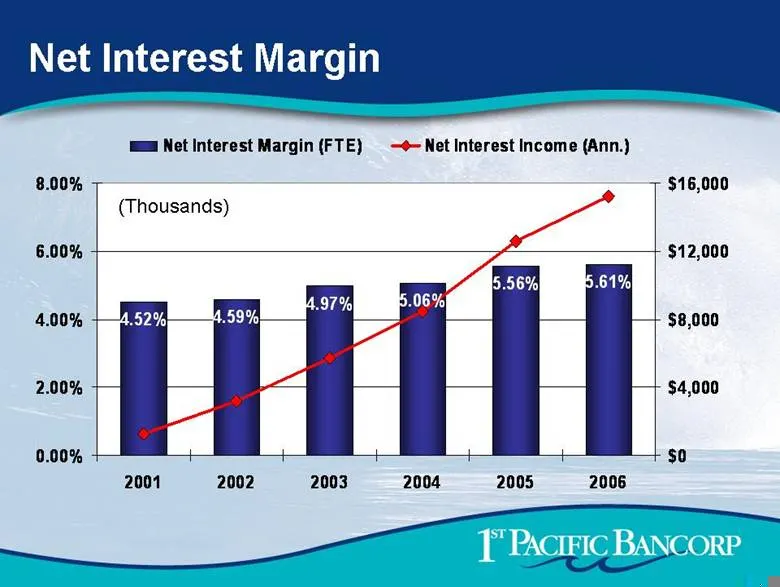
Net Interest Margin (Thousands) 4.52% 4.59% 4.97% 5.06% 5.61% 5.56% 0.00% 2.00% 4.00% 6.00% 8.00% 2001 2002 2003 2004 2005 2006 $0 $4,000 $8,000 $12,000 $16,000 Net Interest Margin (FTE) Net Interest Income (Ann.)
Slide 15: Net Income
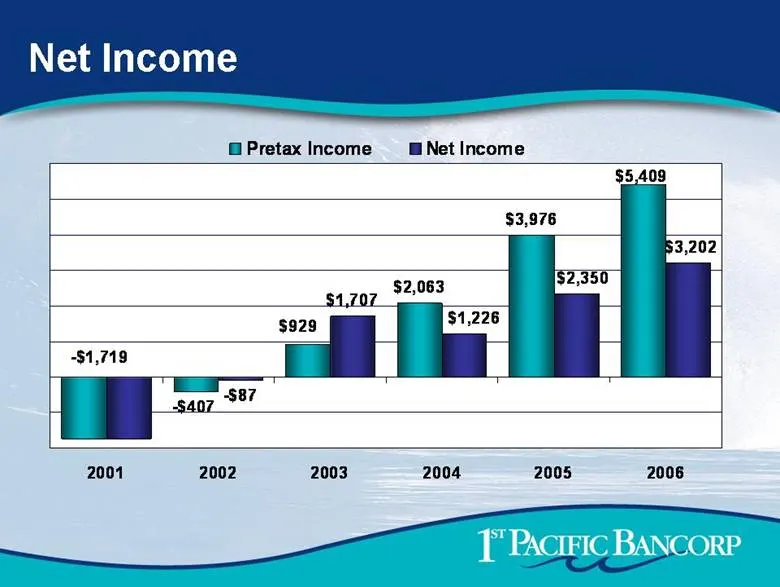
Net Income $3,976 -$87 $1,707 $5,409 -$1,719 $2,063 -$407 $929 $3,202 $2,350 $1,226 2001 2002 2003 2004 2005 2006 Pretax Income Net Income
Slide 16: Technology Enhances Efficiency
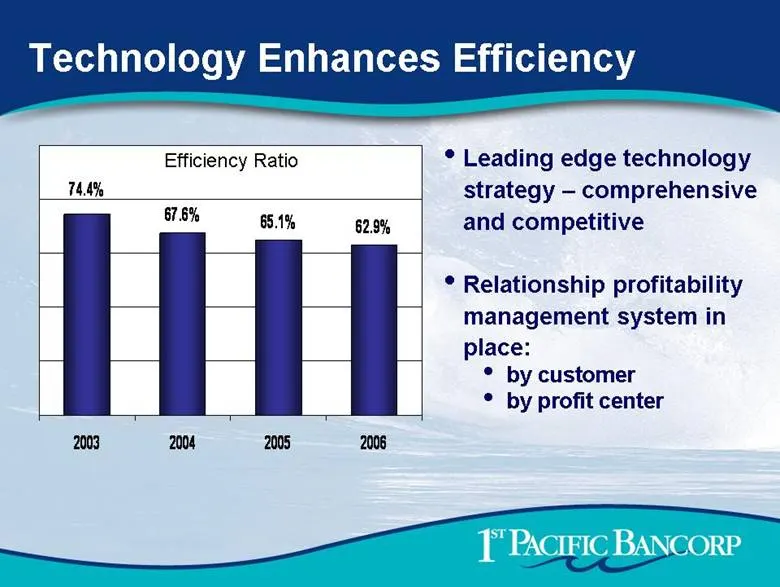
Technology Enhances Efficiency Leading edge technology strategy – comprehensive and competitive Relationship profitability management system in place: by customer by profit center Efficiency Ratio 67.6% 65.1% 62.9% 74.4% 2003 2004 2005 2006
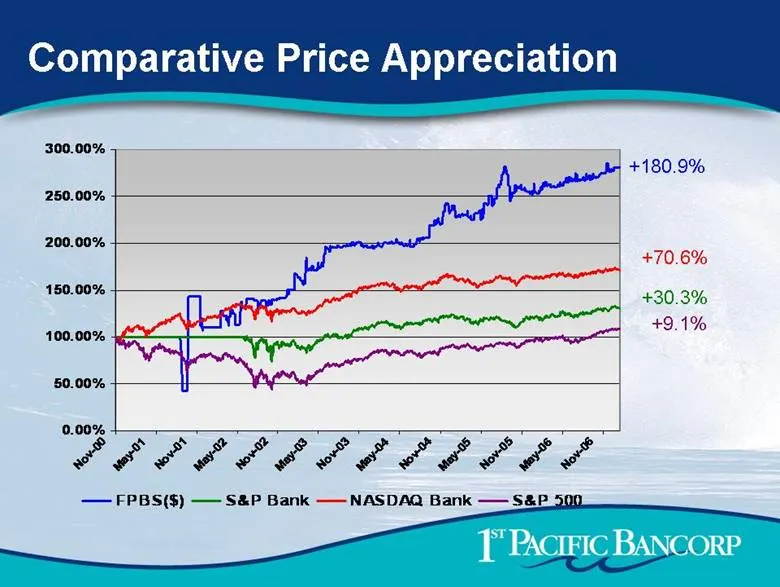
Slide 17: Comparative Price Appreciation
Comparative Price Appreciation +70.6% +180.9% +30.3% +9.1% 0.00% 50.00% 100.00% 150.00% 200.00% 250.00% 300.00% Nov-00 May-01 Nov-01 May-02 Nov-02 May-03 Nov-03 May-04 Nov-04 May-05 Nov-05 May-06 Nov-06 FPBS($) S&P Bank NASDAQ Bank S&P 500
Slide 18: What Does Our Future Look Like?
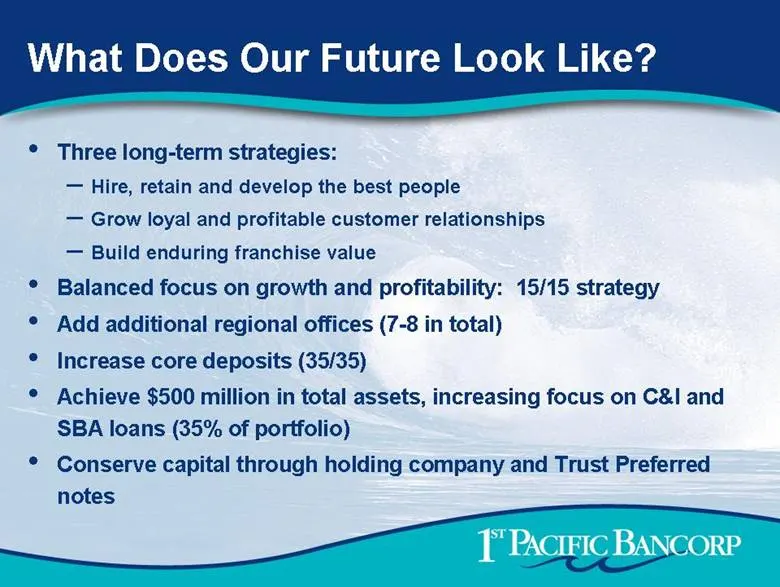
What Does Our Future Look Like? Three long-term strategies: Hire, retain and develop the best people Grow loyal and profitable customer relationships Build enduring franchise value Balanced focus on growth and profitability: 15/15 strategy Add additional regional offices (7-8 in total) Increase core
Slide 19: 1st Pacific Bancorp Announces Planned Acquisition of Landmark National Bank
1st Pacific Bancorp Announces Planned Acquisition of Landmark National Bank Announced February 23, 2007
Slide 20: Forward-Looking Statement
FORWARD-LOOKING STATEMENT This presentation includes "forward-looking" statements as such term is defined in the Private Securities Litigation Reform Act of 1995. These statements are subject to risks and uncertainties and actual results could differ materially due to certain risk factors, including
Slide 21: Contribution Analysis
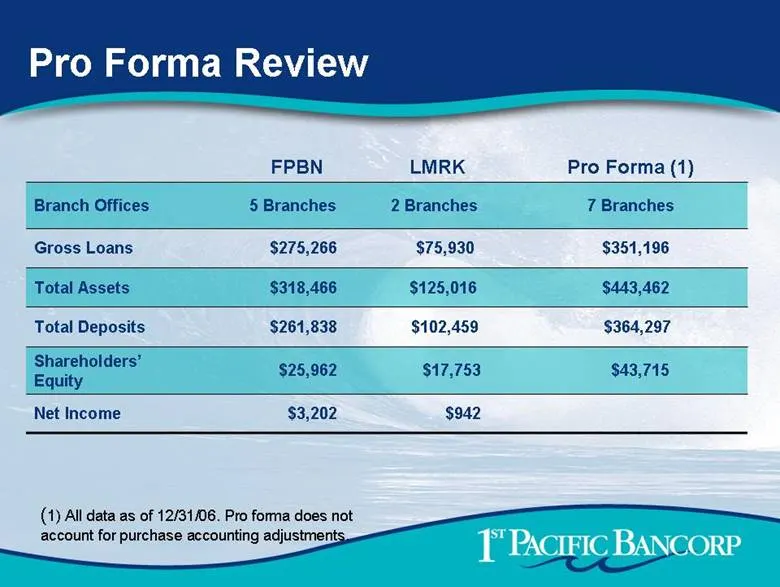
Contribution Analysis Pro Forma Review $3,202 Net Income $25,962 Shareholders’ Equity $261,838 Total Deposits $318,466 Total Assets $275,266 Gross Loans 7 Branches Branch Offices Pro Forma (1) (1) All data as of 12/31/06. Pro forma does not account for purchase accounting adjustments. FPBN LMRK 5 Br
Slide 22: Pro Forma Review
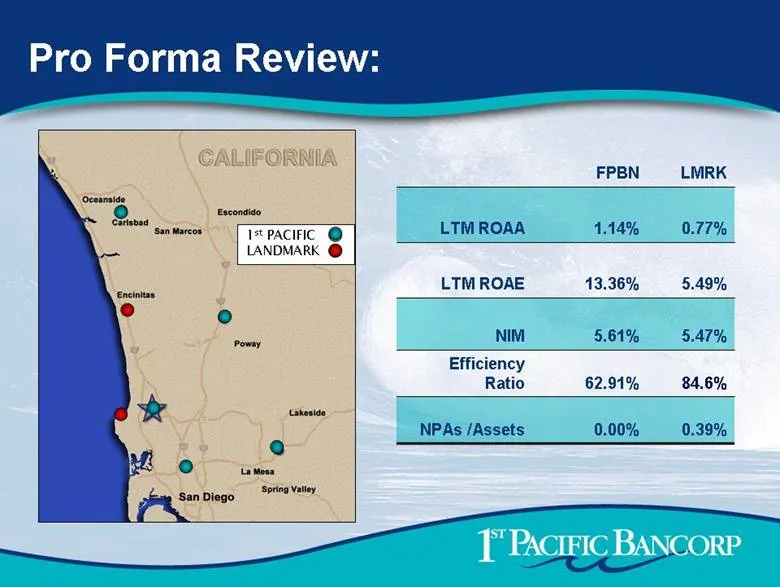
Pro Forma Review: LMRK FPBN 0.00% NPAs /Assets 62.91% Efficiency Ratio 5.61% NIM 13.36% LTM ROAE 1.14% LTM ROAA 0.77% 5.49% 5.47% 84.6% 0.39%
Slide 23: Strategic Rationale
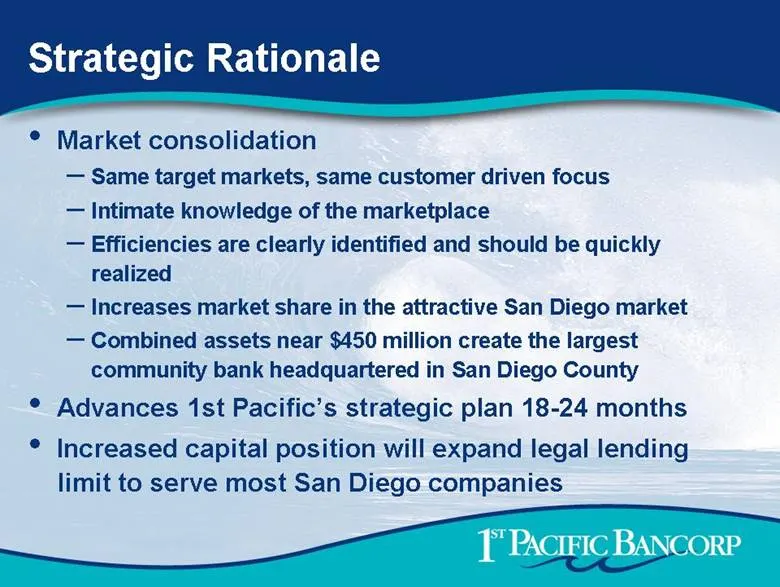
Strategic Rationale Market consolidation Same target markets, same customer driven focus Intimate knowledge of the marketplace Efficiencies are clearly identified and should be quickly realized Increases market share in the attractive San Diego market Combined assets near $450 million create the lar
Slide 24: Transaction Overview
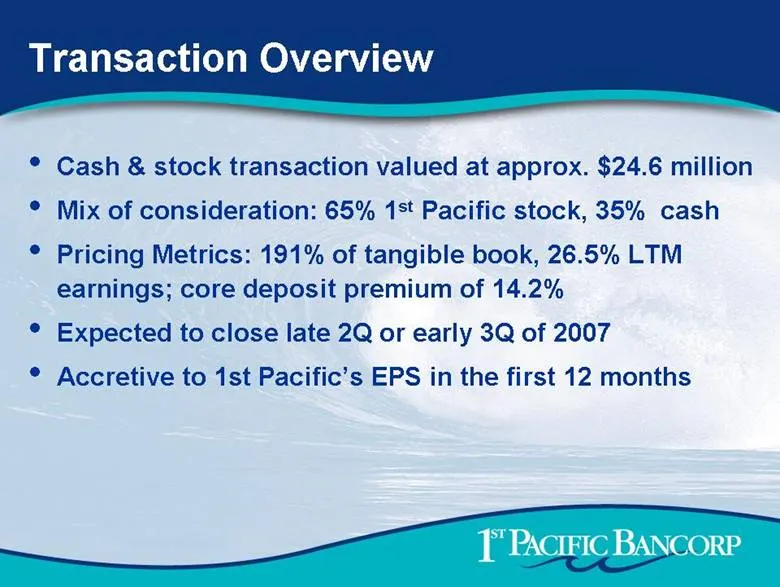
Transaction Overview Cash & stock transaction valued at approx. $24.6 million Mix of consideration: 65% 1st Pacific stock, 35% cash Pricing Metrics: 191% of tangible book, 26.5% LTM earnings; core deposit premium of 14.2% Expected to close late 2Q or early 3Q of 2007 Accretive to 1st Pacific’s EPS i
Slide 25: Investment Summary
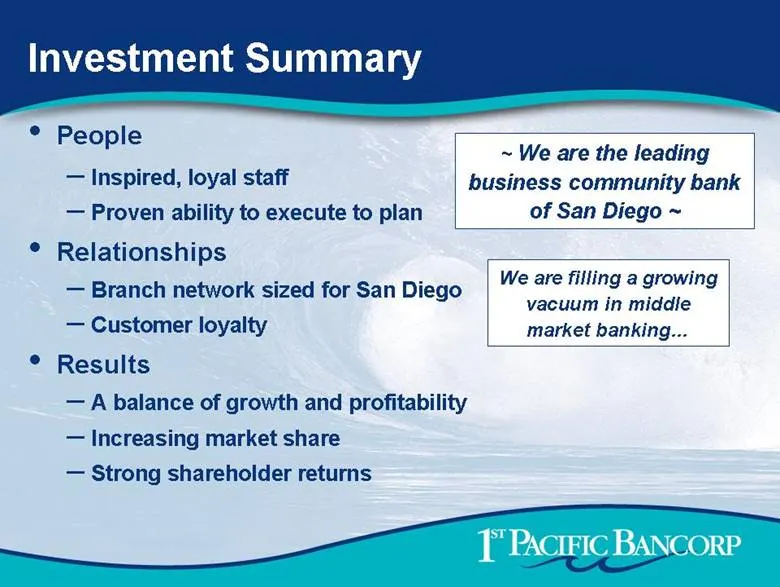
Investment Summary People Inspired, loyal staff Proven ability to execute to plan Relationships Branch network sized for San Diego Customer loyalty Results A balance of growth and profitability Increasing market share Strong shareholder returns ~ We are the leading business community bank of San Die

Slide 26: People. Relationships. Results.
People. Relationships. Results.
Source: SEC EDGAR · 425 filed Feb 27, 2007