Transatlantic — Merger or Acquisition (September 2011)
45 slides from Transatlantic's merger presentation, Sep 2, 2011
Slide 1: Investor Presentation September 2011
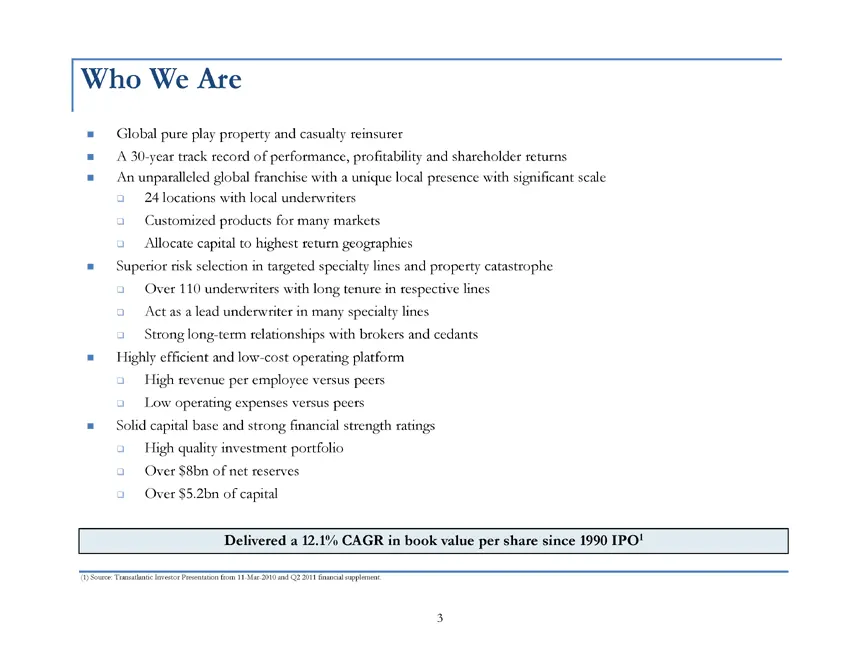
Investor Presentation September 2011
Slide 2: Additional information and third party sourced information
was filed with the SEC on August 19, 2011. Additional information regarding the participants in the proxy solicitation and a description of their direct and indirect interests, by security holdings or otherwise, to the extent applicable, will be contained in the other relevant materials to be filed
Slide 3: Key Discussion Issues / Questions
Key Discussion Issues / Questions Our assessment of current industry dynamics and their impact on Transatlantic How did we assess our strategic alternatives? Why did we pursue the Allied World merger? How did we assess other proposals? Validus proposal National Indemnity proposal Why we believe the
Slide 4: I: Current Industry Dynamics and Their Impact on Transatlantic
I: Current Industry Dynamics and Their Impact on Transatlantic
Slide 5: Competitive Landscape
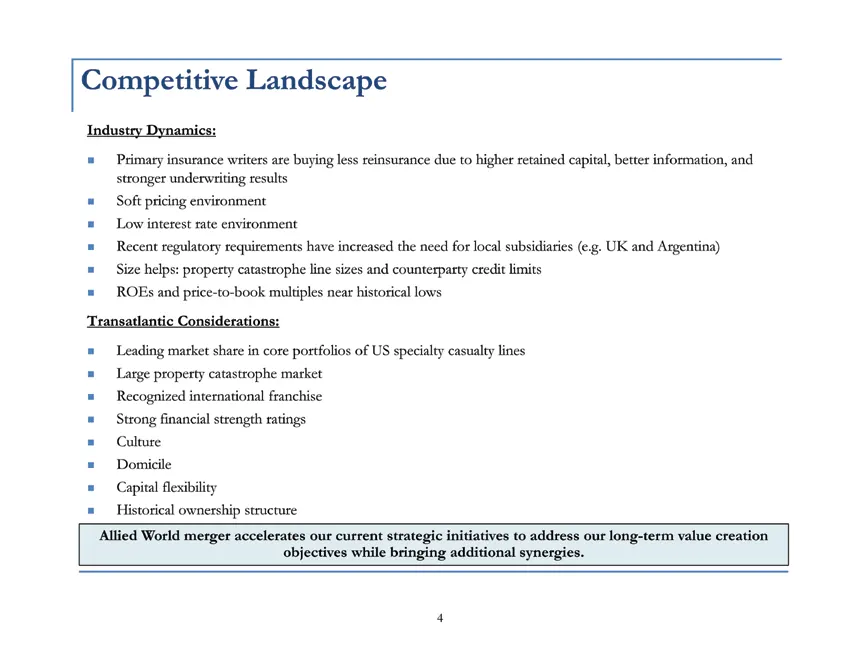
NAUTILUS2011\Presentation\8h ISS\ISS Presentation 101_sending.pptx Competitive Landscape Industry Dynamics: Primary insurance writers are buying less reinsurance due to higher retained capital, better information, and stronger underwriting results Soft pricing environment Low interest rate environme
Slide 6: Competitive Landscape
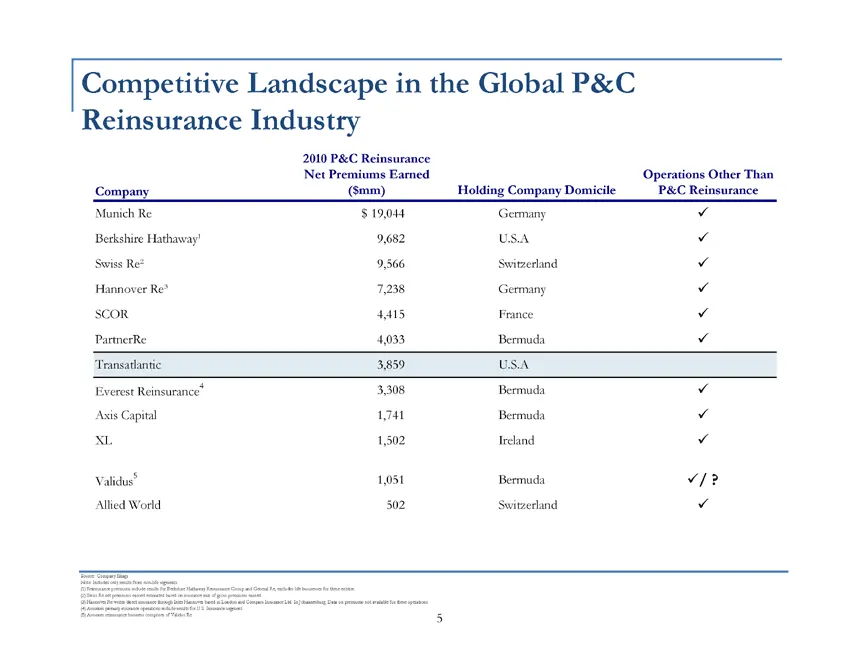
Competitive Landscape Industry Dynamics: Primary insurance writers are buying less reinsurance due to higher retained capital, better information, and stronger underwriting results Soft pricing environment Low interest rate environment Recent regulatory requirements have increased the need for local
Slide 7: Competitive Landscape in the Global P&C Reinsurance Industry
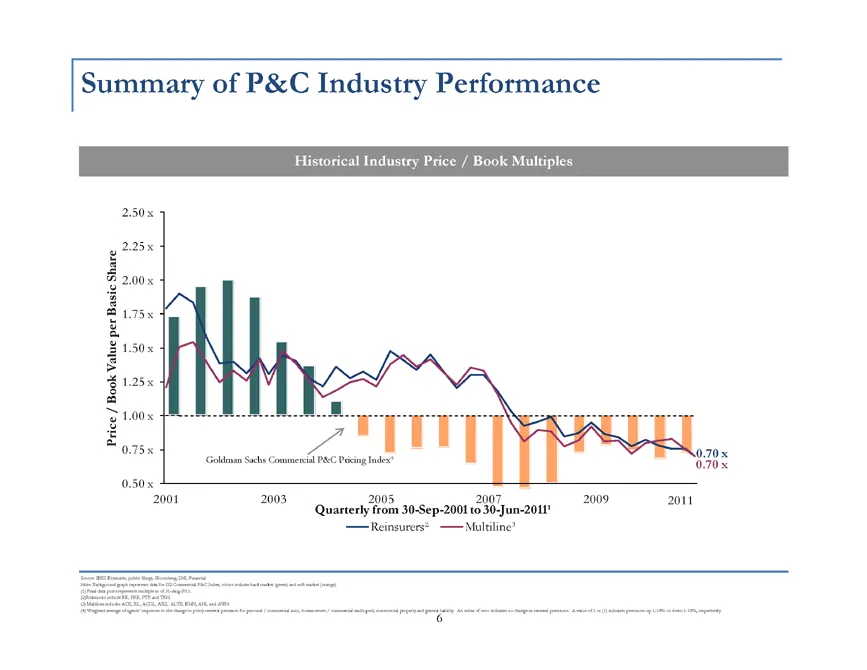
Competitive Landscape in the Global P&C Reinsurance Industry 2010 P&C Reinsurance Net Premiums Earned Operations Other Than Company ($mm) Holding Company Domicile P&C Reinsurance Munich Re $19,044 Germany Berkshire Hathaway 1 9,682 U.S.A Swiss Re 2 9,566 Switzerland Hannover Re 3 7,238 Germany SCOR
Slide 8: Summary of P&C Industry Performance
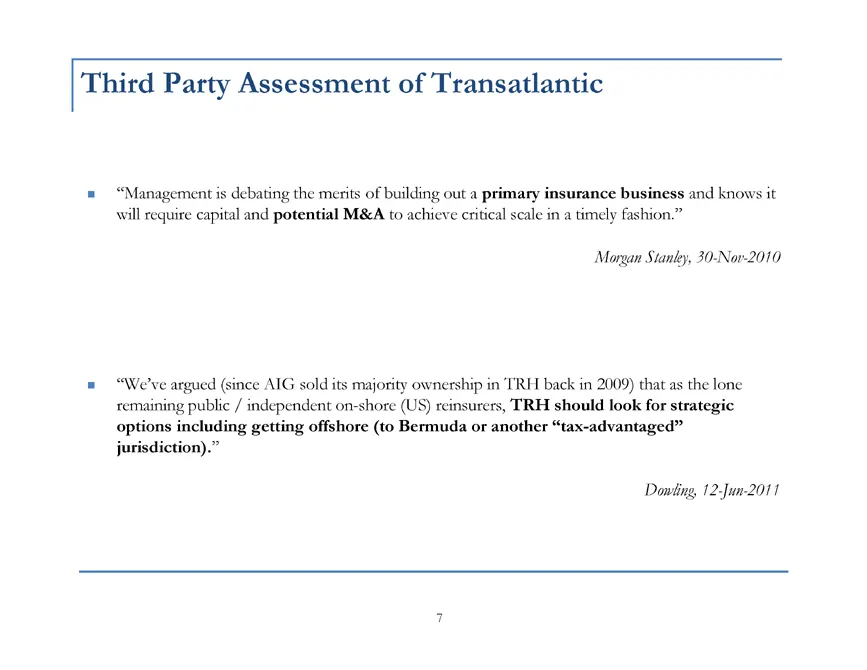
Summary of P&C Industry Performance Historical Industry Price / Book Multiples 2.50 x Share 2.25 x c 2.00 x Basi 1.75 x per Value 1.50 x Book 1.25 x / Price 1.00 x 0.75 x 0.70 x Goldman Sachs Commercial P&C Pricing Index4 0.70 x 0.50 x 2001 2003 2005 2007 2009 2011 Quarterly from 30-Sep-2001 to 30-J
Slide 9: Third Party Assessment of Transatlantic
Third Party Assessment of Transatlantic “Management is debating the merits of building out a primary insurance business and knows it will require capital and potential M&A to achieve critical scale in a timely fashion.” Morgan Stanley, 30-Nov-2010 “We’ve argued (since AIG sold its majority ownership
Slide 10: II: How Did We Assess Our Strategic Alternatives?
II: How Did We Assess Our Strategic Alternatives?
Slide 11: How Transatlantic Evaluated Potential Merger Candidates
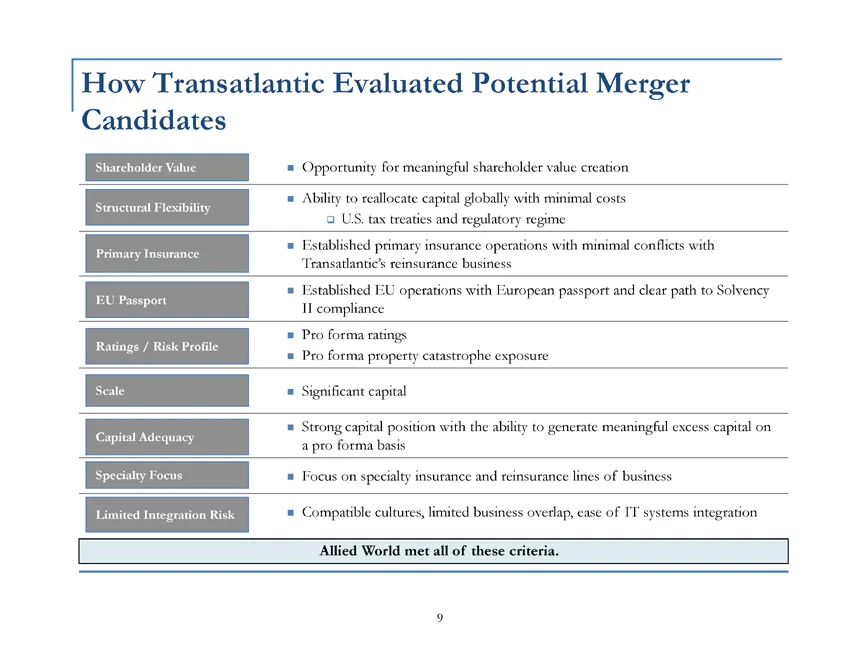
How Transatlantic Evaluated Potential Merger Candidates Shareholder Value Opportunity for meaningful shareholder value creation Ability to reallocate capital globally with minimal costs Structural Flexibility U.S. tax treaties and regulatory regime Established primary insurance operations with minim
Slide 12: How Transatlantic Evaluated Potential Merger Candidates
How Transatlantic Evaluated Potential Merger Candidates Shareholder Value Opportunity for meaningful shareholder value creation Ability to reallocate capital globally with minimal costs Structural Flexibility U.S. tax treaties and regulatory regime Established primary insurance operations with minim
Slide 13: Summary of Selected Companies
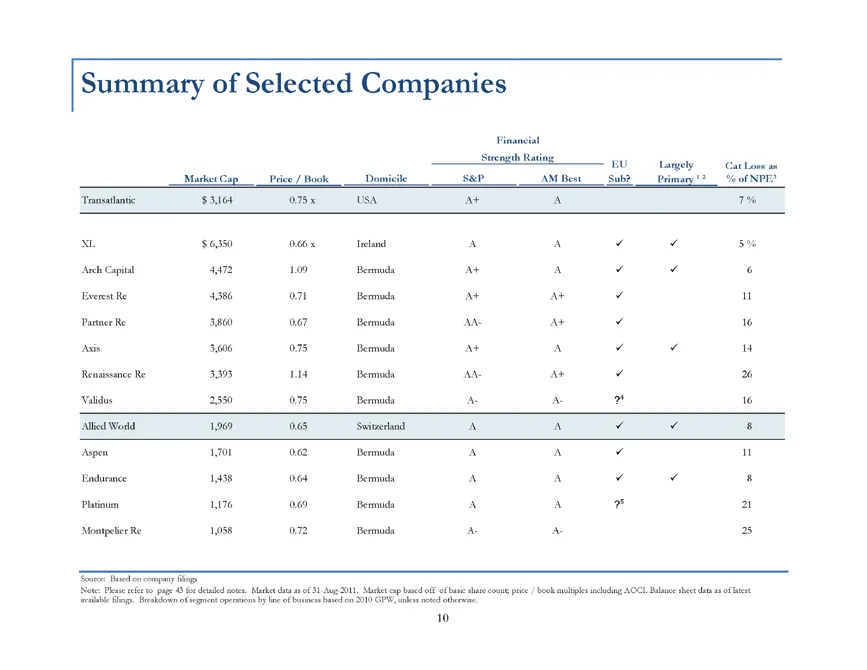
Summary of Selected Companies Financial Strength Rating EU Largely Cat Loss as Market Cap Price / Book Domicile S&P AM Best Sub? Primary 1 2 % of NPE 3 Transatlantic $3,164 0.75 x USA A+ A 7 % XL $6,350 0.66 x Ireland A A 5% Arch Capital 4,472 1.09 Bermuda A+ A 6 Everest Re 4,386 0.71 Bermuda A+ A+
Slide 14: Timeline of Key Events
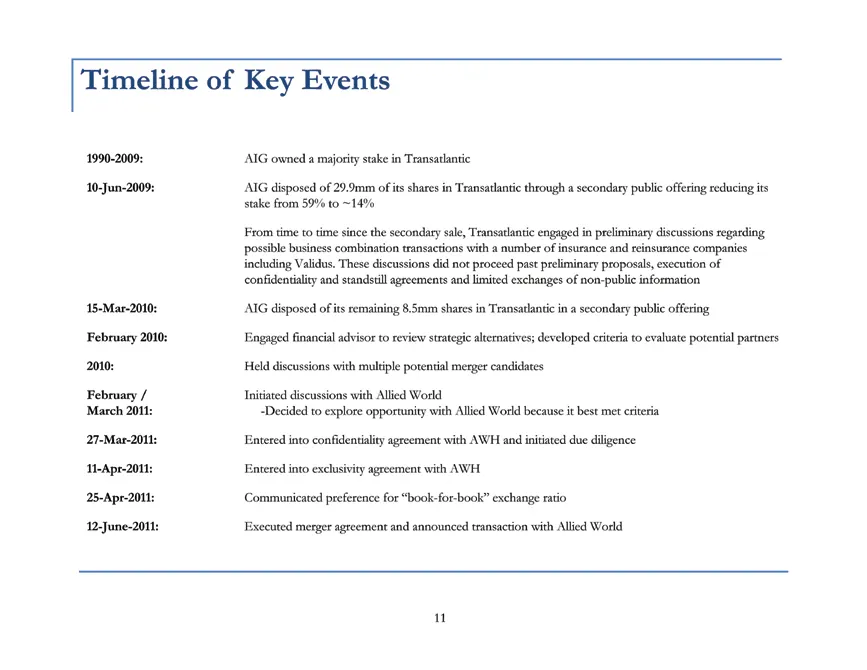
Timeline of Key Events 1990-2009: AIG owned a majority stake in Transatlantic 10-Jun-2009: AIG disposed of 29.9mm of its shares in Transatlantic through a secondary public offering reducing its stake from 59% to ~14% From time to time since the secondary sale, Transatlantic engaged in preliminary di
Slide 15: Strategic Objectives
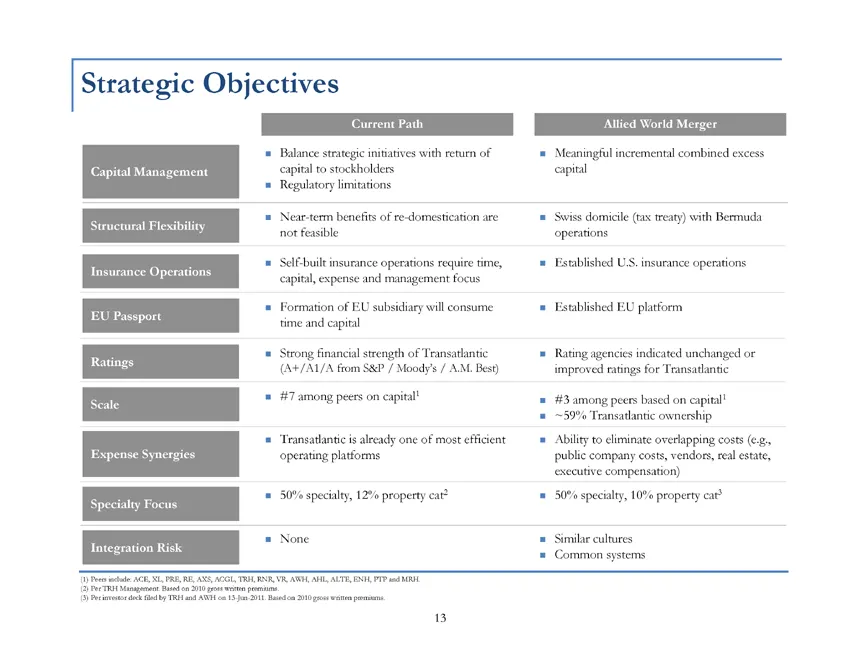
Strategic Objectives Current Path Allied World Merger Balance strategic initiatives with return of Meaningful incremental combined excess Capital Management capital to stockholders capital Regulatory limitations Near-term benefits of re-domestication are Swiss domicile (tax treaty) with Bermuda Stru
Slide 16: How We Expect the Merger to Create Value for Transatlantic Stockholders
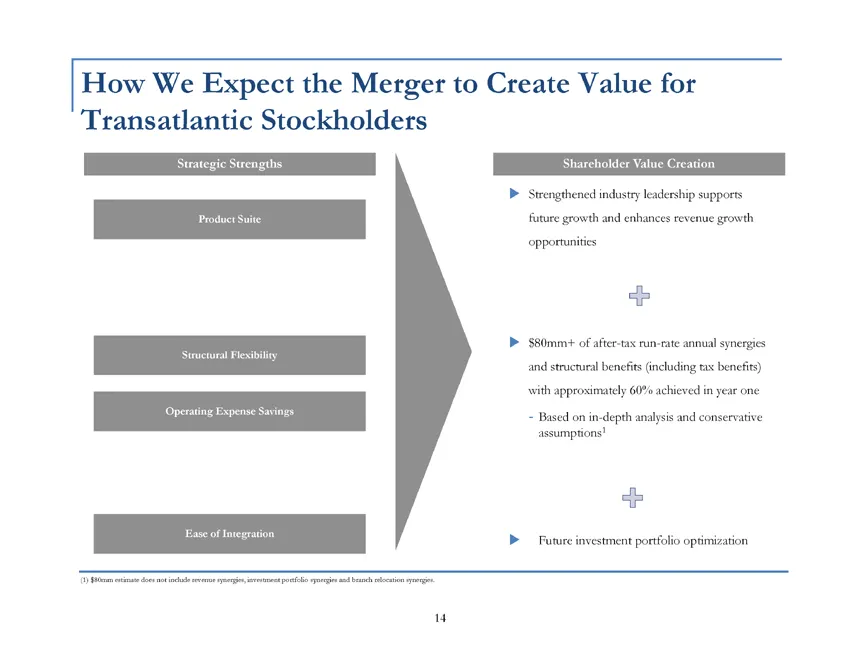
How We Expect the Merger to Create Value for Transatlantic Stockholders Strategic Strengths Shareholder Value Creation Strengthened industry leadership supports Product Suite future growth and enhances revenue growth opportunities $80mm+ of after-tax run-rate annual synergies Structural Flexibility
Slide 17: Attractive Financial Implications For Transatlantic Stockholders
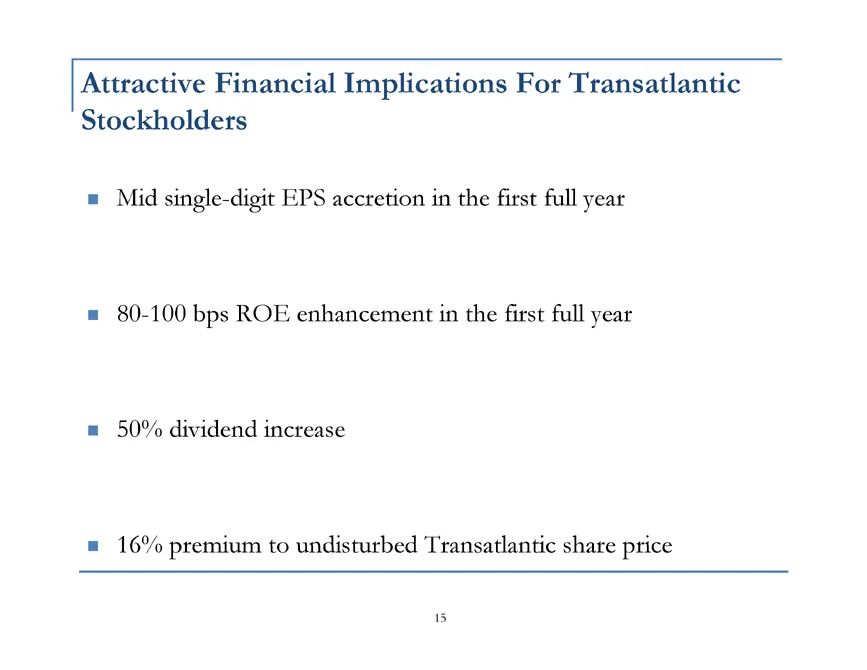
Attractive Financial Implications For Transatlantic Stockholders Mid single-digit EPS accretion in the first full year 80-100 bps ROE enhancement in the first full year 50% dividend increase 16% premium to undisturbed Transatlantic share price
Slide 18: How Did We Arrive at the Exchange Ratio?
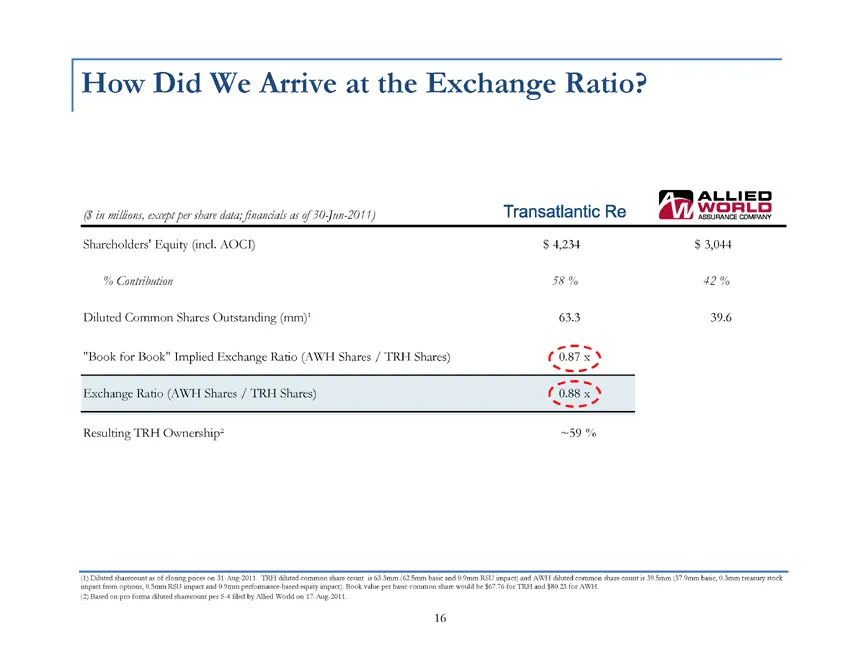
How Did We Arrive at the Exchange Ratio? ($ in millions, except per share data; financials as of 30-Jun-2011) Shareholders’ Equity (incl. AOCI) $4,234 $3,044% Contribution 58% 42% Diluted Common Shares Outstanding (mm) 1 63.3 39.6 “Book for Book” Implied Exchange Ratio (AWH Shares / TRH Shares) 0.87
Slide 19: Participation in Synergies Provides Potential Upside to Public Market Values
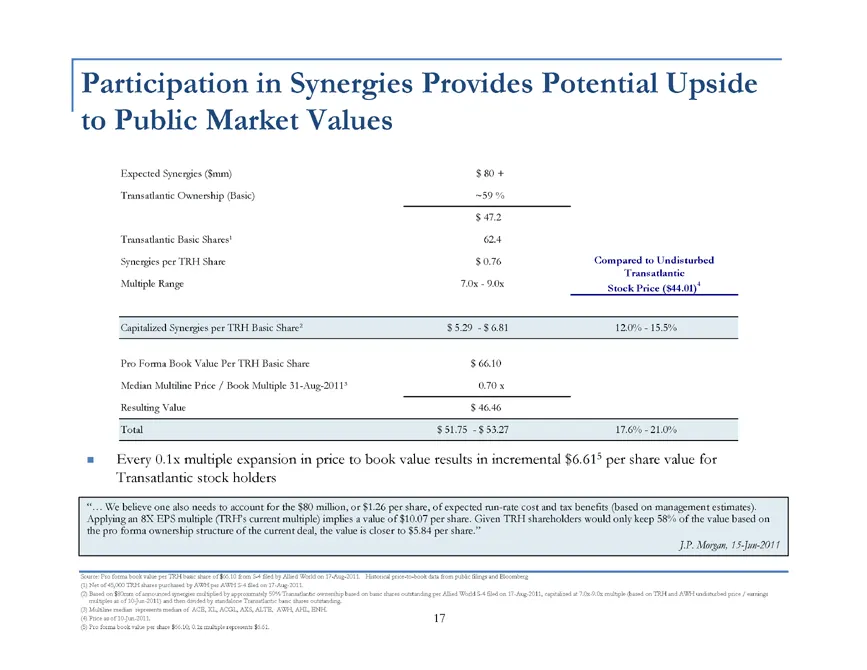
Participation in Synergies Provides Potential Upside to Public Market Values Expected Synergies ($mm) $80 + Transatlantic Ownership (Basic) ~59% $47.2 Transatlantic Basic Shares 1 62.4 Synergies per TRH Share $0.76 Compared to Undisturbed Transatlantic Multiple Range 7.0x — 9.0x Stock Price ($44.01)
Slide 20: Transatlantic Stockholder Value Based on Analysis Presented to Board
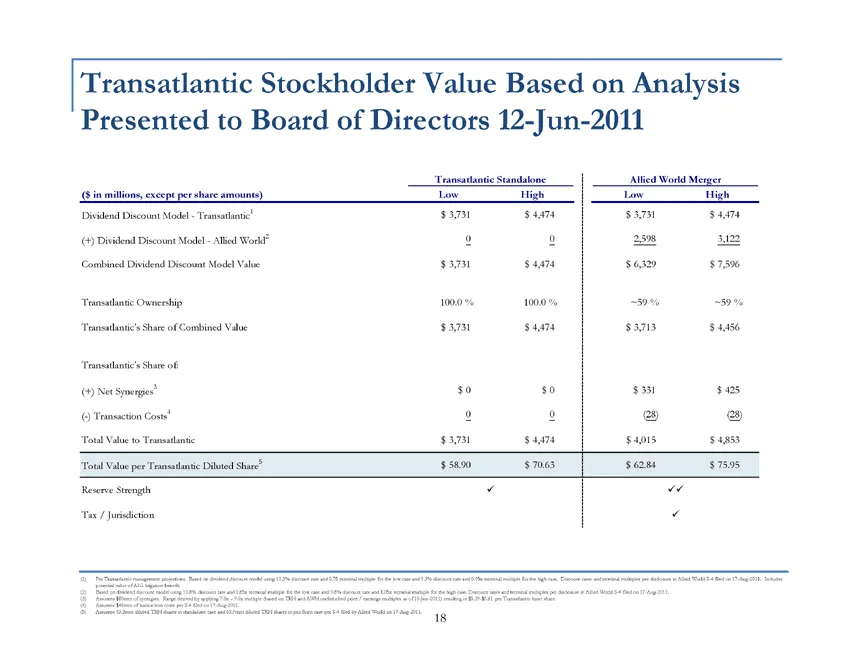
Transatlantic Stockholder Value Based on Analysis Presented to Board of Directors 12-Jun-2011 Transatlantic Standalone Allied World Merger ($ in millions, except per share amounts) Low High Low High Dividend Discount Model — Transatlantic1 $3,731 $4,474 $3,731 $4,474 (+) Dividend Discount Model — Al
Slide 21: Third Party Observations Regarding the Transatlantic / Allied World Deal
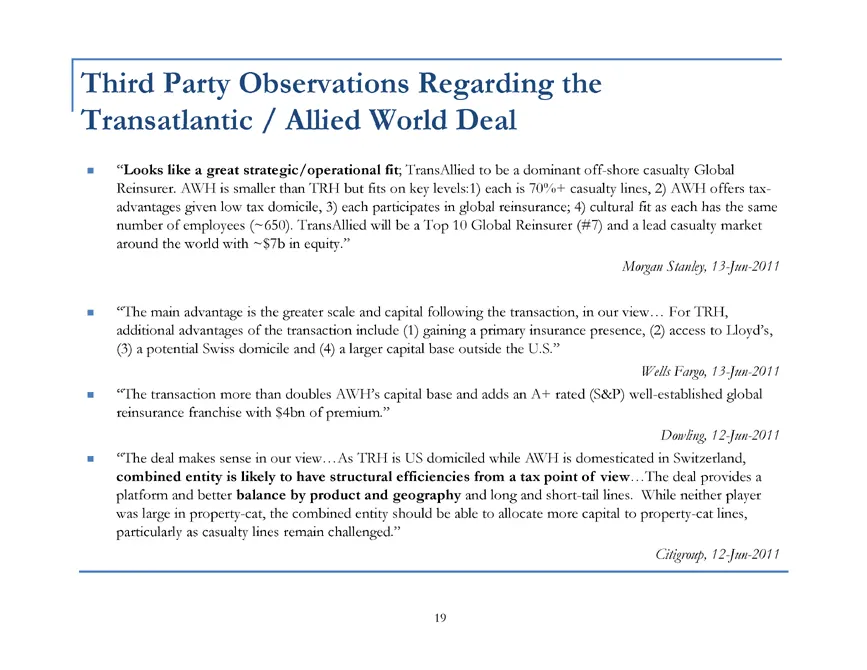
Third Party Observations Regarding the Transatlantic / Allied World Deal “Looks like a great strategic/operational fit; TransAllied to be a dominant off-shore casualty Global Reinsurer. AWH is smaller than TRH but fits on key levels:1) each is 70%+ casualty lines, 2) AWH offers tax-advantages given
Slide 22: III: How Did We Assess Other Proposals?
III: How Did We Assess Other Proposals?
Slide 23: Summary of Validus Proposal
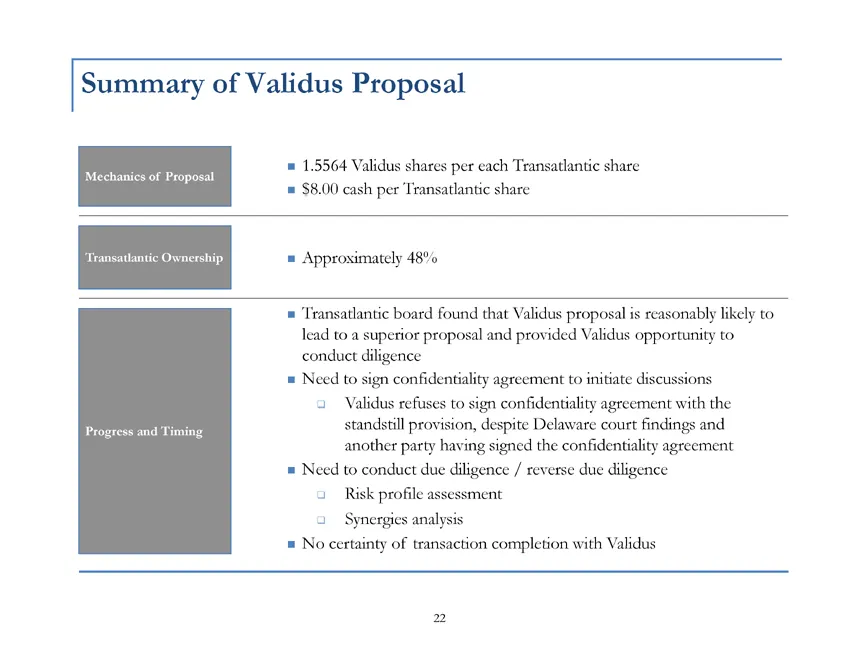
| Summary of Validus Proposal = 1.5564 Validus shares per each Transatlantic share = $8,00 cash per ‘Transatlantic share Transatlantic Ownership = Approsimately 48% Progress and’ Transatlantic board found that Validus proposal is reasonably likely to ead to a superior proposal and provided Validus o
Slide 24: Summary of Validus Proposal
Summary of Validus Proposal 1.5564 Validus shares per each Transatlantic share Mechanics of Proposal $8.00 cash per Transatlantic share Transatlantic Ownership Approximately 48% Transatlantic board found that Validus proposal is reasonably likely to lead to a superior proposal and provided Validus o
Slide 25: Validus Proposal — Key Events
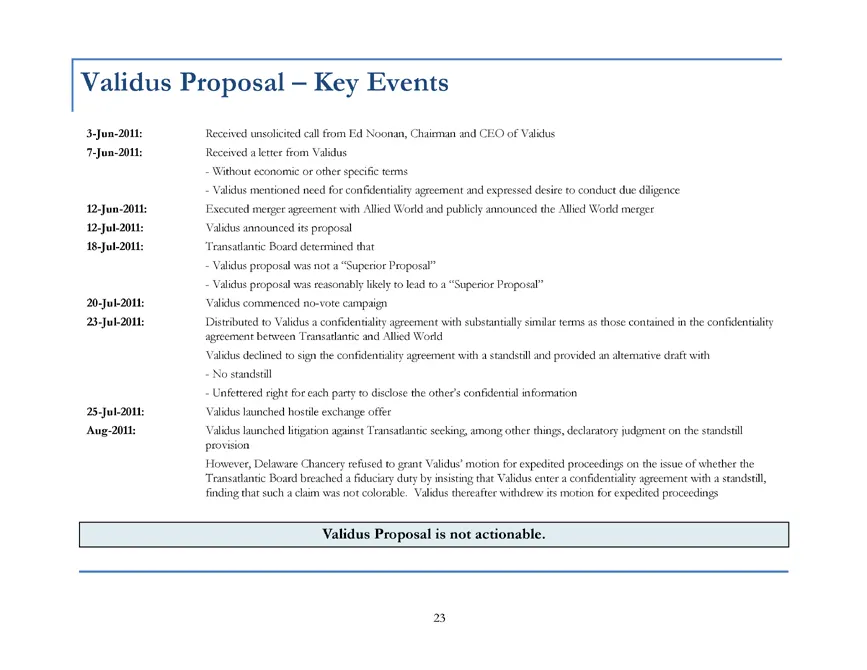
Validus Proposal — Key Events 3-Jun-2011: Received unsolicited call from Ed Noonan, Chairman and CEO of Validus 7-Jun-2011: Received a letter from Validus — Without economic or other specific terms — Validus mentioned need for confidentiality agreement and expressed desire to conduct due diligence 1
Slide 26: Why Did We Not Consider Validus Proposal a Superior Proposal?
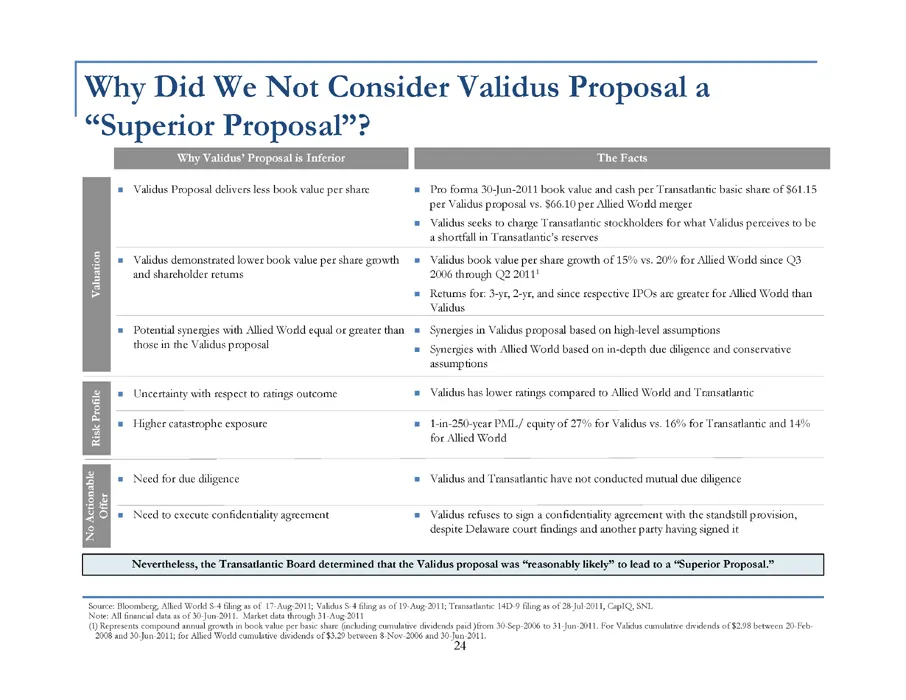
Why Did We Not Consider Validus Proposal a “Superior Proposal”? Why Validus’ Proposal is Inferior The Facts Validus Proposal delivers less book value per share Pro forma 30-Jun-2011 book value and cash per Transatlantic basic share of $61.15 per Validus proposal vs. $66.10 per Allied World merger Va
Slide 27: Validus Proposal Does Not Reflect Transatlantic's Contribution
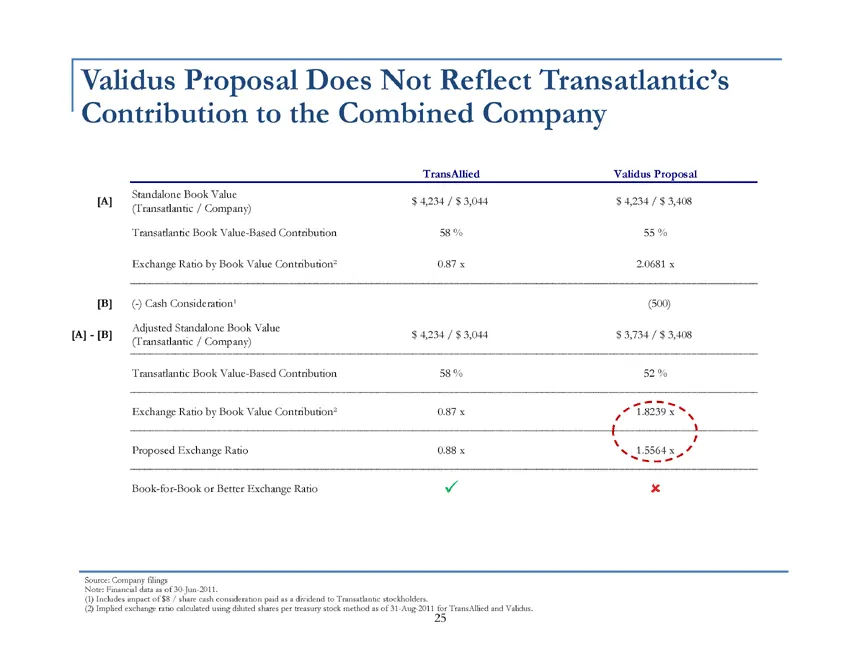
Validus Proposal Does Not Reflect Transatlantic’s Contribution to the Combined Company TransAllied Validus Proposal Standalone Book Value [A] $4,234 / $3,044 $4,234 / $3,408 (Transatlantic / Company) Transatlantic Book Value-Based Contribution 58% 55% Exchange Ratio by Book Value Contribution 2 0.87
Slide 28: Validus Exchange Offer Provides Lower Book Value per Share
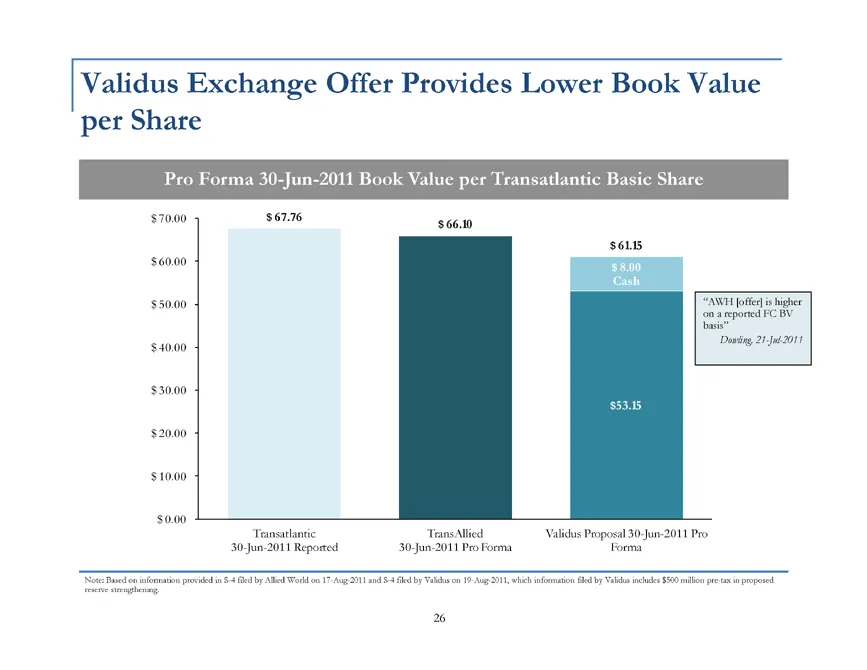
Validus Exchange Offer Provides Lower Book Value per Share Pro Forma 30-Jun-2011 Book Value per Transatlantic Basic Share $70.00 $67.76 $66.10 $61.15 $60.00 $8.00 Cash $50.00 “AWH [offer] is higher on a reported FC BV basis” Dowling, 21-Jul-2011 $40.00 $30.00 $53.15 $20.00 $10.00 $0.00 Transatlantic
Slide 29: Allied World Has Demonstrated Higher Growth in Book Value per Share
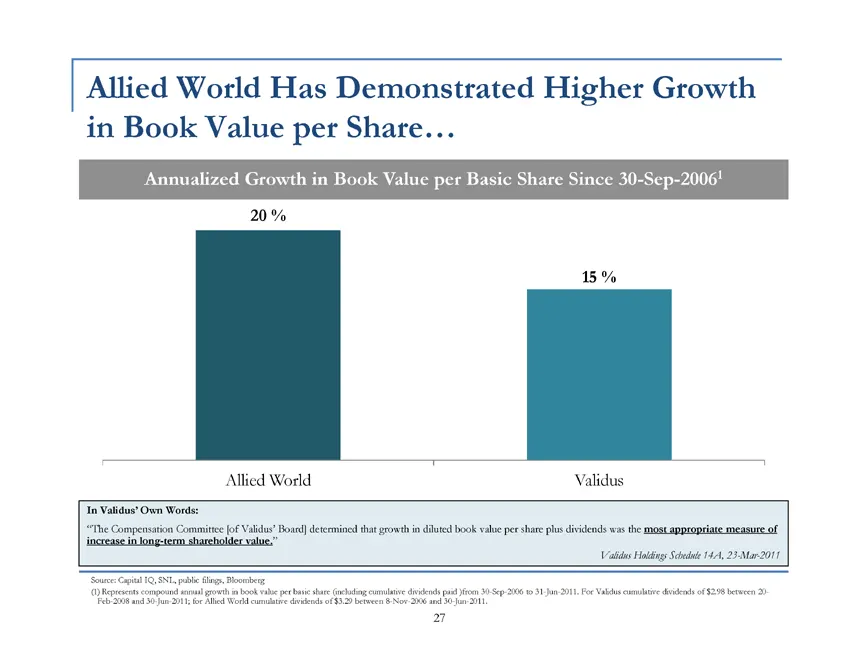
Allied World Has Demonstrated Higher Growth in Book Value per Share... Annualized Growth in Book Value per Basic Share Since 30-Sep-20061 20% 15% Allied World Validus In Validus’ Own Words: “The Compensation Committee [of Validus’ Board] determined that growth in diluted book value per share plus di
Slide 30: ...and Lower Volatility in Earnings
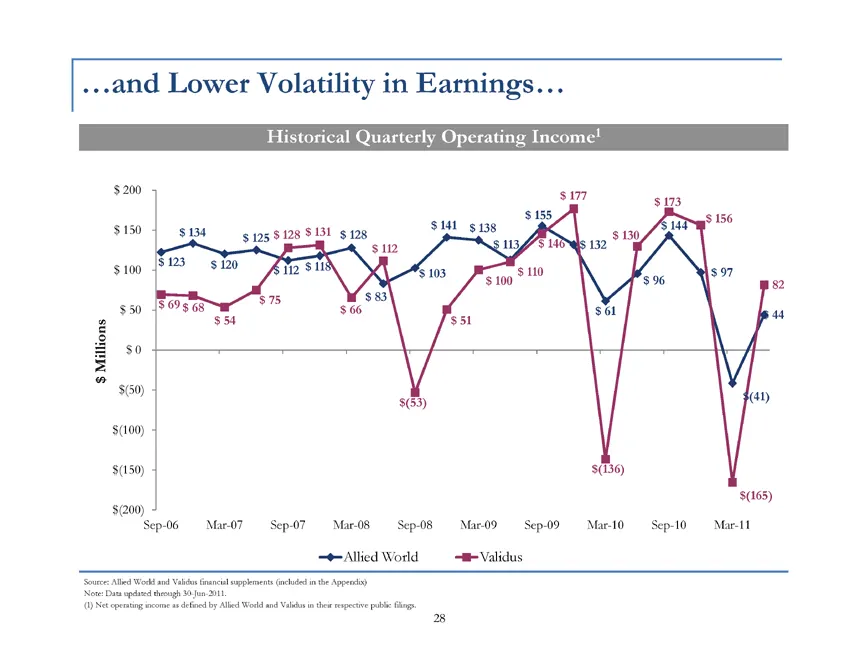
...and Lower Volatility in Earnings... Historical Quarterly Operating Income1 $200 $177 $173 $155 $156 $150 $141 $138 $144 $134 $128 $131 $128 $130 $125 $146 $112 $113 $132 $123 $120 $118 $100 $112 $103 $110 $97 $100 $96 $82 $75 $83 $50 $69 $68 $66 $61 $44 $54 $51 Millions $0 $ $(50) $(41) $(53) $(1
Slide 31: ...Which Have Led to Superior Returns for Allied World Shareholders
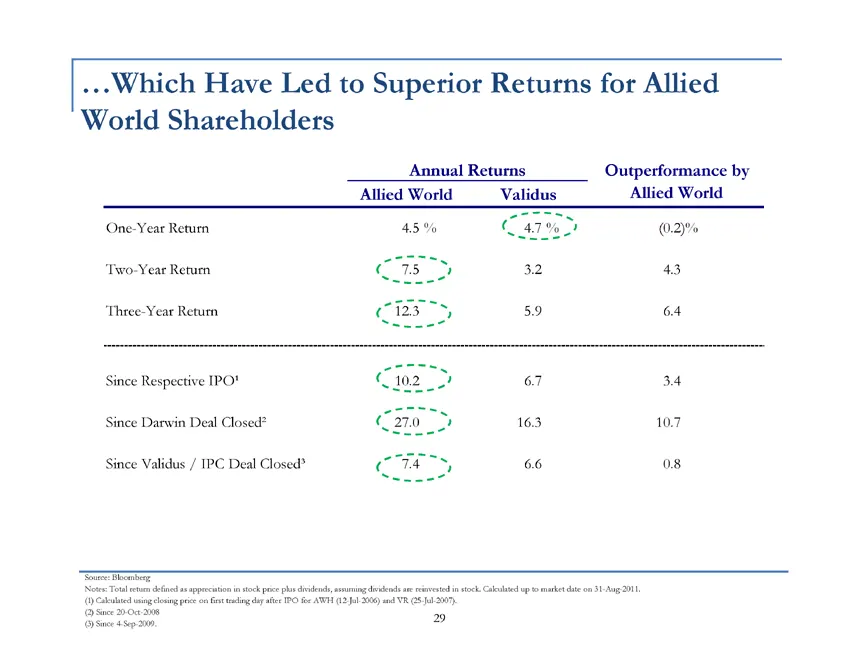
...Which Have Led to Superior Returns for Allied World Shareholders Annual Returns Outperformance by Allied World Validus Allied World One-Year Return 4.5% 4.7% (0.2)% Two-Year Return 7.5 3.2 4.3 Three-Year Return 12.3 5.9 6.4 Since Respective IPO 1 10.2 6.7 3.4 Since Darwin Deal Closed 2 27.0 16.3
Slide 32: Illustrative Adjusted Value per Transatlantic Share
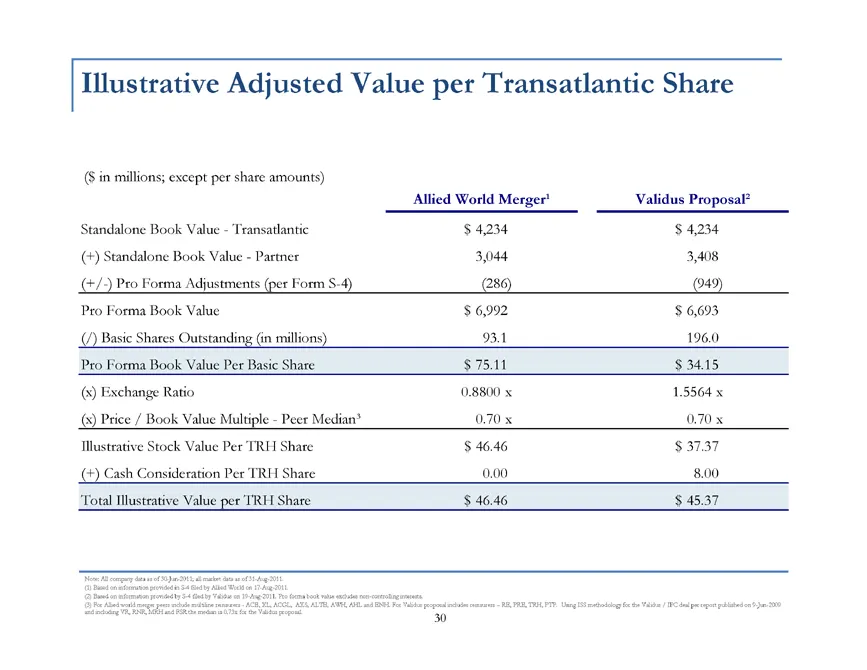
Illustrative Adjusted Value per Transatlantic Share ($ in millions; except per share amounts) Allied World Merger 1 Validus Proposal 2 Standalone Book Value — Transatlantic $4,234 $4,234 (+) Standalone Book Value — Partner 3,044 3,408 (+/-) Pro Forma Adjustments (per Form S-4) (286) (949) Pro Forma
Slide 33: Validus Proposal Results in Significantly Higher Property Catastrophe Risk Exposure
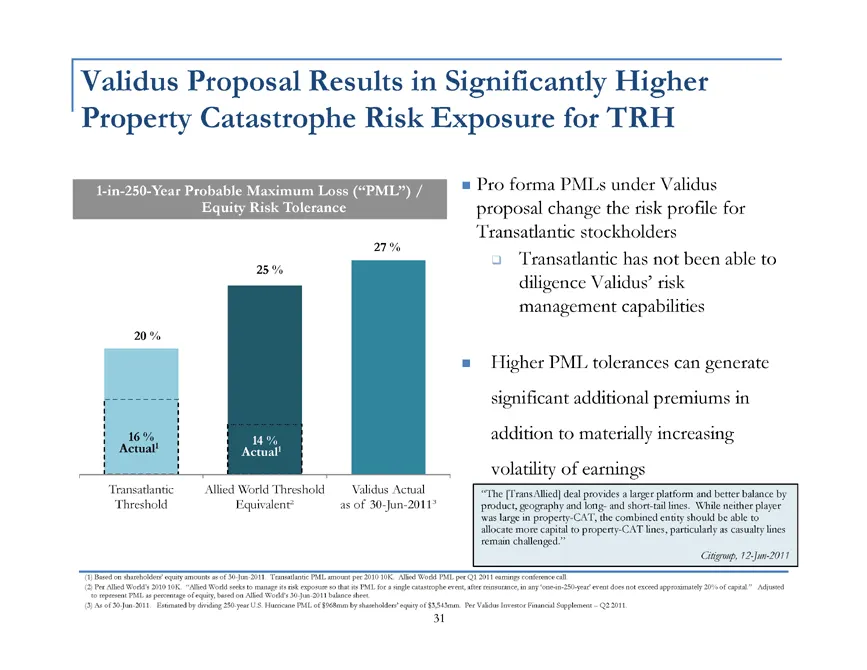
Validus Proposal Results in Significantly Higher Property Catastrophe Risk Exposure for TRH 1-in-250-Year Probable Maximum Loss (“PML”) / Pro forma PMLs under Validus Equity Risk Tolerance proposal change the risk profile for Transatlantic stockholders 27% Transatlantic has not been able to 25% dili
Slide 34: Significant Uncertainty in Ratings Outcome in Validus Proposal
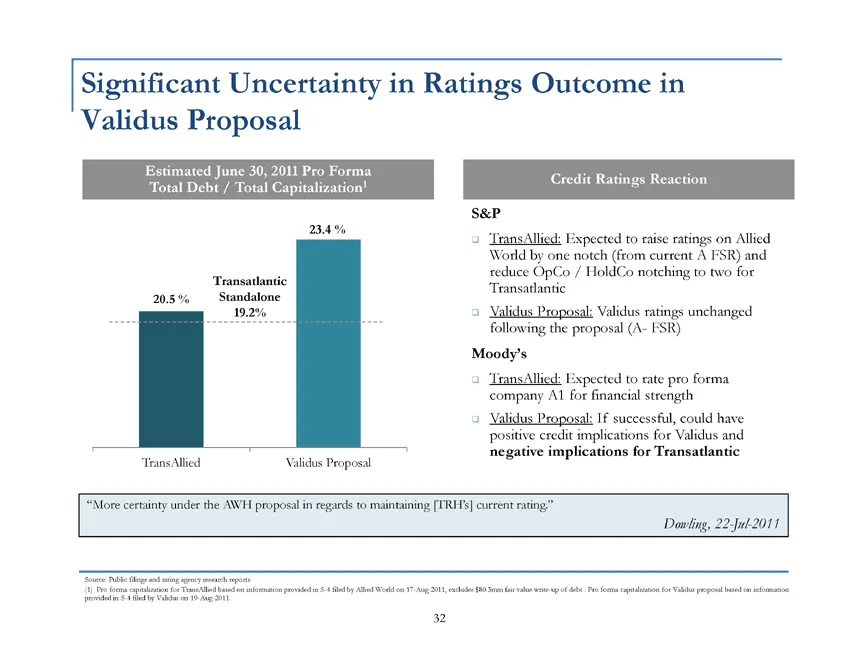
Significant Uncertainty in Ratings Outcome in Validus Proposal Estimated June 30, 2011 Pro Forma 1 Credit Ratings Reaction Total Debt / Total Capitalization S&P 23.4% TransAllied: Expected to raise ratings on Allied World by one notch (from current A FSR) and reduce OpCo / HoldCo notching to two for
Slide 35: B: National Indemnity Proposal
B: National Indemnity Proposal
Slide 36: Summary of National Indemnity Offer
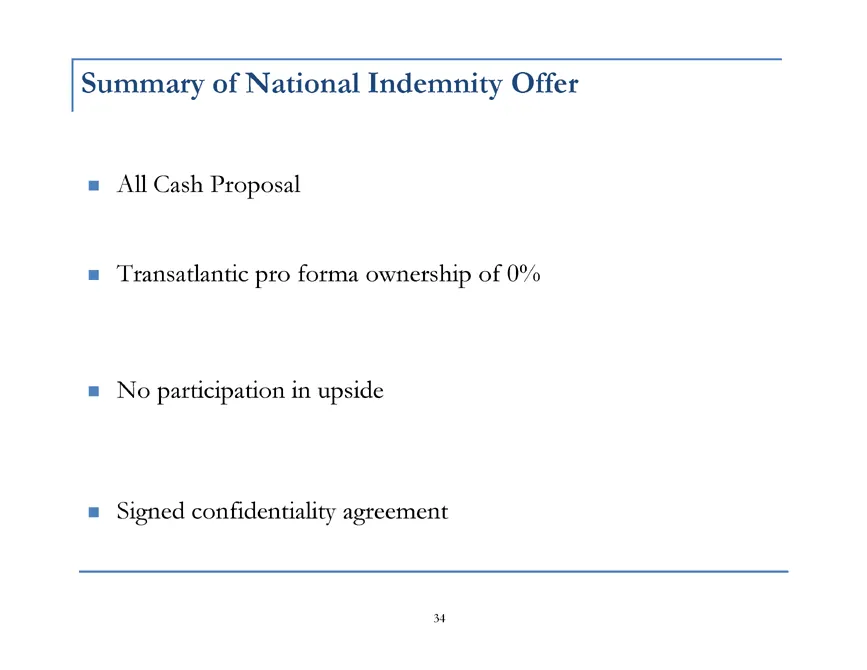
Summary of National Indemnity Offer All Cash Proposal Transatlantic pro forma ownership of 0% No participation in upside Signed confidentiality agreement
Slide 37: National Indemnity Delivered its Opportunistic Offer During Market Decline
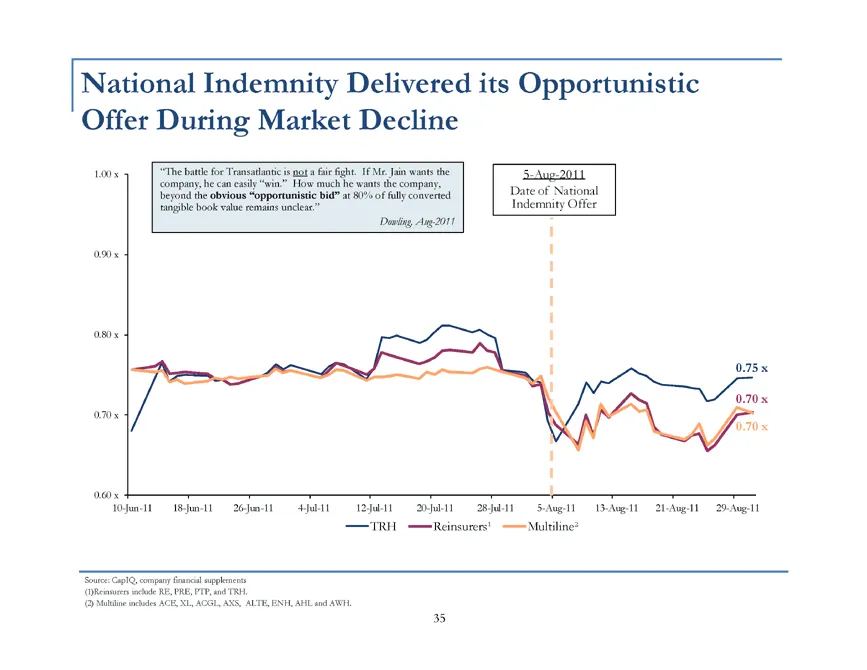
National Indemnity Delivered its Opportunistic Offer During Market Decline 1.00 x “The battle for Transatlantic is not a fair fight. If Mr. Jain wants the 5-Aug-2011 company, he can easily “win.” How much he wants the company, beyond the obvious “opportunistic bid” at 80% of fully converted Date of
Slide 38: National Indemnity Proposal is Below Levels of Selected Precedent Cash Transactions
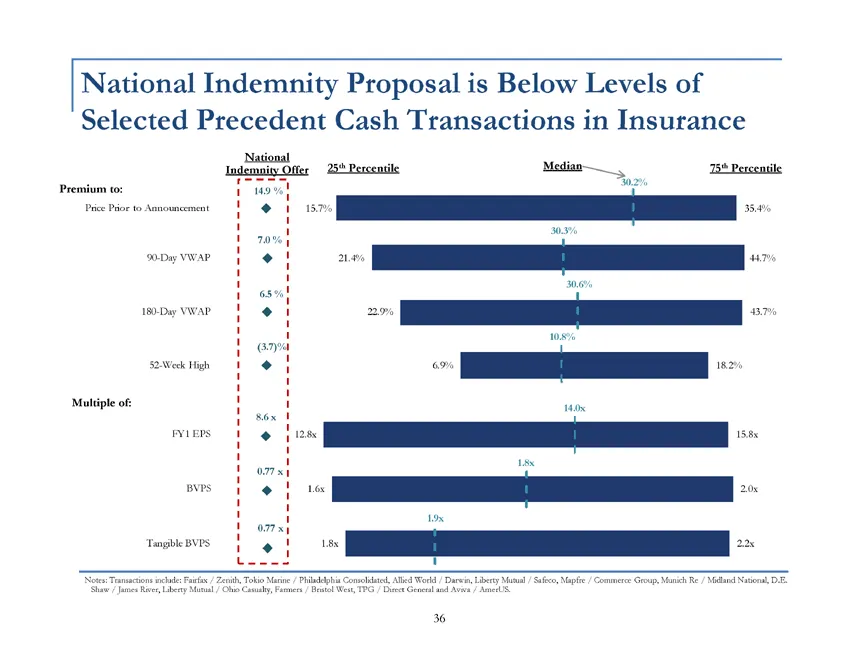
National Indemnity Proposal is Below Levels of Selected Precedent Cash Transactions in Insurance National Indemnity Offer 25th Percentile Median 75th Percentile 30.2% Premium to: 14.9% Price Prior to Announcement 15.7% 35.4% 7.0% 30.3% 90-Day VWAP 21.4% 44.7% 6.5% 30.6% 180-Day VWAP 22.9% 43.7% 10.8
Slide 39: Why We Believe the Allied World Transaction Delivers Superior Value
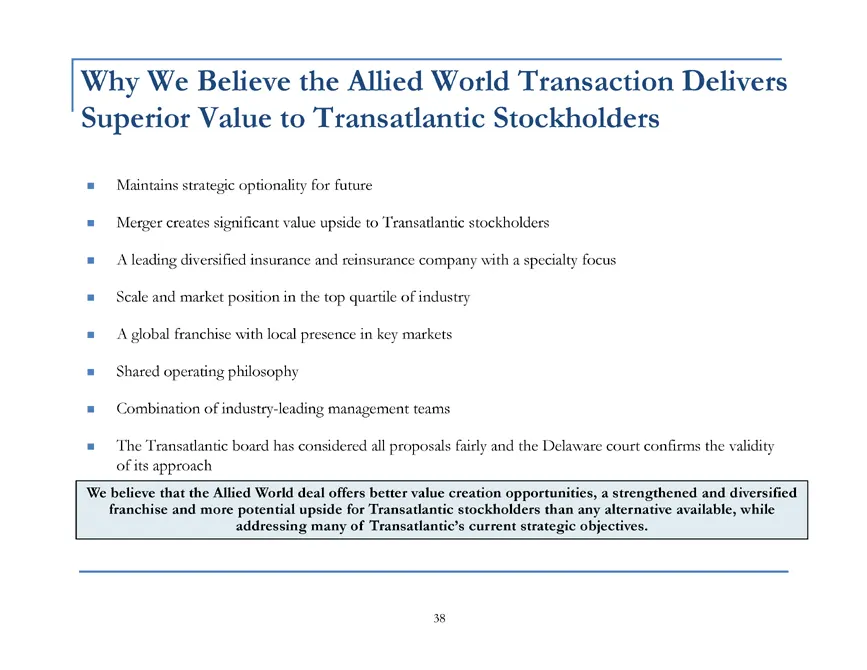
Why We Believe the Allied World Transaction Delivers Superior Value to Transatlantic Stockholders Maintains strategic optionality for future = Merger creates significant value upside to Transatlantic stockholders = A leading diversified insurance and reinsurance company with a specialty focus = Scal
Slide 40: Why We Believe the Allied World Transaction Delivers Superior Value
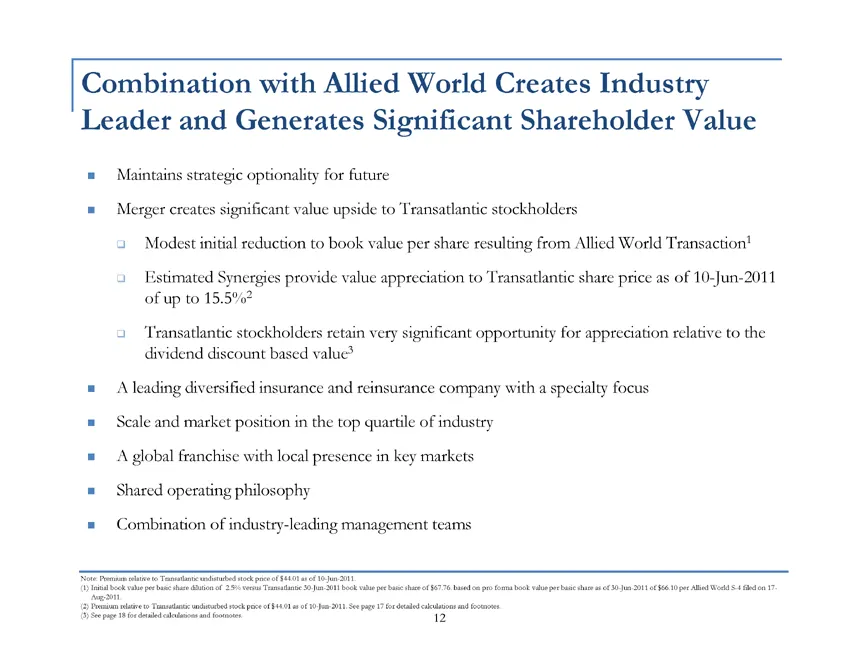
Why We Believe the Allied World Transaction Delivers Superior Value to Transatlantic Stockholders Maintains strategic optionality for future Merger creates significant value upside to Transatlantic stockholders A leading diversified insurance and reinsurance company with a specialty focus Scale and
Slide 41: Appendix A: Reconciliation of Non-GAAP Measures
Appendix pp A: Reconciliation of Non-GAAP Measures1 (1) This presentation includes certain financial measures that are not calculated under standards or rules that comprise U.S. GAAP. Such measures are referred to as non-GAAP. Non-GAAP measures may be defined or calculated differently by other compa
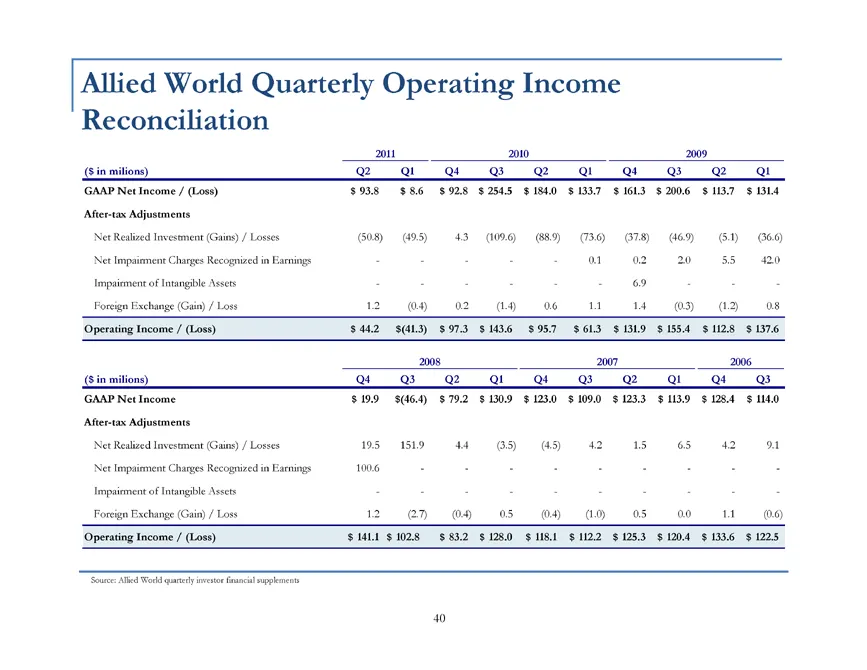
Slide 42: Allied World Quarterly Operating Income Reconciliation
Allied World Quarterly Operating Income Reconciliation 2011 2010 2009 ($ in milions) Q2 Q1 Q4 Q3 Q2 Q1 Q4 Q3 Q2 Q1 GAAP Net Income / (Loss) $93.8 $8.6 $92.8 $254.5 $184.0 $133.7 $161.3 $200.6 $113.7 $131.4 After-tax Adjustments Net Realized Investment (Gains) / Losses (50.8) (49.5) 4.3 (109.6) (88.9
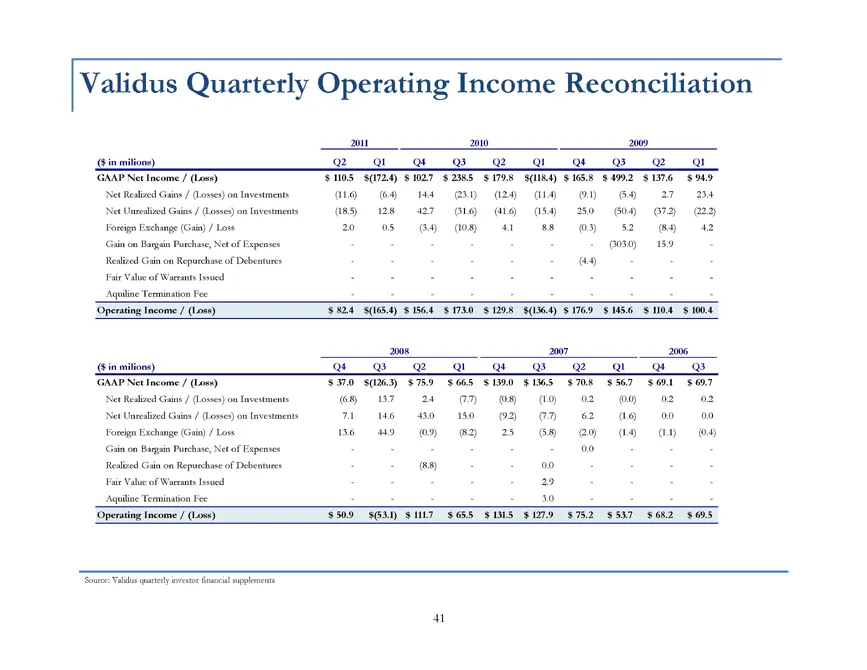
Slide 43: Validus Quarterly Operating Income Reconciliation
Validus Quarterly Operating Income Reconciliation 2011 2010 2009 ($ in milions) Q2 Q1 Q4 Q3 Q2 Q1 Q4 Q3 Q2 Q1 GAAP Net Income / (Loss) $110.5 $(172.4) $102.7 $238.5 $179.8 $(118.4) $165.8 $499.2 $137.6 $94.9 Net Realized Gains / (Losses) on Investments (11.6) (6.4) 14.4 (23.1) (12.4) (11.4) (9.1) (5
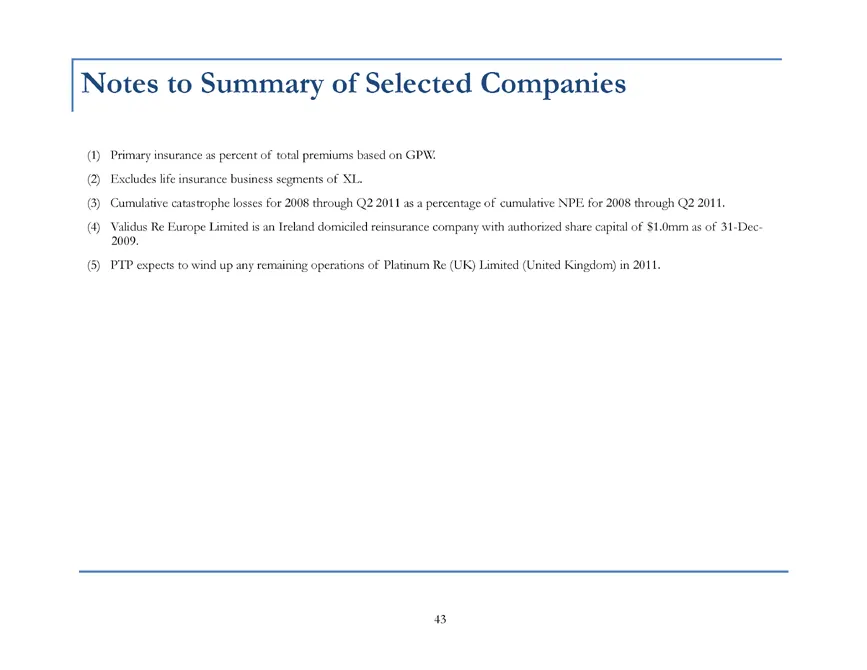
Slide 44: Appendix B: Other Materials - Notes to Summary of Selected Companies
Appendix pp B: Other Materials Notes to Summary of Selected Companies (1) Primary insurance as percent of total premiums based on GPW. (2) Excludes life insurance business segments of XL. (3) Cumulative catastrophe losses for 2008 through Q2 2011 as a percentage of cumulative NPE for 2008 through Q2
Slide 45: Comparison of Selected Companies
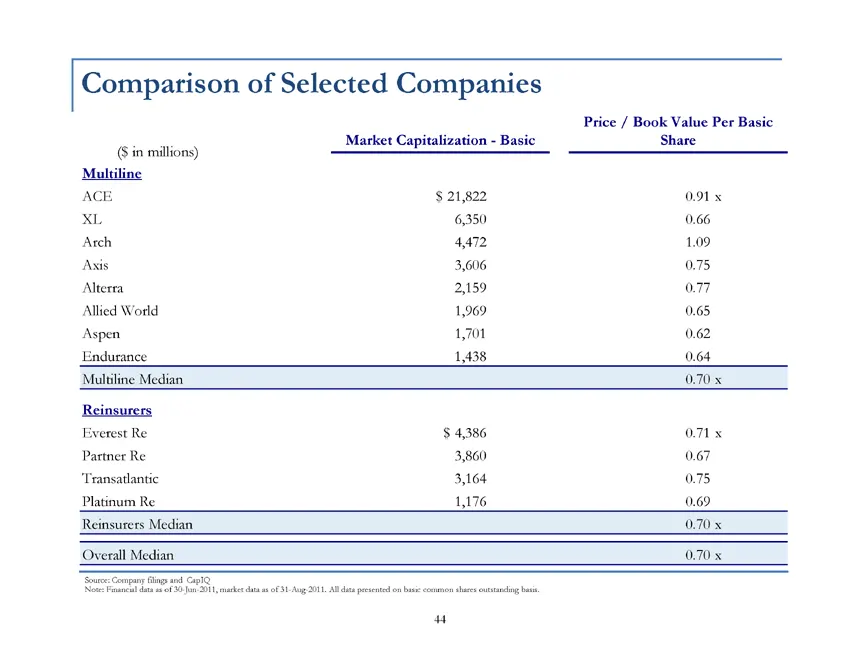
Comparison of Selected Companies Price / Book Value Per Basic Market Capitalization — Basic Share ($ in millions) Multiline ACE $21,822 0.91 x XL 6,350 0.66 Arch 4,472 1.09 Axis 3,606 0.75 Alterra 2,159 0.77 Allied World 1,969 0.65 Aspen 1,701 0.62 Endurance 1,438 0.64 Multiline Median 0.70 x Reinsu
Source: SEC EDGAR · 425 filed Sep 2, 2011
More decks from Transatlantic Holdings Inc
 Q3 2012 Earnings Presentation10 slides · Nov 2, 2012
 Merger or Acquisition (December 2011)40 slides · Dec 1, 2011
 Merger or Acquisition (December 2011)39 slides · Dec 1, 2011
 Merger or Acquisition (November 2011)11 slides · Nov 29, 2011
 Merger or Acquisition (November 2011)28 slides · Nov 10, 2011
 Merger or Acquisition (November 2011)41 slides · Nov 4, 2011