Capita plc · LSE:CPI
Capita — H1 2006 Earnings Presentation
49 slides from Capita's earnings presentation, 2006
Slide 1: Results for the 6 months to 30 June 2006
Results for the 6 months to 30 June 2006
Slide 2: Building value for shareholders
Building value for shareholders Rod Aldridge Chairman
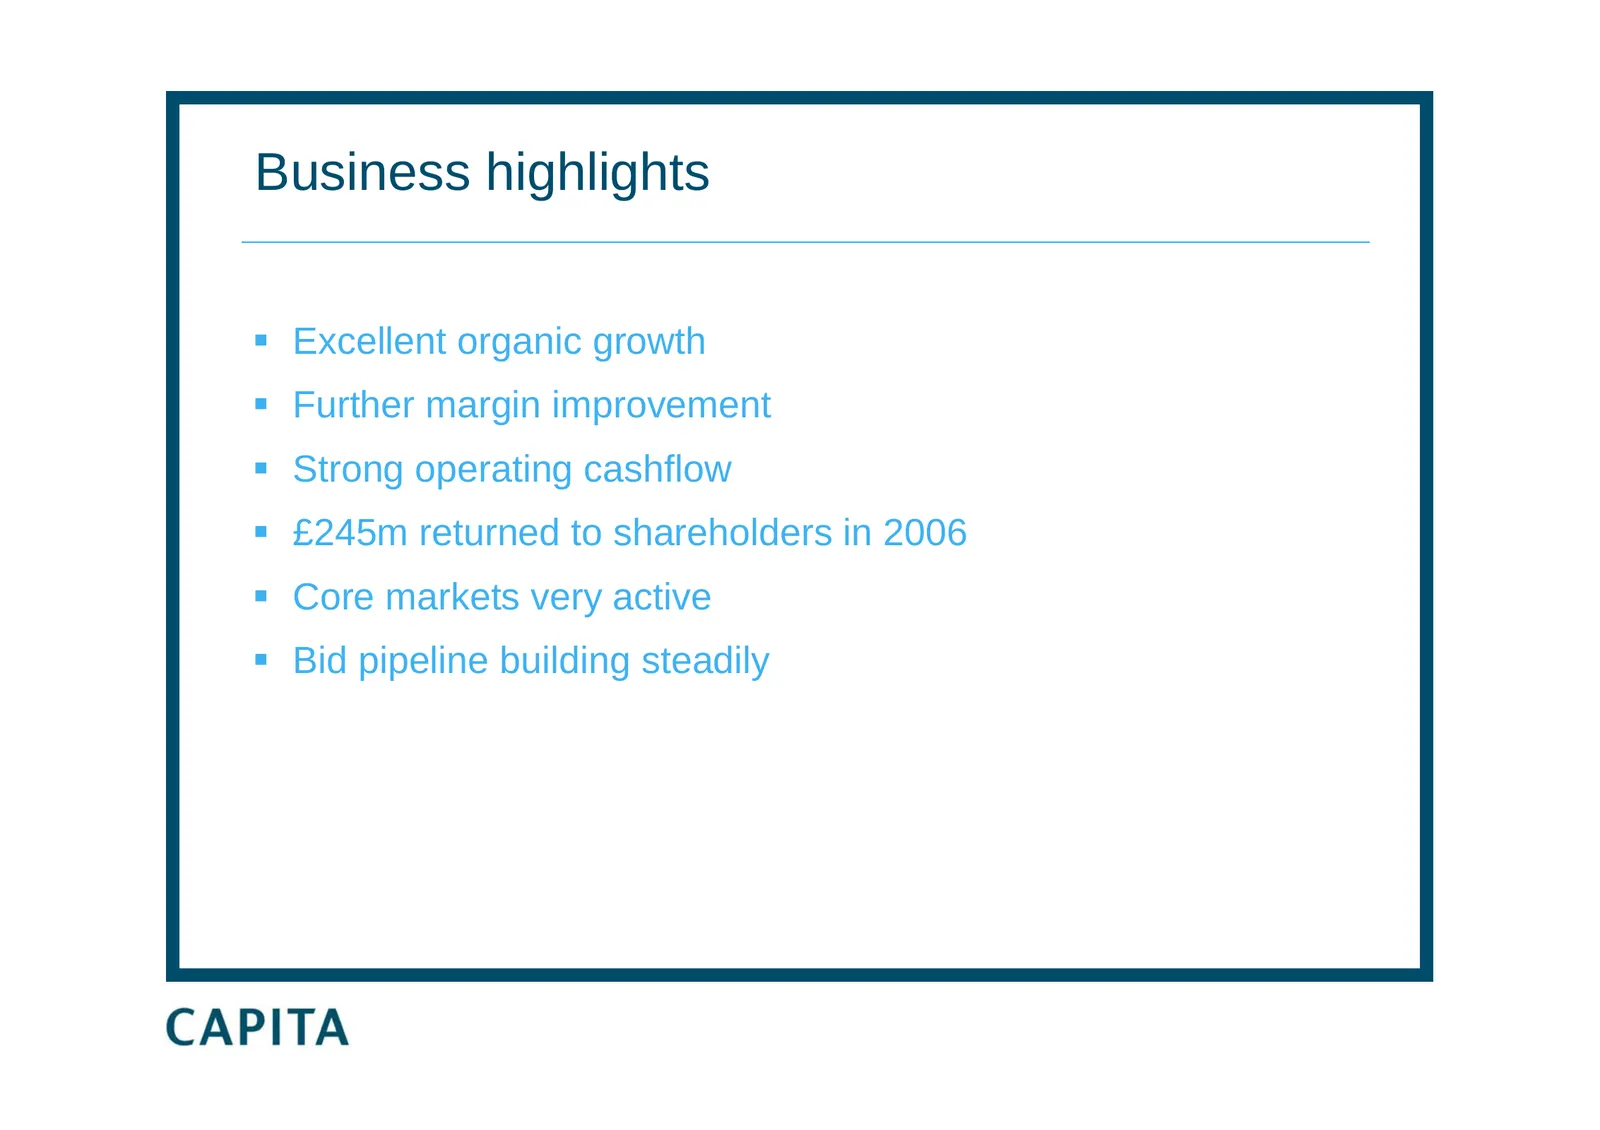
Slide 3: Business highlights
Business highlights Excellent organic growth Further margin improvement Strong operating cashflow £245m returned to shareholders in 2006 Core markets very active Bid pipeline building steadily
Slide 4: Agenda
Agenda Financial results Business performance Developing Capita
Slide 5: Financial results
Financial results Gordon Hurst Group Finance Director
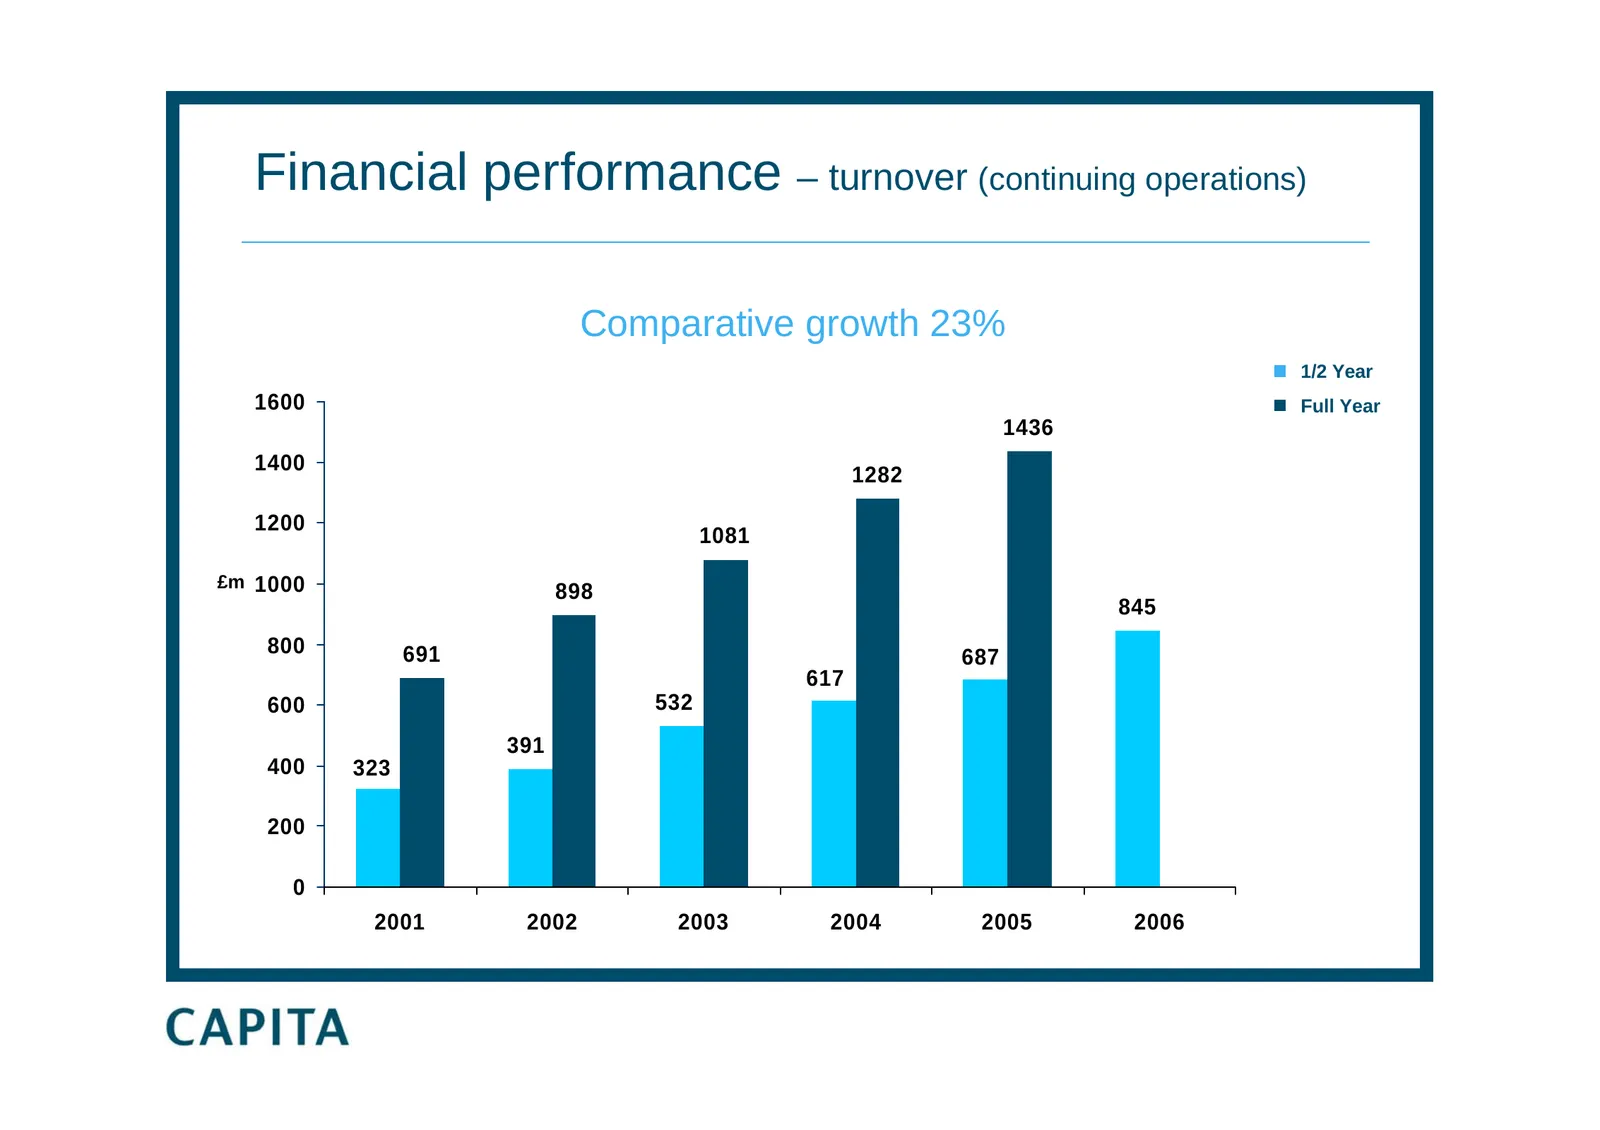
Slide 6: Financial performance – turnover (continuing operations)
Financial performance – turnover (continuing operations) Comparative growth 23% 1/2 Year 1600 Full Year 1436 1400 1282 1200 1081 £m 1000 898 845 800 691 687 617 600 532 391 400 323 200 0 2001 2002 2003 2004 2005 2006
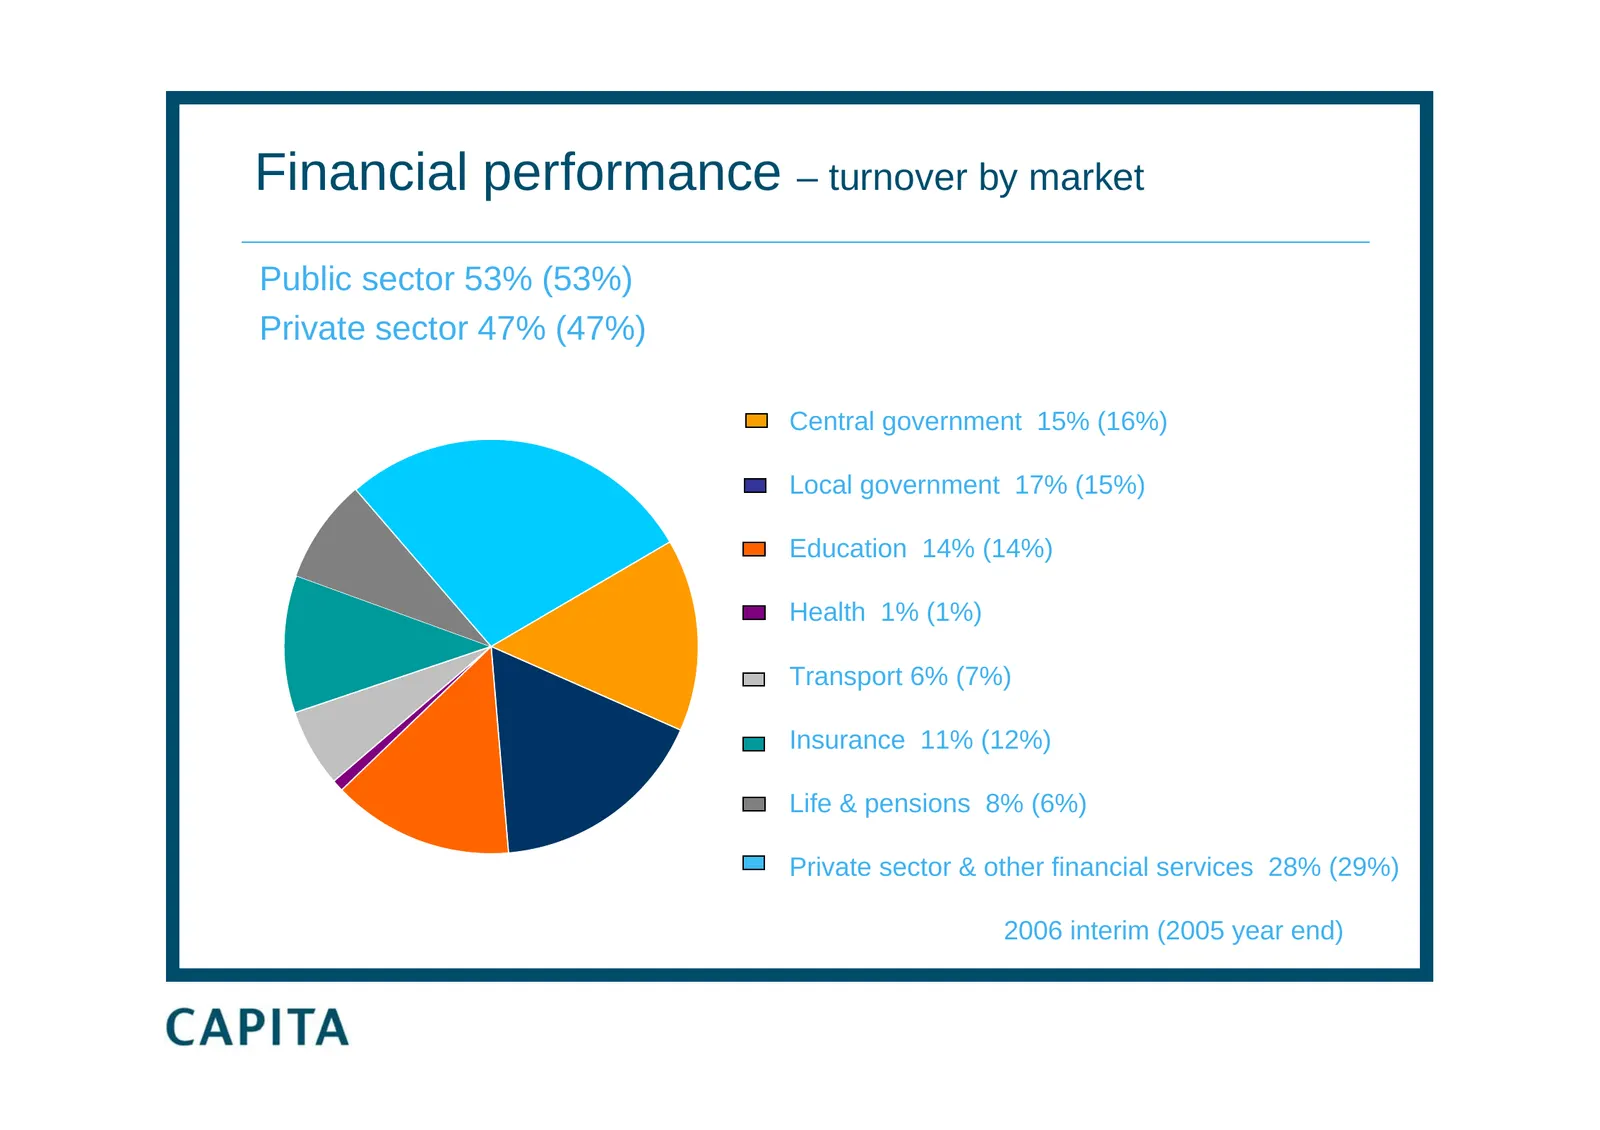
Slide 7: Financial performance – turnover by market
Financial performance – turnover by market Public sector 53% (53%) Private sector 47% (47%) Central government 15% (16%) Local government 17% (15%) Education 14% (14%) Health 1% (1%) Transport 6% (7%) Insurance 11% (12%) Life & pensions 8% (6%) Private sector & other financial services 28% (29%) 200
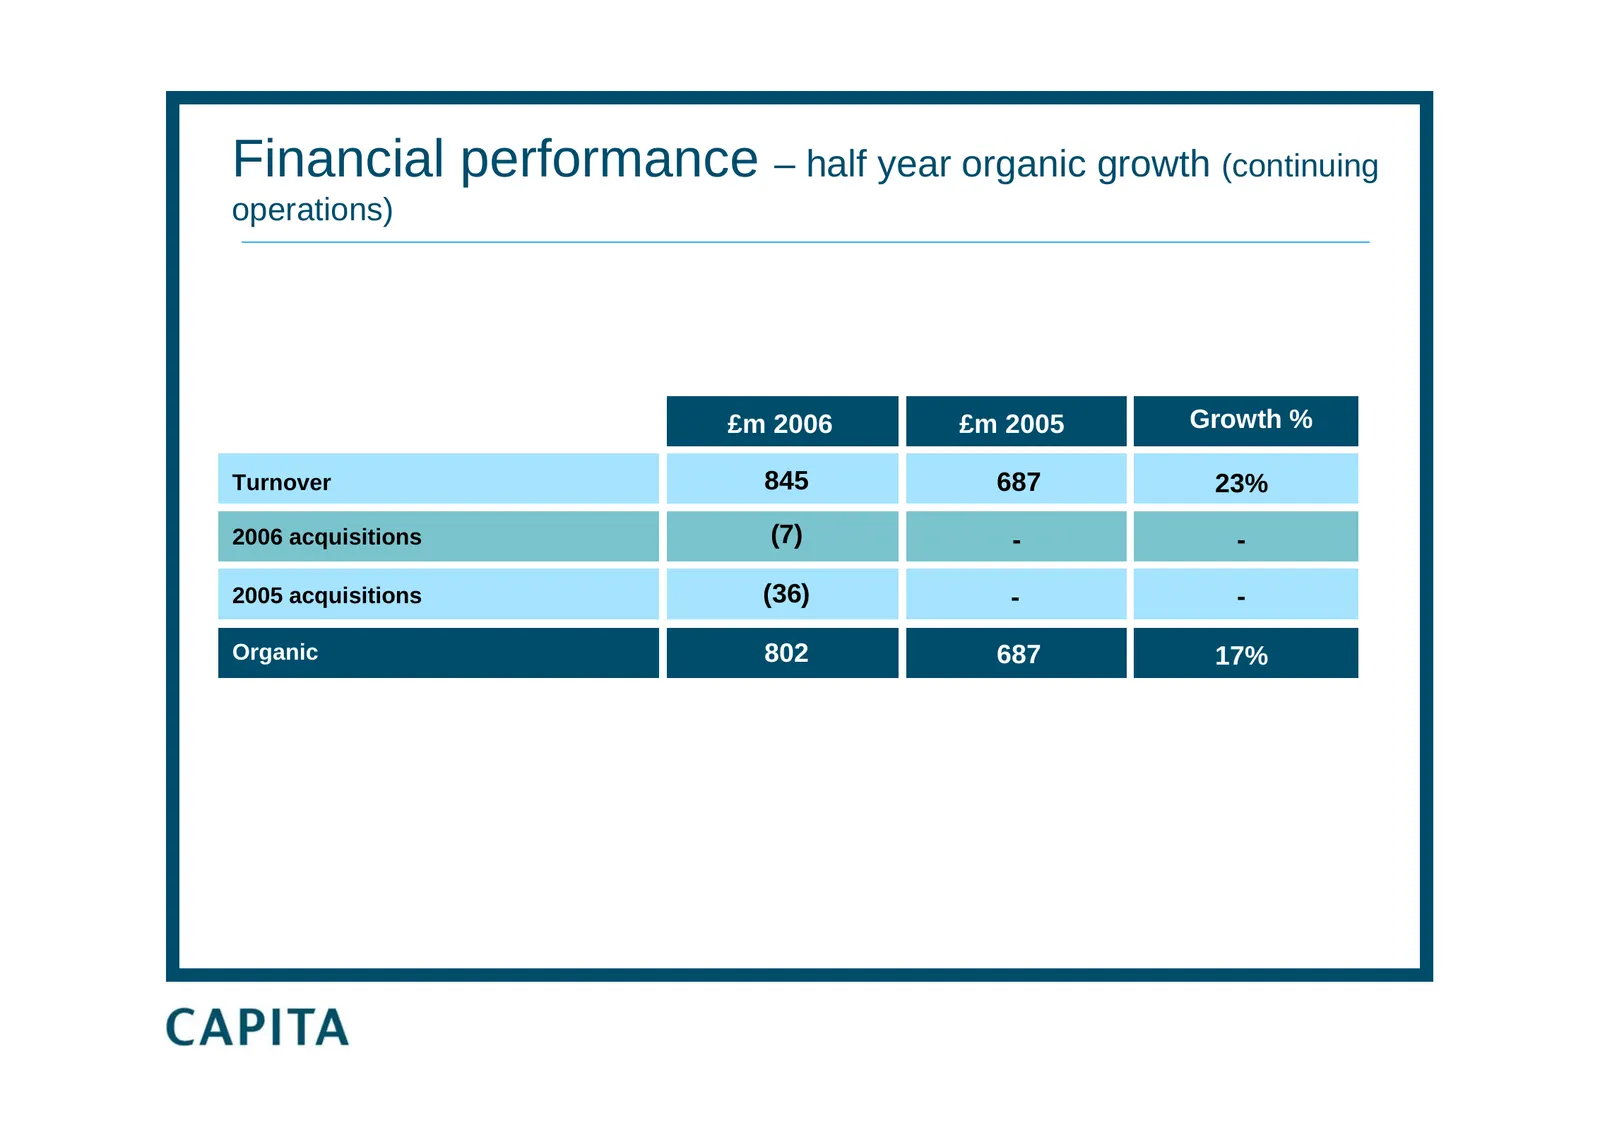
Slide 8: Financial performance – half year organic growth
Financial performance – half year organic growth (continuing operations) £m 2006 £m 2005 Growth % Turnover 845 687 23% 2006 acquisitions (7) - - 2005 acquisitions (36) 2001 (36) - 2003 2004 - Organic 802 687 17%
Slide 9: Financial performance – profit from continuing operations
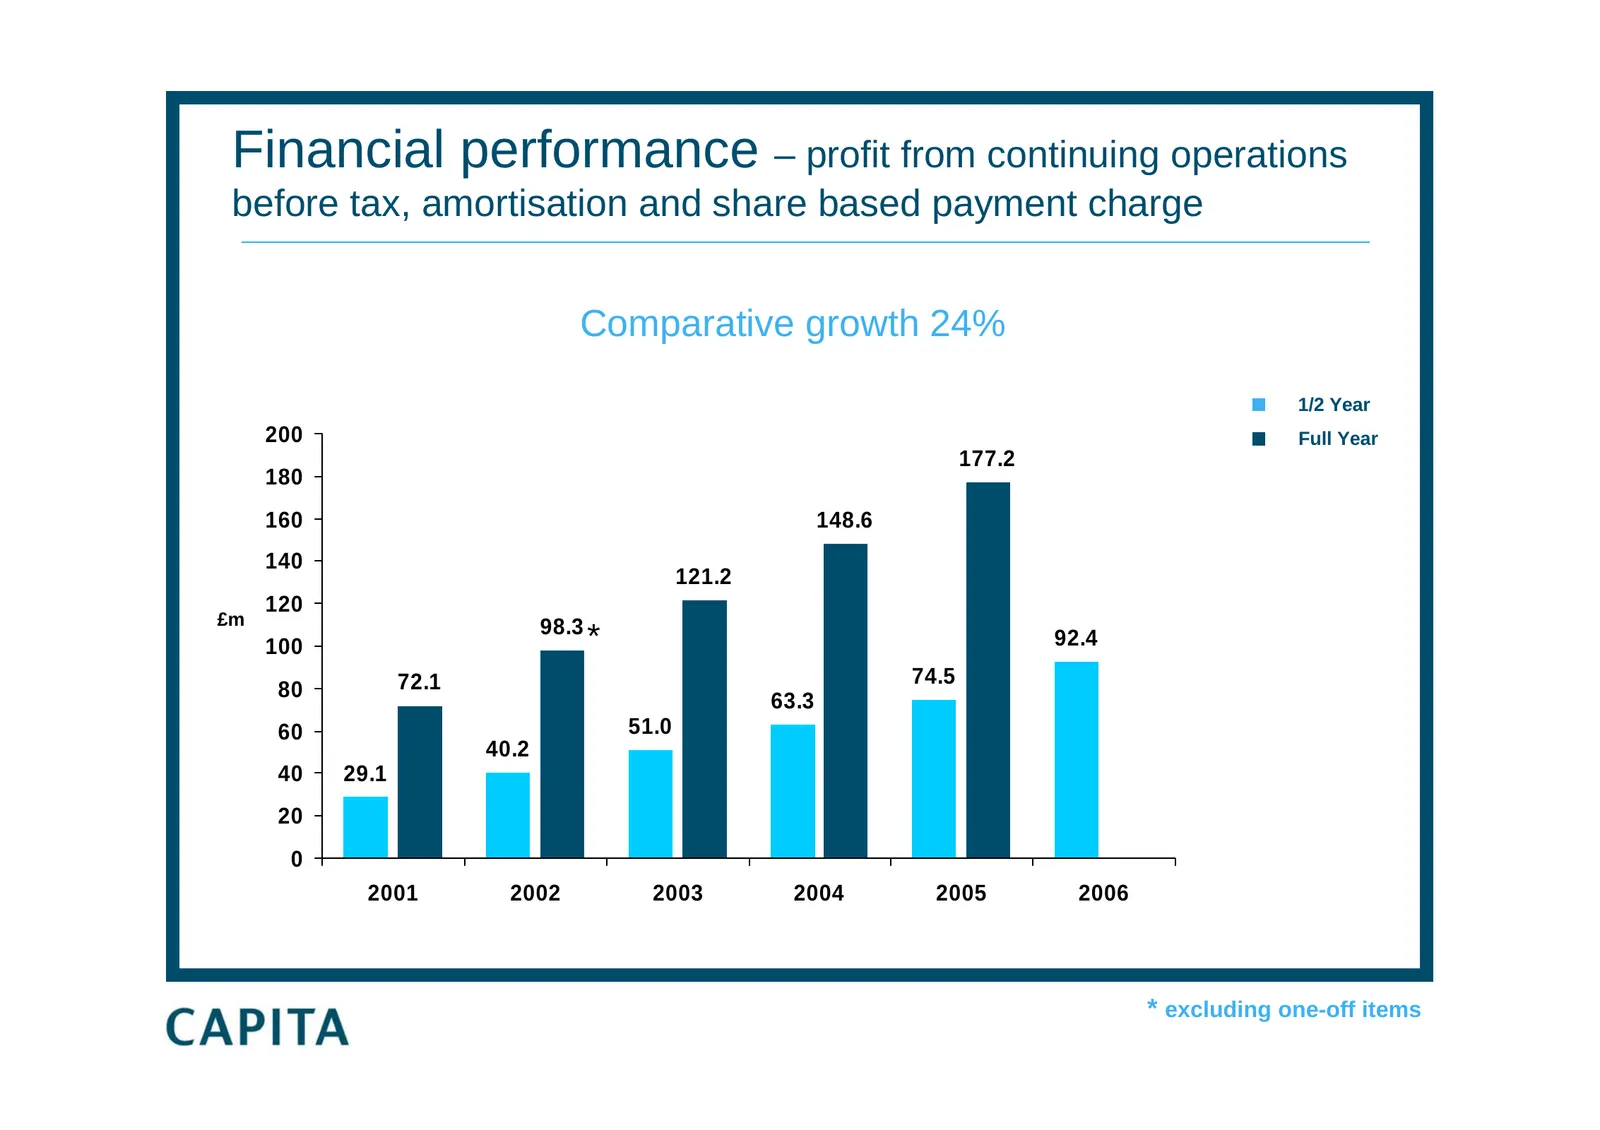
Financial performance – profit from continuing operations before tax, amortisation and share based payment charge Comparative growth 24% 1/2 Year 200 Full Year 177.2 180 160 148.6 140 121.2 120 £m 98.3 100 * 92.4 72.1 74.5 80 63.3 60 51.0 40.2 40 29.1 20 0 2001 2002 2003 2004 2005 2006 * excluding o
Slide 10: Financial performance – operating profit from continuing operations
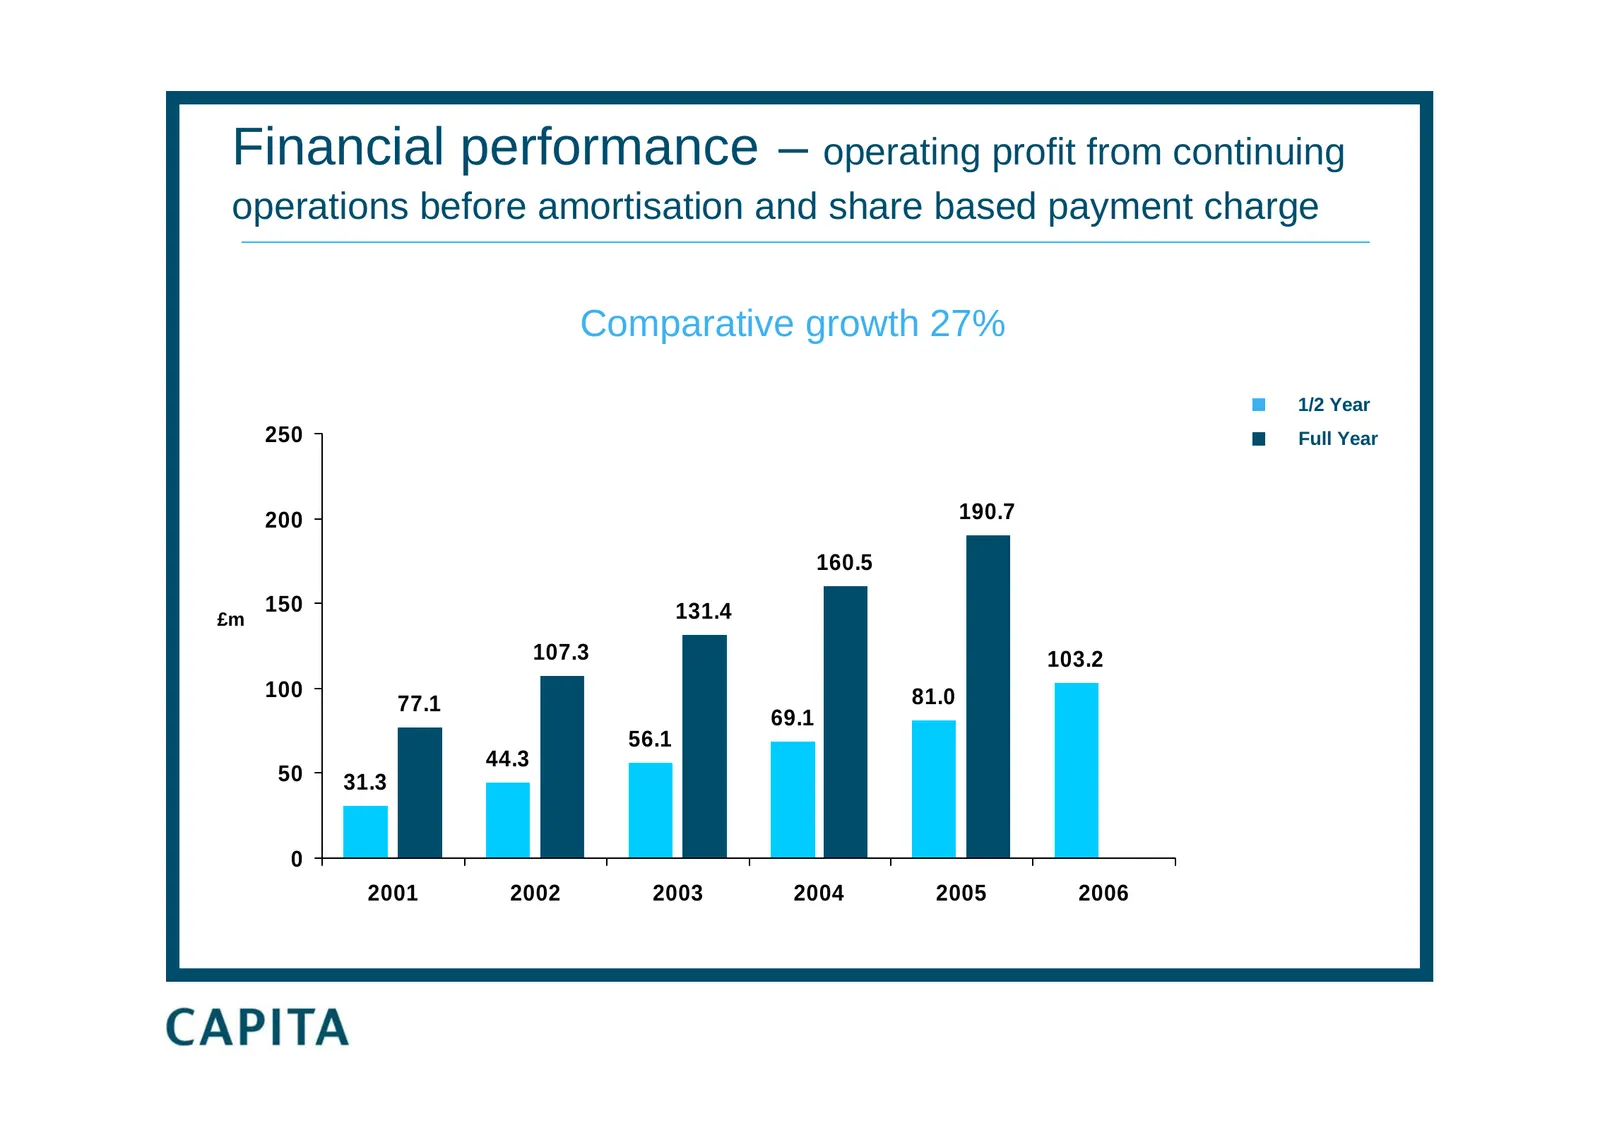
Financial performance – operating profit from continuing operations before amortisation and share based payment charge Comparative growth 27% 1/2 Year 250 Full Year 200 190.7 160.5 150 131.4 £m 107.3 103.2 100 81.0 77.1 69.1 56.1 44.3 50 31.3 0 2001 2002 2003 2004 2005 2006
Slide 11: Half year operating margin
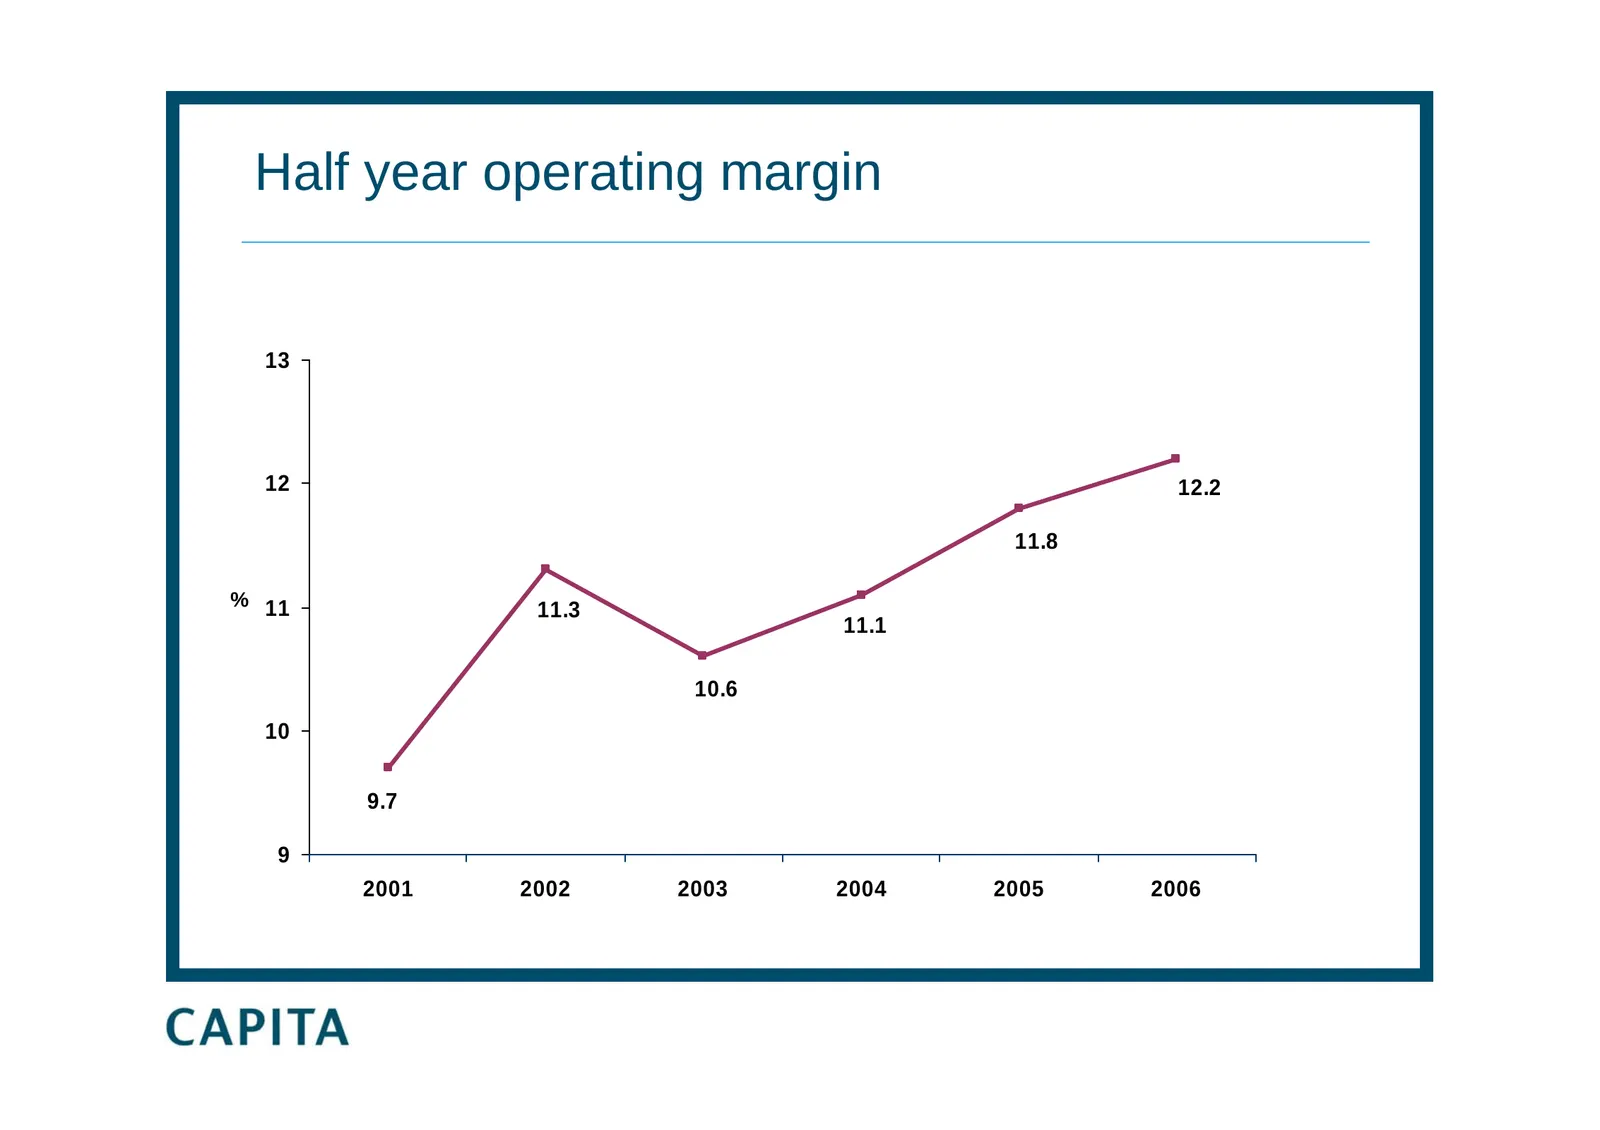
Half year operating margin 13 12 12.2 11.8 % 11 11.3 11.1 10.6 10 9.7 9 2001 2002 2003 2004 2005 2006
Slide 12: Operating margin – drivers behind widening margin
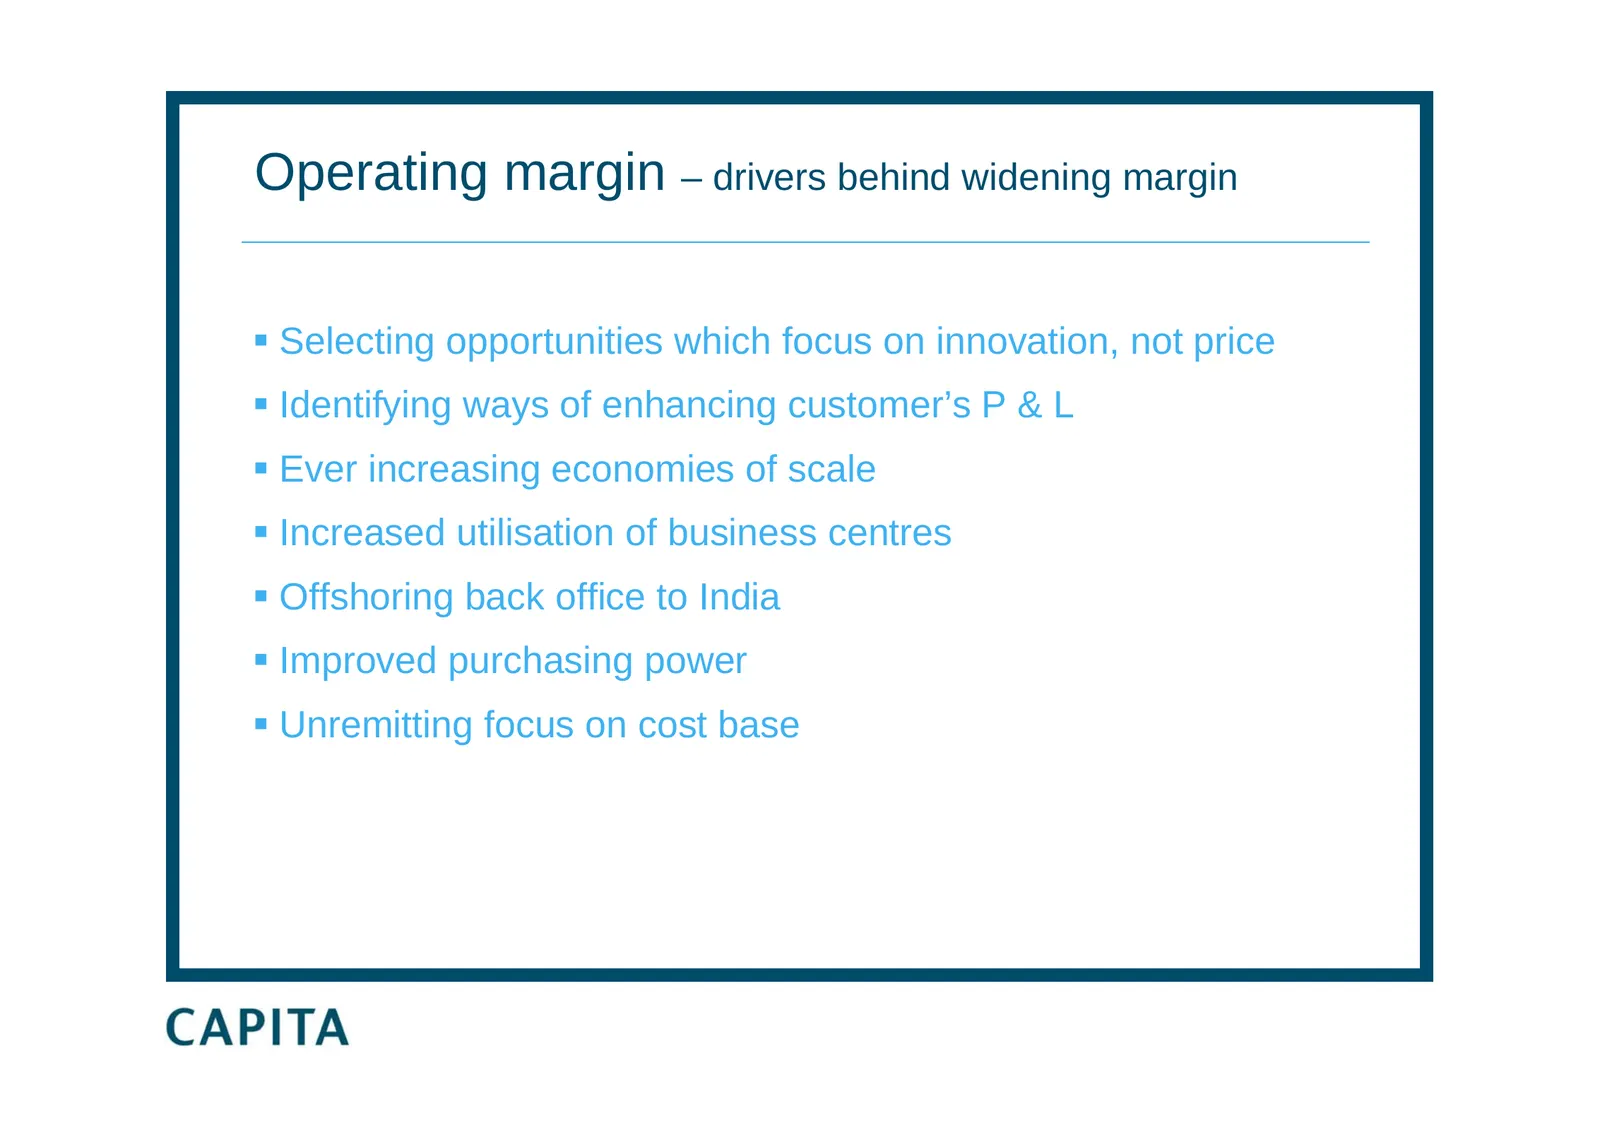
Operating margin – drivers behind widening margin Selecting opportunities which focus on innovation, not price Identifying ways of enhancing customer’s P & L Ever increasing economies of scale Increased utilisation of business centres Offshoring back office to India Improved purchasing p
Slide 13: Financial performance – earnings per share
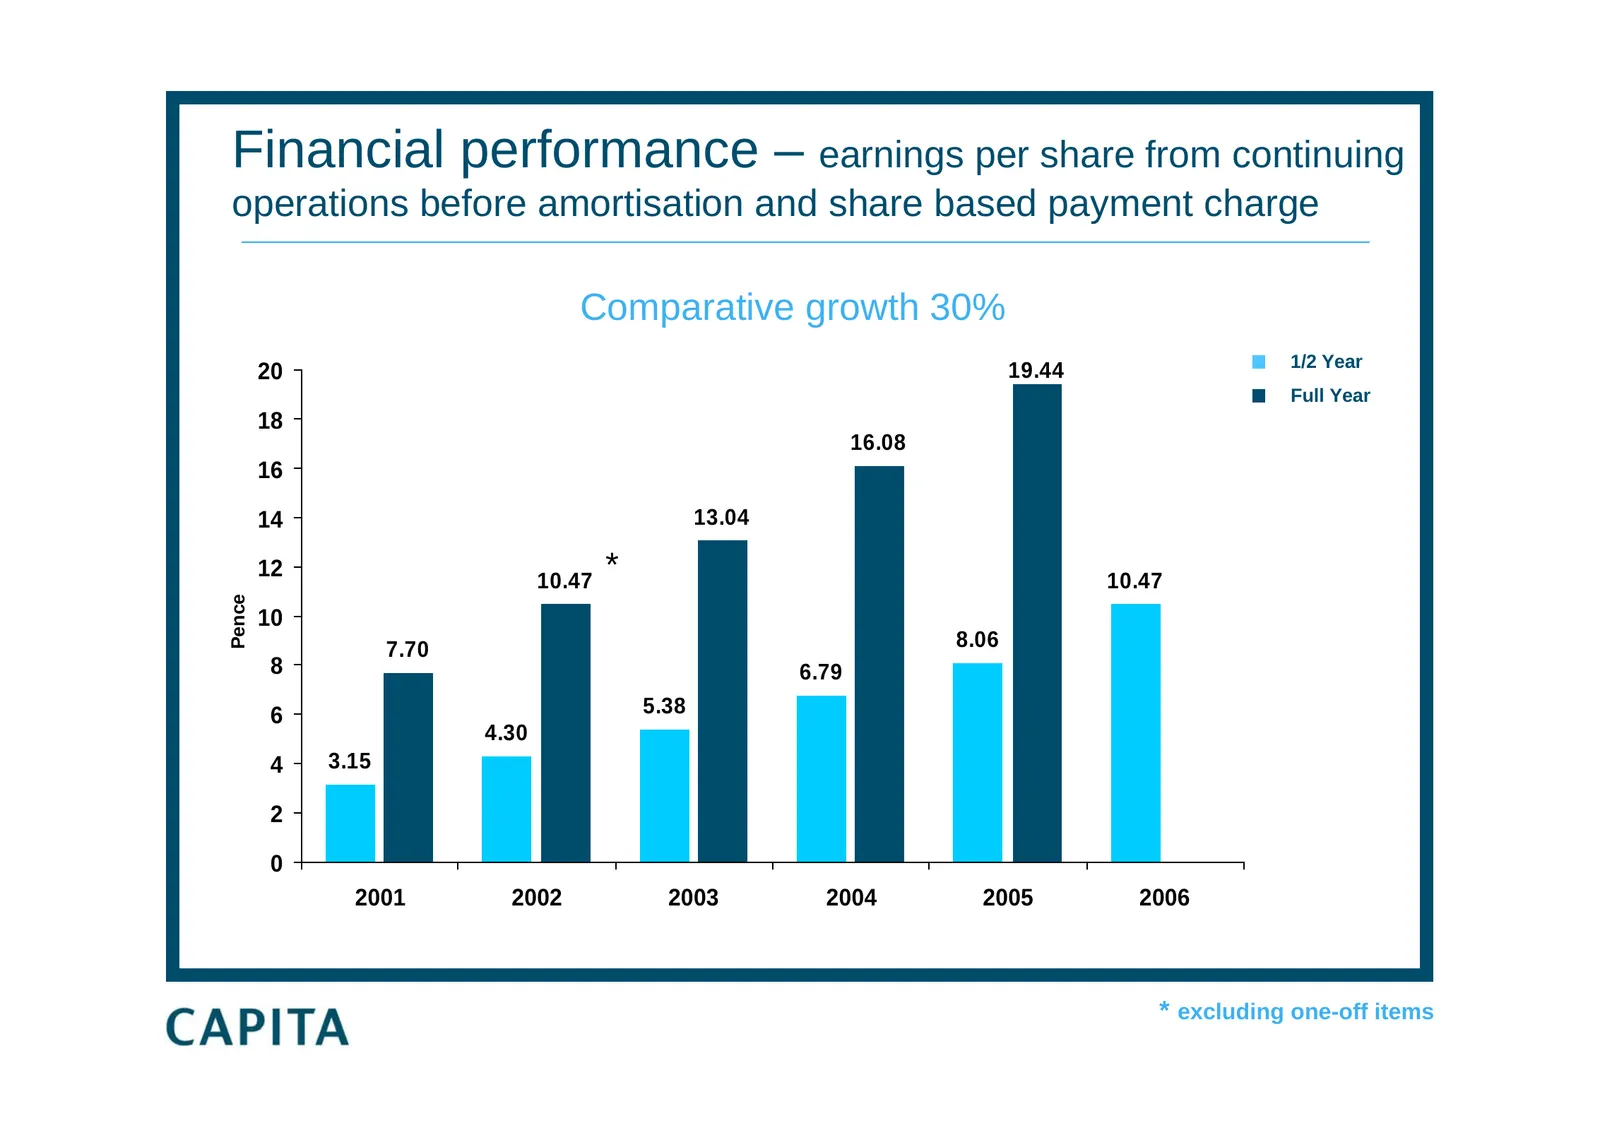
Financial performance – earnings per share from continuing operations before amortisation and share based payment charge Comparative growth 30% 1/2 Year 20 19.44 Full Year 18 16.08 16 14 13.04 12 10.47 * 10.47 Pence 10 7.70 8.06 8 6.79 6 5.38 4.30 4 3.15 2 0 2001 2002 2003 2004 2005 2006 * excluding
Slide 14: Financial performance – dividends
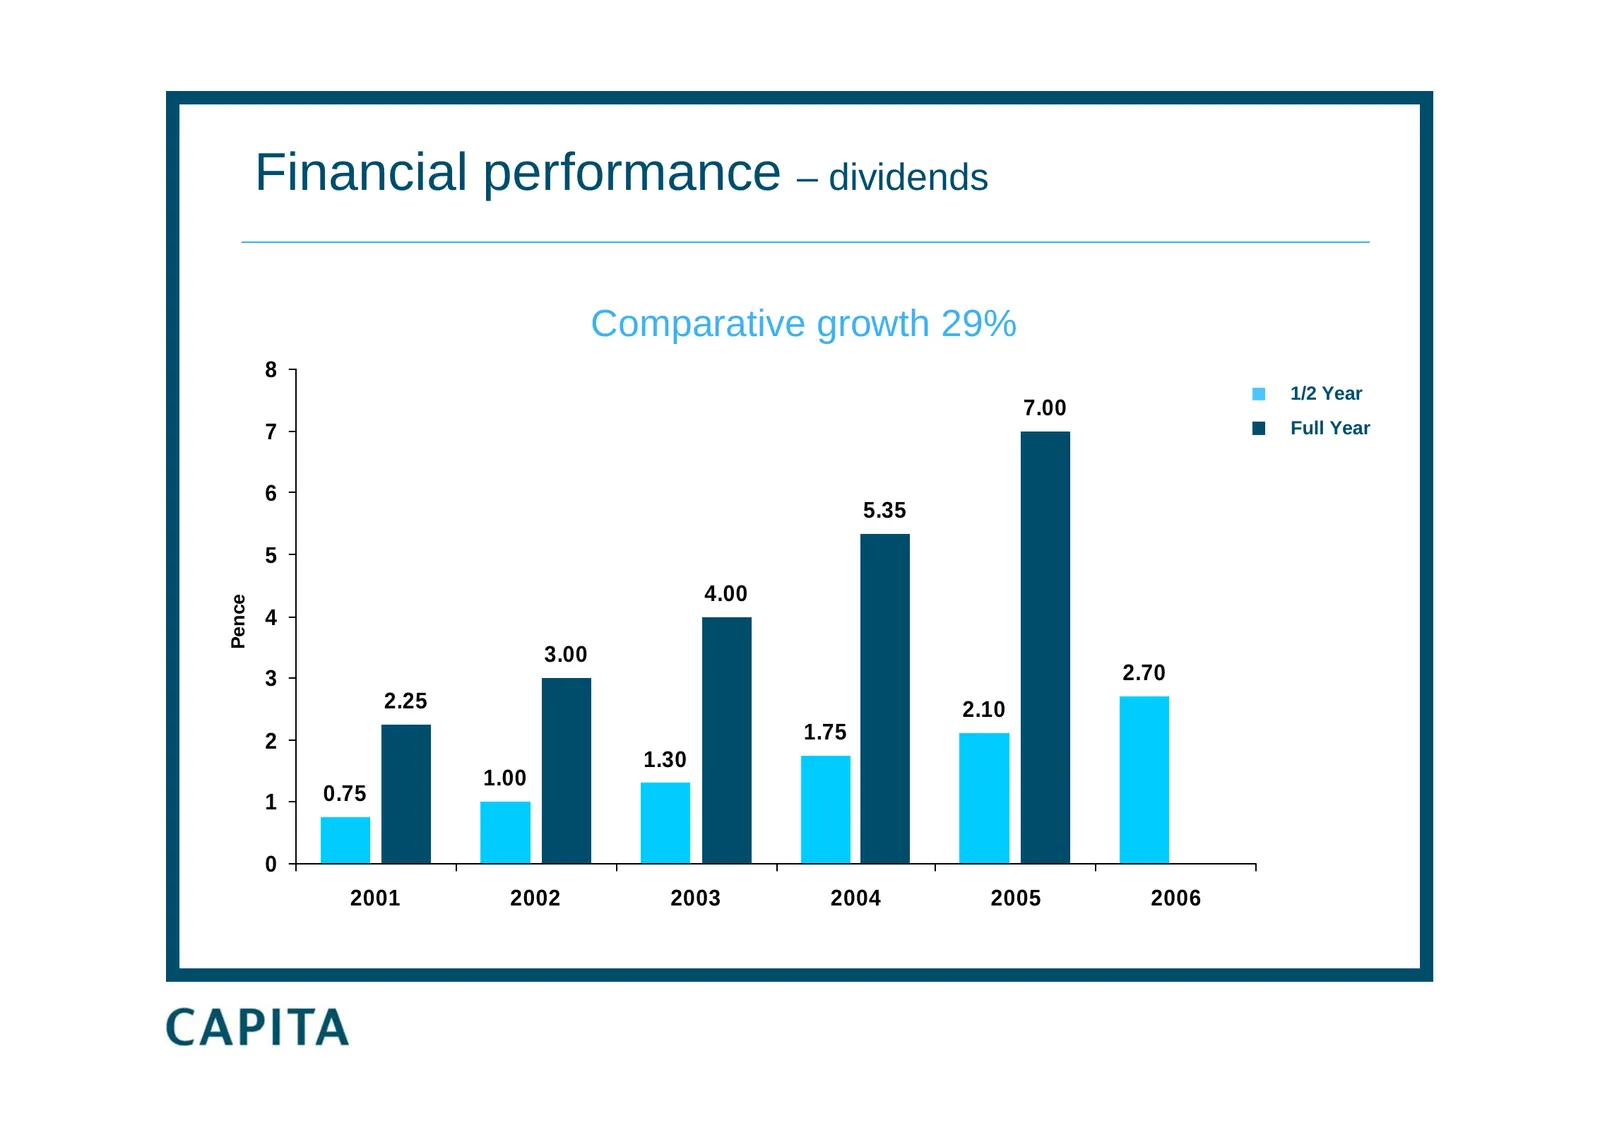
Financial performance – dividends Comparative growth 29% 8 1/2 Year 7.00 7 Full Year 6 5.35 5 4.00 Pence 4 3.00 3 2.70 2.25 2.10 2 1.75 1.30 1.00 1 0.75 0 2001 2002 2003 2004 2005 2006
Slide 15: Financial performance – cash flow statement
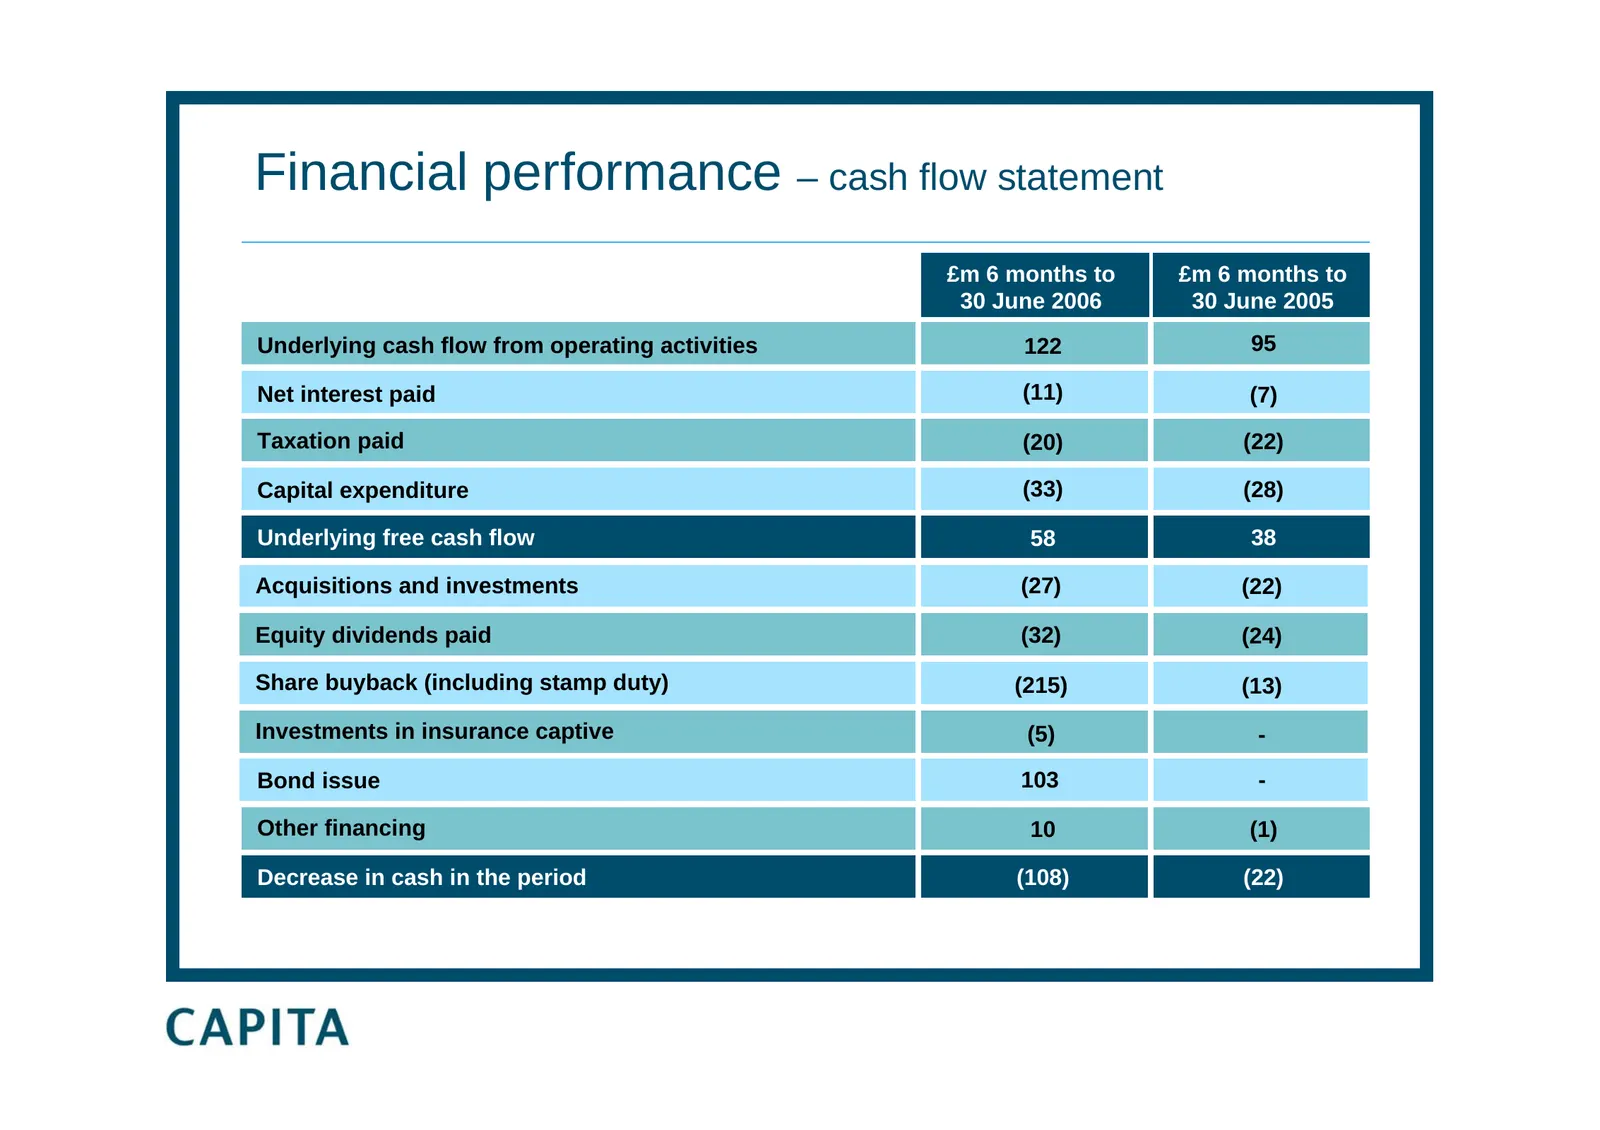
Financial performance – cash flow statement £m 6 months to £m 6 months to 30 June 2006 30 June 2005 Underlying cash flow from operating activities 122 95 Net interest paid (11) (7) Taxation paid (20) (22) Capital expenditure (33) (28) Underlying free cash flow 58 38 Acquisitions and investments (27)
Slide 16: Financial performance – cash flow from operating activities
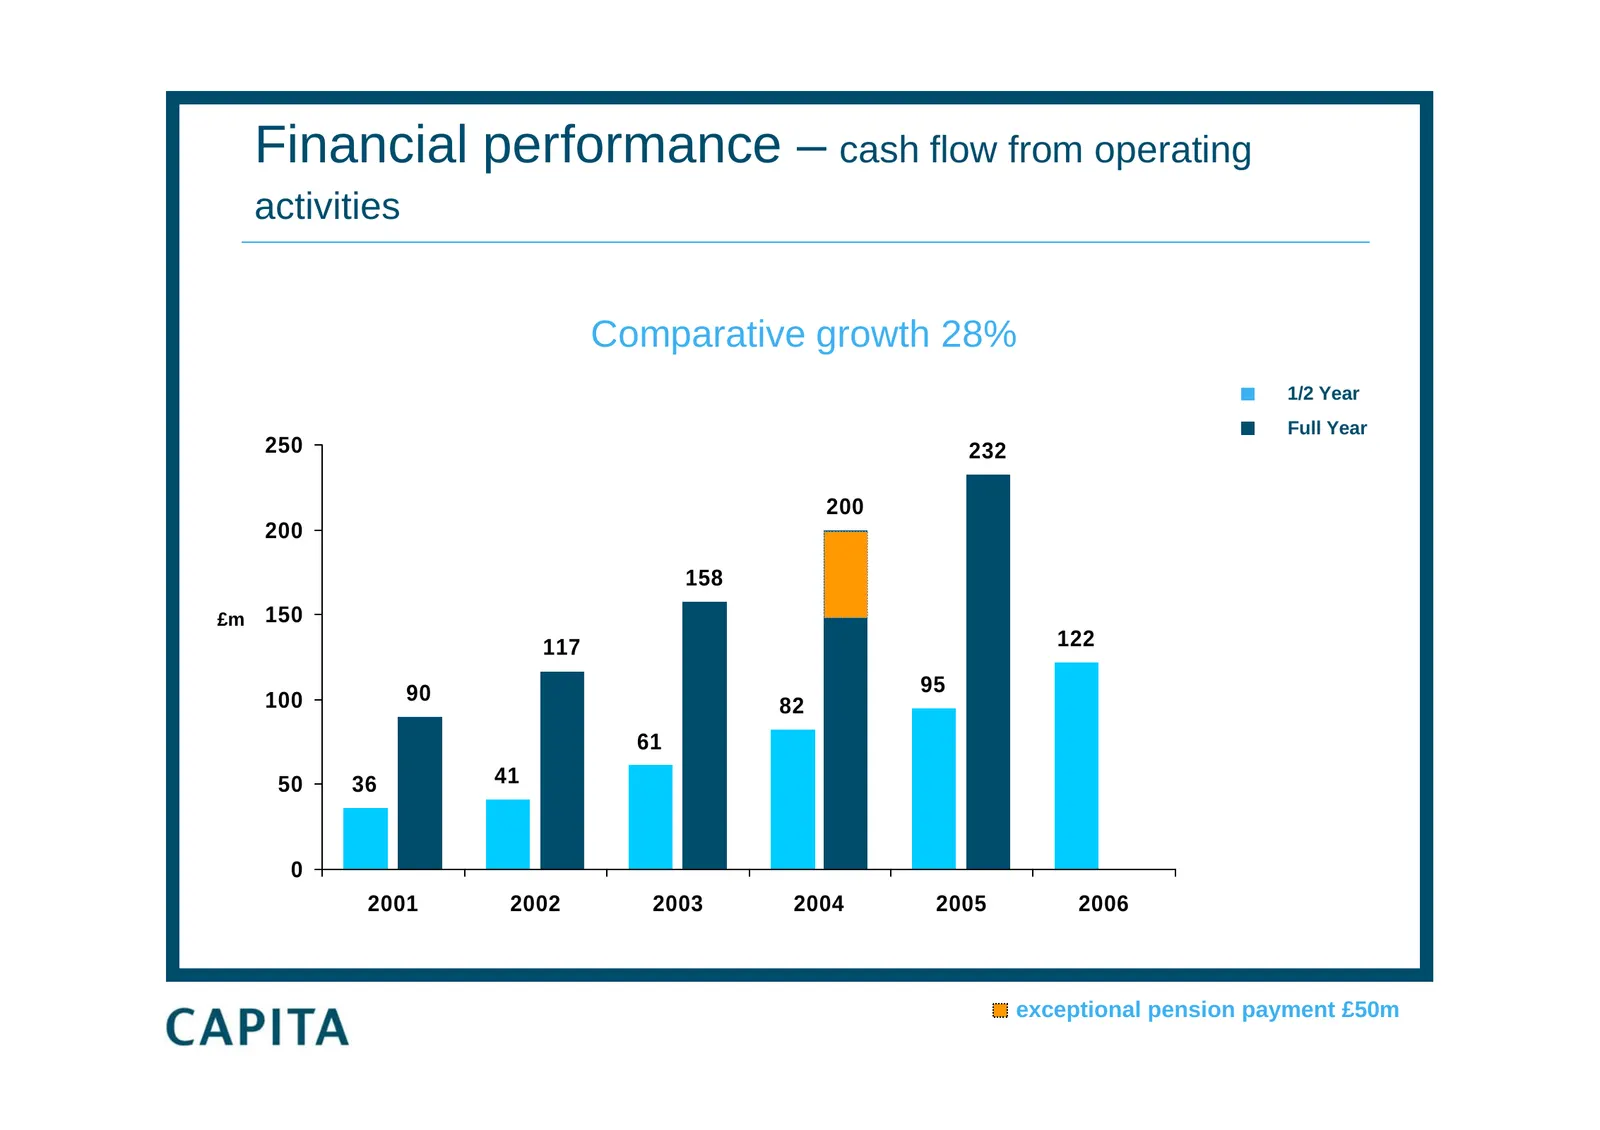
Financial performance – cash flow from operating activities Comparative growth 28% 1/2 Year Full Year 250 232 200 200 158 £m 150 117 122 90 95 100 82 61 50 36 41 0 2001 2002 2003 2004 2005 2006 exceptional pension payment £50m
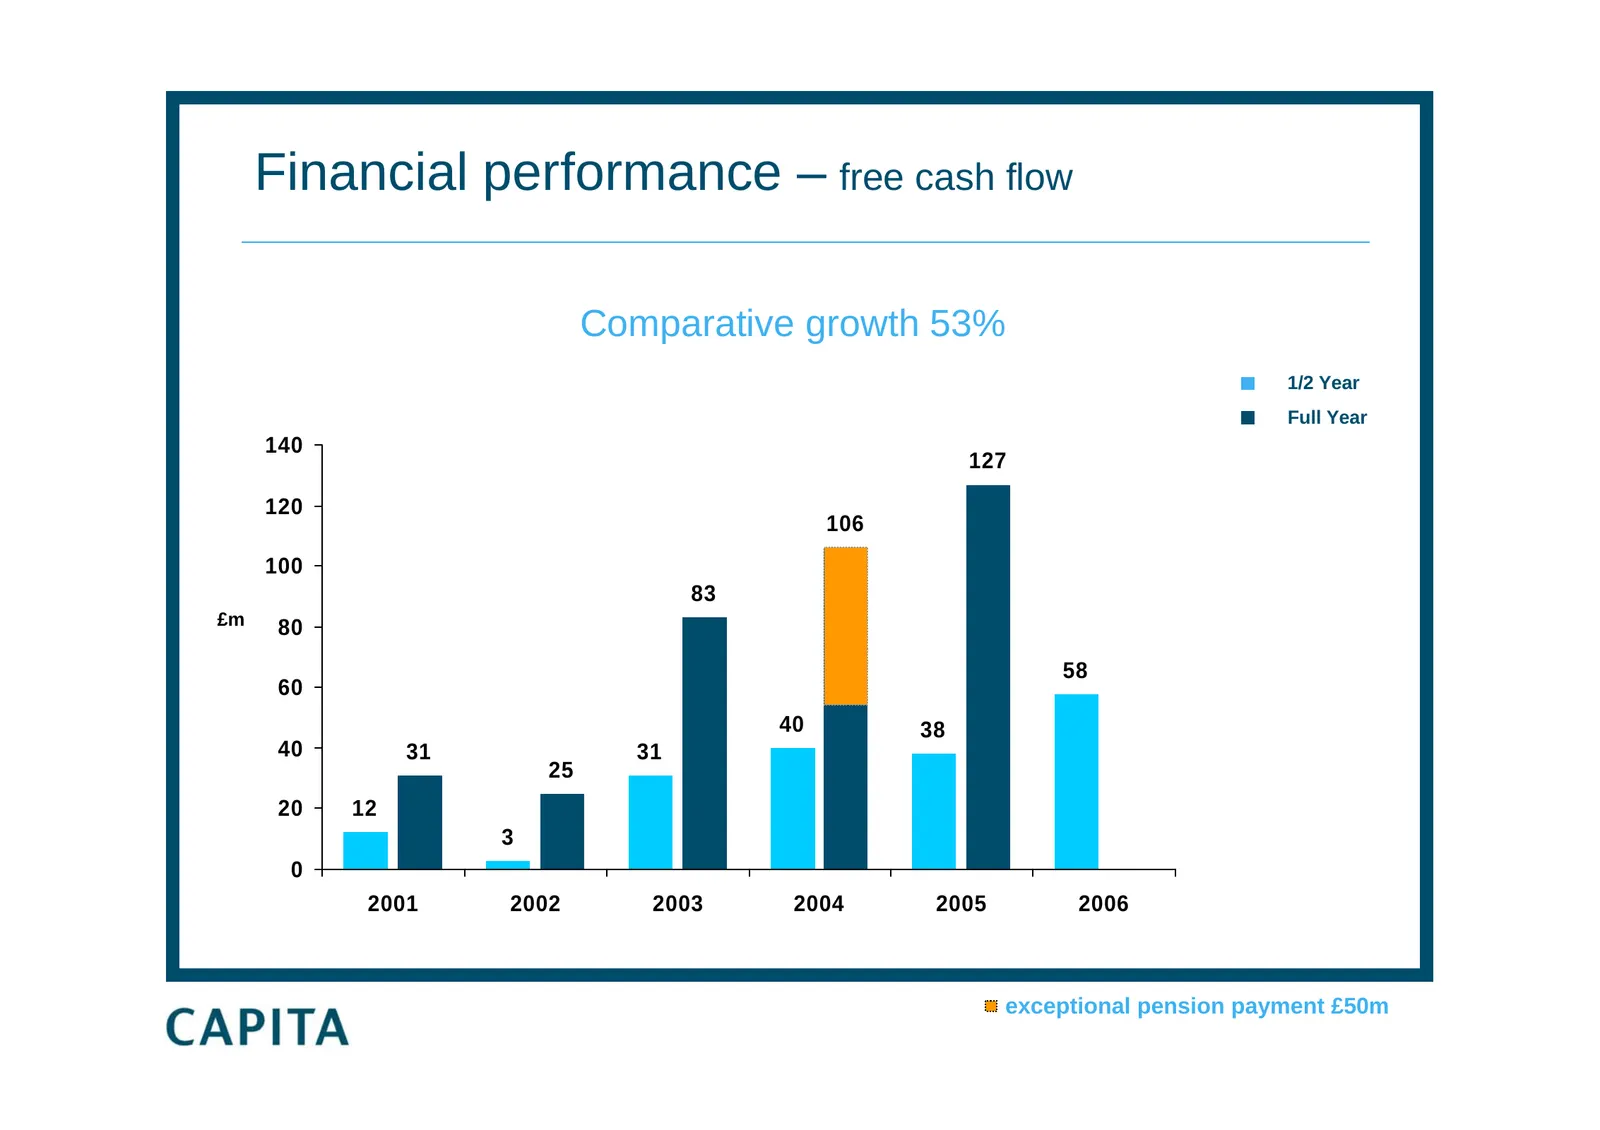
Slide 17: Financial performance – free cash flow
Financial performance – free cash flow Comparative growth 53% 1/2 Year Full Year 140 127 120 106 100 83 £m 80 58 60 40 38 40 31 31 25 20 12 3 0 2001 2002 2003 2004 2005 2006 exceptional pension payment £50m
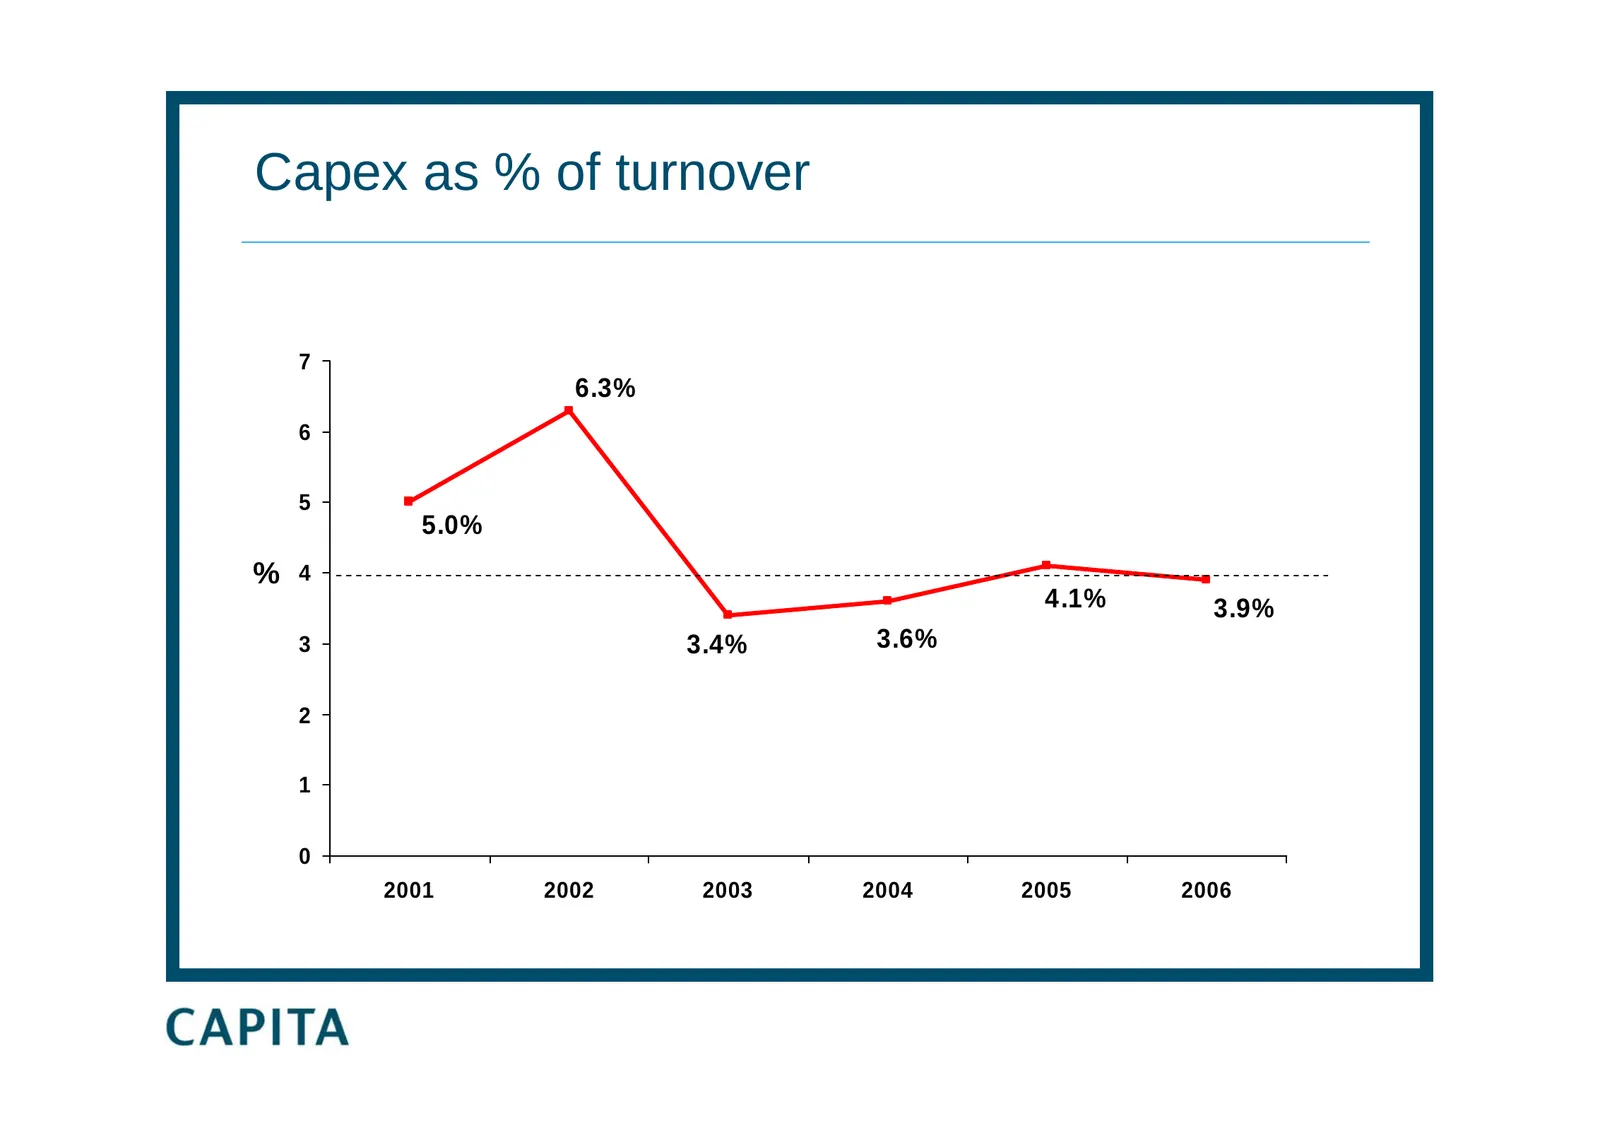
Slide 18: Capex as % of turnover
Capex as % of turnover 7 6.3% 6 5 5.0% % 4 4.1% 3.9% 3 3.4% 3.6% 2 1 0 2001 2002 2003 2004 2005 2006
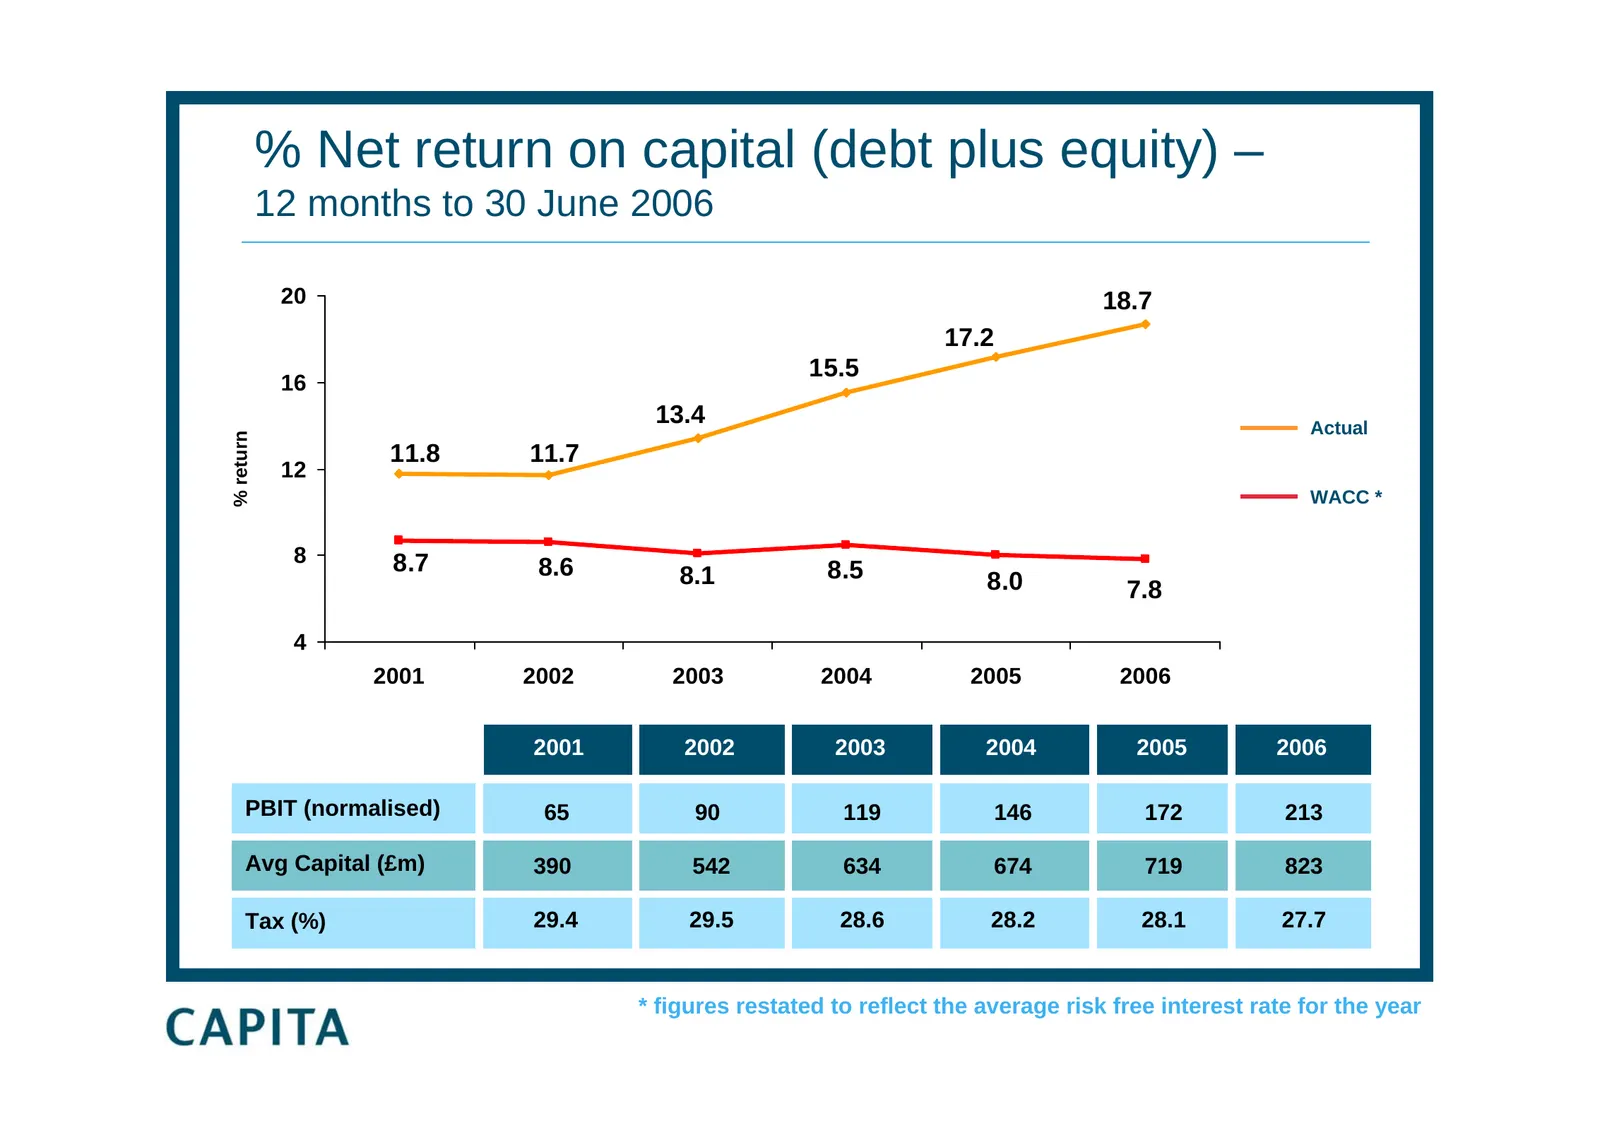
Slide 19: Net return on capital (debt plus equity)
% Net return on capital (debt plus equity) – 12 months to 30 June 2006 20 18.7 17.2 15.5 16 13.4 Actual % return 11.8 11.7 12 WACC * 8 8.7 8.6 8.1 8.5 8.0 7.8 4 2001 2002 2003 2004 2005 2006 2001 2002 2003 2004 2005 2006 PBIT (normalised) 65 90 119 146 172 213 Avg Capital (£m) 390 542 634 674 719 82
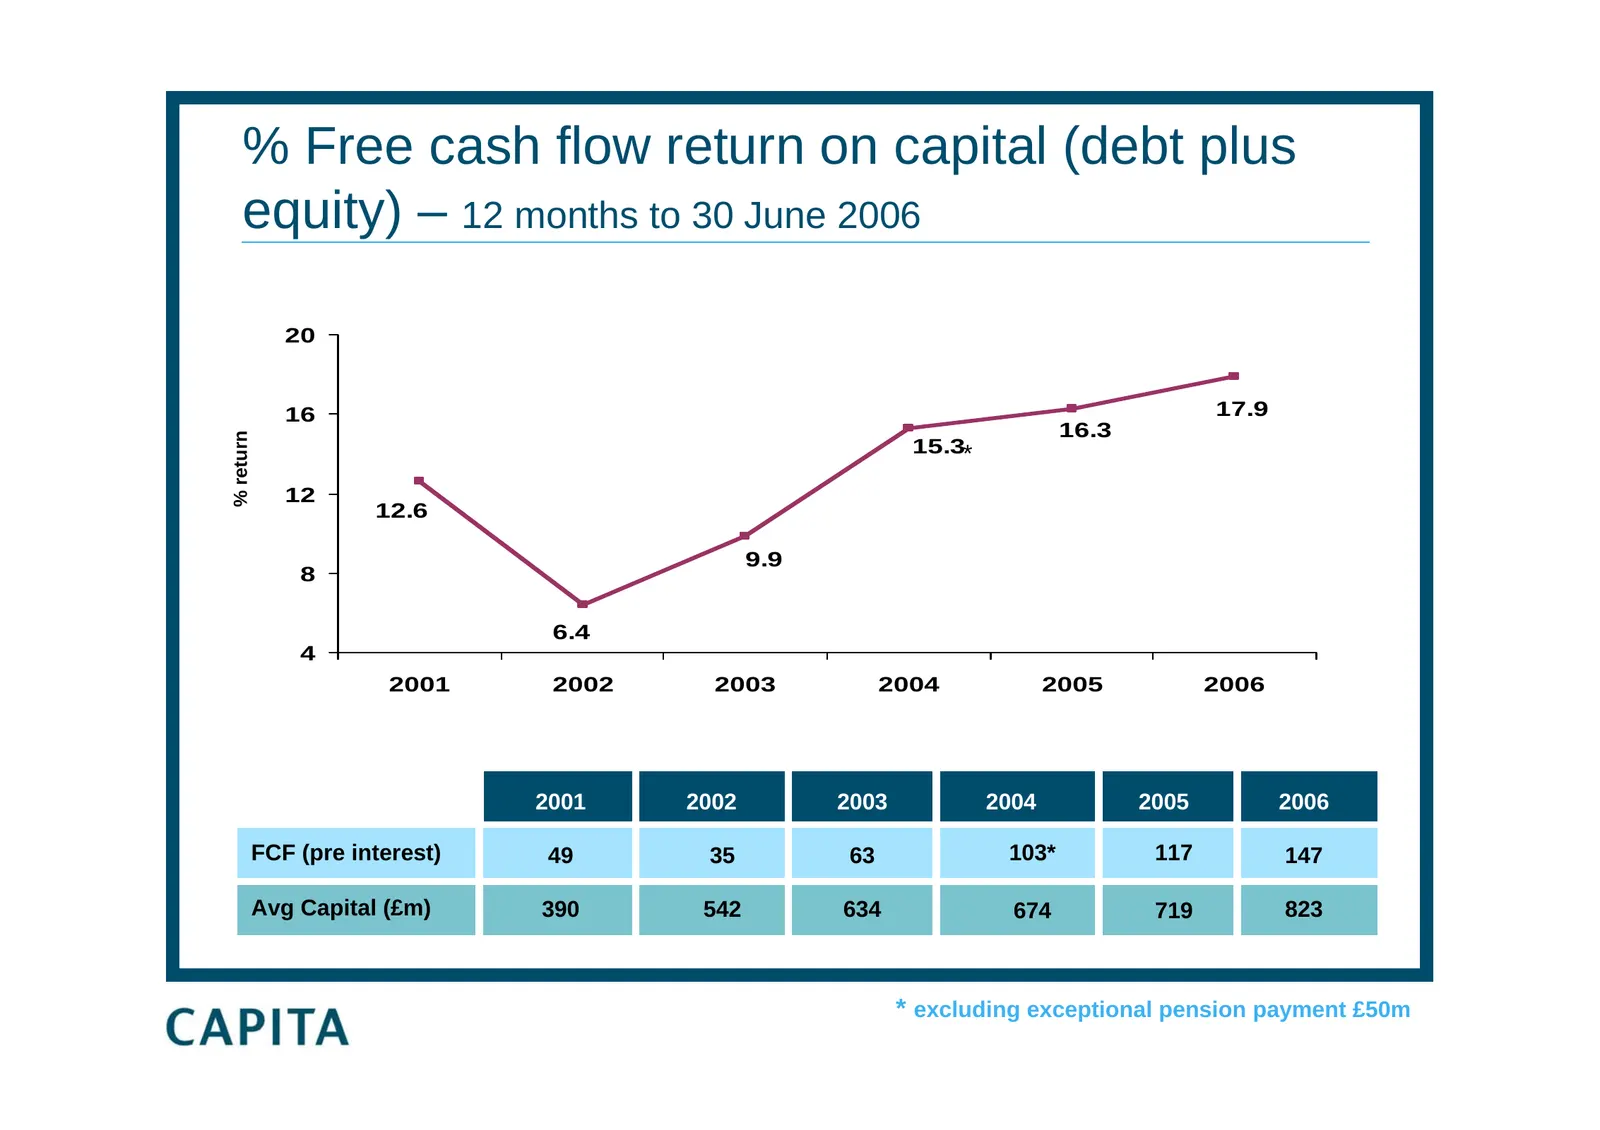
Slide 20: Free cash flow return on capital
% Free cash flow return on capital (debt plus equity) – 12 months to 30 June 2006 20 16 17.9 16.3 % return 15.3* 12 12.6 9.9 8 6.4 4 2001 2002 2003 2004 2005 2006 2001 2002 2003 2004 2005 2006 FCF (pre interest) 49 35 63 103* 117 147 Avg Capital (£m) 390 542 634 674 719 823 * excluding exceptional p
Slide 21: Share buybacks
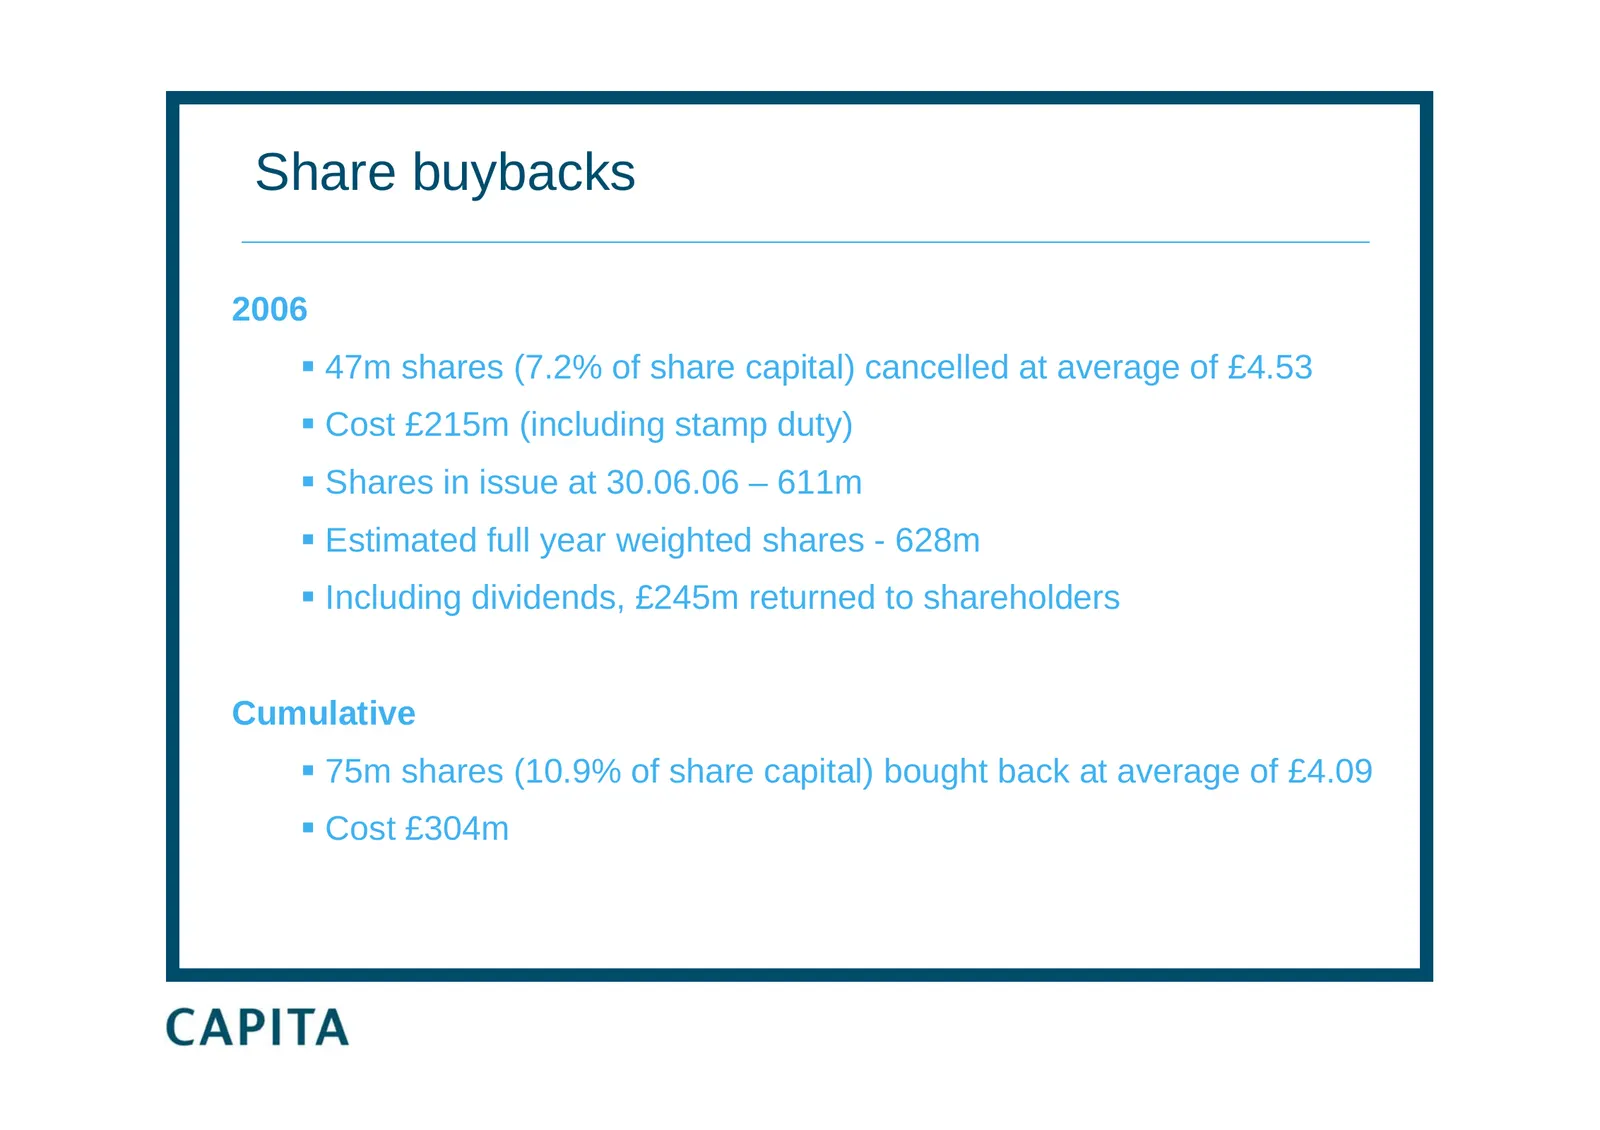
Share buybacks 2006 47m shares (7.2% of share capital) cancelled at average of £4.53 Cost £215m (including stamp duty) Shares in issue at 30.06.06 – 611m Estimated full year weighted shares - 628m Including dividends, £245m returned to shareholders Cumulative 75m shares (10.9% of share c
Slide 22: Balance sheet gearing
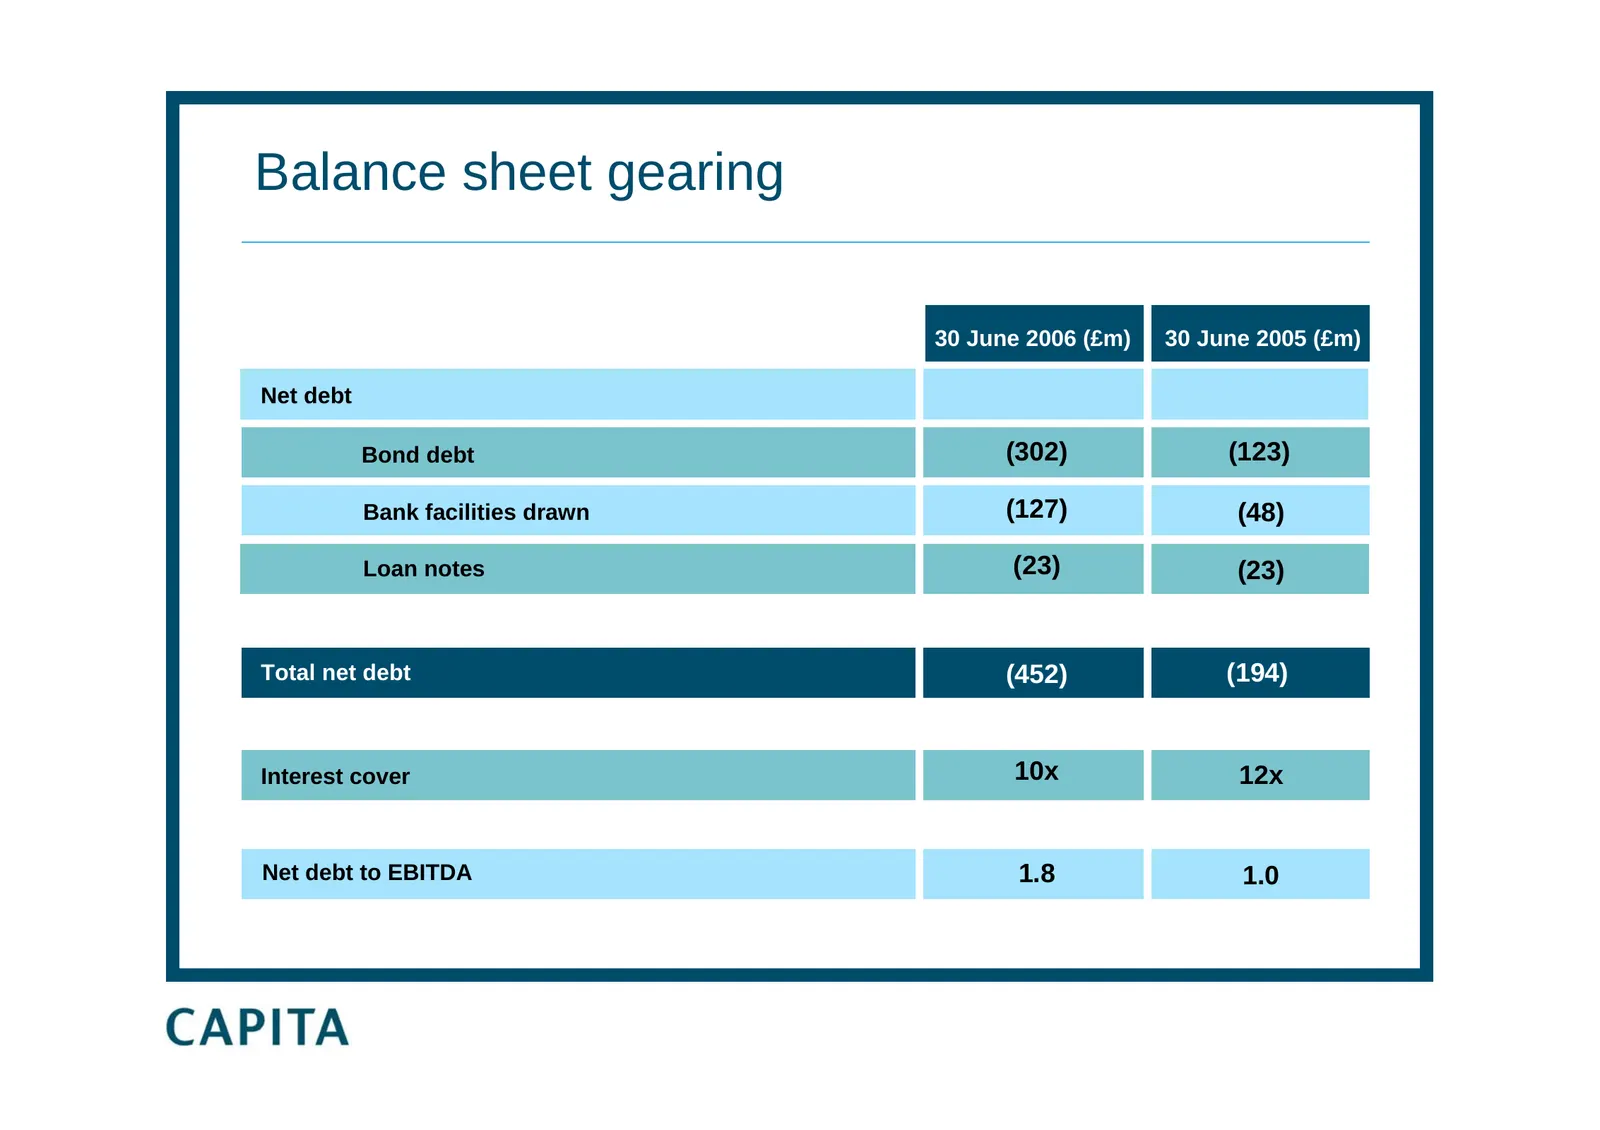
Balance sheet gearing 30 June 2006 (£m) 30 June 2005 (£m) Net debt Bond debt (302) (123) Bank facilities drawn (127) (48) Loan notes (23) (23) Total net debt (452) (194) Interest cover 10x 12x Net debt to EBITDA 1.8 1.0
Slide 23: Business performance
Business performance Paul Pindar Chief Executive
Slide 24: Business performance
Business performance Business developments Operational update
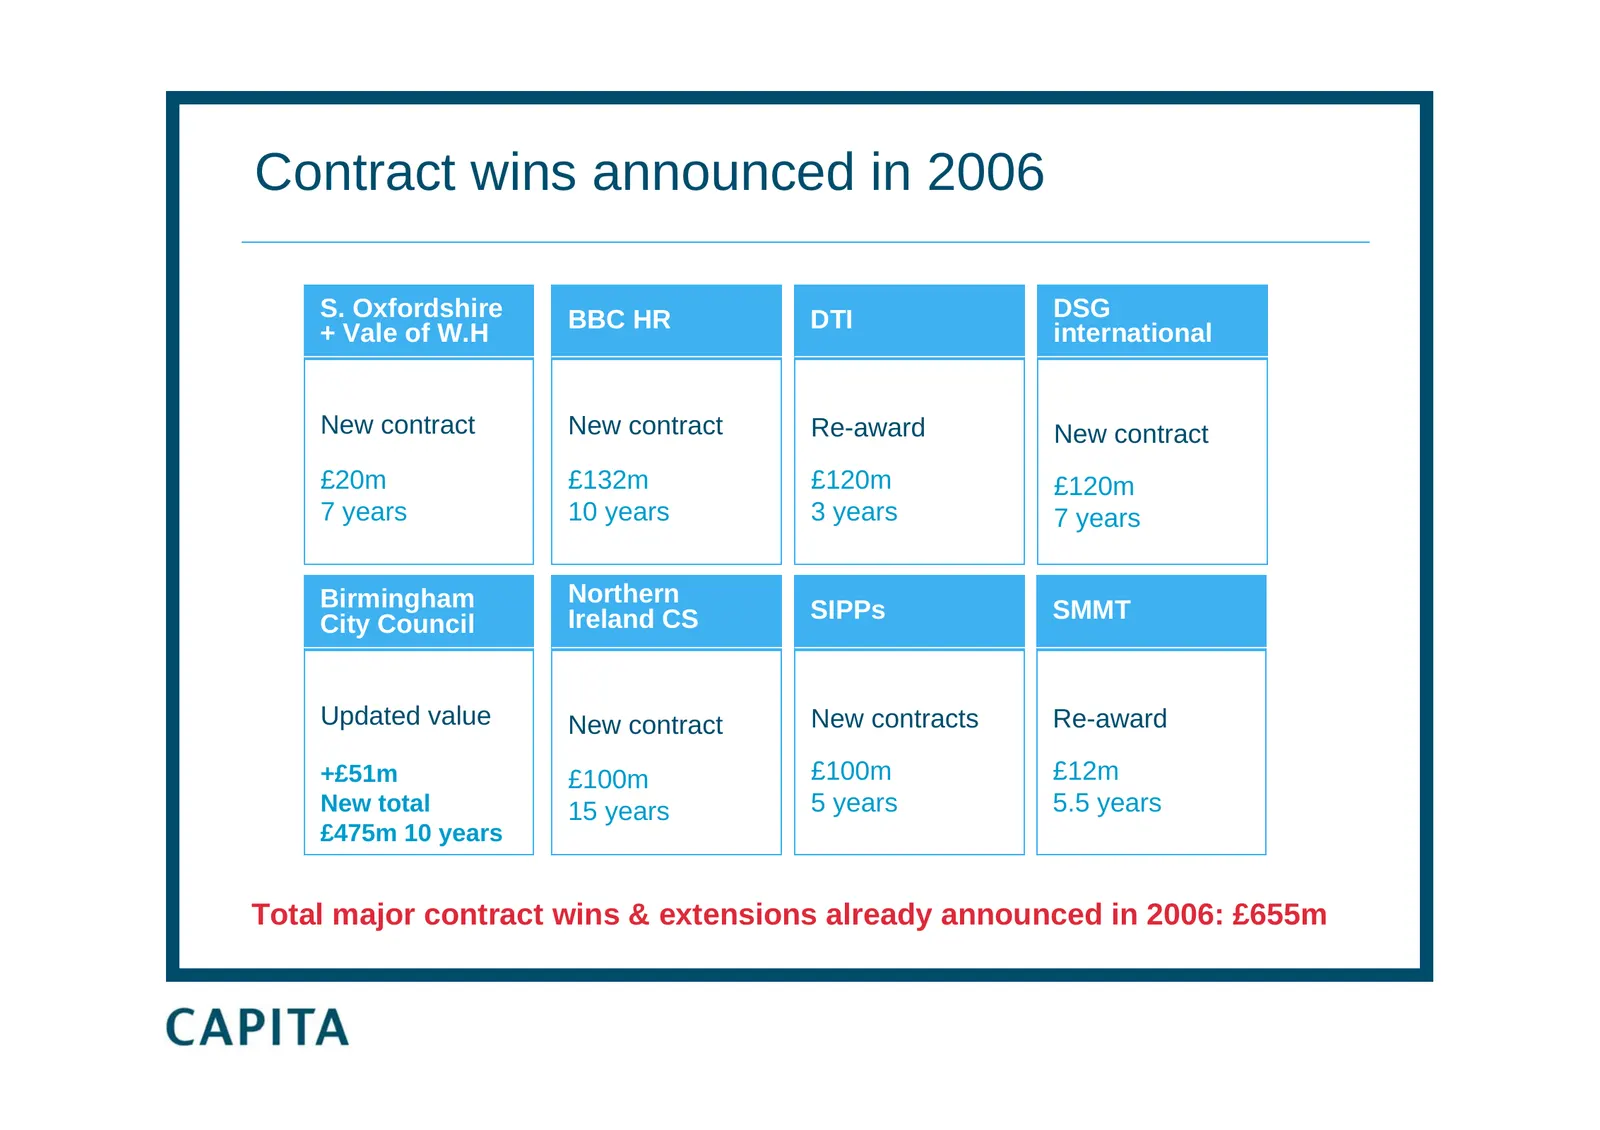
Slide 25: Contract wins announced in 2006
Contract wins announced in 2006 S. Oxfordshire BBC HR DTI DSG + Vale of W.H international New contract New contract Re-award New contract £20m £132m £120m £120m 7 years 10 years 3 years 7 years Birmingham Northern Ireland CS SIPPs SMMT City Council Updated value New contract New contracts Re-award +
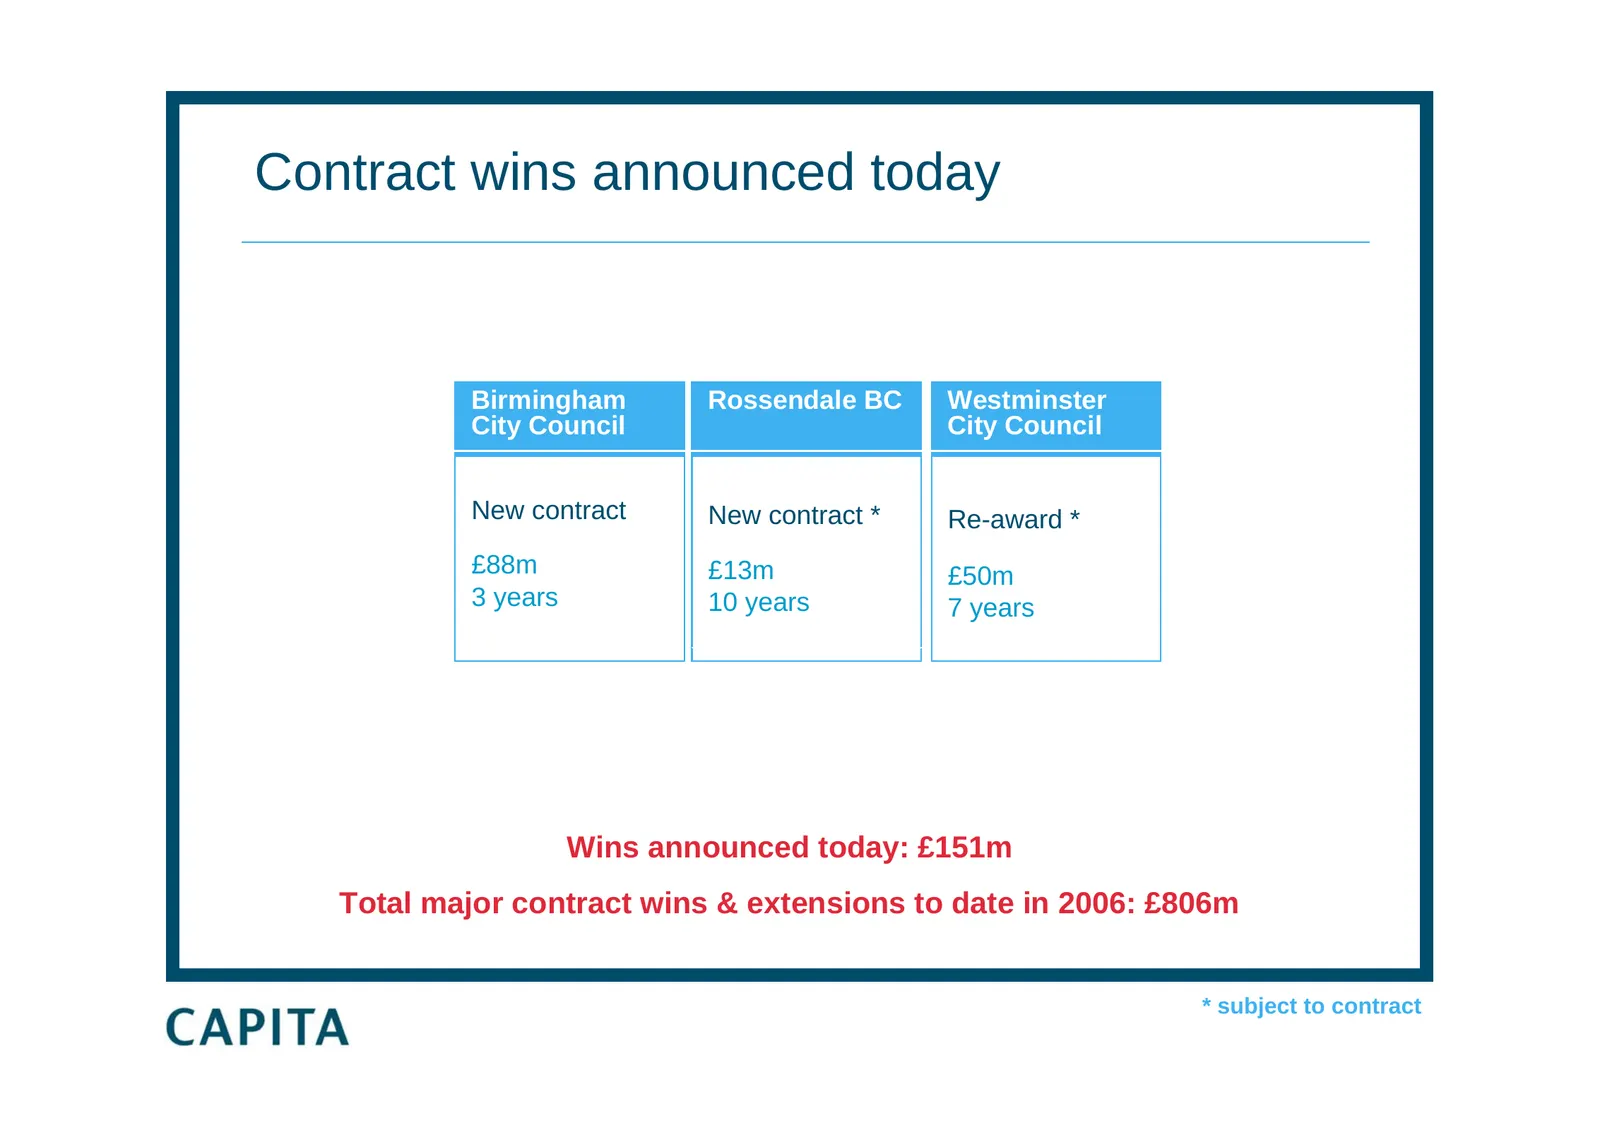
Slide 26: Contract wins announced today
Contract wins announced today Birmingham Rossendale BC Westminster City Council City Council New contract New contract * Re-award * £88m £13m £50m 3 years 10 years 7 years Wins announced today: £151m Total major contract wins & extensions to date in 2006: £806m * subject to contract
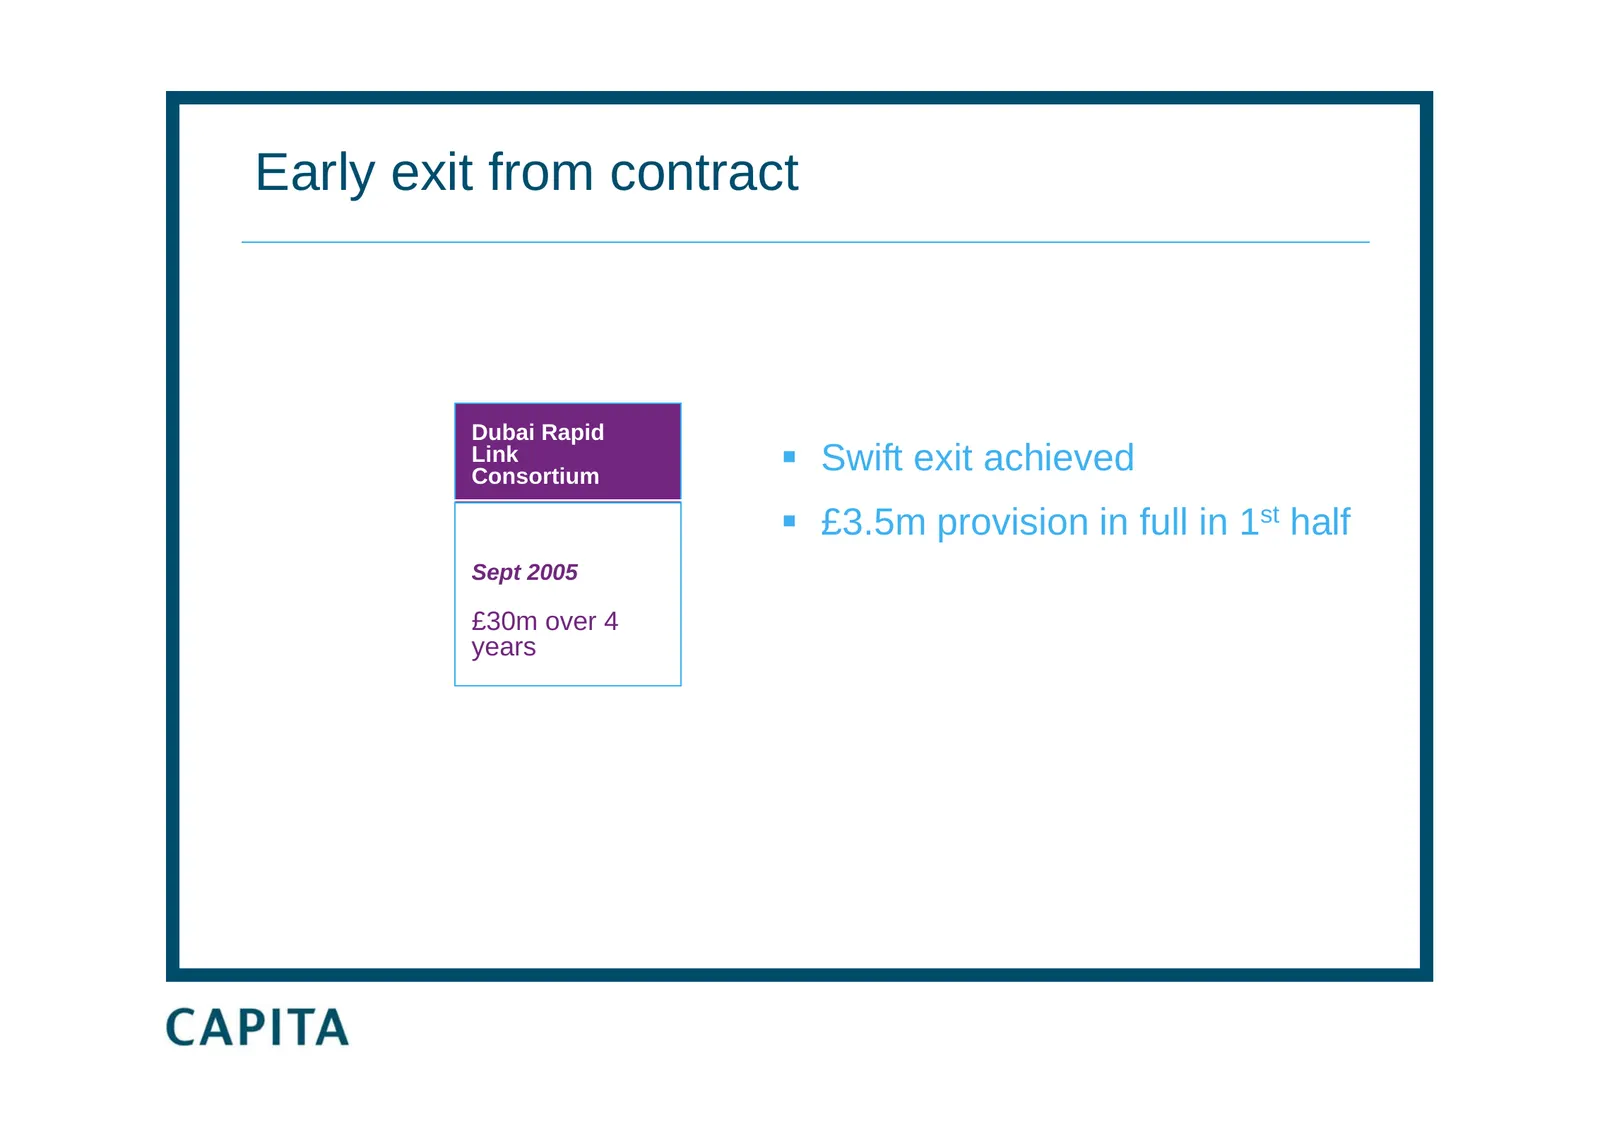
Slide 27: Early exit from contract
Early exit from contract Dubai Rapid Link Consortium Swift exit achieved £3.5m provision in full in 1st half Sept 2005 £30m over 4 years
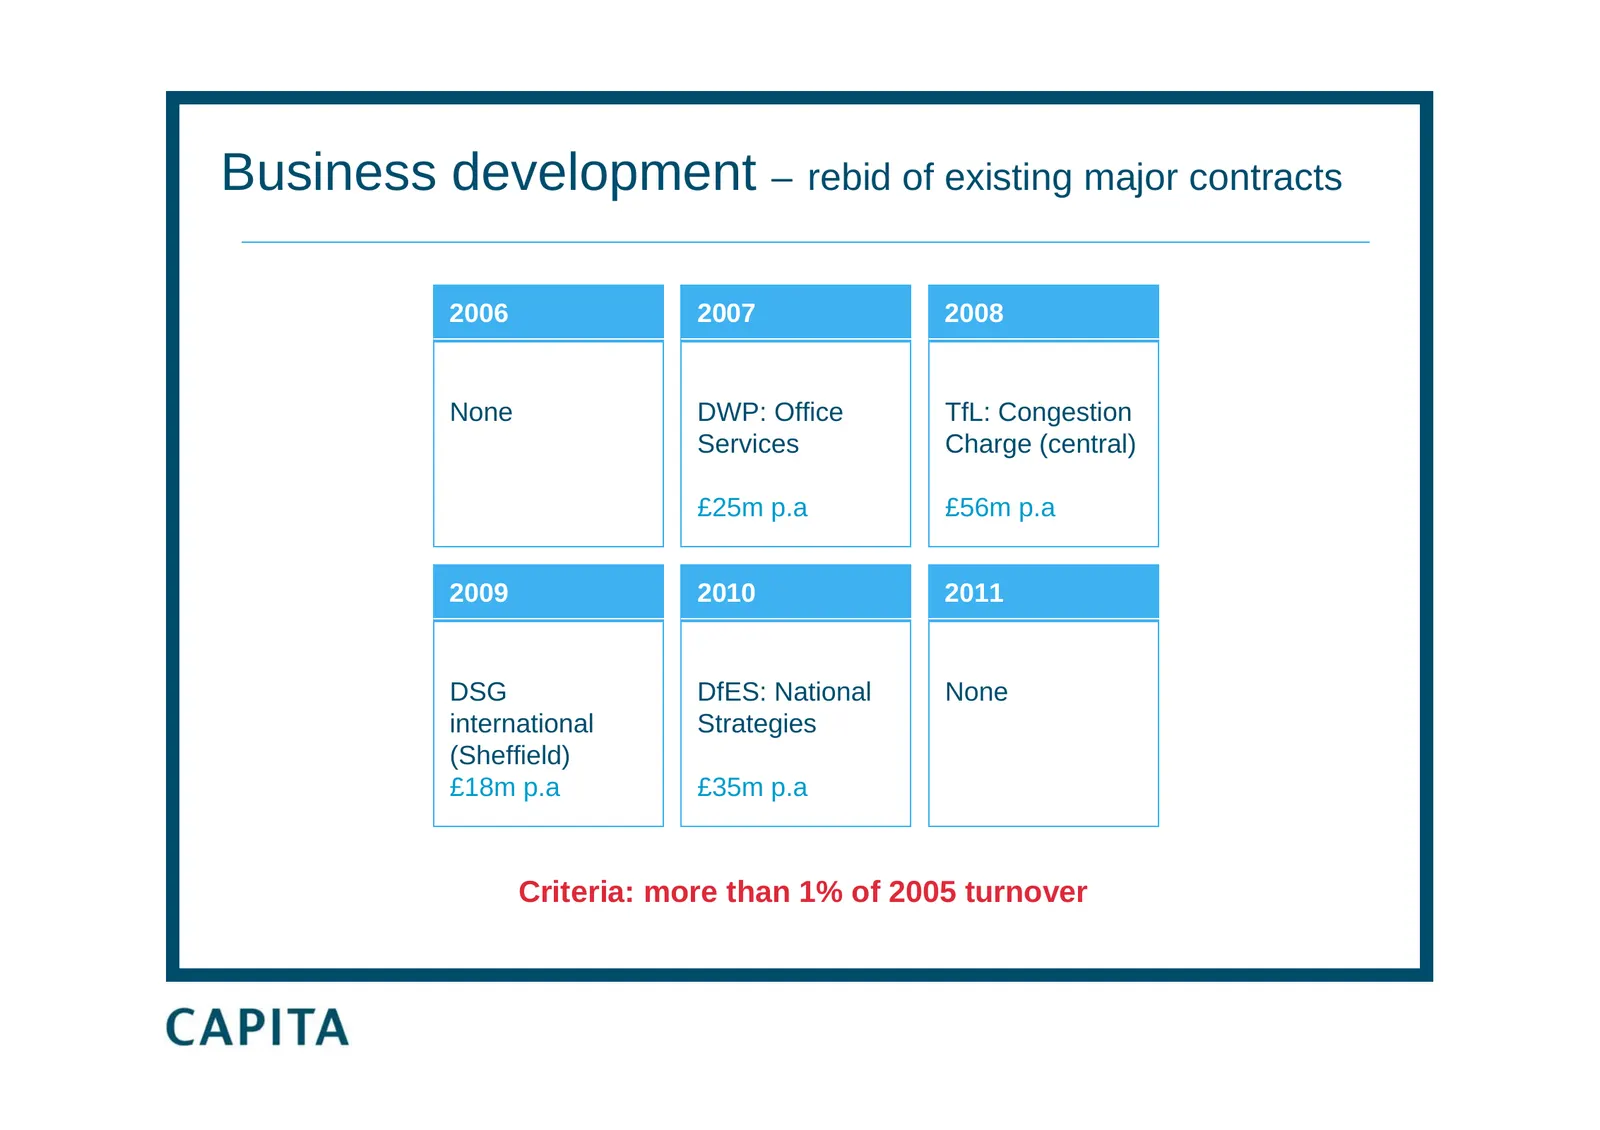
Slide 28: Business development – rebid of existing major contracts
Business development – rebid of existing major contracts 2006 2007 2008 None DWP: Office TfL: Congestion Services Charge (central) £25m p.a £56m p.a 2009 2010 2011 DSG DfES: National None international Strategies (Sheffield) £18m p.a £35m p.a Criteria: more than 1% of 2005 turnover
Slide 29: Business development – bid activity
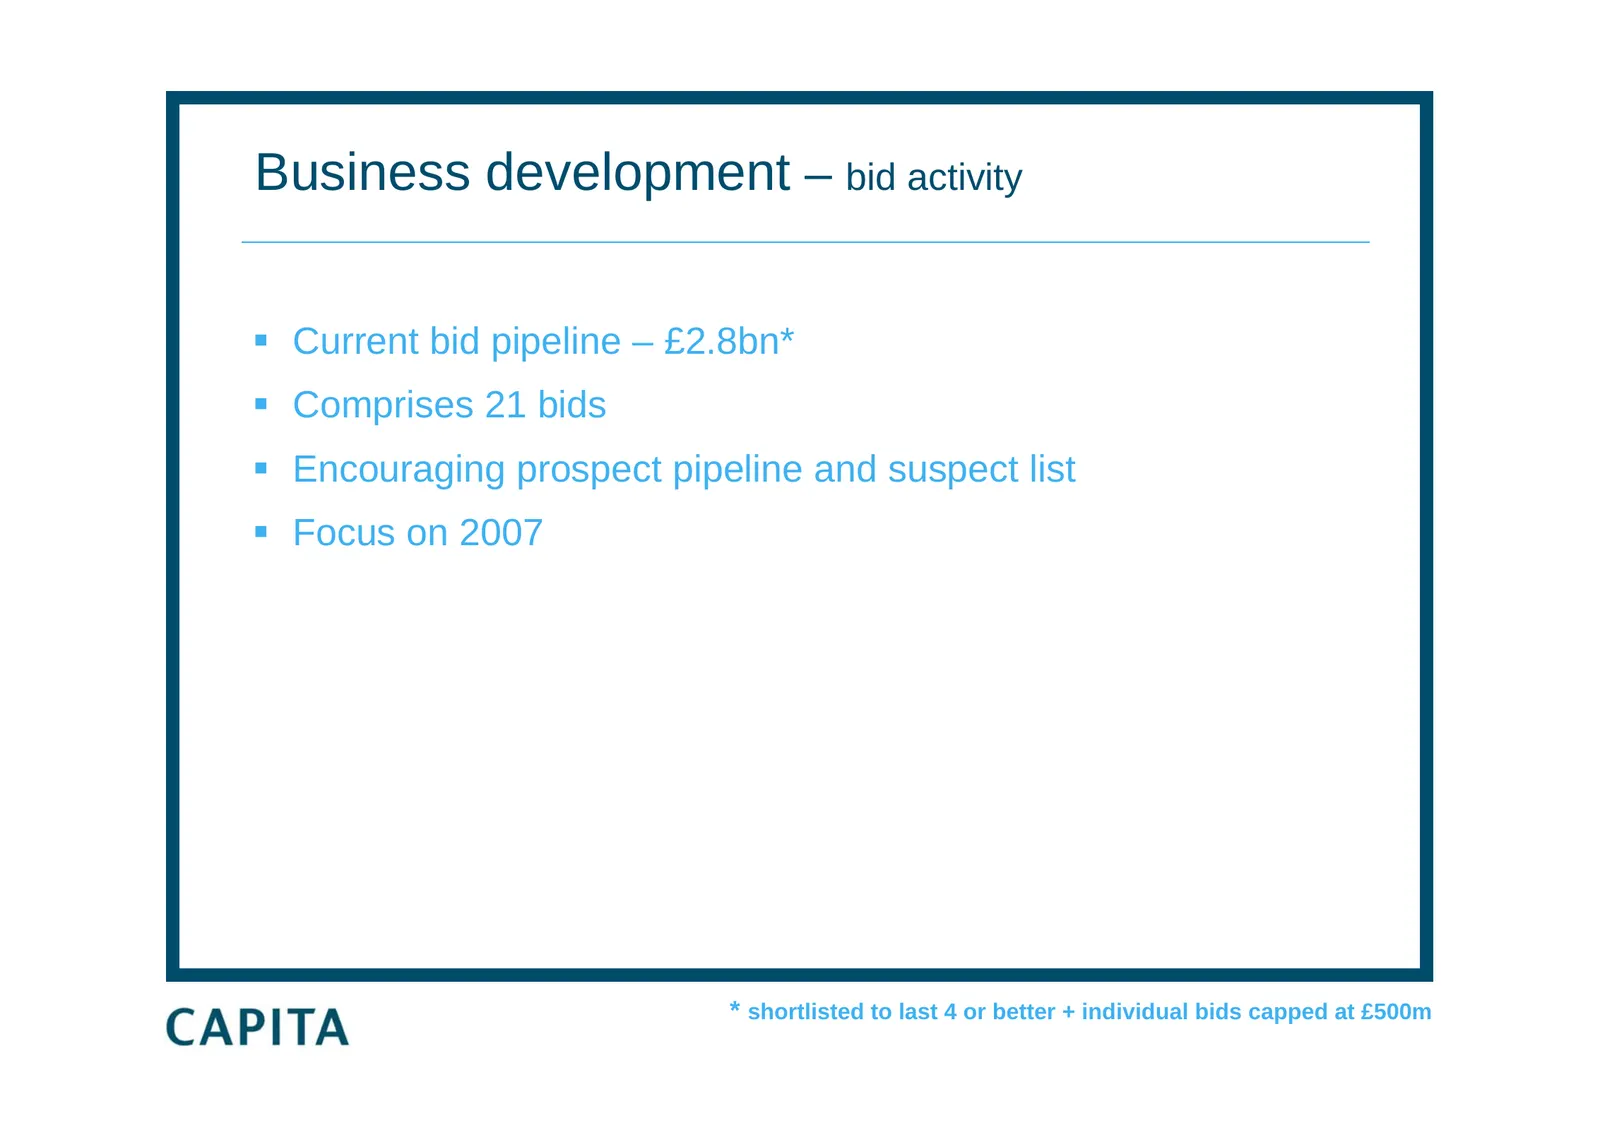
Business development – bid activity Current bid pipeline – £2.8bn* Comprises 21 bids Encouraging prospect pipeline and suspect list Focus on 2007 * shortlisted to last 4 or better + individual bids capped at £500m
Slide 30: 2006 major contract update: Zurich
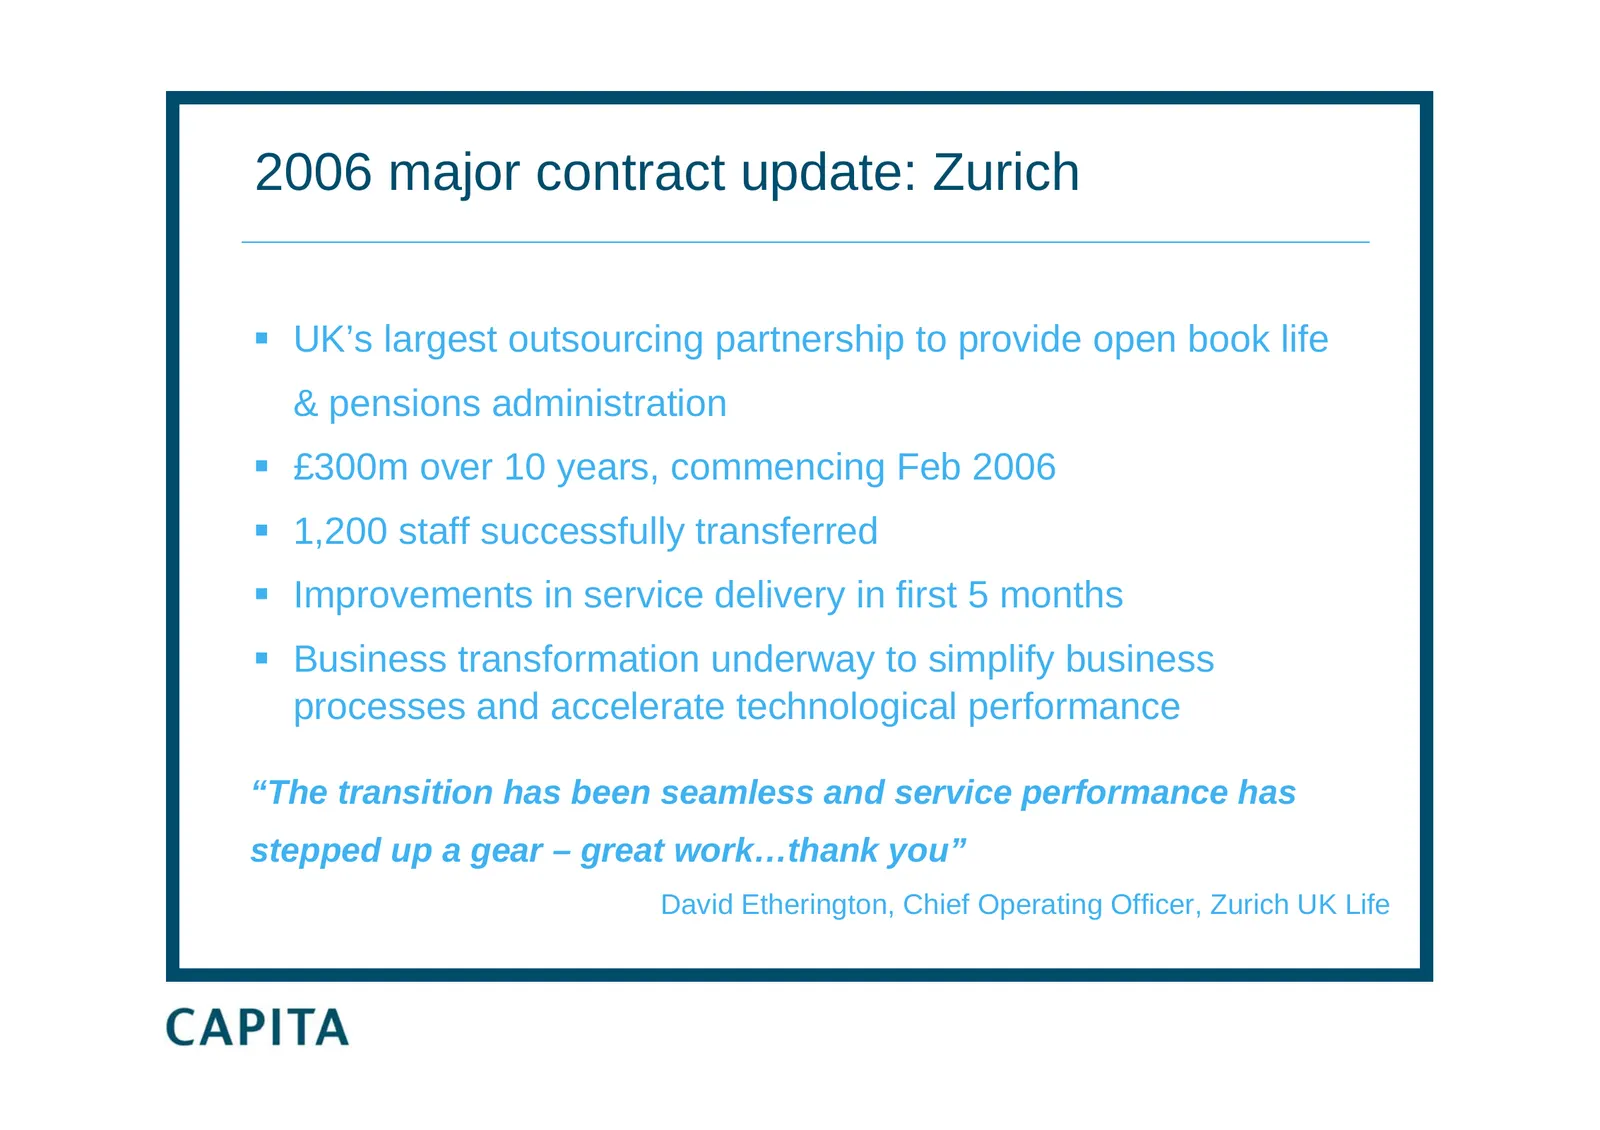
2006 major contract update: Zurich UK’s largest outsourcing partnership to provide open book life & pensions administration £300m over 10 years, commencing Feb 2006 1,200 staff successfully transferred Improvements in service delivery in first 5 months Business transformation underway to s
Slide 31: 2006 major contract update - Service Birmingham
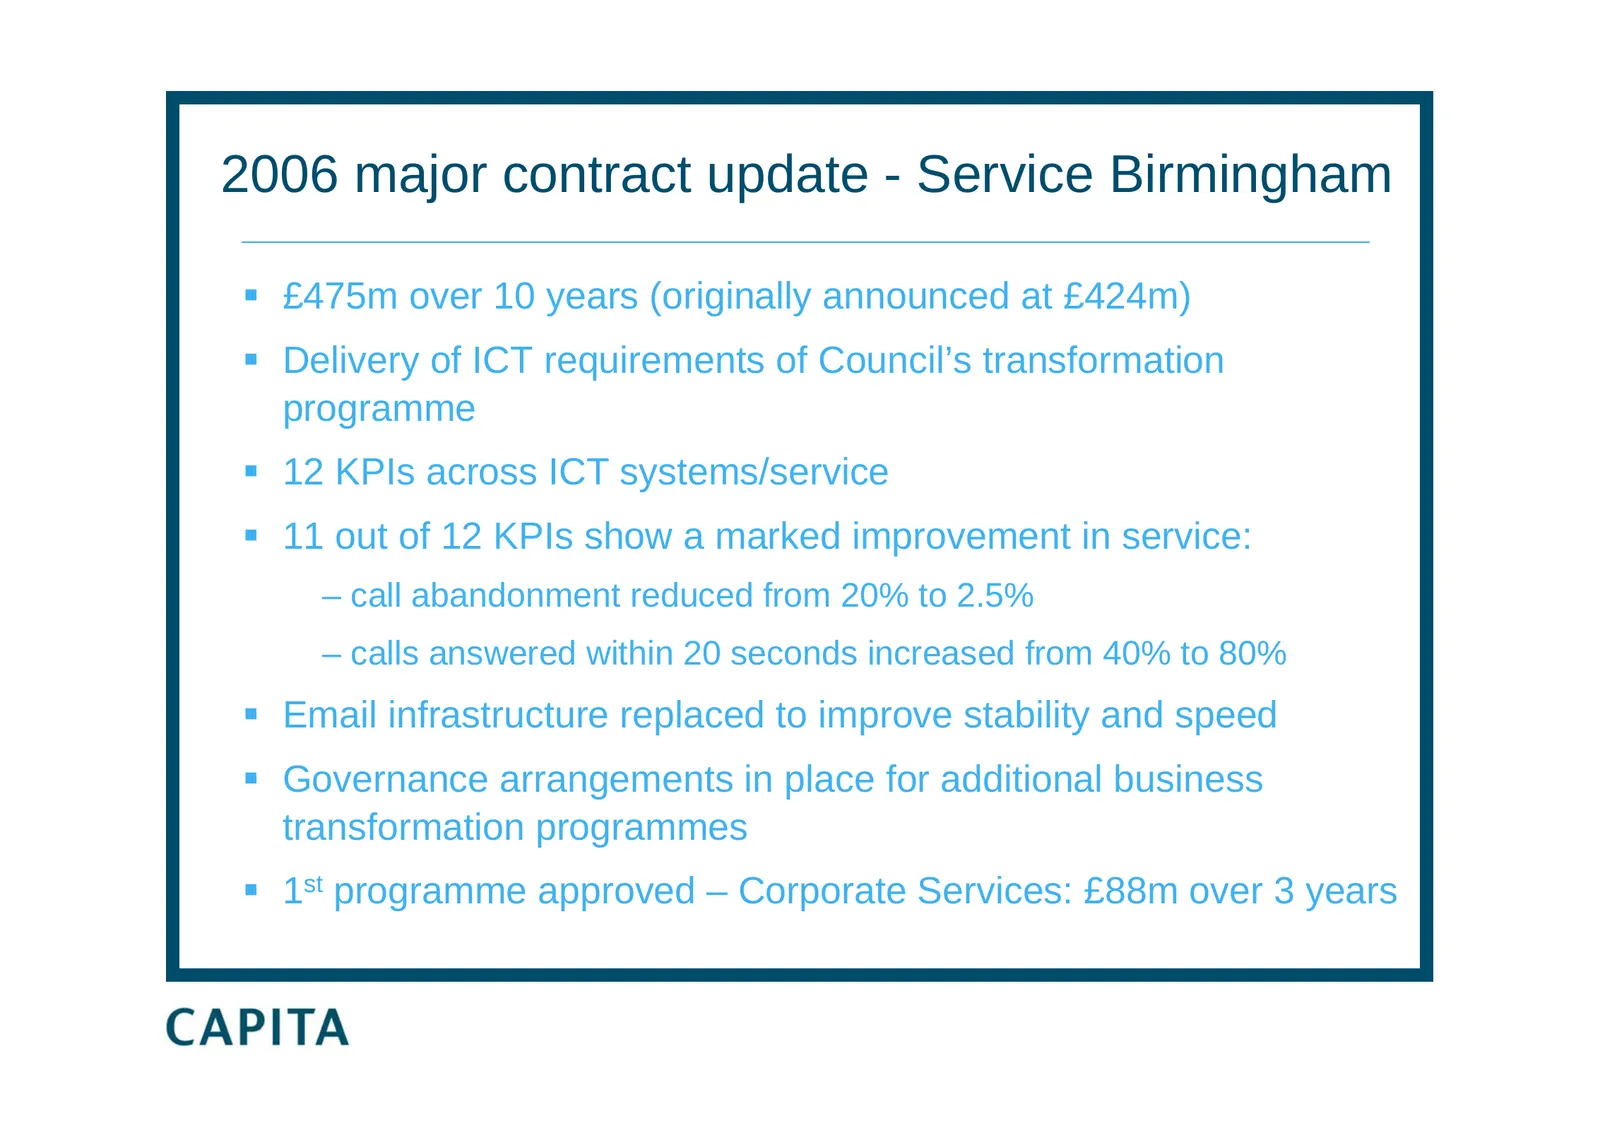
2006 major contract update - Service Birmingham £475m over 10 years (originally announced at £424m) Delivery of ICT requirements of Council’s transformation programme 12 KPIs across ICT systems/service 11 out of 12 KPIs show a marked improvement in service: – call abandonment reduced from 20
Slide 32: 2006 major contract update – DSG international
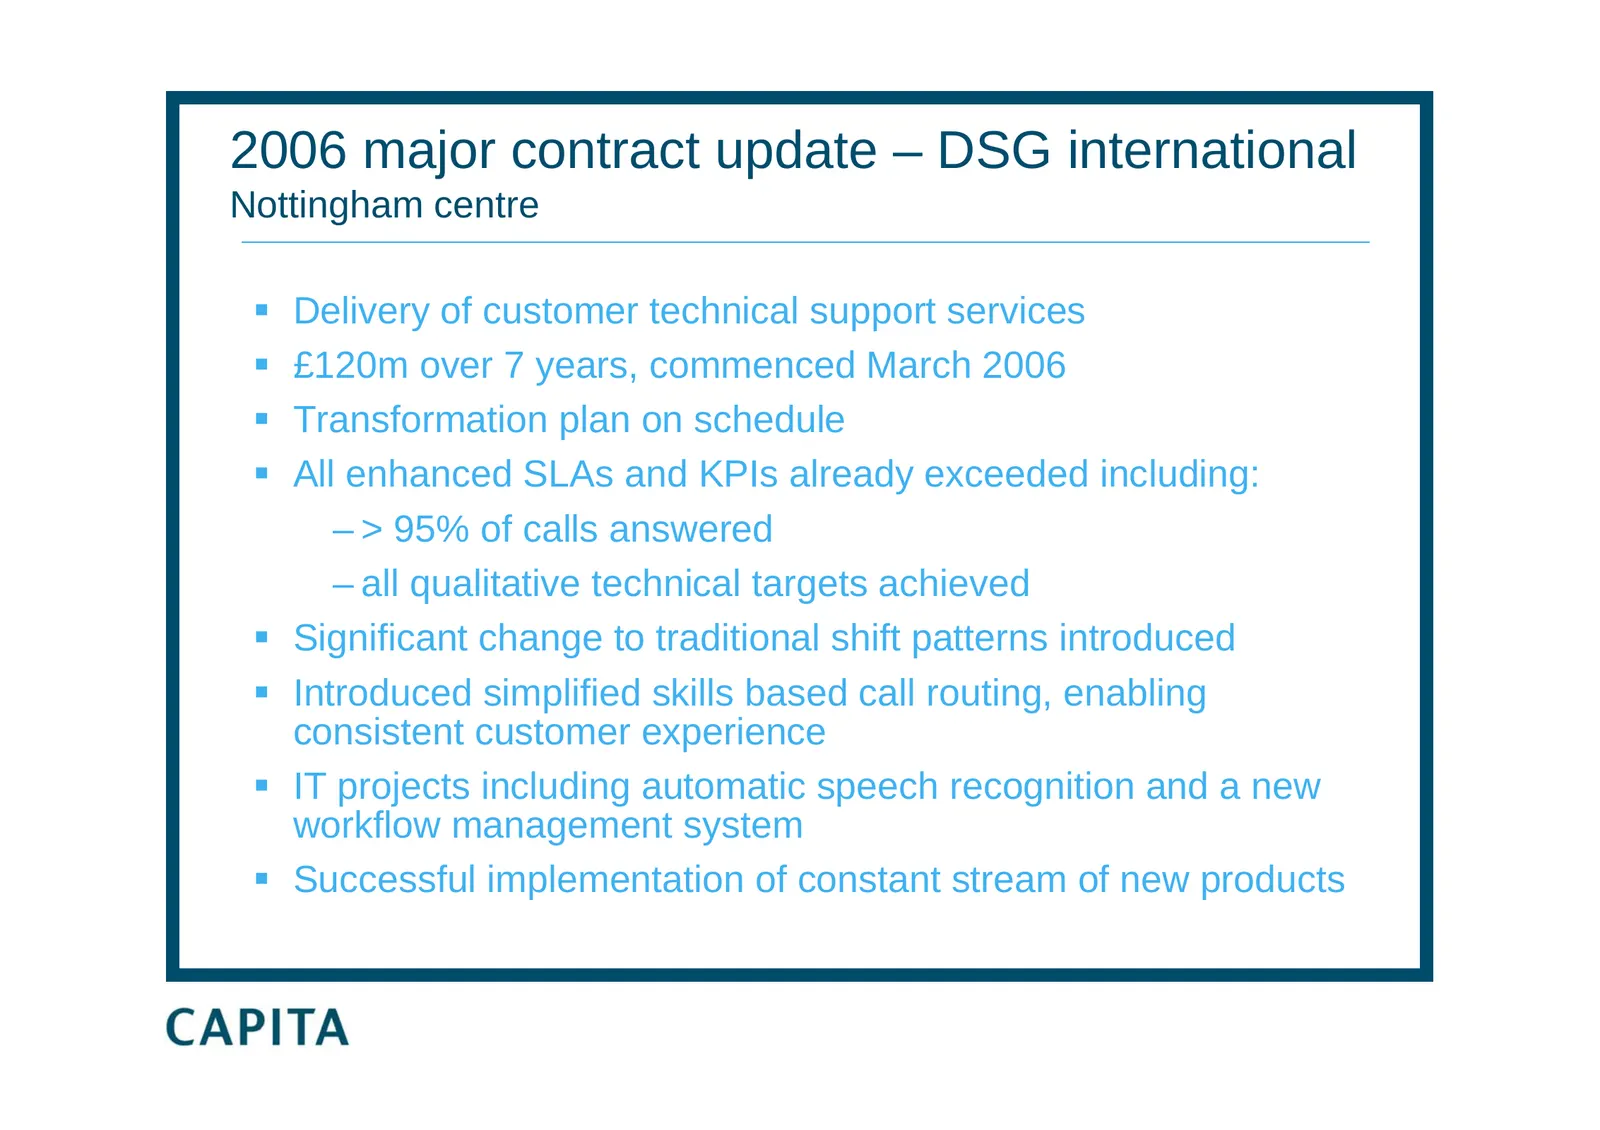
2006 major contract update – DSG international Nottingham centre Delivery of customer technical support services £120m over 7 years, commenced March 2006 Transformation plan on schedule All enhanced SLAs and KPIs already exceeded including: – > 95% of calls answered – all qualitative technic
Slide 33: 2006 major contract update – Northern Ireland Civil Service
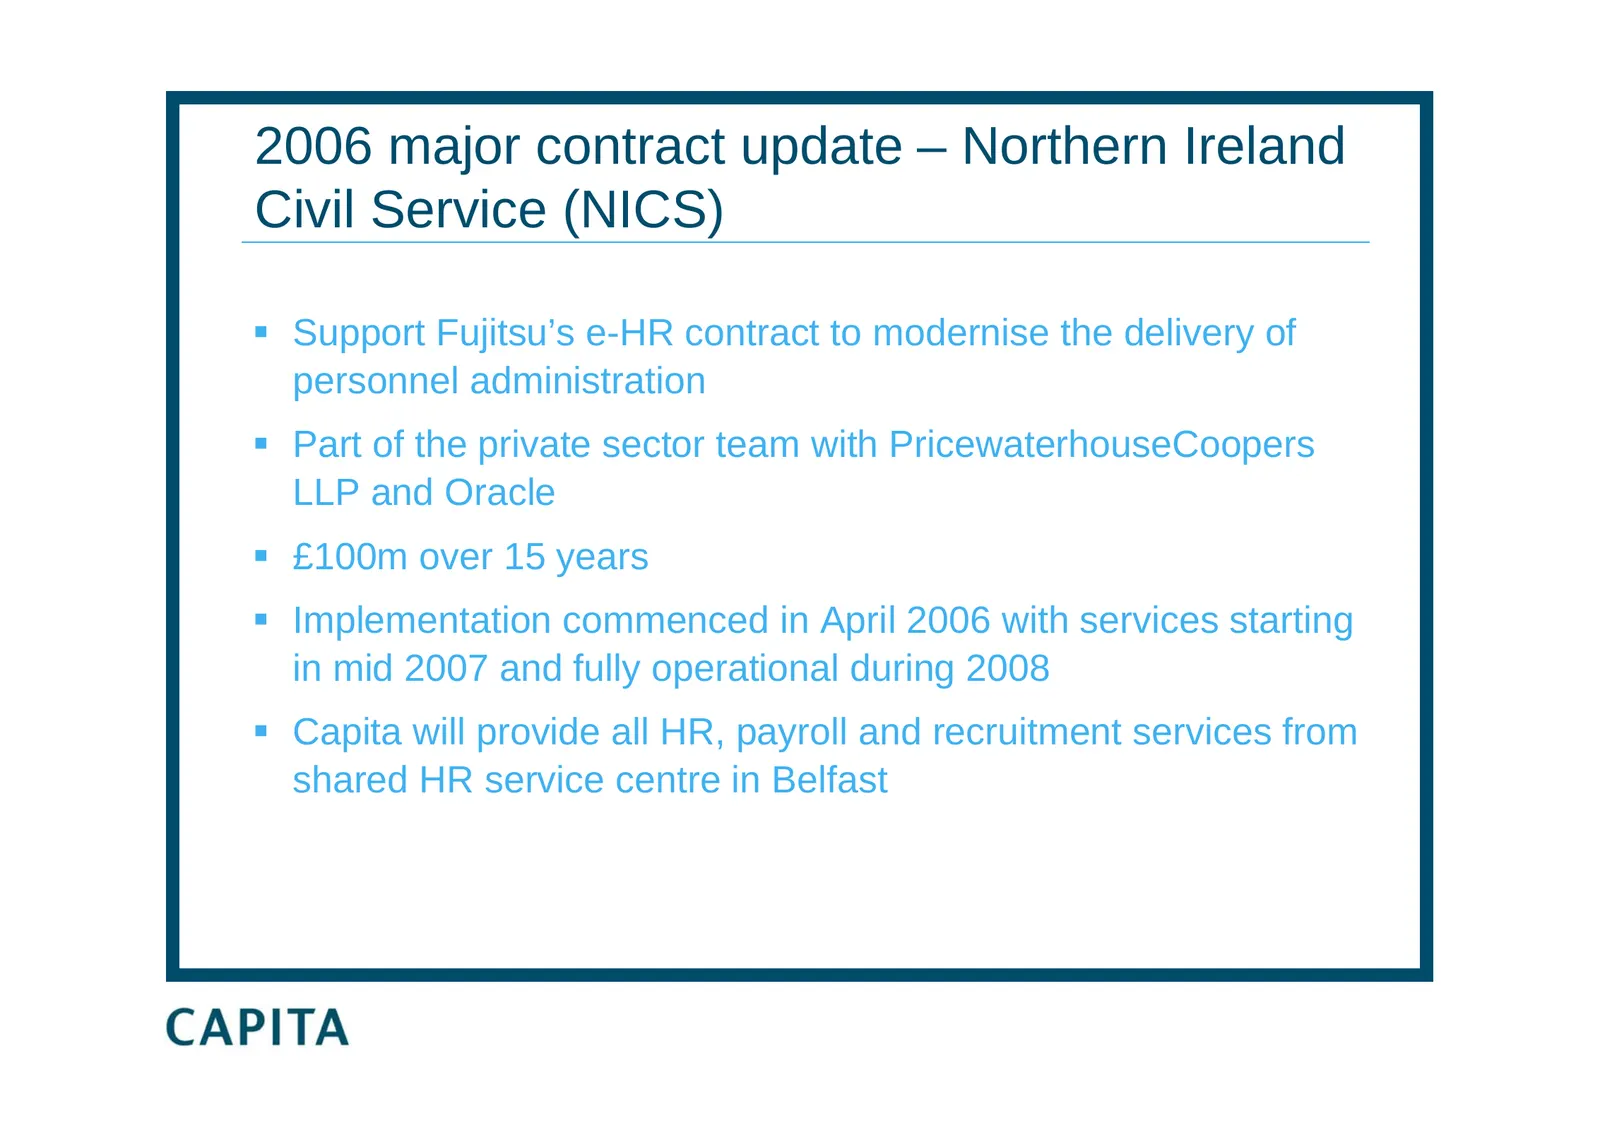
2006 major contract update – Northern Ireland Civil Service (NICS) Support Fujitsu’s e-HR contract to modernise the delivery of personnel administration Part of the private sector team with PricewaterhouseCoopers LLP and Oracle £100m over 15 years Implementation commenced in April 2006 with
Slide 34: 2006 major contract news - BBC HR
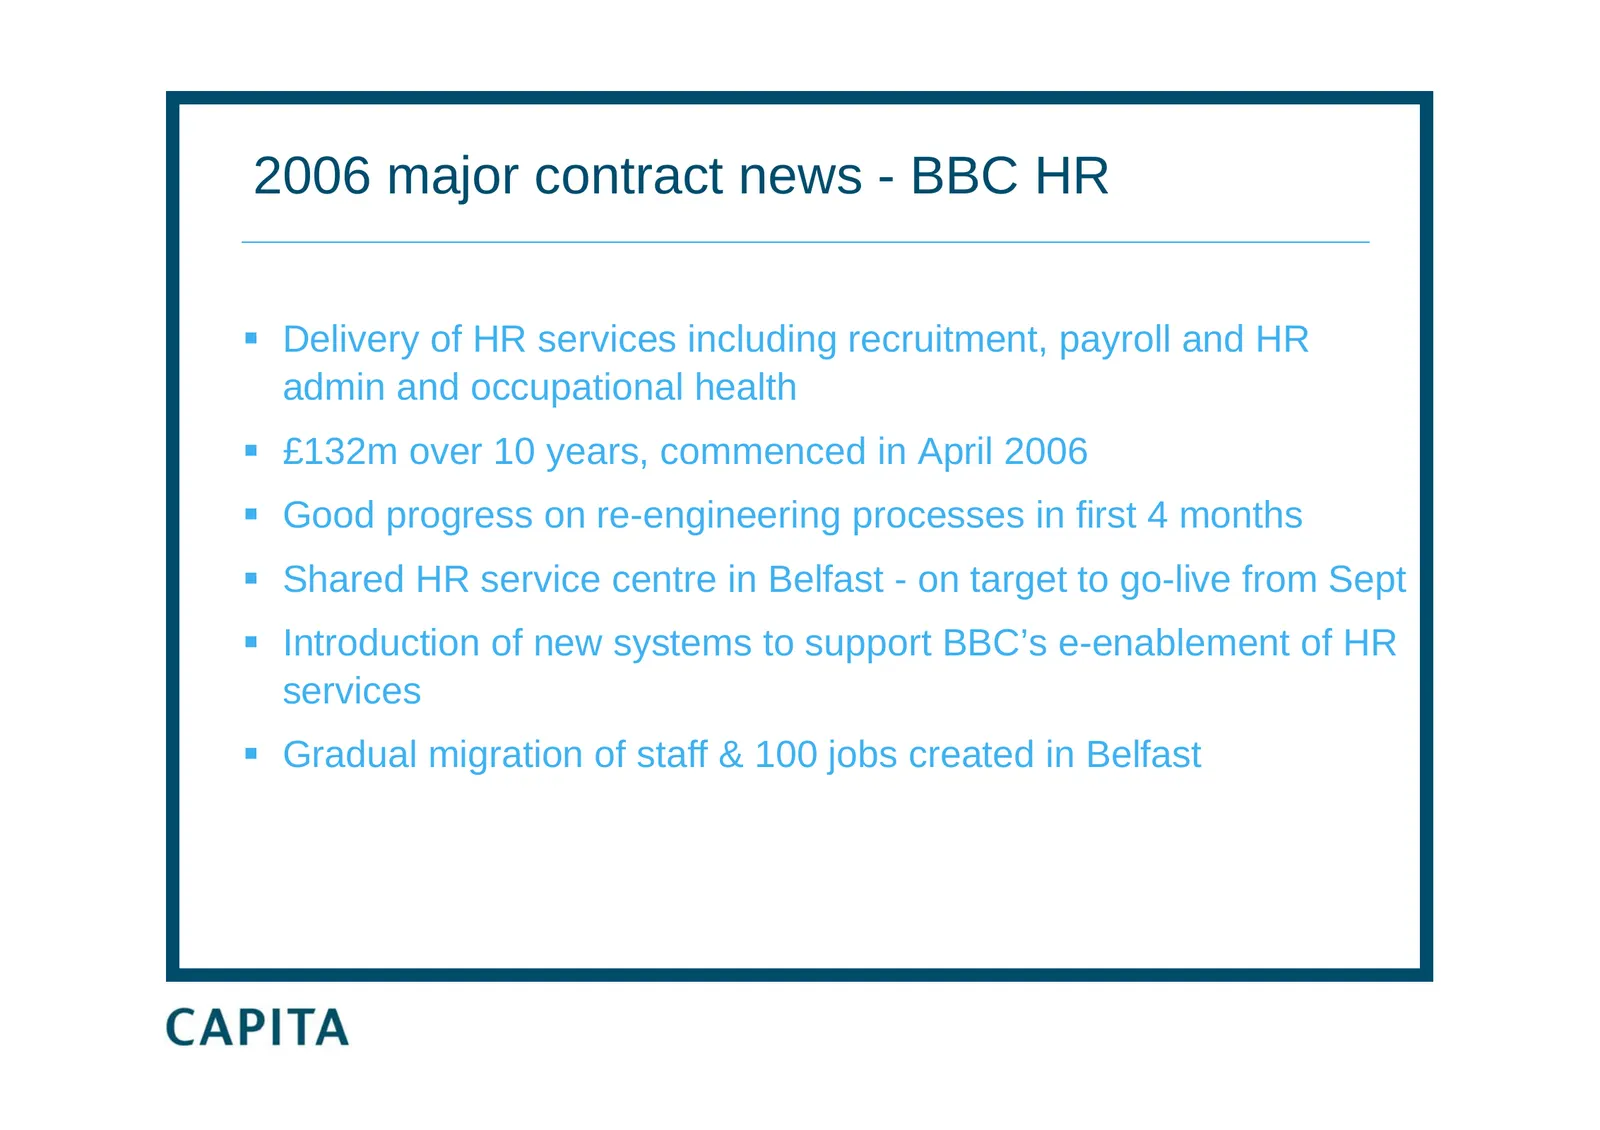
2006 major contract news - BBC HR Delivery of HR services including recruitment, payroll and HR admin and occupational health £132m over 10 years, commenced in April 2006 Good progress on re-engineering processes in first 4 months Shared HR service centre in Belfast - on target to go-live fr
Slide 35: Building operational scale - offshore
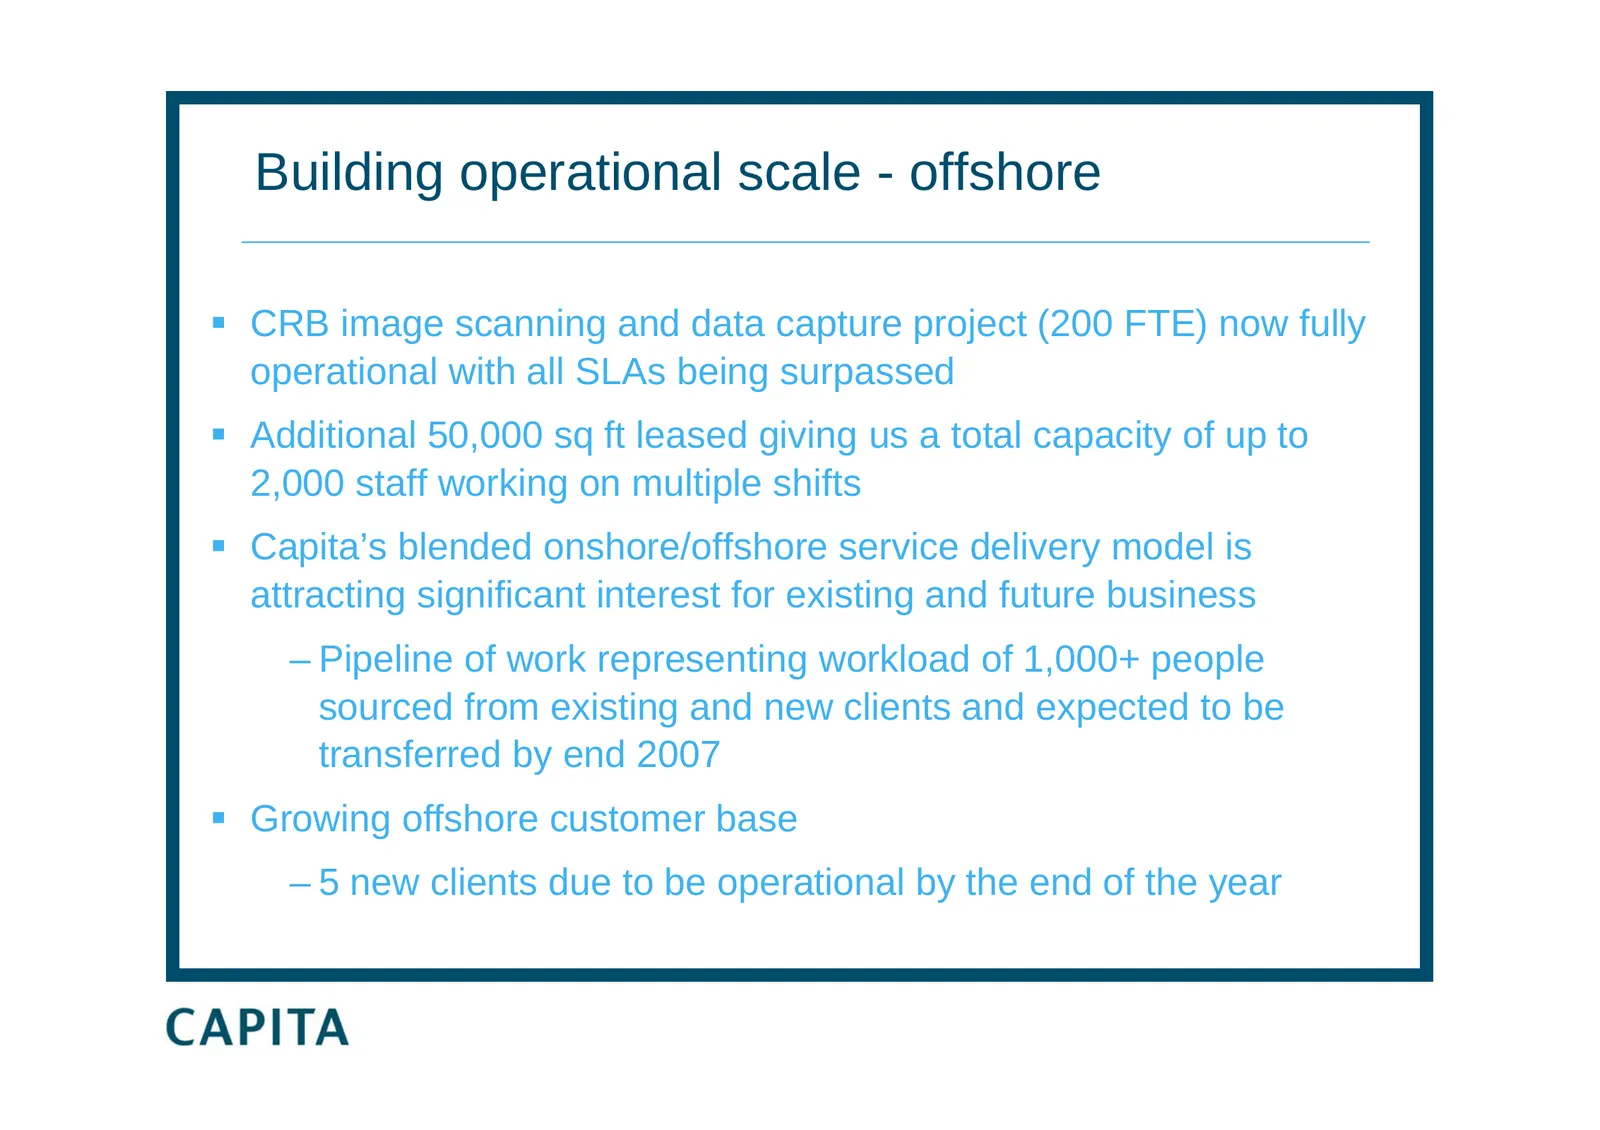
Building operational scale - offshore CRB image scanning and data capture project (200 FTE) now fully operational with all SLAs being surpassed Additional 50,000 sq ft leased giving us a total capacity of up to 2,000 staff working on multiple shifts Capita’s blended onshore/offshore service de
Slide 36: 2006 acquisitions & investments
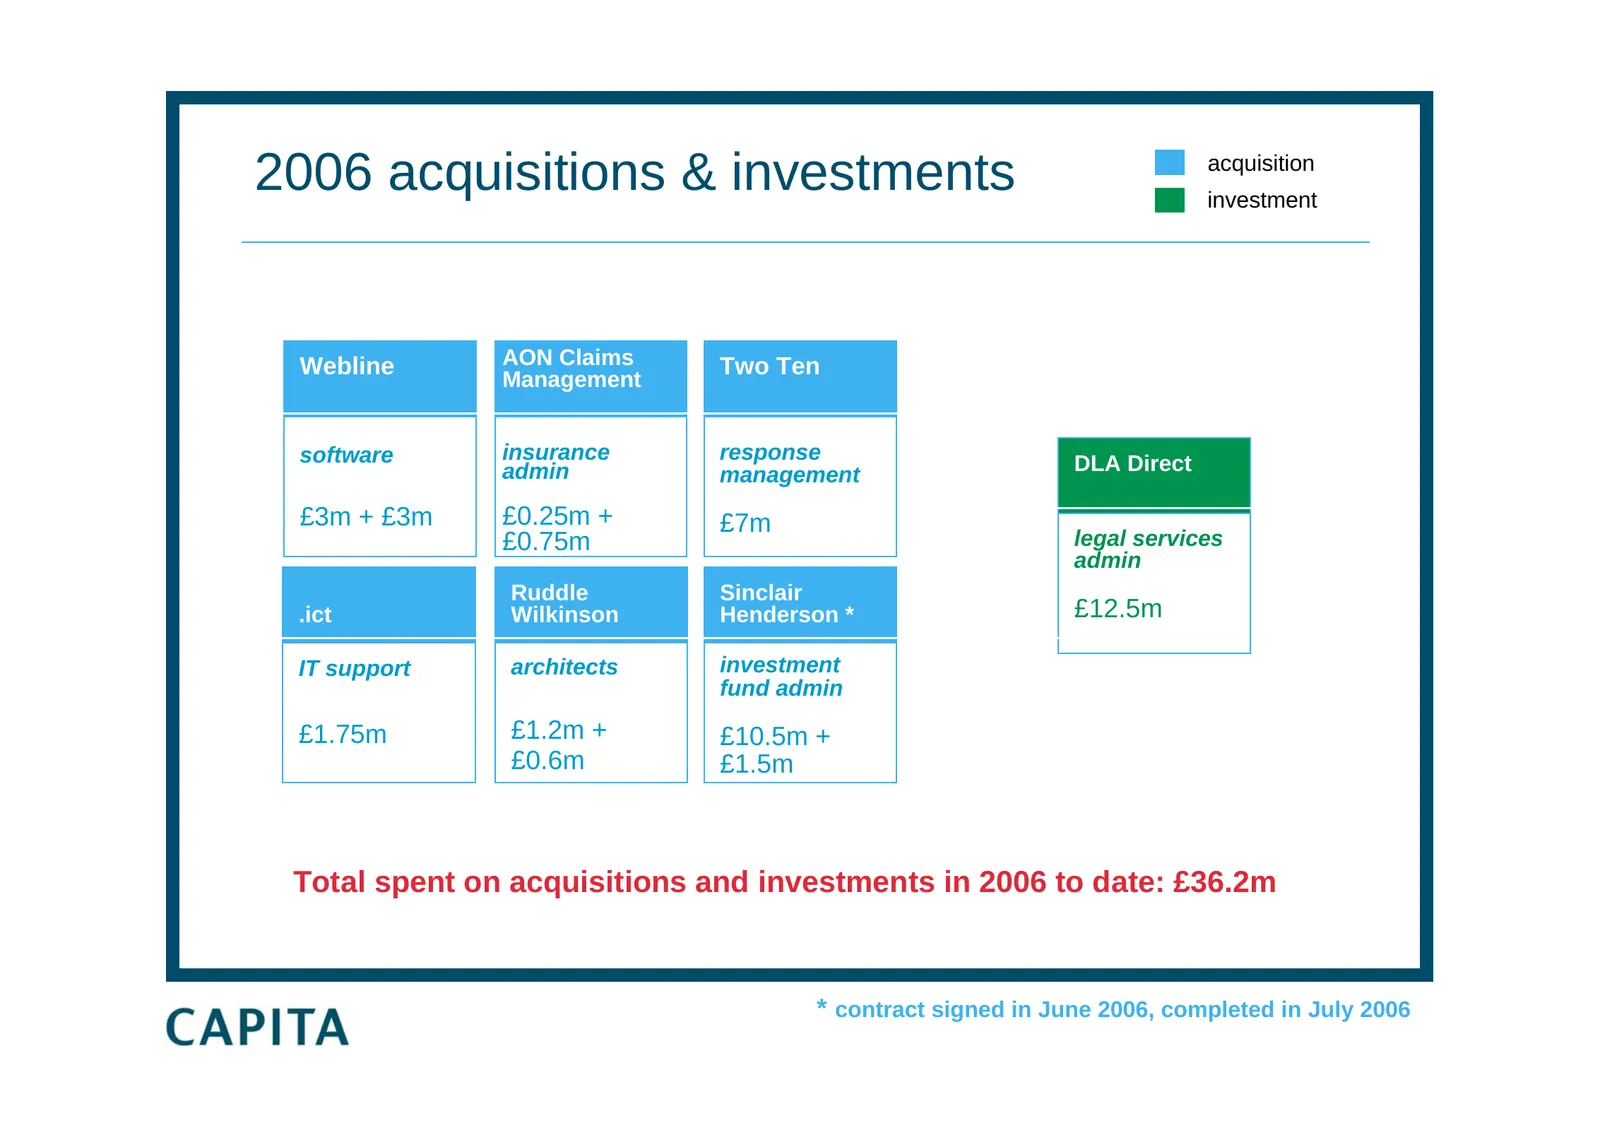
2006 acquisitions & investments acquisition investment Webline AON Claims Two Ten Management software insurance response admin management DLA Direct £3m + £3m £0.25m + £7m £0.75m legal services admin Ruddle Sinclair .ict Wilkinson Henderson * £12.5m IT support architects investment fund admin £1.75m
Slide 37: Building on competitive advantage in a growth market
Building on competitive advantage in a growth market Rod Aldridge Chairman
Slide 38: Building on competitive advantage
Building on competitive advantage Our business model Our service record Our marketplace Our prospects
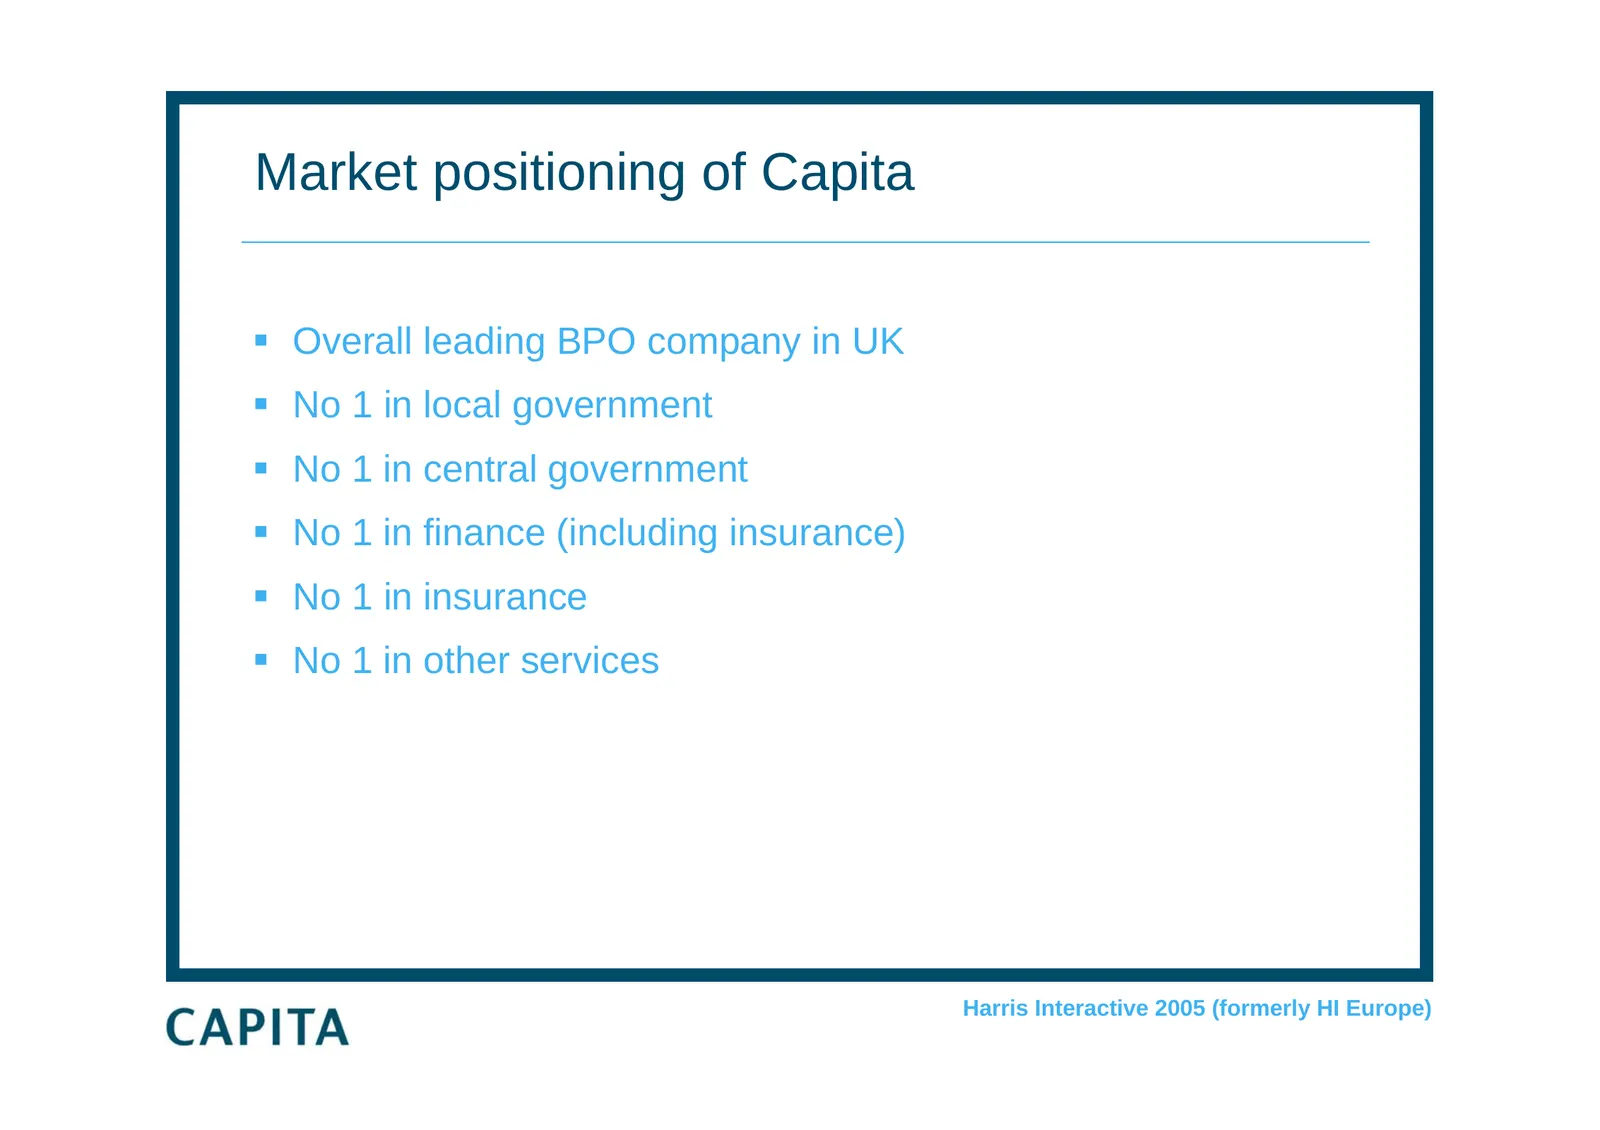
Slide 39: Market positioning of Capita
Market positioning of Capita Overall leading BPO company in UK No 1 in local government No 1 in central government No 1 in finance (including insurance) No 1 in insurance No 1 in other services Harris Interactive 2005 (formerly HI Europe)
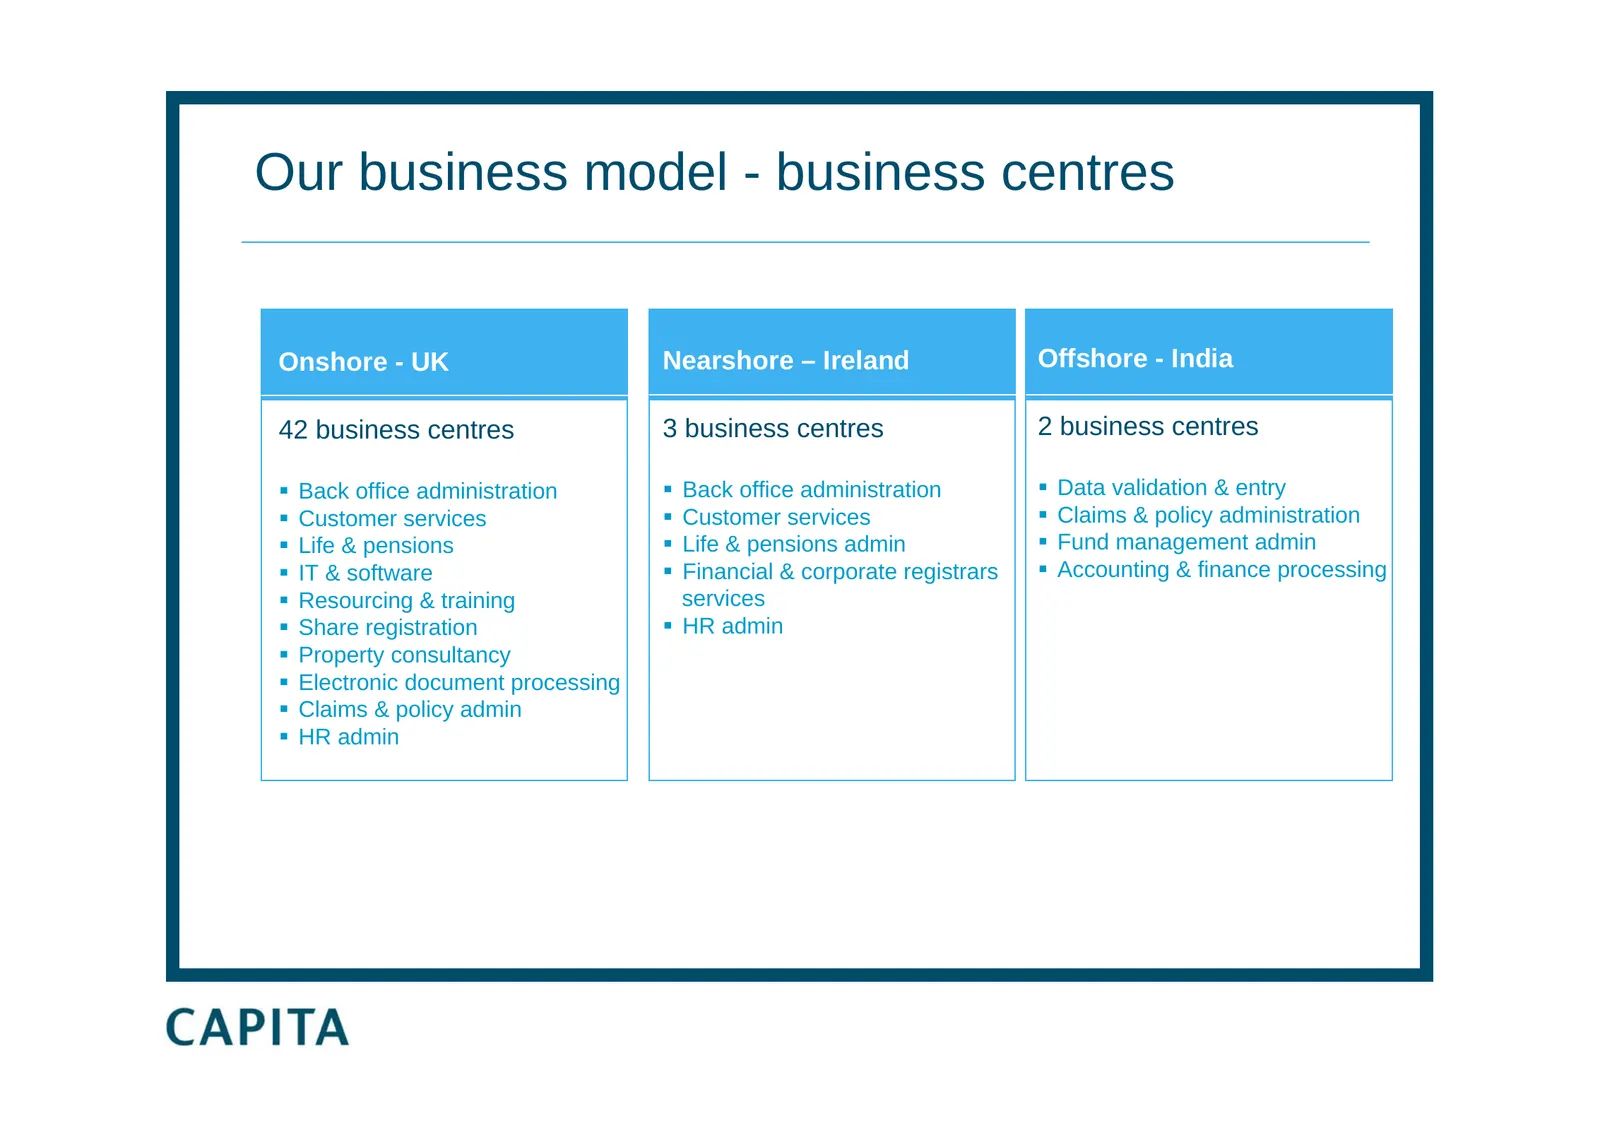
Slide 40: Our business model - business centres
Our business model - business centres Onshore - UK Nearshore – Ireland Offshore - India 42 business centres 3 business centres 2 business centres Back office administration Back office administration Data validation & entry Customer services Customer services Claims & policy administrati
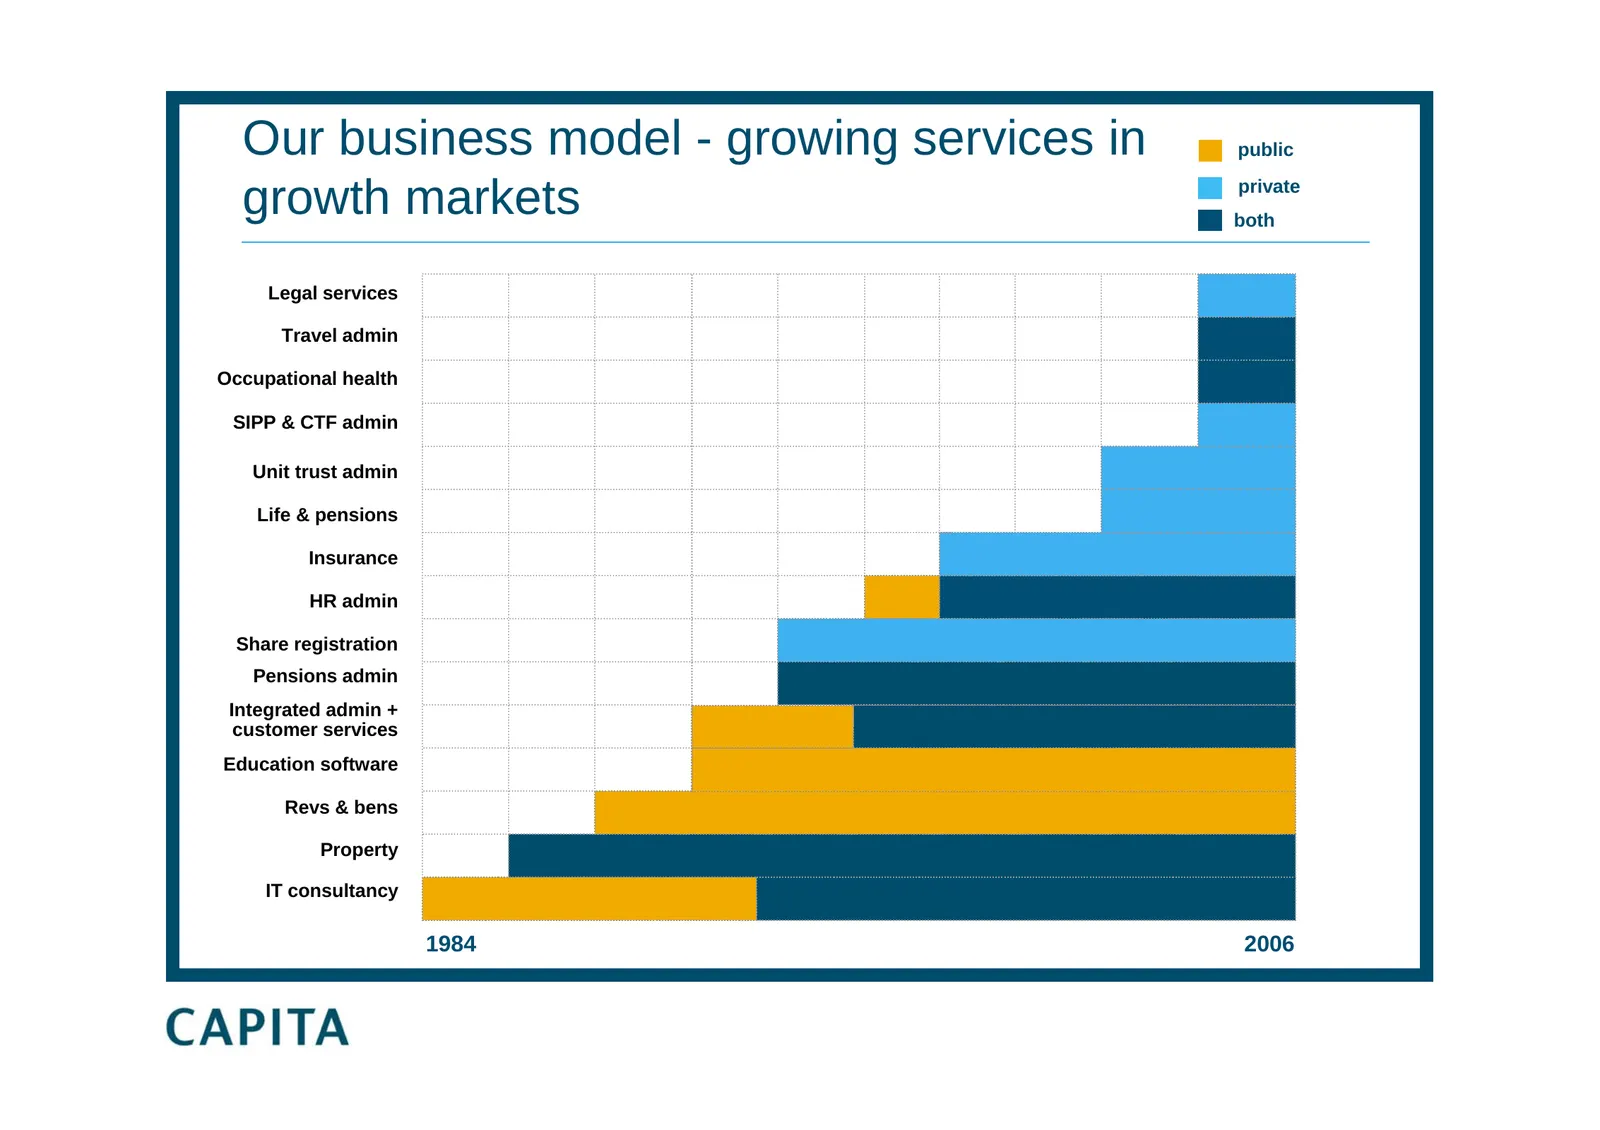
Slide 41: Our business model - growing services in growth markets
Our business model - growing services in public growth markets private both Legal services Travel admin Occupational health SIPP & CTF admin Unit trust admin Life & pensions Insurance HR admin Share registration Pensions admin Integrated admin + customer services Education software Revs & bens Prope
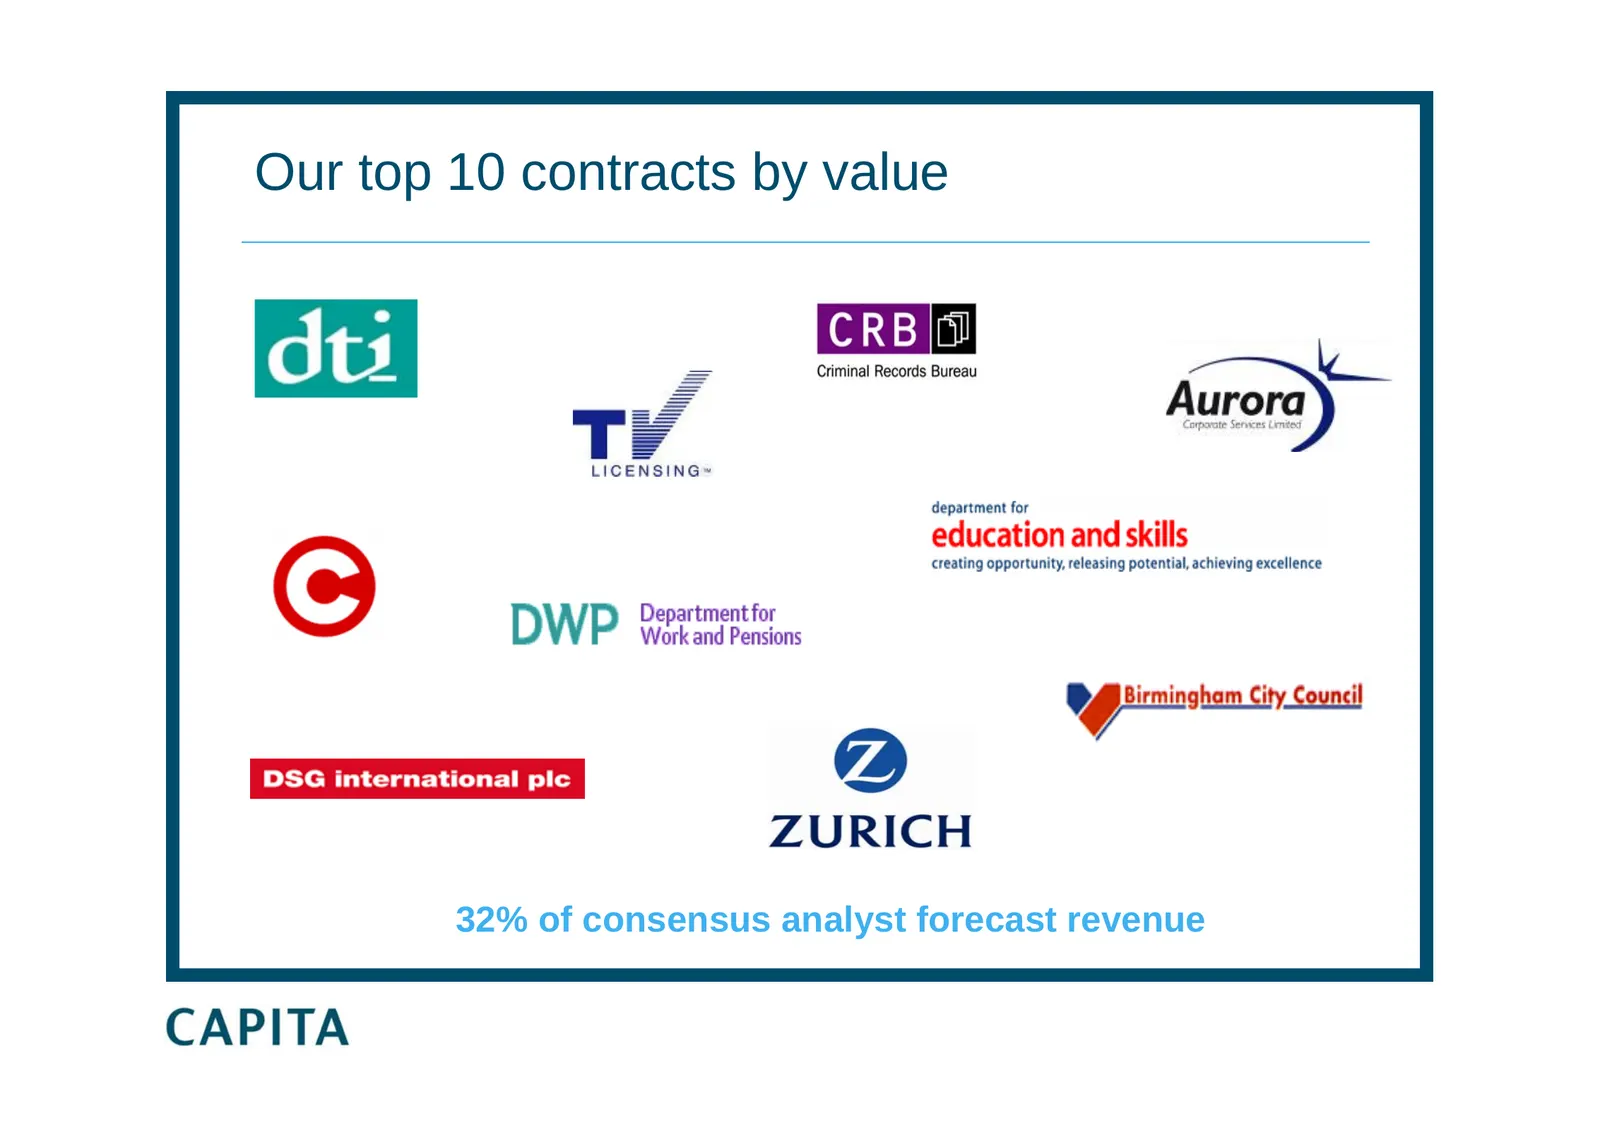
Slide 42: Our top 10 contracts by value
Our top 10 contracts by value 32% of consensus analyst forecast revenue
Slide 43: Our service record
Our service record Operational delivery is valued most highly by clients It is the major reason for customer retention Only one material contract lost in 17 years as a public company Manifests itself in debtor days, client satisfaction surveys and awards received Direct link to margin enha
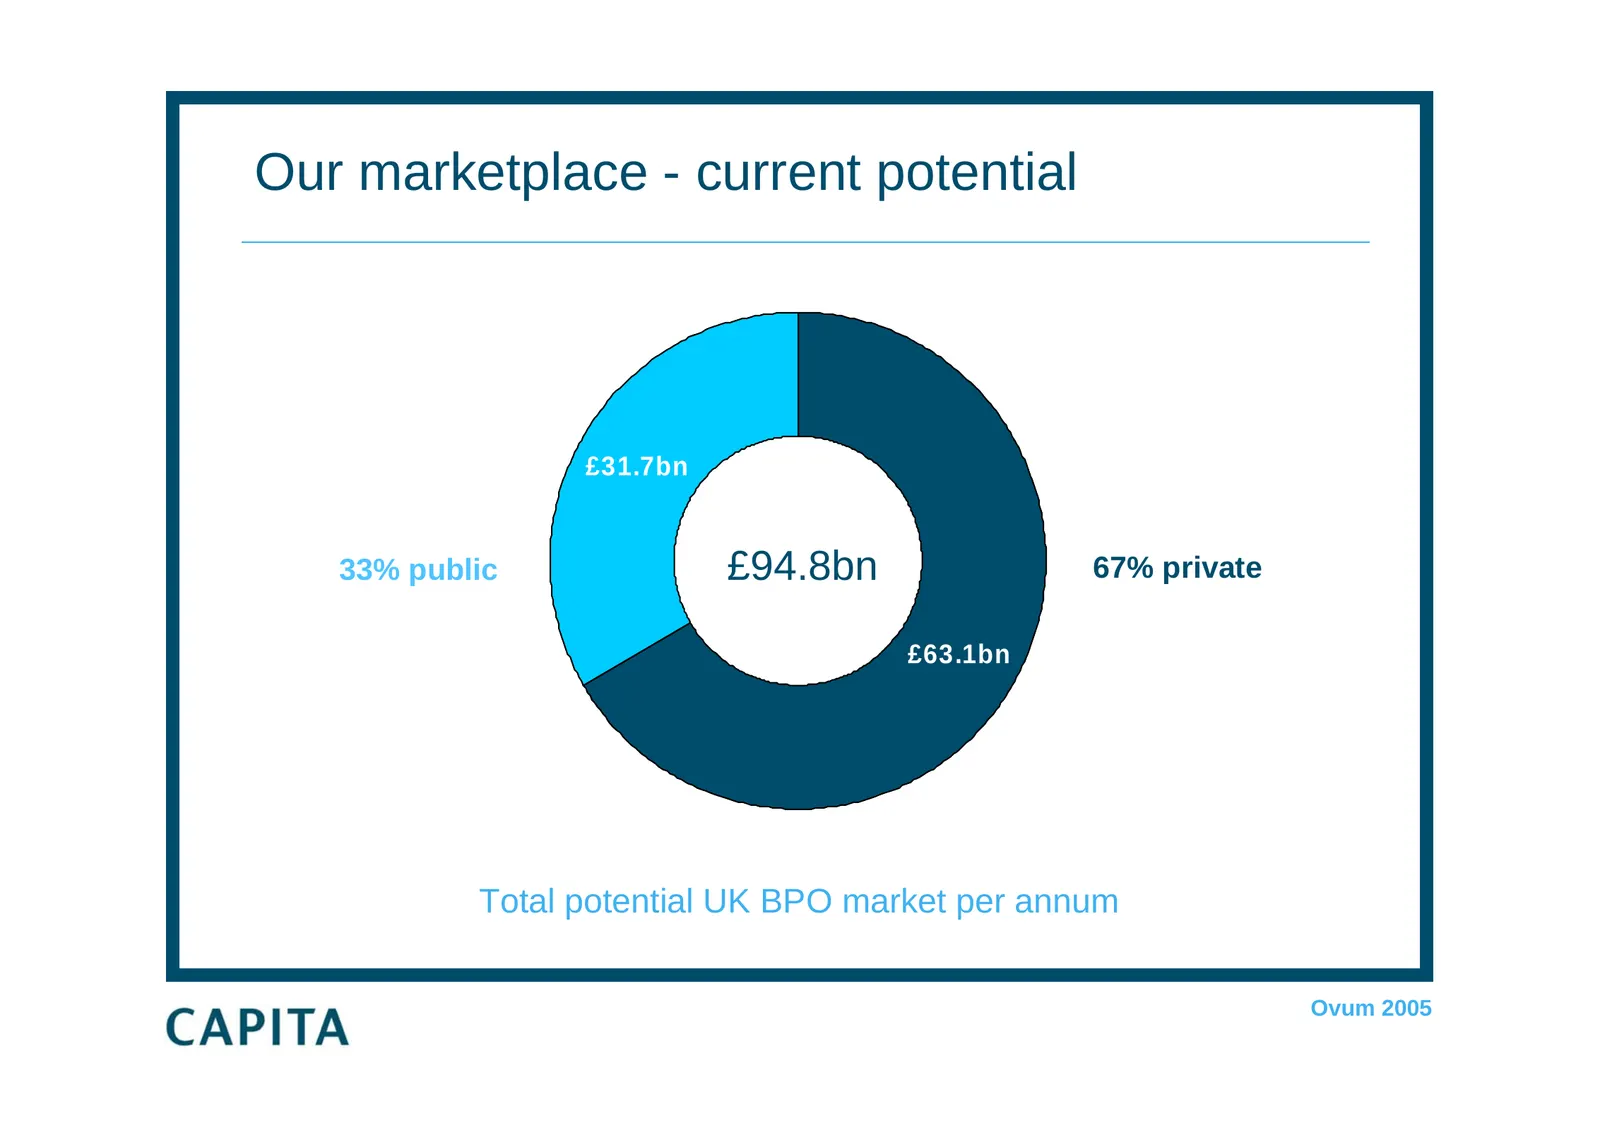
Slide 44: Our marketplace - current potential
Our marketplace - current potential £31.7bn 33% public £94.8bn 67% private £63.1bn Total potential UK BPO market per annum Ovum 2005
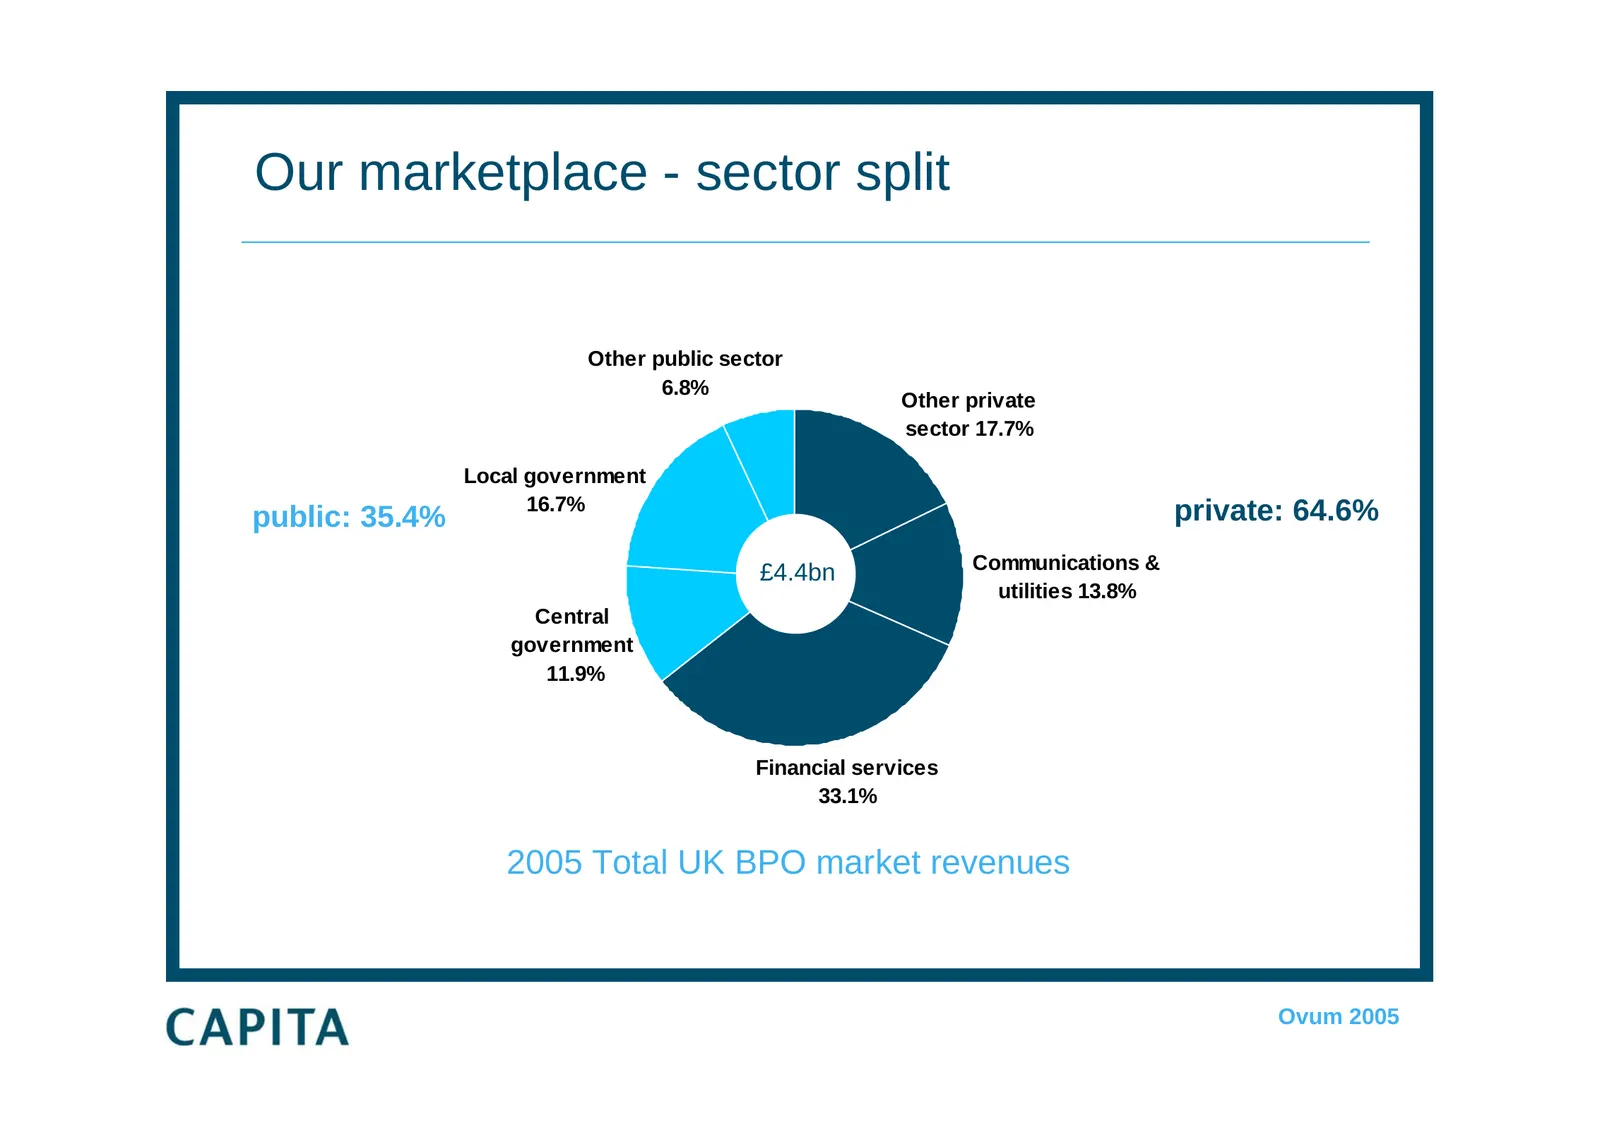
Slide 45: Our marketplace - sector split
Our marketplace - sector split Other public sector 6.8% Other private sector 17.7% Local government 16.7% private: 64.6% public: 35.4% Communications & £4.4bn utilities 13.8% Central government 11.9% Financial services 33.1% 2005 Total UK BPO market revenues Ovum 2005
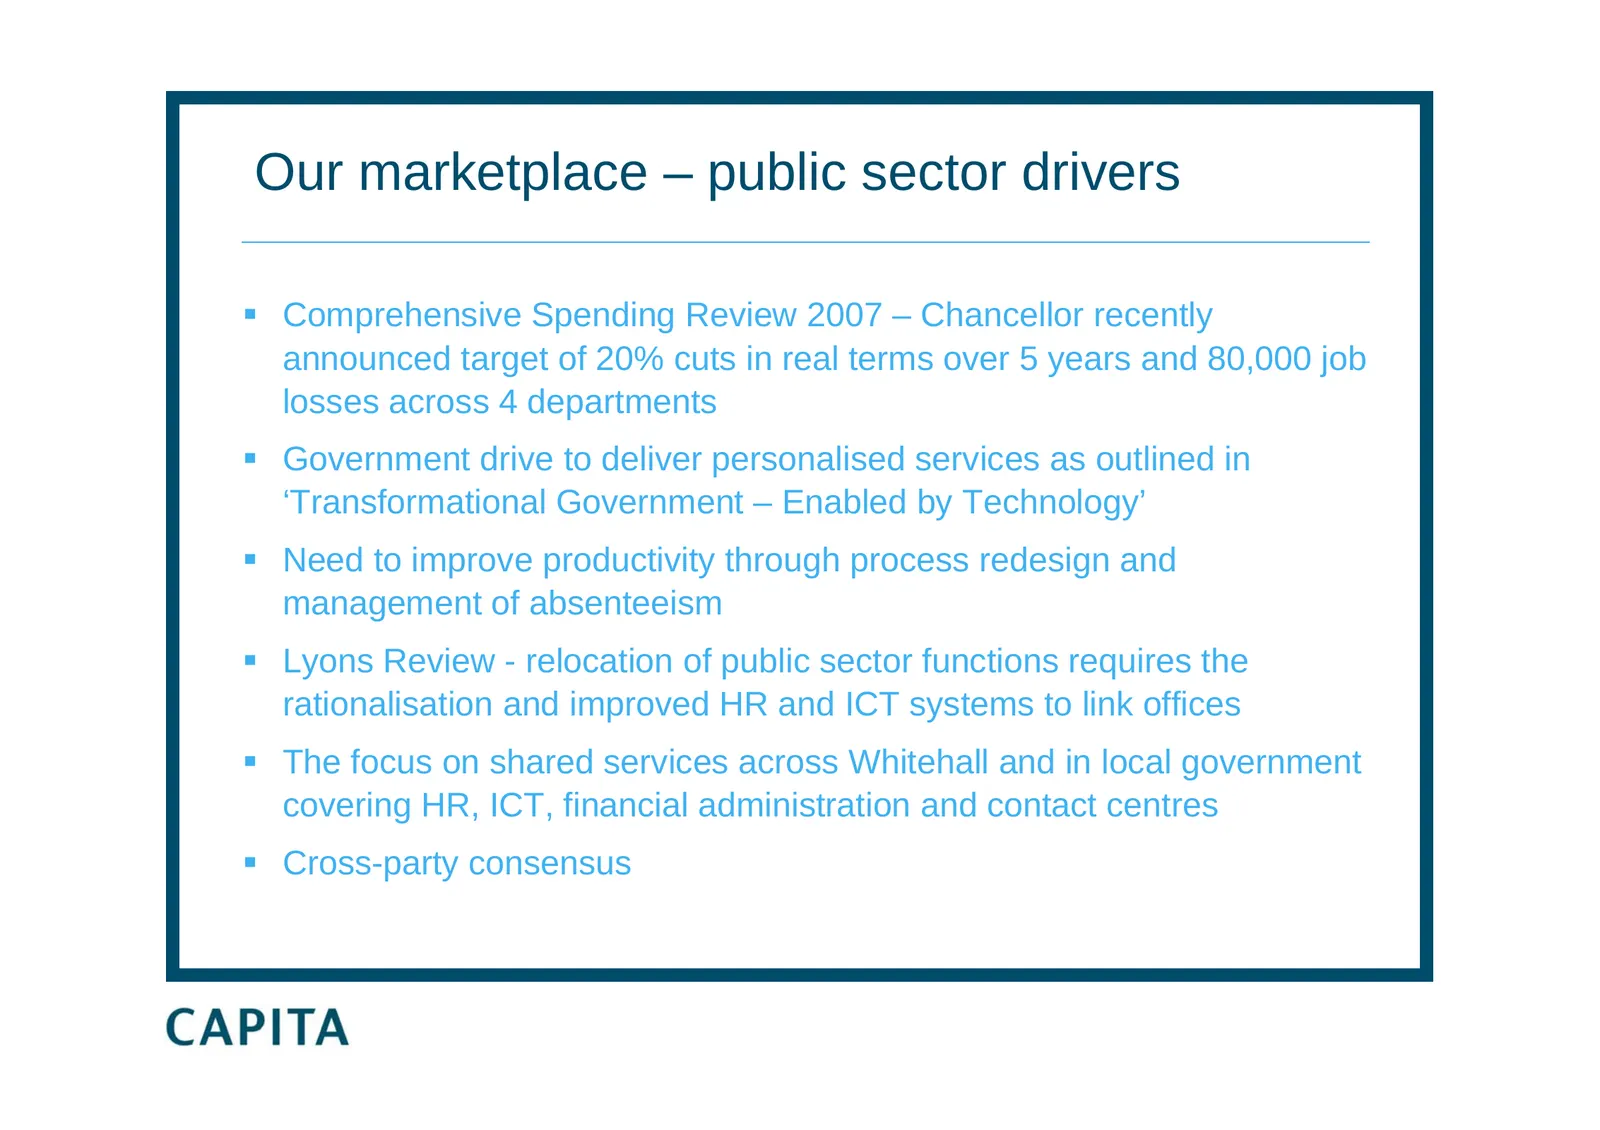
Slide 46: Our marketplace – public sector drivers
Our marketplace – public sector drivers Comprehensive Spending Review 2007 – Chancellor recently announced target of 20% cuts in real terms over 5 years and 80,000 job losses across 4 departments Government drive to deliver personalised services as outlined in ‘Transformational Government – Enab
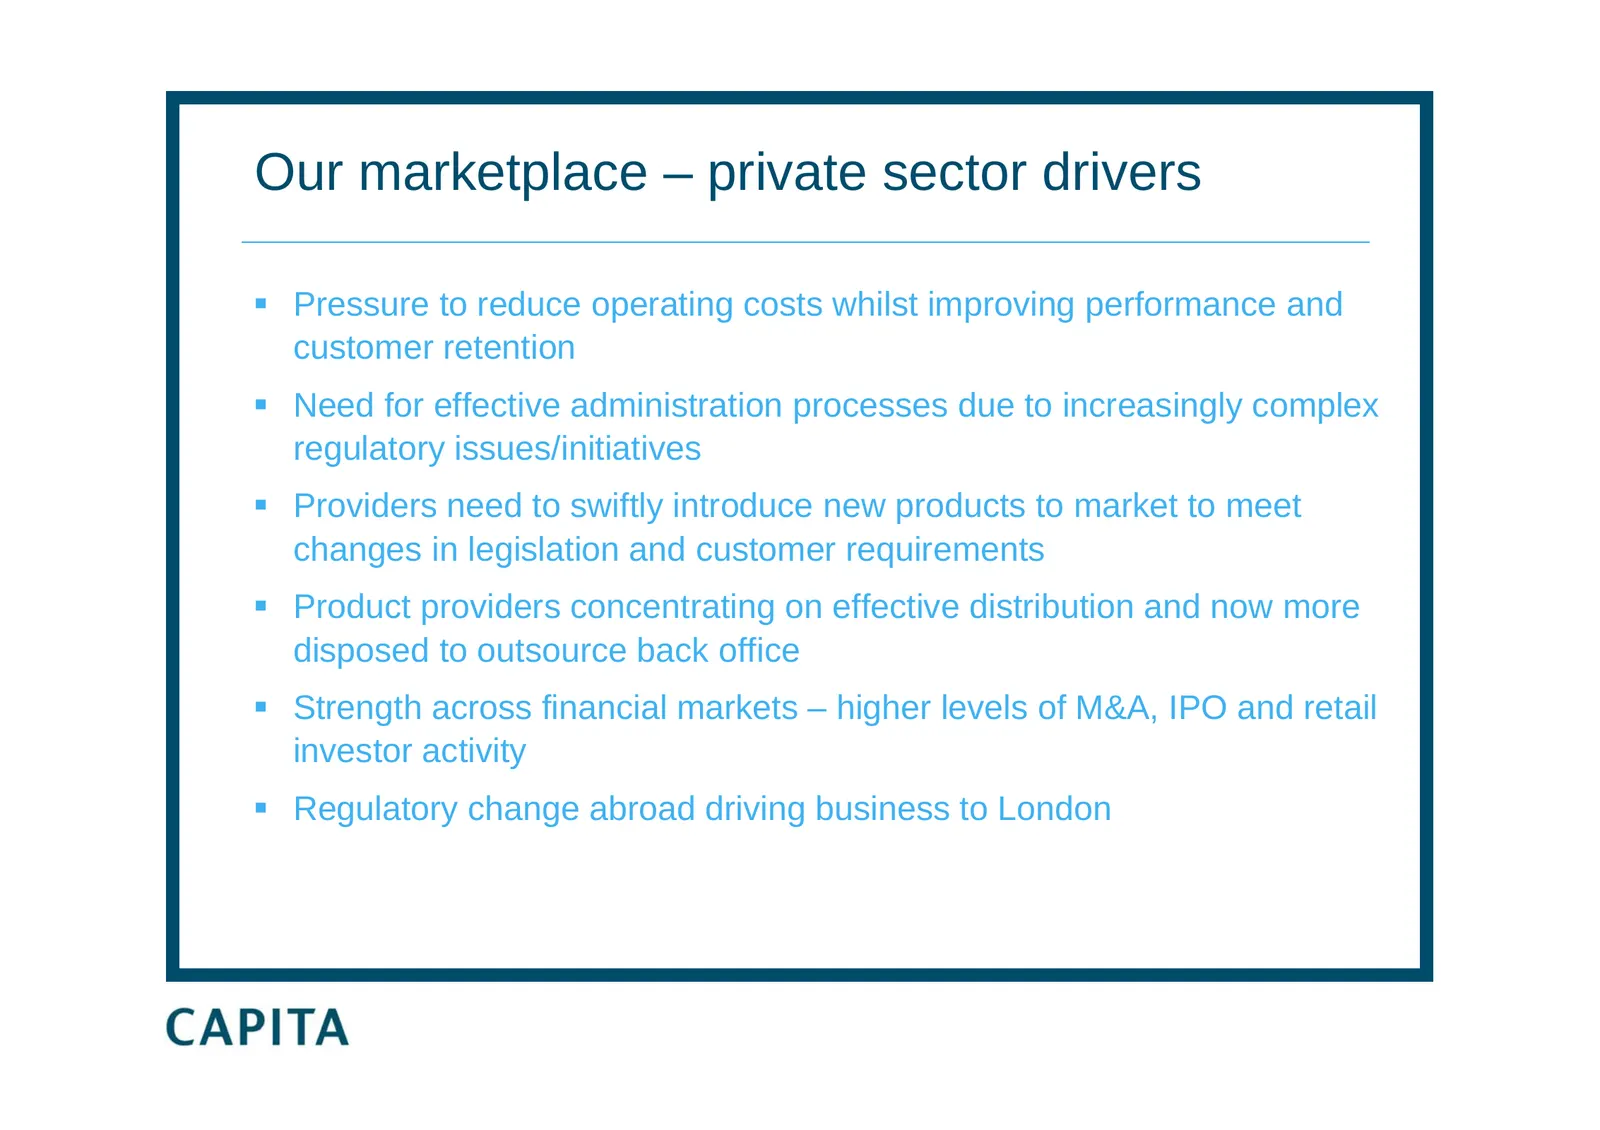
Slide 47: Our marketplace – private sector drivers
Our marketplace – private sector drivers Pressure to reduce operating costs whilst improving performance and customer retention Need for effective administration processes due to increasingly complex regulatory issues/initiatives Providers need to swiftly introduce new products to market to me
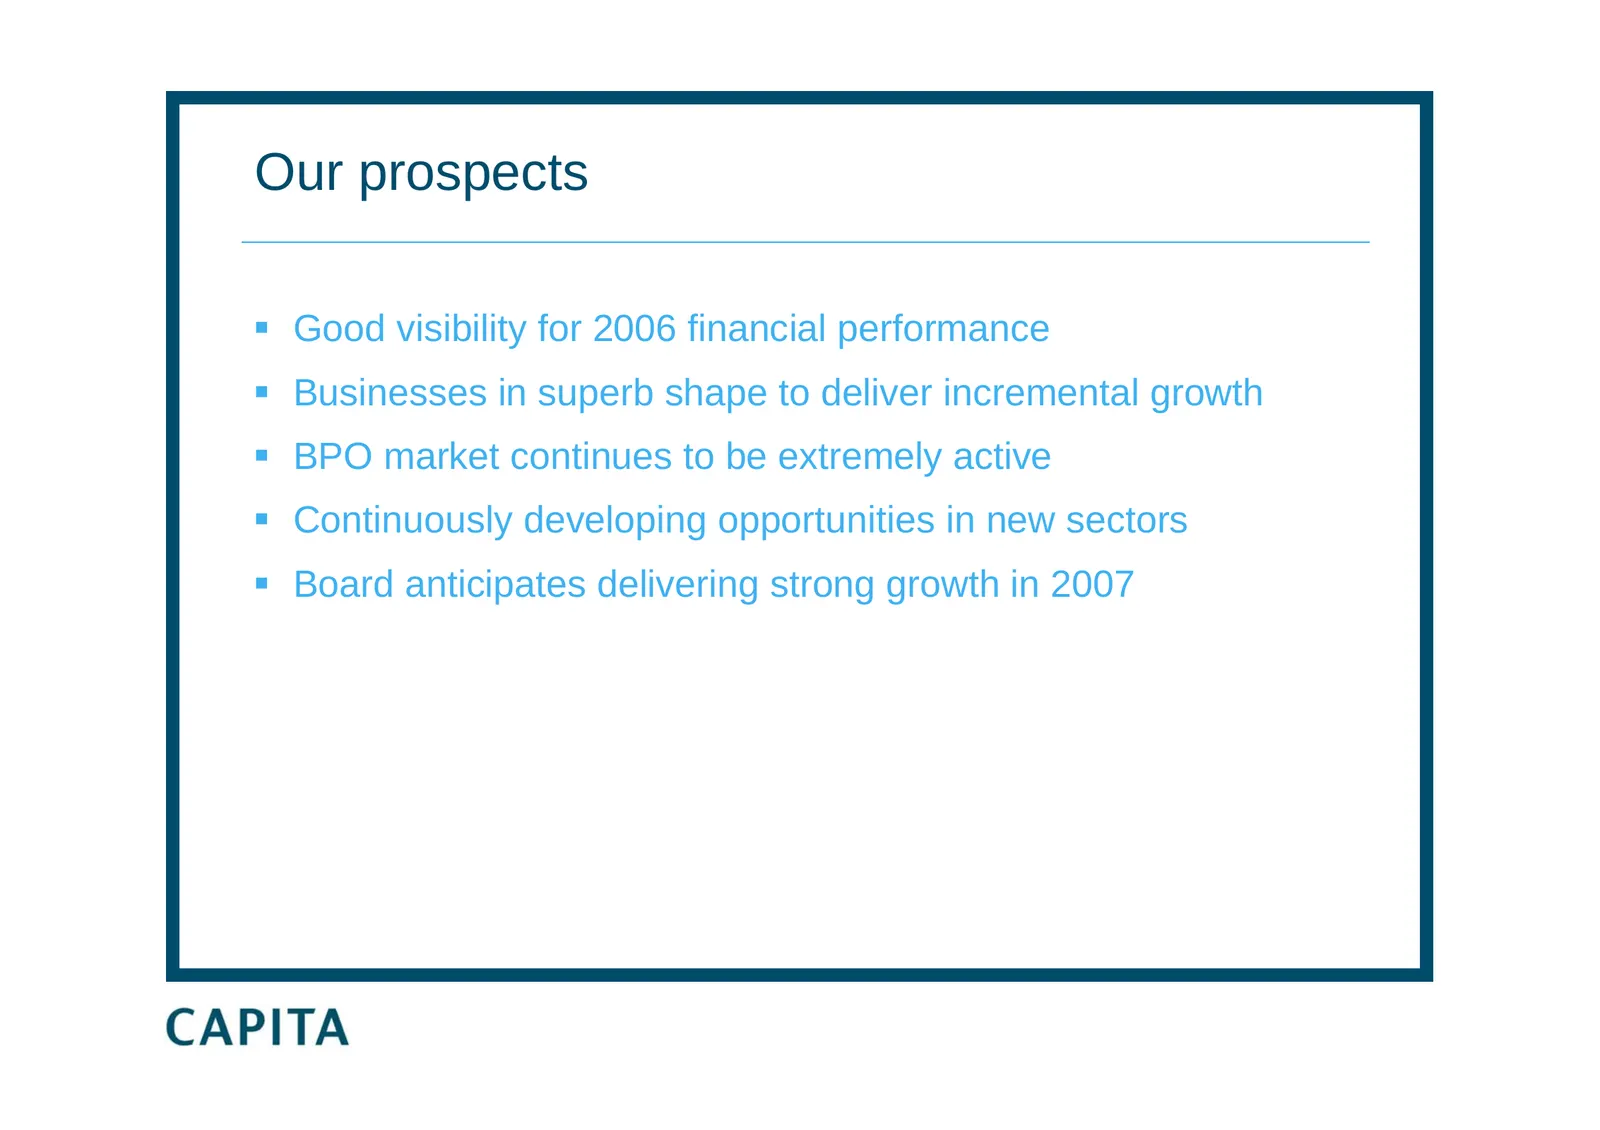
Slide 48: Our prospects
Our prospects Good visibility for 2006 financial performance Businesses in superb shape to deliver incremental growth BPO market continues to be extremely active Continuously developing opportunities in new sectors Board anticipates delivering strong growth in 2007
Slide 49: Results for the 6 months to 30 June 2006
Results for the 6 months to 30 June 2006
Source: Internet Archive copy of investors.capita.com
More decks from Capita plc
 H1 2026 Earnings Presentation44 slides · Aug 4, 2026
 FY2025 Earnings Presentation46 slides · March 2026
 Merger or Acquisition (March 2026)10 slides · March 2026
 H1 2025 Earnings Presentation51 slides · August 2025
 FY2024 Earnings Presentation44 slides · March 2025
 H1 2024 Earnings Presentation33 slides · Aug 1, 2024