Globe Life Inc. · NYSE:GL
Globe Life — Q3 2026 Earnings Presentation
25 slides from Globe Life's earnings presentation, November 2026
Slide 1: Globe Life Inc. Investor Update 3rd Quarter 2026
Globe Life Inc. Investor Update 3rd Quarter 2026
Slide 2: Notice to Recipient
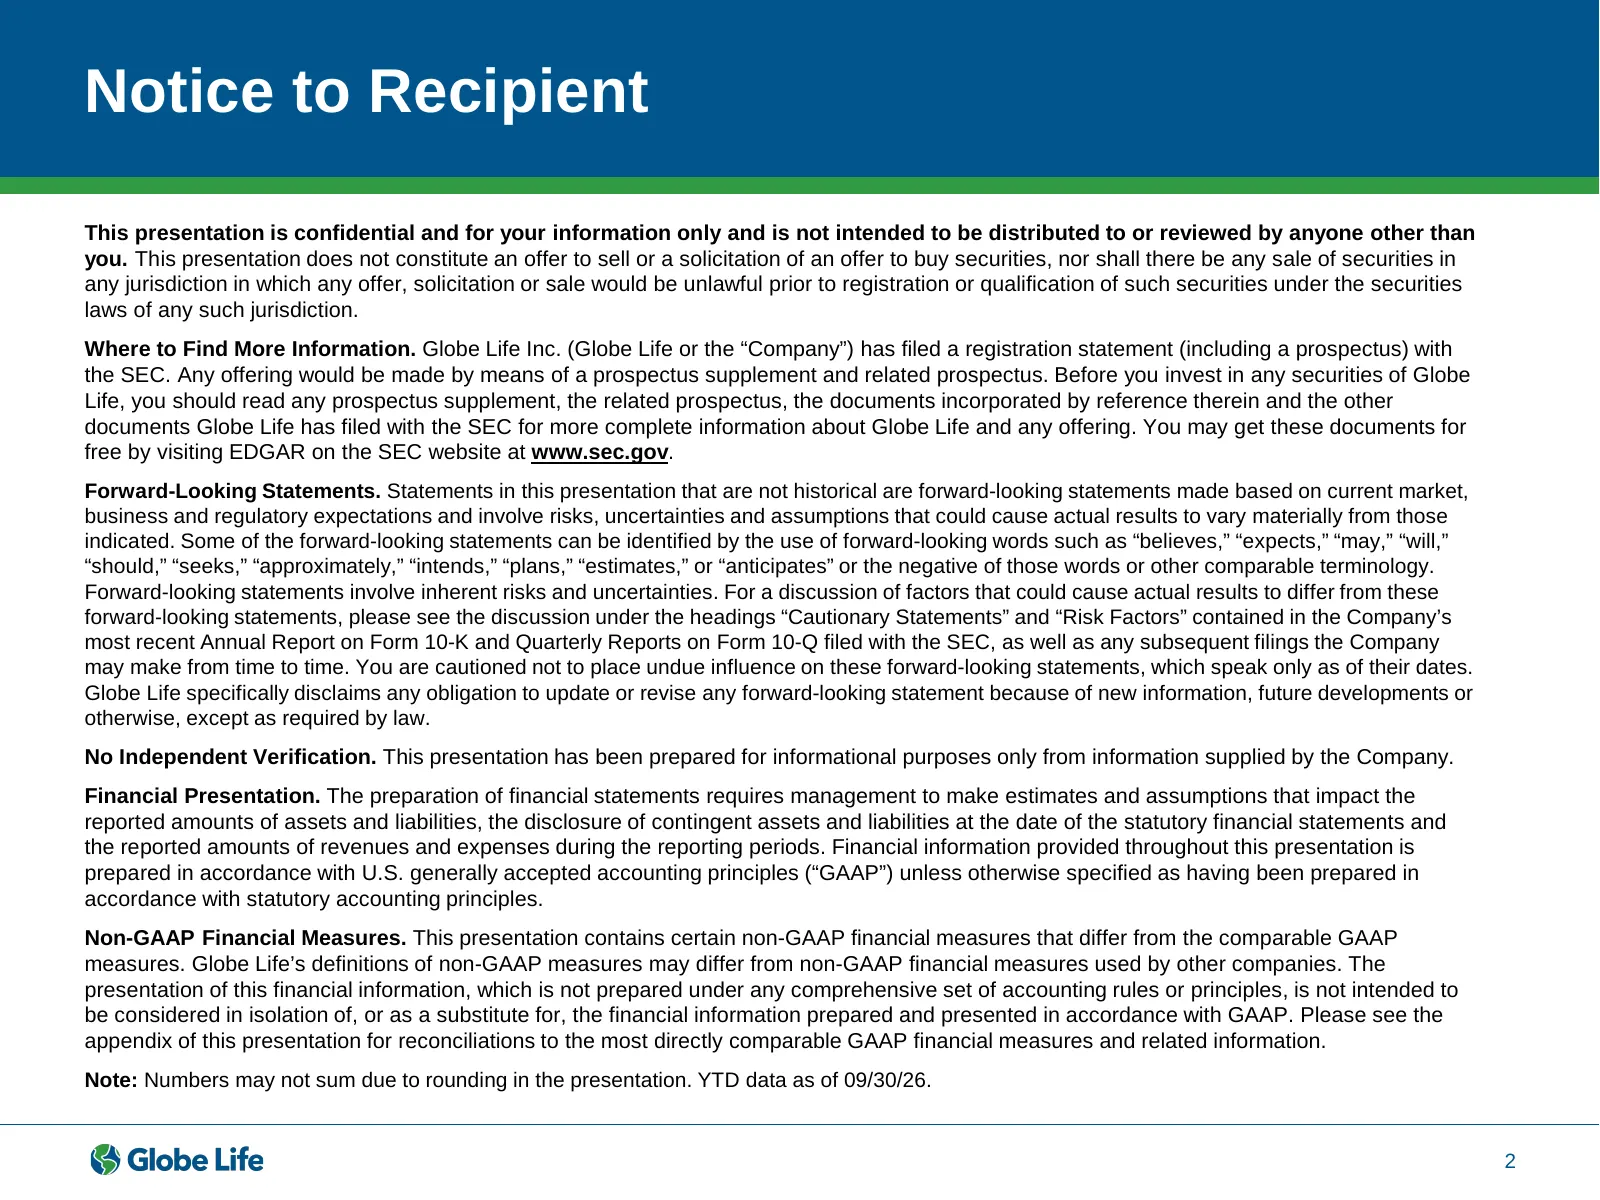
Notice to Recipient This presentation is confidential and for your information only and is not intended to be distributed to or reviewed by anyone other than you. This presentation does not constitute an offer to sell or a solicitation of an offer to buy securities, nor shall there be any sale of se
Slide 3: Consistent Growth. Every Metric. Every year.
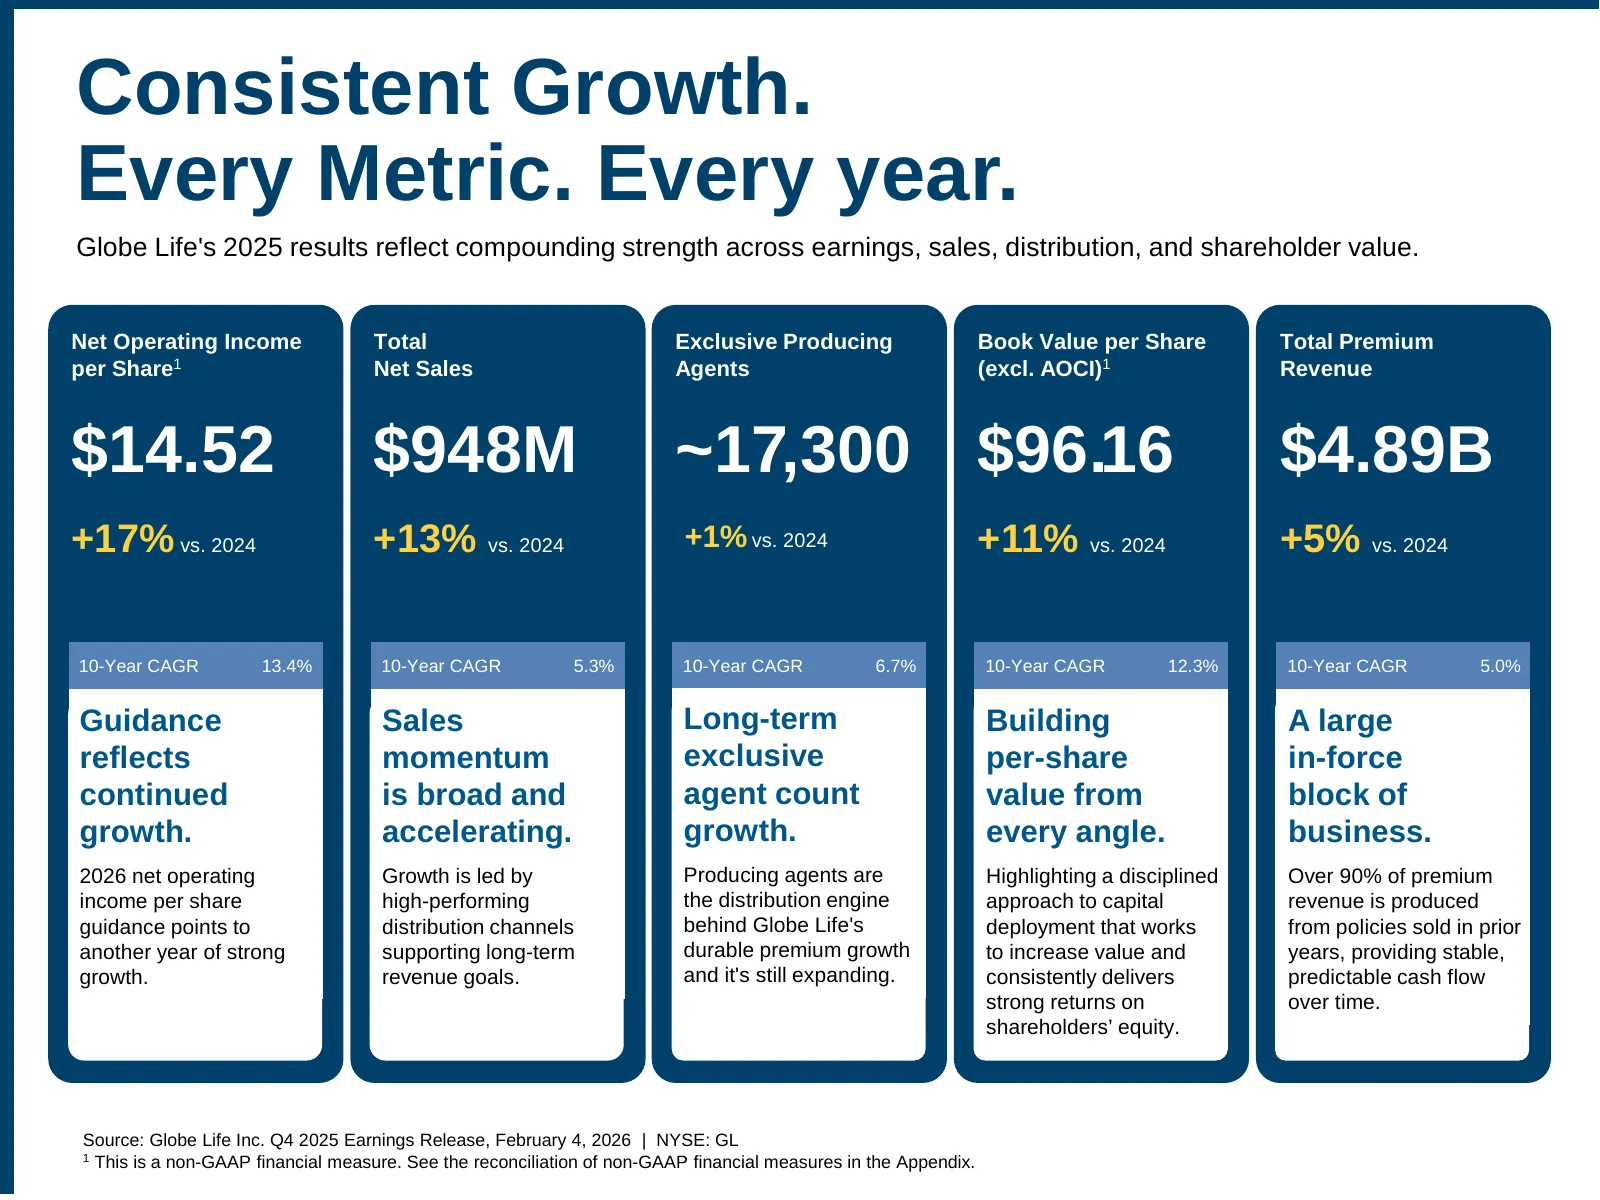
Consistent Growth. Every Metric. Every year. Globe Life's 2025 results reflect compounding strength across earnings, sales, distribution, and shareholder value. Net Operating Income Total Exclusive Producing Book Value per Share Total Premium per Share1 Net Sales Agents (excl. AOCI)1 Revenue $14.52
Slide 4: Globe Life Works to Make Tomorrow Better
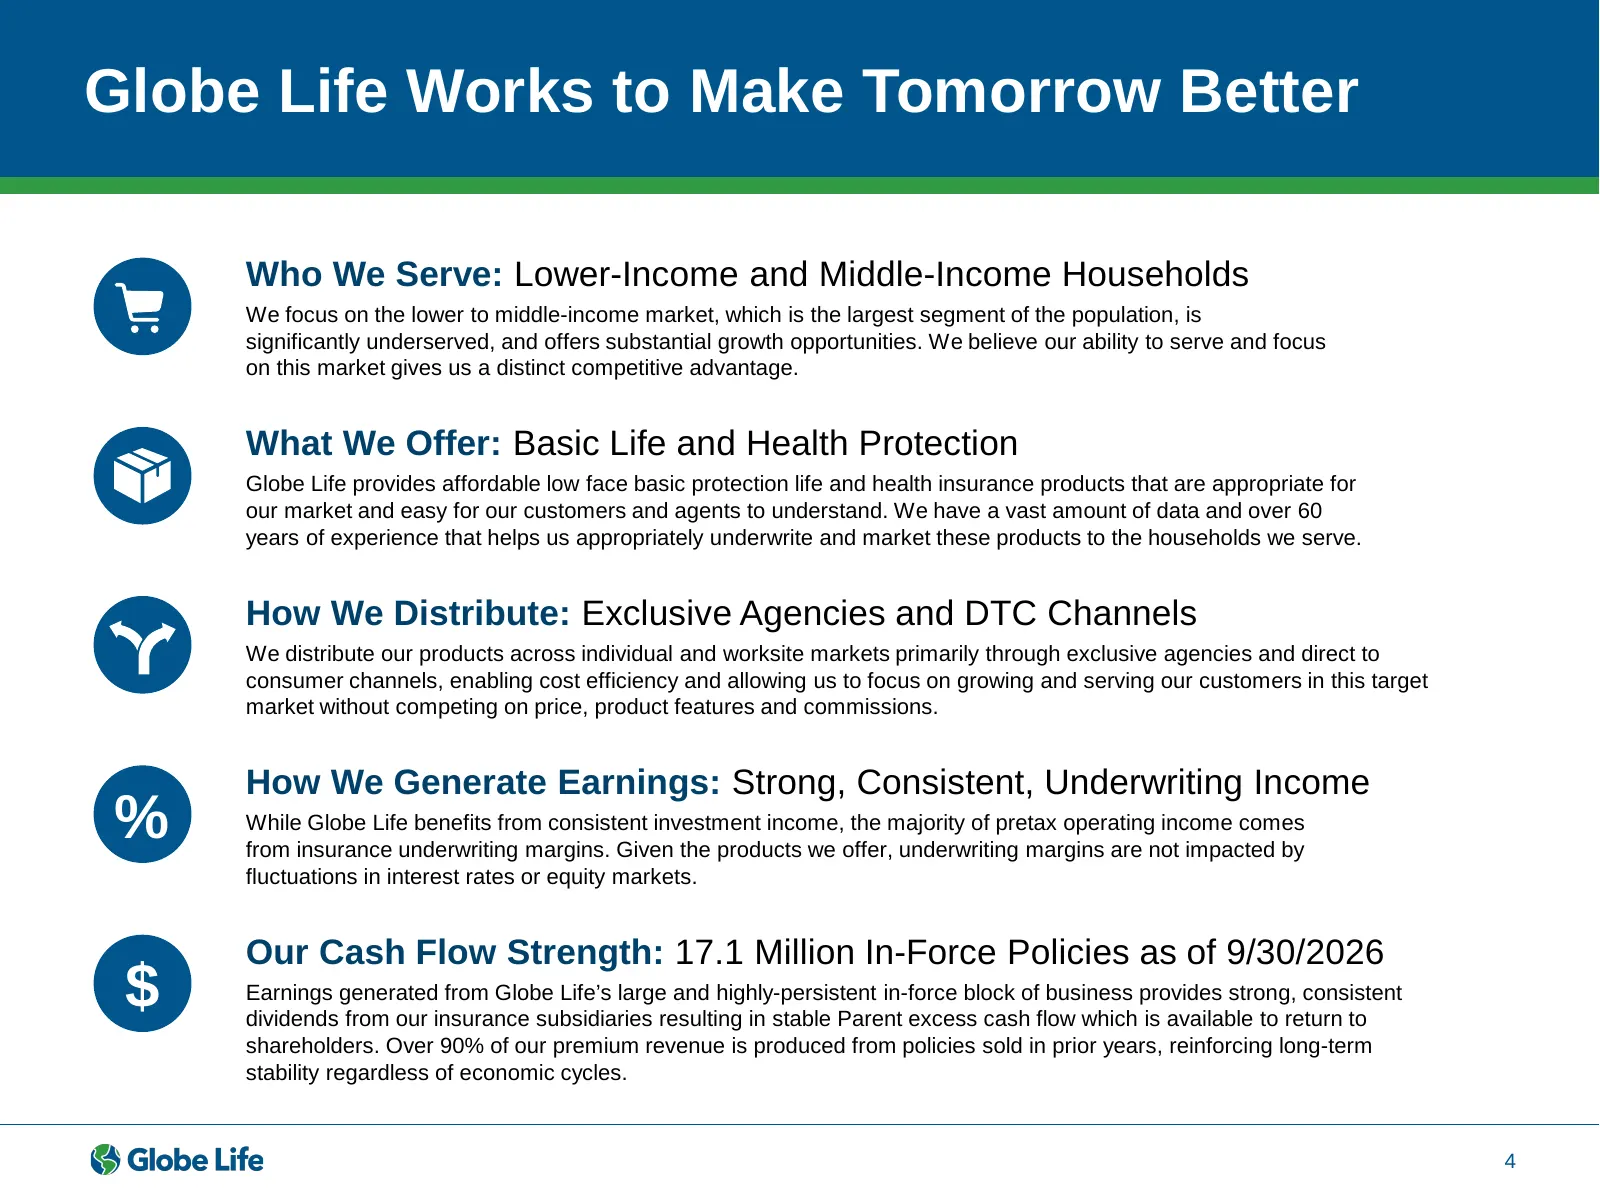
Globe Life Works to Make Tomorrow Better Who We Serve: Lower-Income and Middle-Income Households We focus on the lower to middle-income market, which is the largest segment of the population, is significantly underserved, and offers substantial growth opportunities. We believe our ability to serve a
Slide 5: Our Diversified Distribution Channels
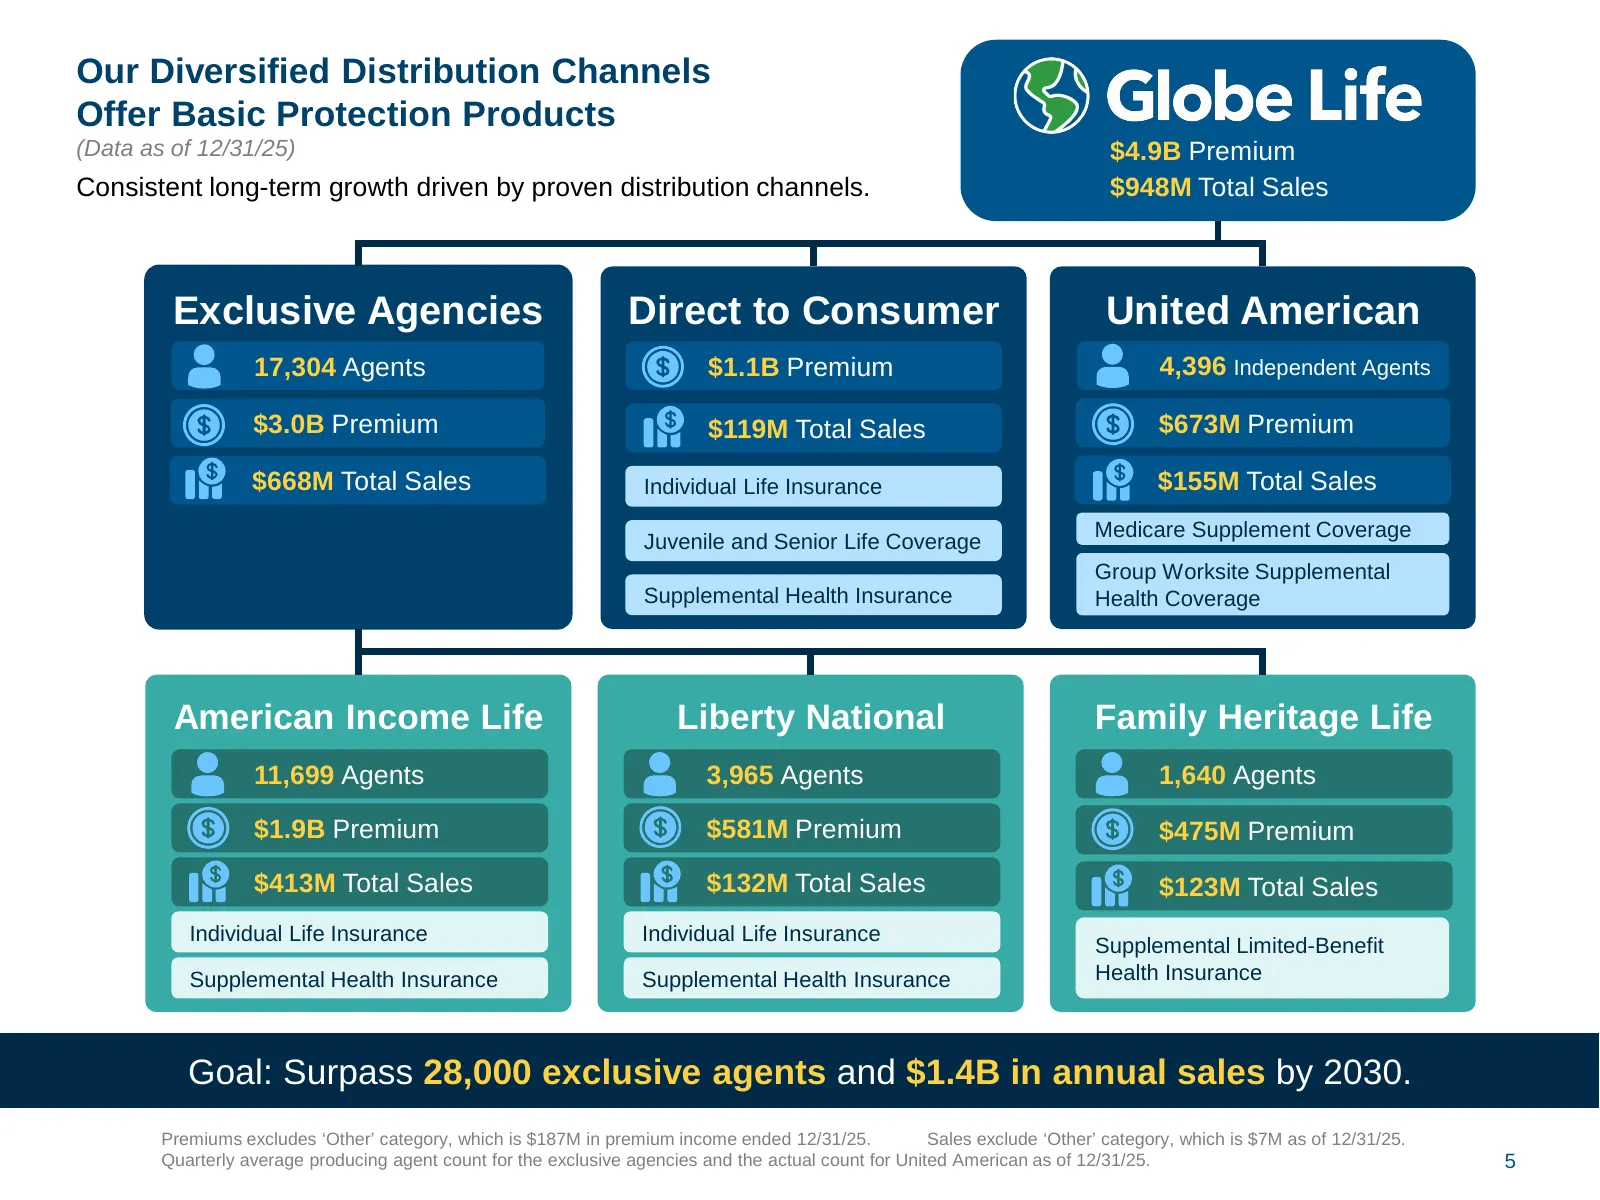
Our Diversified Distribution Channels Offer Basic Protection Products (Data as of 12/31/25) $4.9B Premium Consistent long-term growth driven by proven distribution channels. $948M Total Sales Exclusive Agencies Direct to Consumer United American 17,304 Agents $1.1B Premium 4,396 Independent Agents $
Slide 6: Stable Sales and Profitable Growth
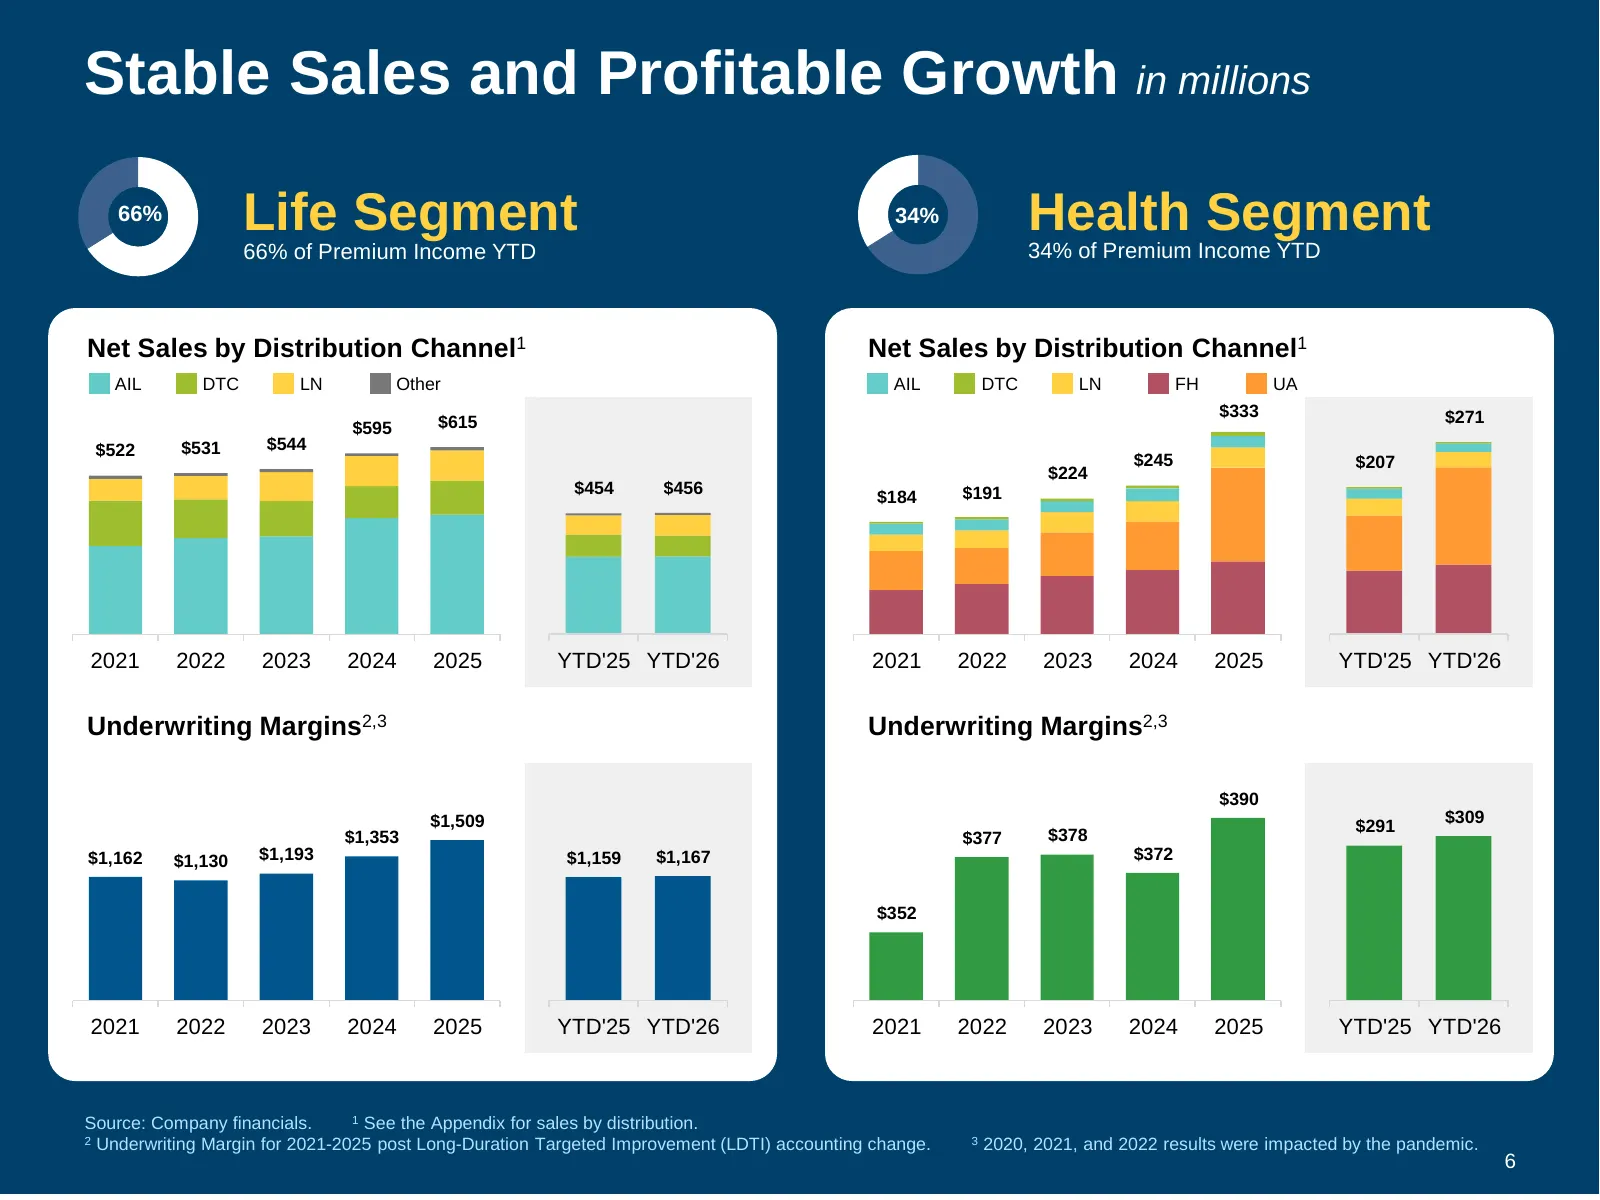
Stable Sales and Profitable Growth in millions 66% Life Segment 34% Health Segment 66% of Premium Income YTD 34% of Premium Income YTD Net Sales by Distribution Channel1 Net Sales by Distribution Channel1 AIL DTC LN Other AIL DTC LN FH UA $333 $271 $595 $615 $522 $531 $544 $245 $207 $224 $454 $456 $
Slide 7: Conservative Investment Strategy Results in Strong Investment Income
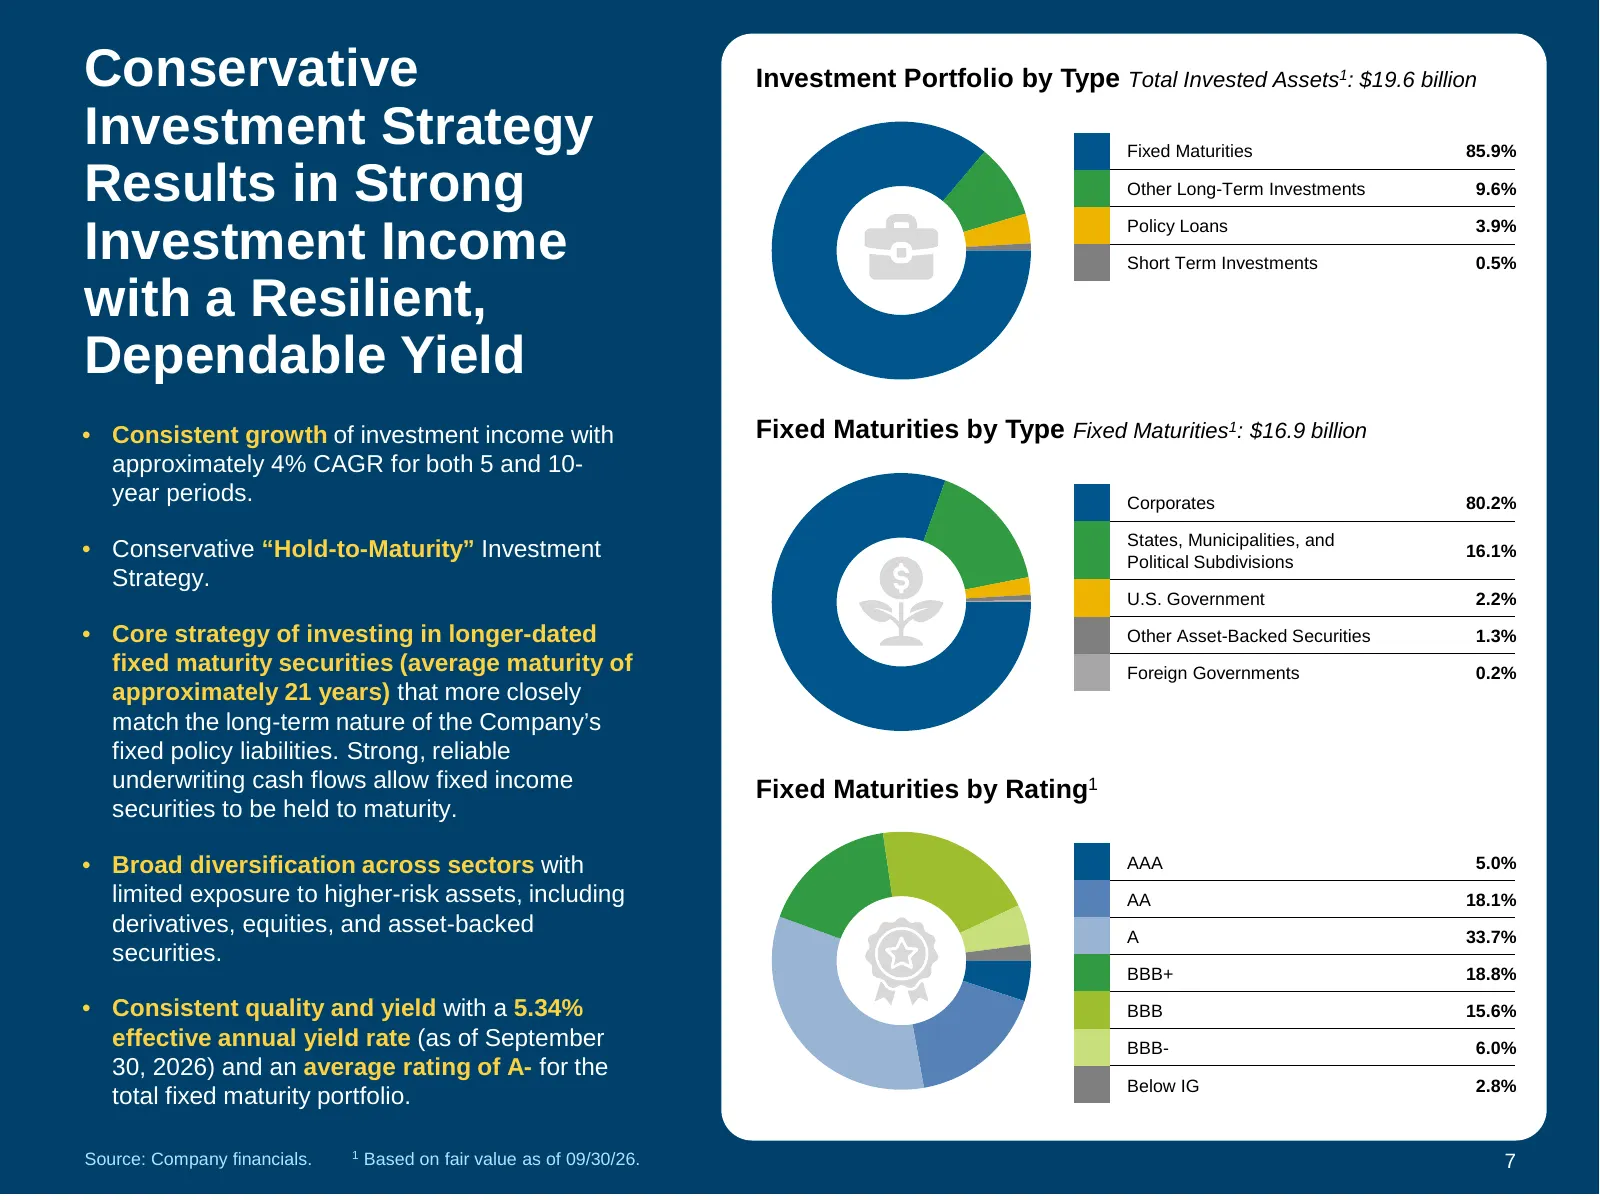
Conservative Investment Portfolio by Type Total Invested Assets1: $19.6 billion Investment Strategy Fixed Maturities 85.9% Results in Strong Other Long-Term Investments 9.6% Policy Loans 3.9% Investment Income Short Term Investments 0.5% with a Resilient, Dependable Yield • Consistent growth of inve
Slide 8: Premium Income Growth, Cost Control and Underwriting Margins Drive Earnings and EPS Growth
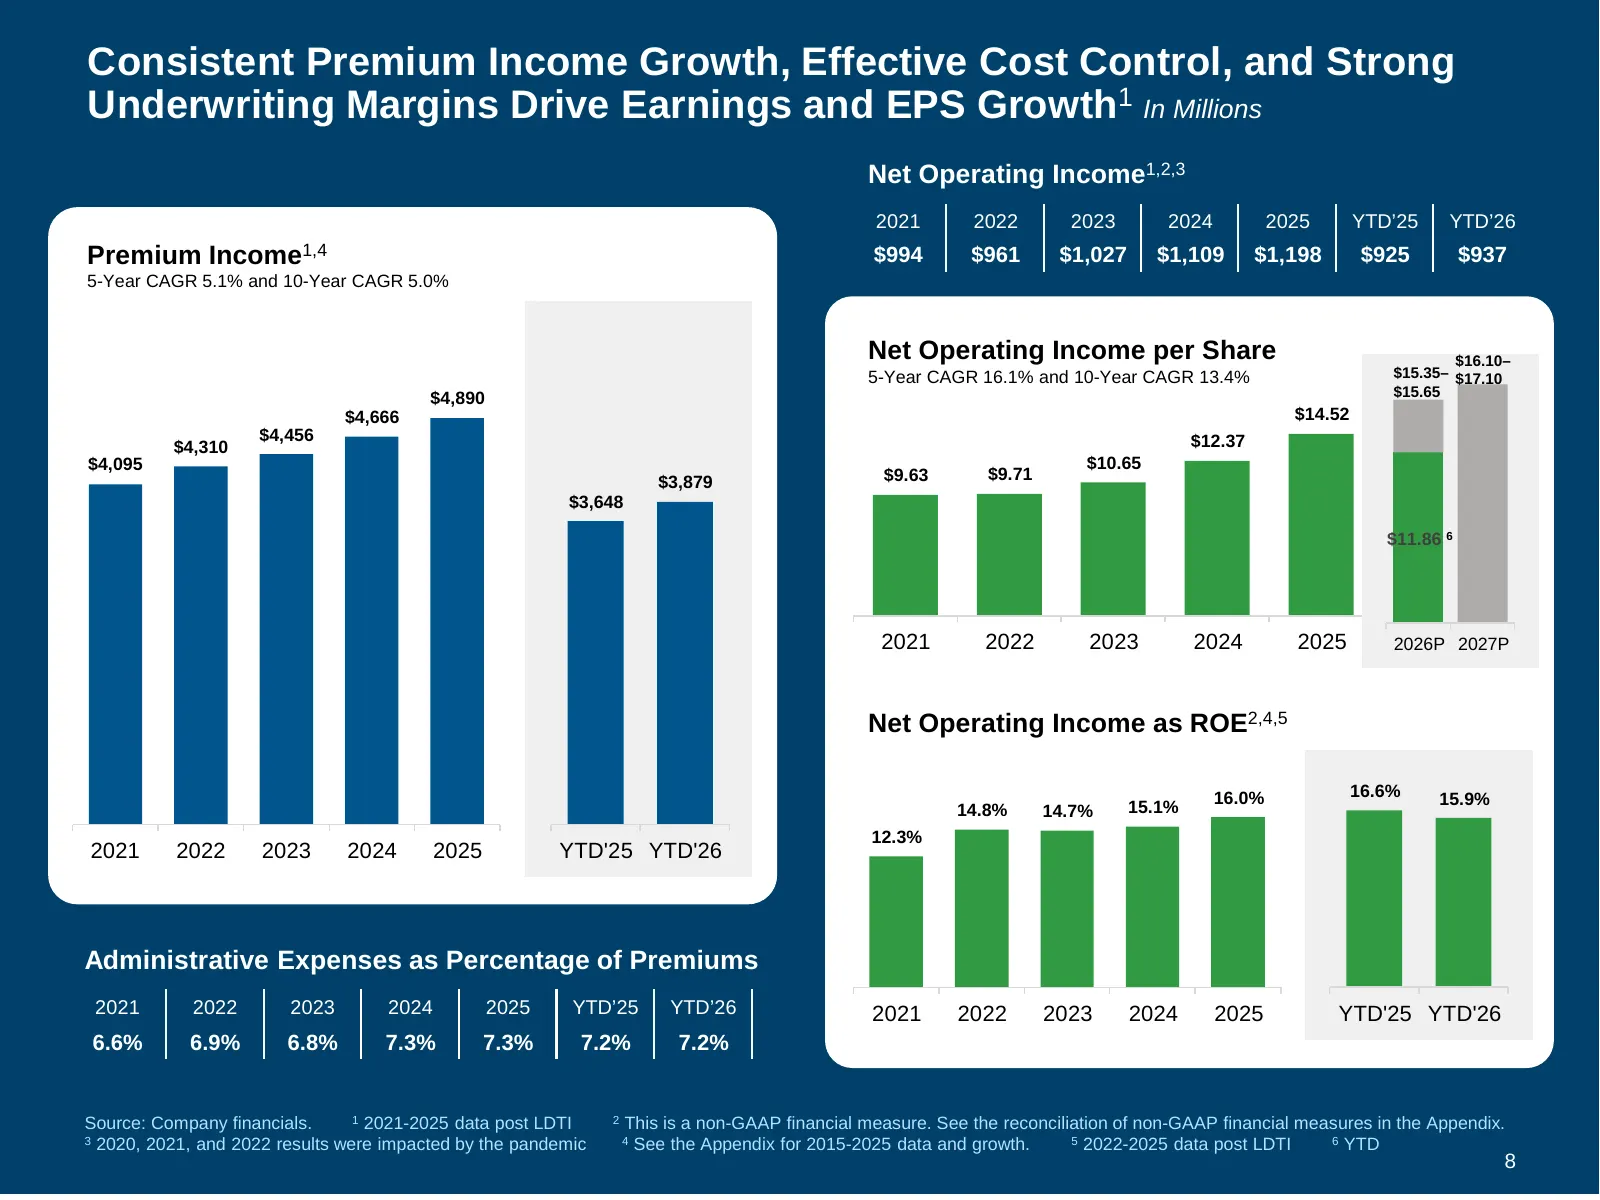
Consistent Premium Income Growth, Effective Cost Control, and Strong Underwriting Margins Drive Earnings and EPS Growth1 In Millions Net Operating Income1,2,3 2021 2022 2023 2024 2025 YTD’25 YTD’26 Premium Income1,4 $994 $961 $1,027 $1,109 $1,198 $925 $937 5-Year CAGR 5.1% and 10-Year CAGR 5.0% Net
Slide 9: Consistent Excess Cash Flows
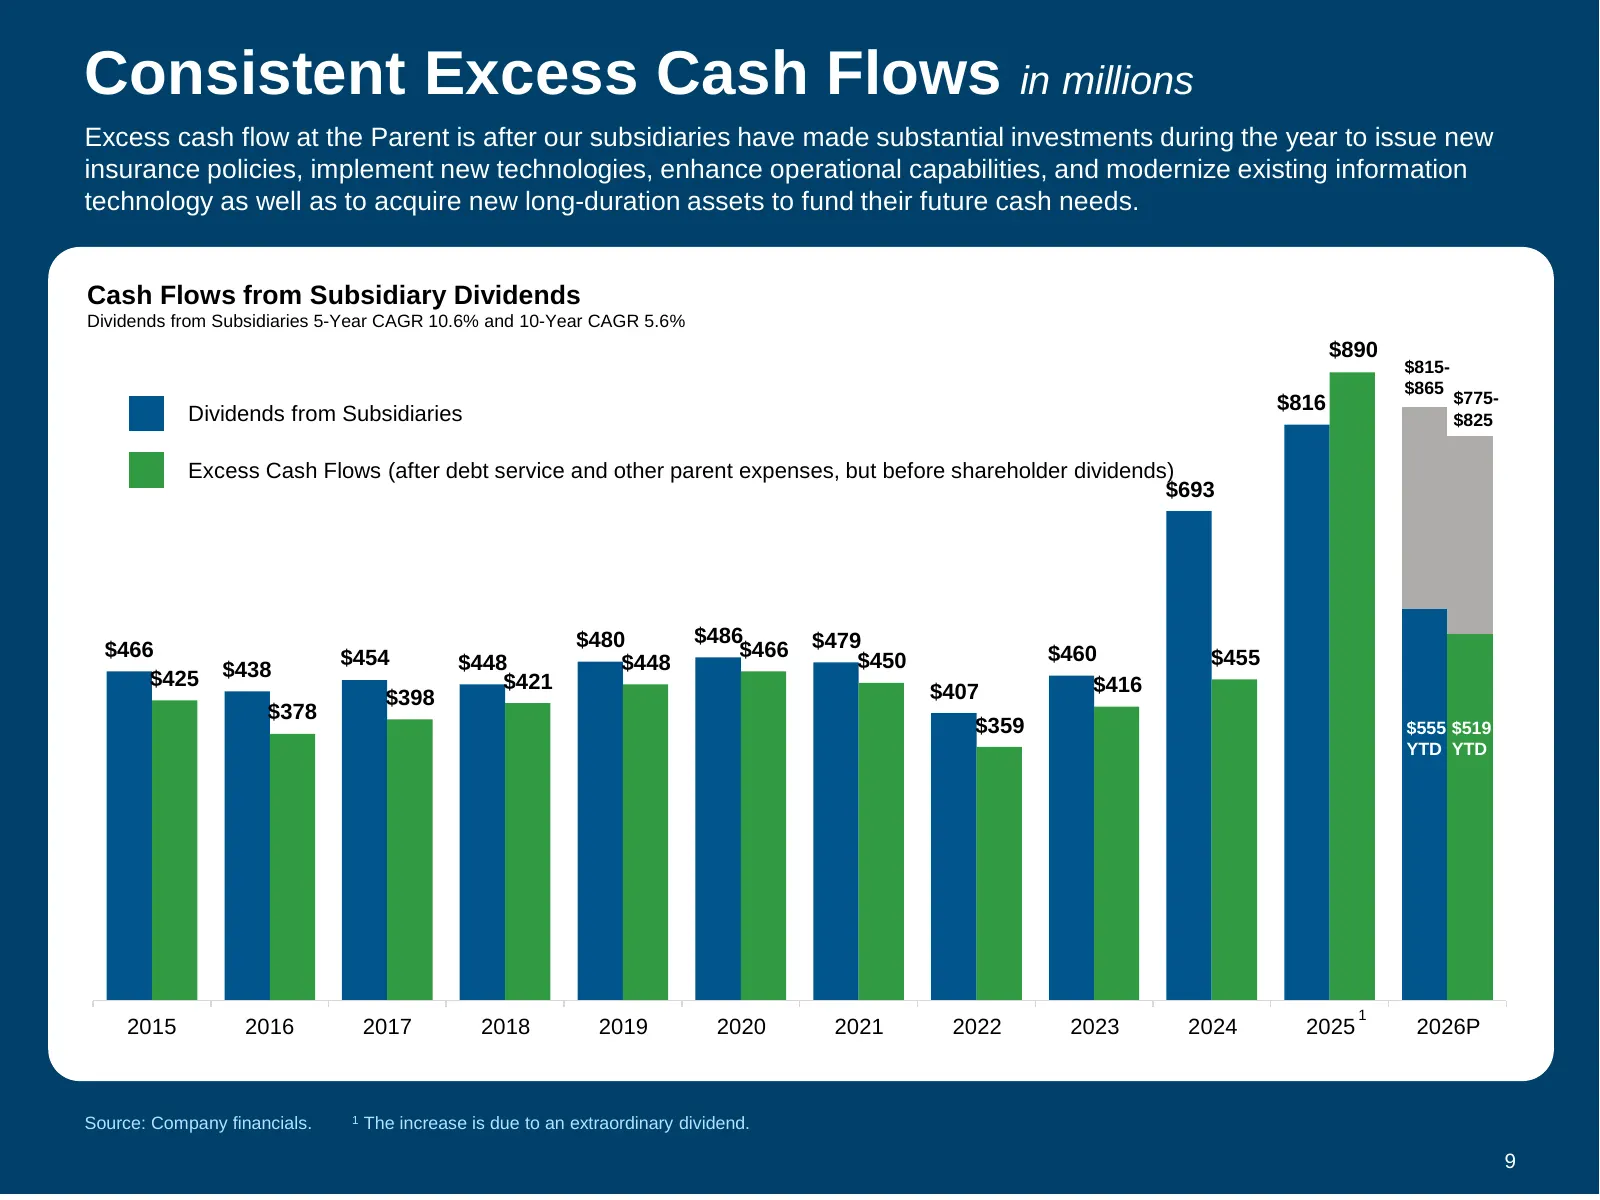
Consistent Excess Cash Flows in millions Excess cash flow at the Parent is after our subsidiaries have made substantial investments during the year to issue new insurance policies, implement new technologies, enhance operational capabilities, and modernize existing information technology as well as
Slide 10: Strong Share Repurchases and Shareholder Dividends
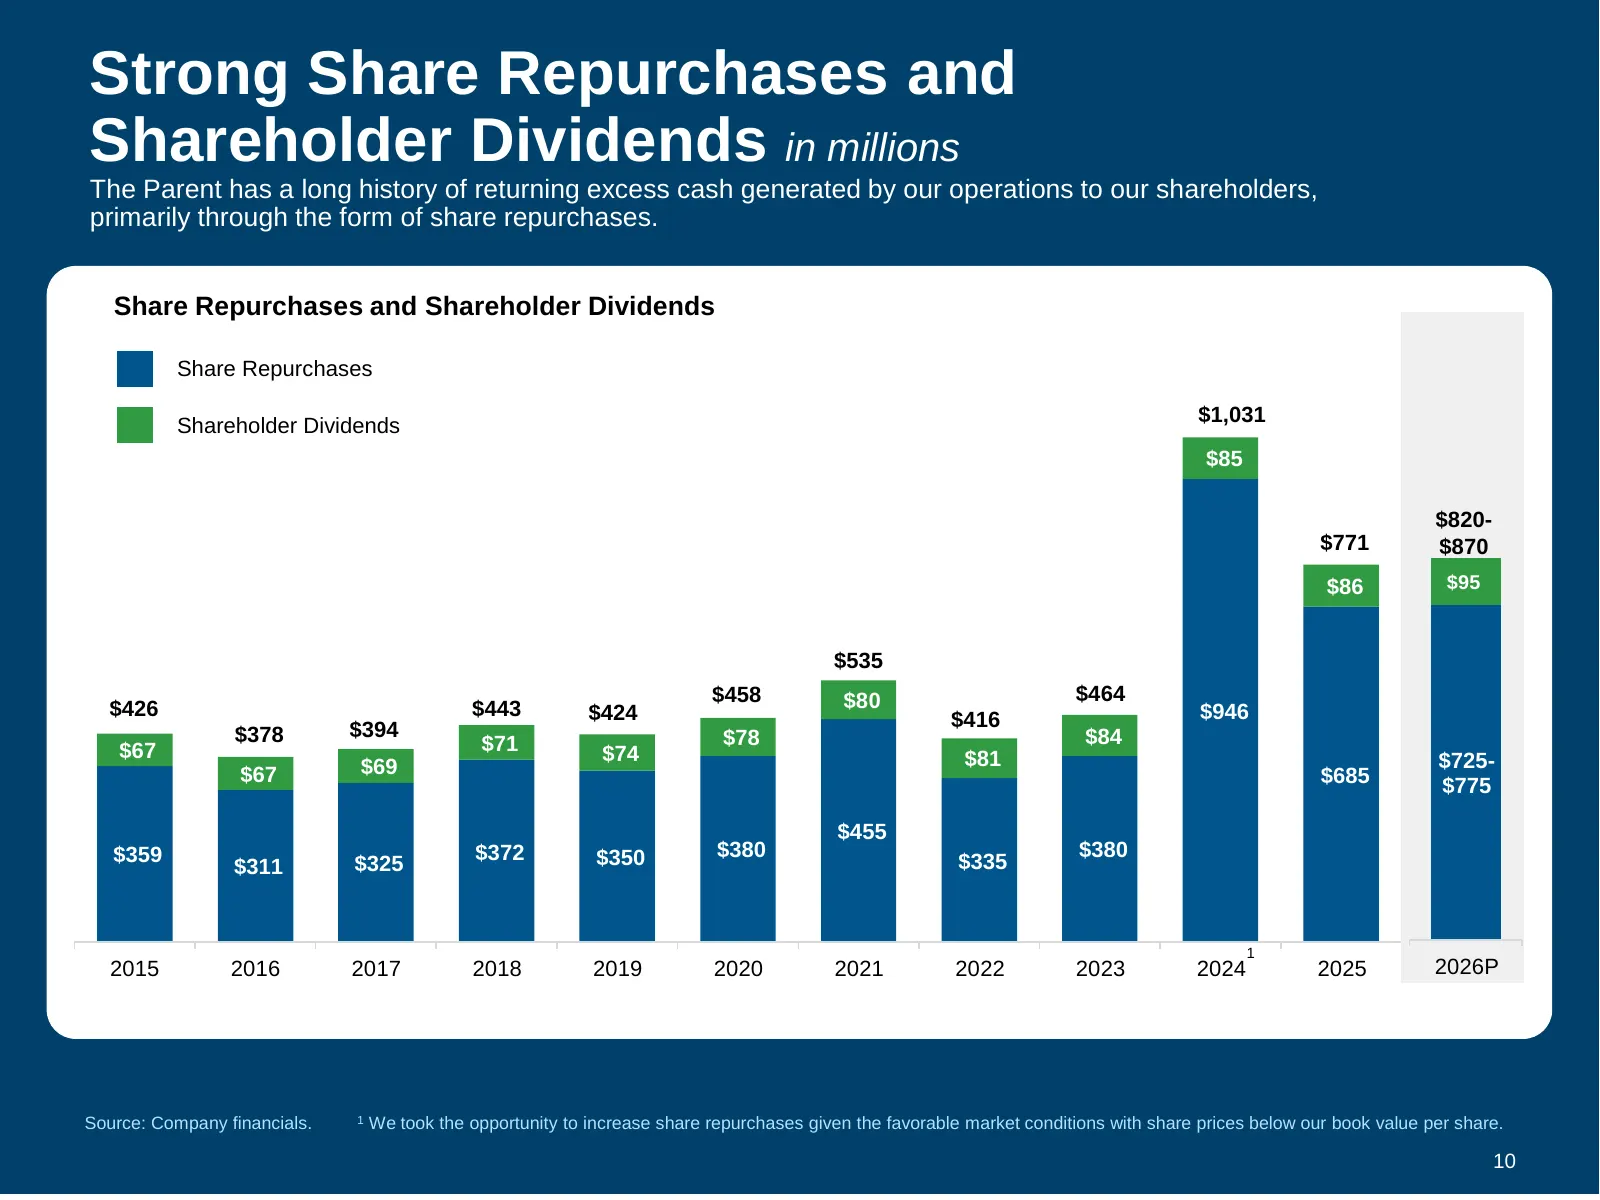
Strong Share Repurchases and Shareholder Dividends in millions The Parent has a long history of returning excess cash generated by our operations to our shareholders, primarily through the form of share repurchases. Share Repurchases and Shareholder Dividends Share Repurchases $1,031 Shareholder Div
Slide 11: Strong Capital Structure and Balance Sheet
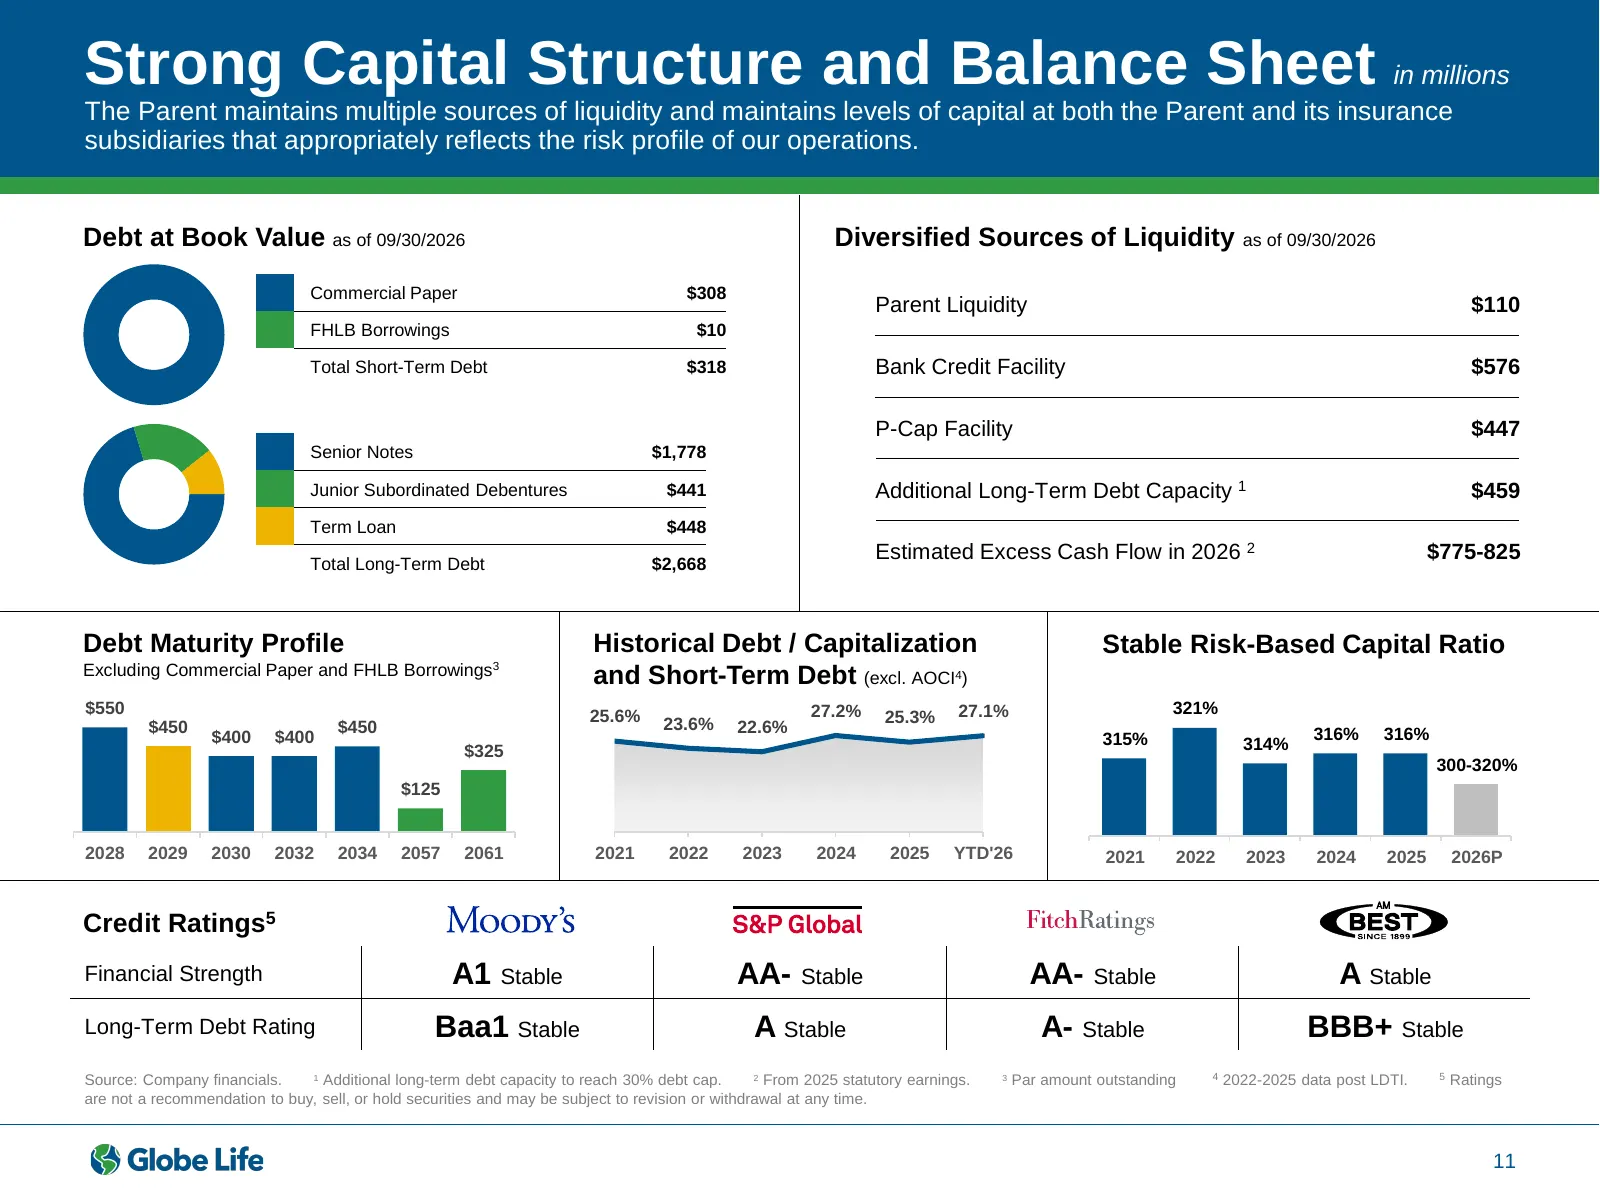
Strong Capital Structure and Balance Sheet in millions The Parent maintains multiple sources of liquidity and maintains levels of capital at both the Parent and its insurance subsidiaries that appropriately reflects the risk profile of our operations. Debt at Book Value as of 09/30/2026 Diversified
Slide 12: Appendix
Appendix
Slide 13: Selected Financial Metrics
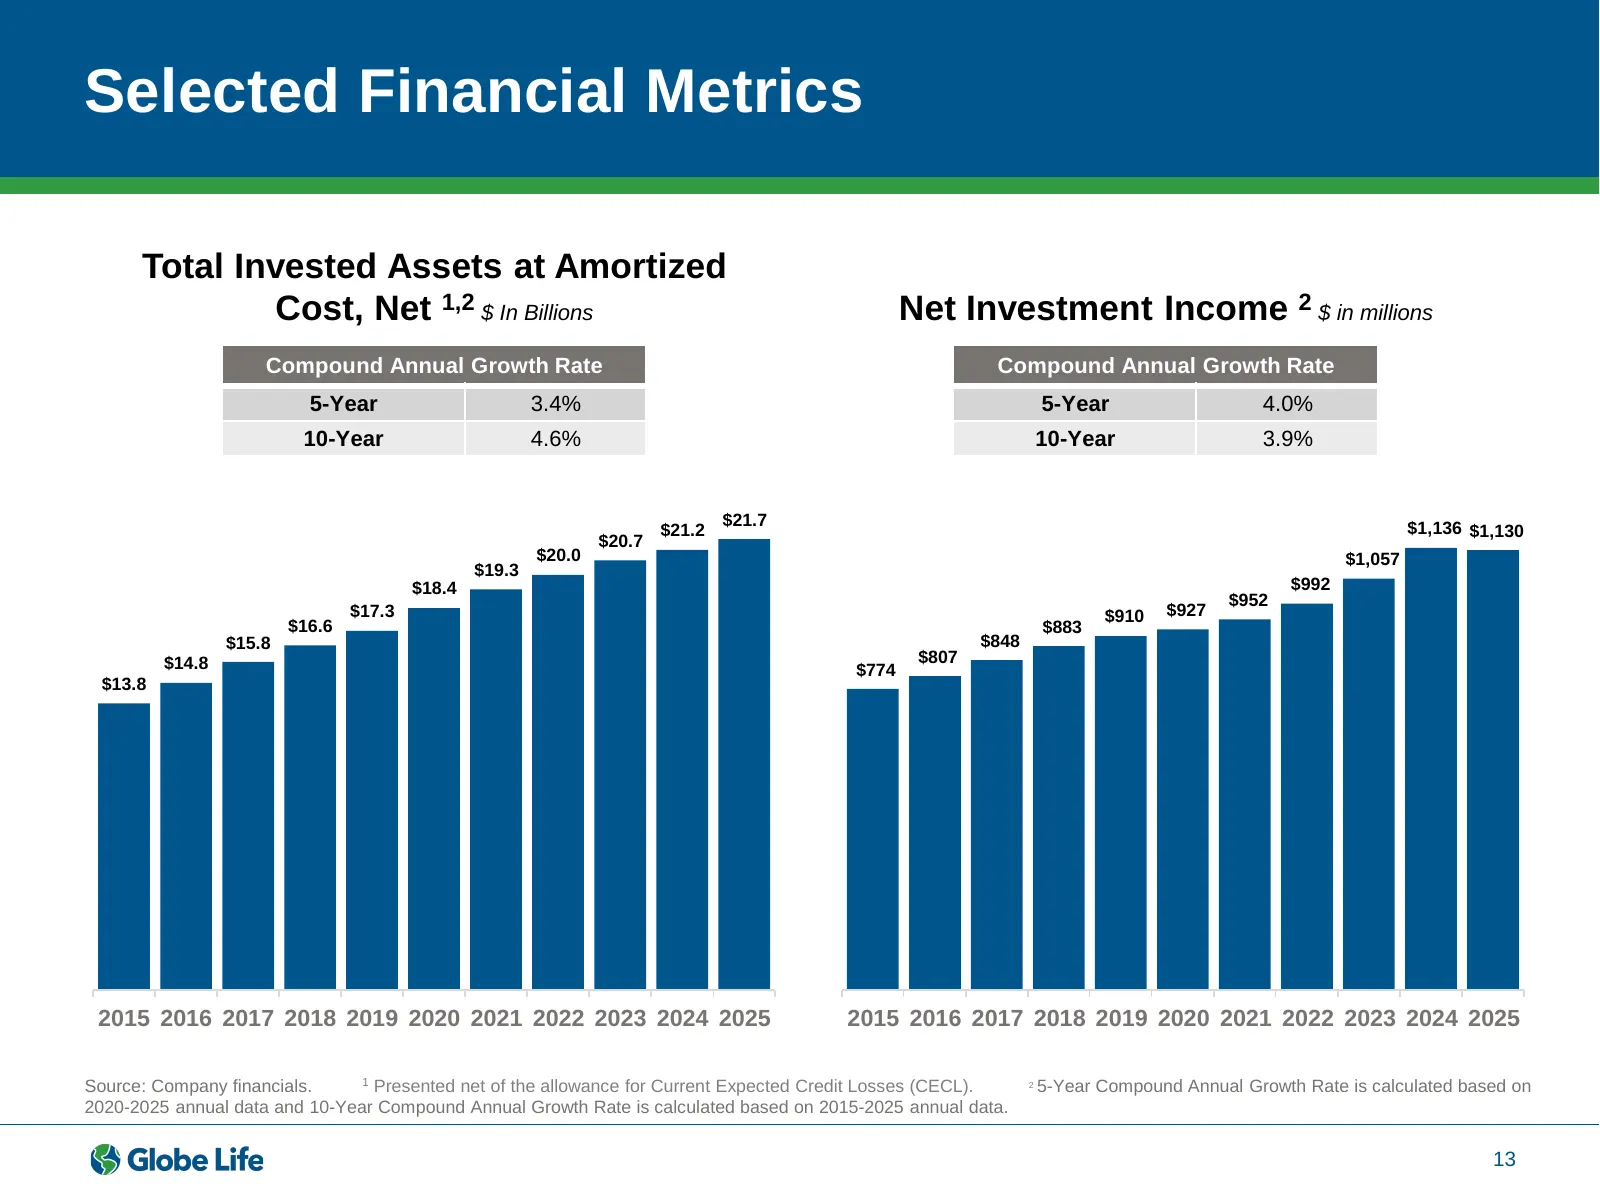
Selected Financial Metrics Total Invested Assets at Amortized Cost, Net 1,2 $ In Billions Net Investment Income 2 $ in millions Compound Annual Growth Rate Compound Annual Growth Rate 5-Year 3.4% 5-Year 4.0% 10-Year 4.6% 10-Year 3.9% $21.7 $1,136 $1,130 $21.2 $20.7 $20.0 $1,057 $19.3 $18.4 $992 $952
Slide 14: Selected Financial Metrics (Cont'd)
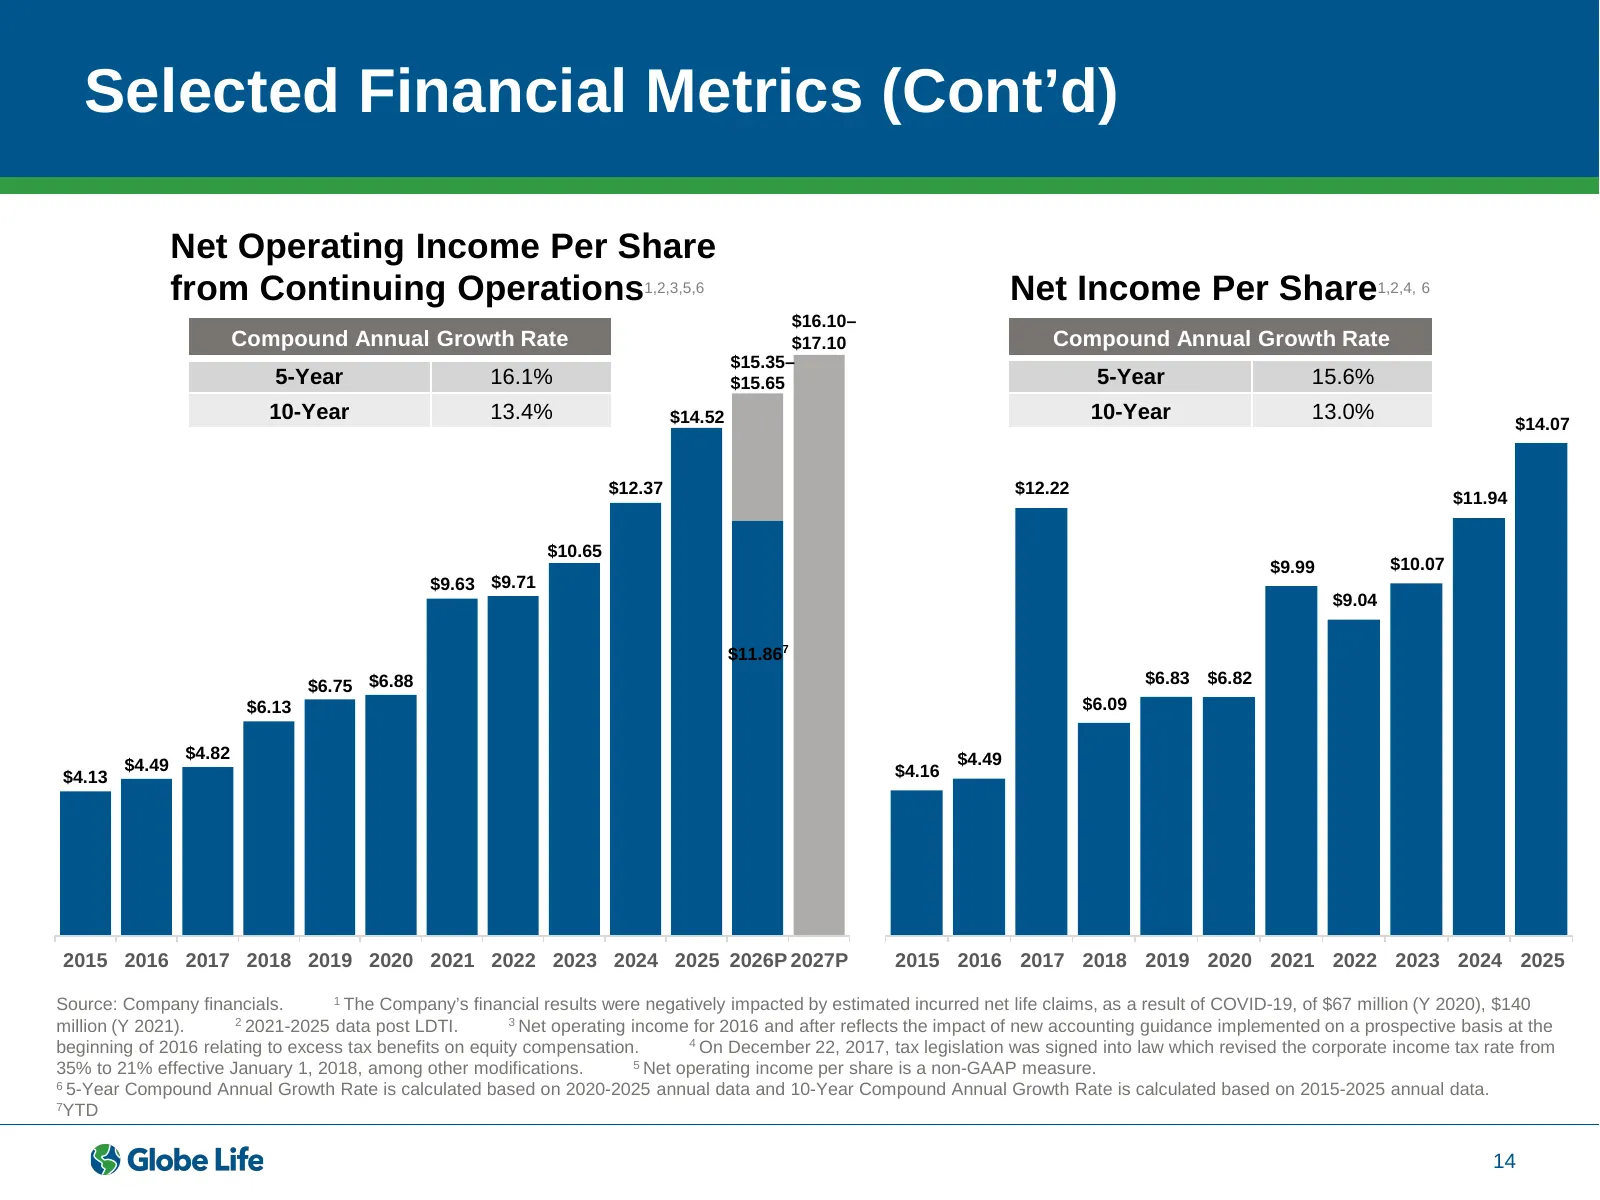
Selected Financial Metrics (Cont’d) Net Operating Income Per Share from Continuing Operations1,2,3,5,6 Net Income Per Share1,2,4, 6 $16.10– Compound Annual Growth Rate $17.10 Compound Annual Growth Rate $15.35– 5-Year 16.1% $15.65 5-Year 15.6% 10-Year 13.4% $14.52 10-Year 13.0% $14.07 $12.37 $12.22
Slide 15: Selected Financial Metrics (Cont'd)
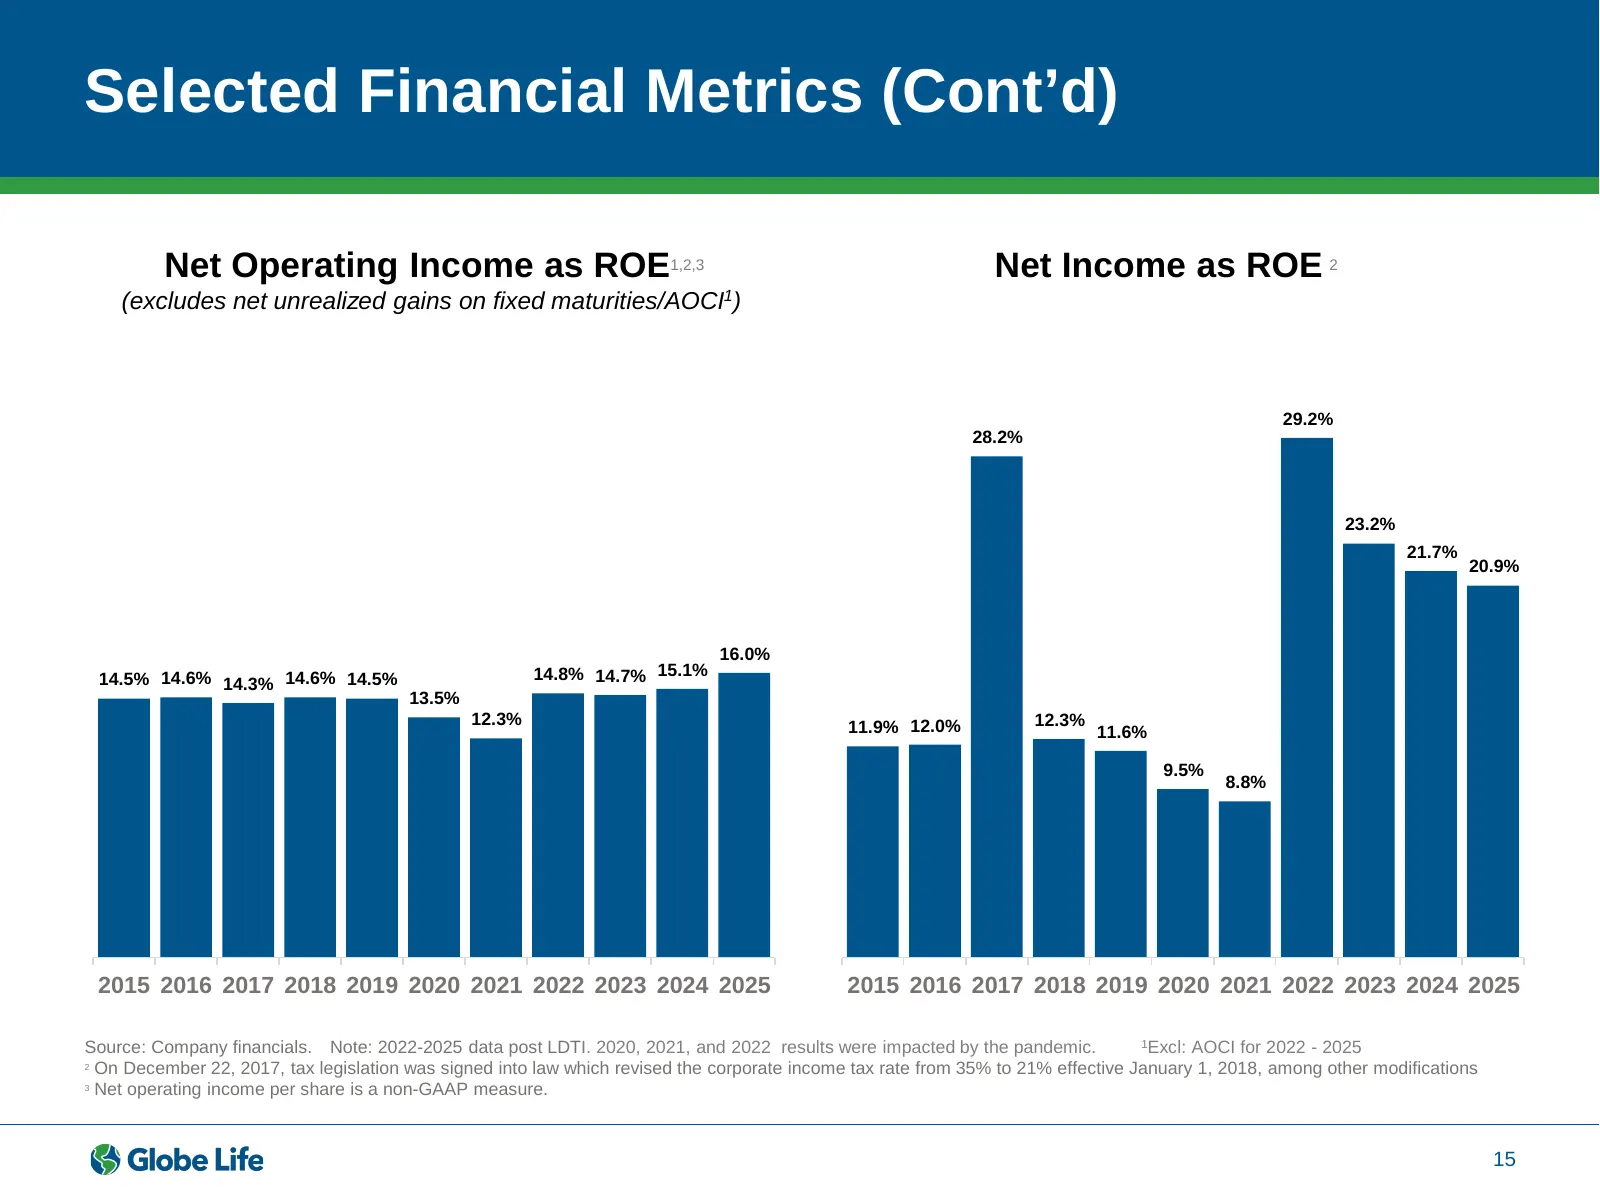
Selected Financial Metrics (Cont’d) Net Operating Income as ROE1,2,3 Net Income as ROE 2 (excludes net unrealized gains on fixed maturities/AOCI1) 29.2% 28.2% 23.2% 21.7% 20.9% 16.0% 14.5% 14.6% 14.3% 14.6% 14.5% 14.8% 14.7% 15.1% 13.5% 12.3% 11.9% 12.0% 12.3% 11.6% 9.5% 8.8% 2015 2016 2017 2018 201
Slide 16: Selected Financial Metrics (Cont'd)
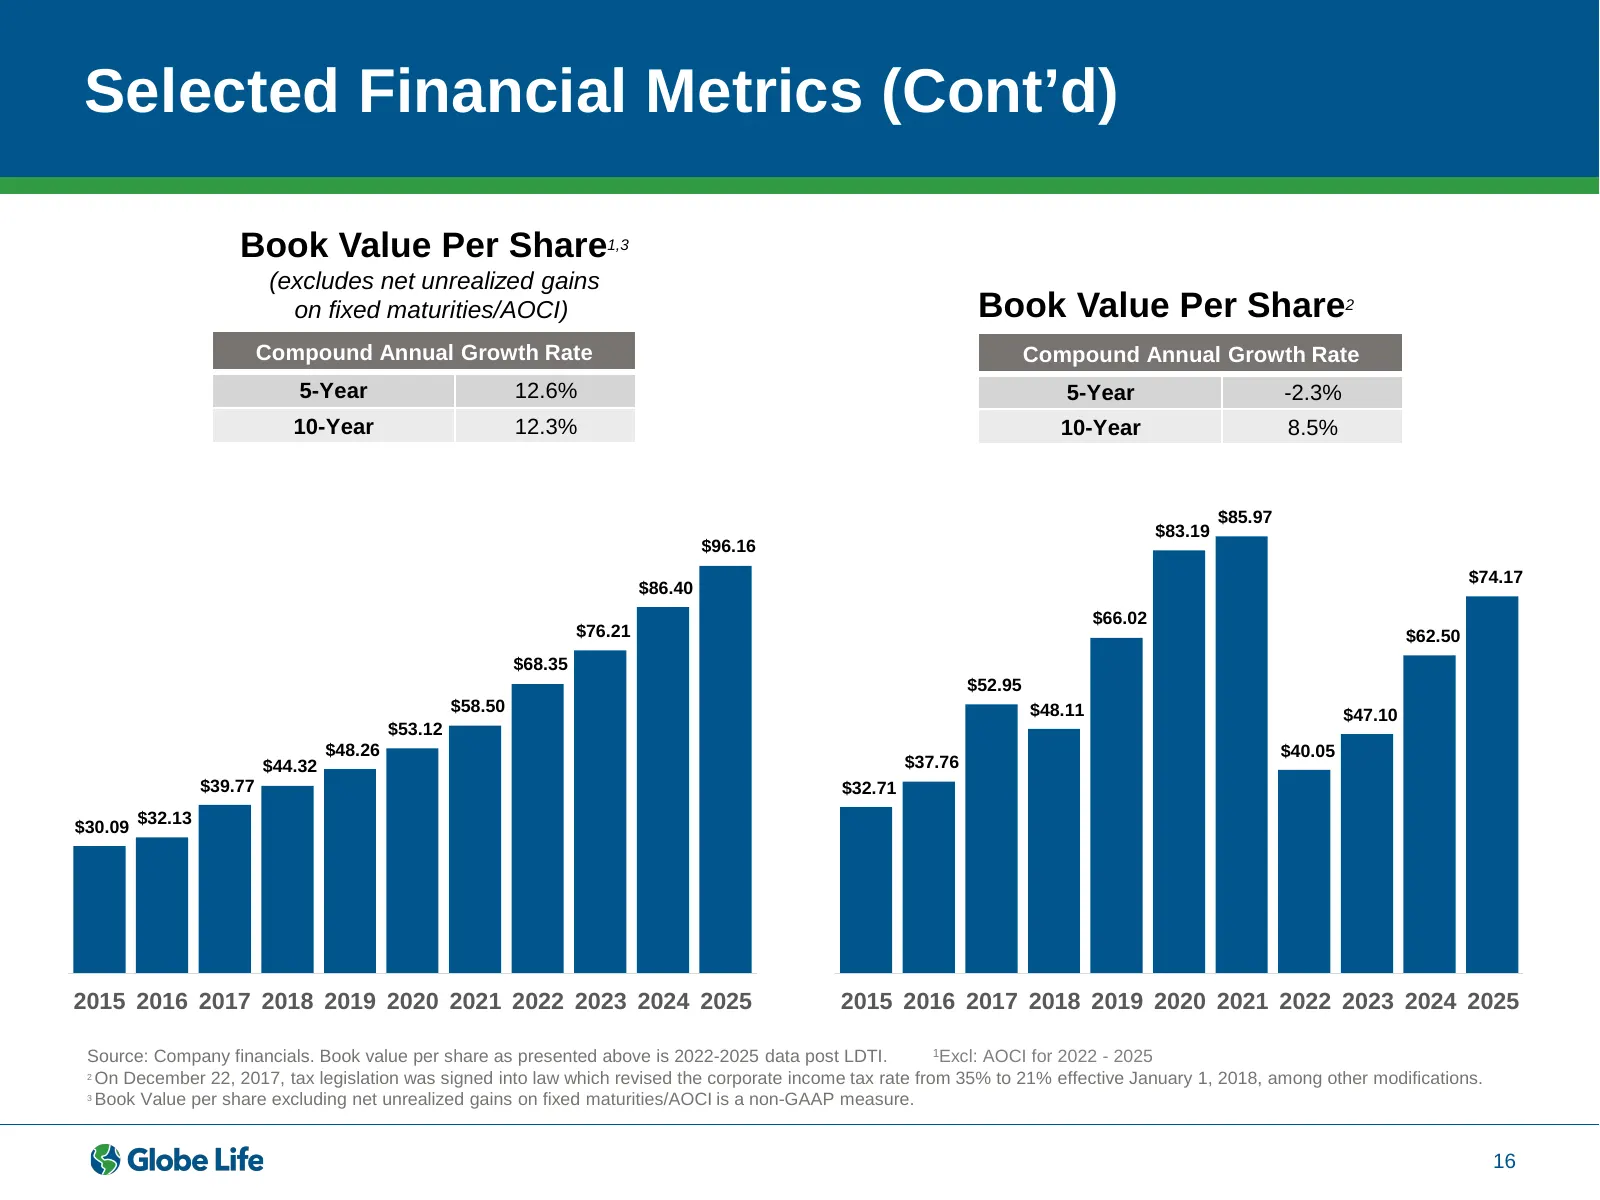
Selected Financial Metrics (Cont’d) Book Value Per Share1,3 (excludes net unrealized gains on fixed maturities/AOCI) Book Value Per Share2 Compound Annual Growth Rate Compound Annual Growth Rate 5-Year 12.6% 5-Year -2.3% 10-Year 12.3% 10-Year 8.5% $85.97 $83.19 $96.16 $74.17 $86.40 $66.02 $76.21 $62
Slide 17: Selected Financial Metrics (Cont'd)
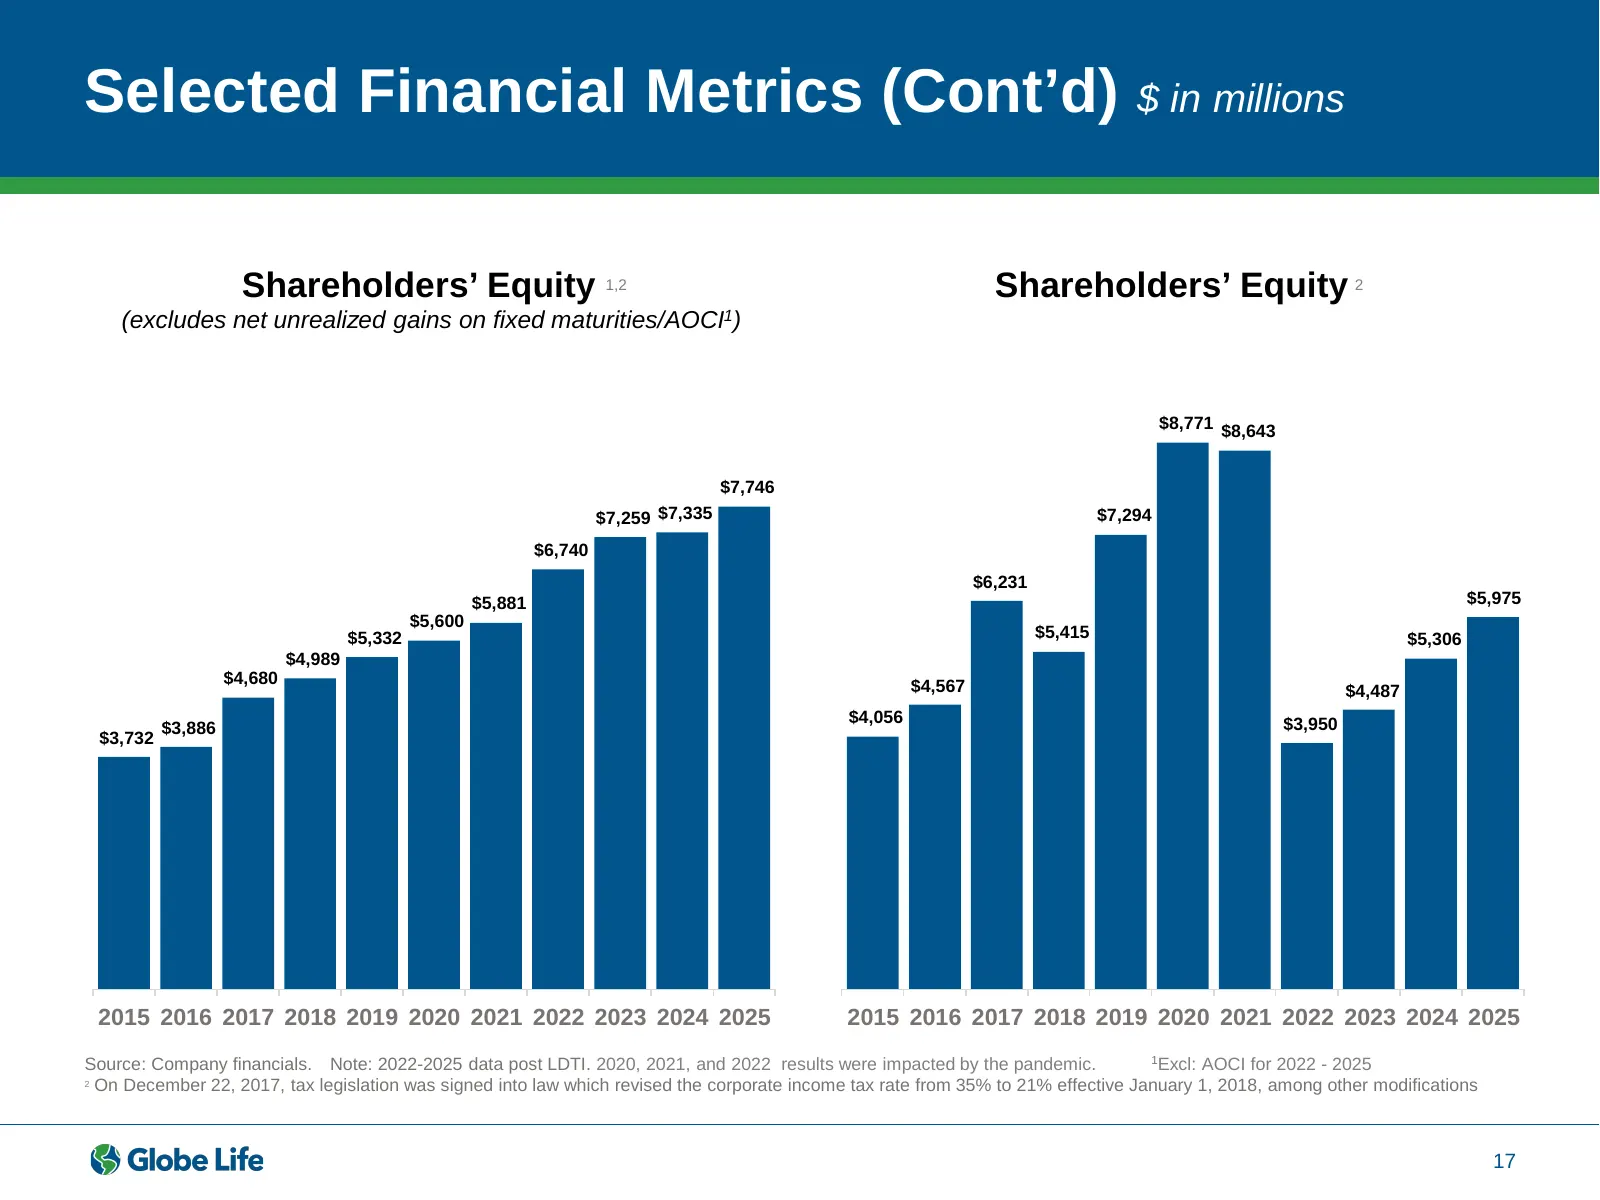
Selected Financial Metrics (Cont’d) $ in millions Shareholders’ Equity 1,2 Shareholders’ Equity 2 (excludes net unrealized gains on fixed maturities/AOCI1) $8,771 $8,643 $7,746 $7,259 $7,335 $7,294 $6,740 $6,231 $5,881 $5,975 $5,600 $5,332 $5,415 $5,306 $4,989 $4,680 $4,567 $4,487 $4,056 $3,950 $3,8
Slide 18: Selected Financial Metrics (Cont'd)
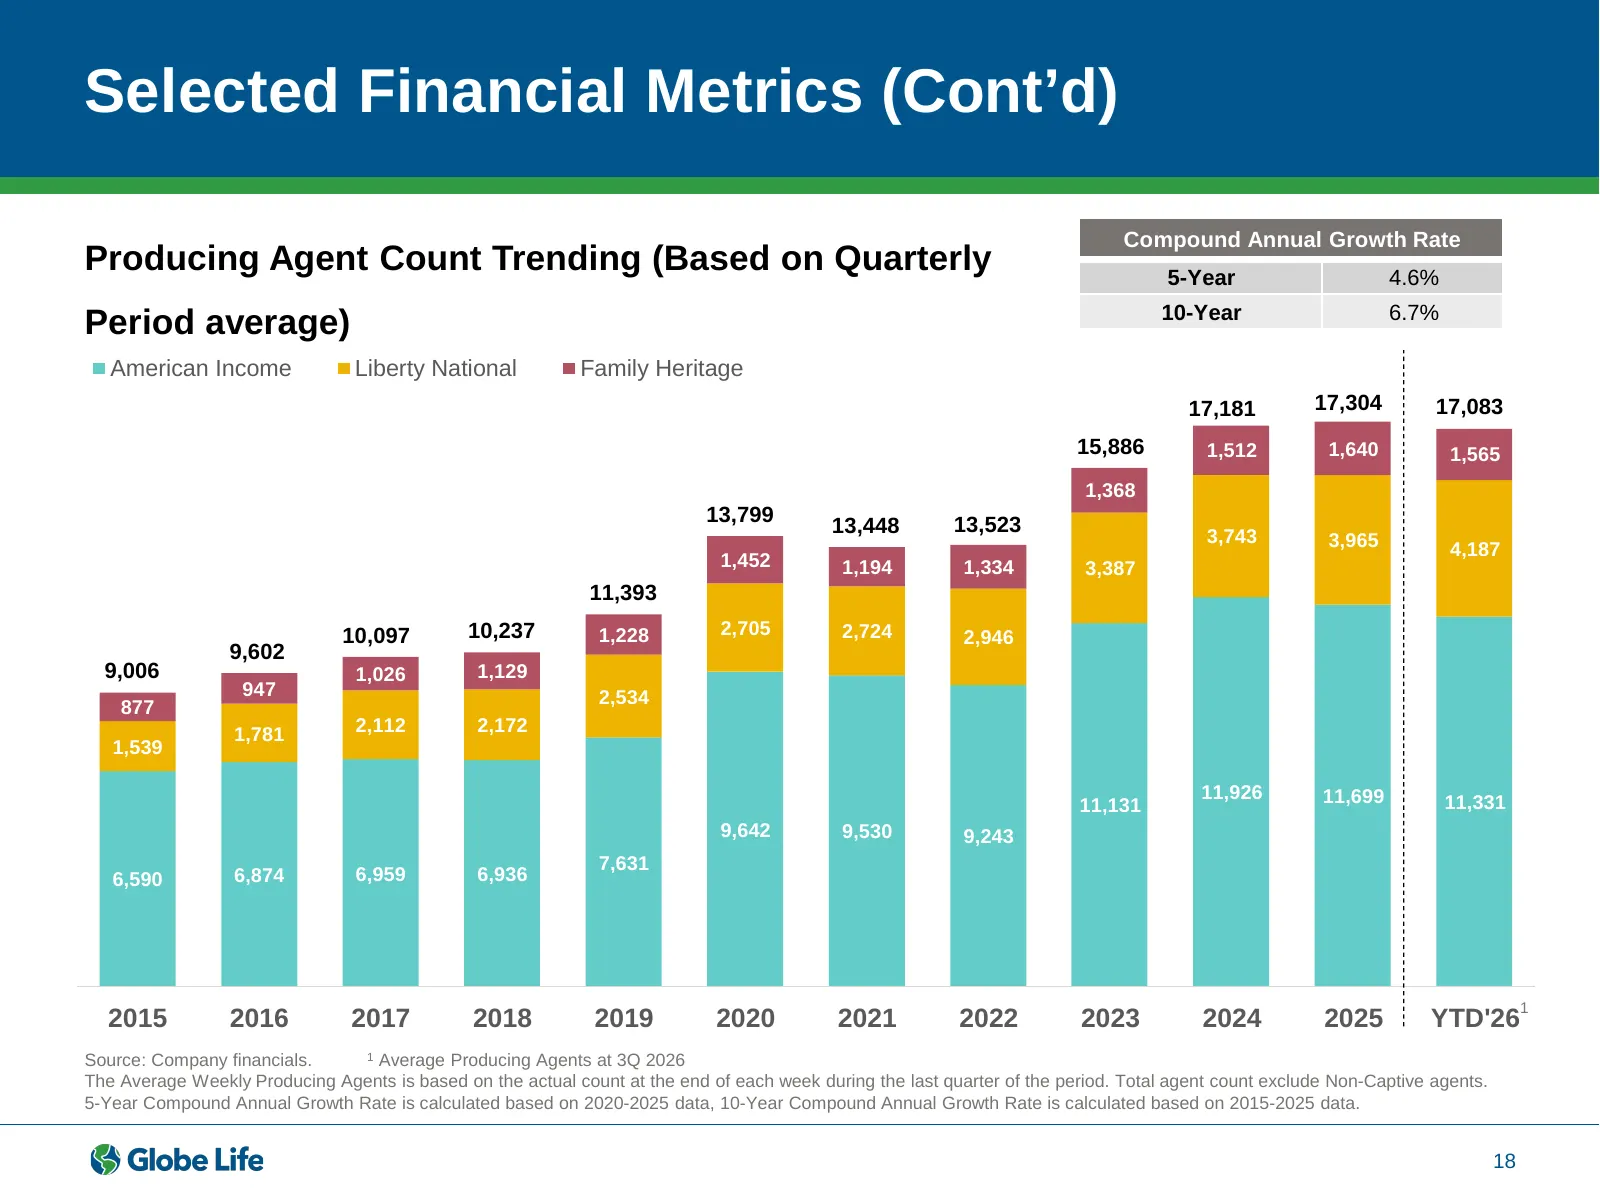
Selected Financial Metrics (Cont’d) Compound Annual Growth Rate Producing Agent Count Trending (Based on Quarterly 5-Year 4.6% 10-Year 6.7% Period average) American Income Liberty National Family Heritage 17,181 17,304 17,083 15,886 1,512 1,640 1,565 1,368 13,799 13,448 13,523 3,743 3,965 4,187 1,45
Slide 19: Selected Financial Metrics (Cont'd)
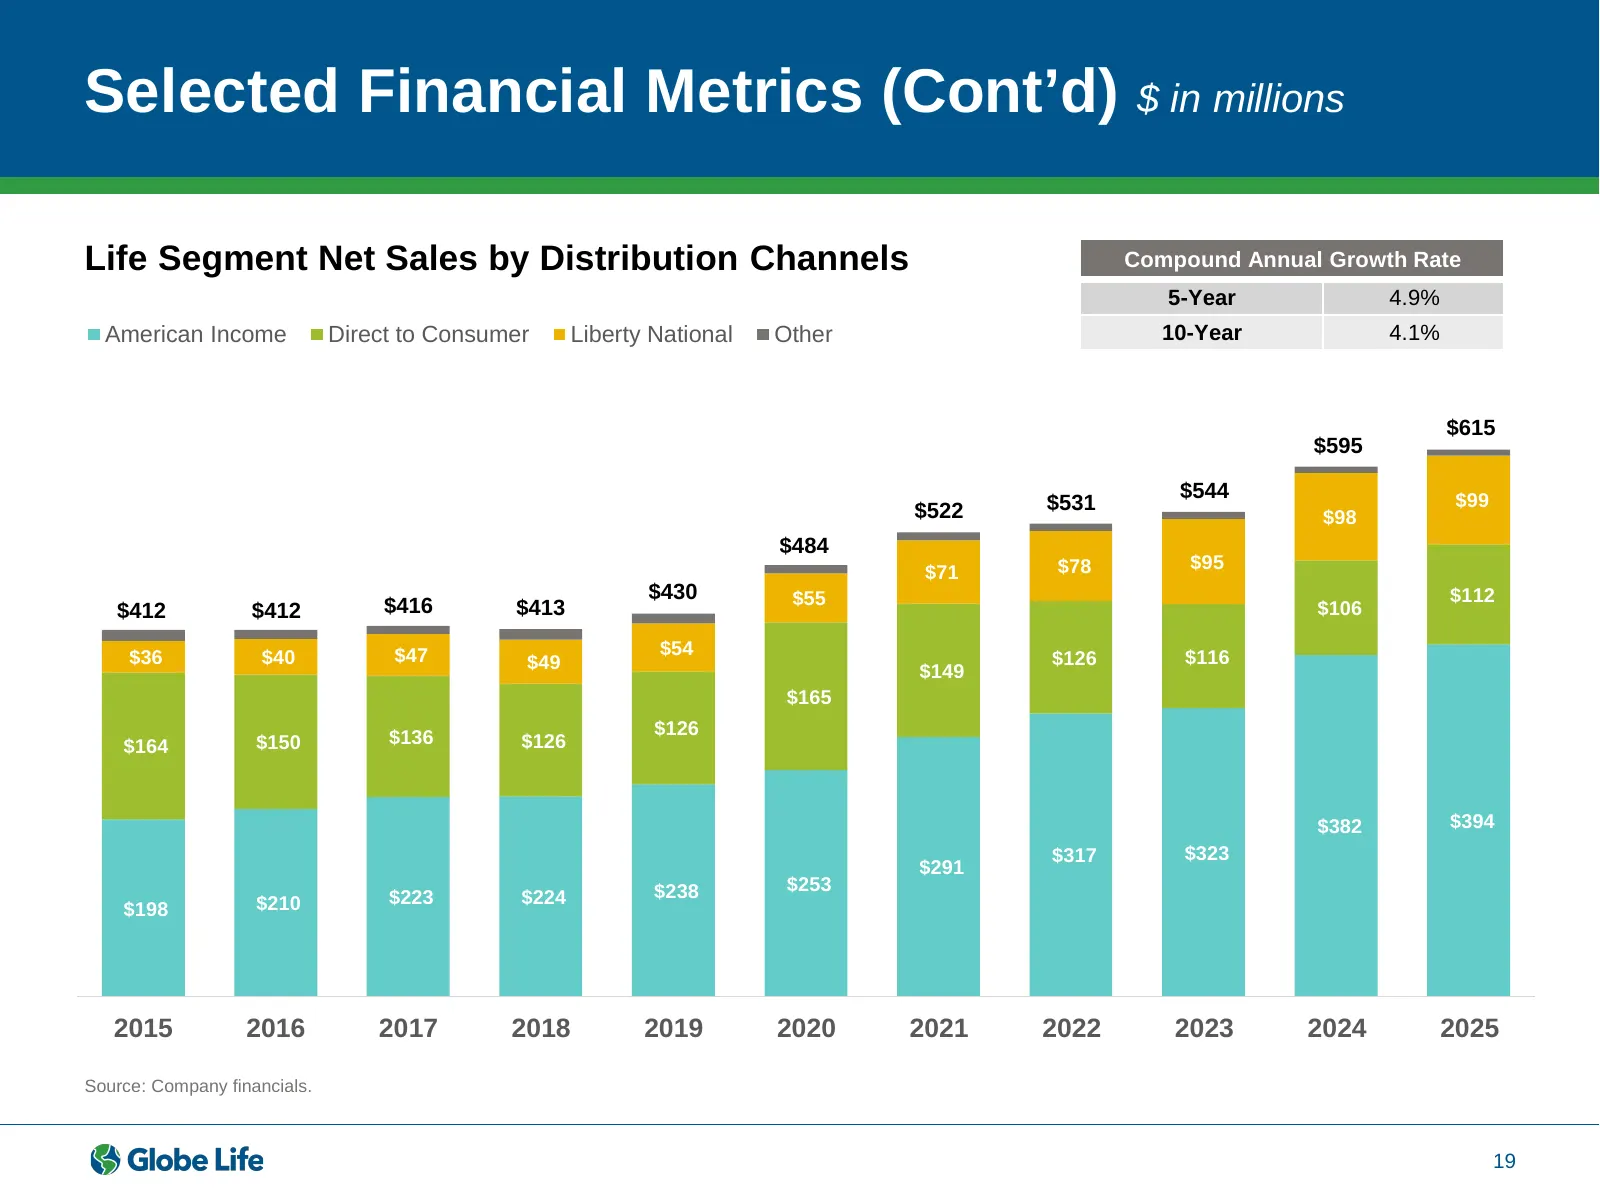
Selected Financial Metrics (Cont’d) $ in millions Life Segment Net Sales by Distribution Channels Compound Annual Growth Rate 5-Year 4.9% American Income Direct to Consumer Liberty National Other 10-Year 4.1% $615 $595 $544 $99 $522 $531 $98 $484 $78 $95 $71 $430 $55 $112 $412 $412 $416 $413 $106 $3
Slide 20: Selected Financial Metrics (Cont'd)
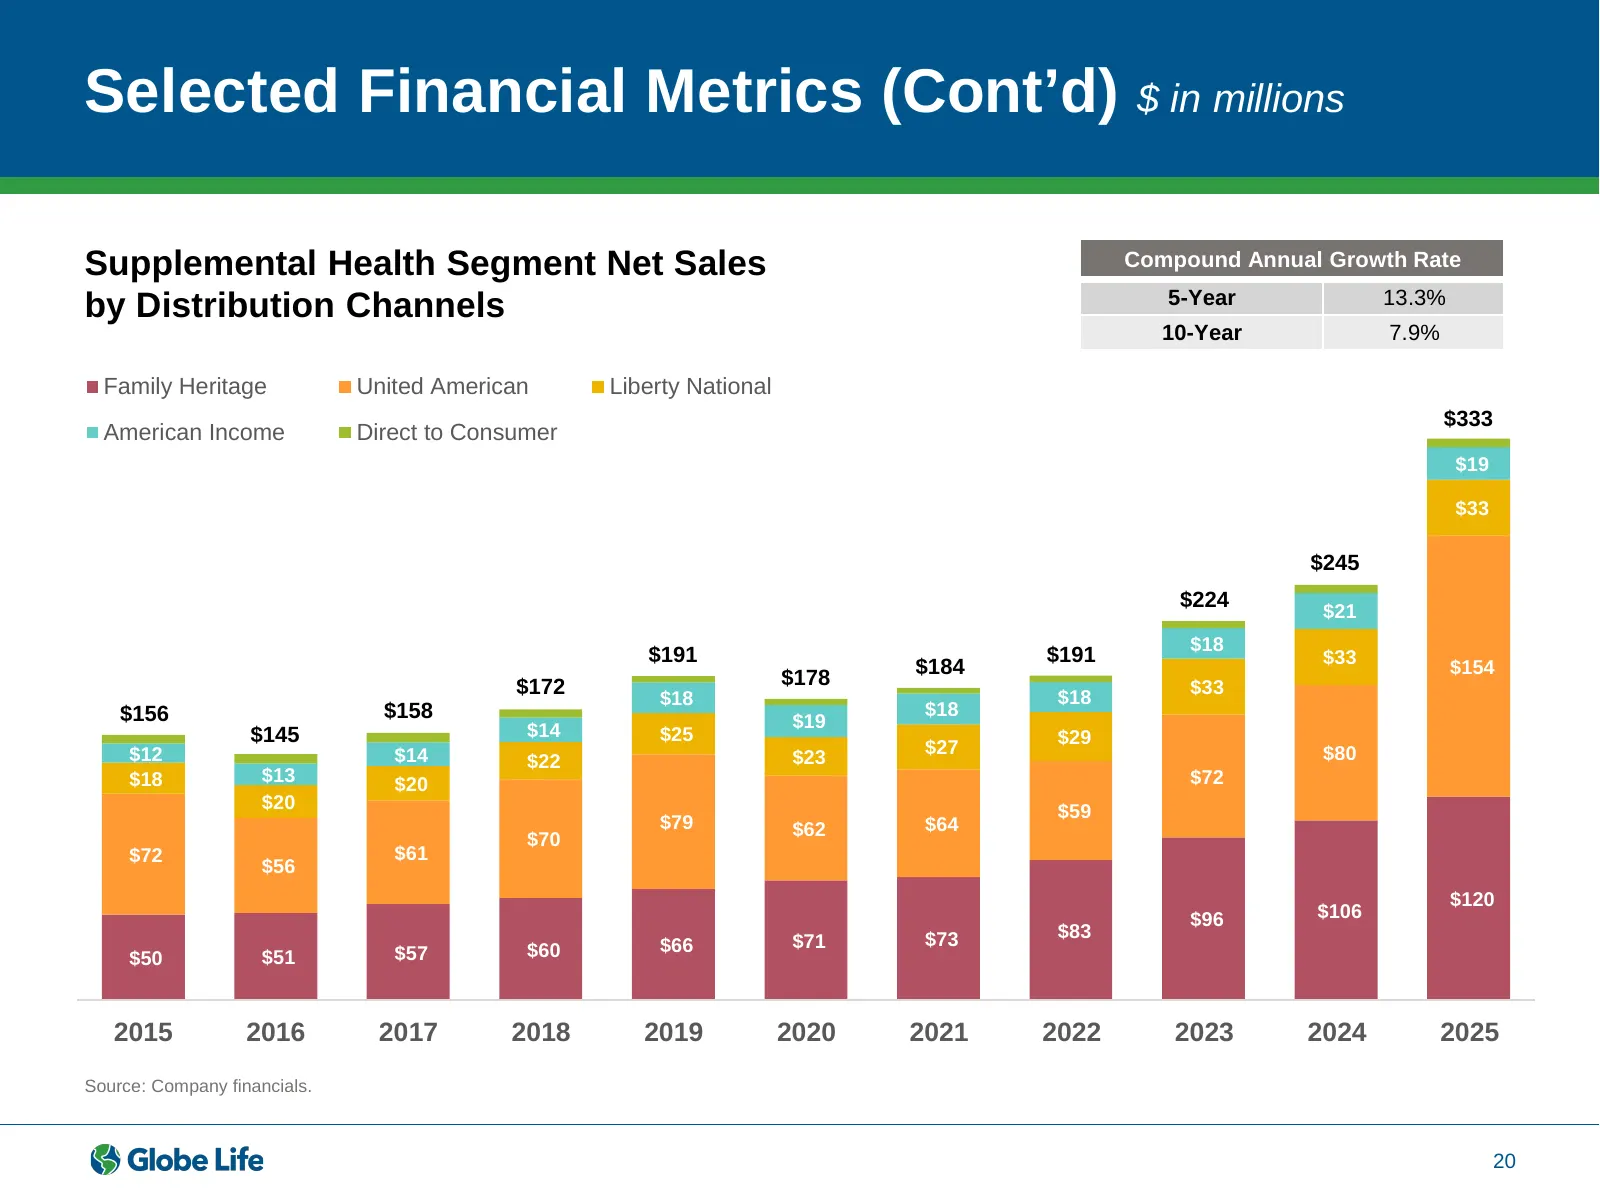
Selected Financial Metrics (Cont’d) $ in millions Supplemental Health Segment Net Sales Compound Annual Growth Rate 5-Year 13.3% by Distribution Channels 10-Year 7.9% Family Heritage United American Liberty National $333 American Income Direct to Consumer $19 $33 $245 $224 $21 $18 $191 $191 $33 $184
Slide 21: Selected Financial Metrics (Cont'd)
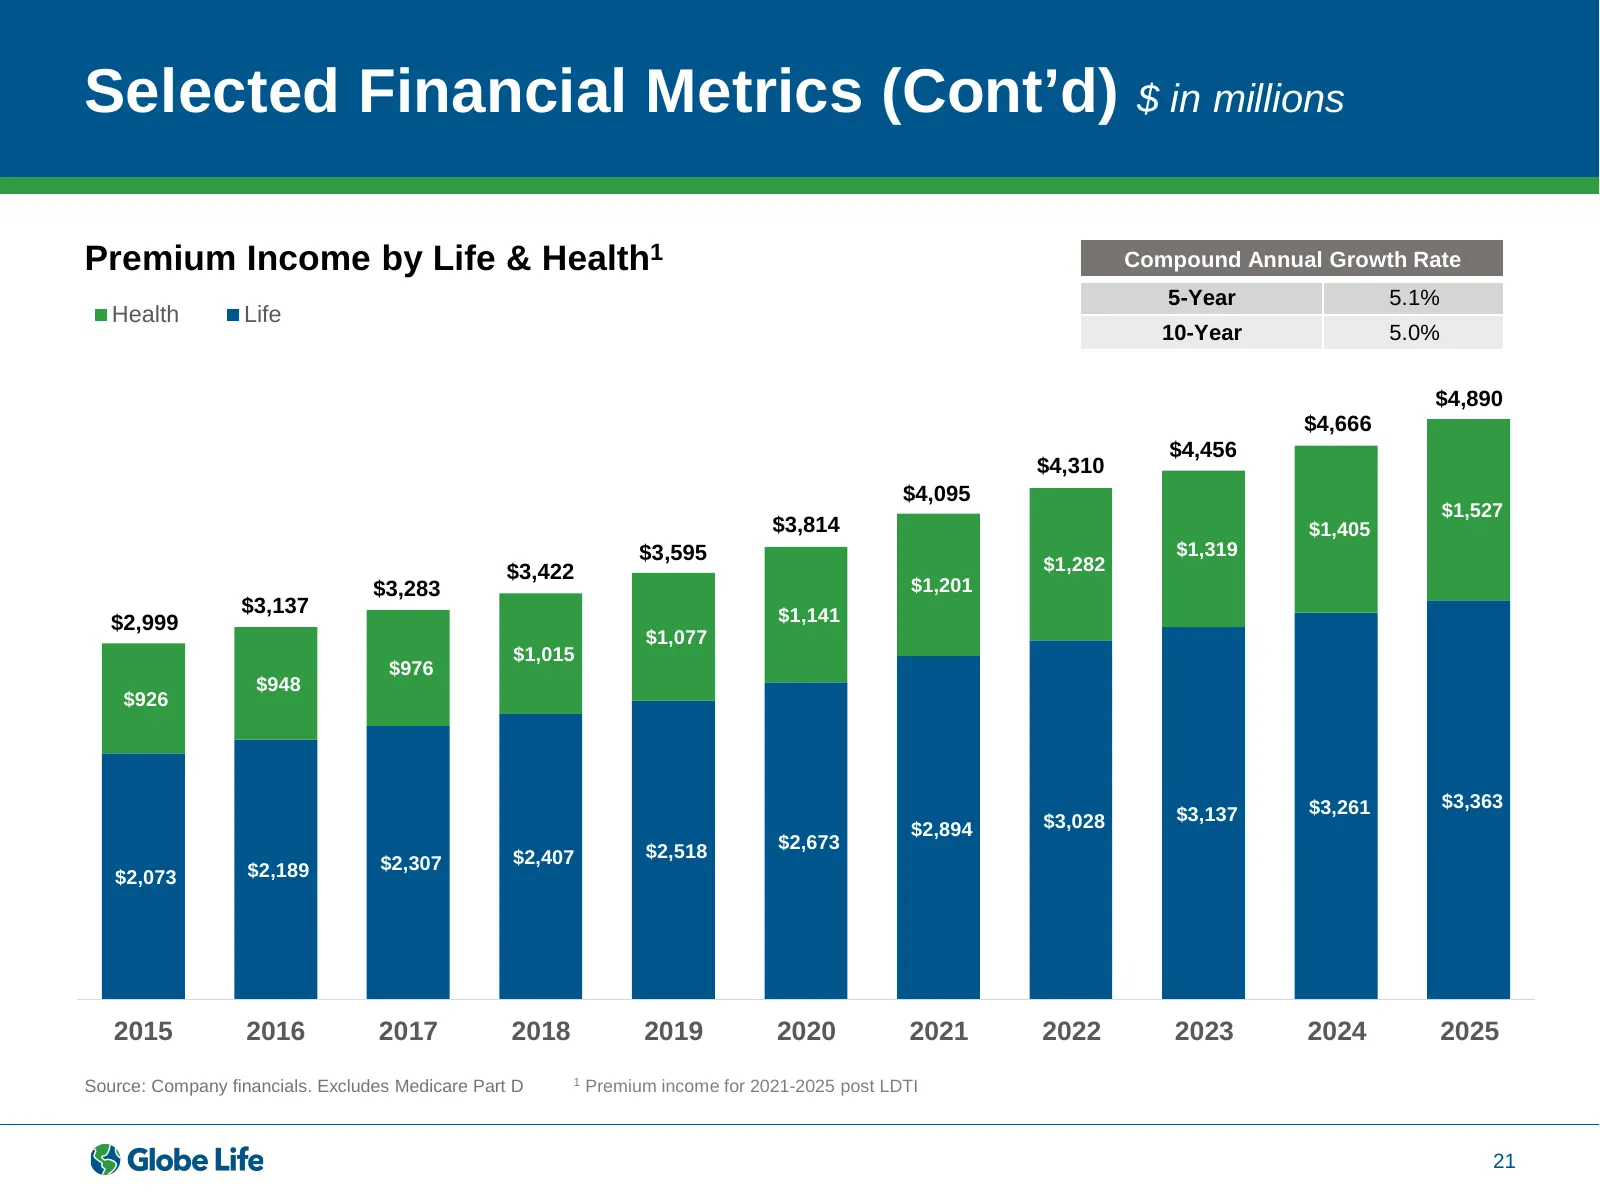
Selected Financial Metrics (Cont’d) $ in millions Premium Income by Life & Health1 Compound Annual Growth Rate 5-Year 5.1% Health Life 10-Year 5.0% $4,890 $4,666 $4,456 $4,310 $4,095 $1,527 $3,814 $1,405 $3,595 $1,319 $3,422 $1,282 $3,283 $1,201 $3,137 $1,141 $2,999 $1,077 $1,015 $976 $948 $926 $3,2
Slide 22: Long-Tenured and Experienced Management
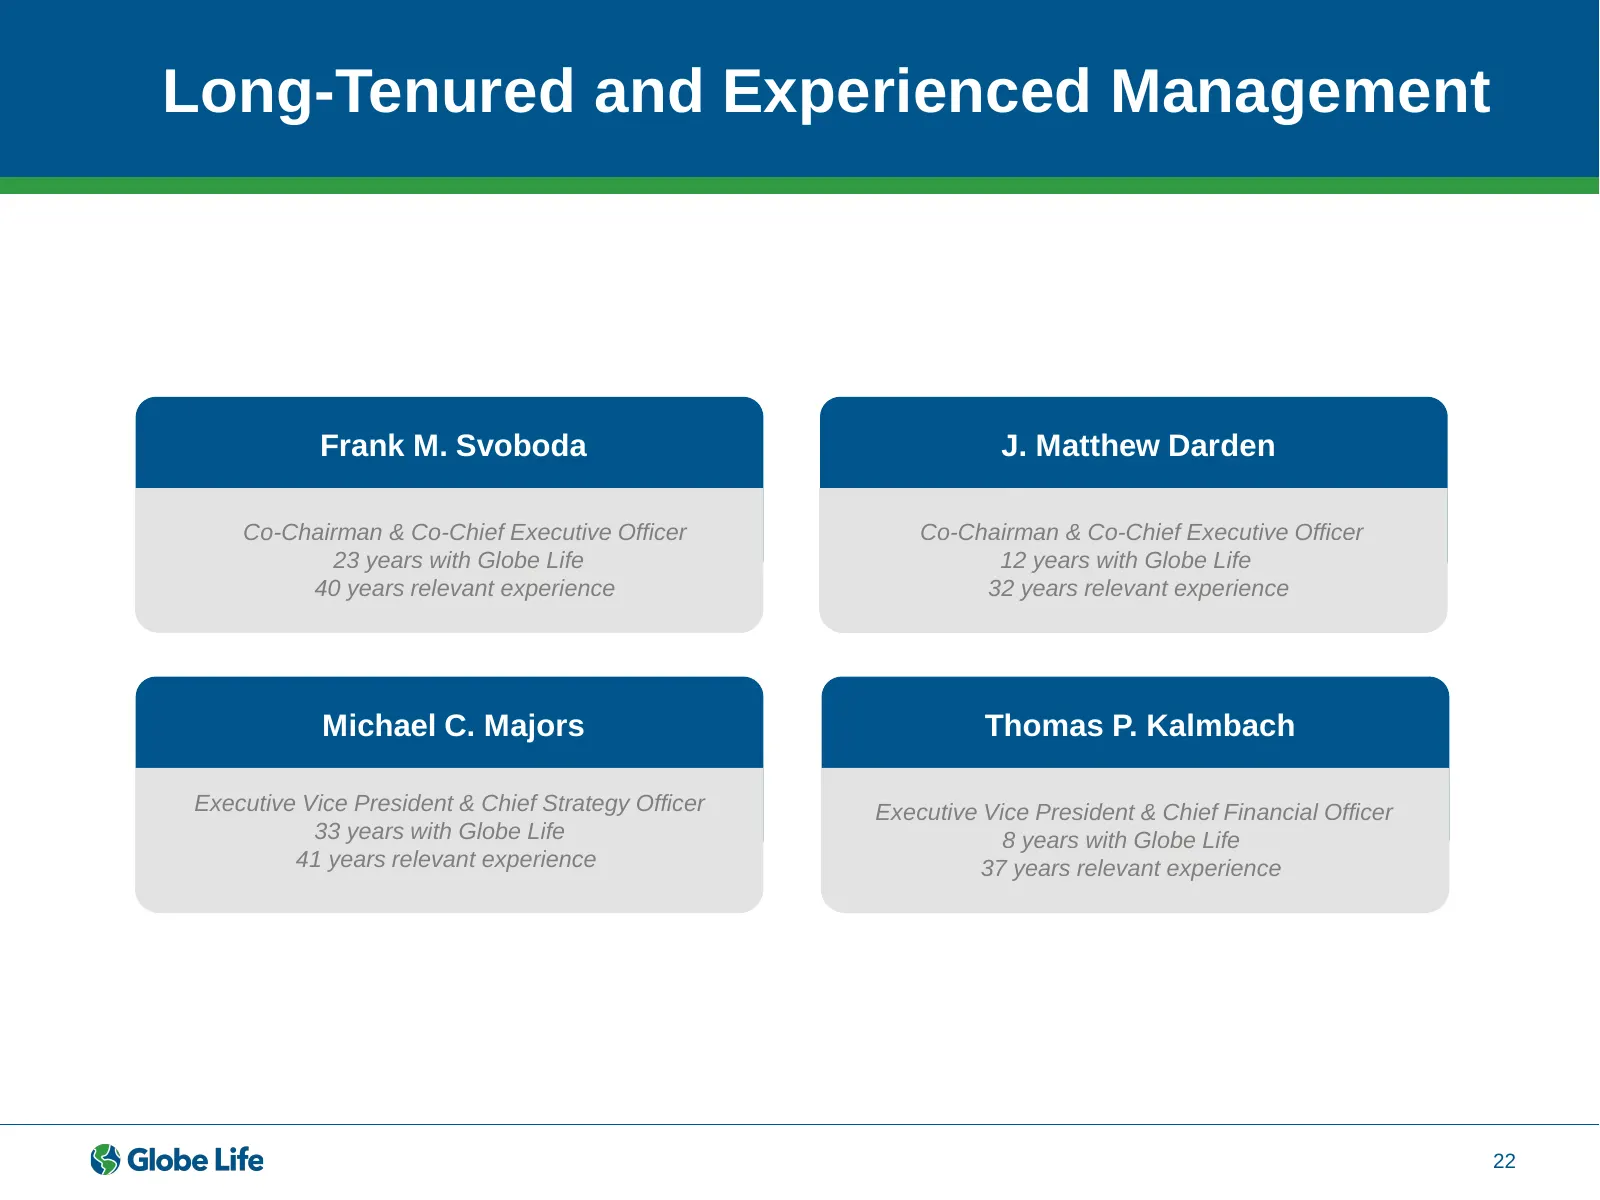
Long-Tenured and Experienced Management Frank M. Svoboda J. Matthew Darden Co-Chairman & Co-Chief Executive Officer Co-Chairman & Co-Chief Executive Officer 23 years with Globe Life 12 years with Globe Life 40 years relevant experience 32 years relevant experience Michael C. Majors Thomas P. Kalmbac
Slide 23: Disciplined Approach to Governance and Risk Management
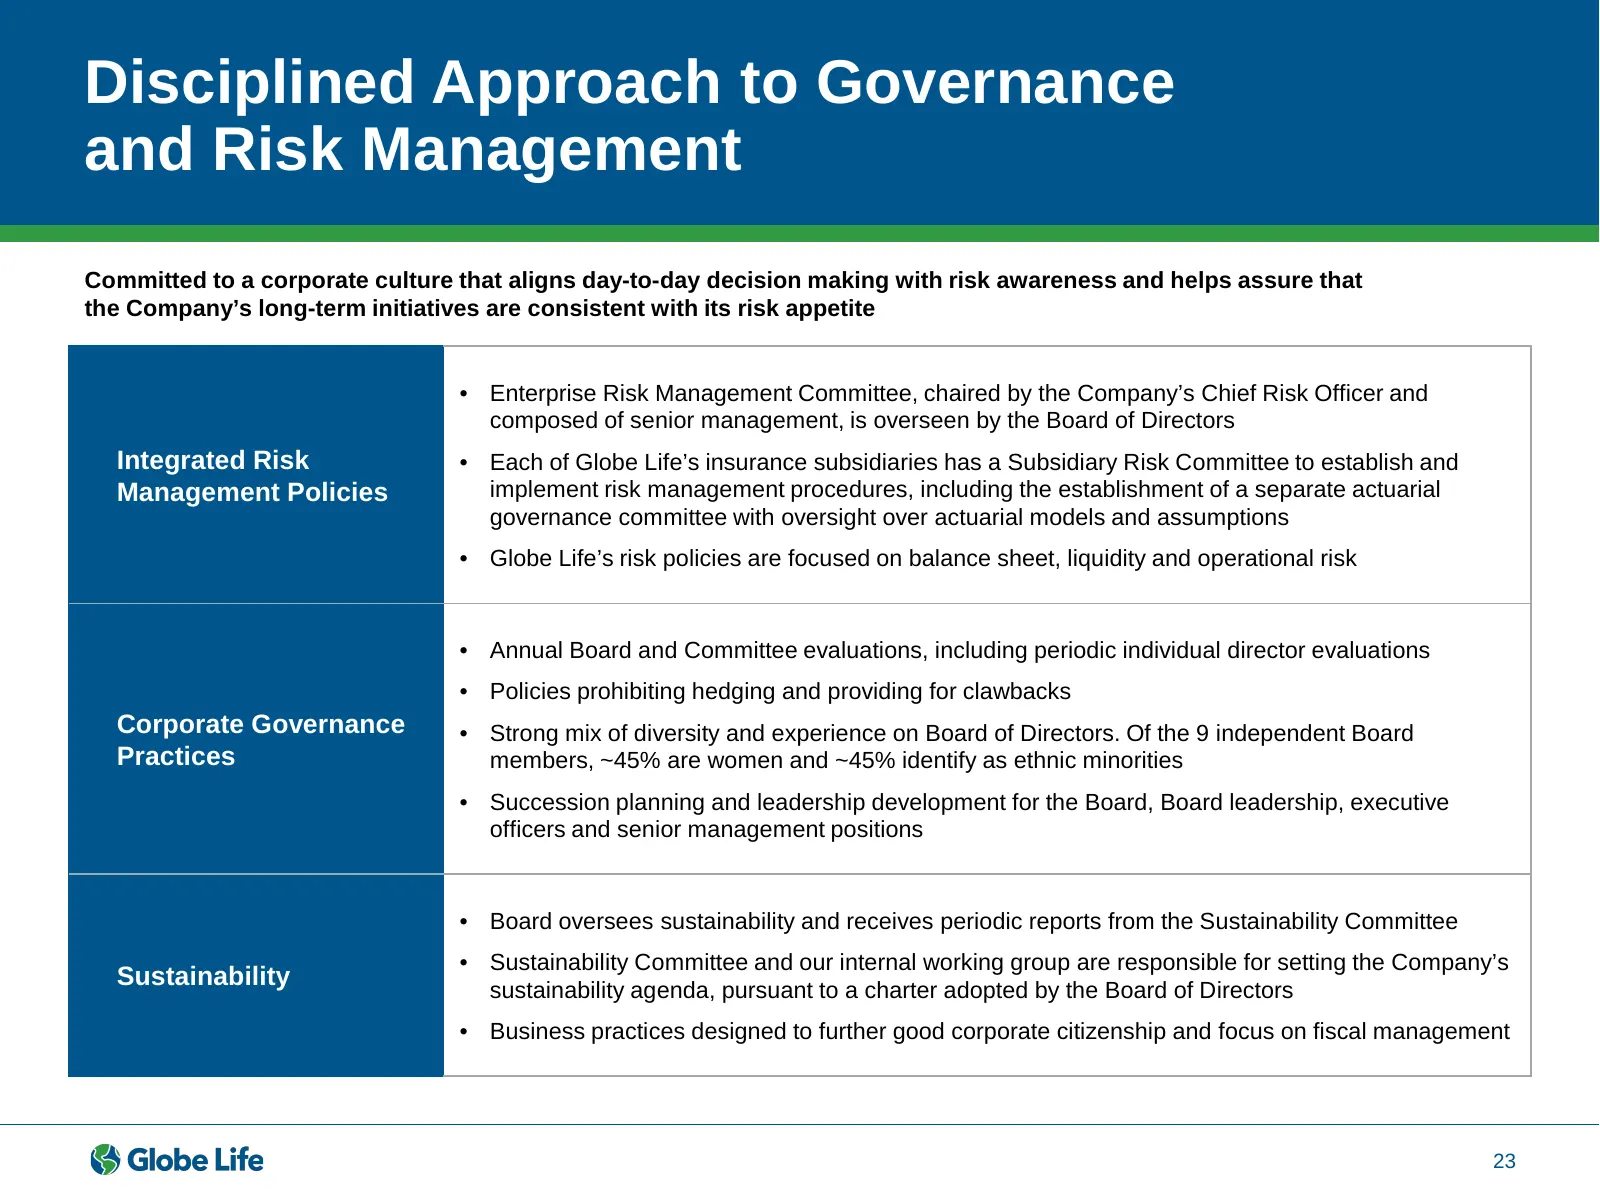
Disciplined Approach to Governance and Risk Management Committed to a corporate culture that aligns day-to-day decision making with risk awareness and helps assure that the Company’s long-term initiatives are consistent with its risk appetite • Enterprise Risk Management Committee, chaired by the Co
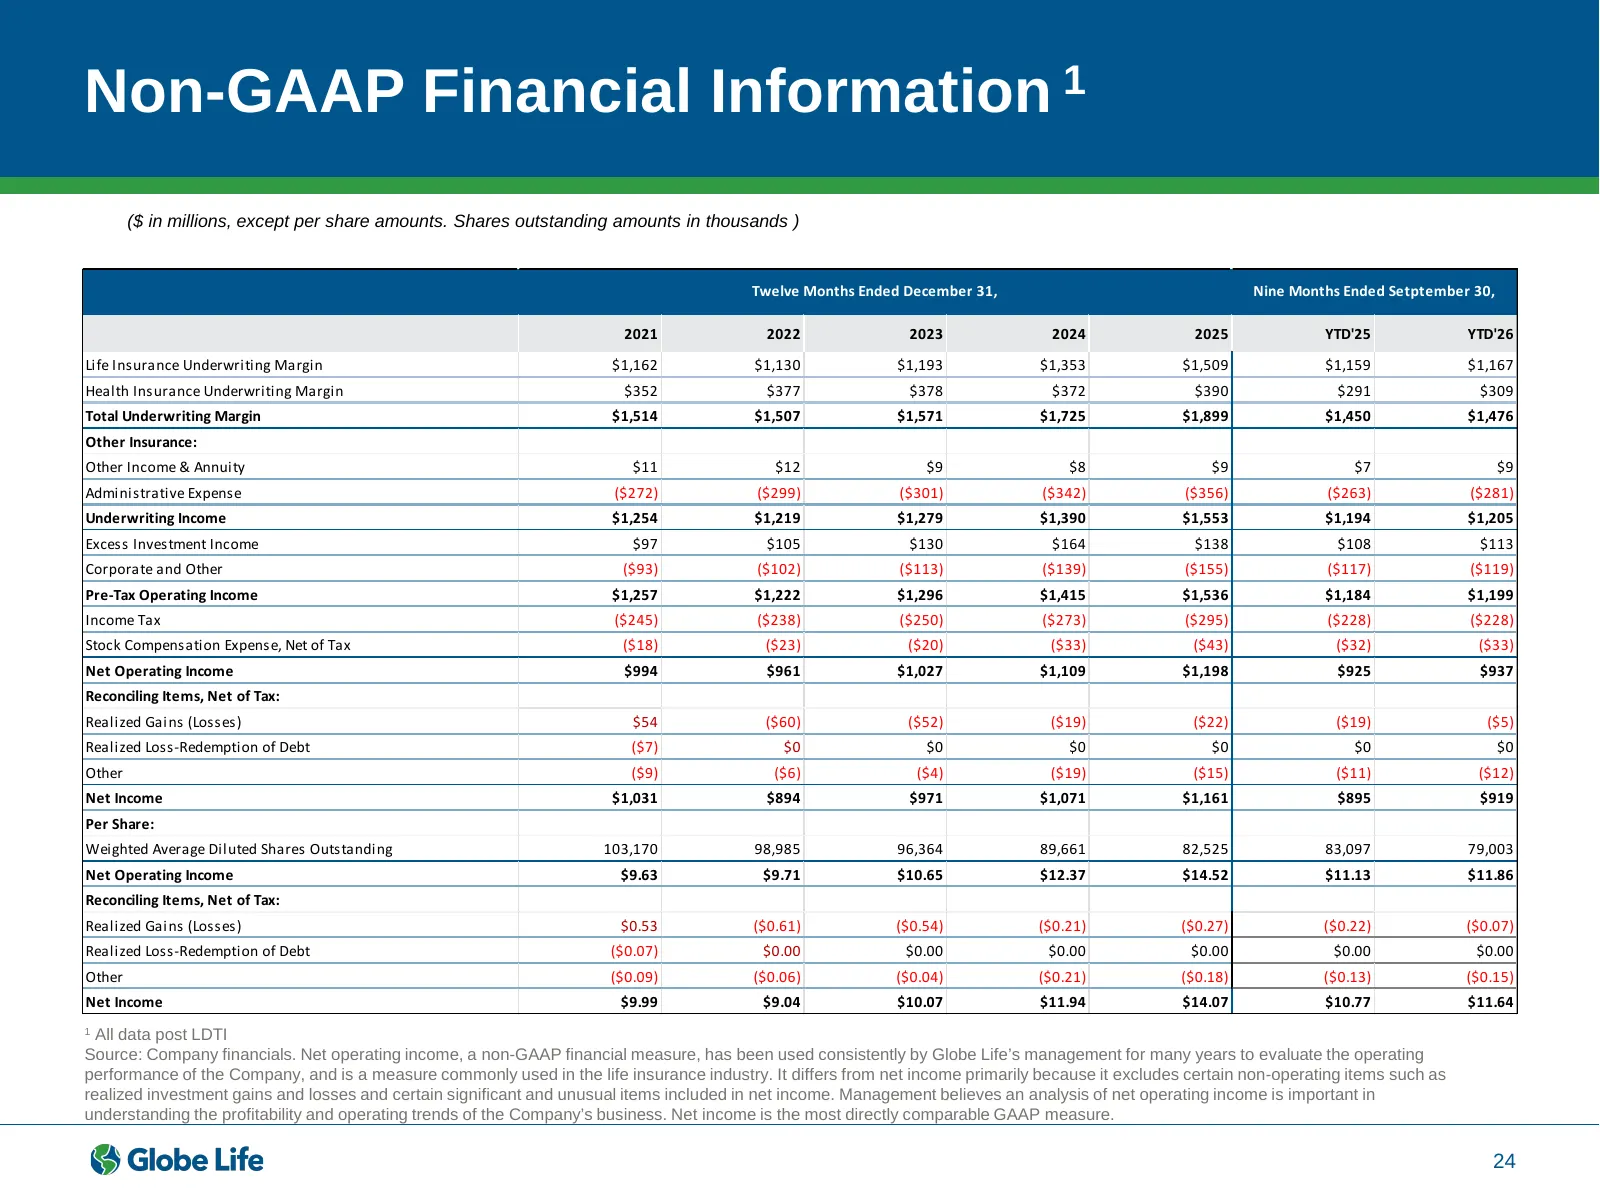
Slide 24: Non-GAAP Financial Information
Non-GAAP Financial Information 1 ($ in millions, except per share amounts. Shares outstanding amounts in thousands ) Twelve Months Ended December 31, Nine Months Ended Setptember 30, 2021 2022 2023 2024 2025 YTD'25 YTD'26 Life Insurance Underwriting Margin $1,162 $1,130 $1,193 $1,353 $1,509 $1,159 $
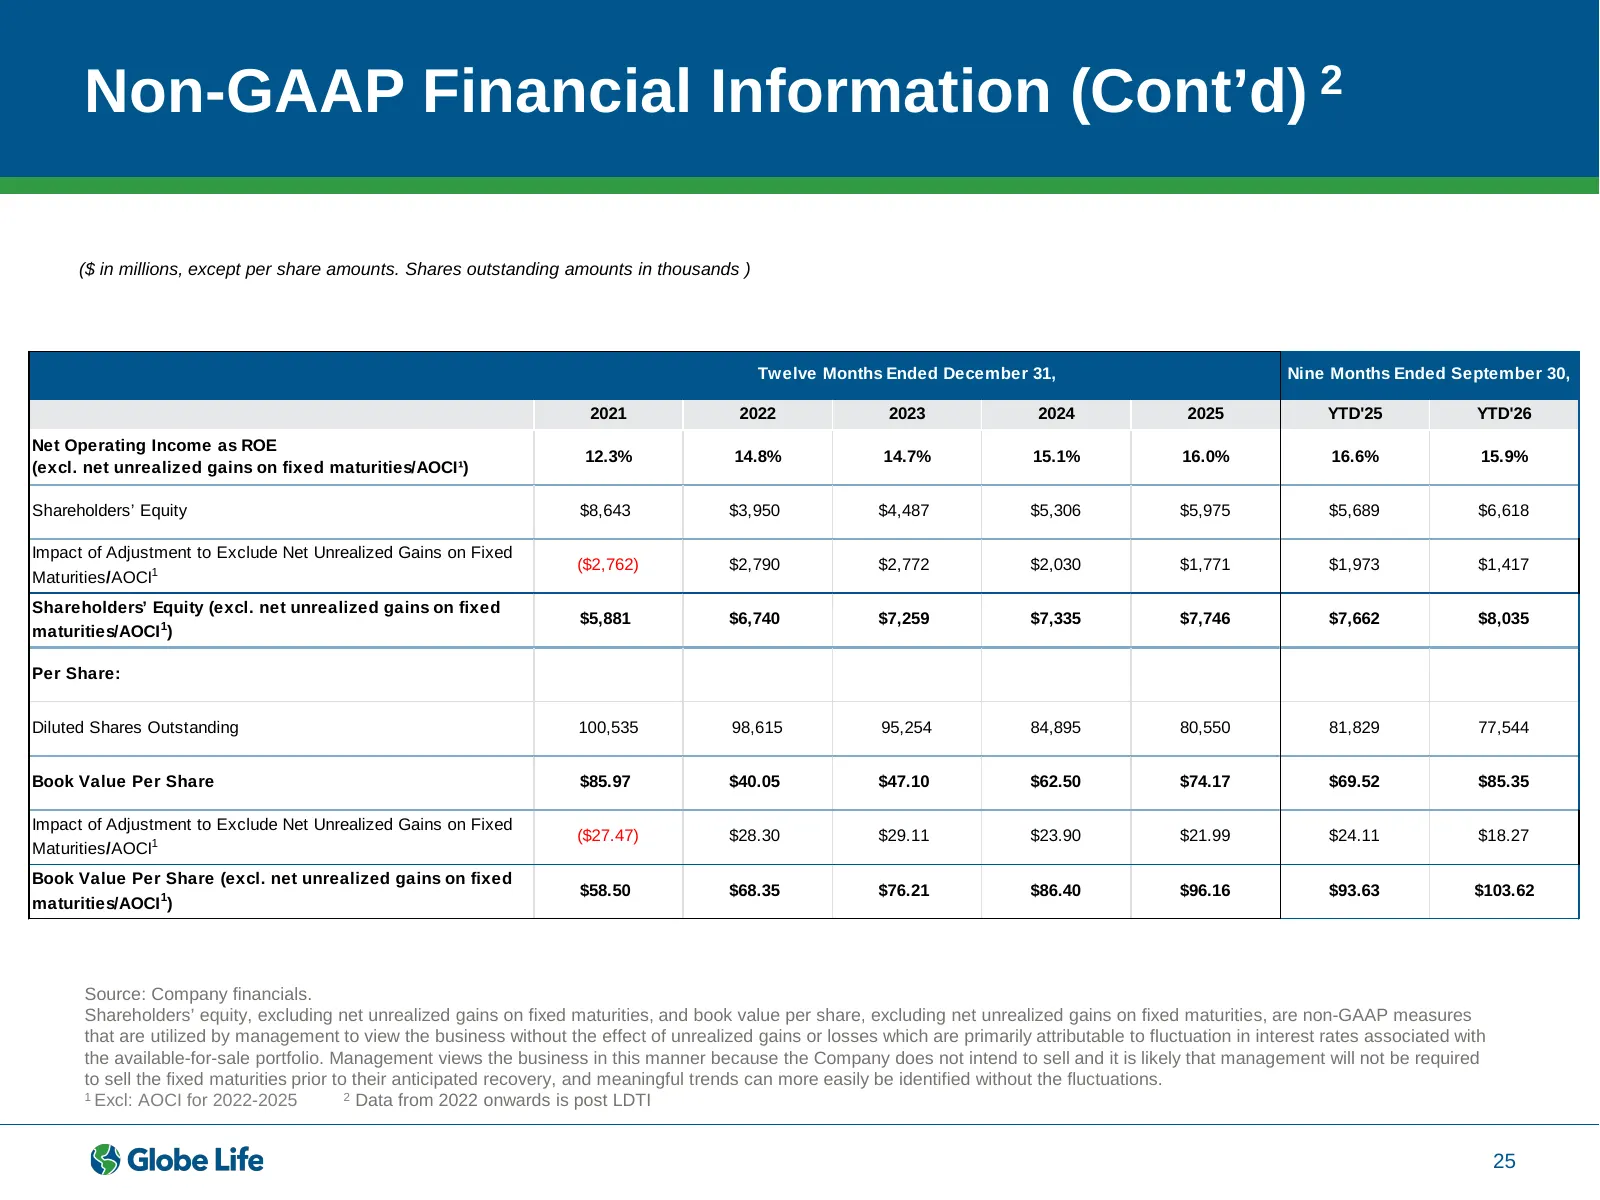
Slide 25: Non-GAAP Financial Information (Cont'd)
Non-GAAP Financial Information (Cont’d) 2 ($ in millions, except per share amounts. Shares outstanding amounts in thousands ) Twelve Months Ended December 31, Nine Months Ended September 30, 2021 2022 2023 2024 2025 YTD'25 YTD'26 Net Operating Income as ROE 12.3% 14.8% 14.7% 15.1% 16.0% 16.6% 15.9%
Source: company website