NHPC Limited · NSE:NHPC
NHPC — FY2018 Earnings Presentation
31 slides from NHPC's earnings presentation, Jun 1, 2018
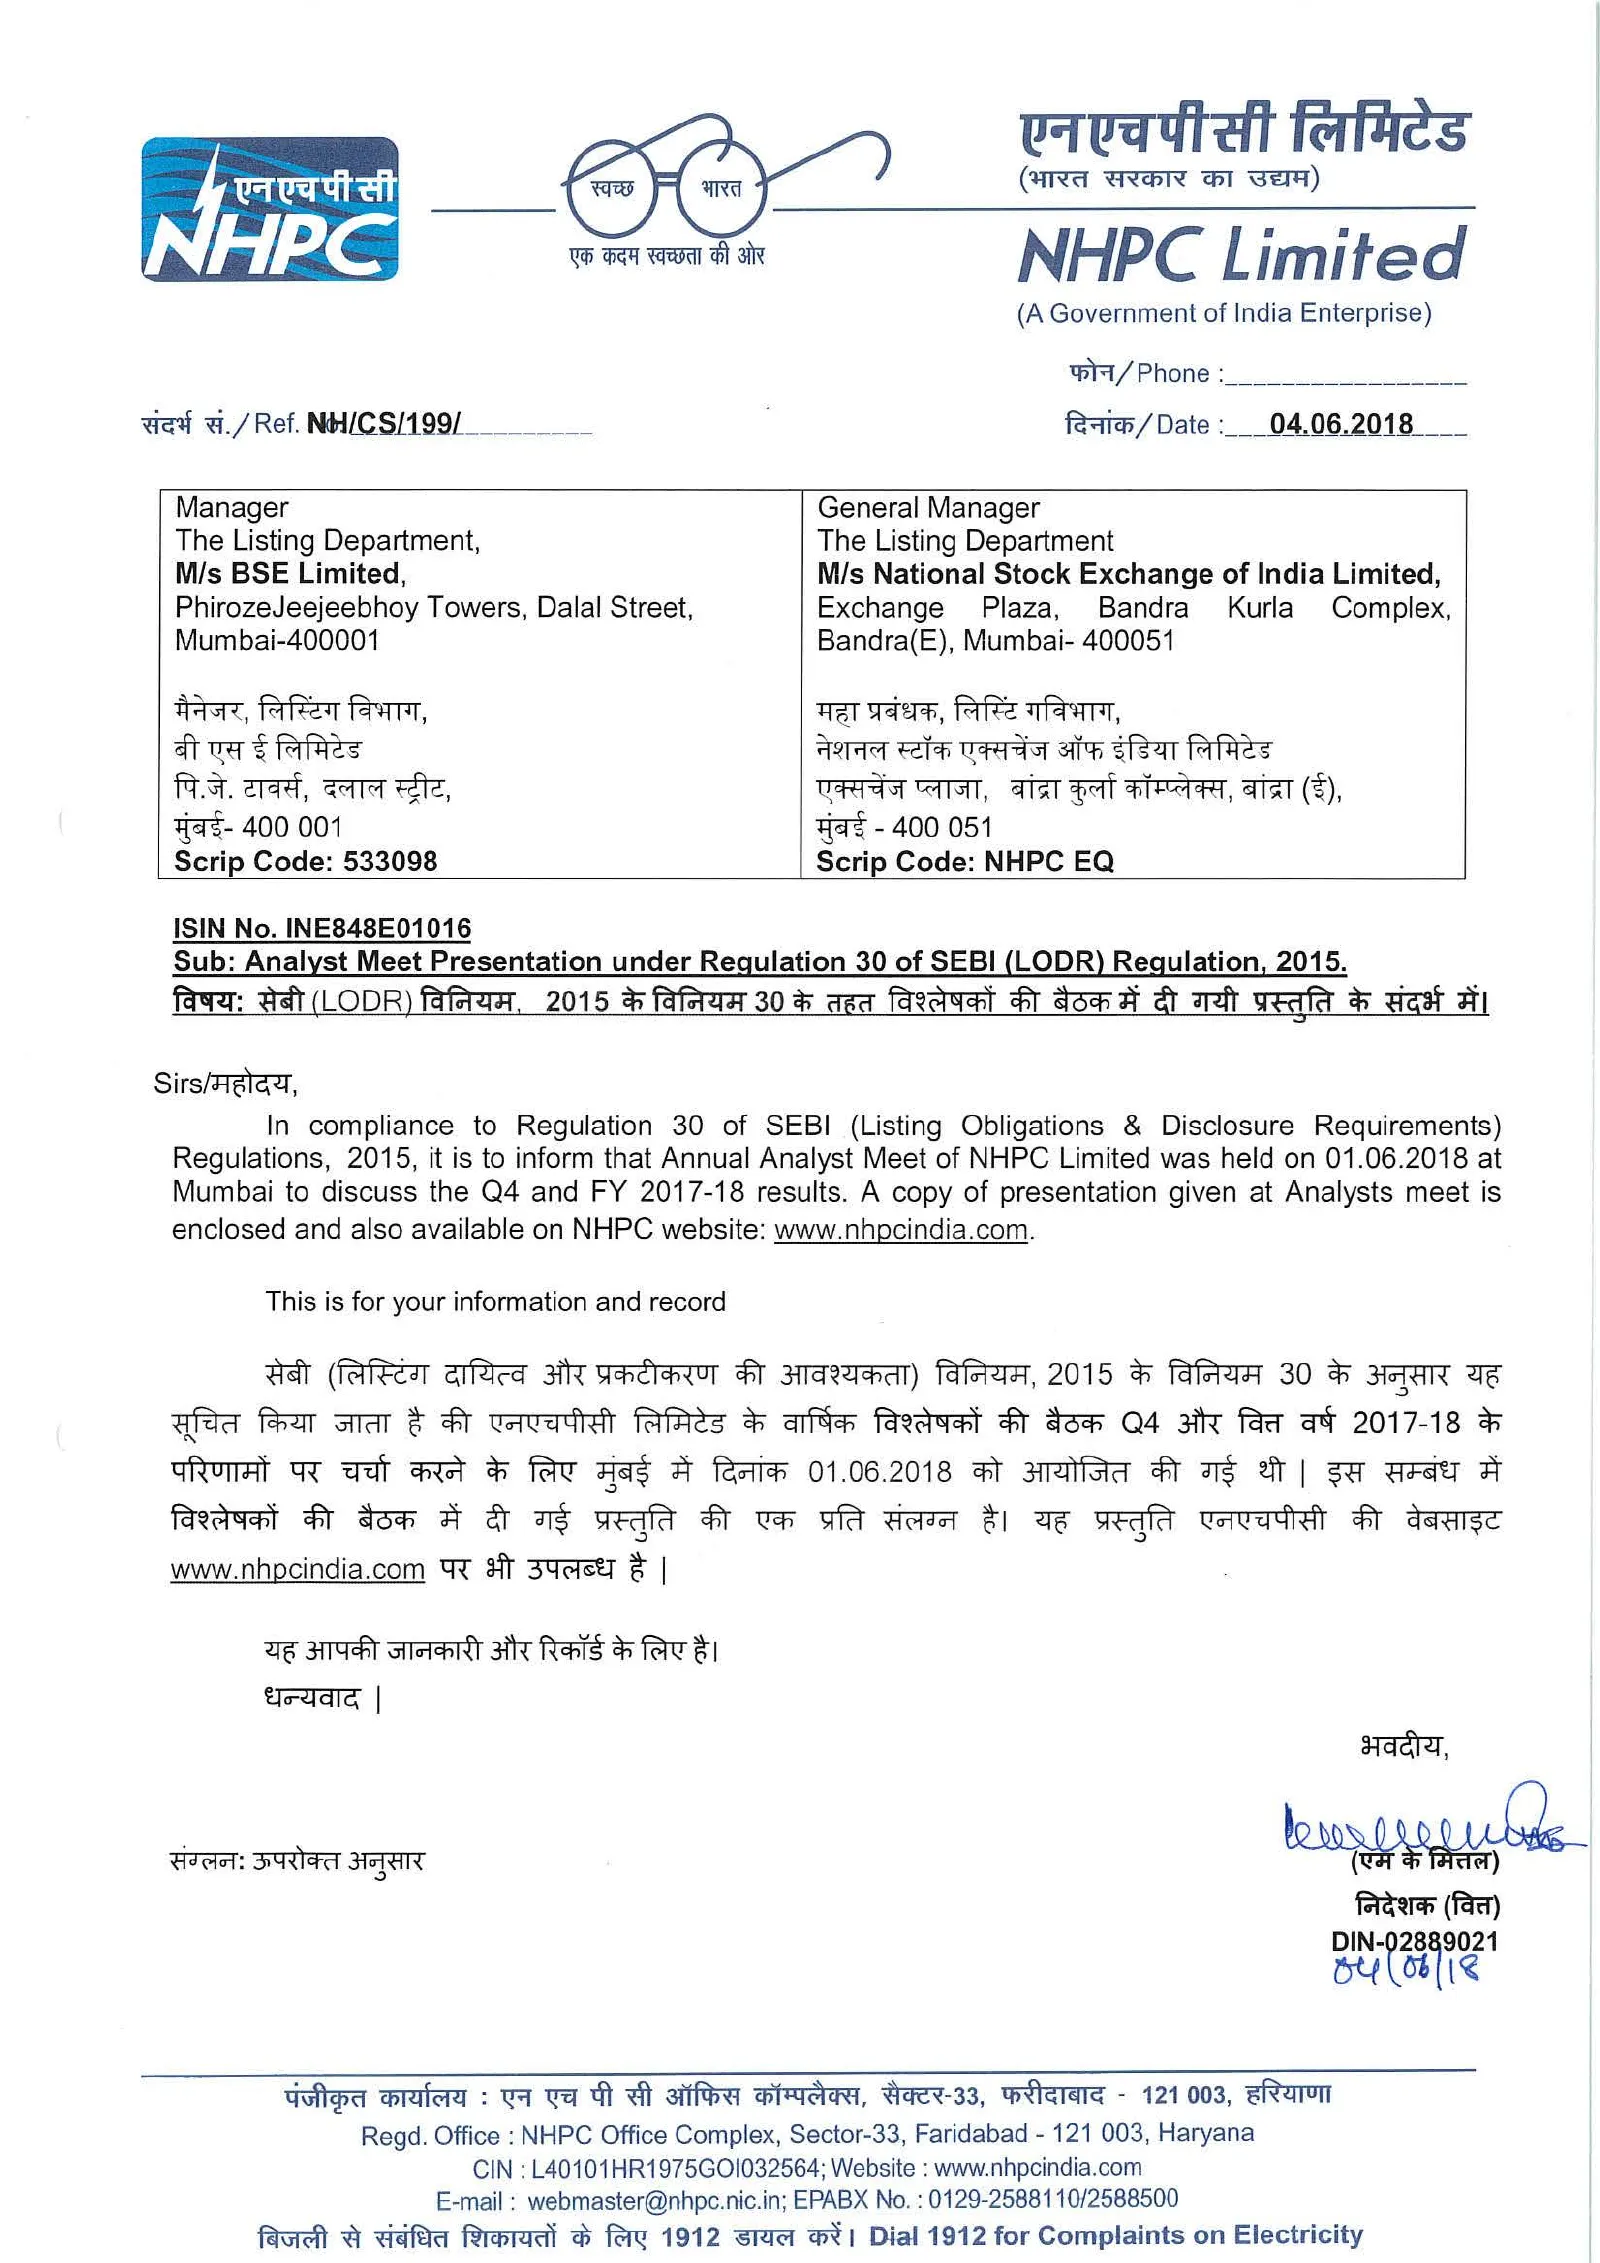
Slide 1: Analyst Meet Presentation covering letter to stock exchanges
"(!Wfeqtff-af f(;f flf ~:s ( ~ '(! '< 4> I'< Cf>T '3EJ1l) NHPC Limited (A Government of India Enterprise) q;l;:r/ Phone :________________ _ ~ "fi./ Ref. ~LC.Sl199L________ ~/Date :___ _OA.Q.6_._igi_s____ Manager General Manager The Listing Department, The Listing Department M/s BSE Limited, M/s Nati
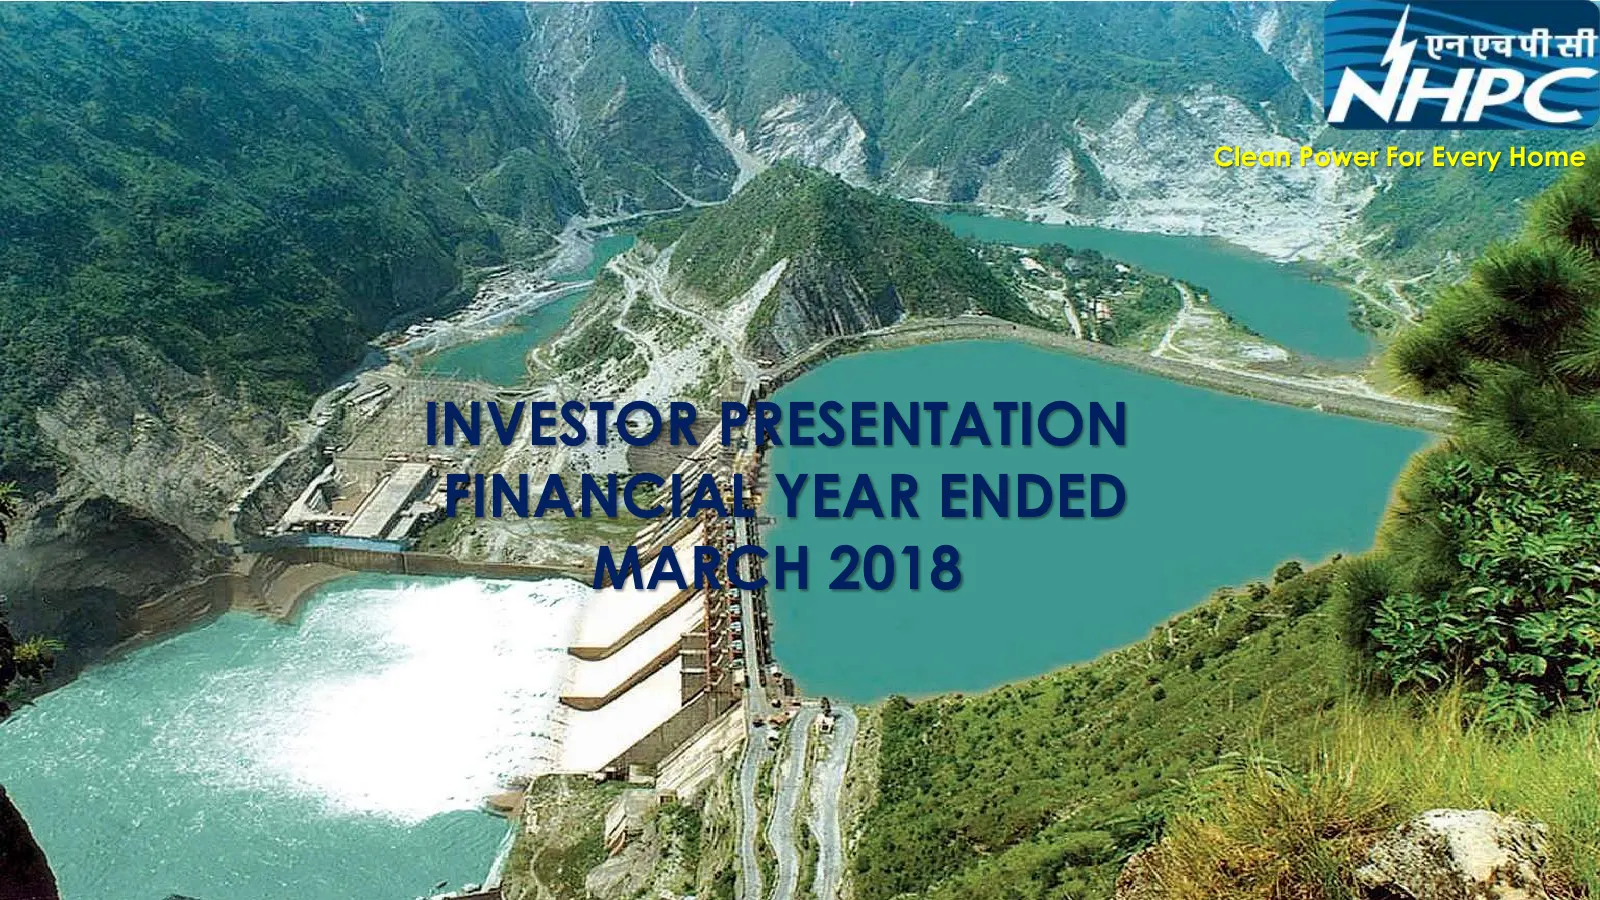
Slide 2: Investor Presentation Financial Year Ended March 2018
Clean Power For Every Home INVESTOR PRESENTATION FINANCIAL YEAR ENDED MARCH 2018 Salal Power Station, J&K
Slide 3: Presentation Outline
Presentation Outline 2 NHPC Today Financial Highlights Financial Ratios Other Business Initiatives Projects At Glance Our Vision: To be a global leading organization for sustainable development of clean power through competent, responsible and innovative values.
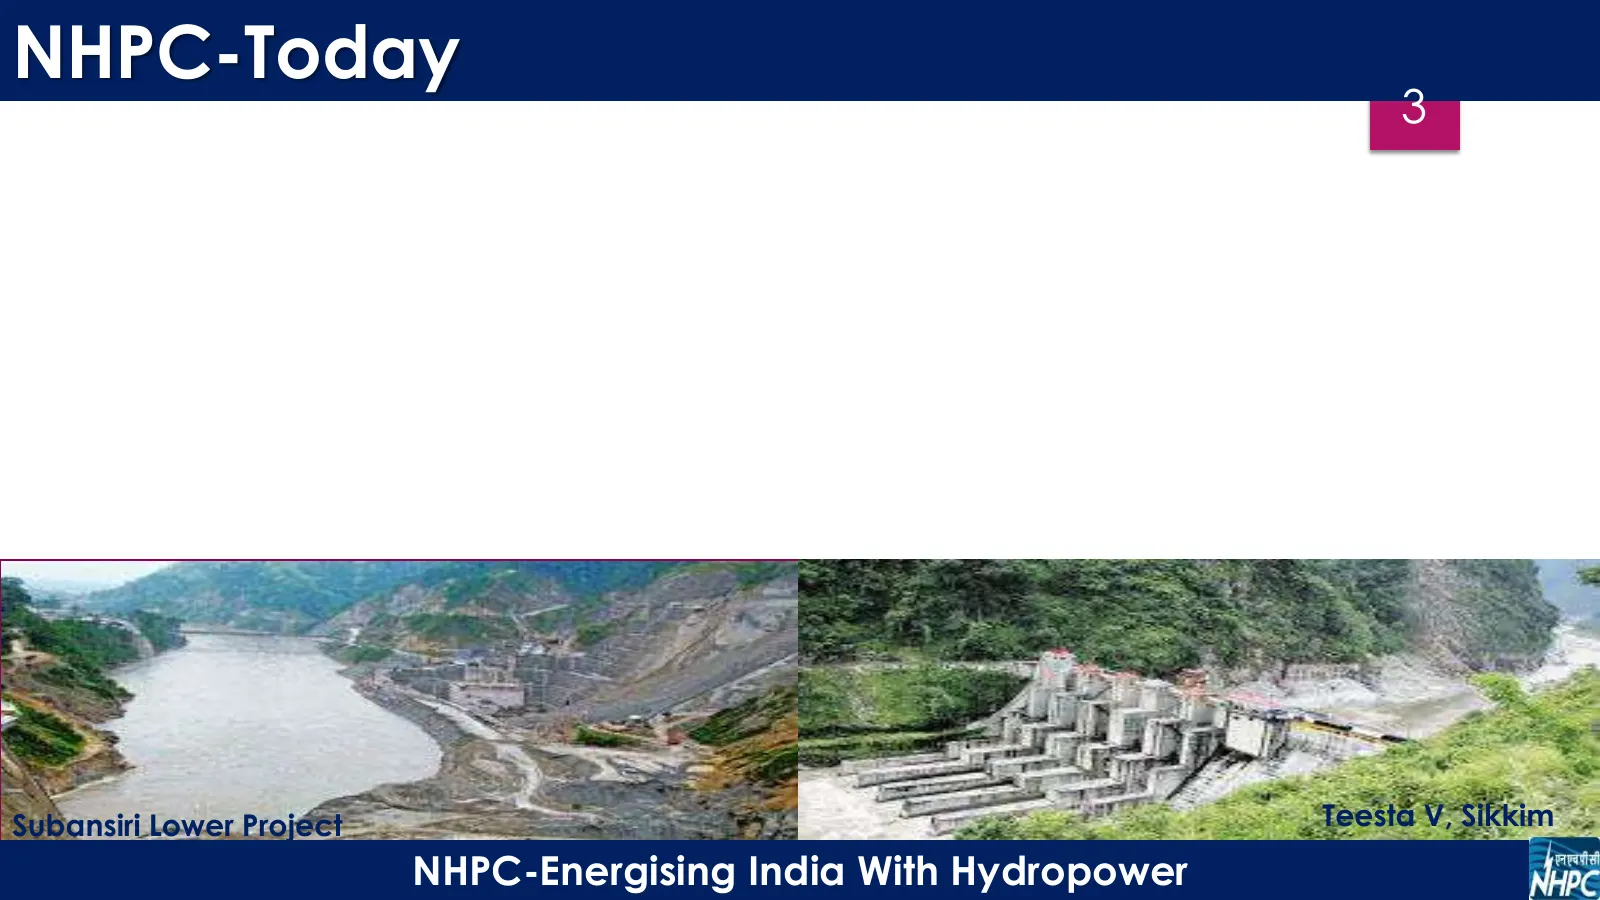
Slide 4: NHPC Today
NHPC-Today 3 Subansiri Lower Project Teesta V, Sikkim NHPC-Energising India With Hydropower
Slide 5: Physical Snapshot
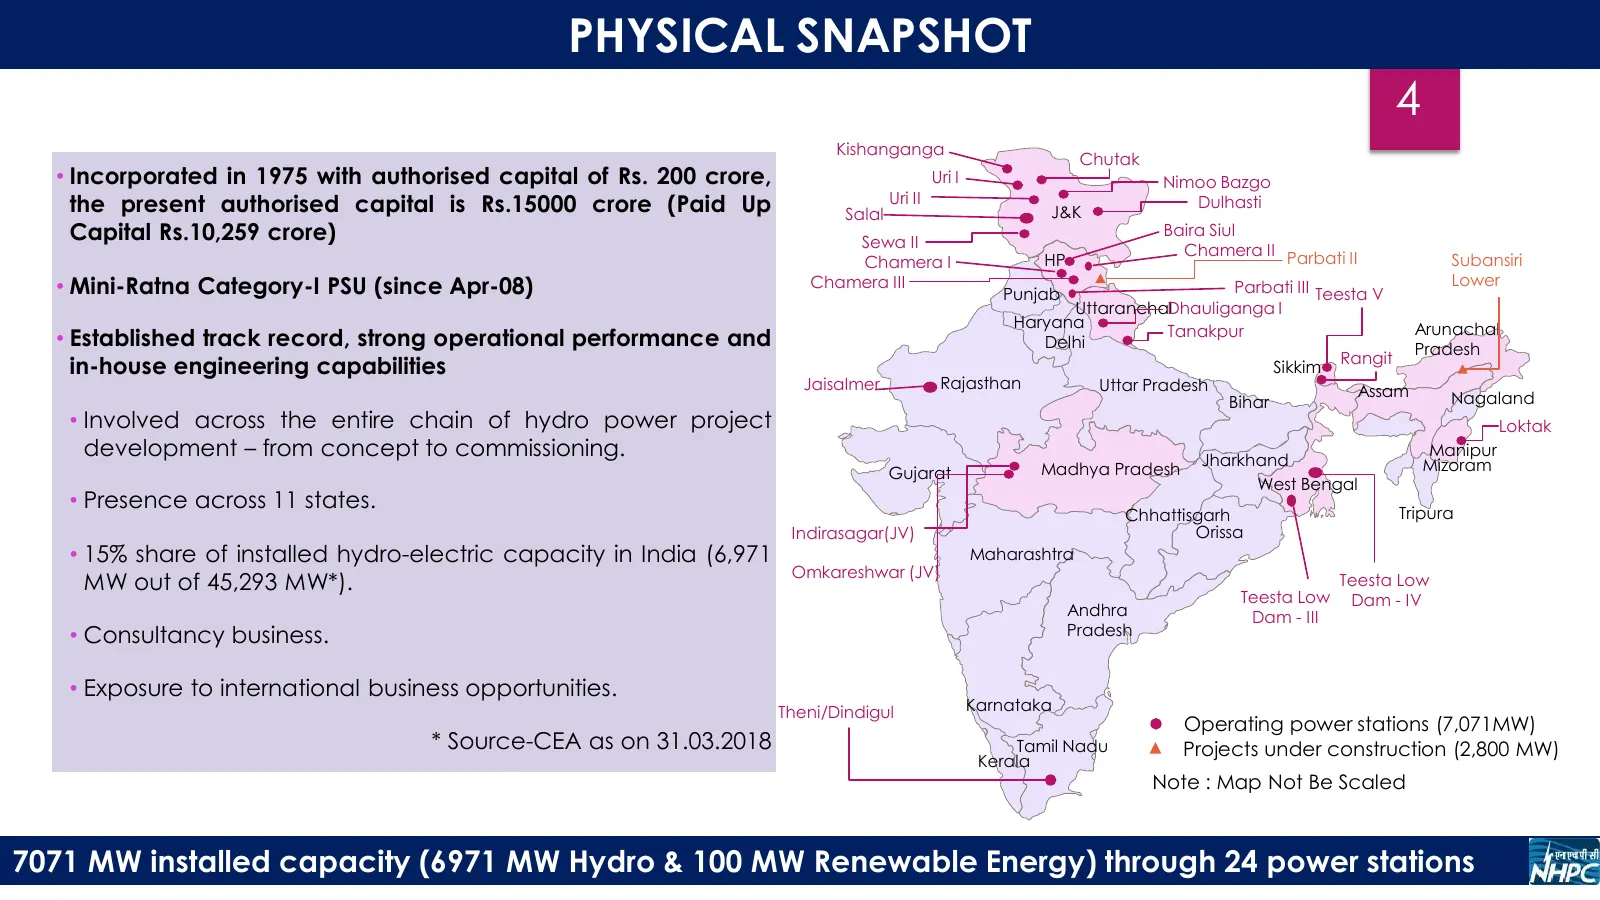
PHYSICAL SNAPSHOT 4 Kishanganga Chutak Installed • Incorporated in 1975 with authorised capital of Rs. 200 crore, Uri II Uri I Nimoo Bazgo the present authorised capital is Rs.15000 crore (Paid Up Dulhasti Capacity Capital Rs.10,259 crore) Salal Sewa II J&K Baira Siul Chamera II Parbati II Chamera I
Slide 6: Physical Snapshot
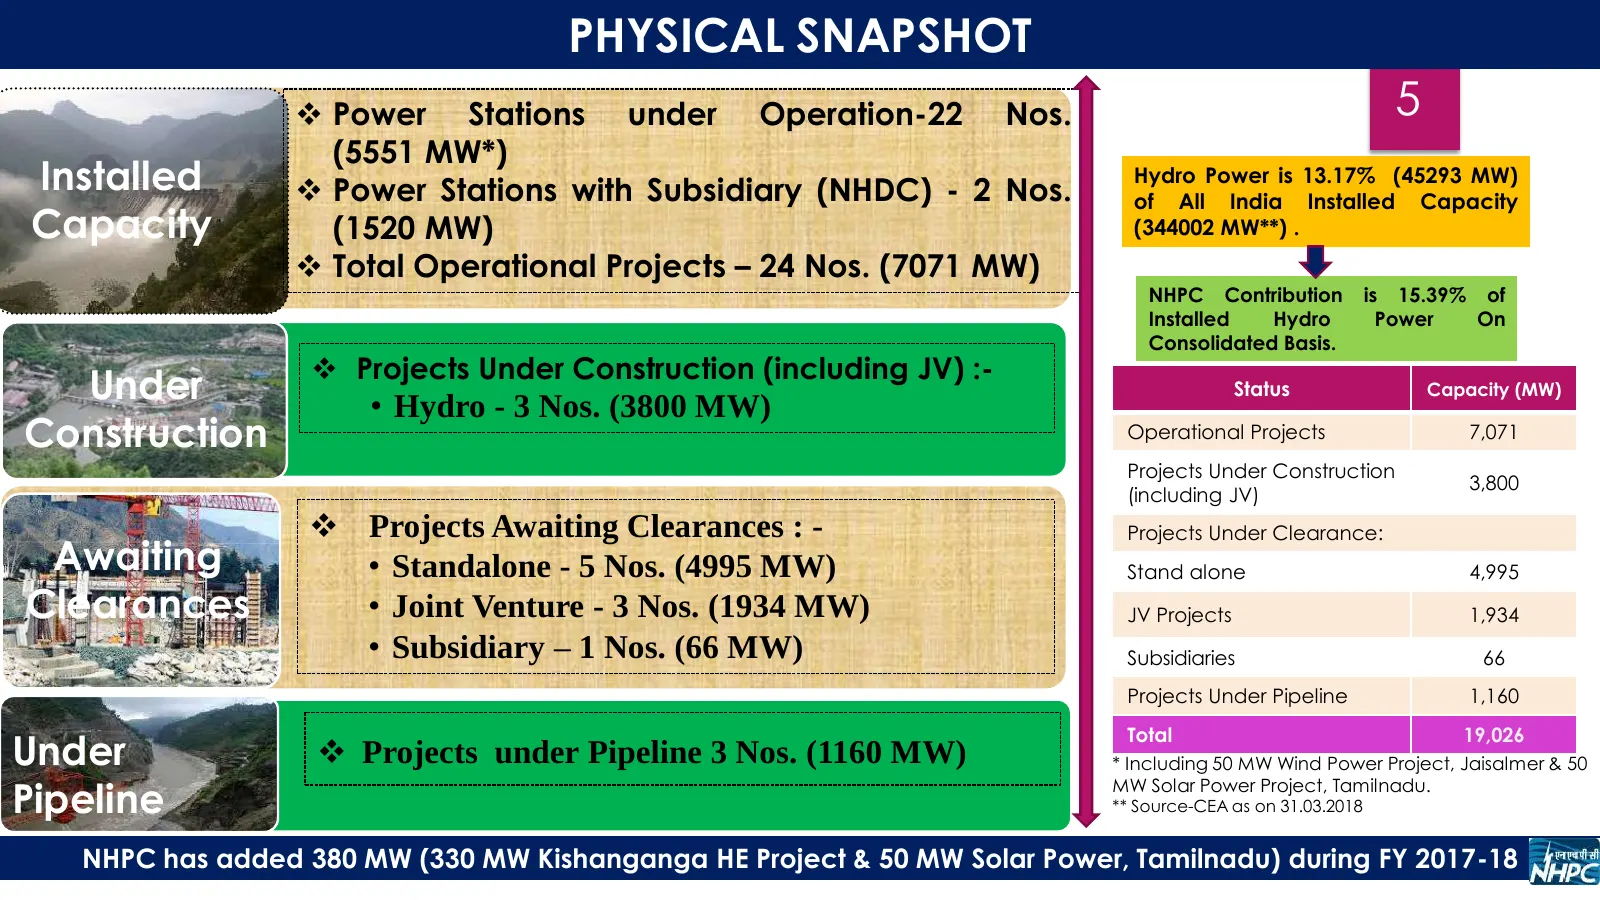
PHYSICAL SNAPSHOT Power Stations under Operation-22 Nos. 5 (5551 MW*) Installed Power Stations with Subsidiary (NHDC) - 2 Nos. Hydro Power is 13.17% (45293 MW) of All India Installed Capacity Capacity (1520 MW) (344002 MW**) . Total Operational Projects – 24 Nos. (7071 MW) NHPC Contribution is
Slide 7: Track Record – A Ten Year Digest
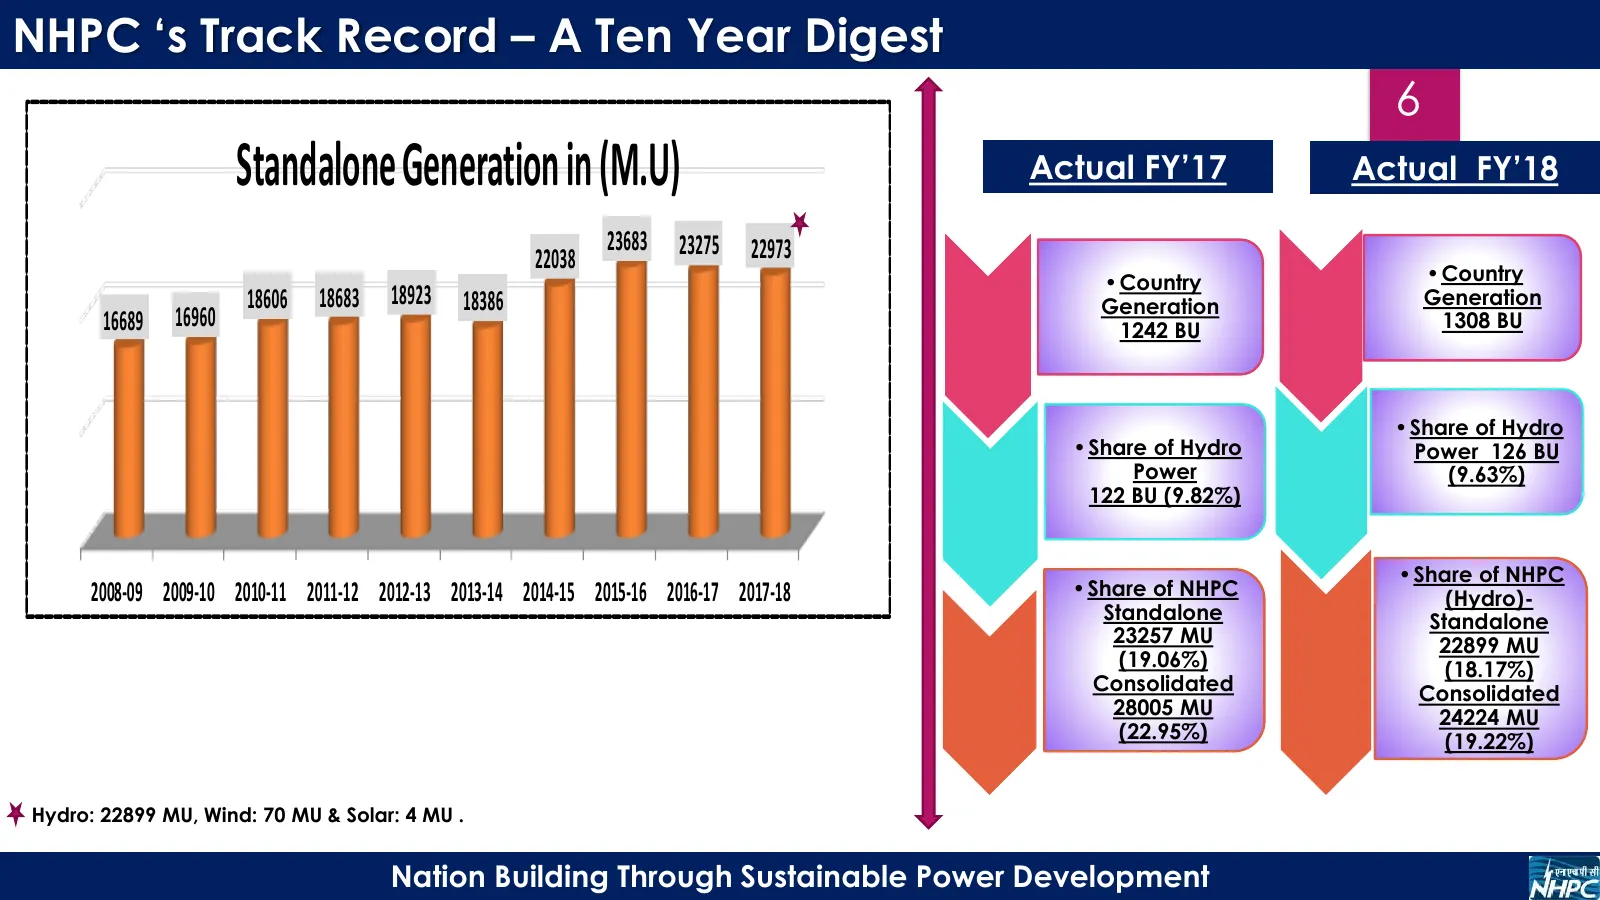
NHPC ‘s Track Record – A Ten Year Digest 6 Installed Standalone Generation in (M.U) Actual FY’17 Actual FY’18 Capacity 23683 23275 22973 22038 •Country •Country 18606 18683 18923 18386 Generation Generation 16689 16960 1242 BU 1308 BU Under Construction •Share of Hydro •Share of Hydro Power 126 BU P
Slide 8: Financial Highlights
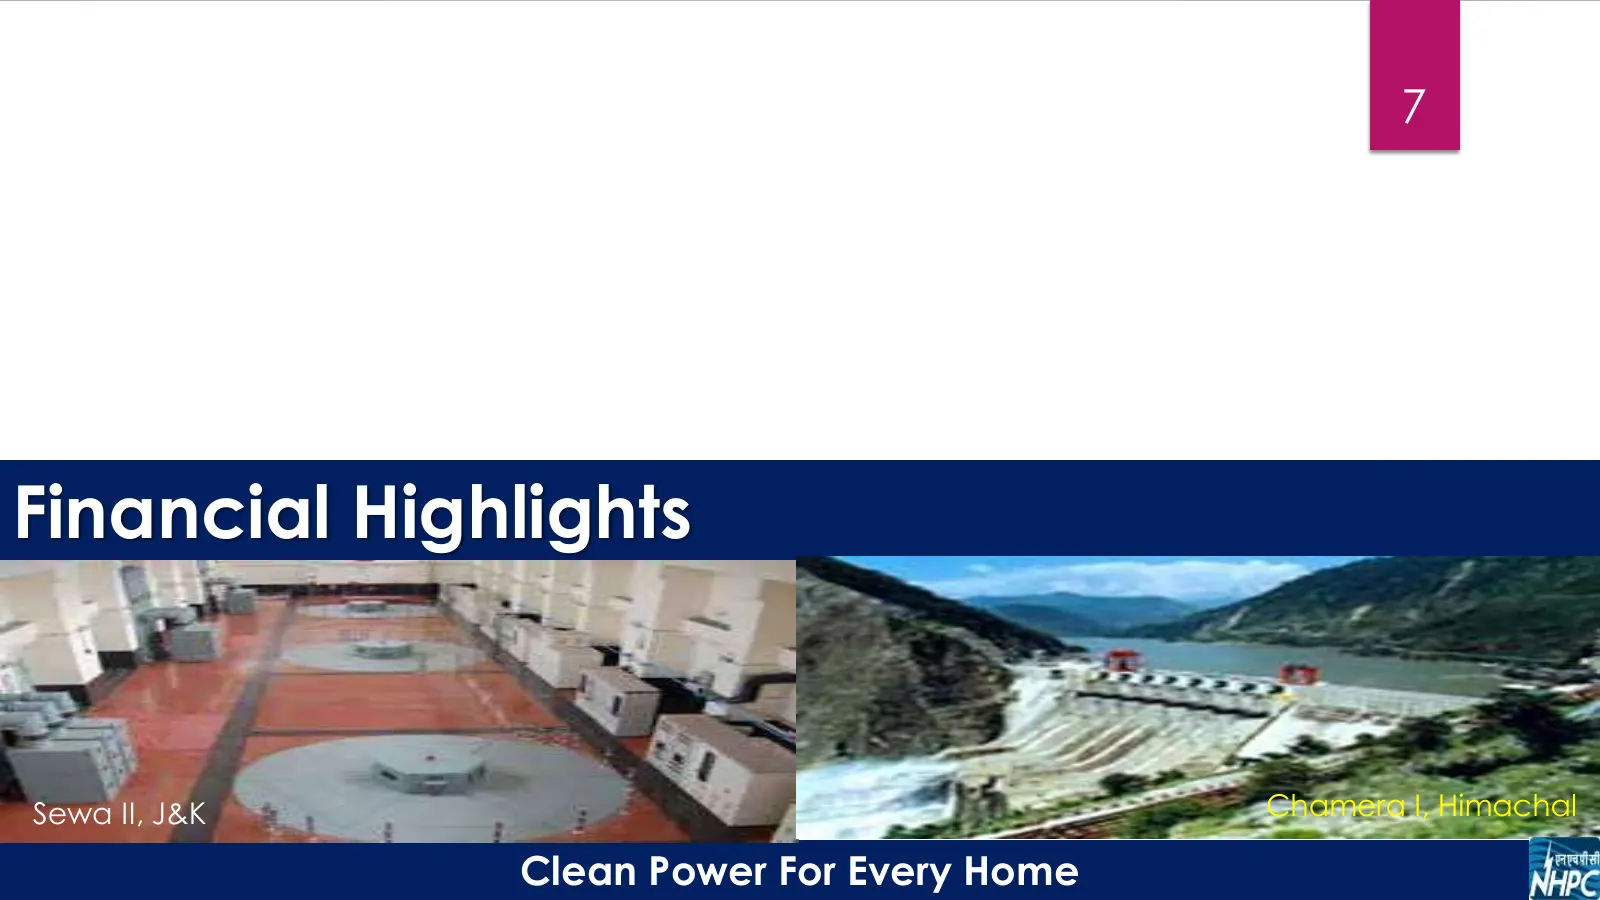
7 Financial Highlights Sewa II, J&K Chamera I, Himachal Clean Power For Every Home
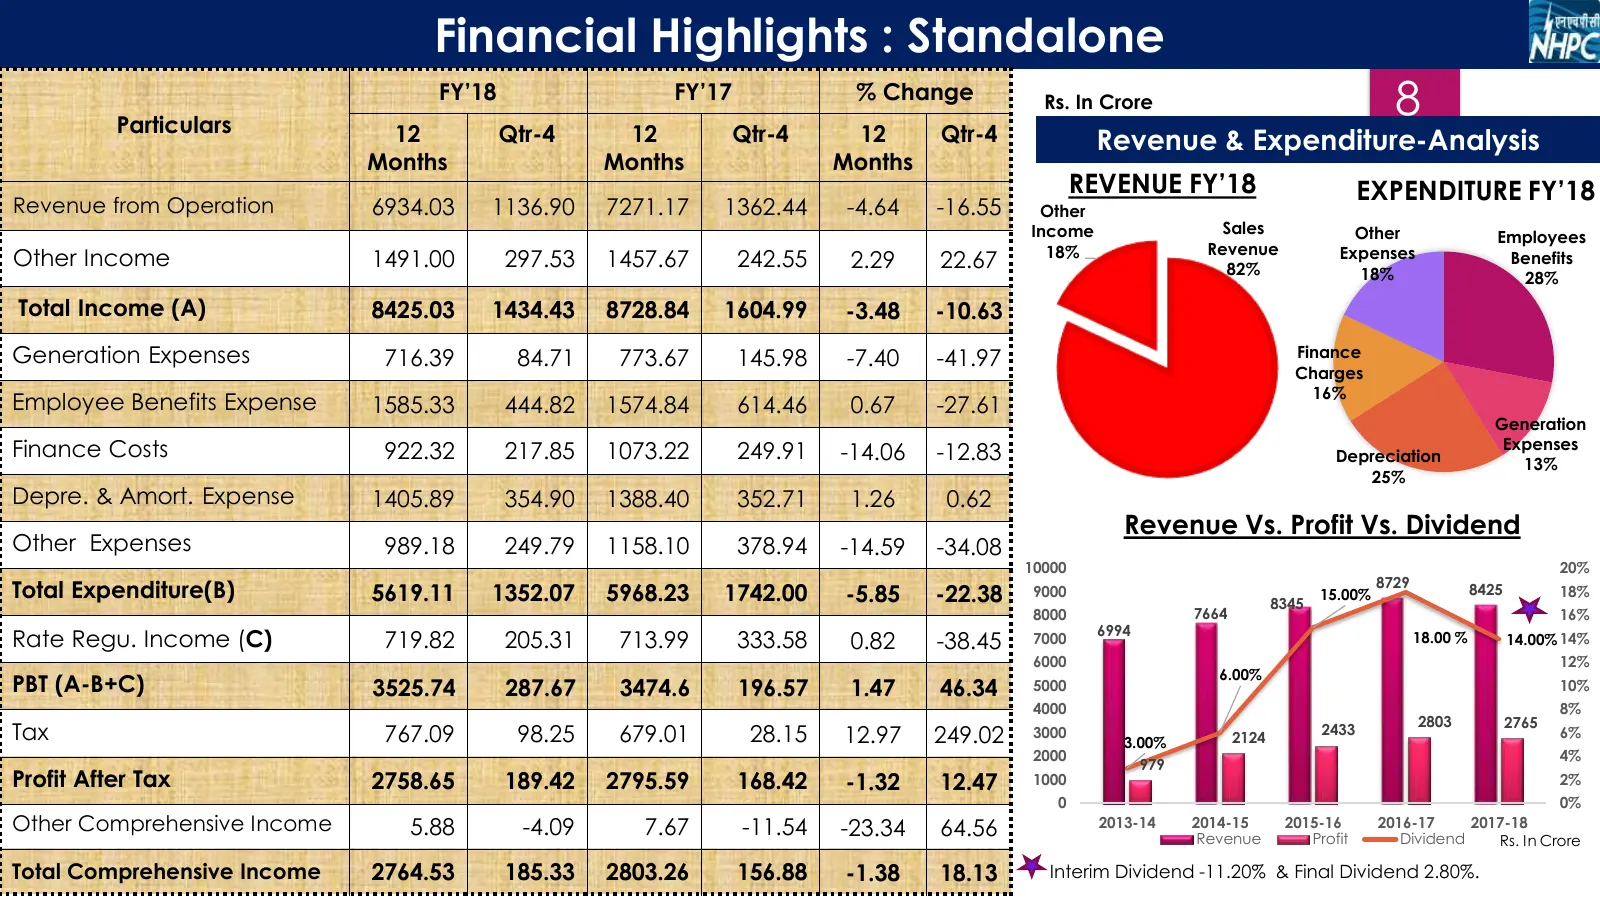
Slide 9: Financial Highlights: Standalone
Financial Highlights : Standalone Particulars FY’18 FY’17 % Change Rs. In Crore 8 12 Qtr-4 12 Qtr-4 12 Qtr-4 Revenue & Expenditure-Analysis Months Months Months REVENUE FY’18 EXPENDITURE FY’18 Revenue from Operation 6934.03 1136.90 7271.17 1362.44 -4.64 -16.55 Other Income Sales Other Employees 18%
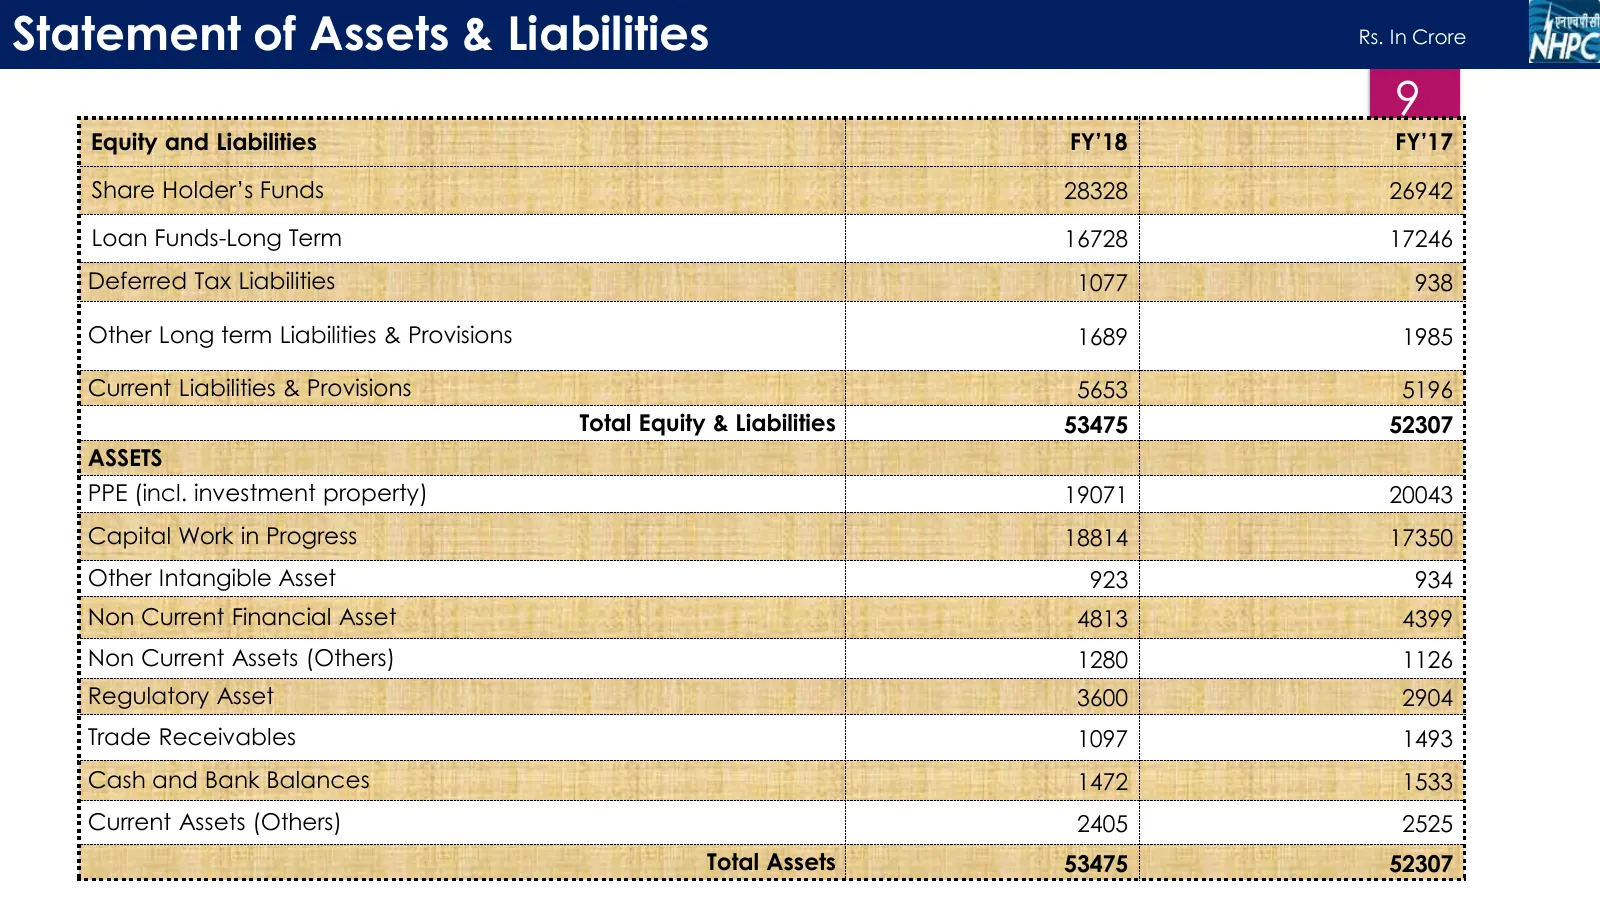
Slide 10: Statement of Assets & Liabilities
Statement of Assets & Liabilities Rs. In Crore 9 Equity and Liabilities FY’18 FY’17 Share Holder’s Funds 28328 26942 Loan Funds-Long Term 16728 17246 Deferred Tax Liabilities 1077 938 Other Long term Liabilities & Provisions 1689 1985 Current Liabilities & Provisions 5653 5196 Total Equity & Liabili
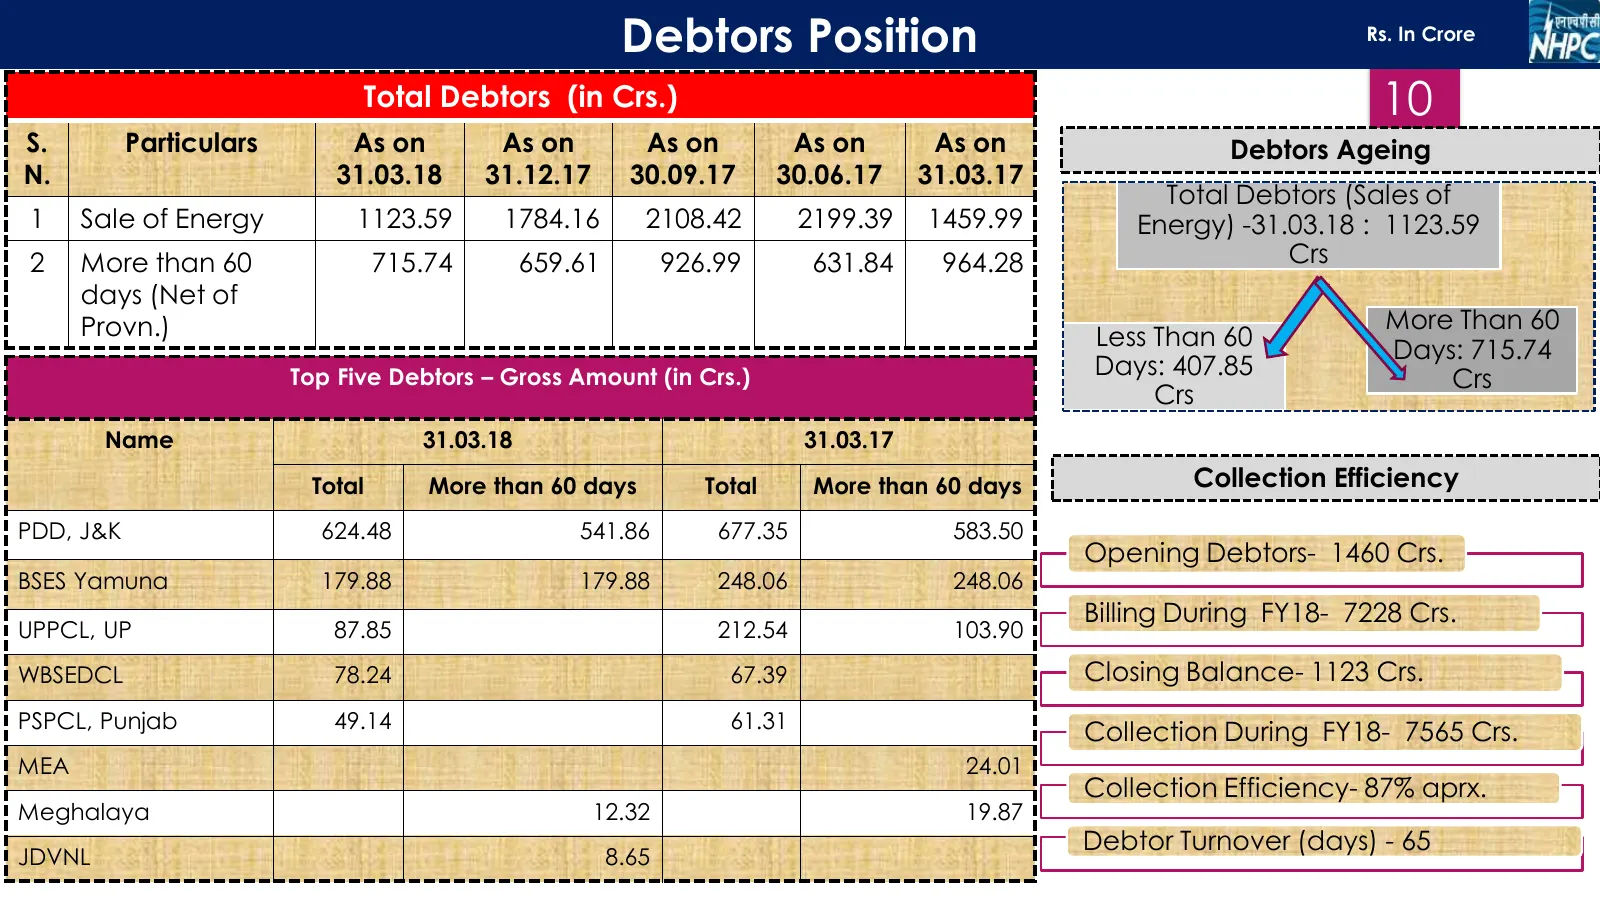
Slide 11: Debtors Position
Debtors Position Rs. In Crore Total Debtors (in Crs.) 10 S. Particulars As on As on As on As on As on Debtors Ageing N. 31.03.18 31.12.17 30.09.17 30.06.17 31.03.17 Total Debtors (Sales of 1 Sale of Energy 1123.59 1784.16 2108.42 2199.39 1459.99 Energy) -31.03.18 : 1123.59 2 More than 60 715.74 659.
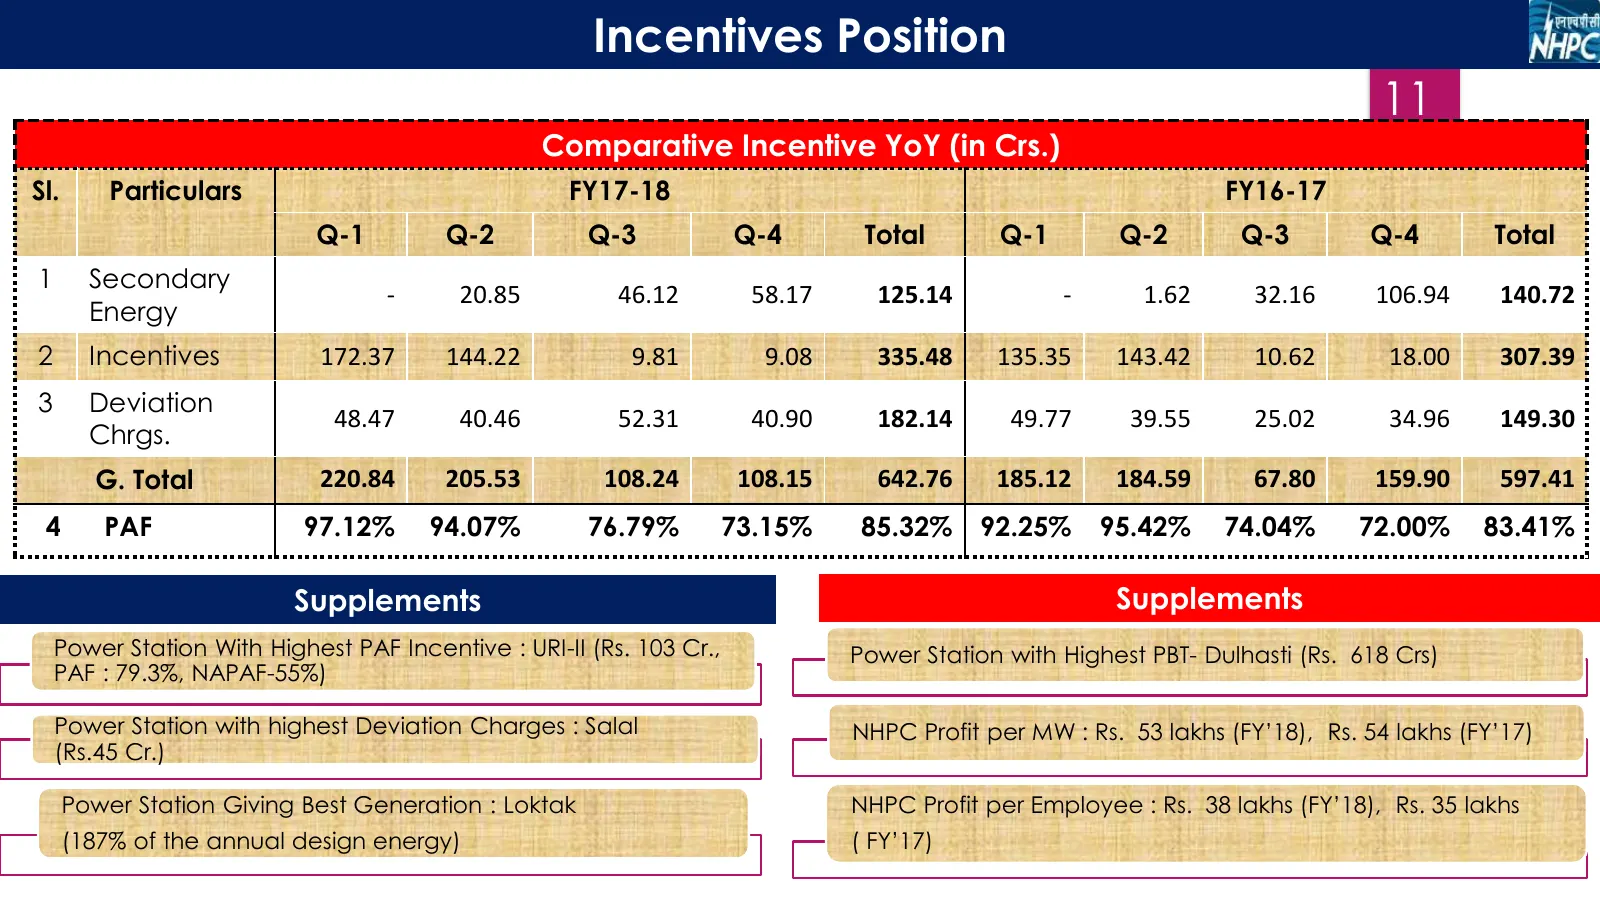
Slide 12: Incentives Position
Incentives Position 11 Comparative Incentive YoY (in Crs.) Rs. In Crore Sl. Particulars FY17-18 FY16-17 Q-1 Q-2 Q-3 Q-4 Total Q-1 Q-2 Q-3 Q-4 Total 1 Secondary - 20.85 46.12 58.17 125.14 - 1.62 32.16 106.94 140.72 Energy 2 Incentives 172.37 144.22 9.81 9.08 335.48 135.35 143.42 10.62 18.00 307.39 3
Slide 13: Key Financials: FY'18
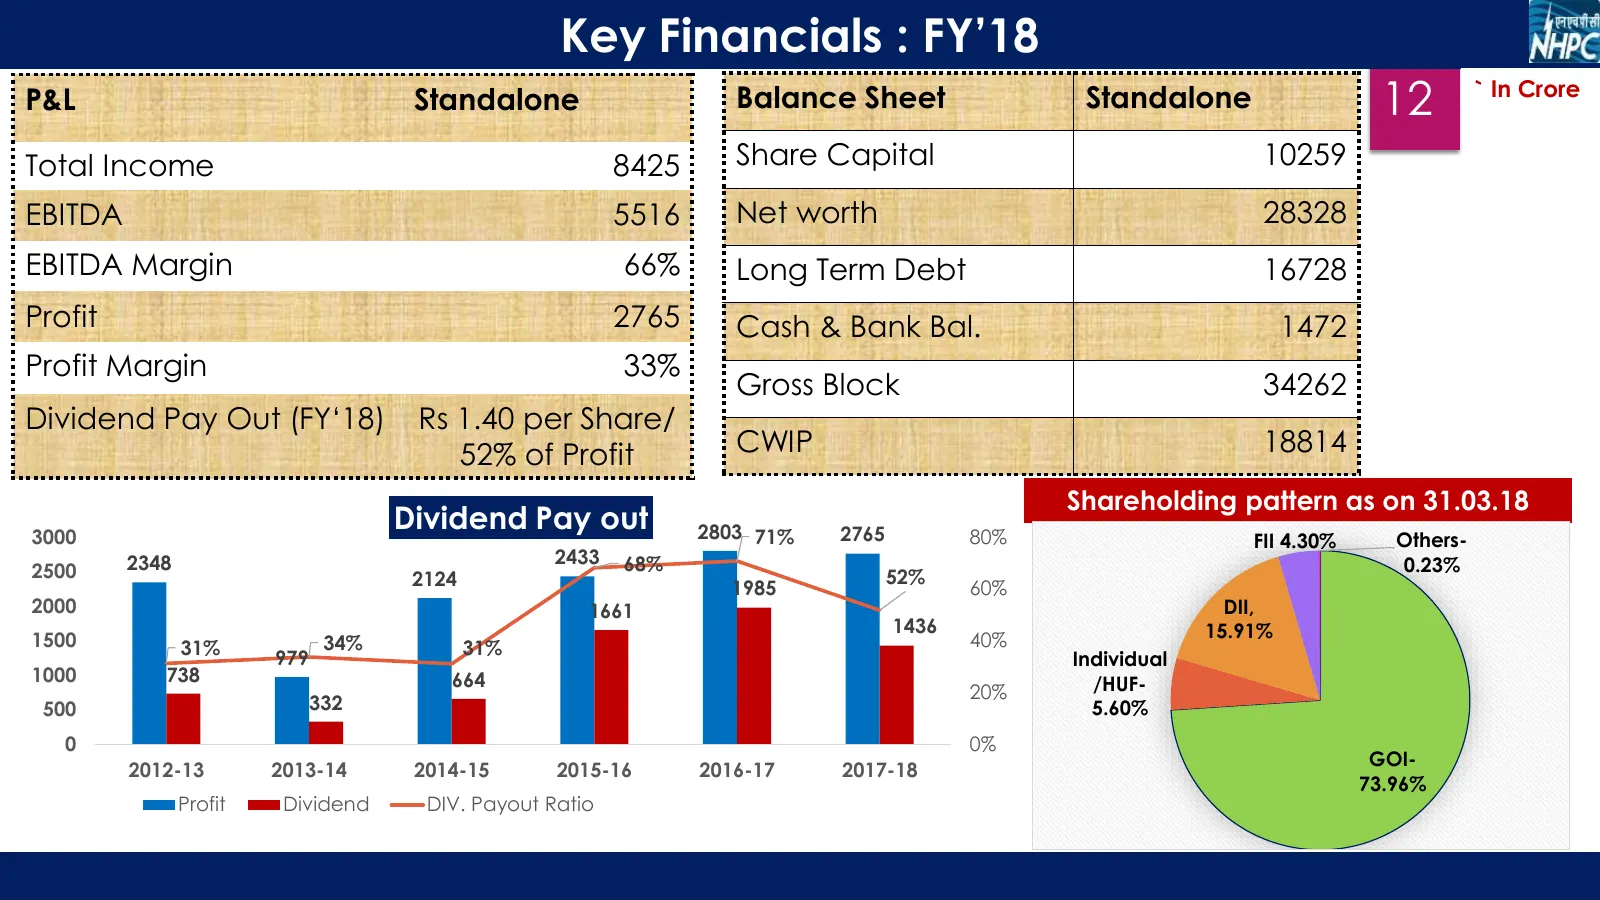
Key Financials : FY’18 P&L Standalone Balance Sheet Standalone 12 ` In Crore Total Income 8425 Share Capital 10259 EBITDA 5516 Net worth 28328 EBITDA Margin 66% Long Term Debt 16728 Profit 2765 Cash & Bank Bal. 1472 Profit Margin 33% Gross Block 34262 Dividend Pay Out (FY‘18) Rs 1.40 per Share/ 52%
Slide 14: NHPC – Key Ratios
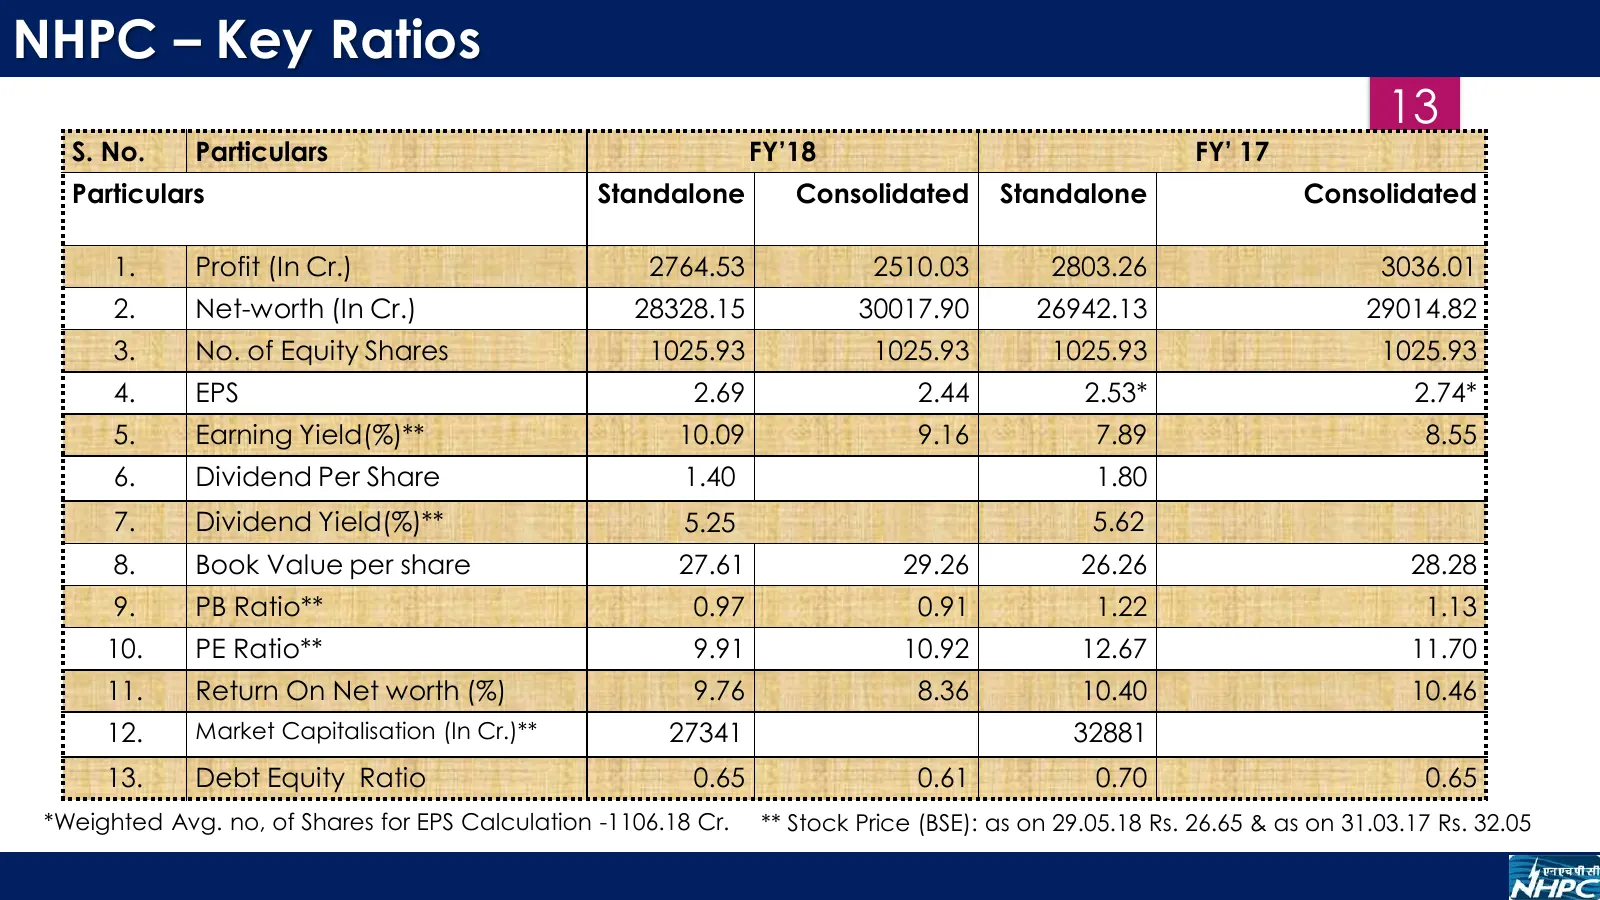
NHPC – Key Ratios 13 S. No. Particulars FY’18 FY’ 17 Particulars Standalone Consolidated Standalone Consolidated 1. Profit (In Cr.) 2764.53 2510.03 2803.26 3036.01 2. Net-worth (In Cr.) 28328.15 30017.90 26942.13 29014.82 3. No. of Equity Shares 1025.93 1025.93 1025.93 1025.93 4. EPS 2.69 2.44 2.53*
Slide 15: NHDC Ltd. (Subsidiary) – Snapshots FY17-18
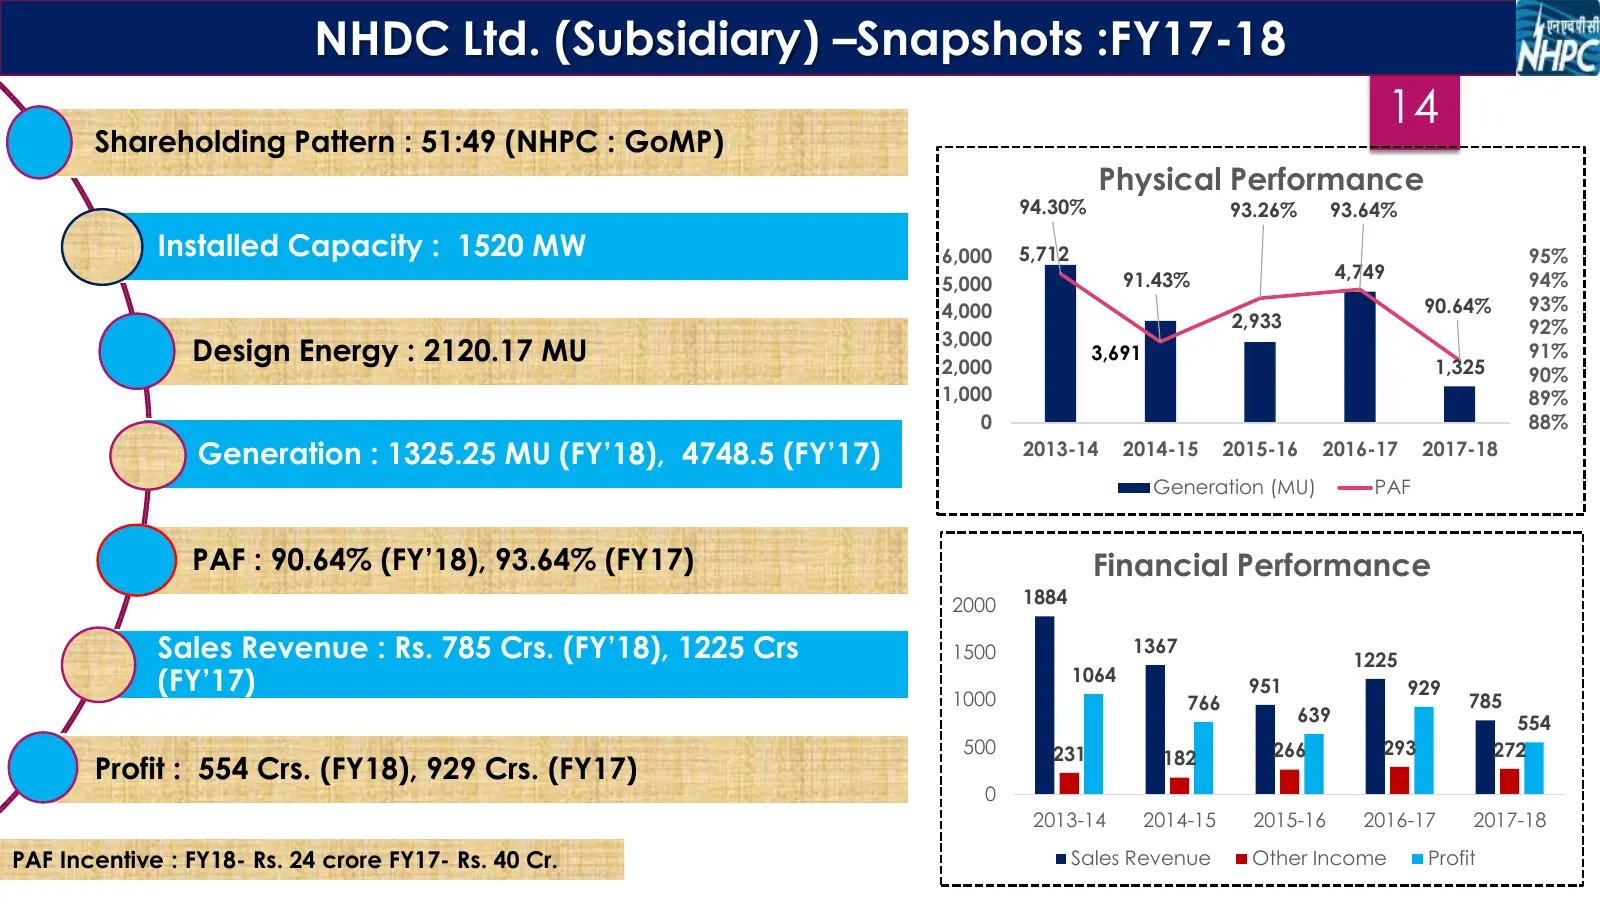
NHDC Ltd. (Subsidiary) –Snapshots :FY17-18 14 Shareholding Pattern : 51:49 (NHPC : GoMP) Physical Performance 94.30% 93.26% 93.64% Installed Capacity : 1520 MW 6,000 5,712 95% 91.43% 4,749 94% 5,000 4,000 90.64% 93% 2,933 92% 3,000 Design Energy : 2120.17 MU 2,000 3,691 1,325 91% 90% 1,000 89% 0 88%
Slide 16: Progressive Physical & Financial Schedule (Hydro)
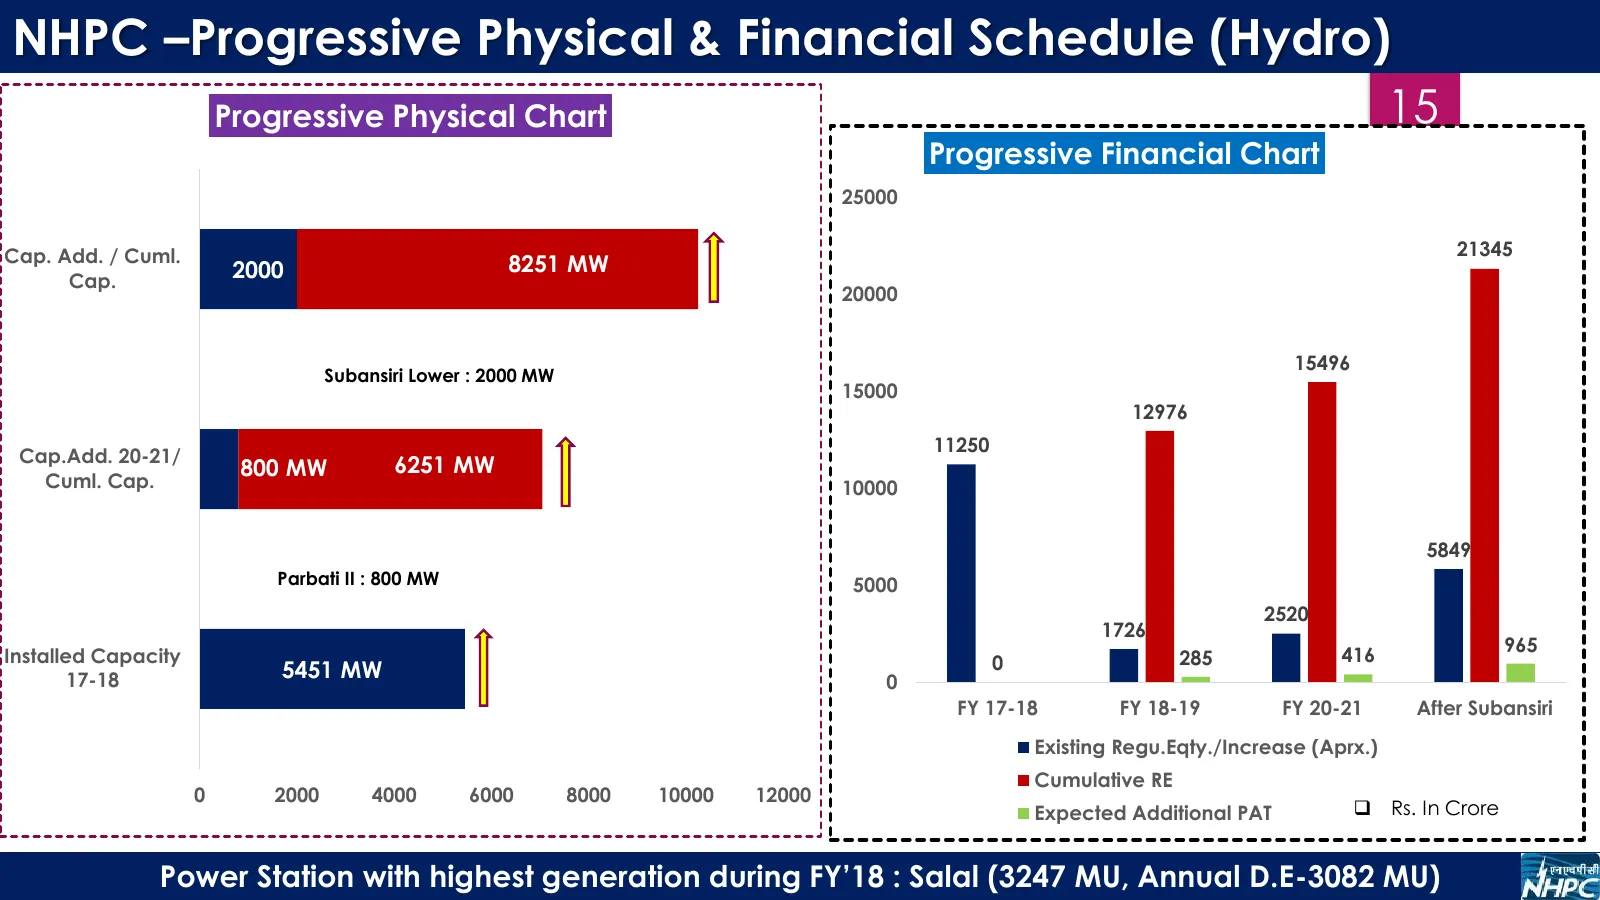
NHPC –Progressive Physical & Financial Schedule (Hydro) Progressive Physical Chart 15 Progressive Financial Chart 25000 Cap. Add. / Cuml. 21345 2000 8251 MW Cap. 20000 15496 Subansiri Lower : 2000 MW 15000 12976 11250 Cap.Add. 20-21/ 6251 MW Cuml. Cap. 800 MW 10000 5849 Parbati II : 800 MW 5000 2520
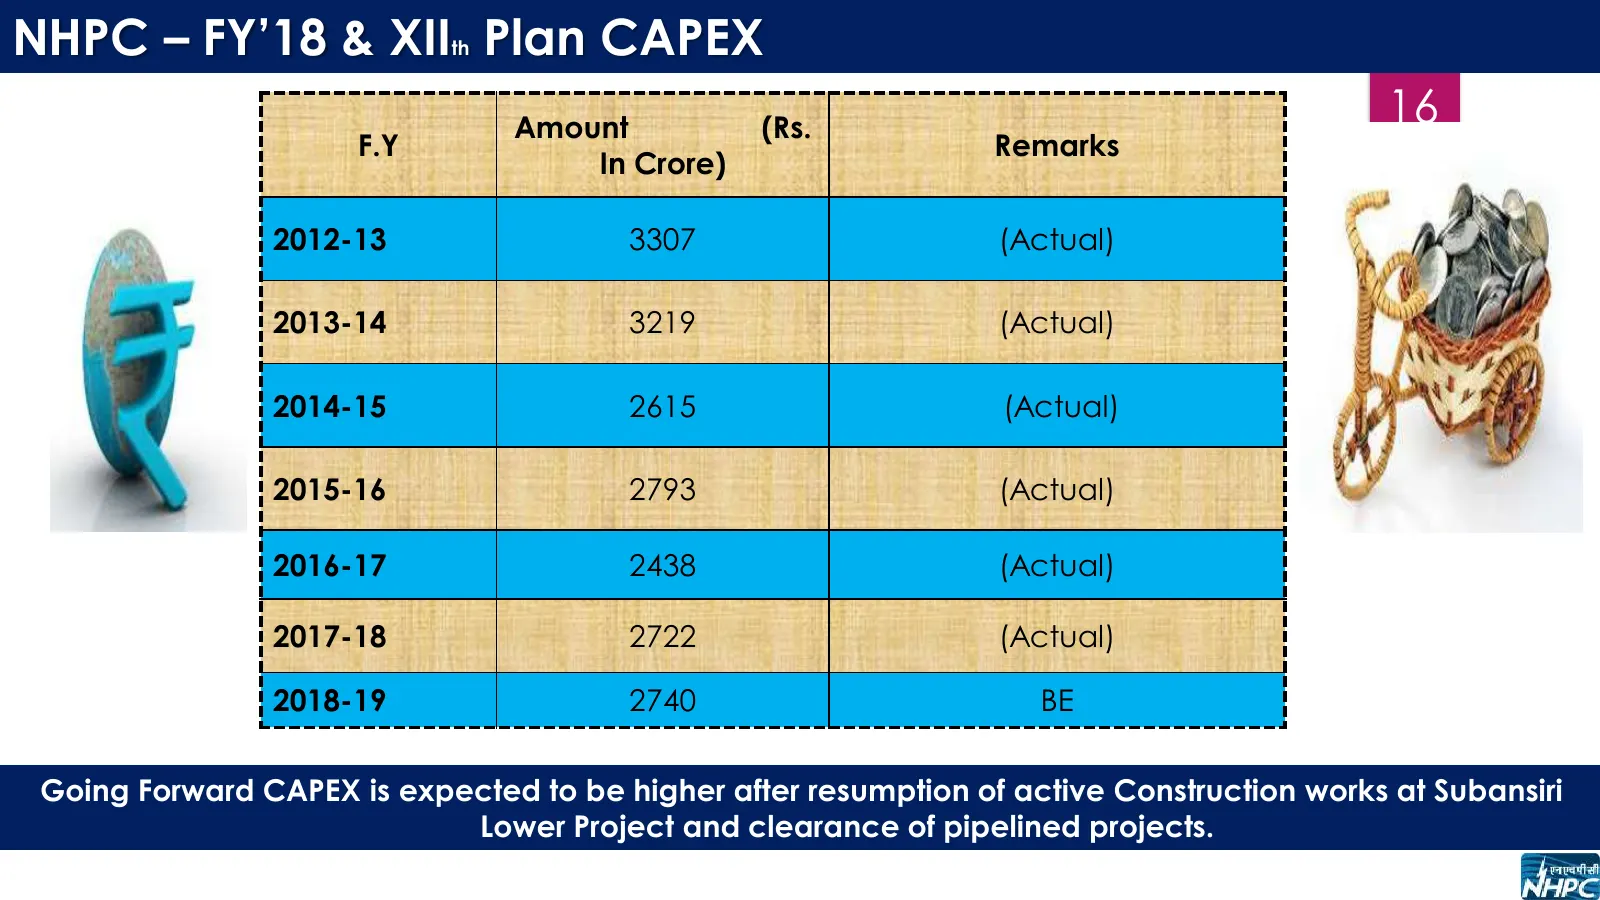
Slide 17: FY'18 & XII Plan CAPEX
NHPC – FY’18 & XII Plan CAPEX th Amount (Rs. 16 F.Y Remarks In Crore) 2012-13 3307 (Actual) 2013-14 3219 (Actual) 2014-15 2615 (Actual) 2015-16 2793 (Actual) 2016-17 2438 (Actual) 2017-18 2722 (Actual) 2018-19 2740 BE Going Forward CAPEX is expected to be higher after resumption of active Constructi
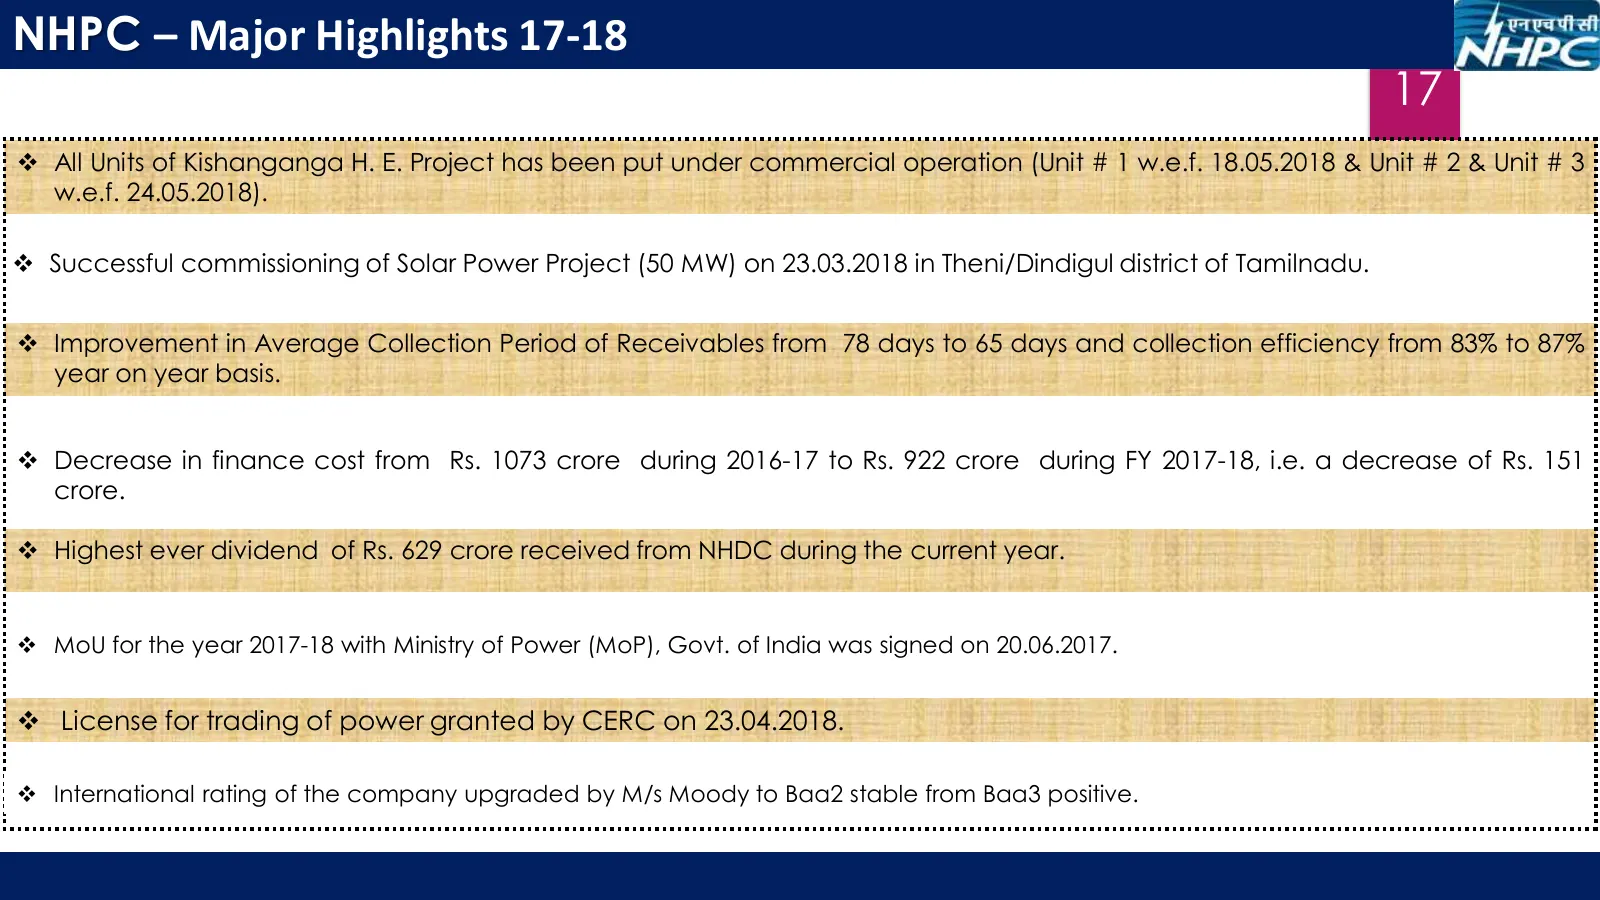
Slide 18: Major Highlights 17-18
NHPC – Major Highlights 17-18 17 All Units of Kishanganga H. E. Project has been put under commercial operation (Unit # 1 w.e.f. 18.05.2018 & Unit # 2 & Unit # 3 w.e.f. 24.05.2018). Successful commissioning of Solar Power Project (50 MW) on 23.03.2018 in Theni/Dindigul district of Tamilnadu. I
Slide 19: Other Business Initiative
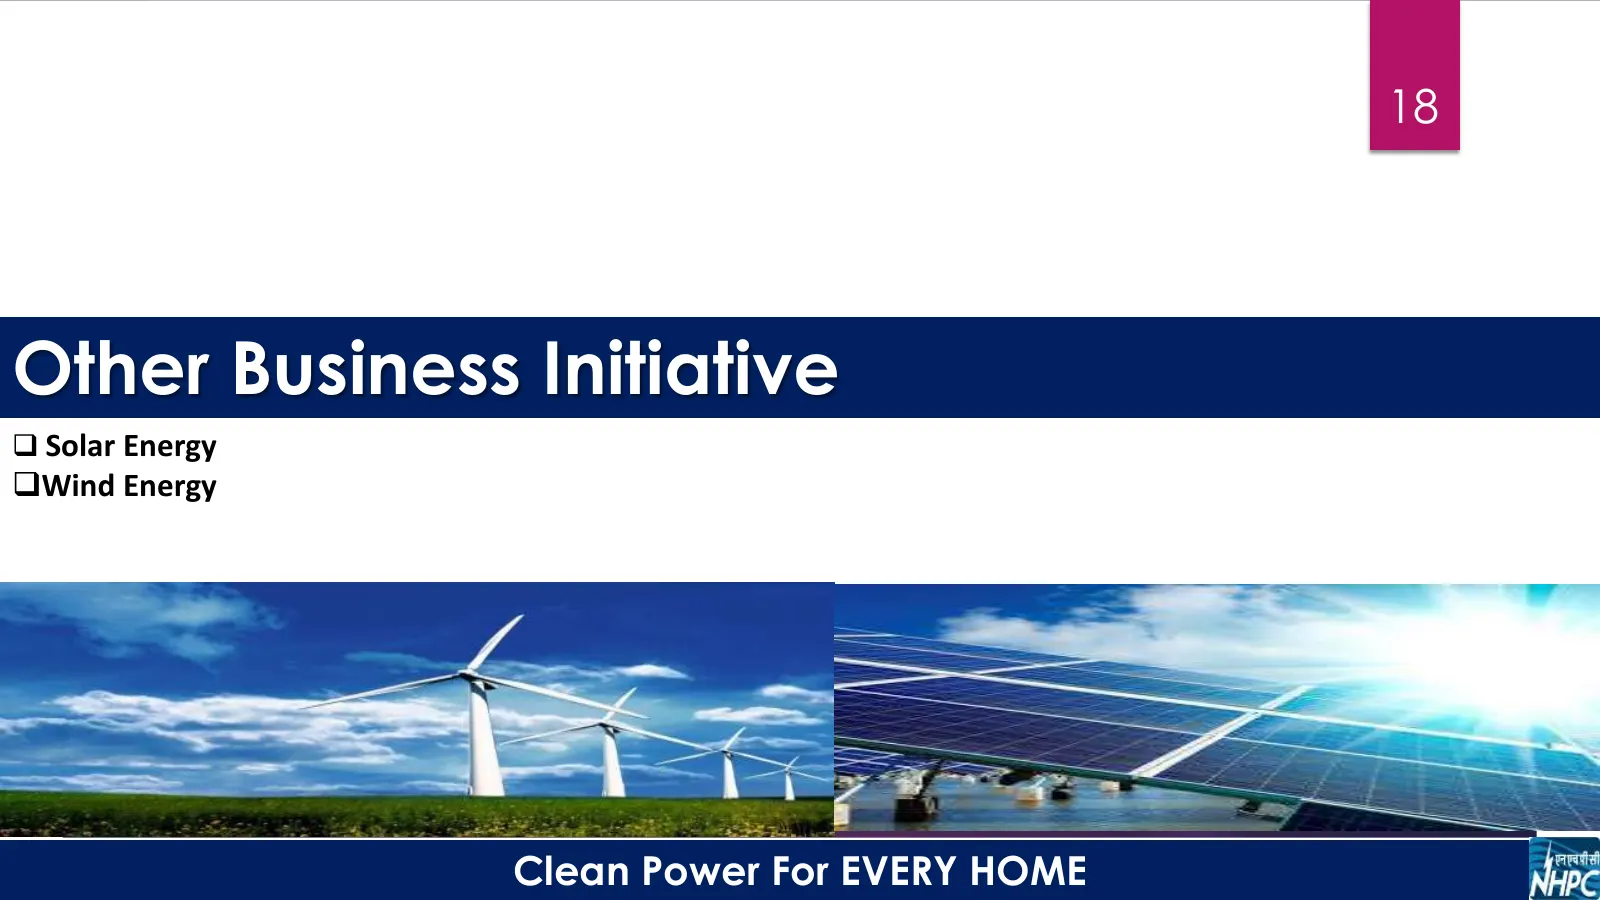
18 Other Business Initiative Solar Energy Wind Energy Clean Power For EVERY HOME
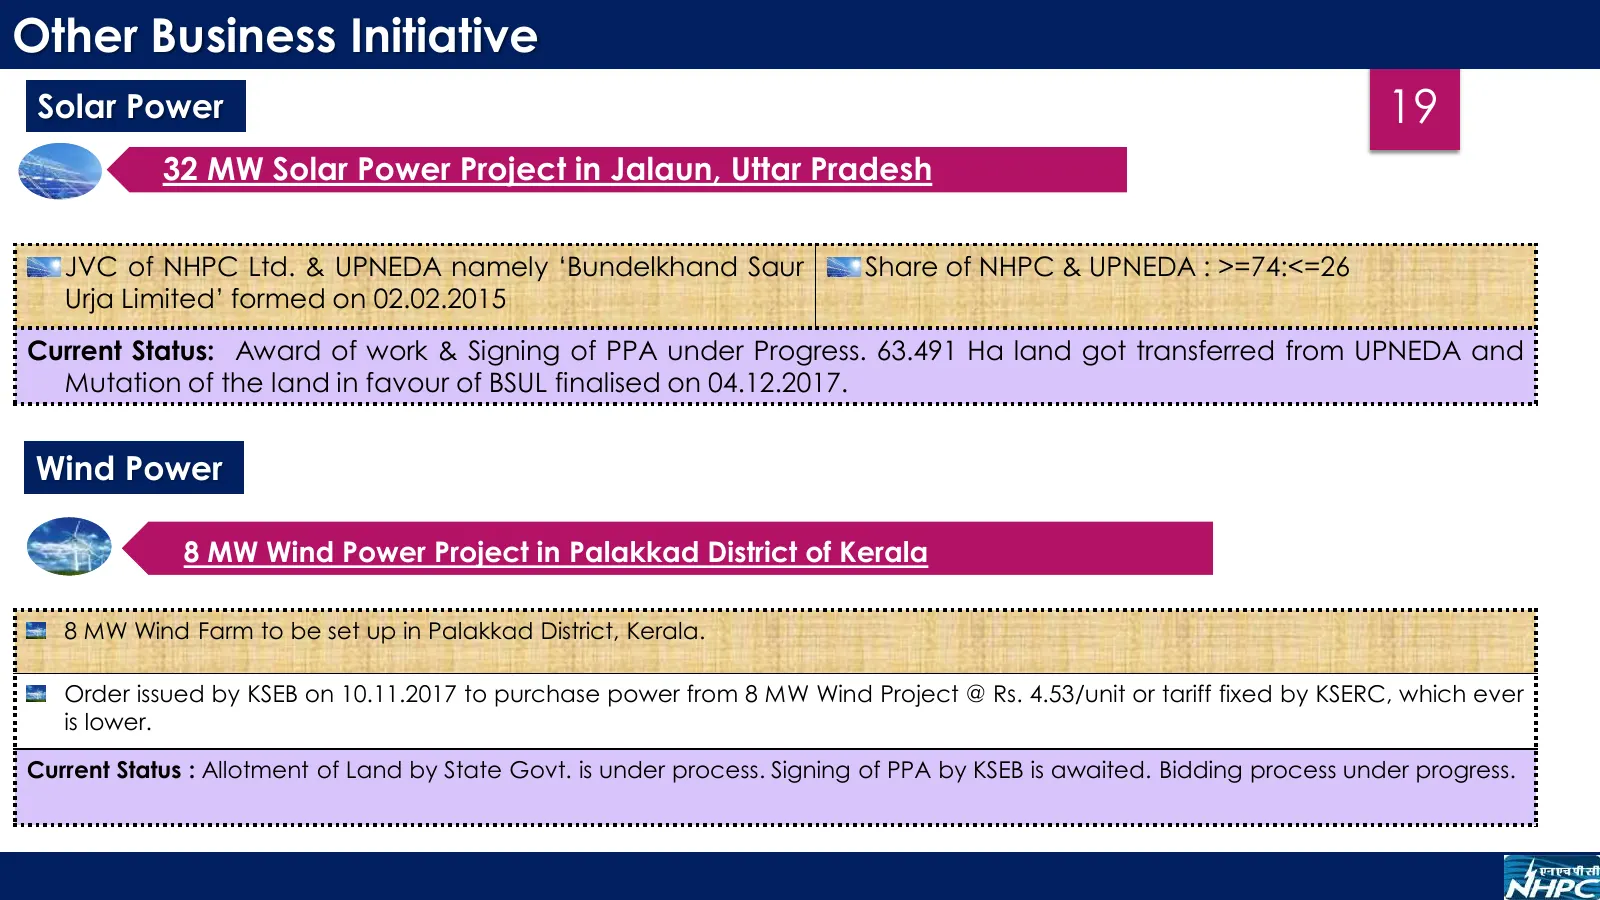
Slide 20: Other Business Initiative: Solar and Wind
Other Business Initiative Solar Power 19 32 MW Solar Power Project in Jalaun, Uttar Pradesh JVC of NHPC Ltd. & UPNEDA namely ‘Bundelkhand Saur Share of NHPC & UPNEDA : >=74:<=26 Urja Limited’ formed on 02.02.2015 Current Status: Award of work & Signing of PPA under Progress. 63.491 Ha land got trans
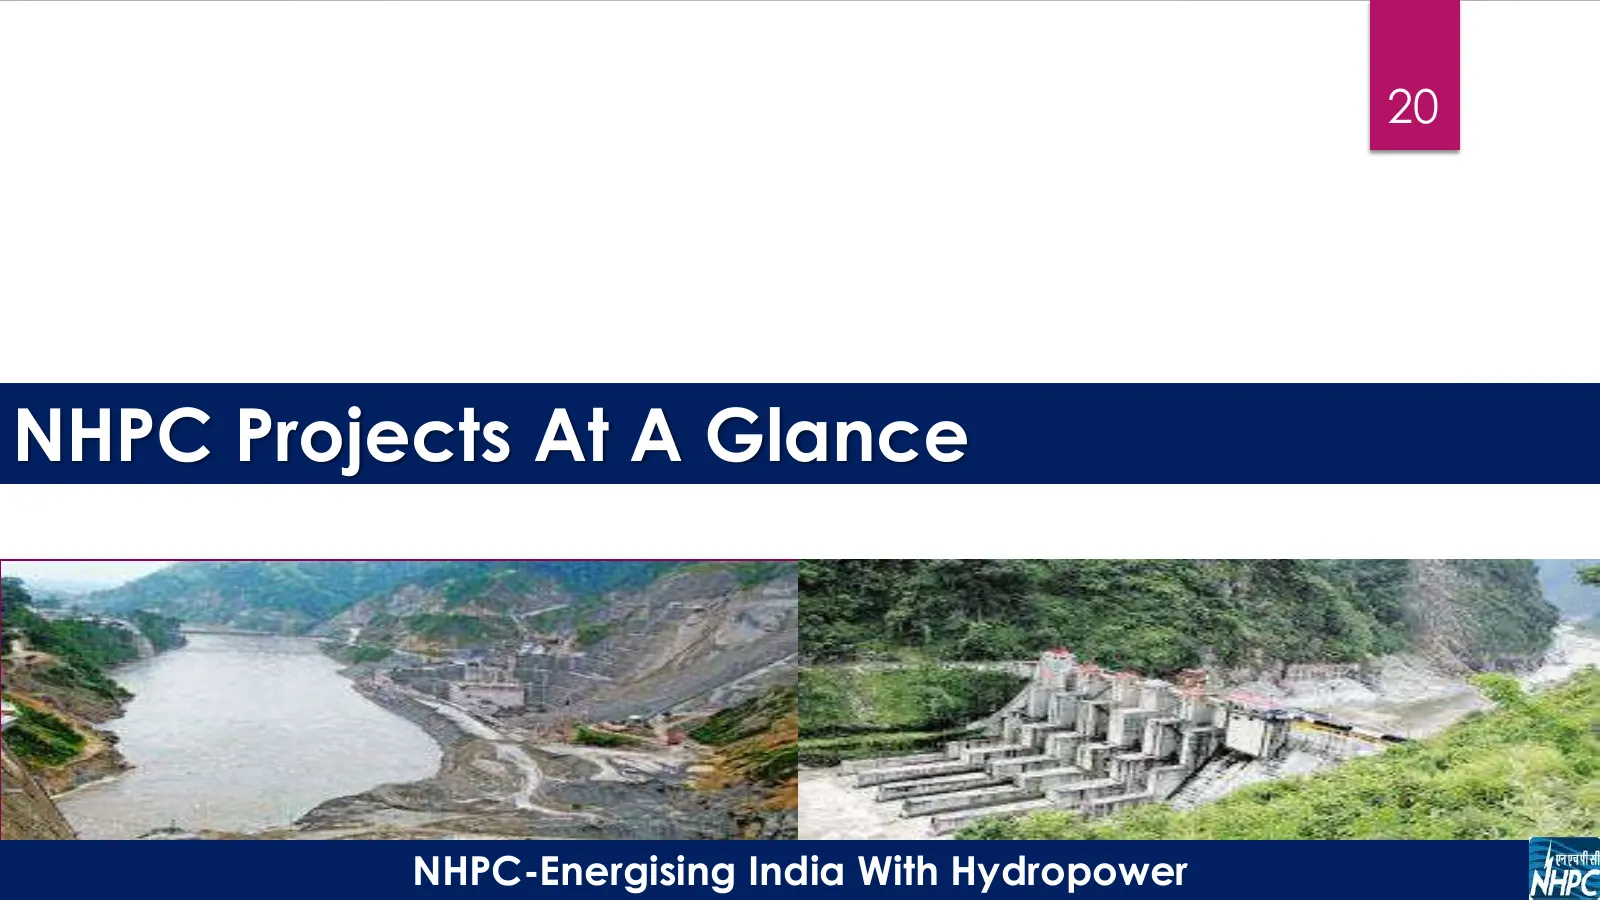
Slide 21: NHPC Projects At A Glance
20 NHPC Projects At A Glance NHPC-Energising India With Hydropower
Slide 22: Projects in Operation
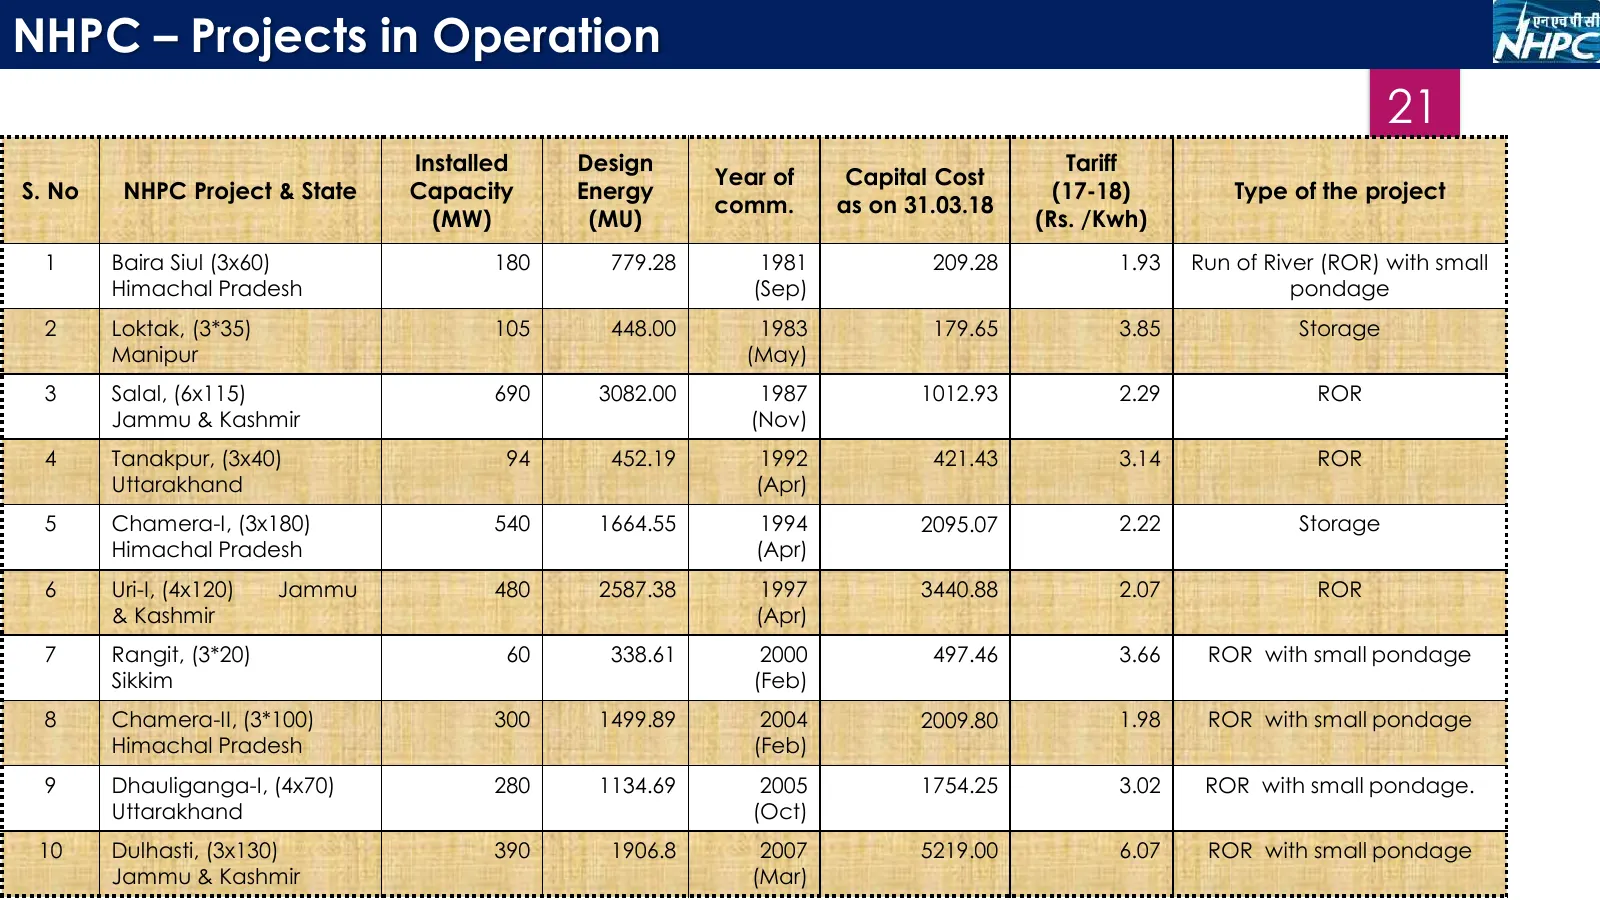
NHPC – Projects in Operation 21 Installed Design Tariff Year of Capital Cost S. No NHPC Project & State Capacity Energy (17-18) Type of the project comm. as on 31.03.18 (MW) (MU) (Rs. /Kwh) 1 Baira Siul (3x60) 180 779.28 1981 209.28 1.93 Run of River (ROR) with small Himachal Pradesh (Sep) pondage 2
Slide 23: Projects in Operation… contd.
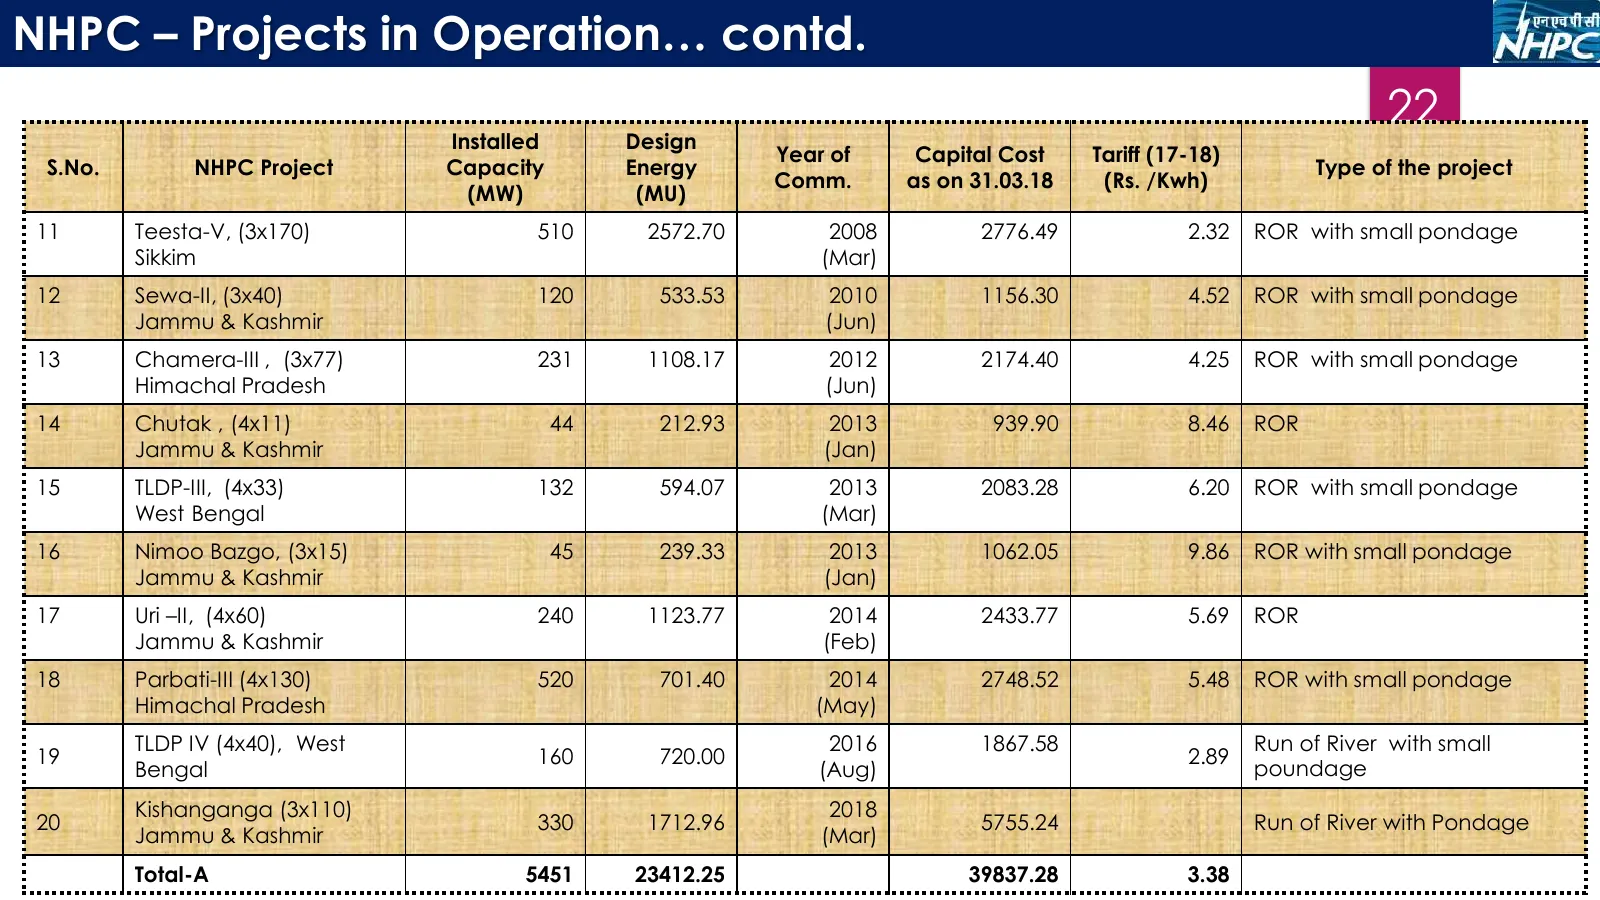
NHPC – Projects in Operation… contd. 22 Installed Design Year of Capital Cost Tariff (17-18) S.No. NHPC Project Capacity Energy Type of the project Comm. as on 31.03.18 (Rs. /Kwh) (MW) (MU) 11 Teesta-V, (3x170) 510 2572.70 2008 2776.49 2.32 ROR with small pondage Sikkim (Mar) 12 Sewa-II, (3x40) 120
Slide 24: Projects in Operation… contd.
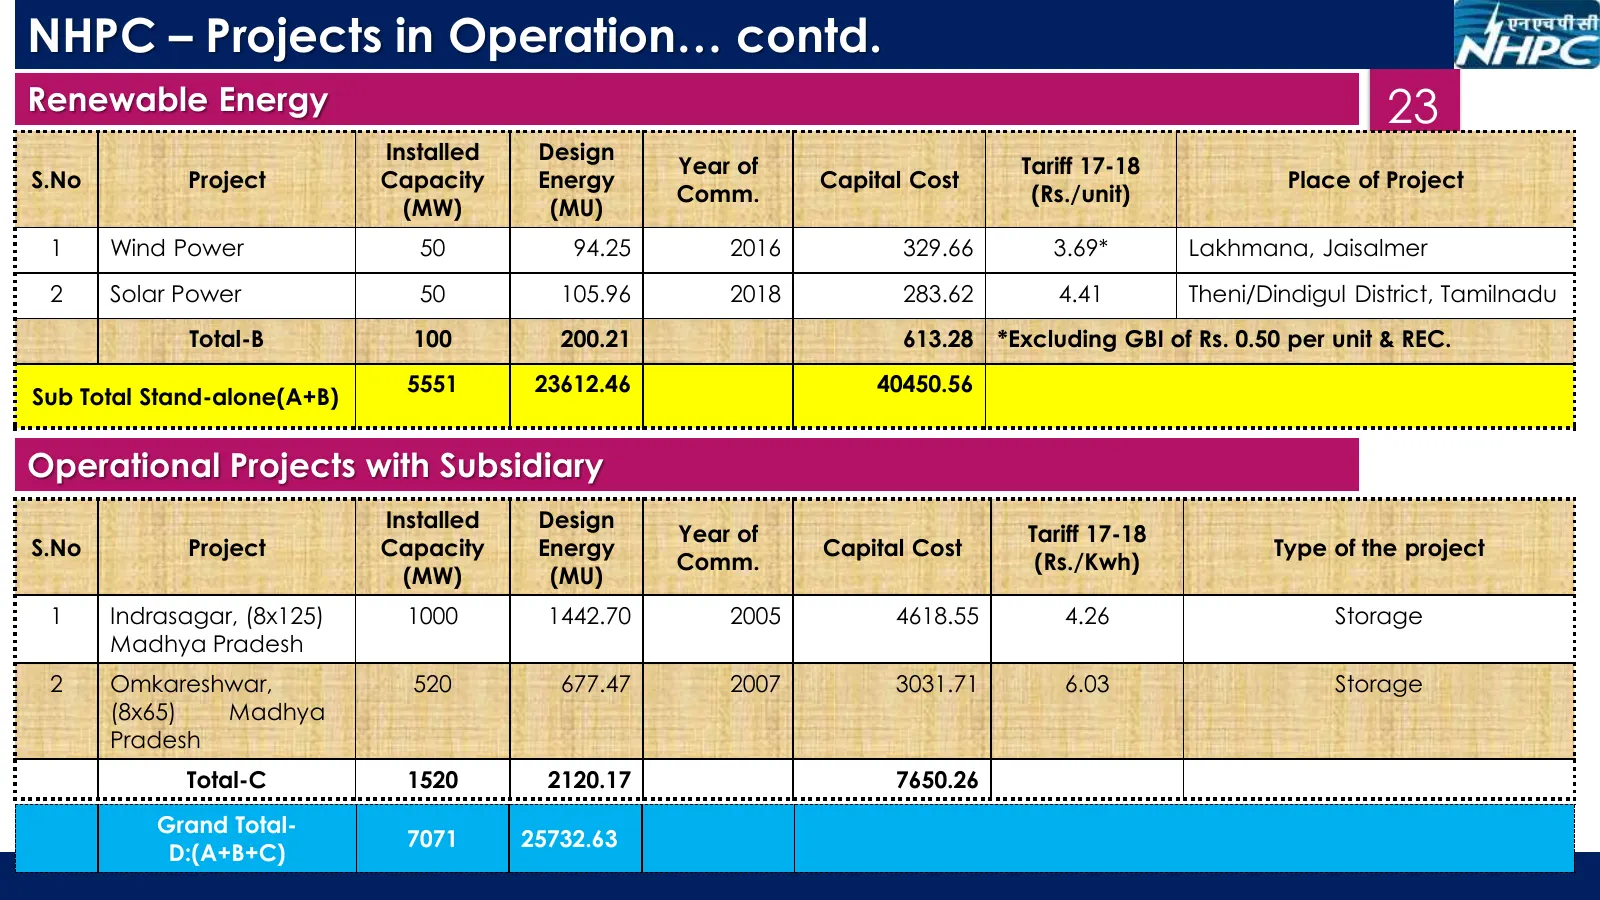
NHPC – Projects in Operation… contd. Renewable Energy 23 Installed Design Year of Tariff 17-18 S.No Project Capacity Energy Capital Cost Place of Project Comm. (Rs./unit) (MW) (MU) 1 Wind Power 50 94.25 2016 329.66 3.69* Lakhmana, Jaisalmer 2 Solar Power 50 105.96 2018 283.62 4.41 Theni/Dindigul Dis
Slide 25: Projects Under Construction
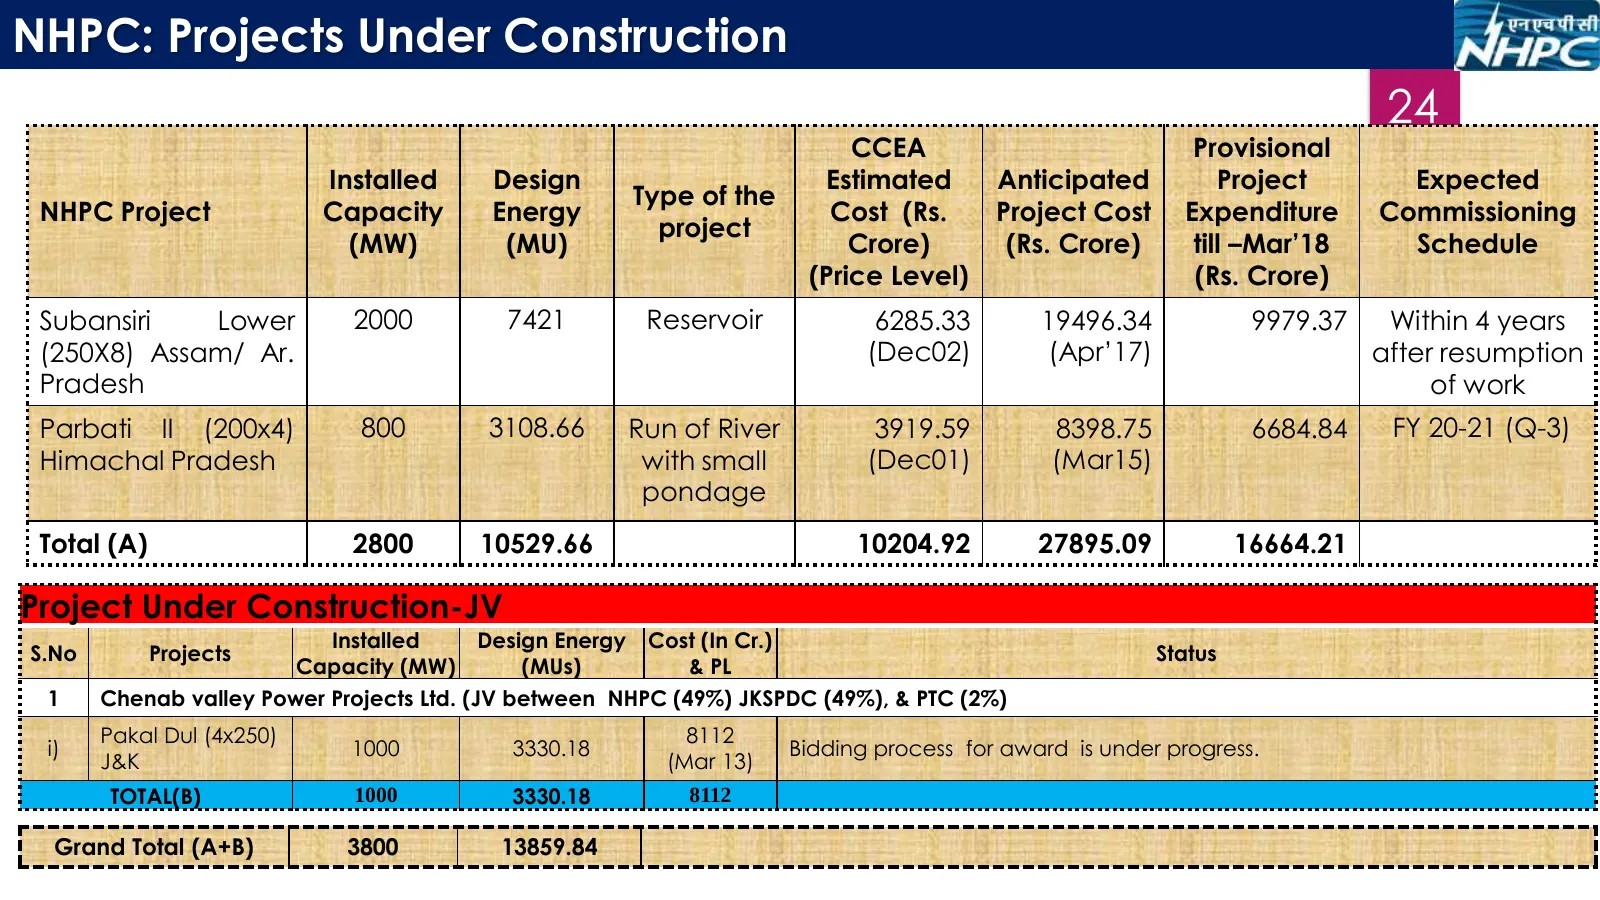
NHPC: Projects Under Construction 24 CCEA Provisional Installed Design Estimated Anticipated Project Expected Type of the NHPC Project Capacity Energy Cost (Rs. Project Cost Expenditure Commissioning project (MW) (MU) Crore) (Rs. Crore) till –Mar’18 Schedule (Price Level) (Rs. Crore) Subansiri Lower
Slide 26: Standalone Projects Under Clearance
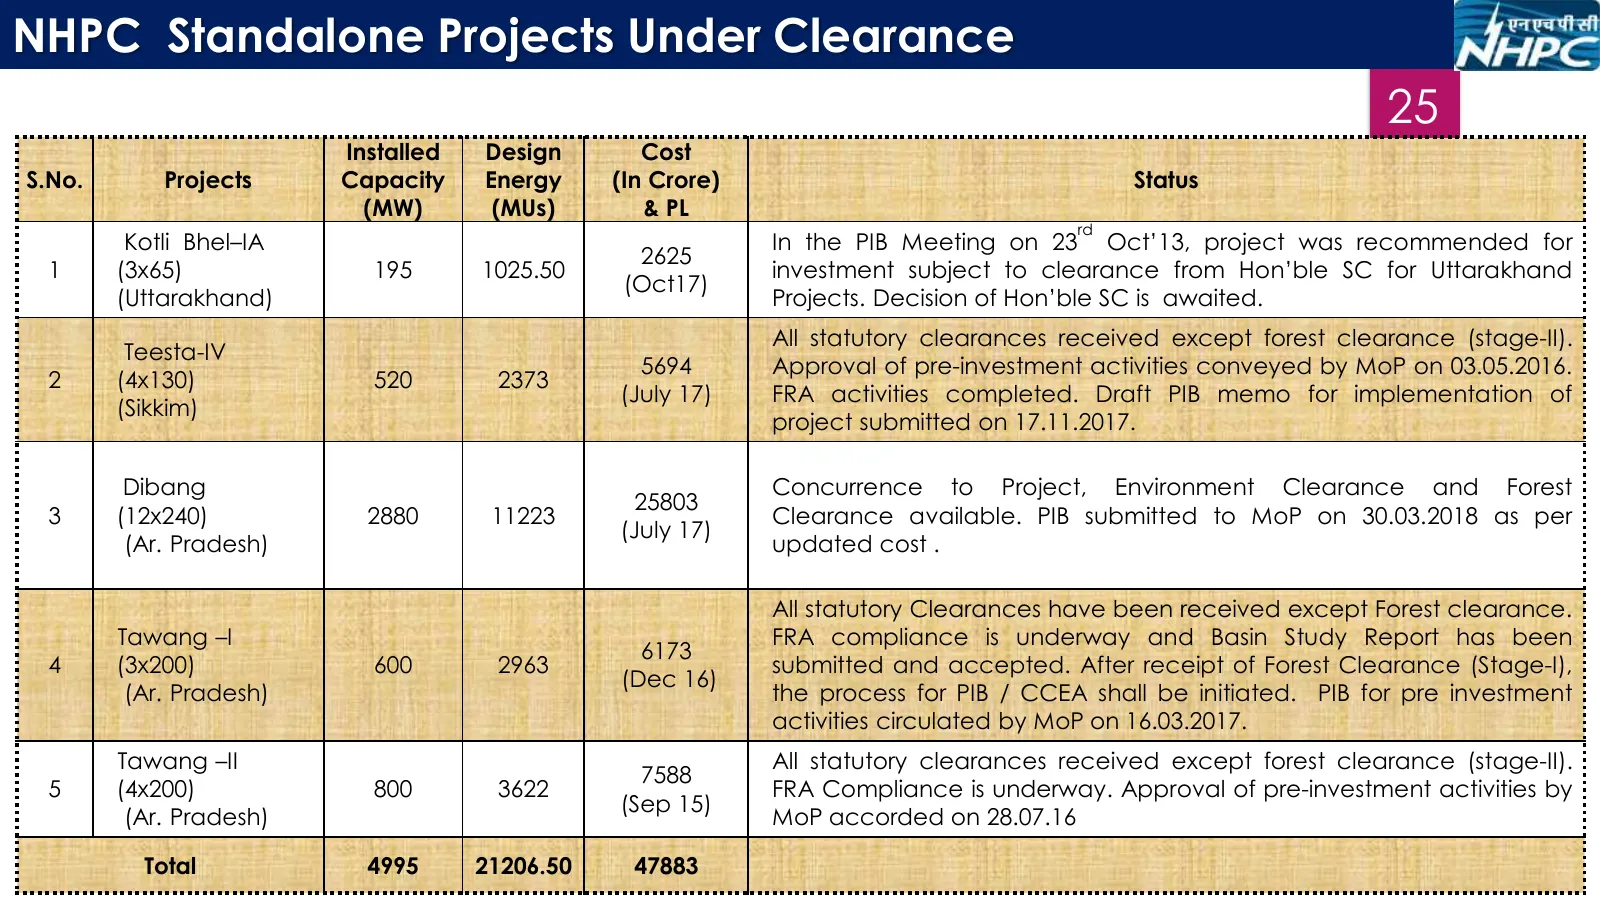
NHPC Standalone Projects Under Clearance 25 Installed Design Cost S.No. Projects Capacity Energy (In Crore) Status (MW) (MUs) & PL rd Kotli Bhel–IA In the PIB Meeting on 23 Oct’13, project was recommended for 2625 1 (3x65) 195 1025.50 investment subject to clearance from Hon’ble SC for Uttarakhand (
Slide 27: JV Projects Under Clearance
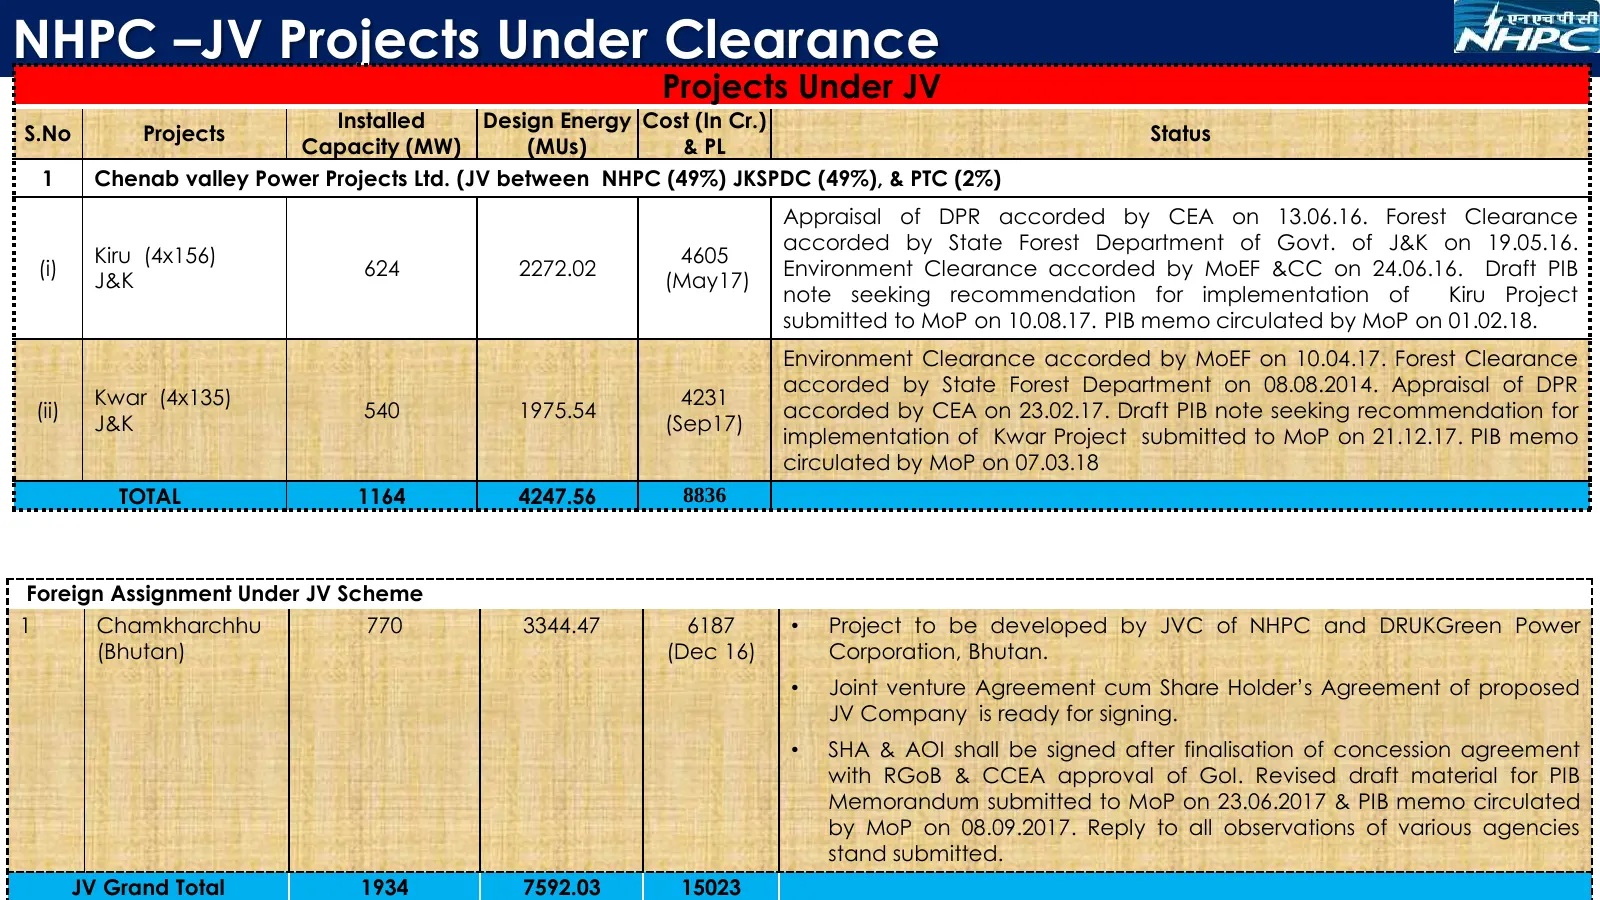
NHPC –JV Projects Under Clearance Projects Under JV S.No Projects Installed Design Energy Cost (In Cr.) Status 26 Capacity (MW) (MUs) & PL 1 Chenab valley Power Projects Ltd. (JV between NHPC (49%) JKSPDC (49%), & PTC (2%) Appraisal of DPR accorded by CEA on 13.06.16. Forest Clearance accorded by St
Slide 28: Subsidiary Under Clearance
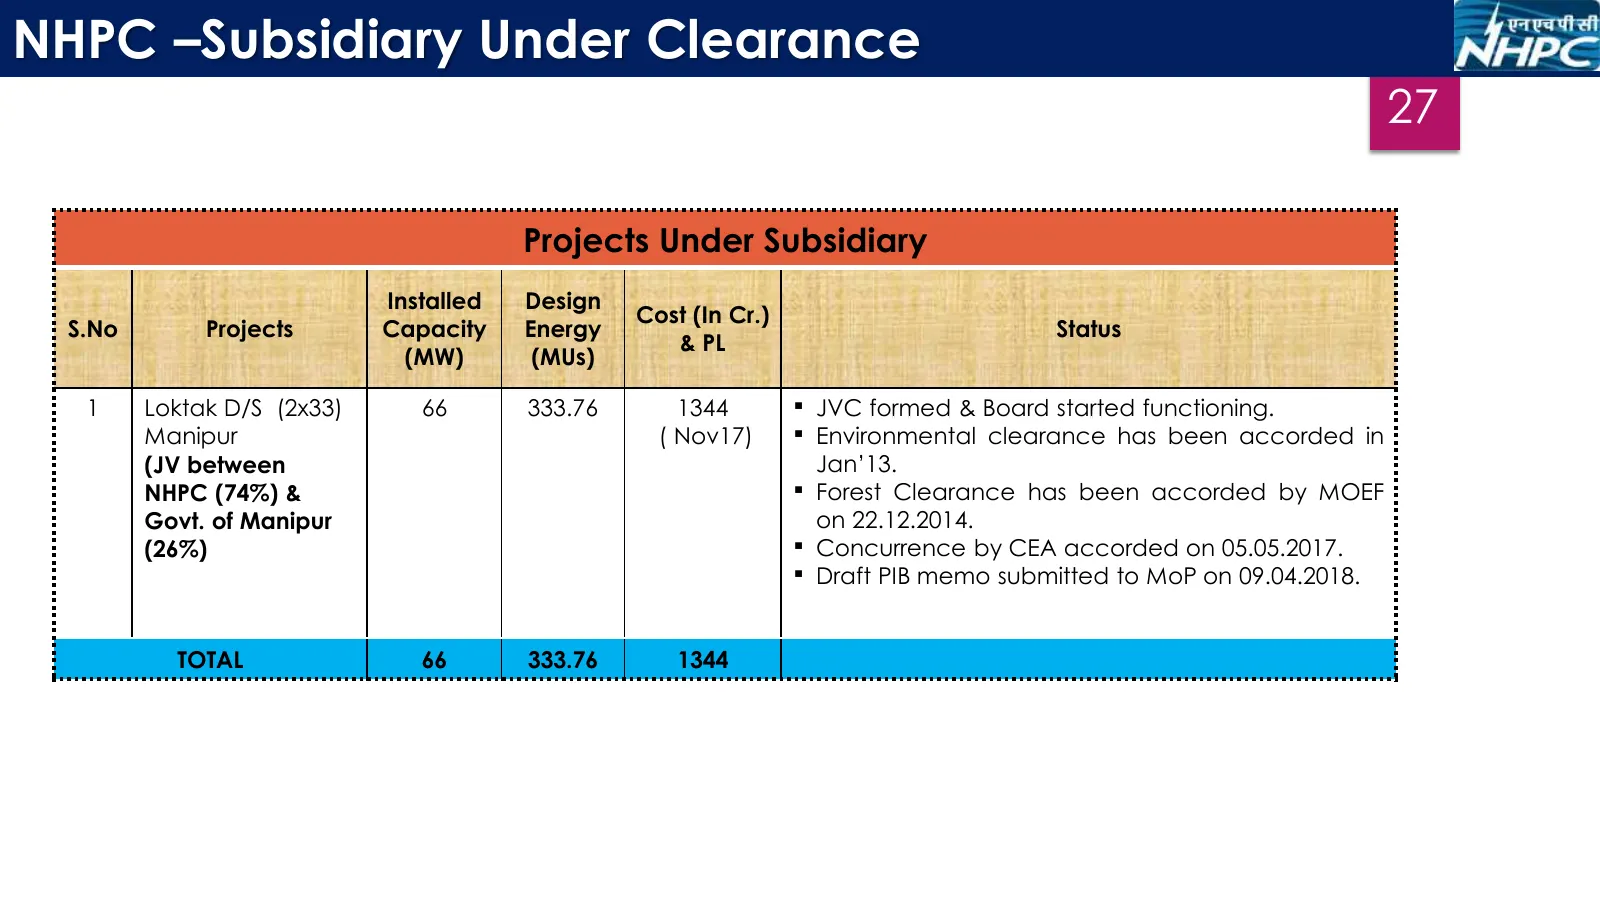
NHPC –Subsidiary Under Clearance 27 Projects Under Subsidiary Installed Design Cost (In Cr.) S.No Projects Capacity Energy Status & PL (MW) (MUs) 1 Loktak D/S (2x33) 66 333.76 1344 JVC formed & Board started functioning. Manipur ( Nov17) Environmental clearance has been accorded in (JV between J
Slide 29: Projects Under Pipeline
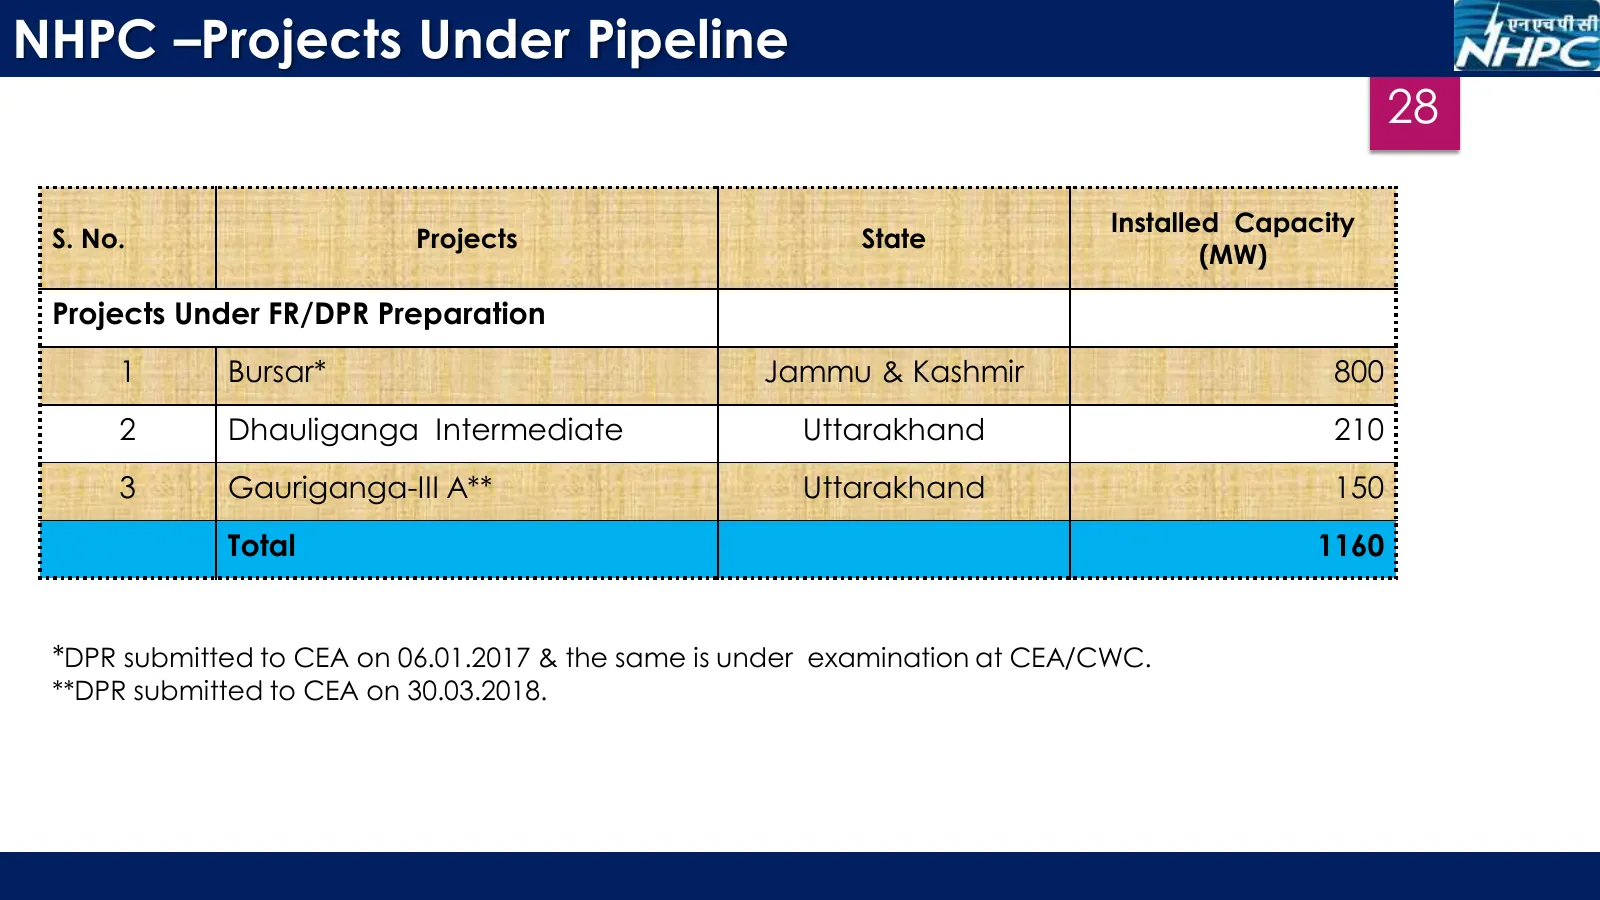
NHPC –Projects Under Pipeline 28 Installed Capacity S. No. Projects State (MW) Projects Under FR/DPR Preparation 1 Bursar* Jammu & Kashmir 800 2 Dhauliganga Intermediate Uttarakhand 210 3 Gauriganga-III A** Uttarakhand 150 Total 1160 *DPR submitted to CEA on 06.01.2017 & the same is under examinatio
Slide 30: Trading Business of NHPC
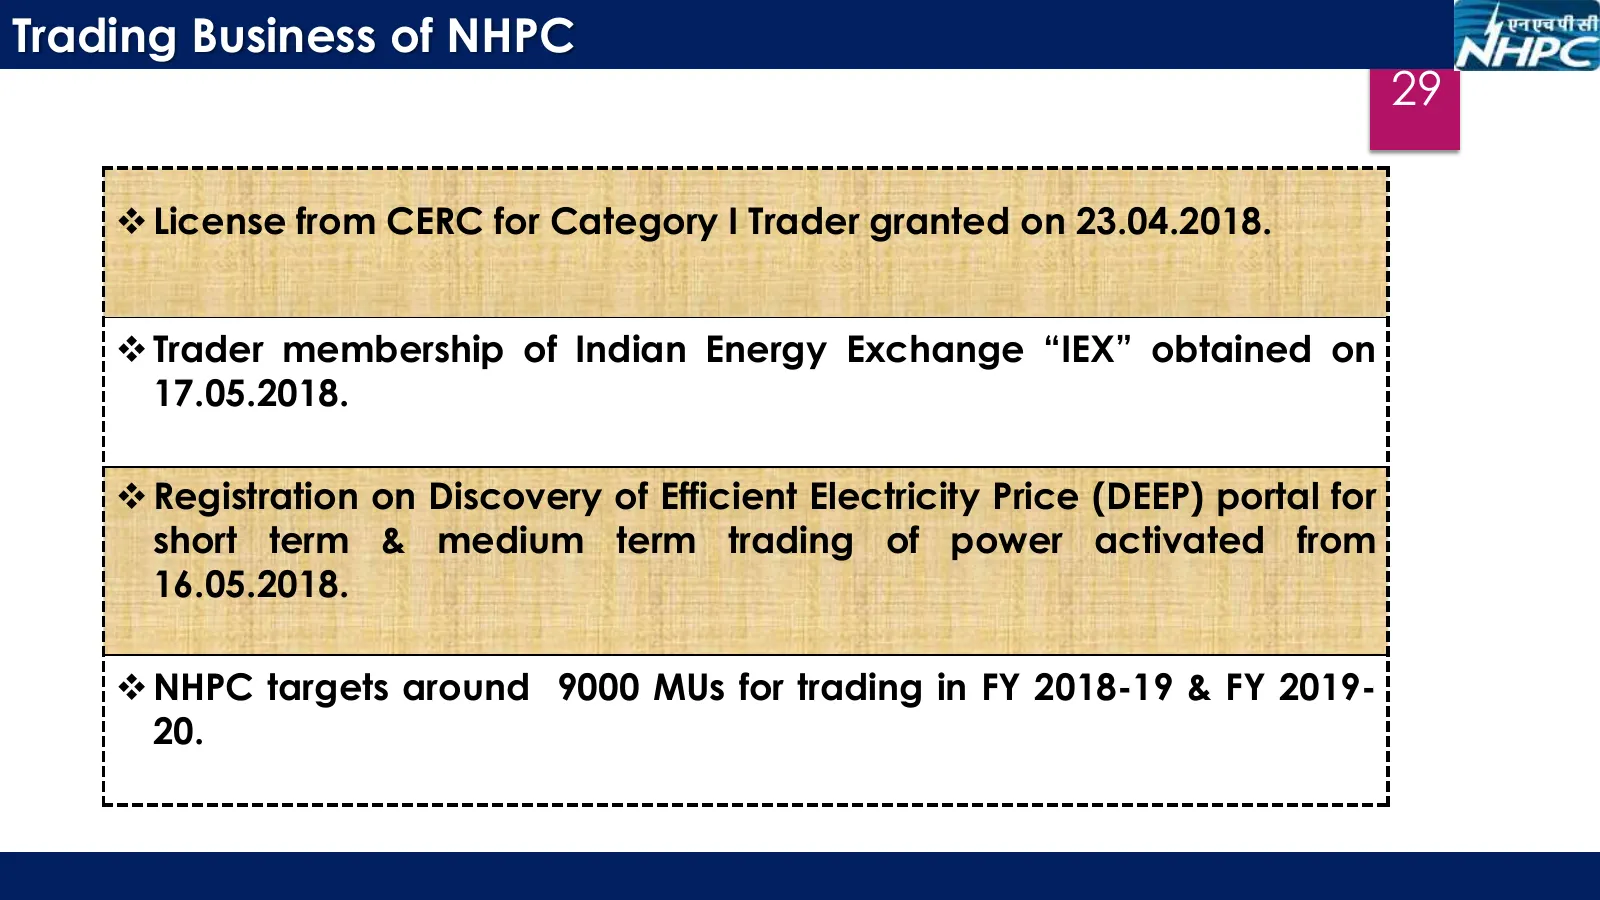
Trading Business of NHPC 29 License from CERC for Category I Trader granted on 23.04.2018. Trader membership of Indian Energy Exchange “IEX” obtained on 17.05.2018. Registration on Discovery of Efficient Electricity Price (DEEP) portal for short term & medium term trading of power activated fr
Slide 31: NHPC-Energising India With Hydropower
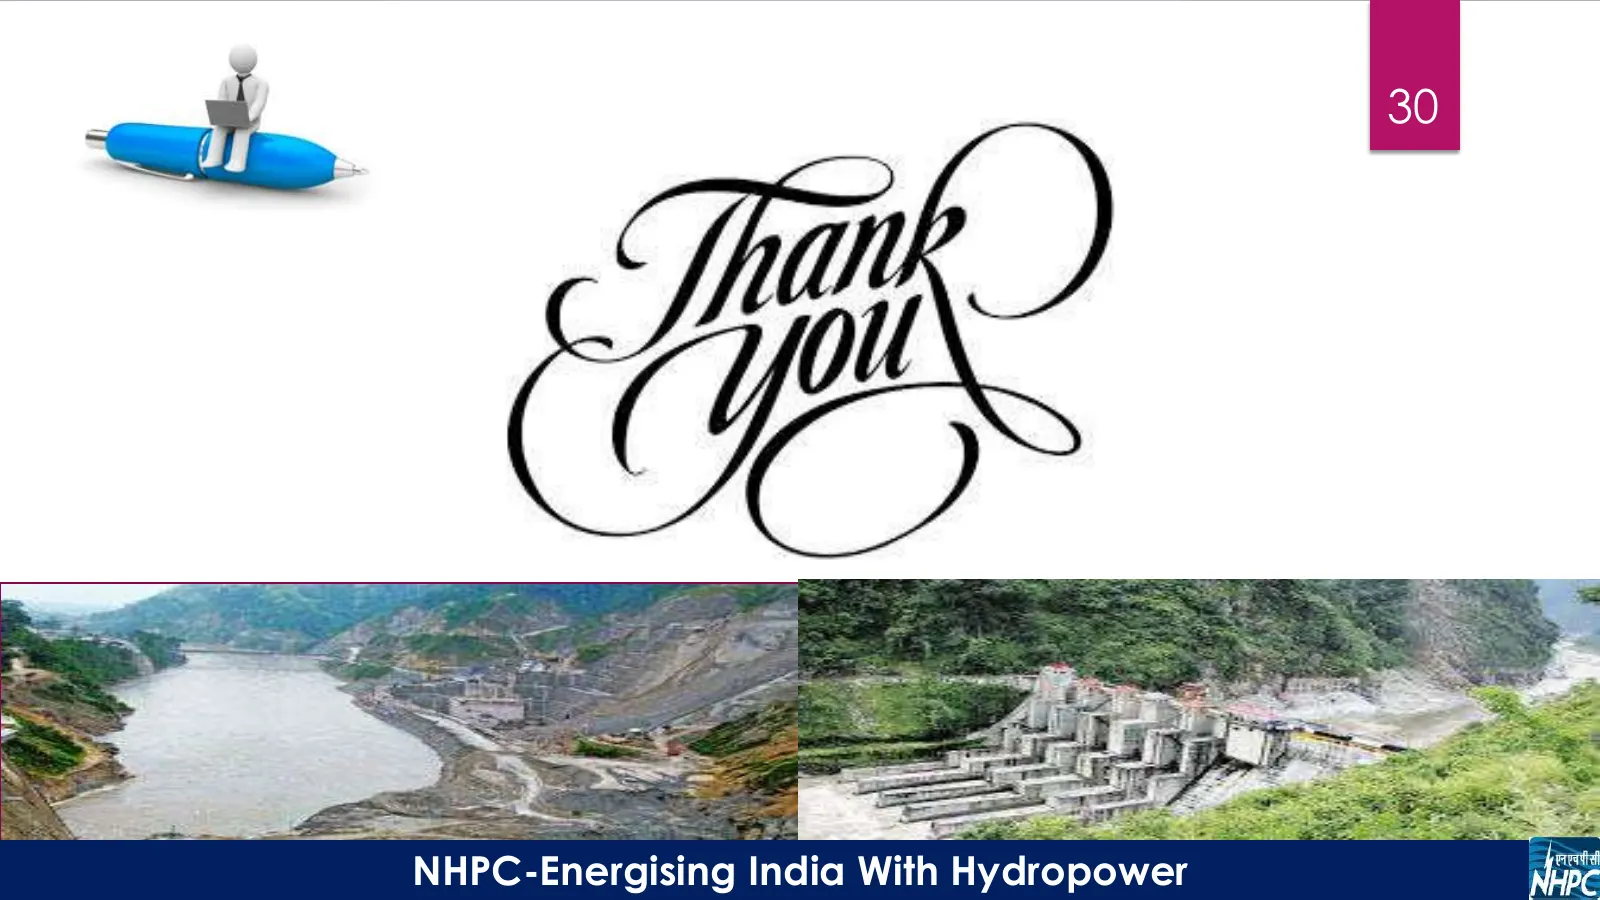
30 NHPC-Energising India With Hydropower
Source: Internet Archive copy of nhpcindia.com
More decks from NHPC Limited
 Investor Presentation (June 2026)49 slides · June 2026
 Investor Presentation (March 2026)48 slides · March 2026
 Investor Presentation (December 2025)49 slides · December 2025
 Investor Presentation (September 2025)49 slides · September 2025
 Investor Presentation (June 2025)51 slides · June 2025
 Investor Presentation (May 2025)49 slides · May 2025