Western Asset Mortgage Capital
Western Asset Mortgage Capital — Q1 2018 Earnings Presentation
23 slides from Western Asset Mortgage Capital's earnings presentation, May 7, 2018
Slide 1: First Quarter 2018 Investor Presentation
First Quarter 2018 Investor Presentation May 8, 2018
Slide 2: Safe Harbor Statement
Safe Harbor Statement We make forward-looking statements in this presentation that are subject to risks and uncertainties. These forward-looking statements include information about possible or assumed future results of our business, financial condition, liquidity, results of operations, plans and o
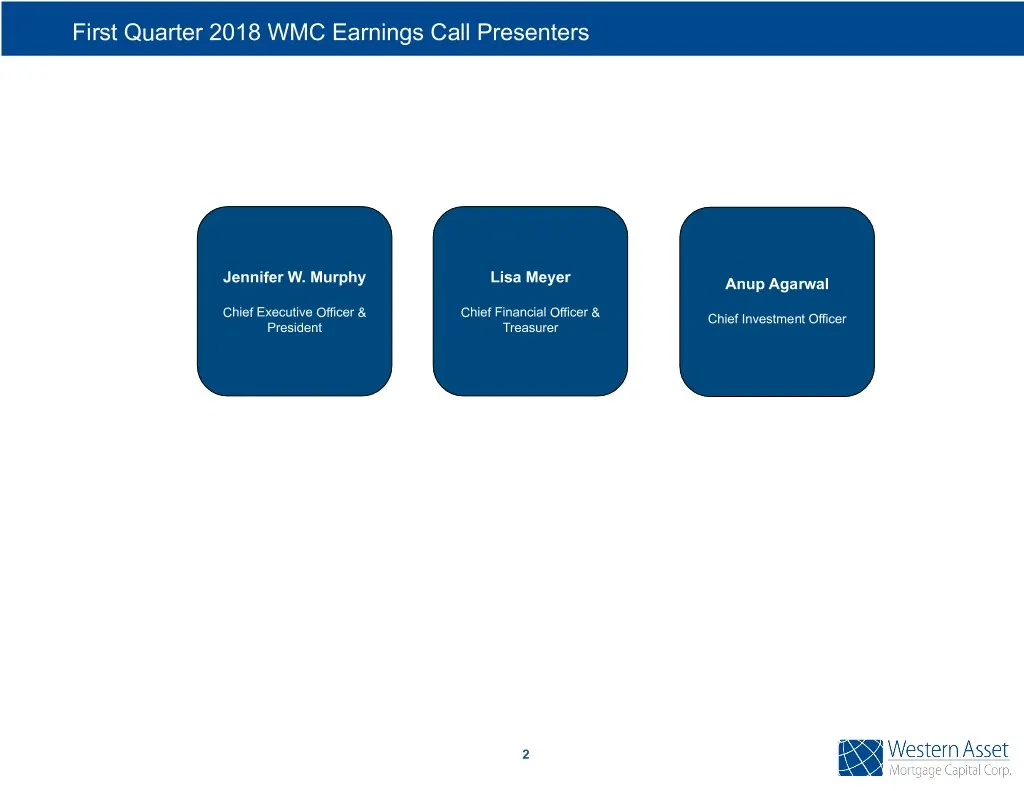
Slide 3: First Quarter 2018 WMC Earnings Call Presenters
First Quarter 2018 WMC Earnings Call Presenters Jennifer W. Murphy Lisa Meyer Anup Agarwal Chief Executive Officer & Chief Financial Officer & Chief Investment Officer President Treasurer 2
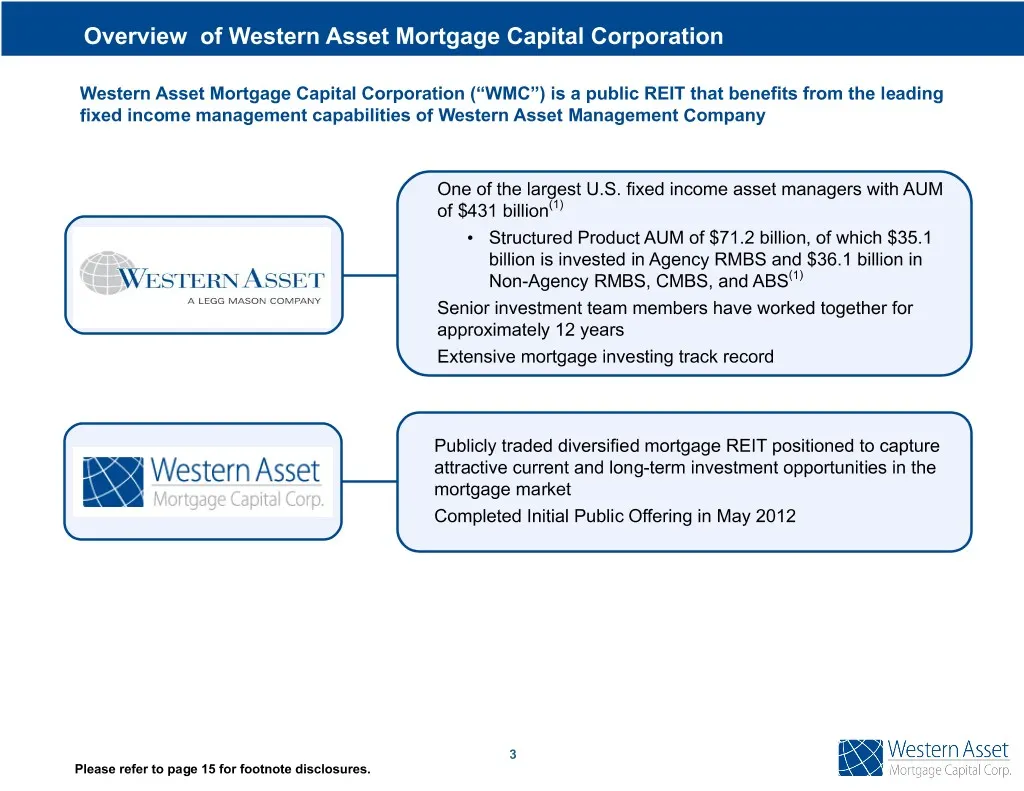
Slide 4: Overview of Western Asset Mortgage Capital Corporation
Overview of Western Asset Mortgage Capital Corporation Western Asset Mortgage Capital Corporation (“WMC”) is a public REIT that benefits from the leading fixed income management capabilities of Western Asset Management Company One of the largest U.S. fixed income asset managers with AUM of $431 bill
Slide 5: Corporate Overview
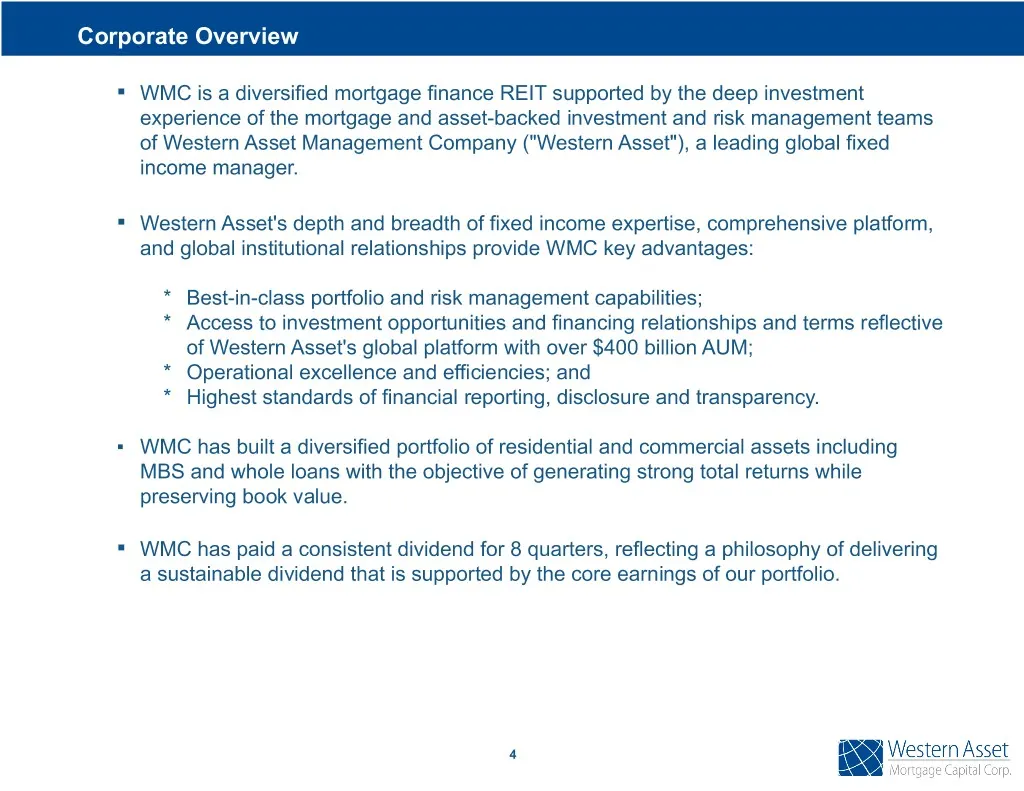
Corporate Overview ▪ WMC is a diversified mortgage finance REIT supported by the deep investment experience of the mortgage and asset-backed investment and risk management teams of Western Asset Management Company ("Western Asset"), a leading global fixed income manager. ▪ Western Asset's depth and
Slide 6: First Quarter Financial Highlights
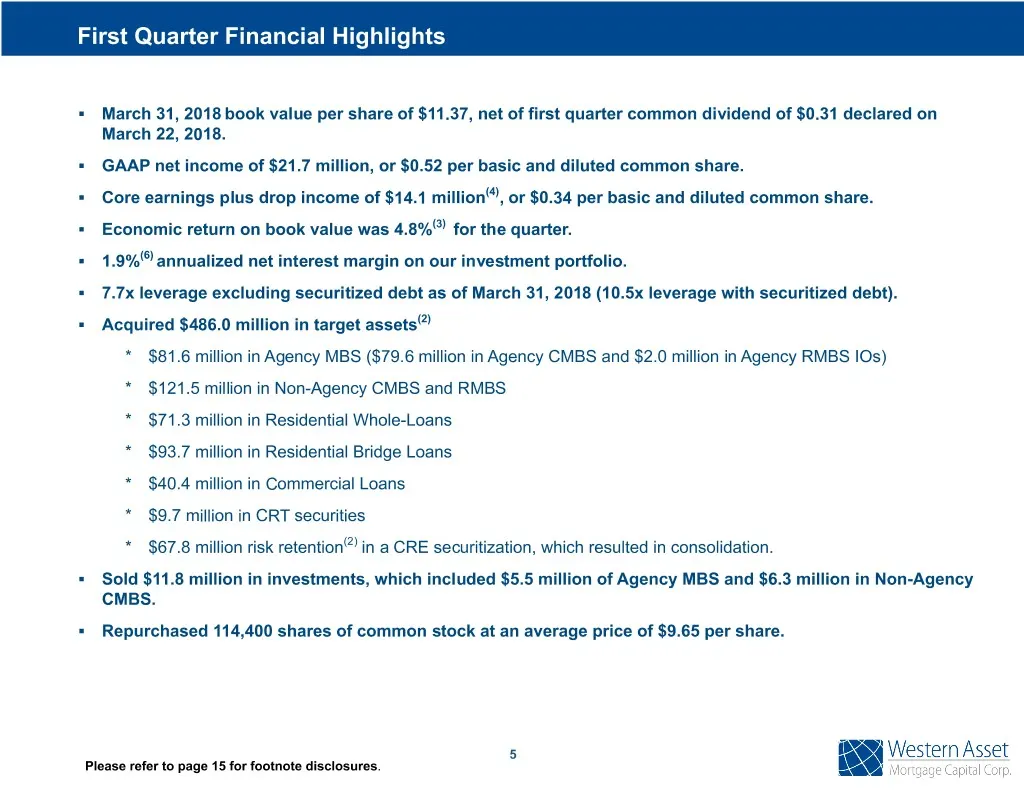
First Quarter Financial Highlights ▪ March 31, 2018 book value per share of $11.37, net of first quarter common dividend of $0.31 declared on March 22, 2018. ▪ GAAP net income of $21.7 million, or $0.52 per basic and diluted common share. ▪ Core earnings plus drop income of $14.1 million(4), or $0.3
Slide 7: Recent Performance
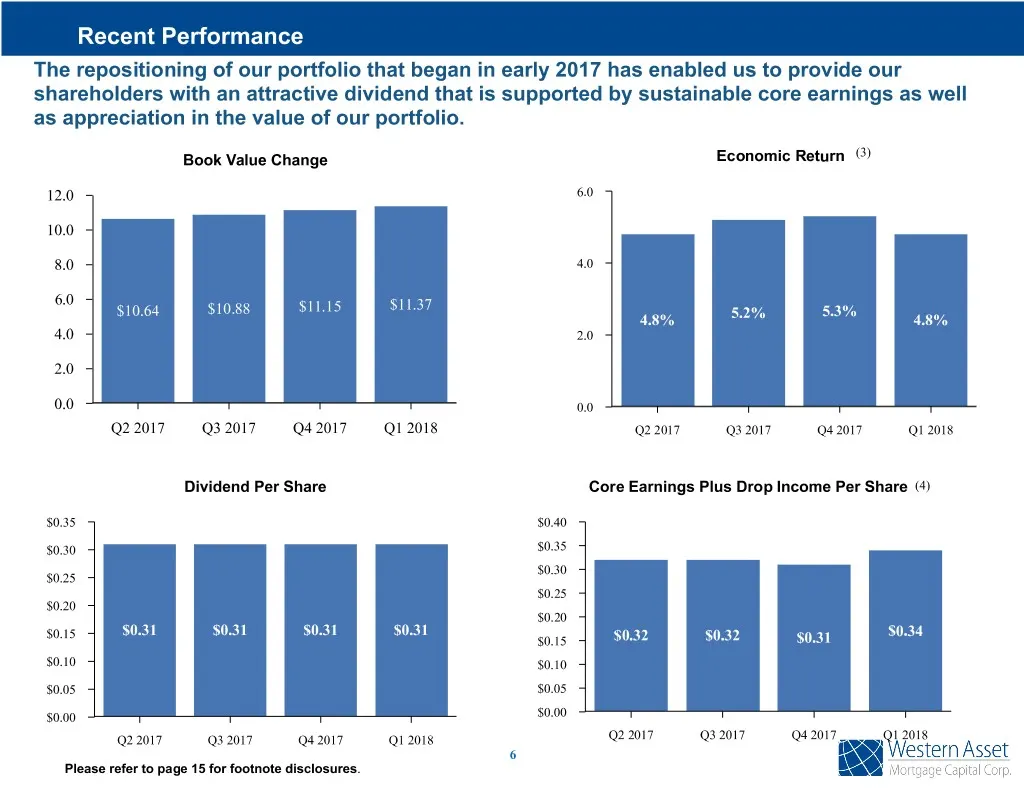
Recent Performance The repositioning of our portfolio that began in early 2017 has enabled us to provide our shareholders with an attractive dividend that is supported by sustainable core earnings as well as appreciation in the value of our portfolio. (3) Book Value Change Economic Return 12.0 6.0 1
Slide 8: Portfolio Income Attribution
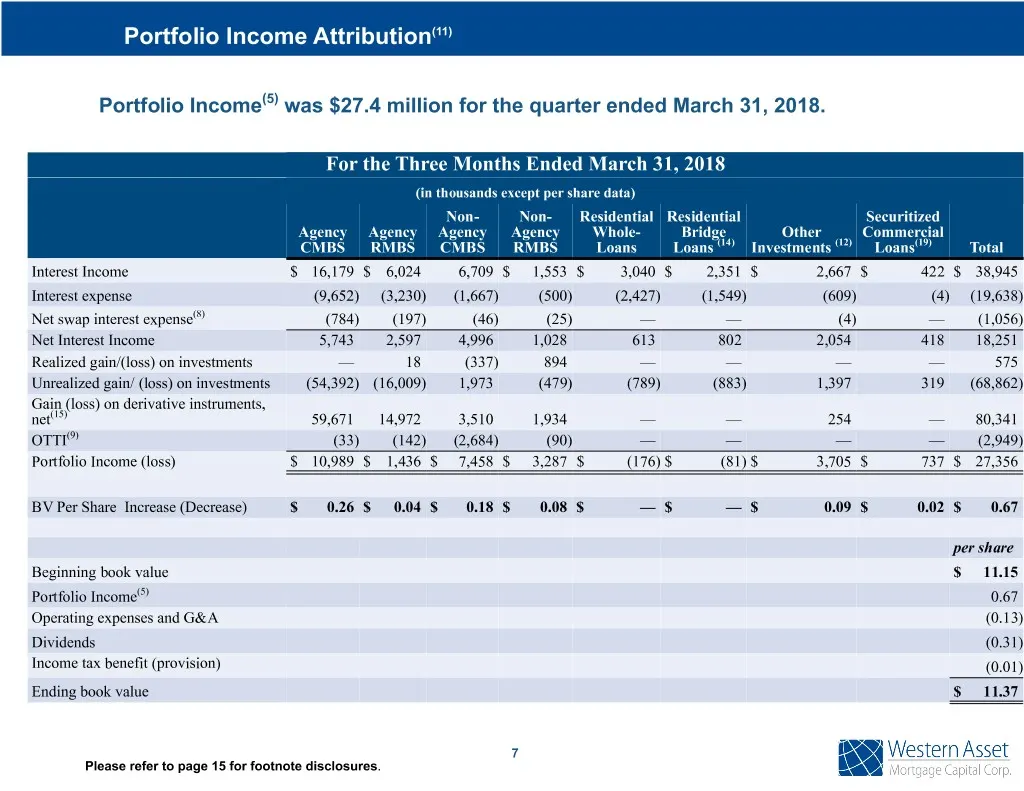
Portfolio Income Attribution(11) Portfolio Income(5) was $27.4 million for the quarter ended March 31, 2018. For the Three Months Ended March 31, 2018 (in thousands except per share data) Non- Non- Residential Residential Securitized Agency Agency Agency Agency Whole- Bridge Other Commercial CMBS RM
Slide 9: Portfolio Composition
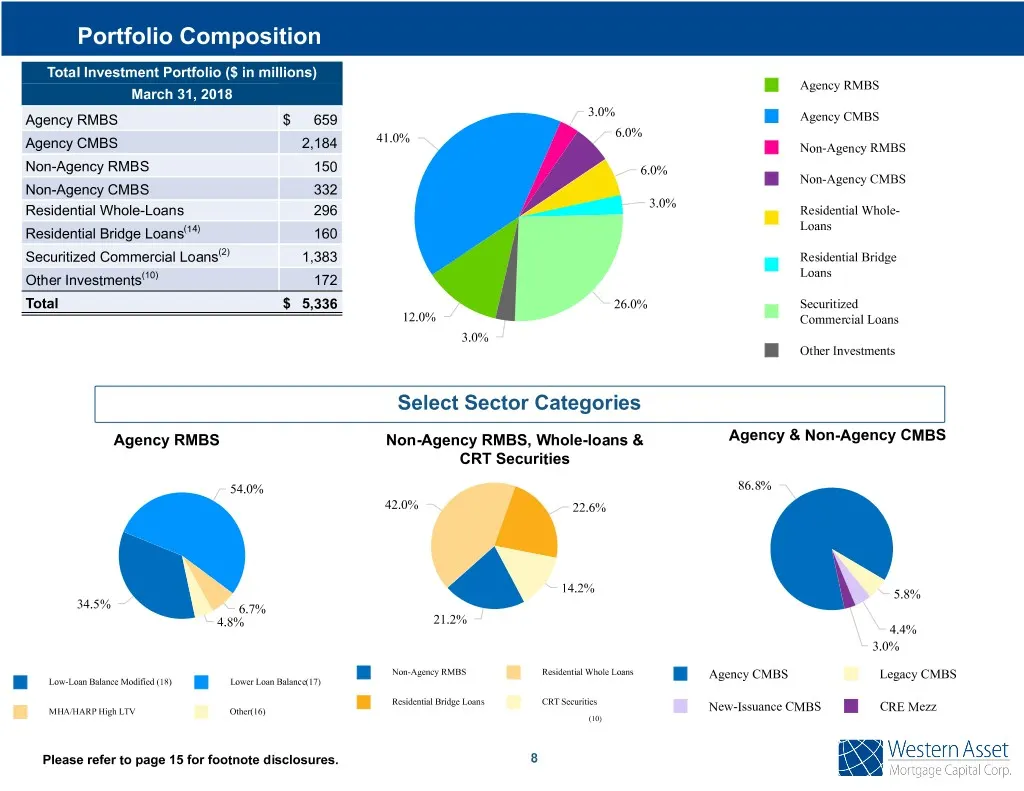
Portfolio Composition Total Investment Portfolio ($ in millions) Agency RMBS March 31, 2018 3.0% Agency RMBS $ 659 Agency CMBS 41.0% 6.0% Agency CMBS 2,184 Non-Agency RMBS Non-Agency RMBS 150 6.0% Non-Agency CMBS Non-Agency CMBS 332 3.0% Residential Whole-Loans 296 Residential Whole- Loans Residenti
Slide 10: Financing Summary
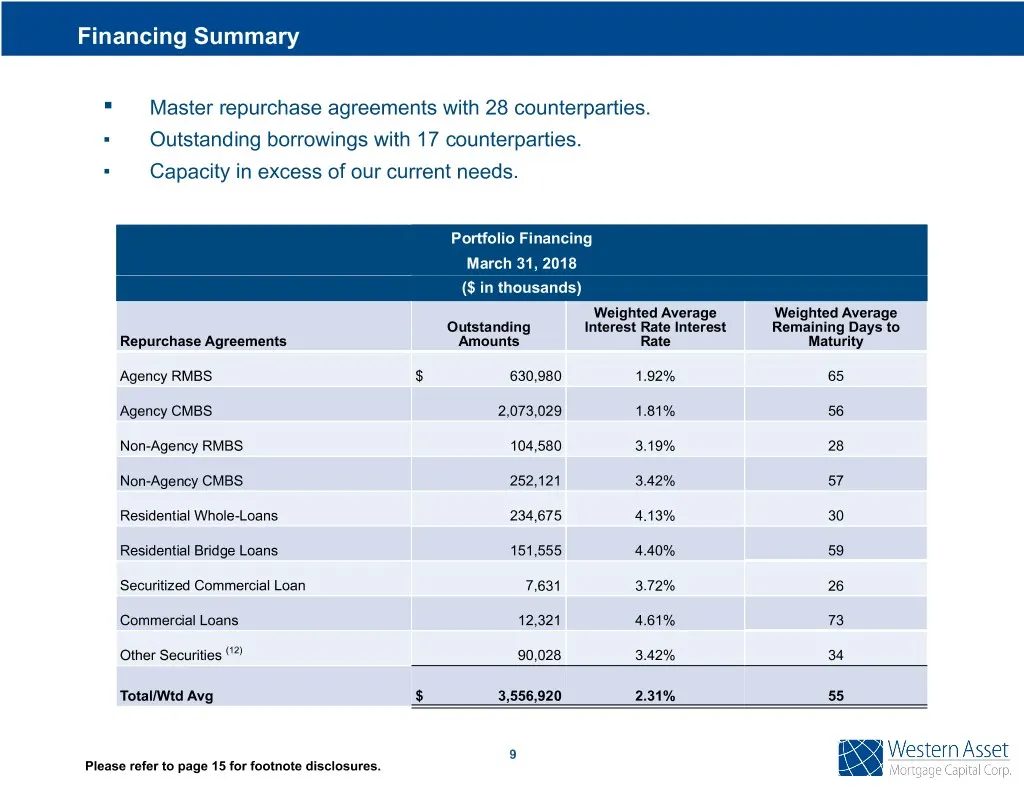
Financing Summary ▪ Master repurchase agreements with 28 counterparties. ▪ Outstanding borrowings with 17 counterparties. ▪ Capacity in excess of our current needs. Portfolio Financing March 31, 2018 ($ in thousands) Weighted Average Weighted Average Outstanding Interest Rate Interest Remaining Days
Slide 11: Hedging Summary
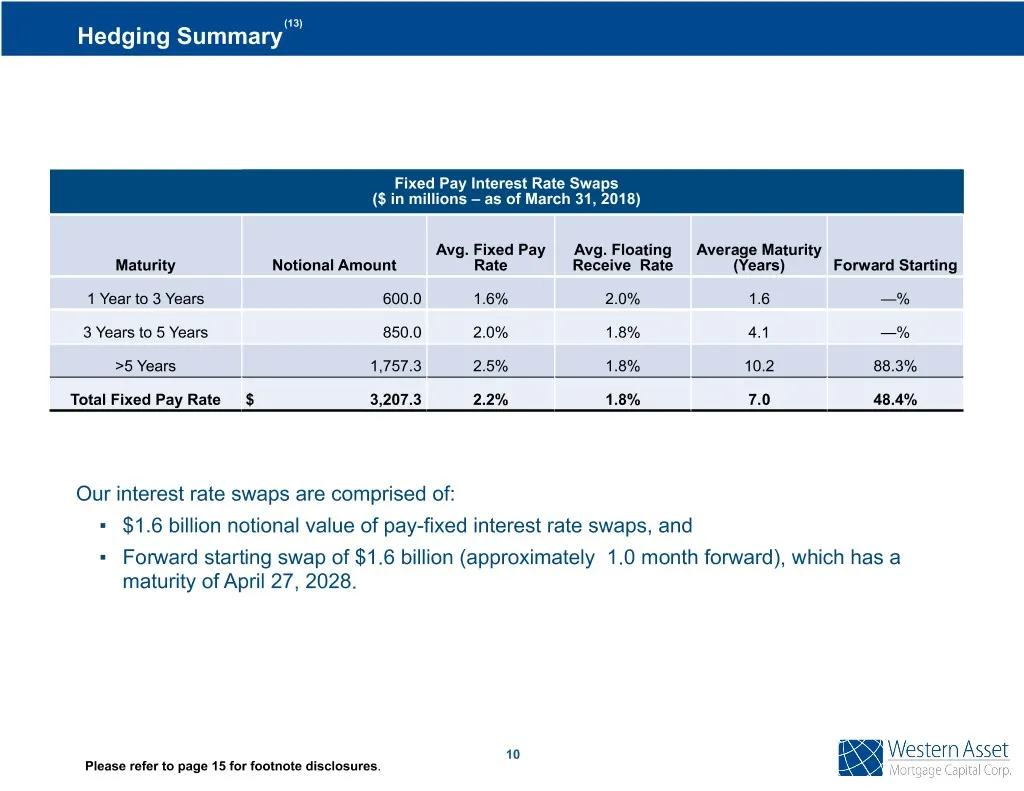
(13) Hedging Summary Fixed Pay Interest Rate Swaps ($ in millions – as of March 31, 2018) Avg. Fixed Pay Avg. Floating Average Maturity Maturity Notional Amount Rate Receive Rate (Years) Forward Starting 1 Year to 3 Years 600.0 1.6% 2.0% 1.6 —% 3 Years to 5 Years 850.0 2.0% 1.8% 4.1 —% >5 Years 1,75
Slide 12: Duration
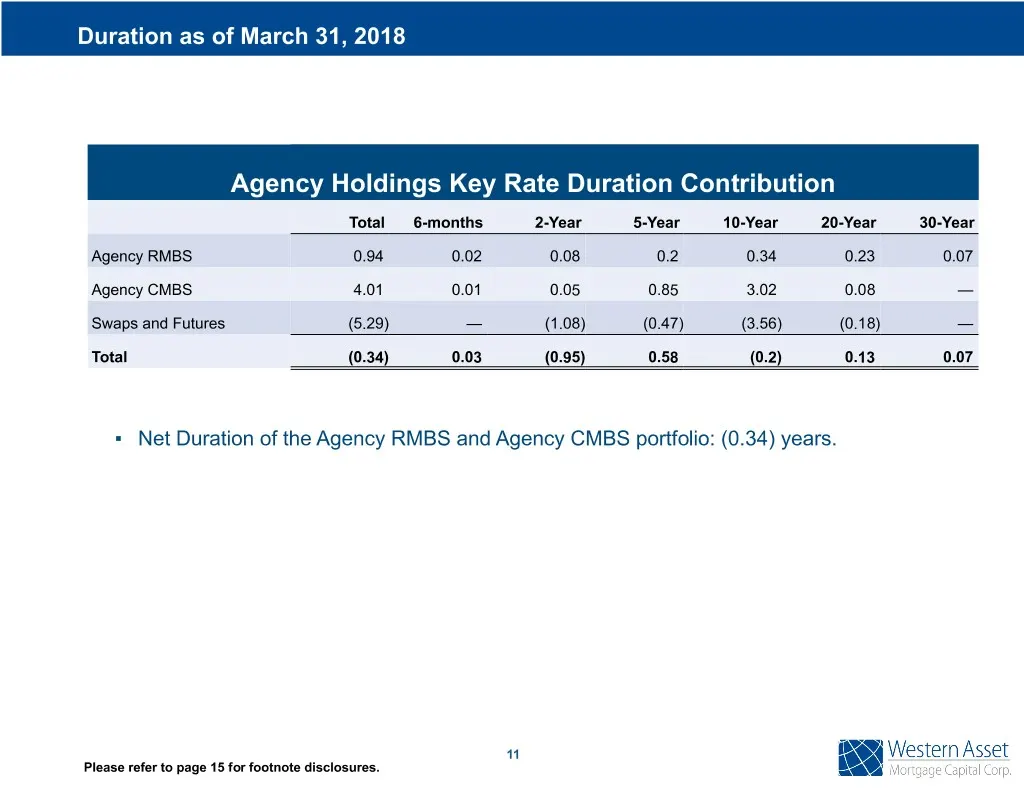
Duration as of March 31, 2018 Agency Holdings Key Rate Duration Contribution Total 6-months 2-Year 5-Year 10-Year 20-Year 30-Year Agency RMBS 0.94 0.02 0.08 0.2 0.34 0.23 0.07 Agency CMBS 4.01 0.01 0.05 0.85 3.02 0.08 — Swaps and Futures (5.29) — (1.08) (0.47) (3.56) (0.18) — Total (0.34) 0.03 (0.95
Slide 13: 2018 Macroeconomic Outlook
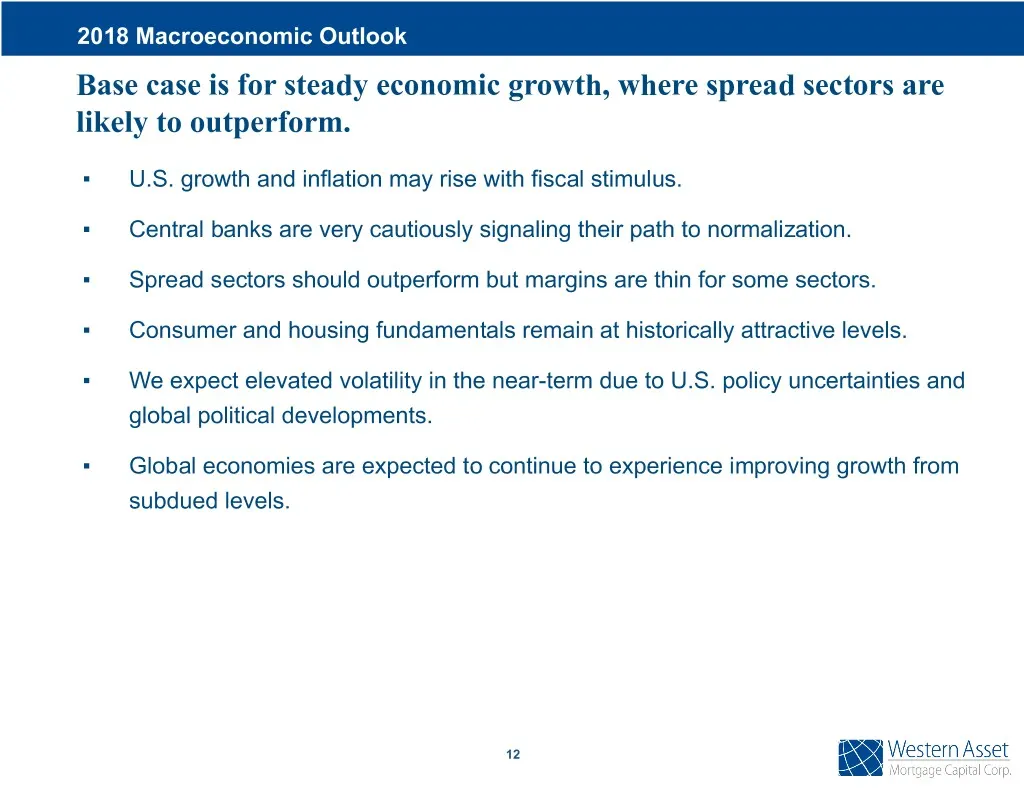
2018 Macroeconomic Outlook Base case is for steady economic growth, where spread sectors are likely to outperform. ▪ U.S. growth and inflation may rise with fiscal stimulus. ▪ Central banks are very cautiously signaling their path to normalization. ▪ Spread sectors should outperform but margins are
Slide 14: Portfolio View
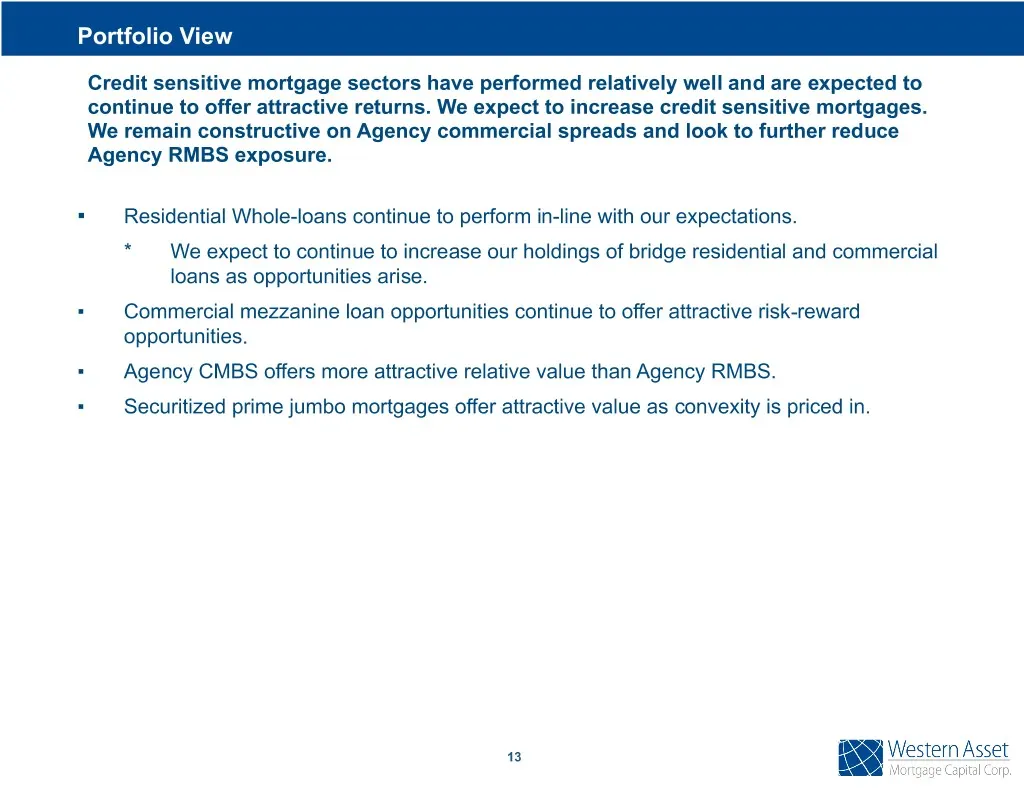
Portfolio View Credit sensitive mortgage sectors have performed relatively well and are expected to continue to offer attractive returns. We expect to increase credit sensitive mortgages. We remain constructive on Agency commercial spreads and look to further reduce Agency RMBS exposure. ▪ Residenti
Slide 15: Target Investment Opportunities
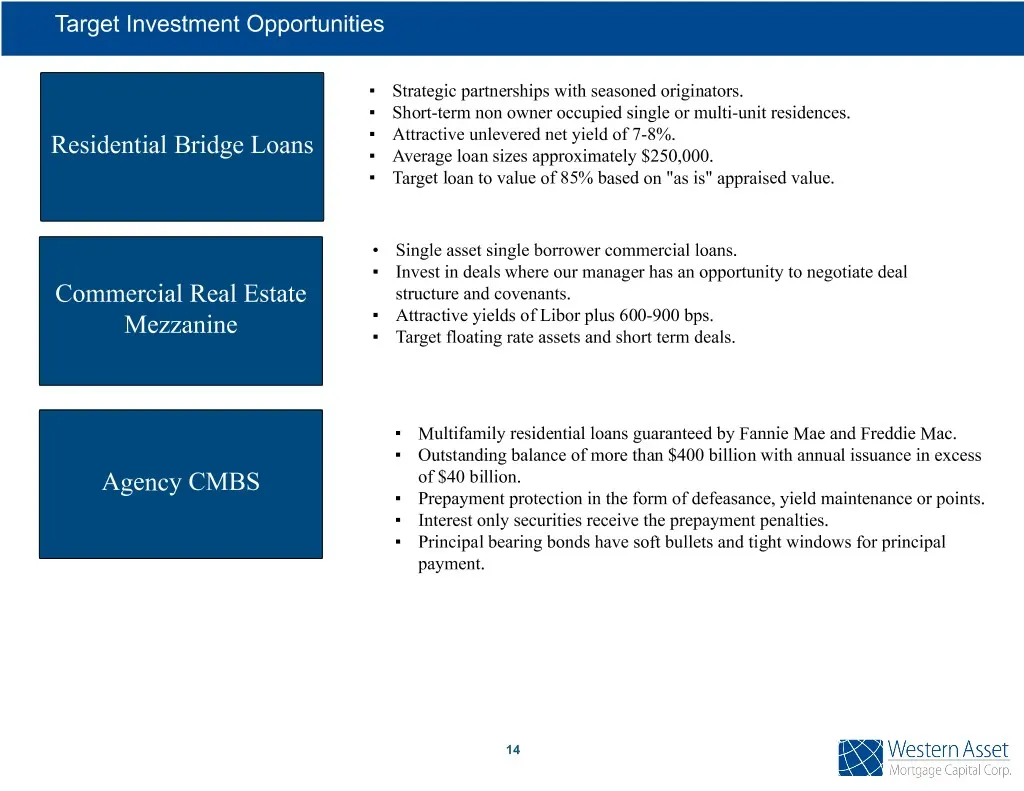
Target Investment Opportunities ▪ Strategic partnerships with seasoned originators. ▪ Short-term non owner occupied single or multi-unit residences. ▪ Attractive unlevered net yield of 7-8%. Residential Bridge Loans ▪ Average loan sizes approximately $250,000. ▪ Target loan to value of 85% based on
Slide 16: Footnotes
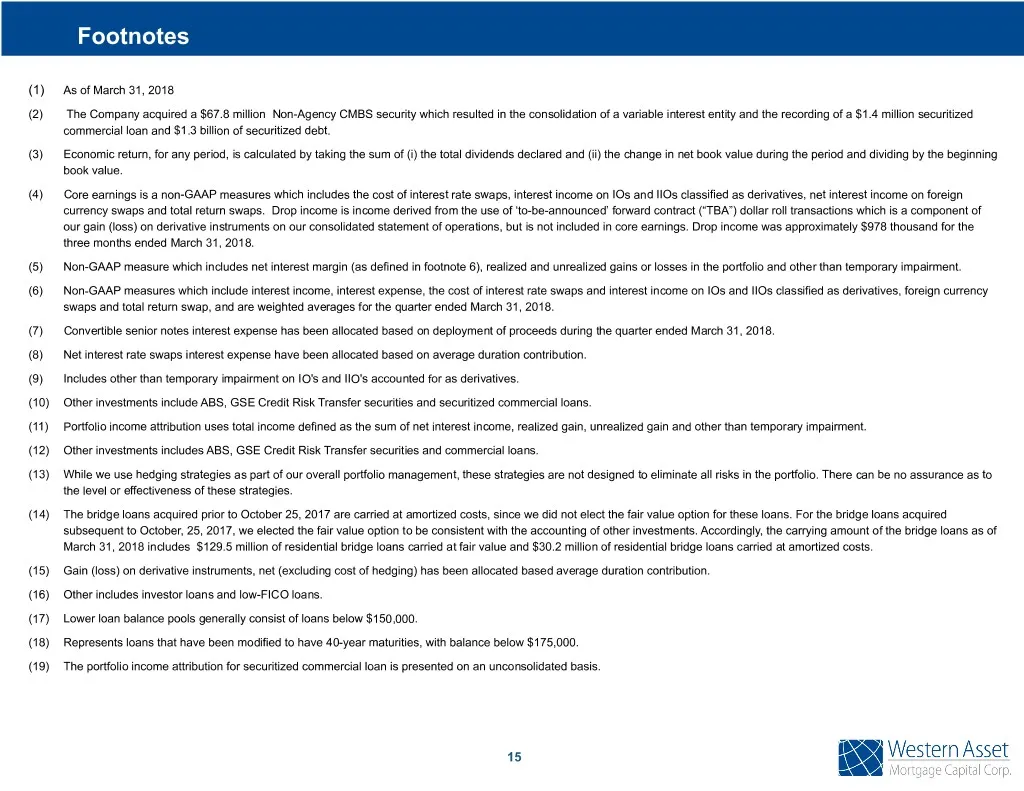
Footnotes (1) As of March 31, 2018 (2) The Company acquired a $67.8 million Non-Agency CMBS security which resulted in the consolidation of a variable interest entity and the recording of a $1.4 million securitized commercial loan and $1.3 billion of securitized debt. (3) Economic return, for any pe
Slide 17: Supplemental Information
pplemental Informa Western Asset Comp.
Slide 18: Book Value Roll Forward
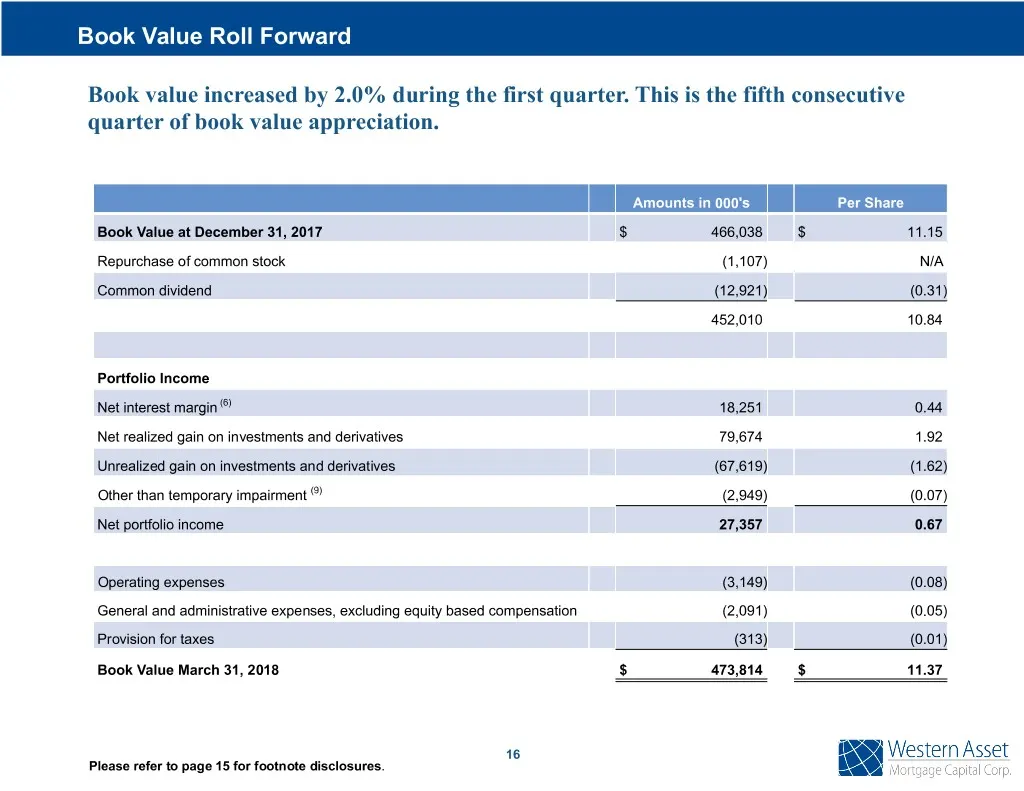
Book Value Roll Forward Book value increased by 2.0% during the first quarter. This is the fifth consecutive quarter of book value appreciation. Amounts in 000's Per Share Book Value at December 31, 2017 $ 466,038 $ 11.15 Repurchase of common stock (1,107) N/A Common dividend (12,921) (0.31) 452,010
Slide 19: Portfolio Composition: Agency Portfolio
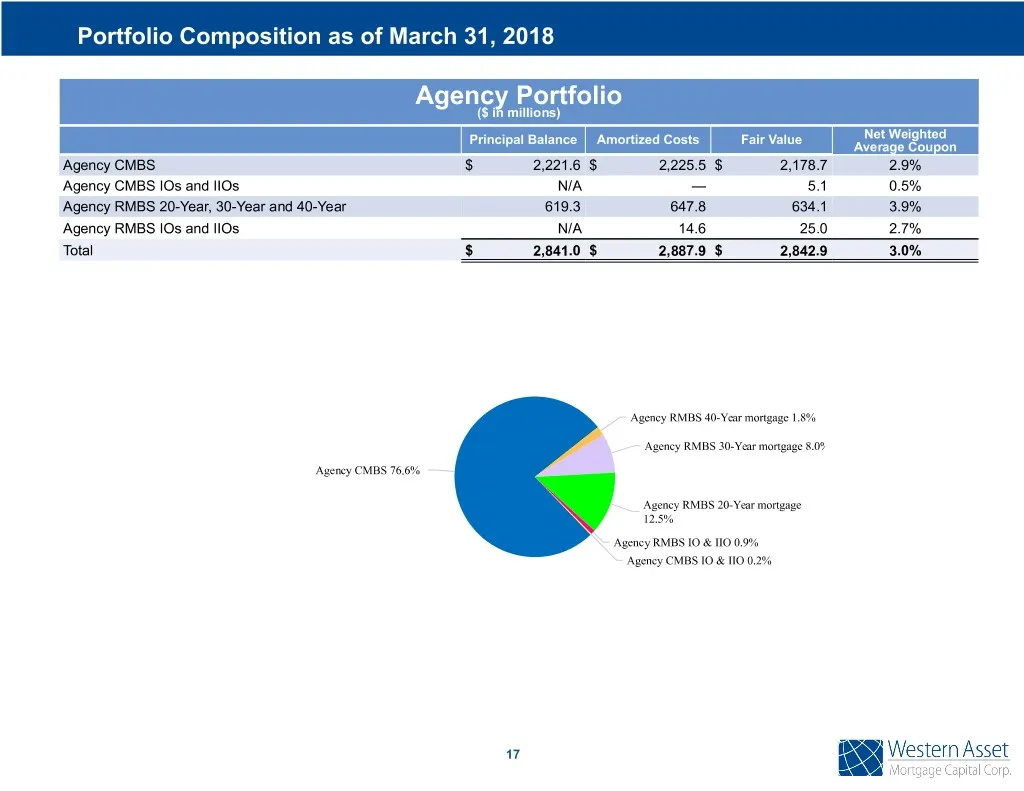
Portfolio Composition as of March 31, 2018 Agency Portfolio ($ in millions) Principal Balance Amortized Costs Fair Value Net Weighted Average Coupon Agency CMBS $ 2,221.6 $ 2,225.5 $ 2,178.7 2.9% Agency CMBS IOs and IIOs N/A — 5.1 0.5% Agency RMBS 20-Year, 30-Year and 40-Year 619.3 647.8 634.1 3.9%
Slide 20: Portfolio Composition: Credit Sensitive Portfolio
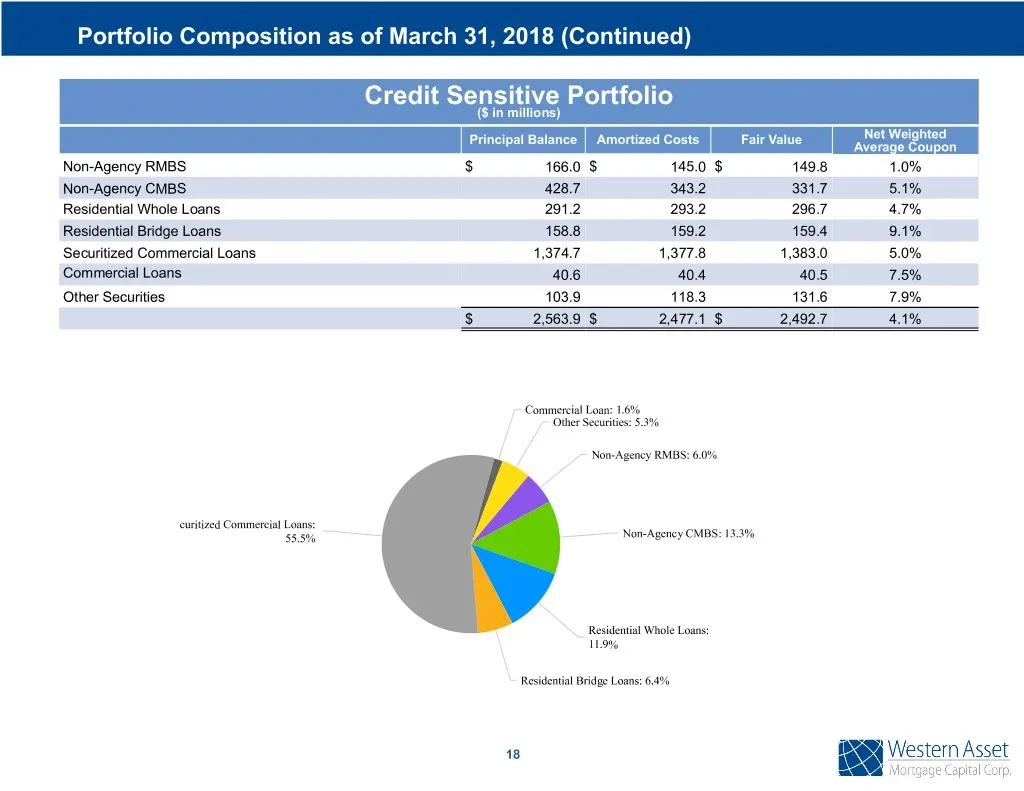
Portfolio Composition as of March 31, 2018 (Continued) Credit Sensitive Portfolio ($ in millions) Principal Balance Amortized Costs Fair Value Net Weighted Average Coupon Non-Agency RMBS $ 166.0 $ 145.0 $ 149.8 1.0% Non-Agency CMBS 428.7 343.2 331.7 5.1% Residential Whole Loans 291.2 293.2 296.7 4.7
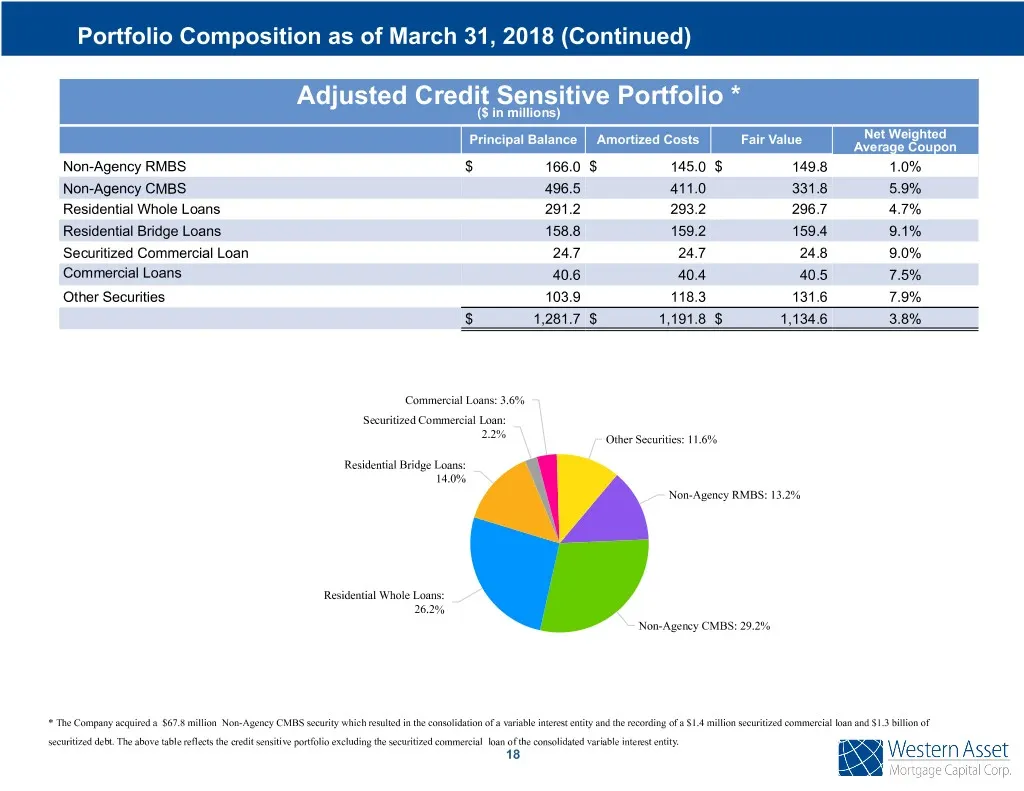
Slide 21: Portfolio Composition: Adjusted Credit Sensitive Portfolio
Portfolio Composition as of March 31, 2018 (Continued) Adjusted Credit Sensitive Portfolio * ($ in millions) Principal Balance Amortized Costs Fair Value Net Weighted Average Coupon Non-Agency RMBS $ 166.0 $ 145.0 $ 149.8 1.0% Non-Agency CMBS 496.5 411.0 331.8 5.9% Residential Whole Loans 291.2 293.
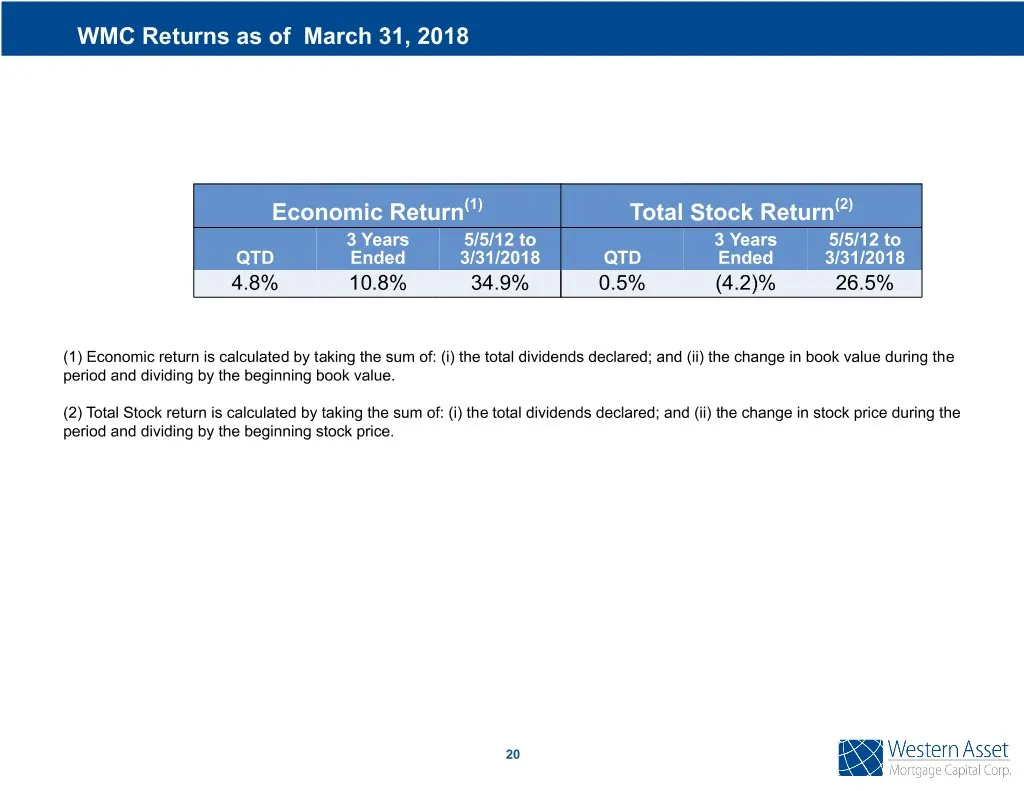
Slide 22: WMC Returns
WMC Returns as of March 31, 2018 Economic Return(1) Total Stock Return(2) 3 Years 5/5/12 to 3 Years 5/5/12 to QTD Ended 3/31/2018 QTD Ended 3/31/2018 4.8% 10.8% 34.9% 0.5% (4.2)% 26.5% (1) Economic return is calculated by taking the sum of: (i) the total dividends declared; and (ii) the change in bo
Slide 23: Contact Information
Contact Information Western Asset Mortgage Capital Corporation c/o Financial Profiles, Inc. 11601 Wilshire Blvd., Suite 1920 Los Angeles, CA 90025 www.westernassetmcc.com Investor Relations Contact: Larry Clark Tel: (310) 622-8223 lclark@finprofiles.com
Source: SEC EDGAR · 8-K filed May 7, 2018
More decks from Western Asset Mortgage Capital
 Merger or Acquisition (August 2023)9 slides · Aug 9, 2023
 Q2 2023 Earnings Presentation32 slides · Aug 8, 2023
 Merger or Acquisition (July 2023)9 slides · Jul 13, 2023
 Merger or Acquisition (June 2023)16 slides · Jun 28, 2023
 Q1 2023 Earnings Presentation33 slides · May 4, 2023
 Q4 2022 Earnings Presentation34 slides · Mar 2, 2023