Pioneer Natural Resources — Goldman Sachs Energy Conference 2007
28 slides from Pioneer Natural Resources's conference presentation, Jan 17, 2007

Slide 1: Goldman Sachs Energy Conference January 17-18, 2007
Goldman Sachs Energy Conference January 17 -18, 2007

Slide 2: Forward-Looking Statements
Forward-Looking Statements Except for historical information contained herein, the statements, charts and graphs in this presentation are forward-looking statements that are made pursuant to the Safe Harbor Provisions of the Private Securities Litigation Reform Act of 1995. Forward-looking statement
Slide 3: Delivering on Low-Risk Strategy
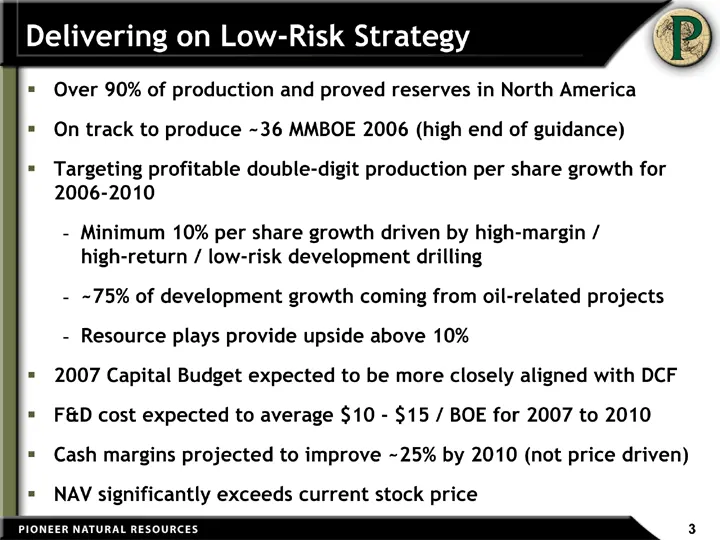
Delivering on Low-Risk Strategy Over 90% of production and proved reserves in North America On track to produce ~36 MMBOE 2006 (high end of guidance) Targeting profitable double-digit production per share growth for 2006-2010 Minimum 10% per share growth driven by high-margin / high-return / low-ris
Slide 4: Production Growth on Track
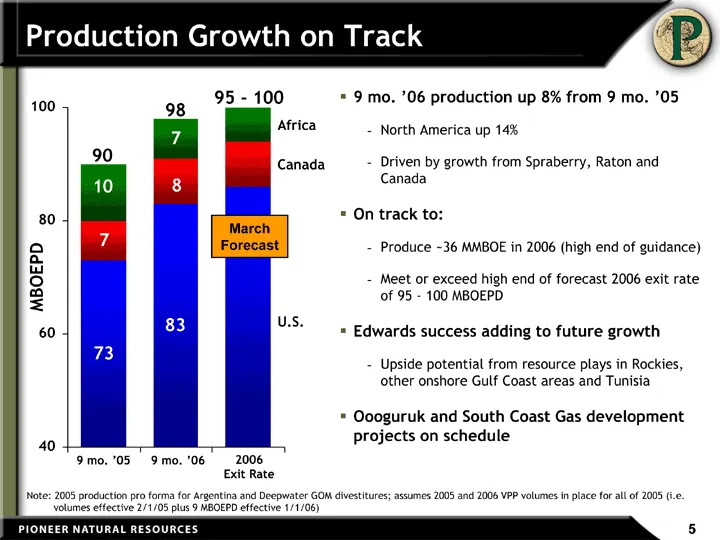
YTD 05 YTD 06 Exit Rate US 73 83 86 Canada 7 8 8 Africa 10 7 6 2005 93 MBOEPD 90 98 95 - 100 U.S. Canada Africa Note: 2005 production pro forma for Argentina and Deepwater GOM divestitures; assumes 2005 and 2006 VPP volumes in place for all of 2005 (i.e. volumes effective 2/1/05 plus 9 MBOEPD effect
Slide 5: Strong Returns on 2007 Development Drilling & Projects
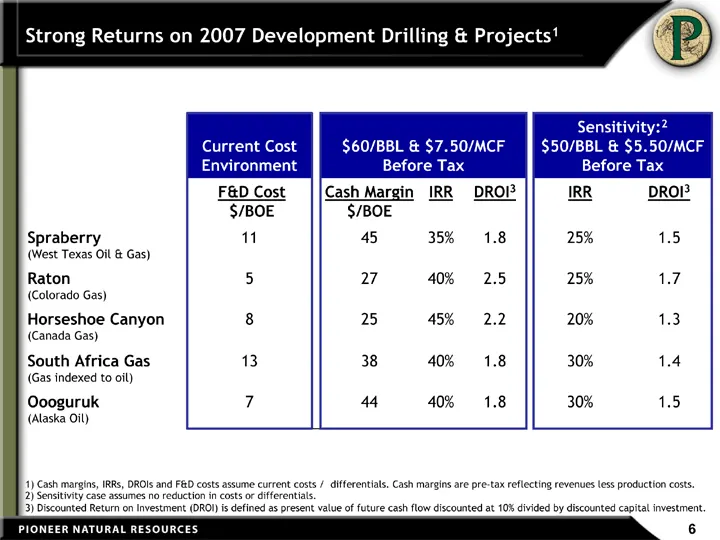
Strong Returns on 2007 Development Drilling & Projects1 Current Cost Environment $60/BBL & $7.50/MCF Before Tax $60/BBL & $7.50/MCF Before Tax $60/BBL & $7.50/MCF Before Tax Sensitivity:2 $50/BBL & $5.50/MCF Before Tax Sensitivity:2 $50/BBL & $5.50/MCF Before Tax F&D Cost $/BOE Cash Margin $/BOE IRR
Slide 6: 2006-2010 Capital Allocation
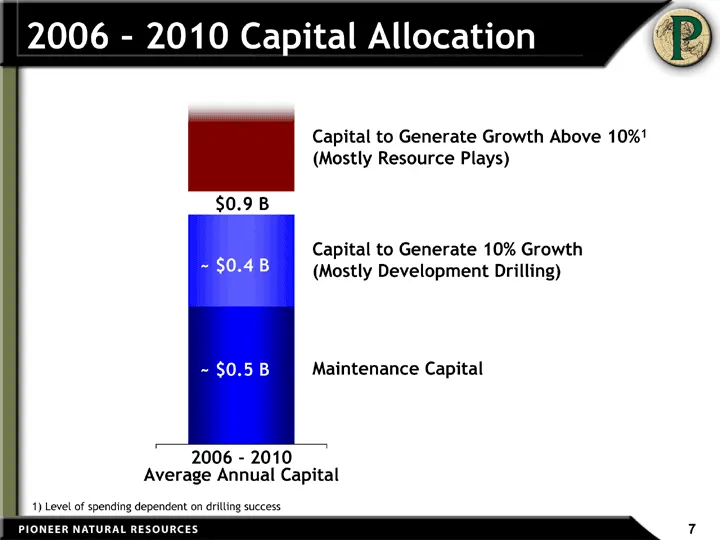
2006 - 2010 Capital Allocation Total Budget Maintance 600 2P Growth 400 100 Risk Success Growth 300 asd 100 2006 - 2010 Average Annual Capital ~ $0.5 B Maintenance Capital Capital to Generate 10% Growth (Mostly Development Drilling) ~ $0.4 B $0.9 B 1) Level of spending dependent on drilling success
Slide 7: 2007/2011 Maintenance Capital Requirements
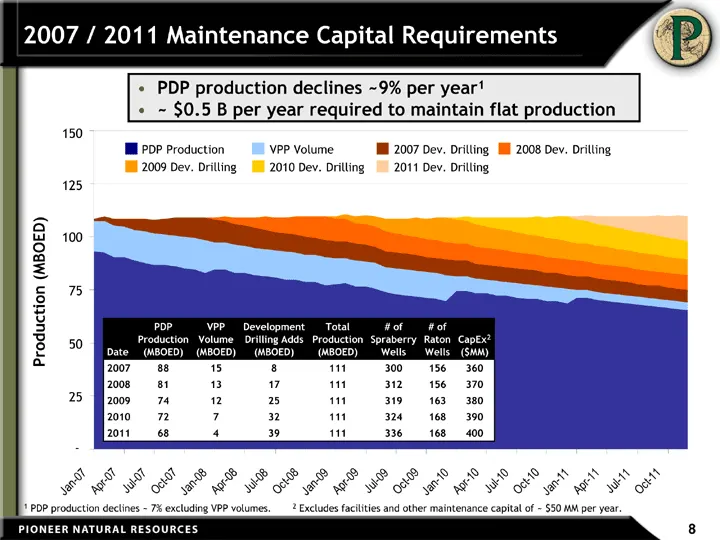
2007 / 2011 Maintenance Capital Requirements 1 PDP production declines ~ 7% excluding VPP volumes. 2 Excludes facilities and other maintenance capital of ~ $50 MM per year. PDP production declines ~9% per year1 ~ $0.5 B per year required to maintain flat production Date PDP Production (MBOED) VPP Vo
Slide 8: Cash Margins Improve ~25% by 2010
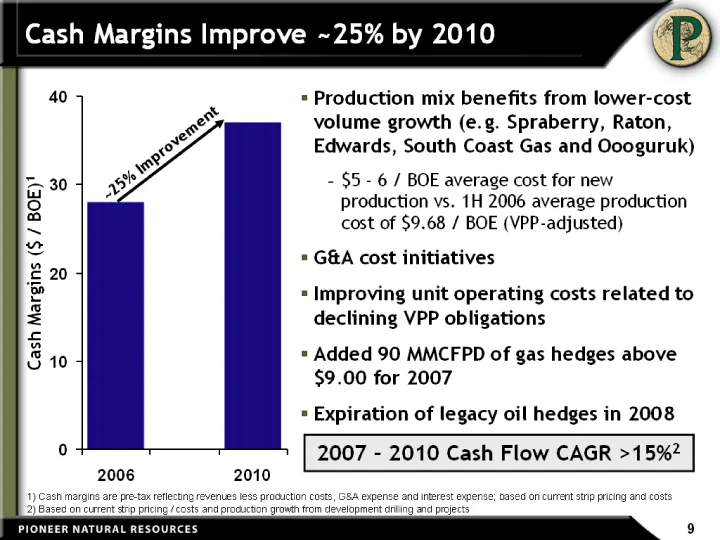
2006 2007 2010 LOE 28 33 37 2 Cash Margins Improve ~25% by 2010 1) Cash margins are pre-tax reflecting revenues less production costs, G&A expense and interest expense; based on current strip pricing and costs 2) Based on current strip pricing / costs and production growth from development drilling
Slide 9: Spraberry Anchors Growth
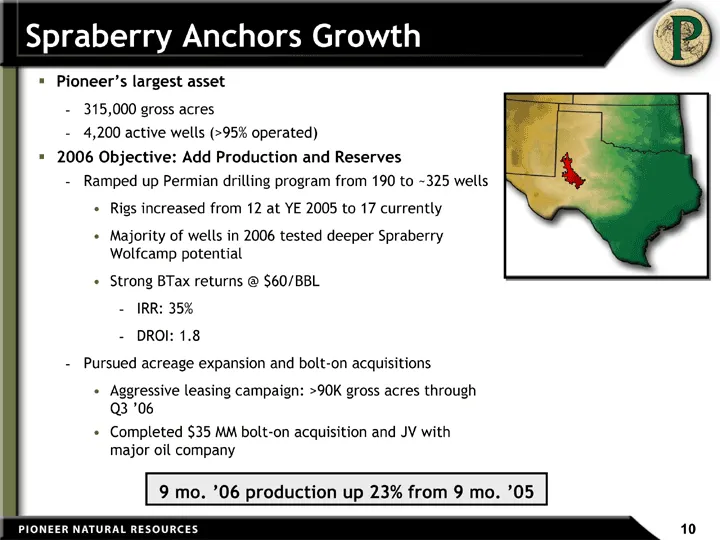
Spraberry Anchors Growth Pioneer's largest asset 315,000 gross acres 4,200 active wells (>95% operated) 2006 Objective: Add Production and Reserves Ramped up Permian drilling program from 190 to ~325 wells Rigs increased from 12 at YE 2005 to 17 currently Majority of wells in 2006 tested deeper Spra
Slide 10: Edwards Expansion on Schedule
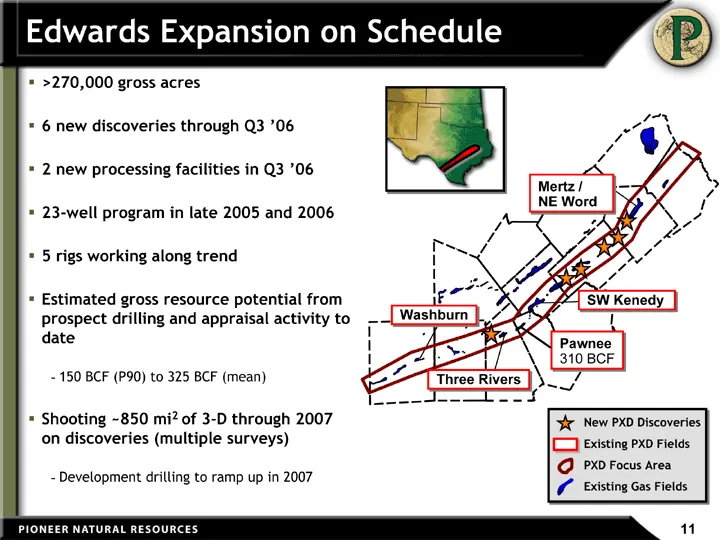
Edwards Expansion on Schedule >270,000 gross acres 6 new discoveries through Q3 '06 2 new processing facilities in Q3 '06 23-well program in late 2005 and 2006 5 rigs working along trend Estimated gross resource potential from prospect drilling and appraisal activity to date 150 BCF (P90) to 325 BCF
Slide 11: Raton Expansion Continues
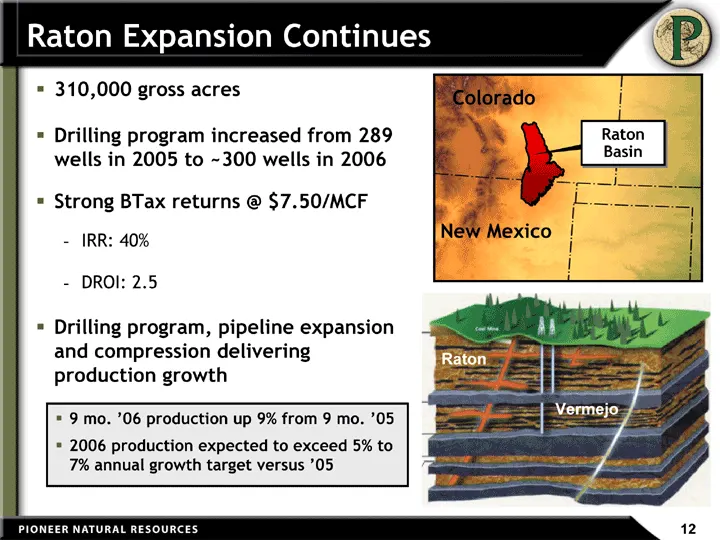
Raton Expansion Continues New Mexico Colorado Raton Basin 310,000 gross acres Drilling program increased from 289 wells in 2005 to ~300 wells in 2006 Strong BTax returns @ $7.50/MCF IRR: 40% DROI: 2.5 Drilling program, pipeline expansion and compression delivering production growth Raton Vermejo 9 m
Slide 12: Rockies Emerging Resource Plays
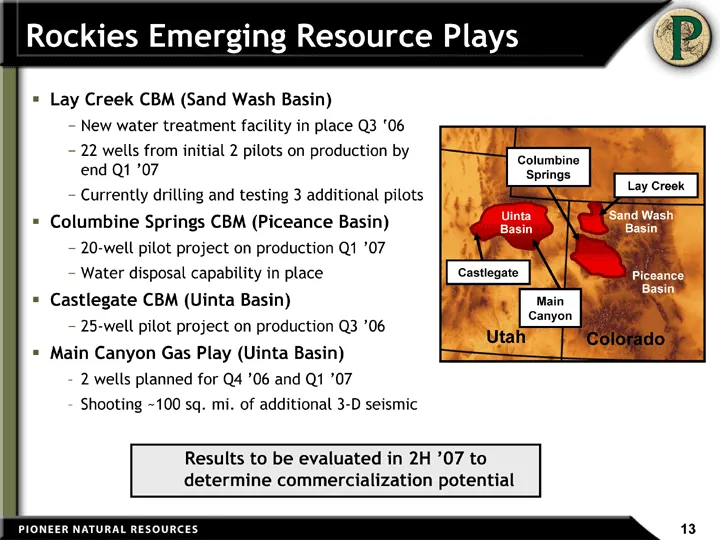
Rockies Emerging Resource Plays Lay Creek CBM (Sand Wash Basin) New water treatment facility in place Q3 '06 22 wells from initial 2 pilots on production by end Q1 '07 Currently drilling and testing 3 additional pilots Columbine Springs CBM (Piceance Basin) 20-well pilot project on production Q1 '07
Slide 13: Canada Production Growing
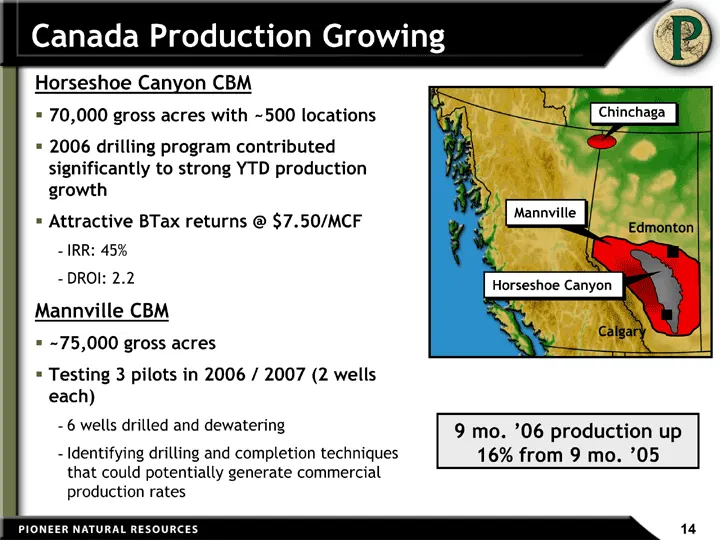
Canada Production Growing Horseshoe Canyon CBM 70,000 gross acres with ~500 locations 2006 drilling program contributed significantly to strong YTD production growth Attractive BTax returns @ $7.50/MCF IRR: 45% DROI: 2.2 Mannville CBM ~75,000 gross acres Testing 3 pilots in 2006 / 2007 (2 wells each
Slide 14: Development Projects On Schedule
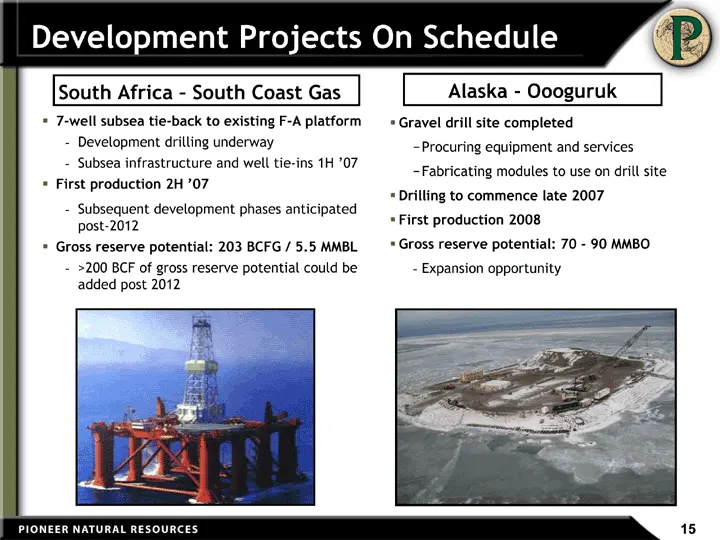
Development Projects On Schedule 7-well subsea tie-back to existing F-A platform Development drilling underway Subsea infrastructure and well tie-ins 1H '07 First production 2H '07 Subsequent development phases anticipated post-2012 Gross reserve potential: 203 BCFG / 5.5 MMBL >200 BCF of gross rese
Slide 15: Tunisia Provides Core Area Potential
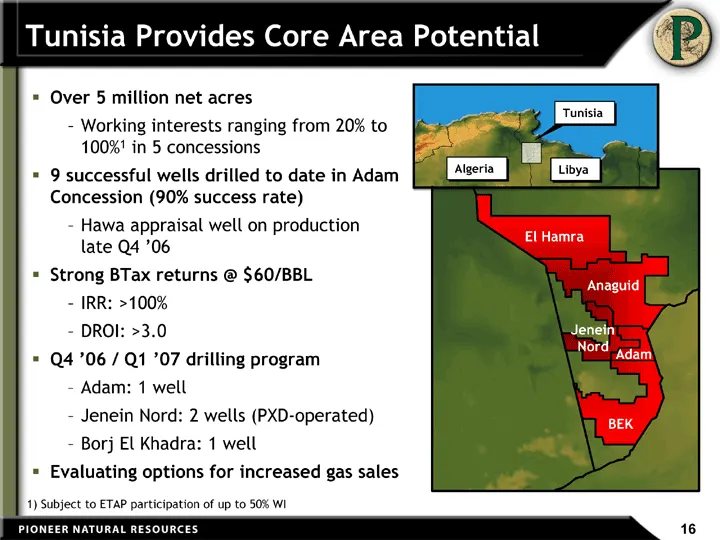
Tunisia Provides Core Area Potential Tunisia Algeria Libya 1) Subject to ETAP participation of up to 50% WI El Hamra Anaguid Jenein Nord Adam BEK Over 5 million net acres Working interests ranging from 20% to 100%1 in 5 concessions 9 successful wells drilled to date in Adam Concession (90% success r
Slide 16: Positioned to Create Value
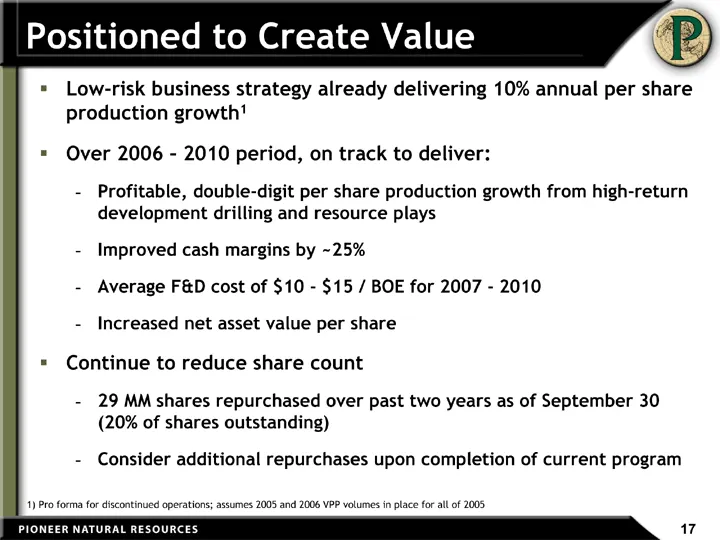
Positioned to Create Value Low-risk business strategy already delivering 10% annual per share production growth1 Over 2006 - 2010 period, on track to deliver: Profitable, double-digit per share production growth from high-return development drilling and resource plays Improved cash margins by ~25% A
Slide 17: Pioneer Today
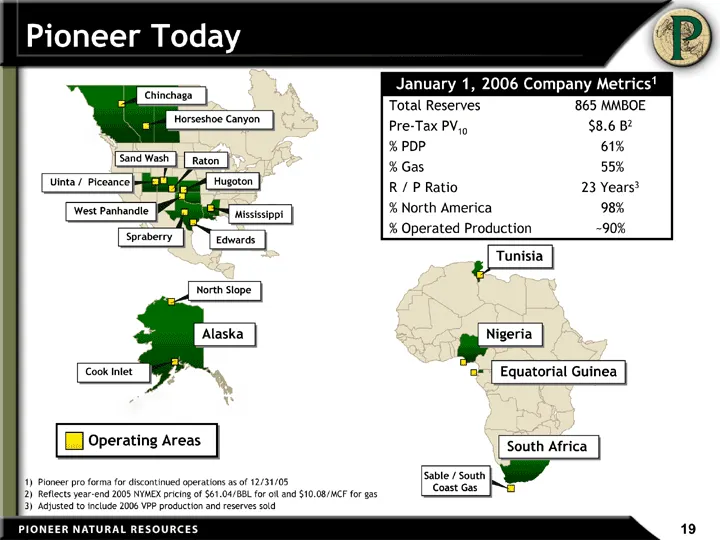
Pioneer Today Operating Areas Tunisia Nigeria Equatorial Guinea South Africa Sable / South Coast Gas January 1, 2006 Company Metrics1 January 1, 2006 Company Metrics1 Total Reserves 865 MMBOE Pre-Tax PV10 $8.6 B2 % PDP 61% % Gas 55% R / P Ratio 23 Years3 % North America 98% % Operated Production ~90
Slide 18: Spraberry Type Curve
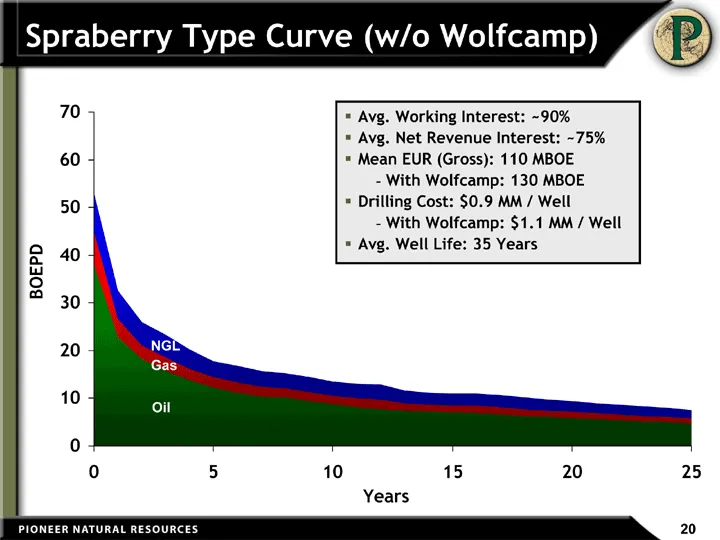
Spraberry Type Curve (w/o Wolfcamp) Years Oil Wet Gas Dry Gas MCF Dry Gas (BOE) 0 38 97.33 49.73 7 8 1 22.87 43.04 21.99 3.67 6.03 2 18.18 34.53 17.64 2.94 4.83 3 15.78 33.51 17.12 2.85 4.69 4 13.77 28.9 14.76 2.46 4.05 5 12.34 24.39 12.46 2.08 3.41 6 11.22 24.64 12.59 2.1 3.45 7 10.31 24.2 12.36 2.
Slide 19: Raton Type Curve
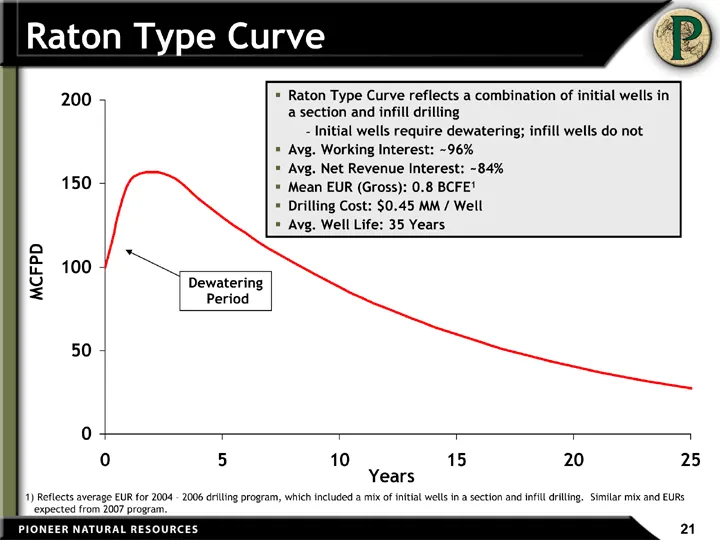
Raton Type Curve Years 2004 - 2006 Avg 0 100 1 150 2 157 3 153 4 140.5601195 5 130.0131103 6 120.257502 7 111.2339114 8 102.8874111 9 95.16719519 10 88.02627013 11 81.42116847 12 75.3116844 13 69.66062897 14 64.43360373 15 59.59879133 16 55.12676184 17 50.99029365 18 47.16420773 19 43.62521436 20 40
Slide 20: Horseshoe Canyon Type Curve
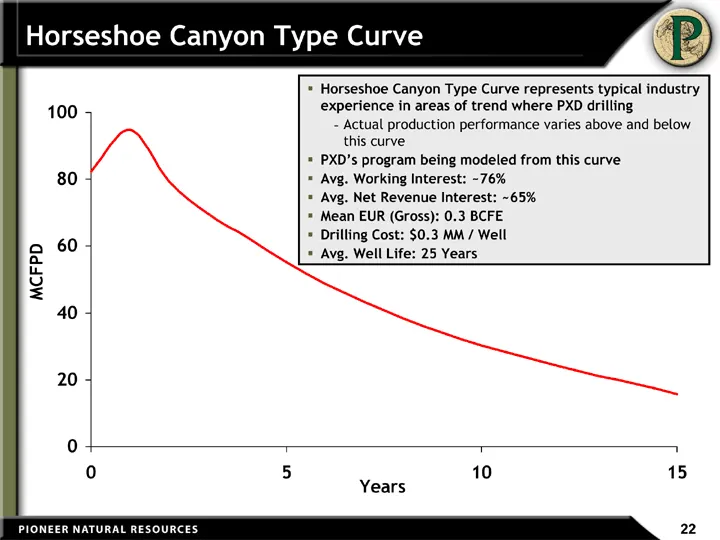
Years Gas 0 82.34311884 1 94.81128447 2 79.44693333 3 69.73333333 4 62.48764224 5 55.17649938 6 48.67891677 7 43.25408282 8 38.38502774 9 34.10789979 10 30.25901532 11 27.01845797 12 24.07975072 13 20.99282319 14 18.64090683 15 15.8 Horseshoe Canyon Type Curve Years MCFPD Horseshoe Canyon Type Curve
Slide 21: Pawnee EURs Expected For Edwards Trend
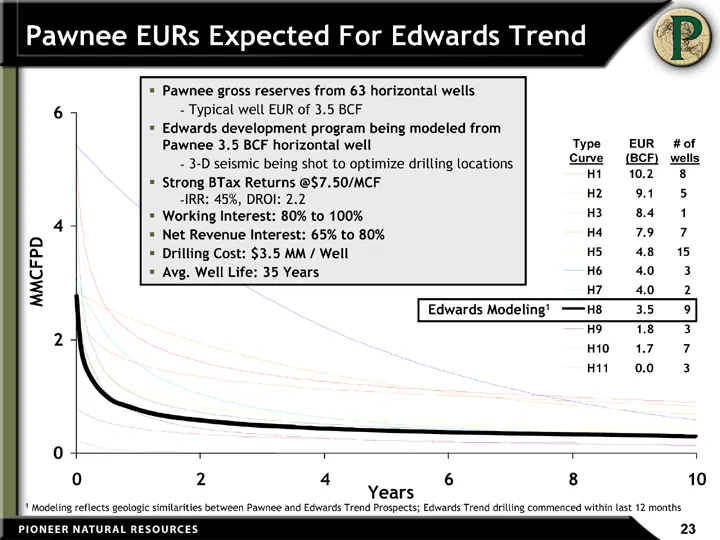
Pawnee EURs Expected For Edwards Trend H1 10.2 8 H2 9.1 5 H3 8.4 1 H4 7.9 7 H5 4.8 15 H6 4.0 3 H7 4.0 2 H8 3.5 9 H9 1.8 3 H10 1.7 7 H11 0.0 3 0 0 5.263 2.467 5.428 2.829 2.138 4.441 3.125 2.796 2.796 0.789 0.263 0.083333333 0 4.052 2.274 5.328 2.78 1.898 2.813 2.885 1.82 2.133 0.723 0.203 0.16666666
Slide 22: Unbooked Resource Potential Drives Down F&D Costs
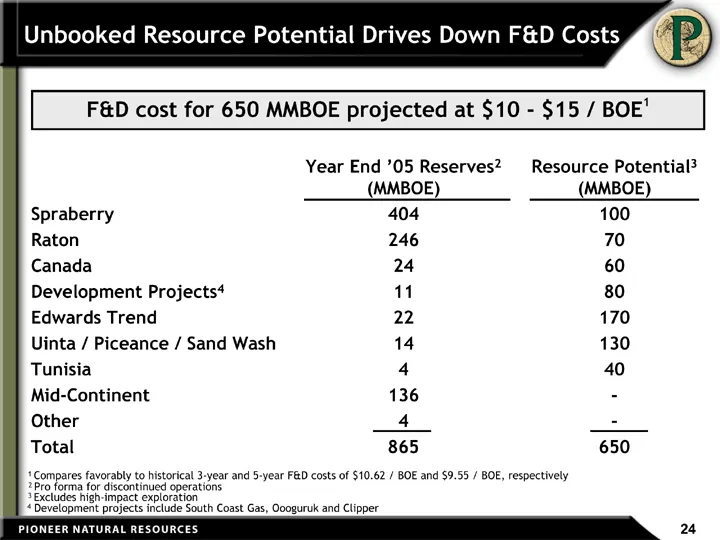
Unbooked Resource Potential Drives Down F&D Costs Year End '05 Reserves2 (MMBOE) Resource Potential3 (MMBOE) Spraberry 404 100 Raton 246 70 Canada 24 60 Development Projects4 11 80 Edwards Trend 22 170 Uinta / Piceance / Sand Wash 14 130 Tunisia 4 40 Mid-Continent 136 - Other 4 - Total 865 650 4 Dev
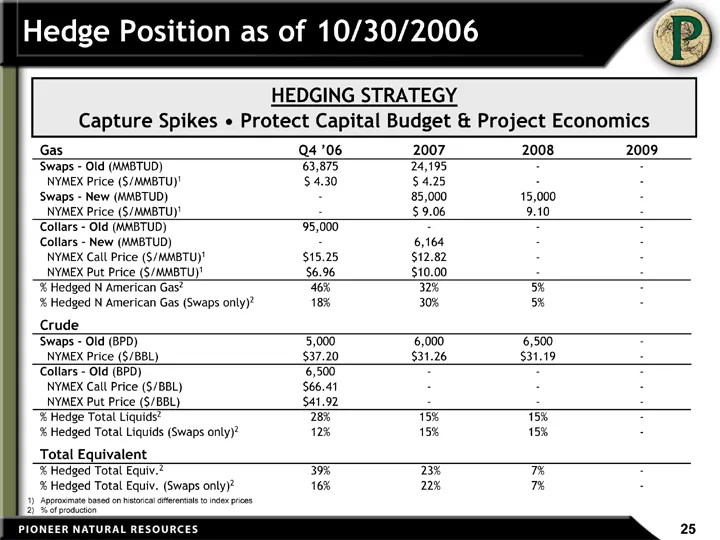
Slide 23: Hedging Positions
Approximate based on historical differentials to index prices % of production Gas Q4 '06 2007 2008 2009 Swaps - Old (MMBTUD) 63,875 24,195 - - NYMEX Price ($/MMBTU)1 $ 4.30 $ 4.25 - - Swaps - New (MMBTUD) - 85,000 15,000 - NYMEX Price ($/MMBTU)1 - $ 9.06 9.10 - Collars - Old (MMBTUD) 95,000 - - - Co
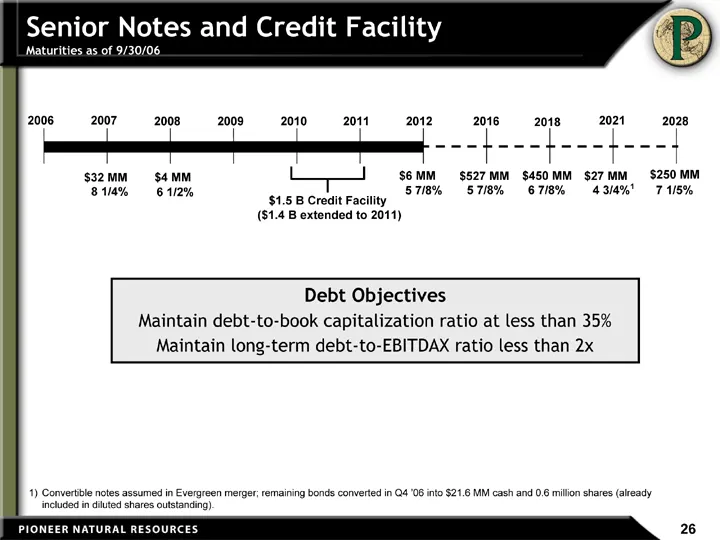
Slide 24: Senior Notes and Credit Facility Maturities
Senior Notes and Credit Facility Maturities as of 9/30/06 2006 2007 2008 2009 2010 2011 2012 2028 $32 MM 8 1/4% $6 MM 5 7/8% $250 MM 7 1/5% 2016 $527 MM 5 7/8% 2021 $27 MM 4 3/4%1 2018 $450 MM 6 7/8% $1.5 B Credit Facility ($1.4 B extended to 2011) $4 MM 6 1/2% Debt Objectives Maintain debt-to-book
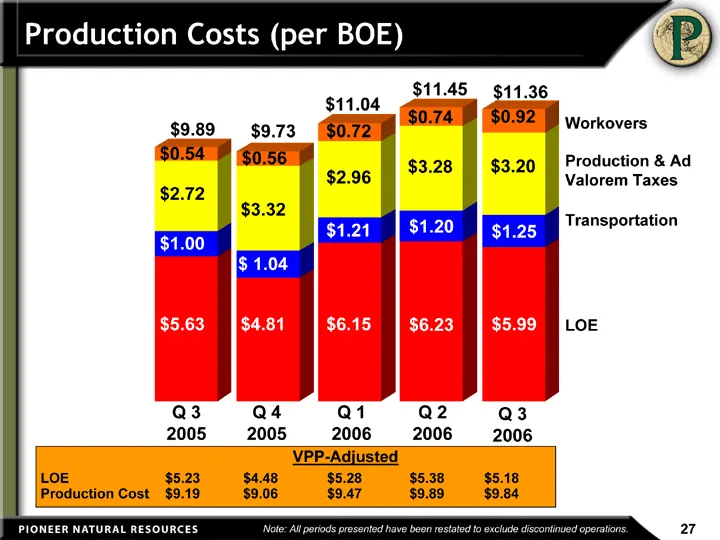
Slide 25: Production Cost History
Q1 Q2 Q3 Q1 2000 Q2 2000 Q3 2000 Q4 2000 Q1 01 Q2 2001 Q3 01 Q4 01 Q1 02 Q2 02 Q3 02 Q4 02 Q1 03 Q2 03 Q3 03 Q4 03 Q1 04 Q2 04 Q3 04 Q4 04 Q1 05 Q2 05 Q3 05 Q4 05 Q1 06 Q2 06 Q3 06 LOE 2.99 2.42 2.47 2.18 2.05 2.2 2.33 2.36 2.58 2.89 3.19 3.29 2.88 2.63 2.68 3.02 3.3 3.29 3.44 3.43 3.71 3.81 4.22 4.
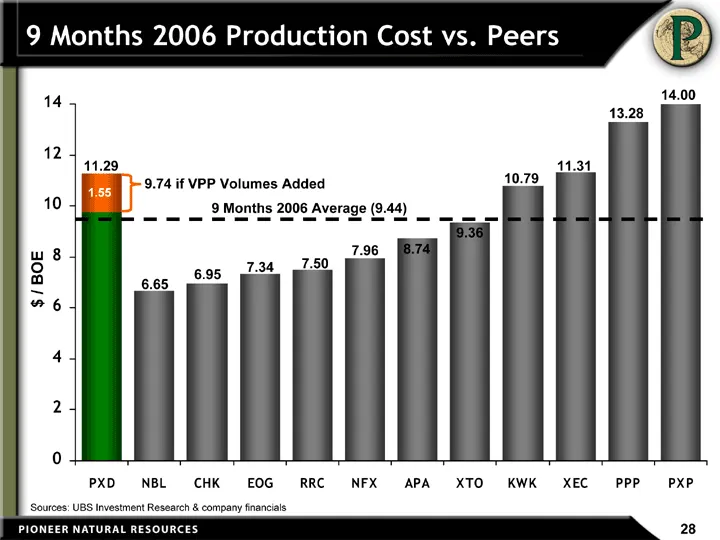
Slide 26: 2006 Production Cost vs. Peers
9 Months 2006 Production Cost vs. Peers PXD 9.7403 1.55 NBL 6.6533 CHK 6.9531 EOG 7.3425 RRC 7.5 7.5 NFX 7.9593 APA 8.739 XTO 9.3587 KWK 10.7948 XEC 11.3054 PPP 13.2844 PXP 14.0022 $ / BOE 11.29 6.65 6.95 7.34 7.50 7.96 8.74 14.00 13.28 10.79 9.36 9 Months 2006 Average (9.44) 9.74 if VPP Volumes Add
Slide 27: VPP-Adjusted Production Costs
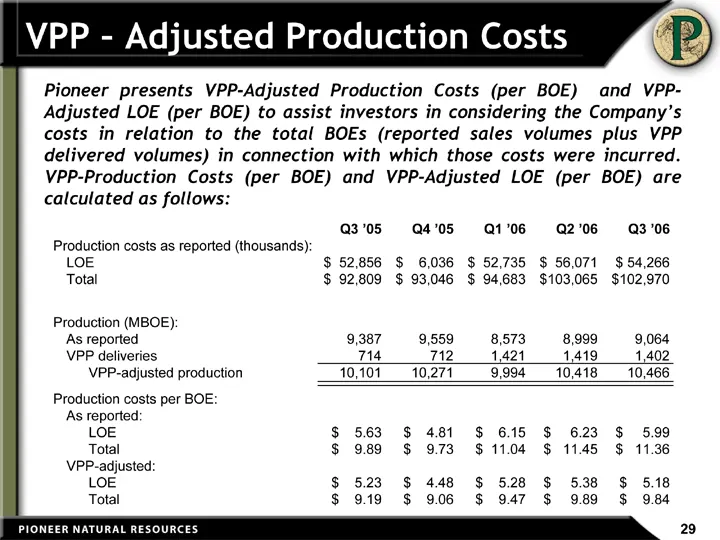
VPP - Adjusted Production Costs Pioneer presents VPP-Adjusted Production Costs (per BOE) and VPP- Adjusted LOE (per BOE) to assist investors in considering the Company's costs in relation to the total BOEs (reported sales volumes plus VPP delivered volumes) in connection with which those costs were
Slide 28: Certain Reserve Information
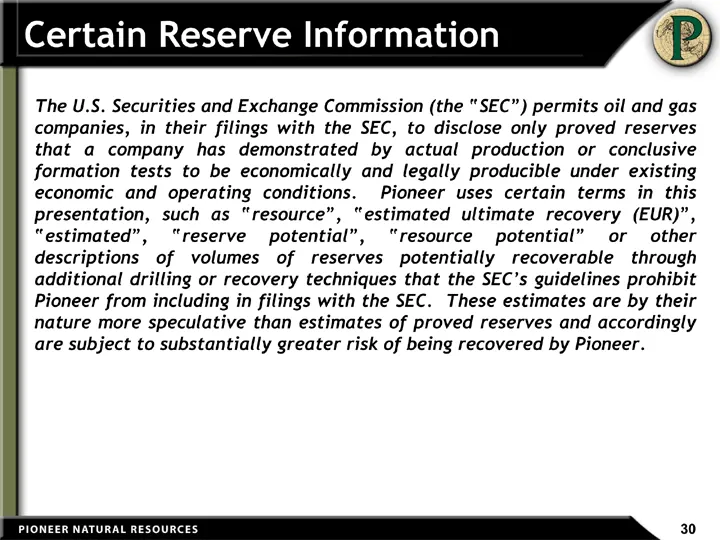
Certain Reserve Information The U.S. Securities and Exchange Commission (the "SEC") permits oil and gas companies, in their filings with the SEC, to disclose only proved reserves that a company has demonstrated by actual production or conclusive formation tests to be economically and legally produci
Source: SEC EDGAR · 8-K filed Jan 17, 2007
More decks from Pioneer Natural Resources Co
 Merger or Acquisition (October 2023)15 slides · Oct 11, 2023
 Q3 2020 Earnings Presentation30 slides · Nov 4, 2020
 Merger or Acquisition (October 2020)18 slides · Oct 20, 2020
 IPAA Oil & Gas Investment Symposium 201846 slides · Apr 9, 2018
 Investor Presentation (January 2014)80 slides · Jan 6, 2014
 Q4 2012 Earnings Presentation48 slides · Feb 13, 2013