Durr AG · XETR:DUE
Durr — Investor Presentation (April 2016)
45 slides from Durr's investor presentation, April 2016
Slide 1: Investor Relations Presentation
WELCOME INVESTOR RELATIONS PRESENTATION Bietigheim-Bissingen, April 2016 www.durr.com
Slide 2: Disclaimer
DISCLAIMER This investor presentation has been prepared independently by Dürr AG (“Dürr”). The presentation contains statements which address such key issues as Dürr’s strategy, future financial results, market positions and product development. Such statements should be carefully considered, and it
Slide 3: Agenda
AGENDA 1. Dürr: A portfolio of global market leaders in engineering 2. Our five divisions 3. Group strategy 4. Group financials, markets and outlook © Dürr AG, CCI, Investor Relations Presentation, Bietigheim-Bissingen, April 2016 3
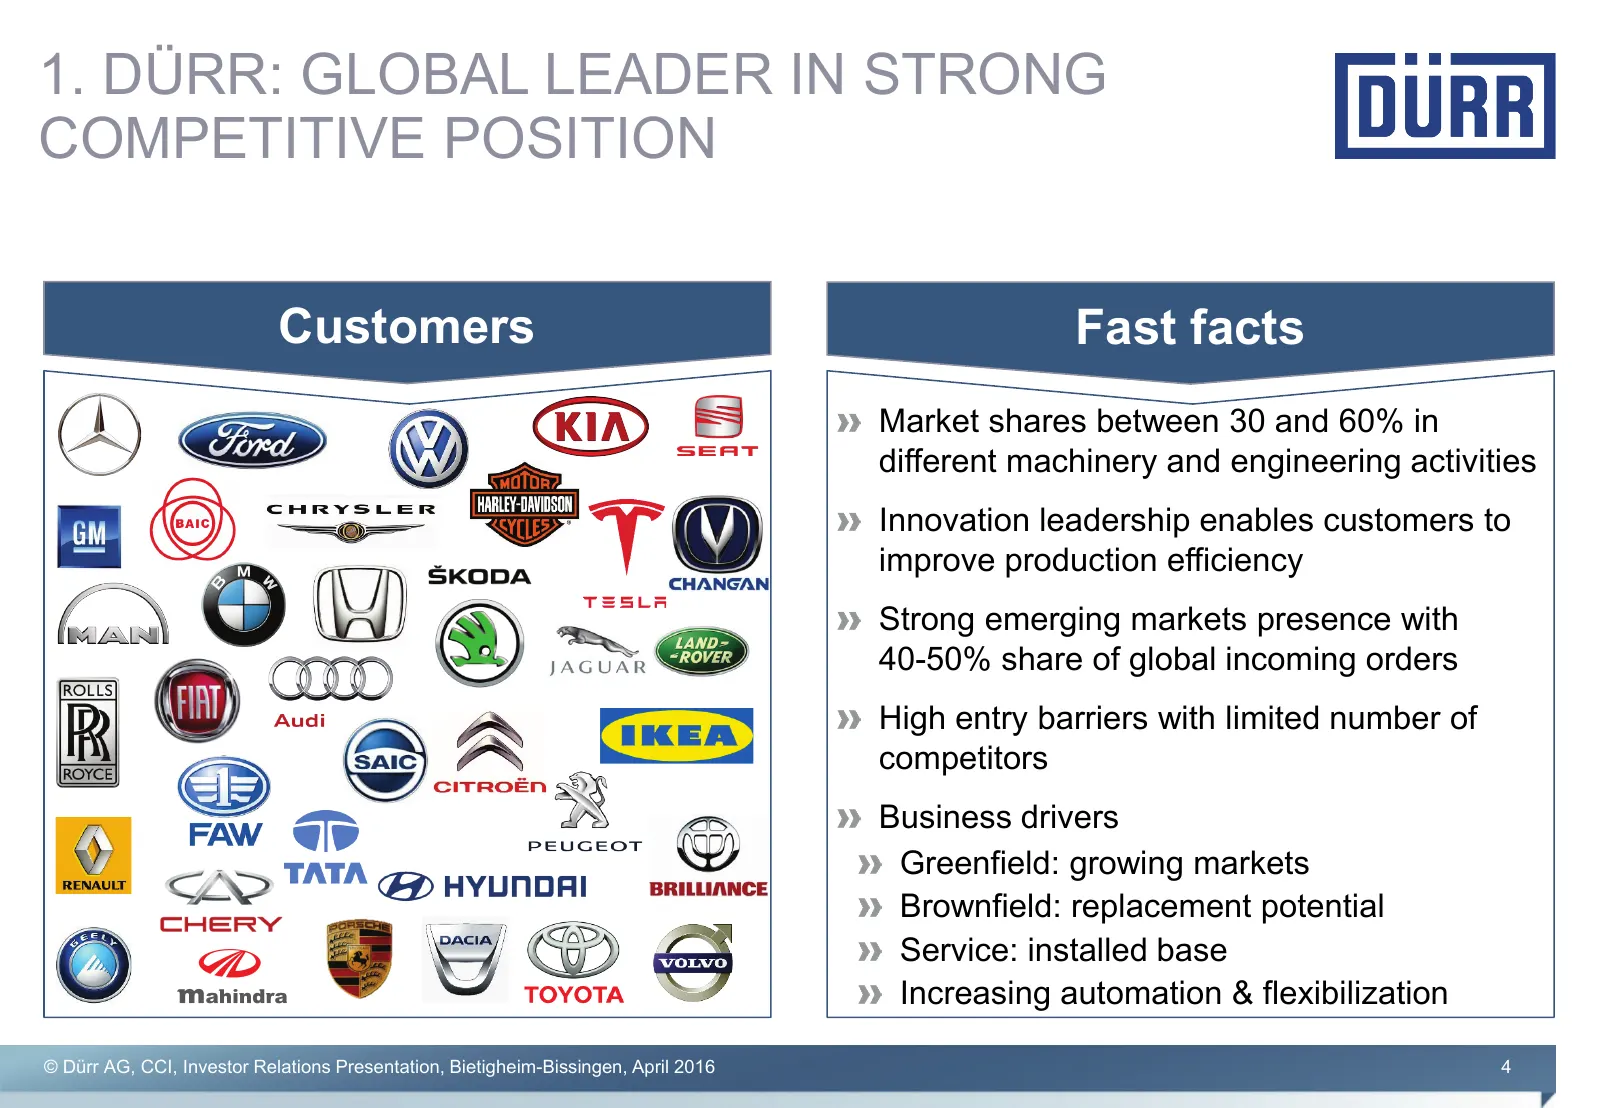
Slide 4: Dürr: Global Leader in Strong Competitive Position
1. DÜRR: GLOBAL LEADER IN STRONG COMPETITIVE POSITION Customers Fast facts Market shares between 30 and 60% in different machinery and engineering activities Innovation leadership enables customers to improve production efficiency Strong emerging markets presence with 40-50% share of global incoming
Slide 5: Order Intake: Regions/Sectors
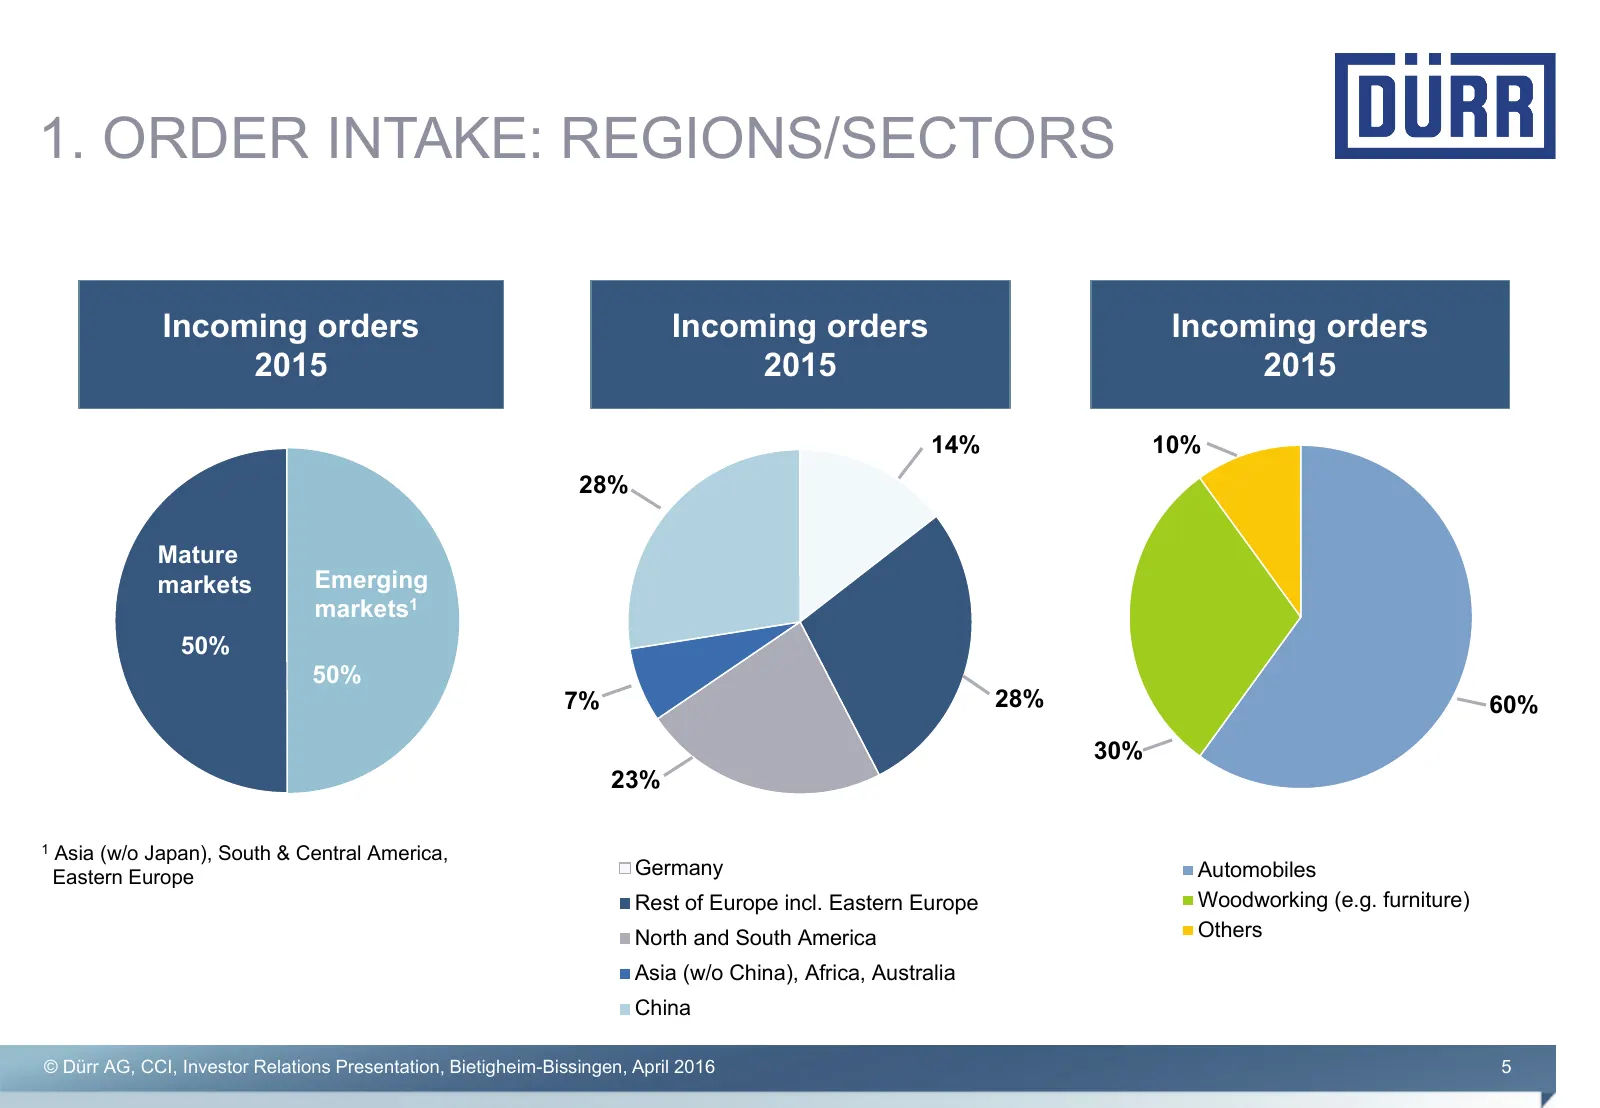
1. ORDER INTAKE: REGIONS/SECTORS Incoming orders Incoming orders Incoming orders 2015 2015 2015 14% 10% 28% Mature markets Emerging markets1 50% 50% 7% 28% 60% 30% 23% 1 Asia (w/o Japan), South & Central America, Eastern Europe Germany Automobiles Rest of Europe incl. Eastern Europe Woodworking (e.g
Slide 6: Agenda
AGENDA 1. Dürr: A portfolio of global market leaders in engineering 2. Our five divisions 3. Group strategy 4. Group financials, markets and outlook © Dürr AG, CCI, Investor Relations Presentation, Bietigheim-Bissingen, April 2016 6
Slide 7: Our Five Divisions
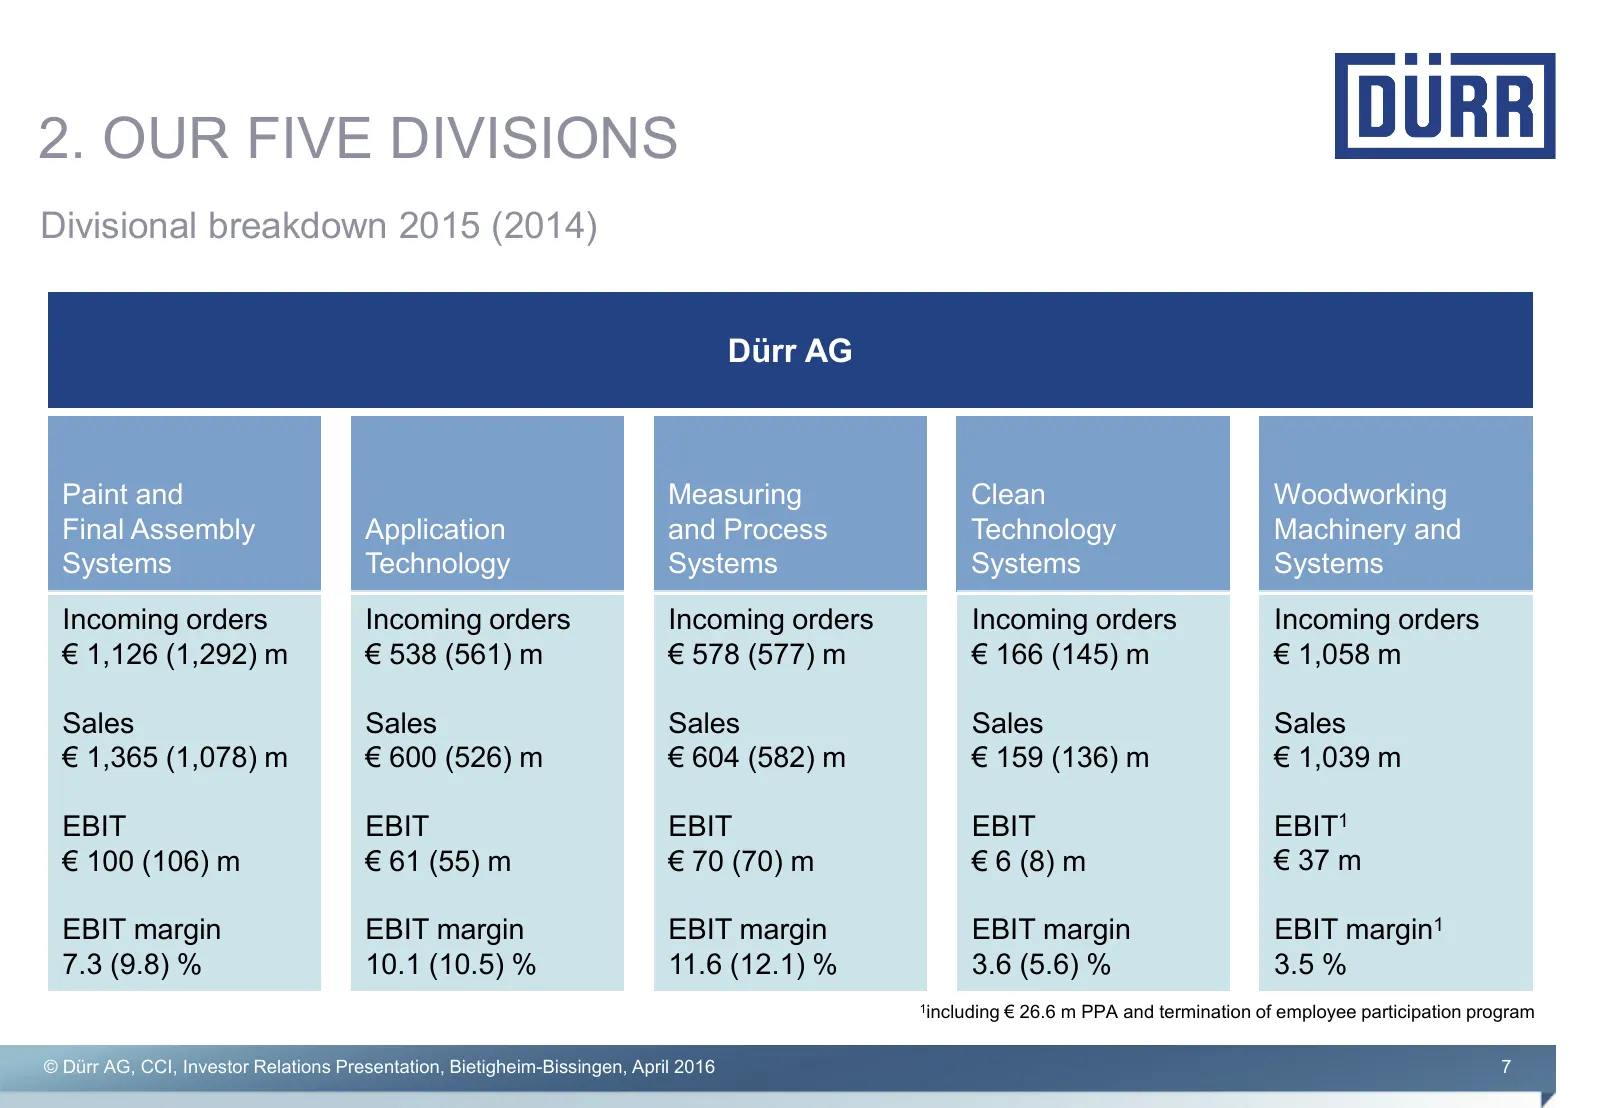
2. OUR FIVE DIVISIONS Divisional breakdown 2015 (2014) Dürr AG Paint and Measuring Clean Woodworking Final Assembly Application and Process Technology Machinery and Systems Technology Systems Systems Systems Incoming orders Incoming orders Incoming orders Incoming orders Incoming orders € 1,126 (1,2
Slide 8: Paint and Final Assembly Systems
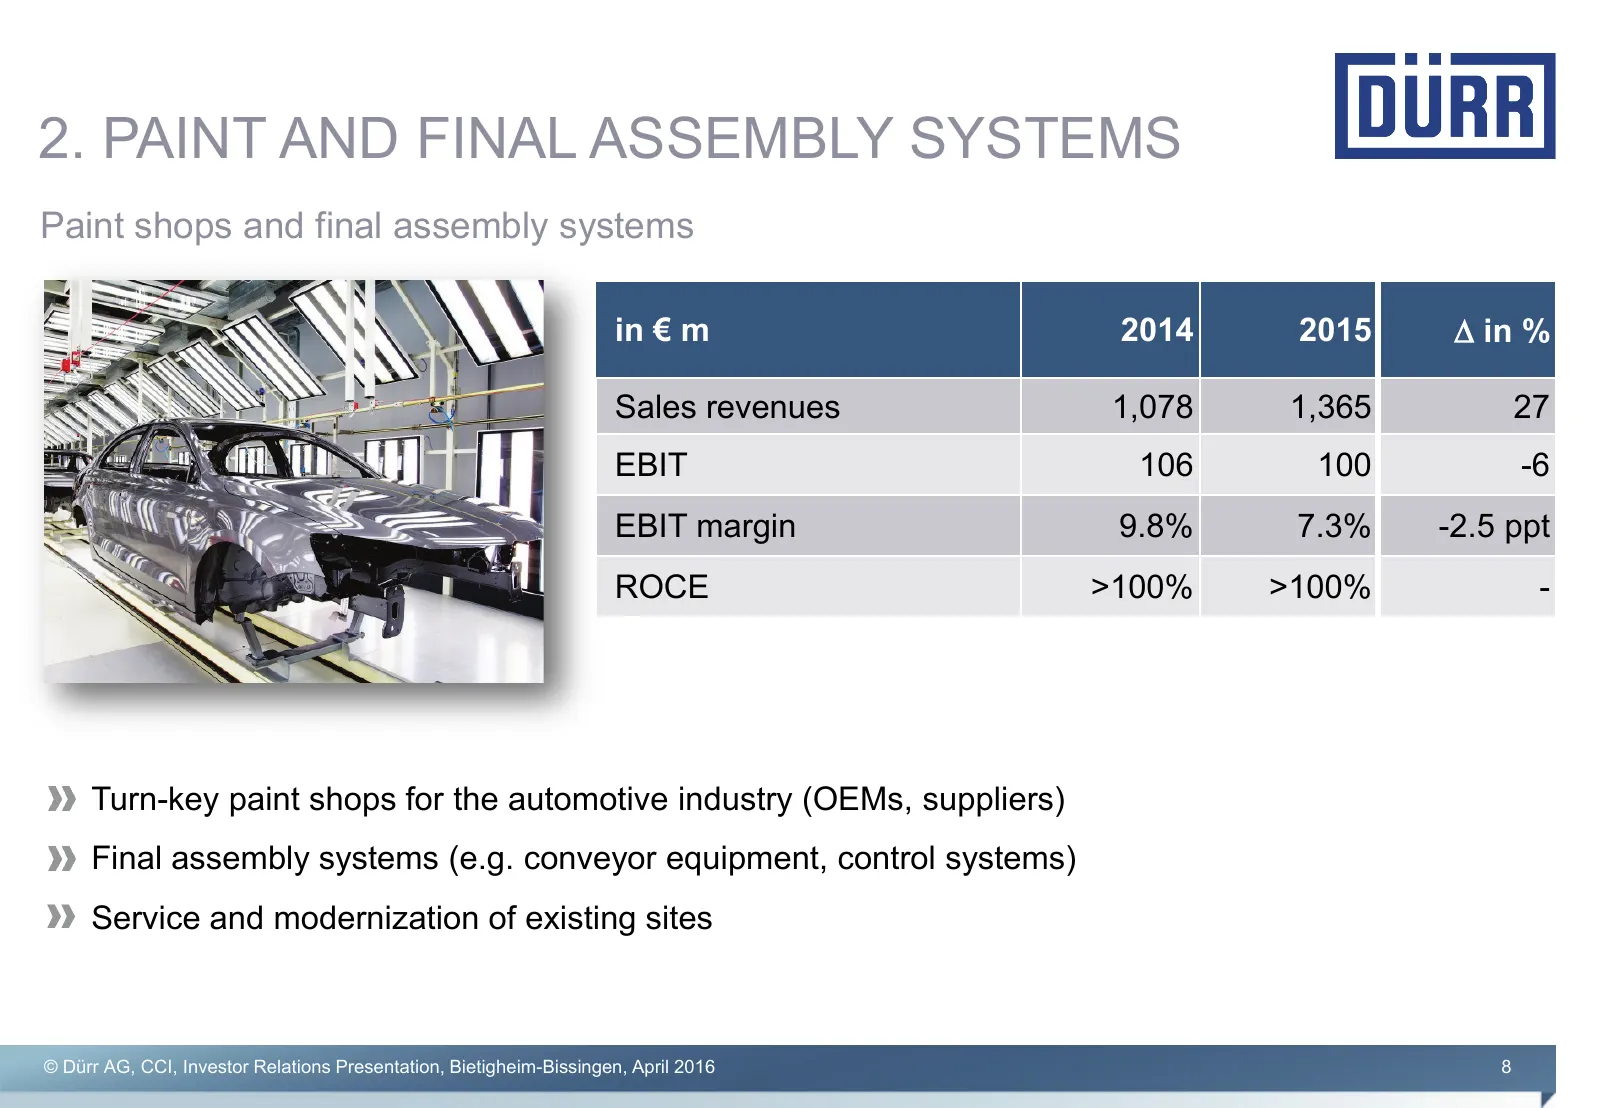
2. PAINT AND FINAL ASSEMBLY SYSTEMS Paint shops and final assembly systems in € m 2014 2015 ∆ in % Sales revenues 1,078 1,365 27 EBIT 106 100 -6 EBIT margin 9.8% 7.3% -2.5 ppt ROCE >100% >100% - Turn-key paint shops for the automotive industry (OEMs, suppliers) Final assembly systems (e.g. conveyor
Slide 9: Application Technology
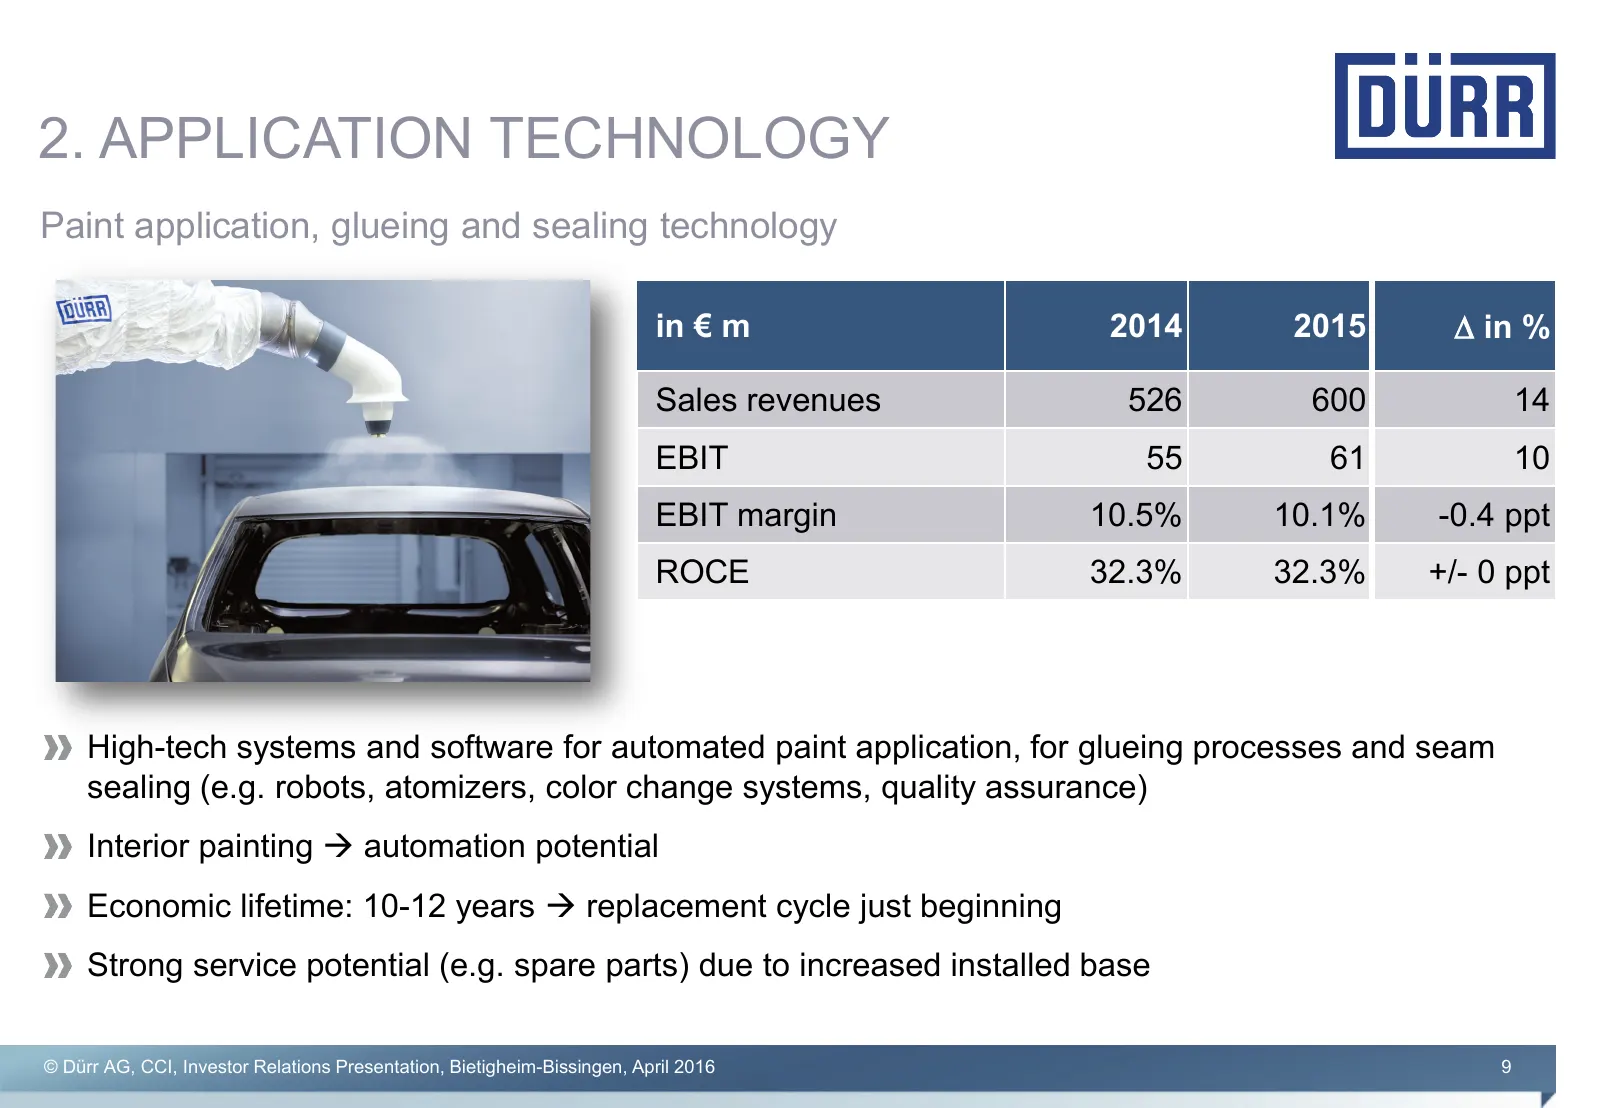
2. APPLICATION TECHNOLOGY Paint application, glueing and sealing technology in € m 2014 2015 ∆ in % Sales revenues 526 600 14 EBIT 55 61 10 EBIT margin 10.5% 10.1% -0.4 ppt ROCE 32.3% 32.3% +/- 0 ppt High-tech systems and software for automated paint application, for glueing processes and seam seali
Slide 10: Application Technology: Addressing New Markets: Industrial Products
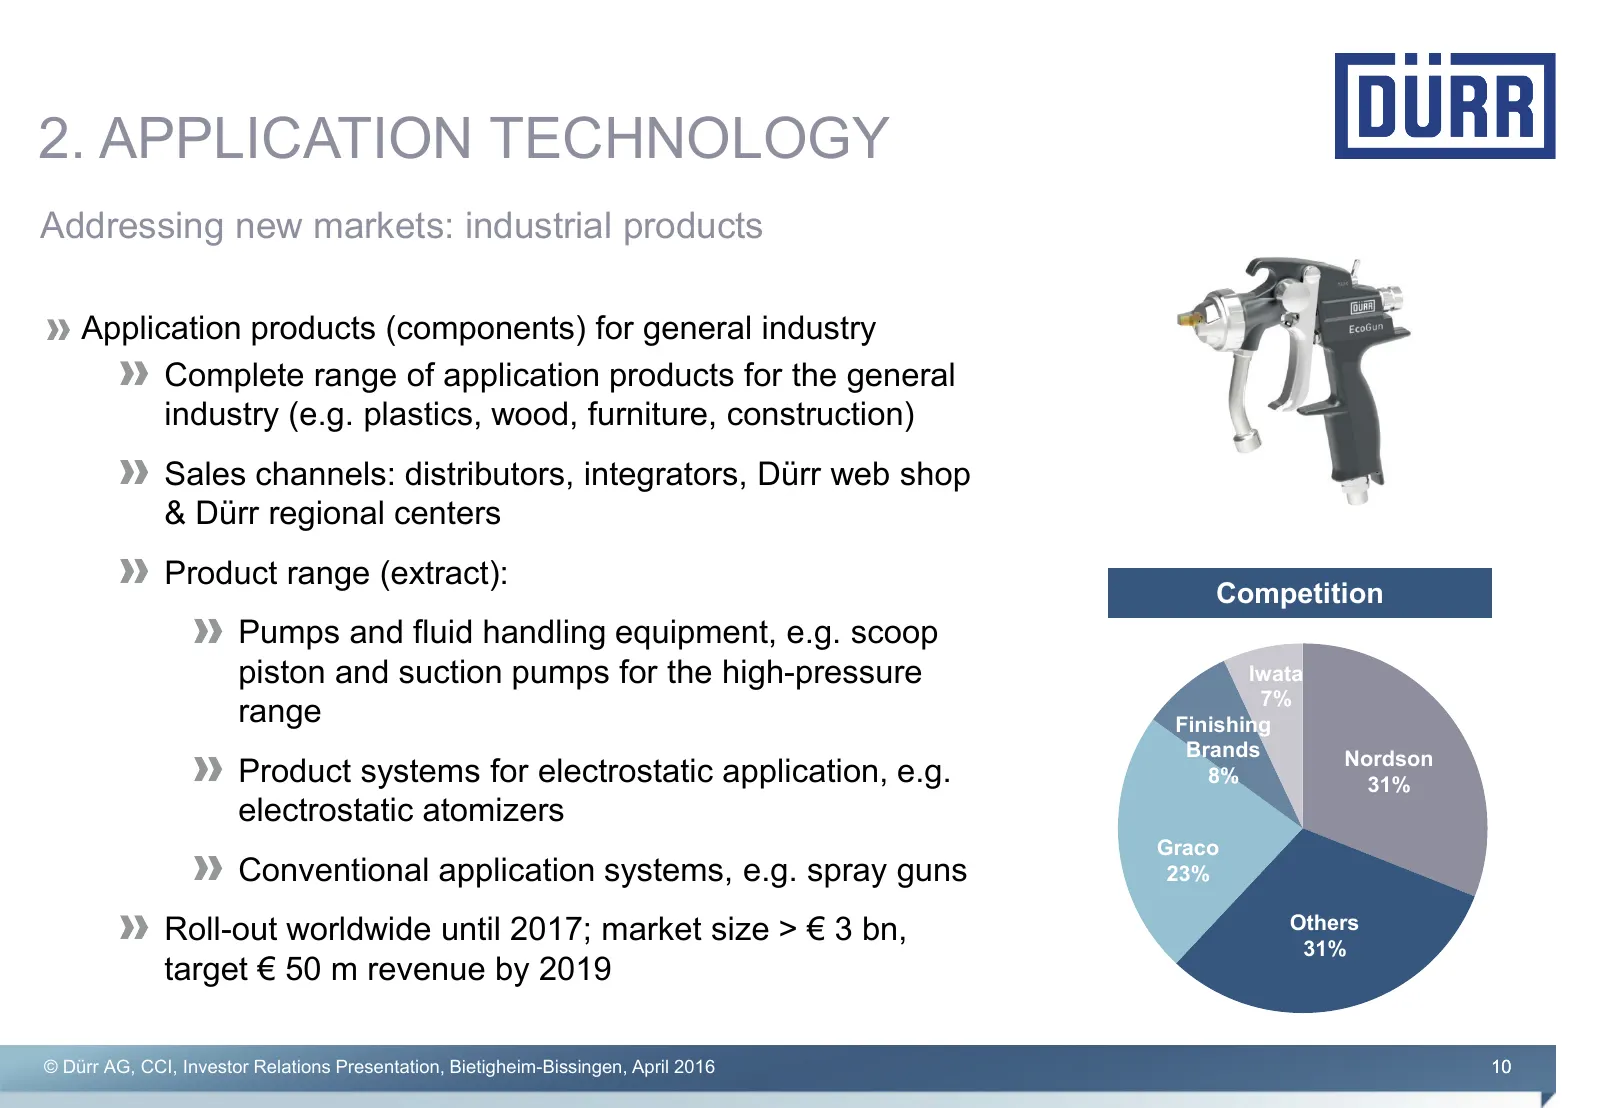
2. APPLICATION TECHNOLOGY Addressing new markets: industrial products Application products (components) for general industry Complete range of application products for the general industry (e.g. plastics, wood, furniture, construction) Sales channels: distributors, integrators, Dürr web shop & Dürr
Slide 11: Paint Business
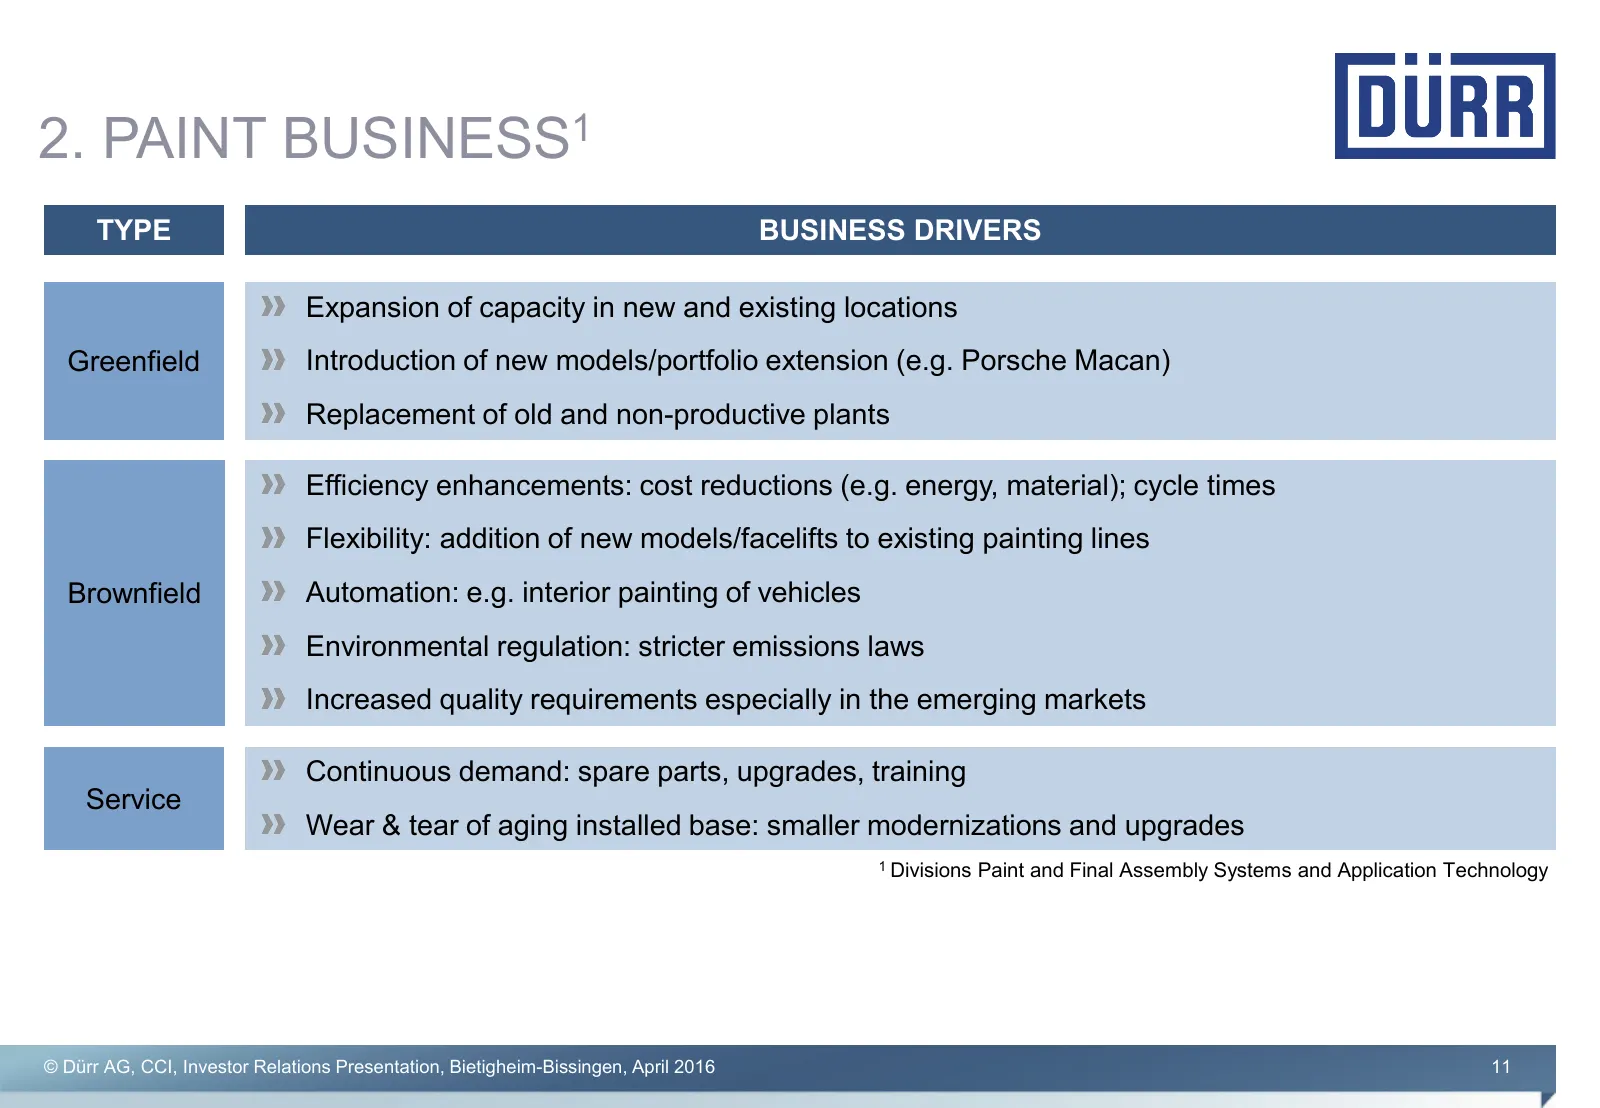
2. PAINT BUSINESS1 TYPE BUSINESS DRIVERS Expansion of capacity in new and existing locations Greenfield Introduction of new models/portfolio extension (e.g. Porsche Macan) Replacement of old and non-productive plants Efficiency enhancements: cost reductions (e.g. energy, material); cycle times Flexi
Slide 12: Paint Business: Brownfield with Growing Importance
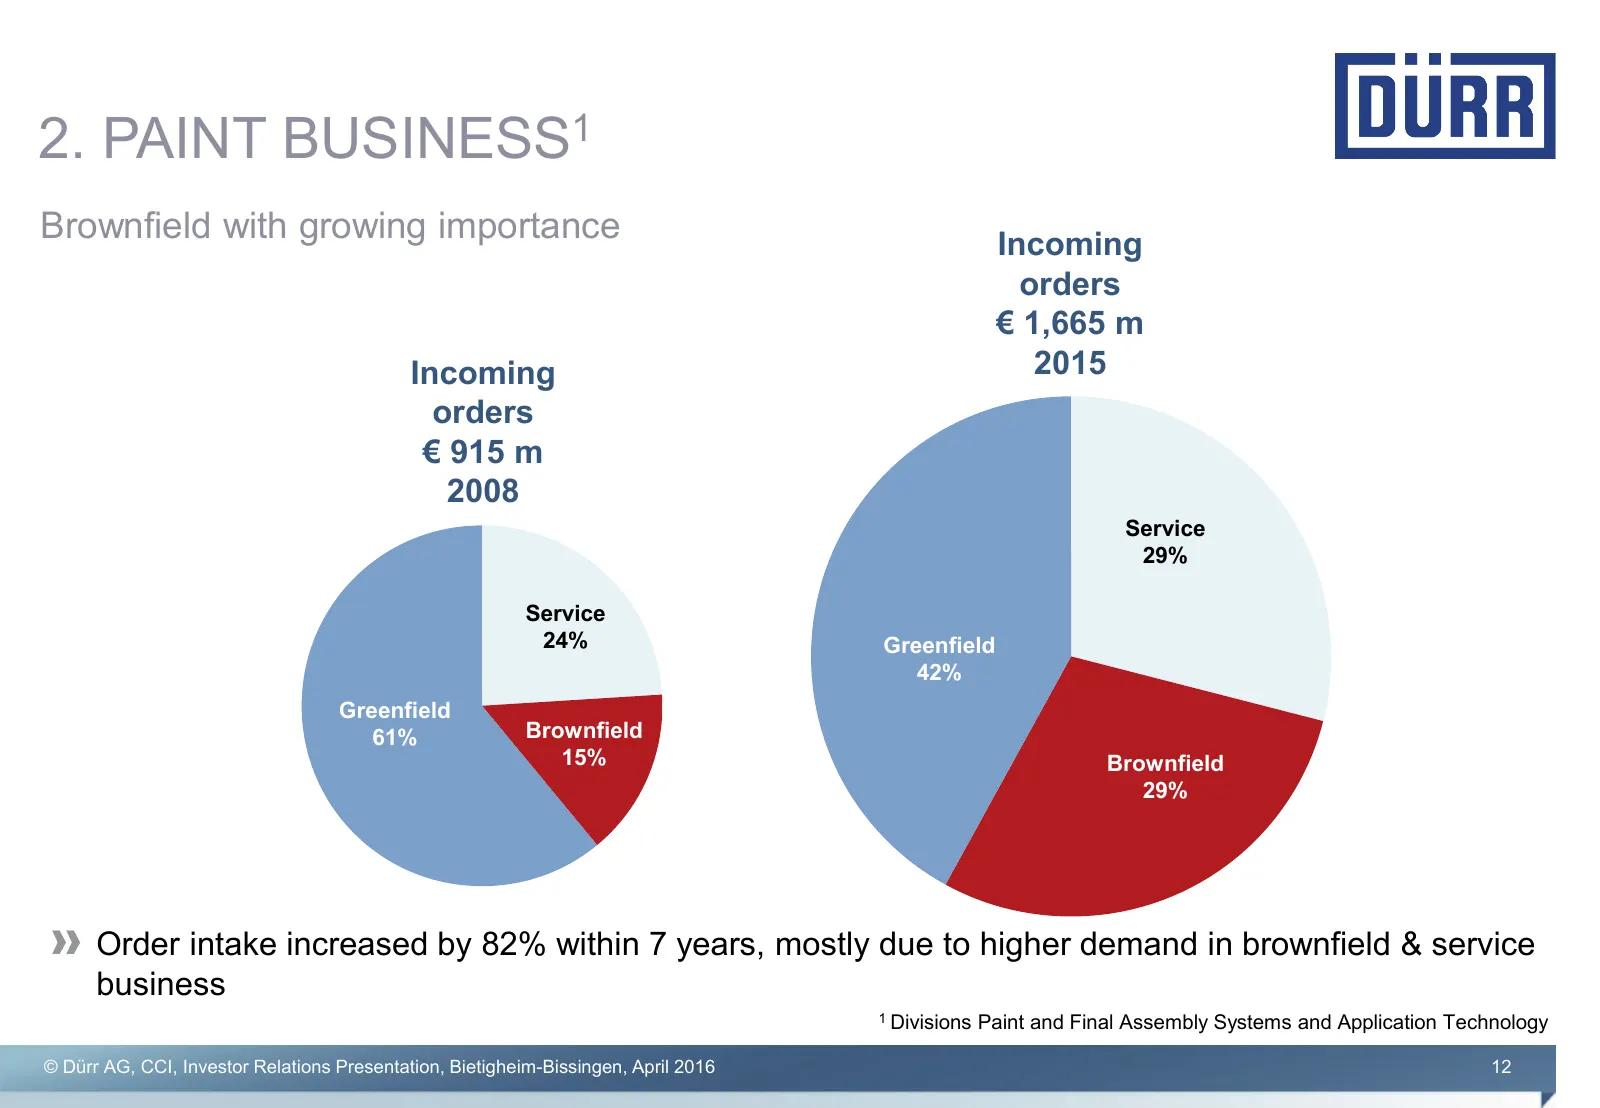
2. PAINT BUSINESS1 Brownfield with growing importance Incoming orders € 1,665 m Incoming 2015 orders € 915 m 2008 Service 29% Service 24% Greenfield 42% Greenfield 61% Brownfield 15% Brownfield 29% Order intake increased by 82% within 7 years, mostly due to higher demand in brownfield & service busi
Slide 13: Brownfield Project Example: SGM Shanghai
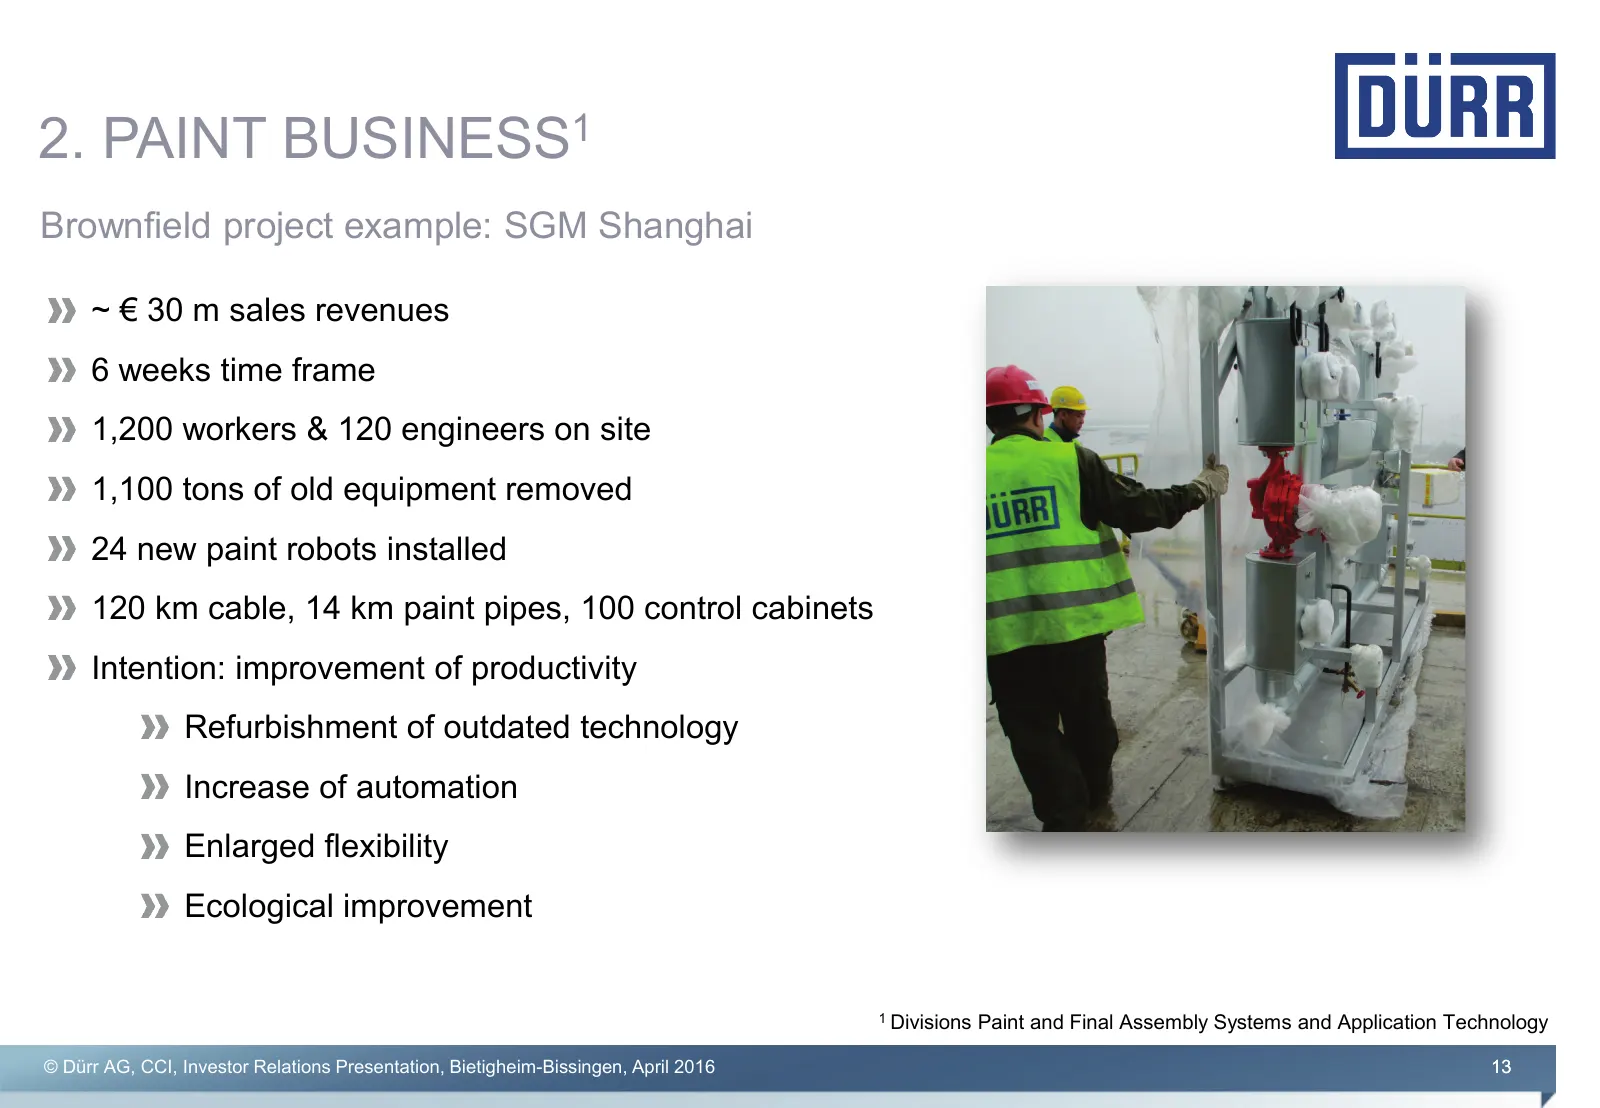
2. PAINT BUSINESS1 Brownfield project example: SGM Shanghai ~ € 30 m sales revenues 6 weeks time frame 1,200 workers & 120 engineers on site 1,100 tons of old equipment removed 24 new paint robots installed 120 km cable, 14 km paint pipes, 100 control cabinets Intention: improvement of productivity
Slide 14: Measuring and Process Systems
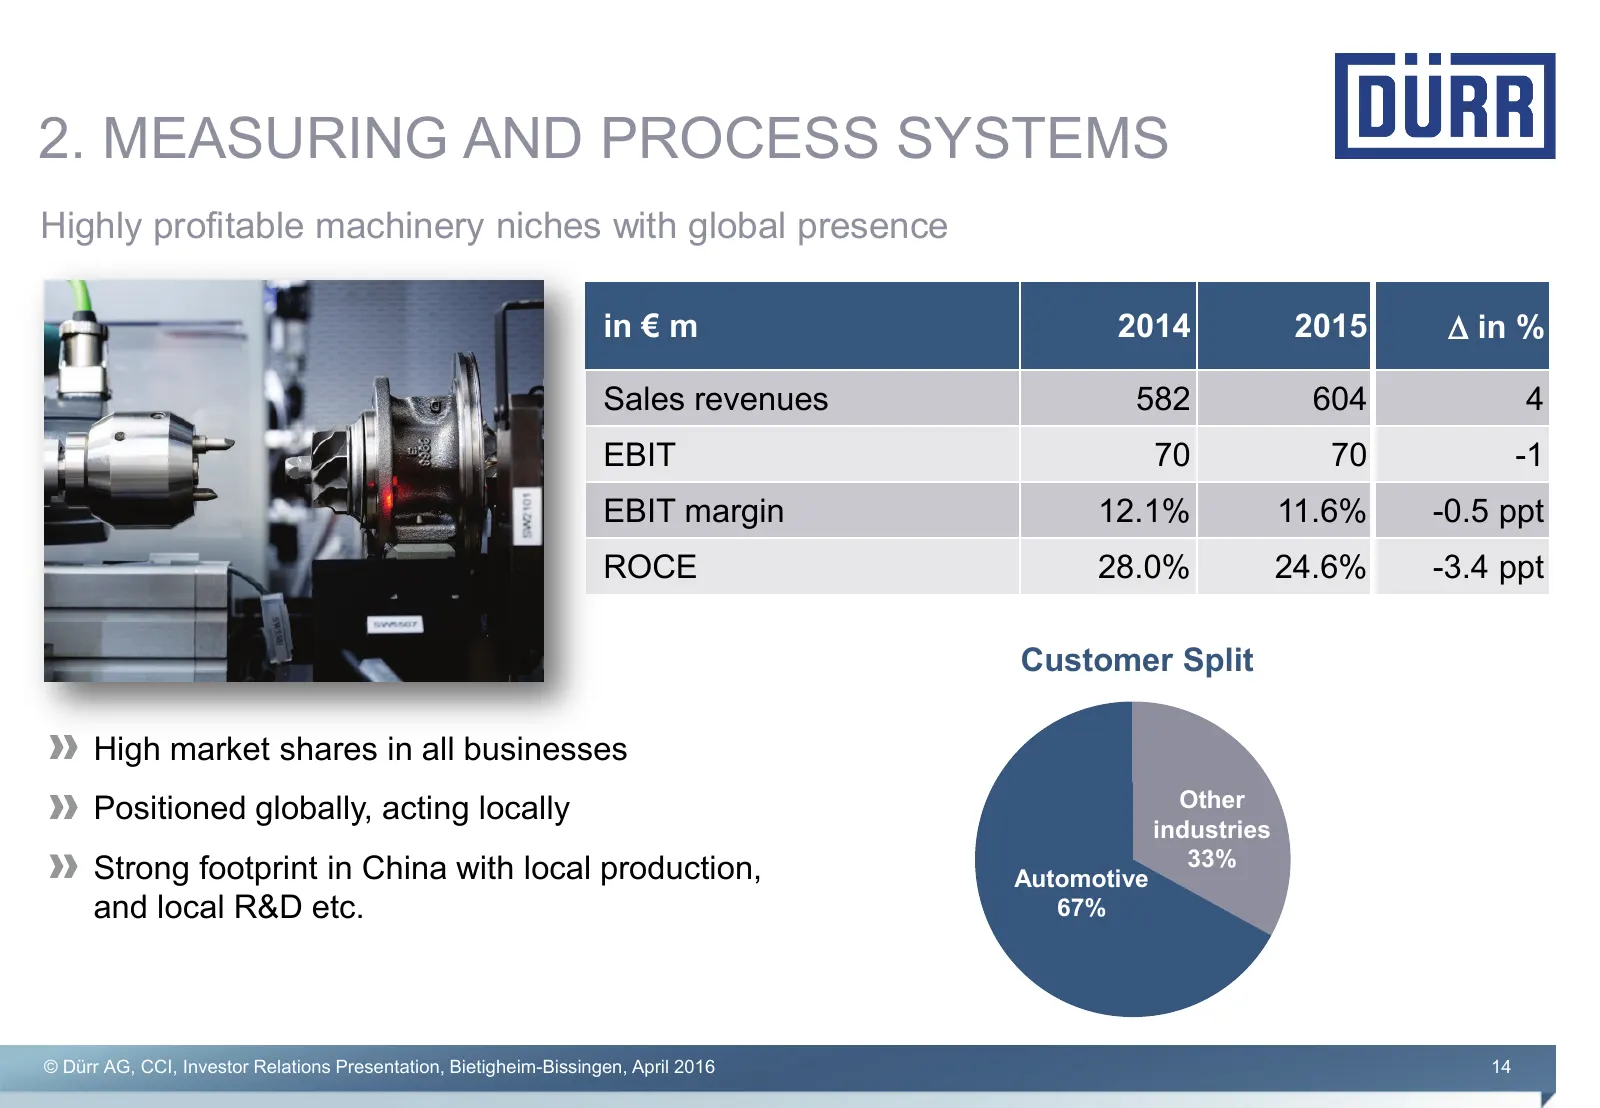
2. MEASURING AND PROCESS SYSTEMS Highly profitable machinery niches with global presence in € m 2014 2015 ∆ in % Sales revenues 582 604 4 EBIT 70 70 -1 EBIT margin 12.1% 11.6% -0.5 ppt ROCE 28.0% 24.6% -3.4 ppt Customer Split High market shares in all businesses Positioned globally, acting locally O
Slide 15: Four Strongly Performing Machinery Niche Players
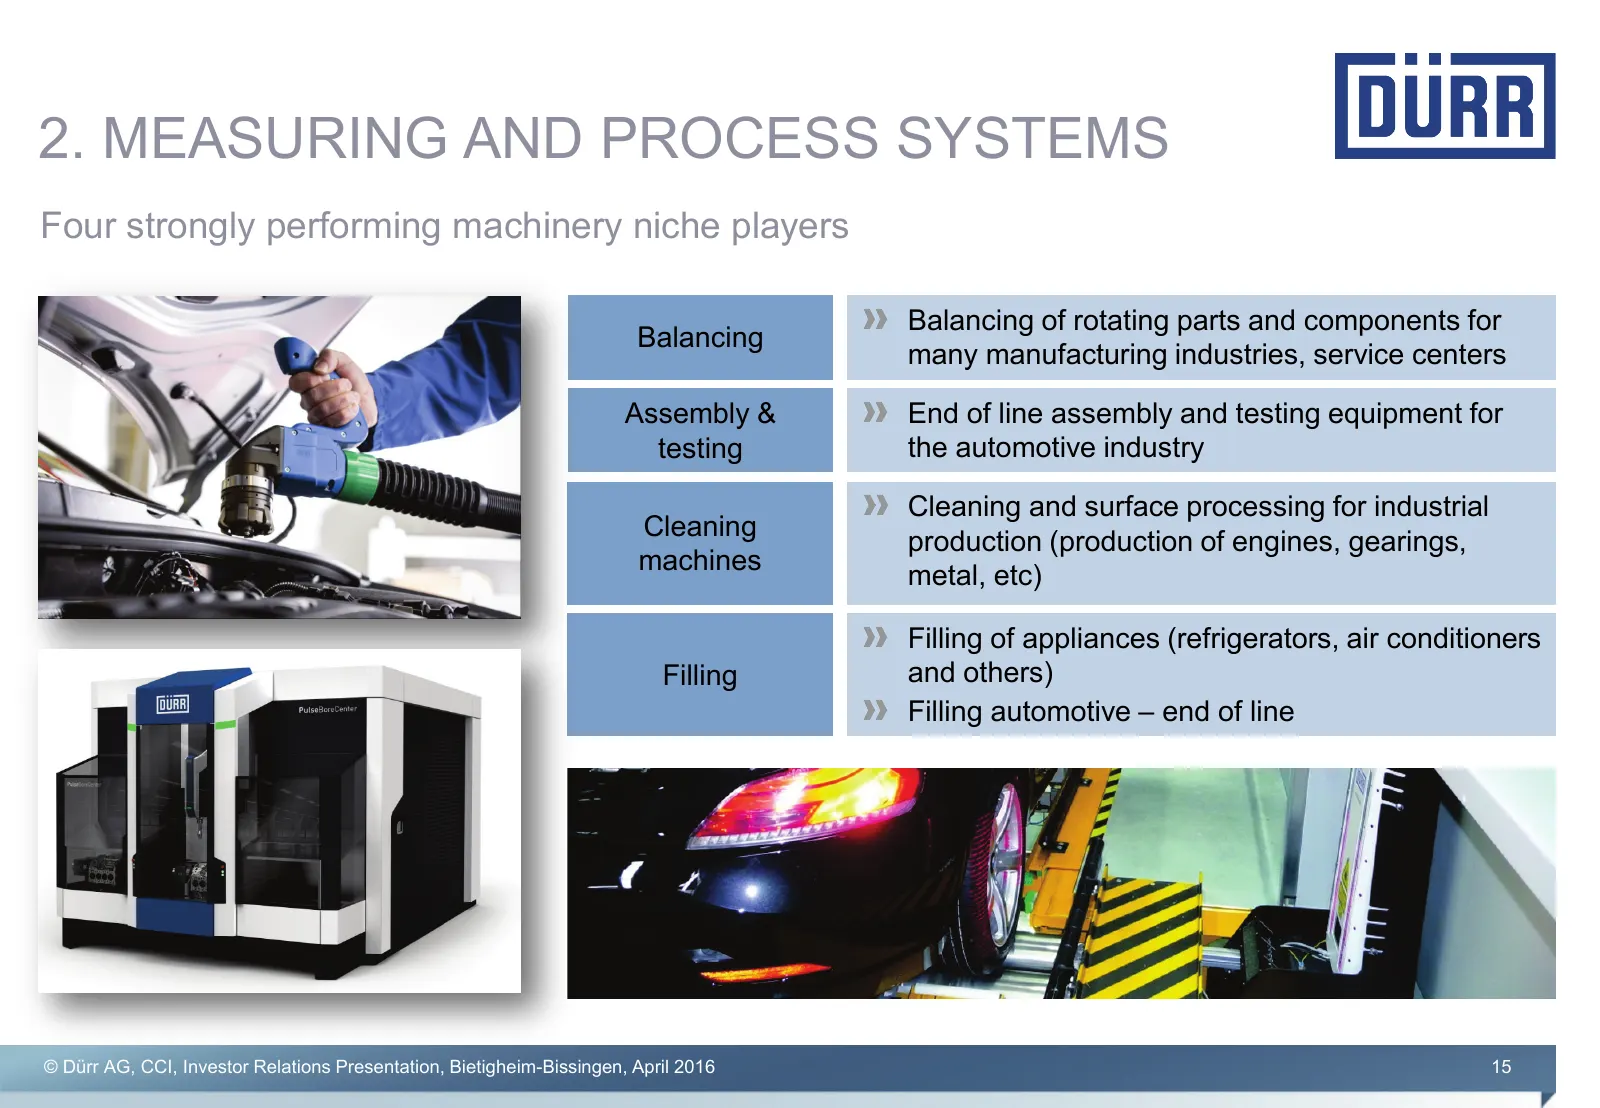
2. MEASURING AND PROCESS SYSTEMS Four strongly performing machinery niche players Balancing of rotating parts and components for Balancing many manufacturing industries, service centers Assembly & End of line assembly and testing equipment for testing the automotive industry Cleaning and surface pro
Slide 16: Clean Technology Systems
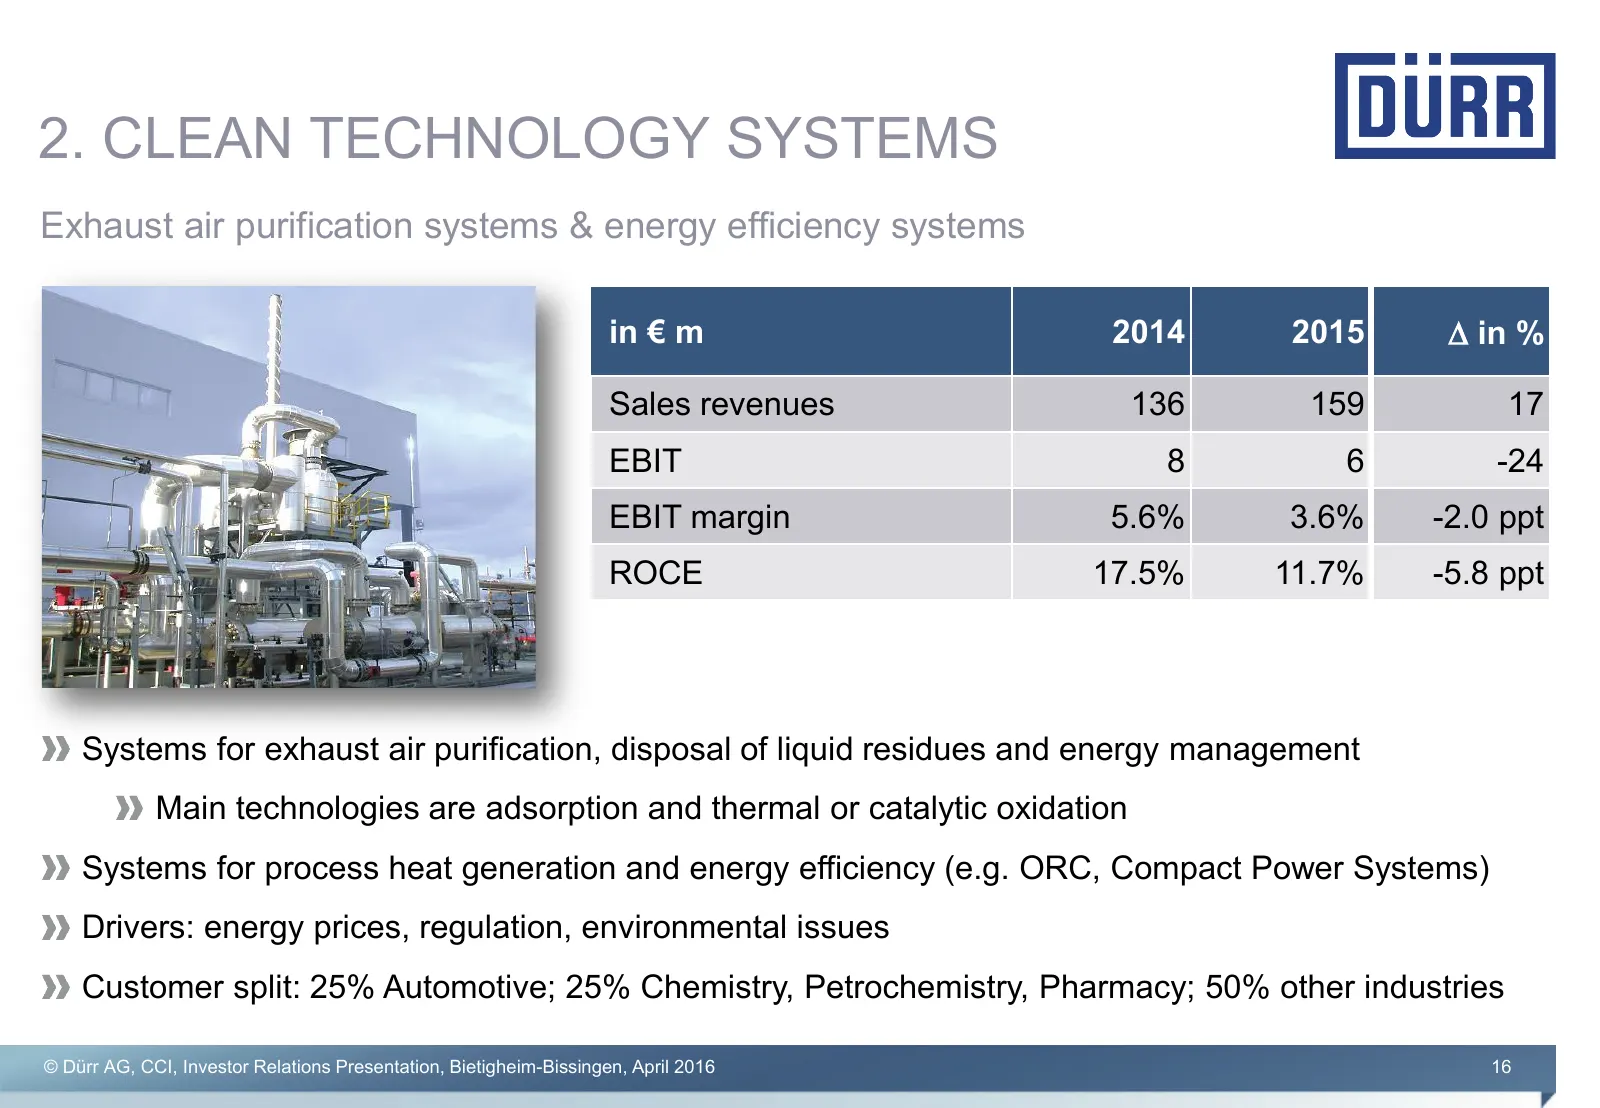
2. CLEAN TECHNOLOGY SYSTEMS Exhaust air purification systems & energy efficiency systems in € m 2014 2015 ∆ in % Sales revenues 136 159 17 EBIT 8 6 -24 EBIT margin 5.6% 3.6% -2.0 ppt ROCE 17.5% 11.7% -5.8 ppt Systems for exhaust air purification, disposal of liquid residues and energy management Mai
Slide 17: Woodworking Machinery and Systems
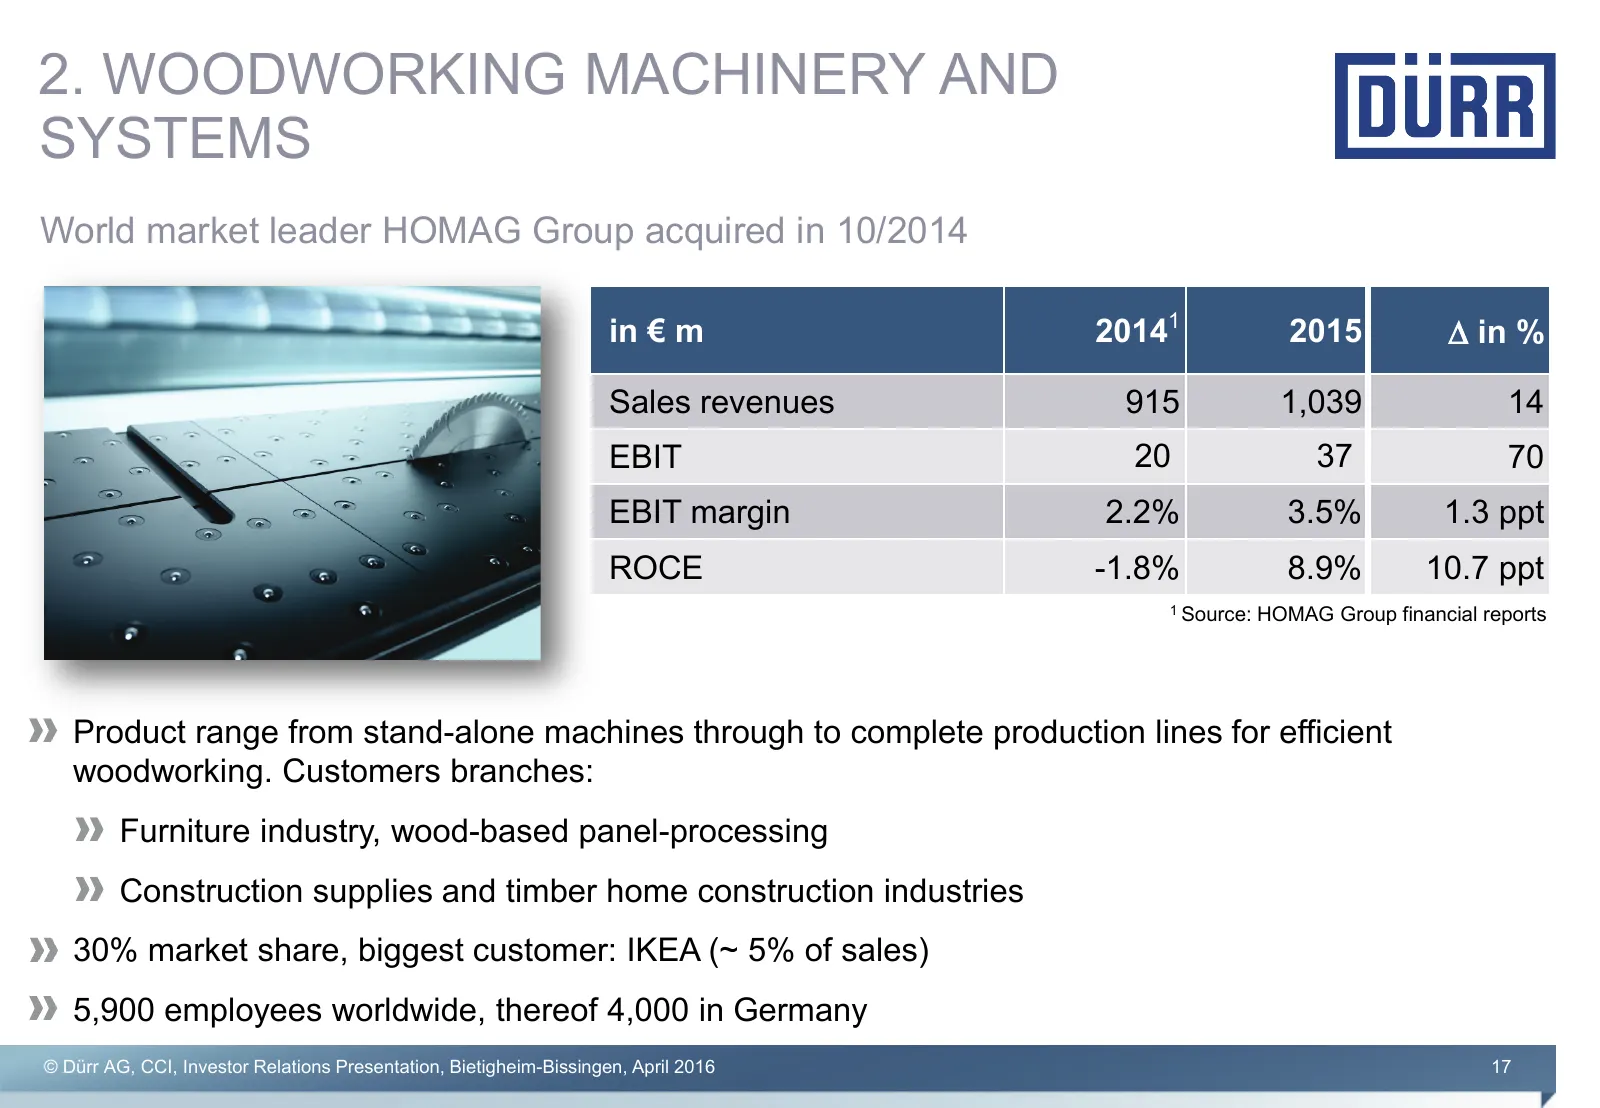
2. WOODWORKING MACHINERY AND SYSTEMS World market leader HOMAG Group acquired in 10/2014 in € m 20141 2015 ∆ in % Sales revenues 915 1,039 14 EBIT 20 37 70 EBIT margin 2.2% 3.5% 1.3 ppt ROCE -1.8% 8.9% 10.7 ppt 1 Source: HOMAG Group financial reports Product range from stand-alone machines through t
Slide 18: Major Achievements HOMAG Group
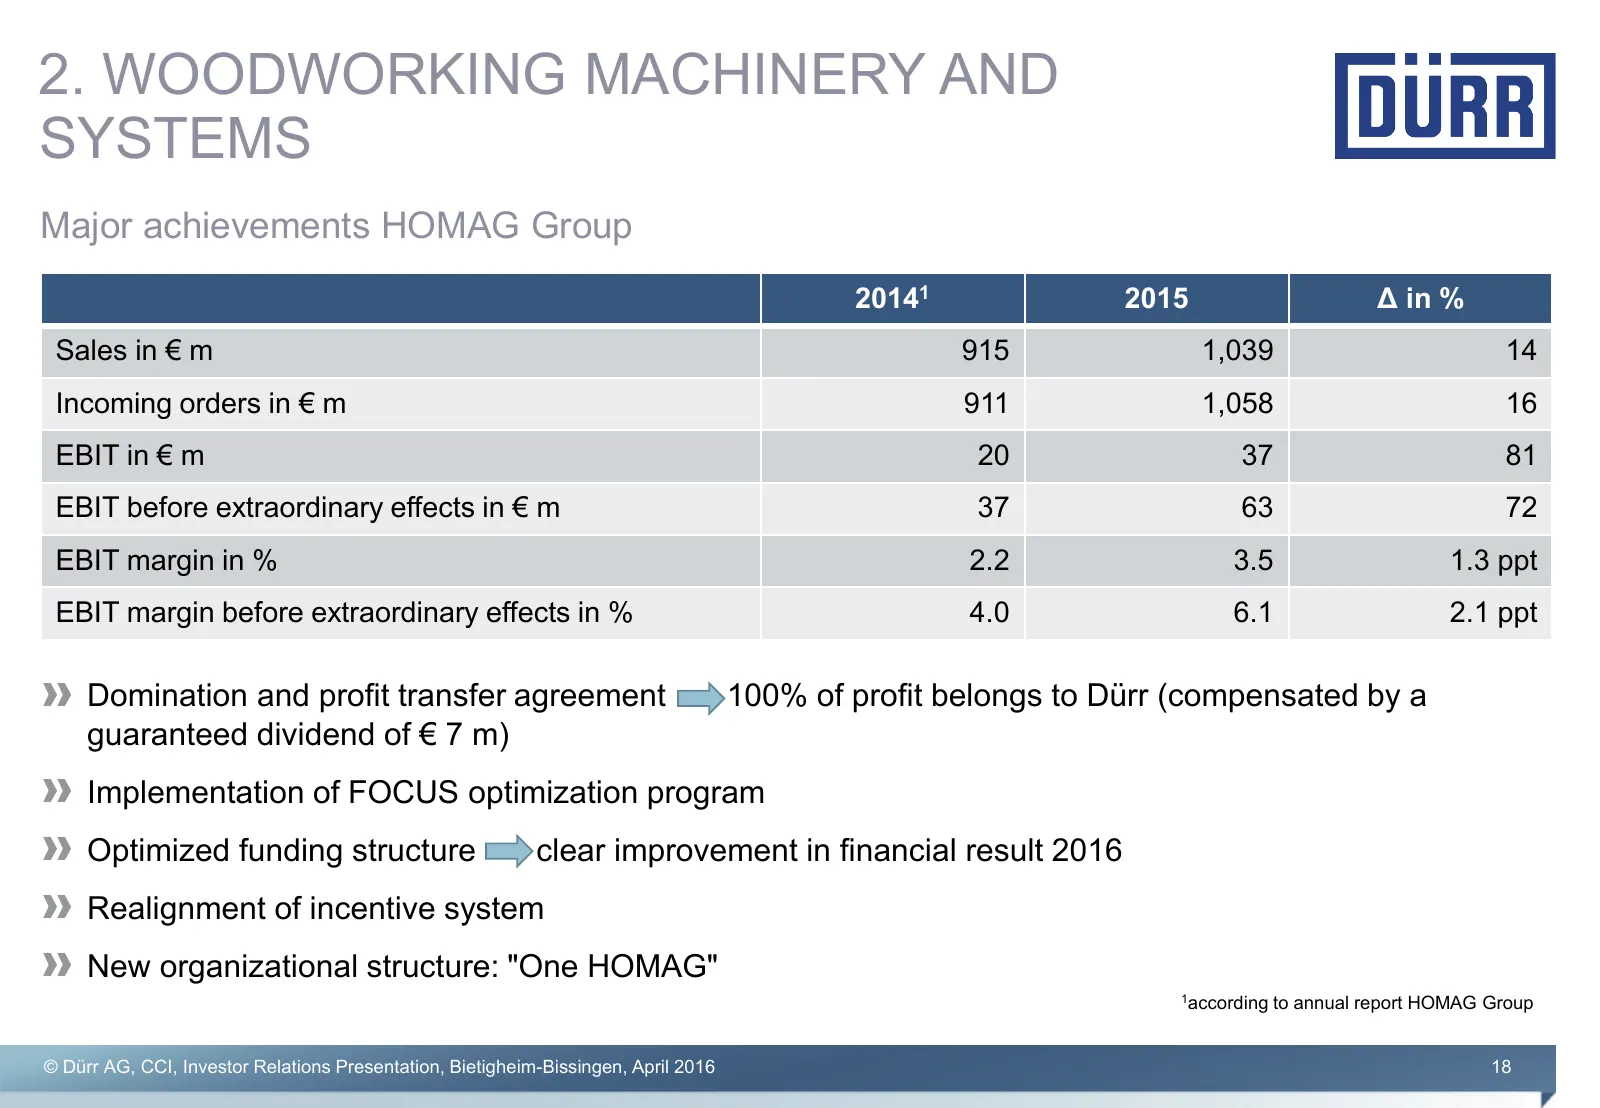
2. WOODWORKING MACHINERY AND SYSTEMS Major achievements HOMAG Group 20141 2015 Δ in % Sales in € m 915 1,039 14 Incoming orders in € m 911 1,058 16 EBIT in € m 20 37 81 EBIT before extraordinary effects in € m 37 63 72 EBIT margin in % 2.2 3.5 1.3 ppt EBIT margin before extraordinary effects in % 4.
Slide 19: Many Regions with Substantial Growth Potential
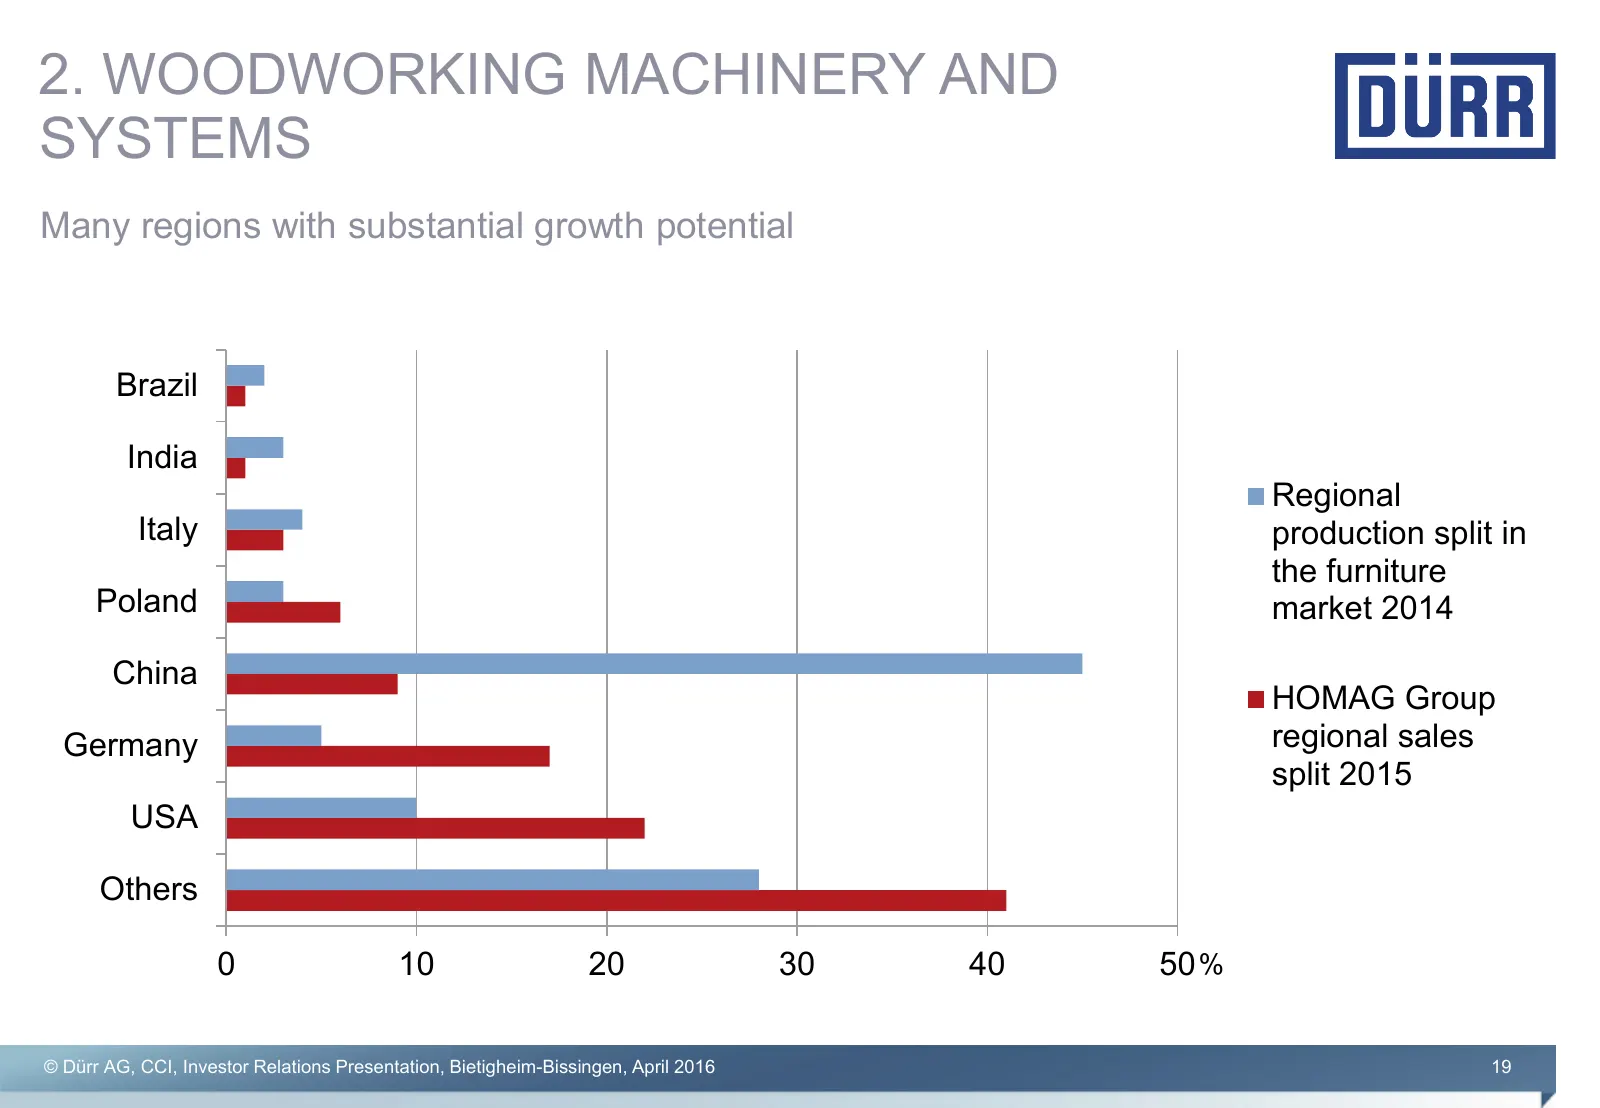
2. WOODWORKING MACHINERY AND SYSTEMS Many regions with substantial growth potential Brazil India Regional Italy production split in the furniture Poland market 2014 China HOMAG Group Germany regional sales split 2015 USA Others 0 10 20 30 40 50 % © Dürr AG, CCI, Investor Relations Presentation, Biet
Slide 20: FOCUS Program Started in June 2015
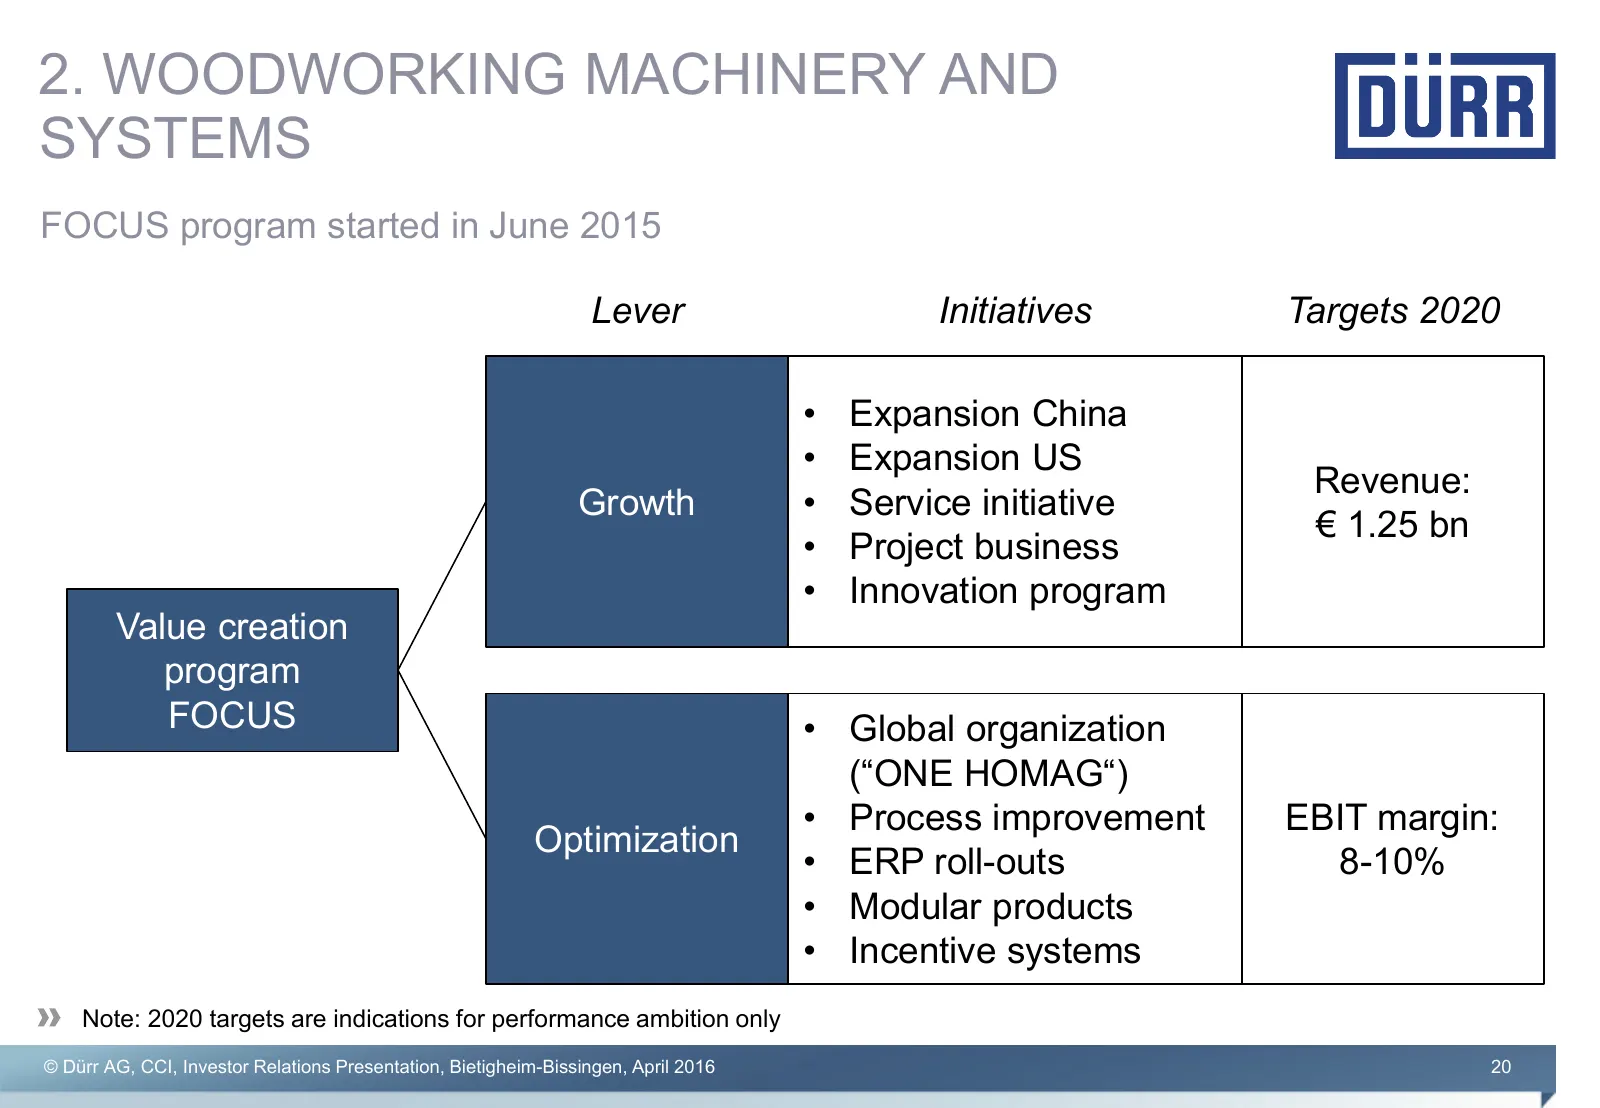
2. WOODWORKING MACHINERY AND SYSTEMS FOCUS program started in June 2015 Lever Initiatives Targets 2020 • Expansion China • Expansion US Revenue: Growth • Service initiative € 1.25 bn • Project business • Innovation program Value creation program FOCUS • Global organization (“ONE HOMAG“) • Process im
Slide 21: Agenda
AGENDA 1. Dürr: A portfolio of global market leaders in engineering 2. Our five divisions 3. Group strategy 4. Group financials, markets and outlook © Dürr AG, CCI, Investor Relations Presentation, Bietigheim-Bissingen, April 2016 21
Slide 22: Dürr Strategy 2020
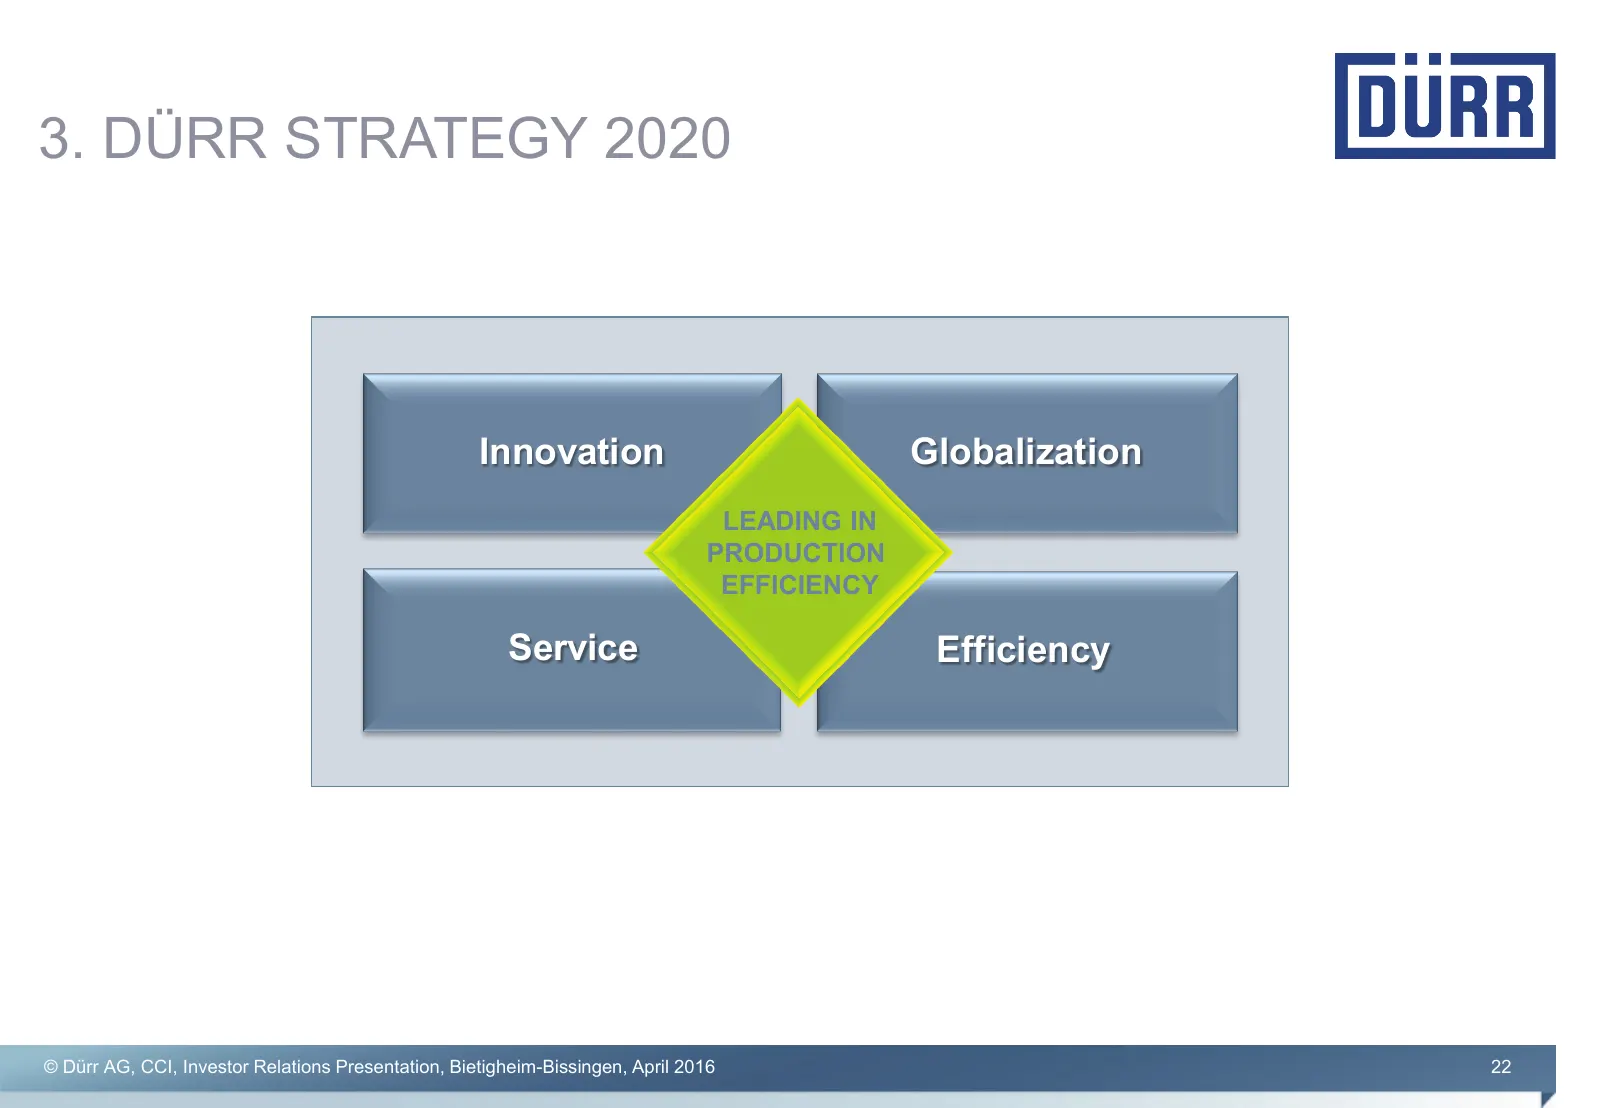
3. DÜRR STRATEGY 2020 Innovation Globalization LEADING IN PRODUCTION EFFICIENCY Service Efficiency © Dürr AG, CCI, Investor Relations Presentation, Bietigheim-Bissingen, April 2016 22
Slide 23: Strategy: Innovation
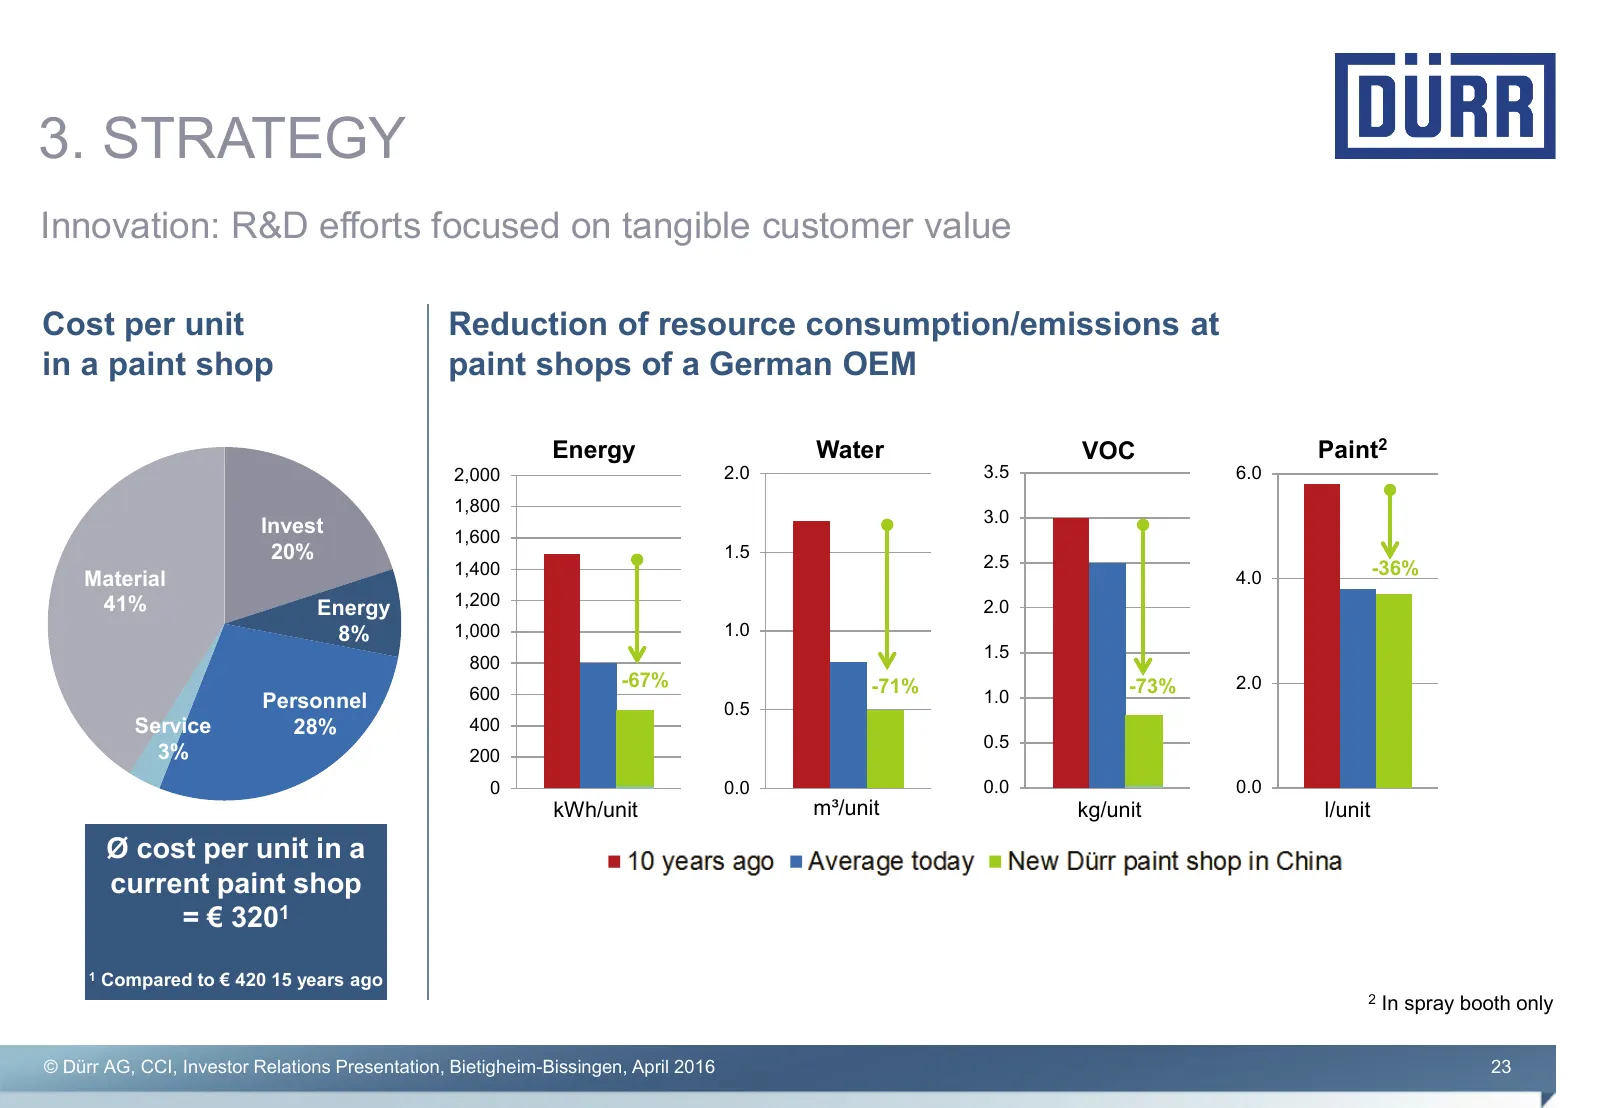
3. STRATEGY Innovation: R&D efforts focused on tangible customer value Cost per unit Reduction of resource consumption/emissions at in a paint shop paint shops of a German OEM Energy Water VOC Paint2 2,000 2.0 3.5 6.0 1,800 3.0 Invest 1,600 20% 1.5 2.5 1,400 -36% Material 4.0 41% 1,200 Energy 2.0 8%
Slide 24: Smart Factory/Industry 4.0: Takeover iTAC
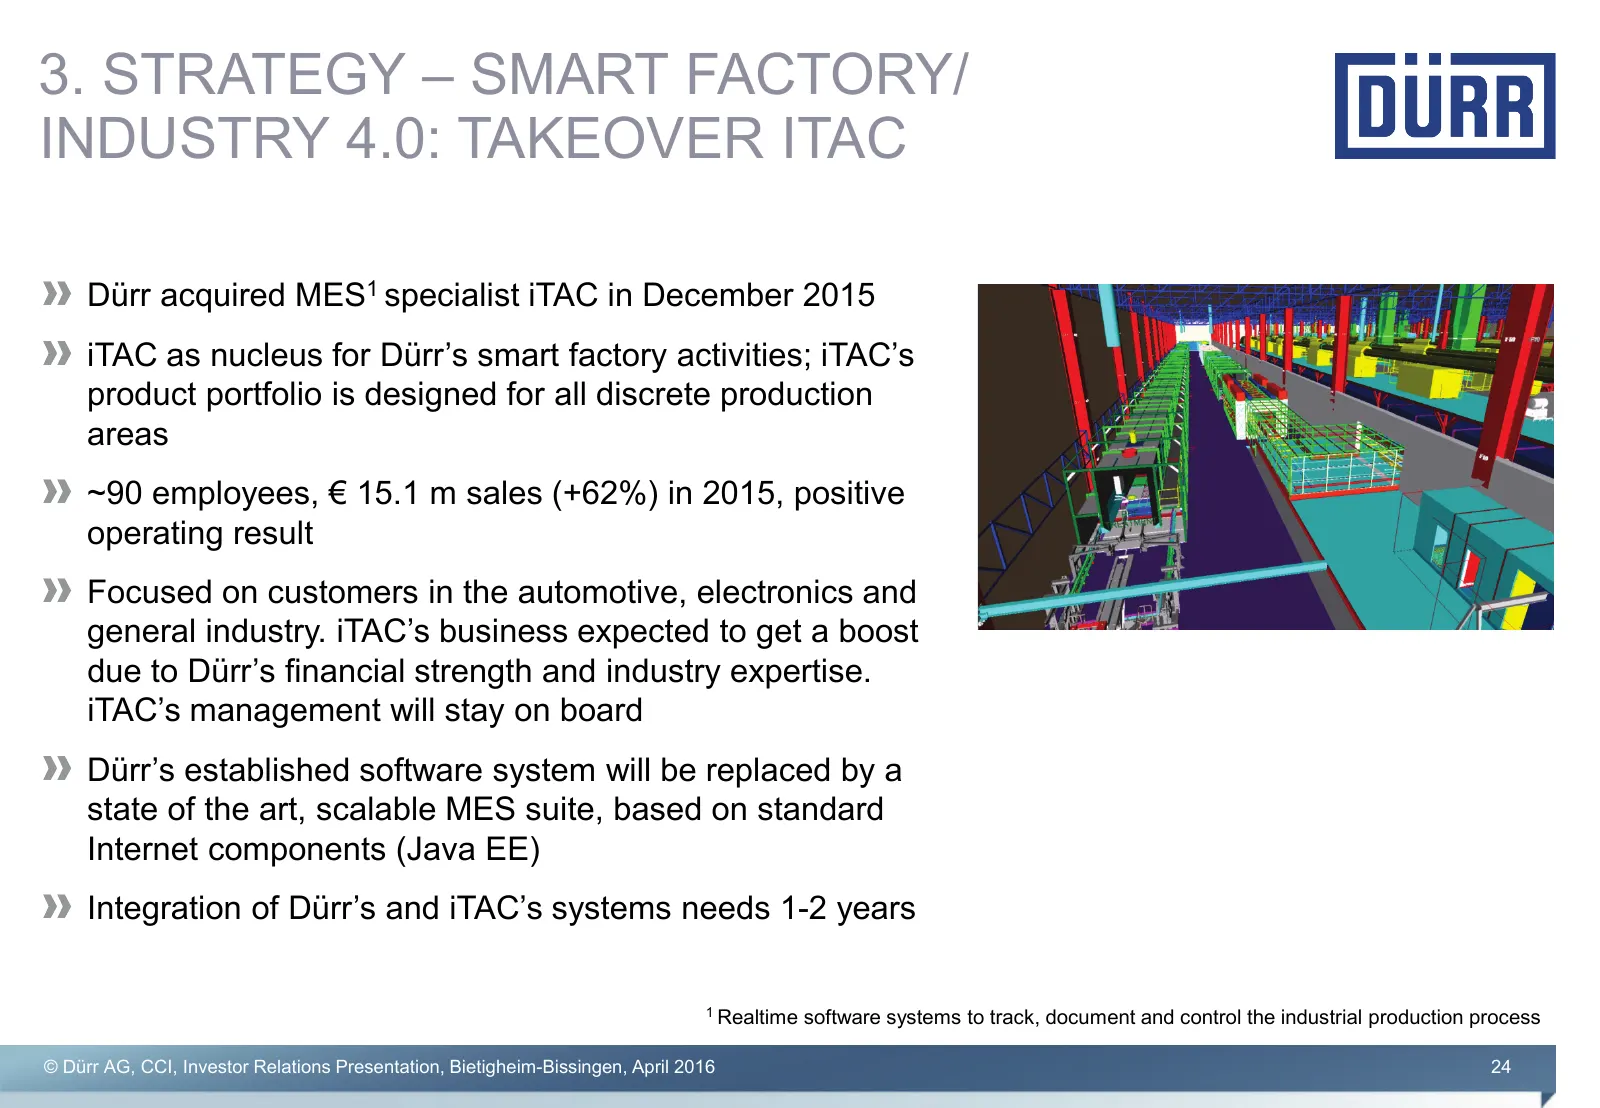
3. STRATEGY – SMART FACTORY/ INDUSTRY 4.0: TAKEOVER ITAC Dürr acquired MES1 specialist iTAC in December 2015 iTAC as nucleus for Dürr’s smart factory activities; iTAC’s product portfolio is designed for all discrete production areas ~90 employees, € 15.1 m sales (+62%) in 2015, positive operating re
Slide 25: Smart Factory/Industry 4.0 at Dürr
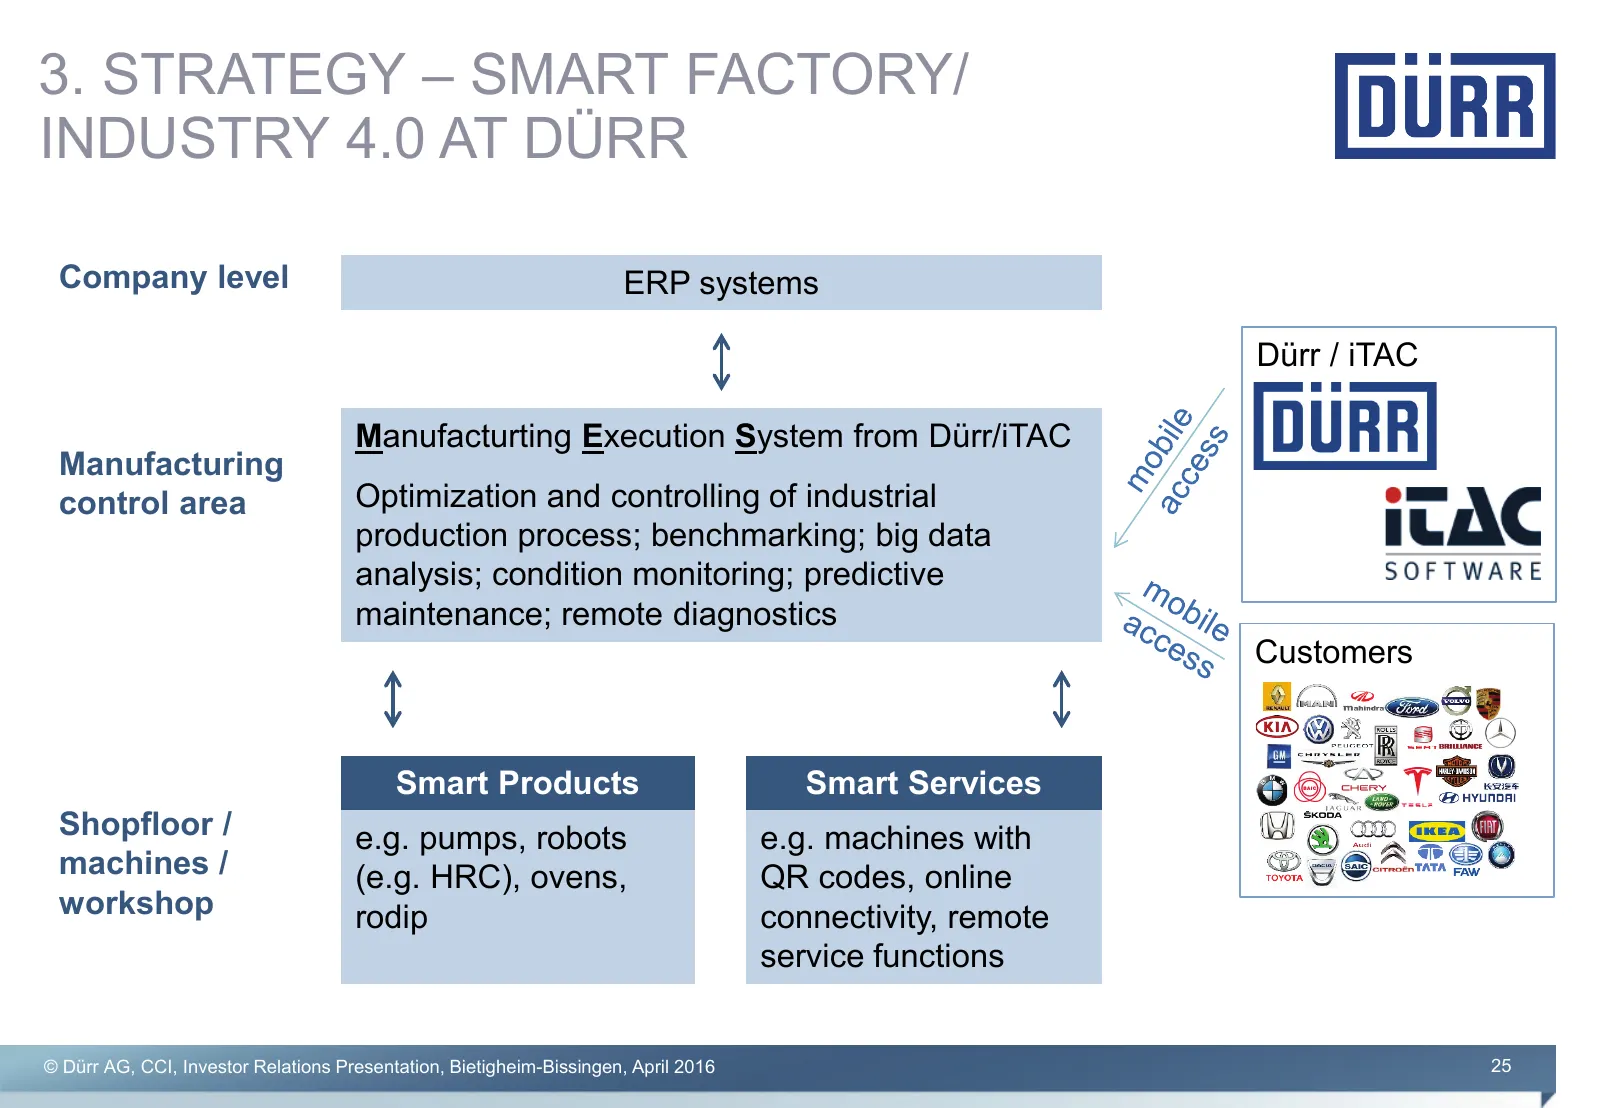
3. STRATEGY – SMART FACTORY/ INDUSTRY 4.0 AT DÜRR Company level ERP systems Dürr / iTAC Manufacturting Execution System from Dürr/iTAC Manufacturing control area Optimization and controlling of industrial production process; benchmarking; big data analysis; condition monitoring; predictive maintenan
Slide 26: Smart Factory/Industry 4.0 at Dürr: Smart Processes
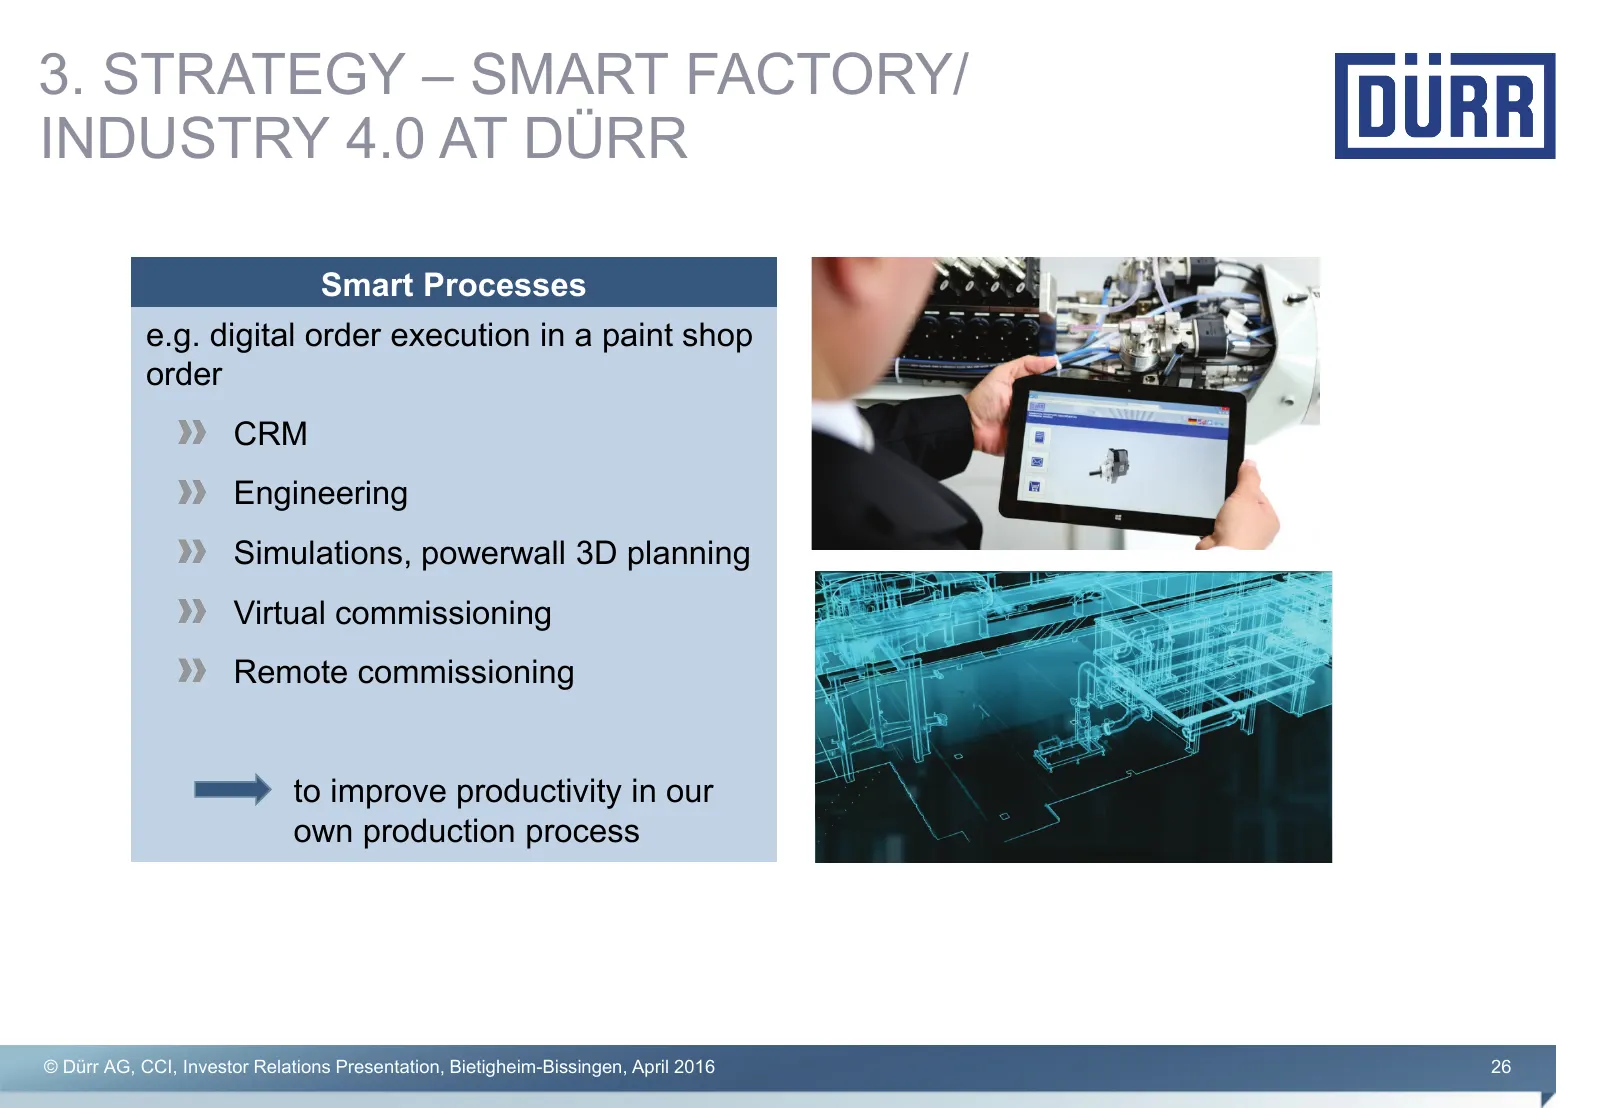
3. STRATEGY – SMART FACTORY/ INDUSTRY 4.0 AT DÜRR Smart Processes e.g. digital order execution in a paint shop order CRM Engineering Simulations, powerwall 3D planning Virtual commissioning Remote commissioning to improve productivity in our own production process © Dürr AG, CCI, Investor Relations
Slide 27: Strategy: Globalization
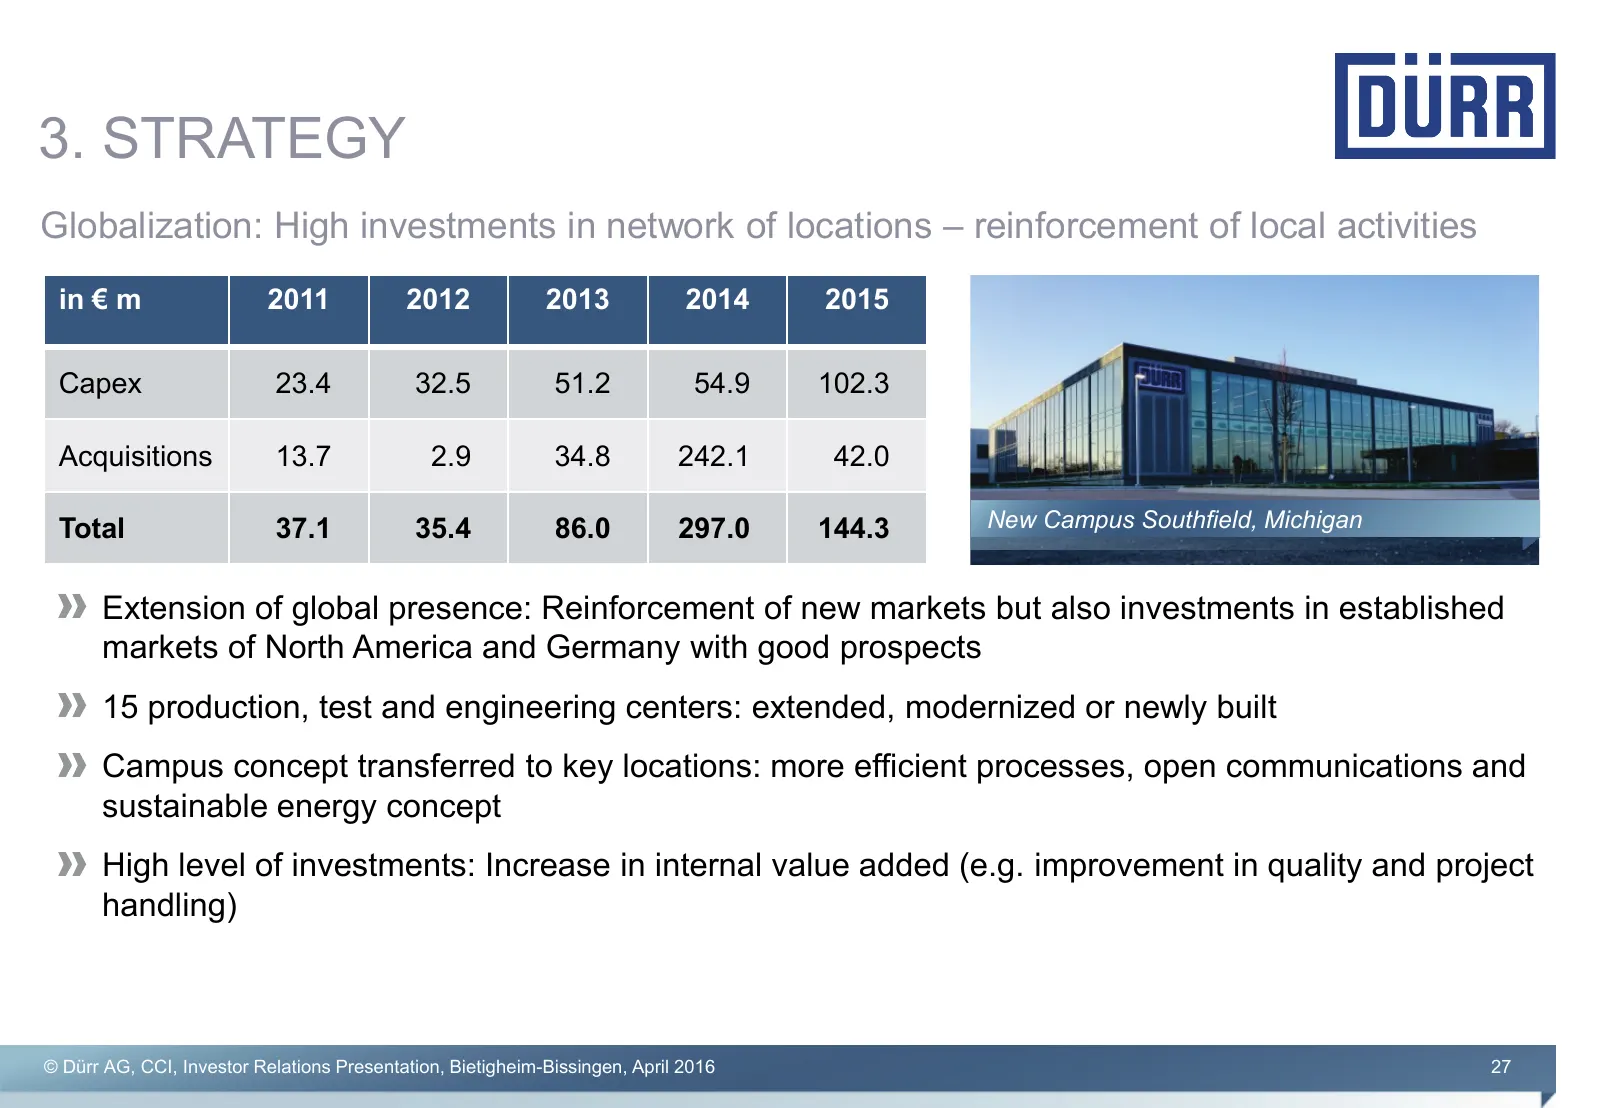
3. STRATEGY Globalization: High investments in network of locations – reinforcement of local activities in € m 2011 2012 2013 2014 2015 Capex 23.4 32.5 51.2 54.9 102.3 Acquisitions 13.7 2.9 34.8 242.1 42.0 Total 37.1 35.4 86.0 297.0 144.3 New Campus Southfield, Michigan Extension of global presence:
Slide 28: Strategy: Service
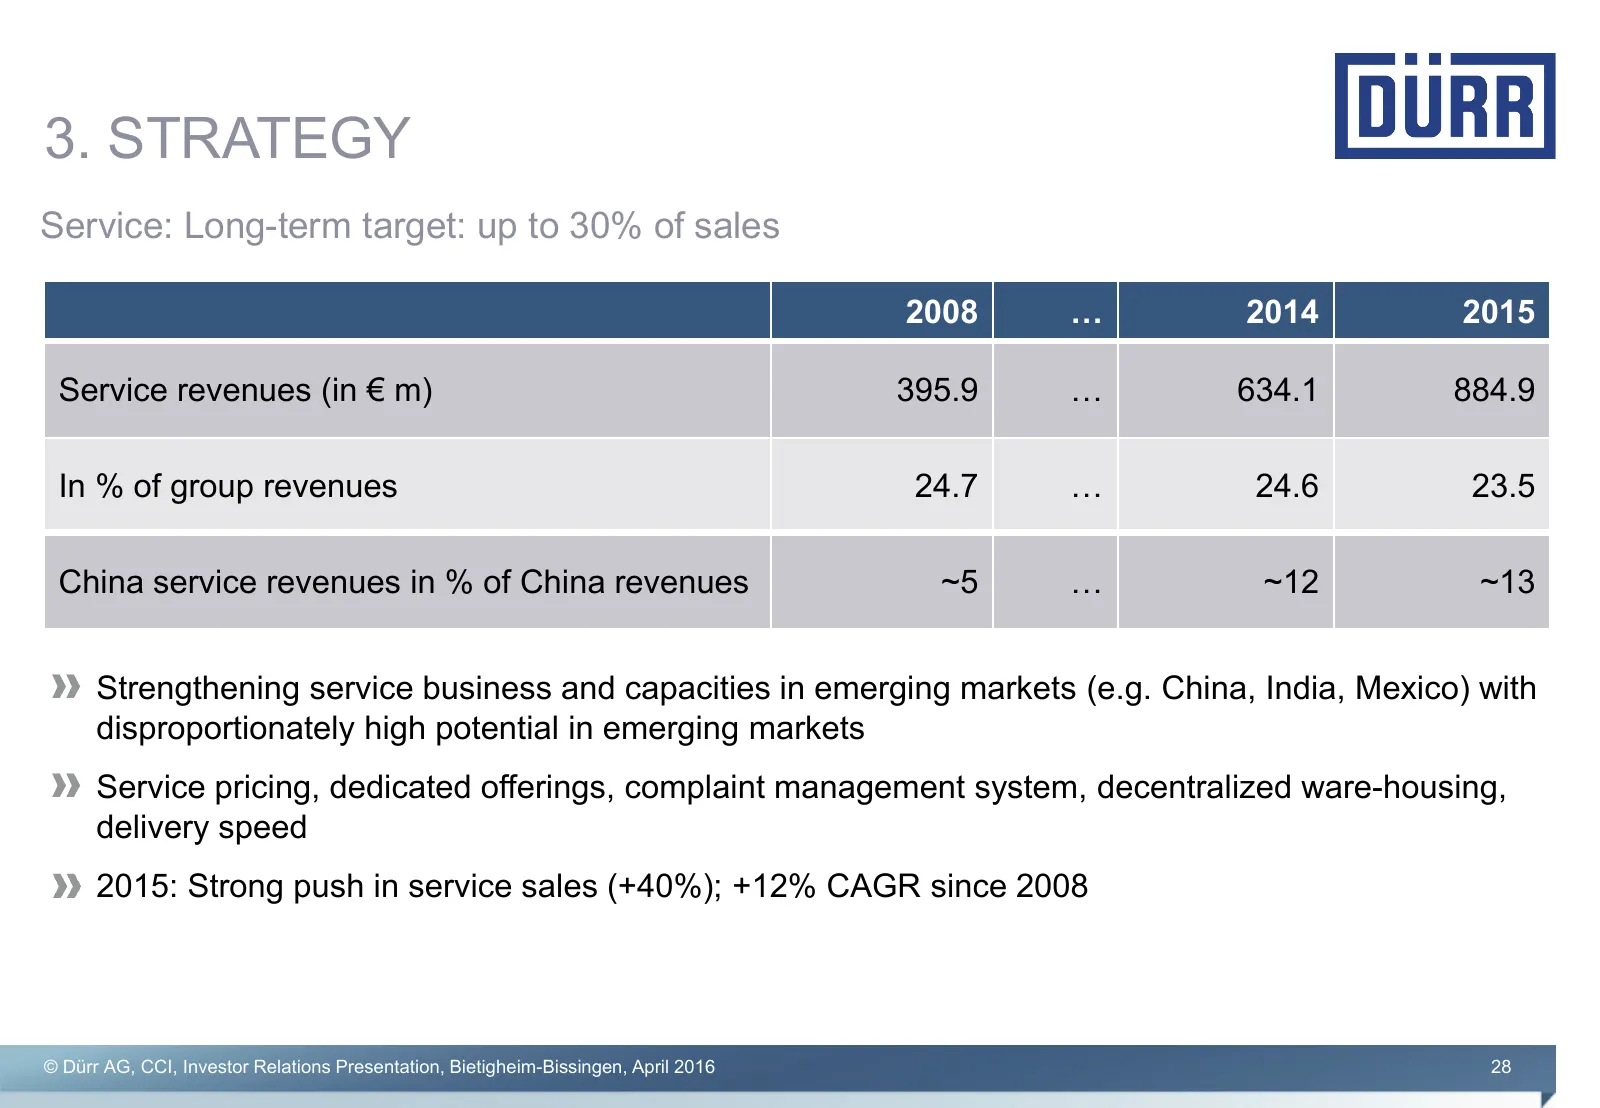
3. STRATEGY Service: Long-term target: up to 30% of sales 2008 … 2014 2015 Service revenues (in € m) 395.9 … 634.1 884.9 In % of group revenues 24.7 … 24.6 23.5 China service revenues in % of China revenues ~5 … ~12 ~13 Strengthening service business and capacities in emerging markets (e.g. China, I
Slide 29: Service: Growing Installed Base as Catalyst
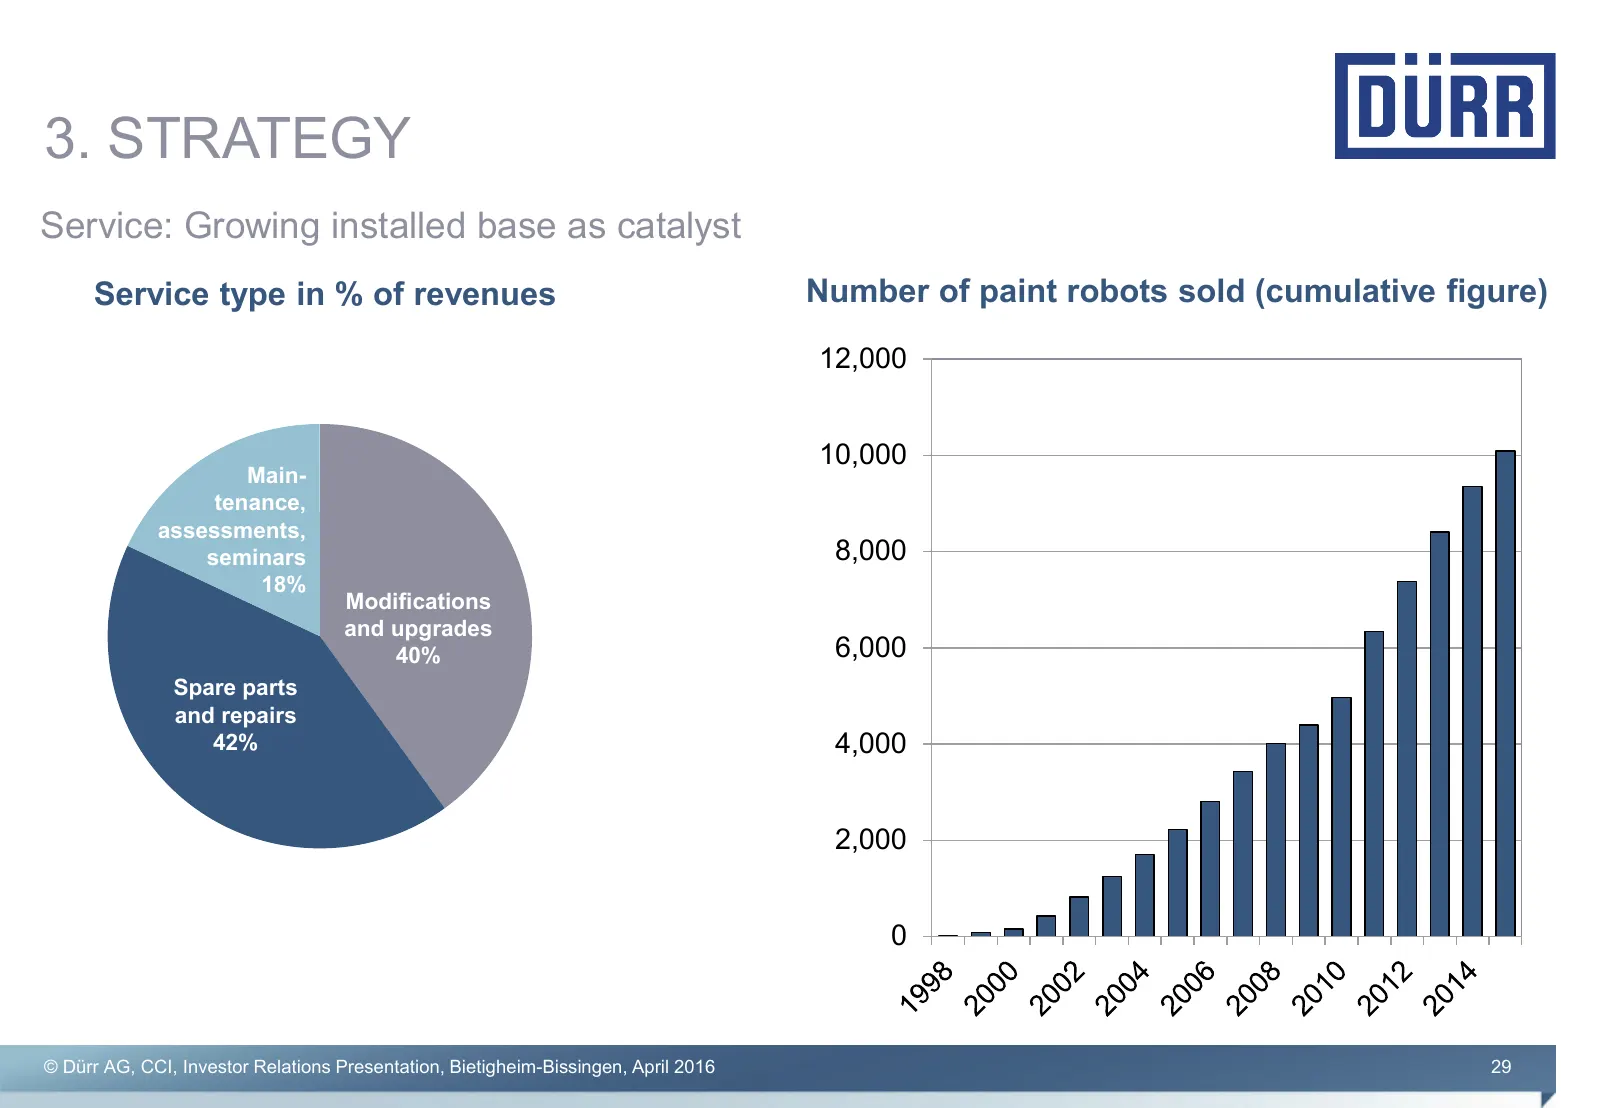
3. STRATEGY Service: Growing installed base as catalyst Service type in % of revenues Number of paint robots sold (cumulative figure) 12,000 10,000 Main- tenance, assessments, seminars 8,000 18% Modifications and upgrades 40% 6,000 Spare parts and repairs 42% 4,000 2,000 0 © Dürr AG, CCI, Investor R
Slide 30: Efficiency: Global Processes as Basis for Profitability
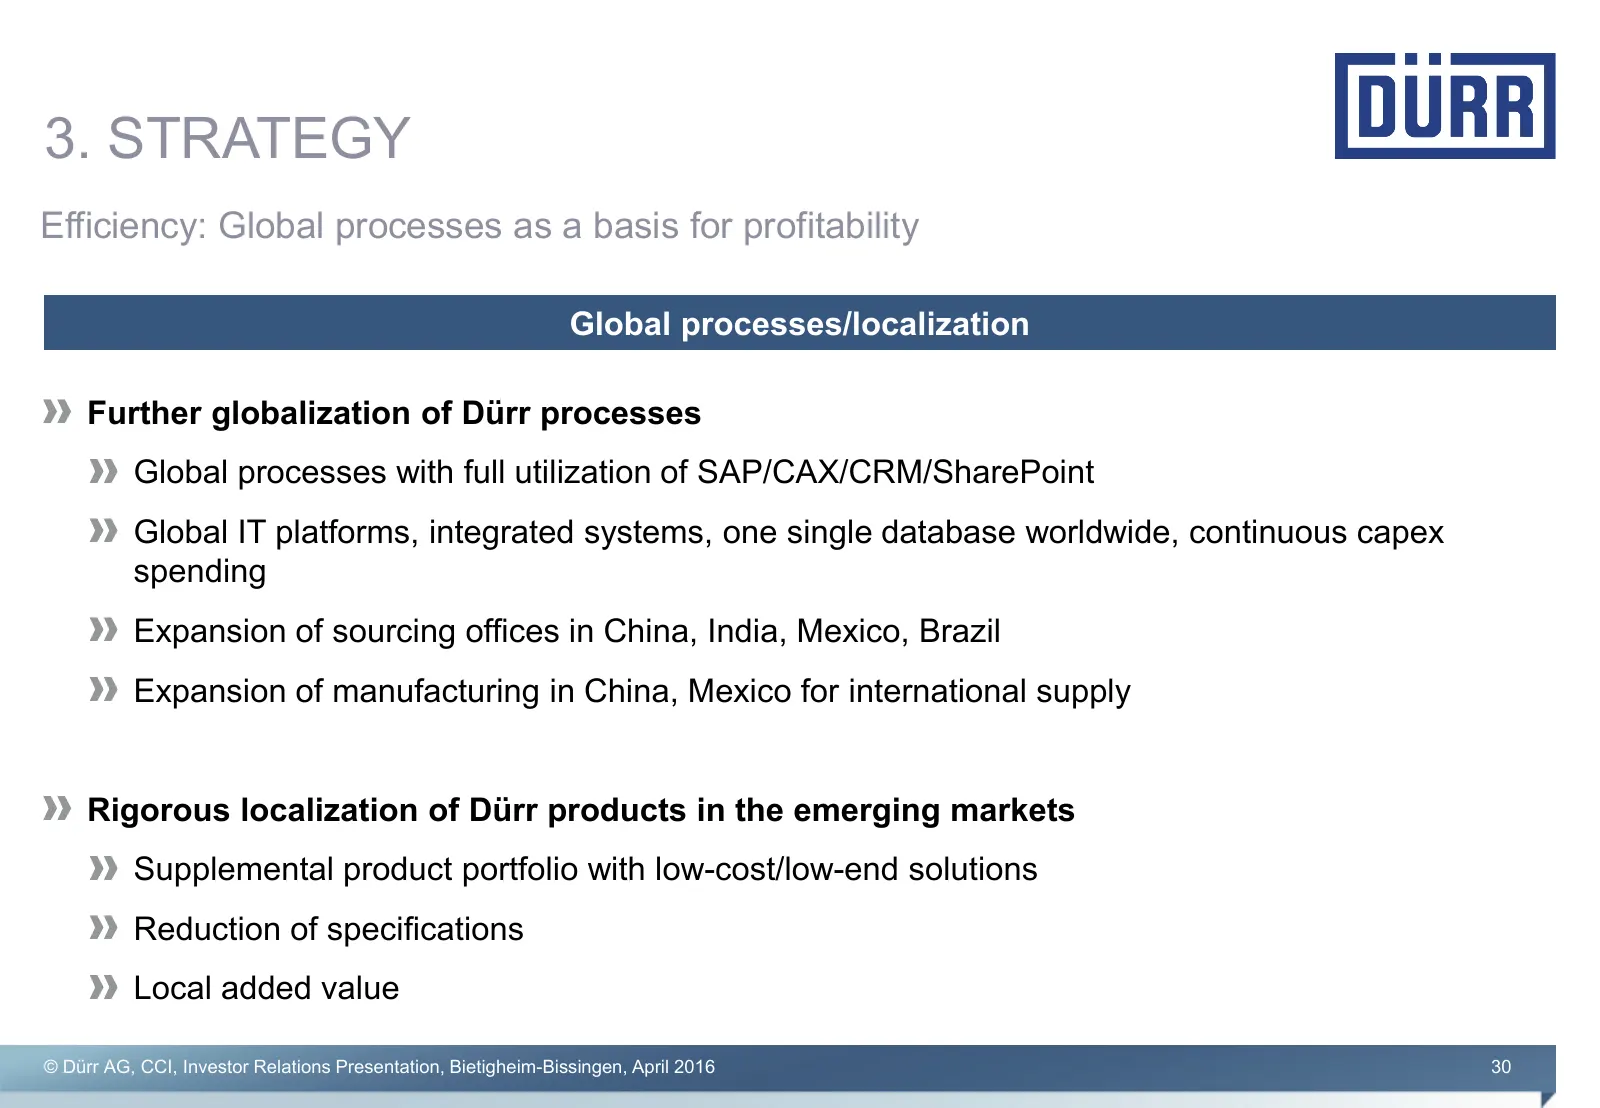
3. STRATEGY Efficiency: Global processes as a basis for profitability Global processes/localization Further globalization of Dürr processes Global processes with full utilization of SAP/CAX/CRM/SharePoint Global IT platforms, integrated systems, one single database worldwide, continuous capex spendi
Slide 31: Agenda
AGENDA 1. Dürr: A portfolio of global market leaders in engineering 2. Our five divisions 3. Group strategy 4. Group financials, markets and outlook © Dürr AG, CCI, Investor Relations Presentation, Bietigheim-Bissingen, April 2016 31
Slide 32: Earnings on the Rise
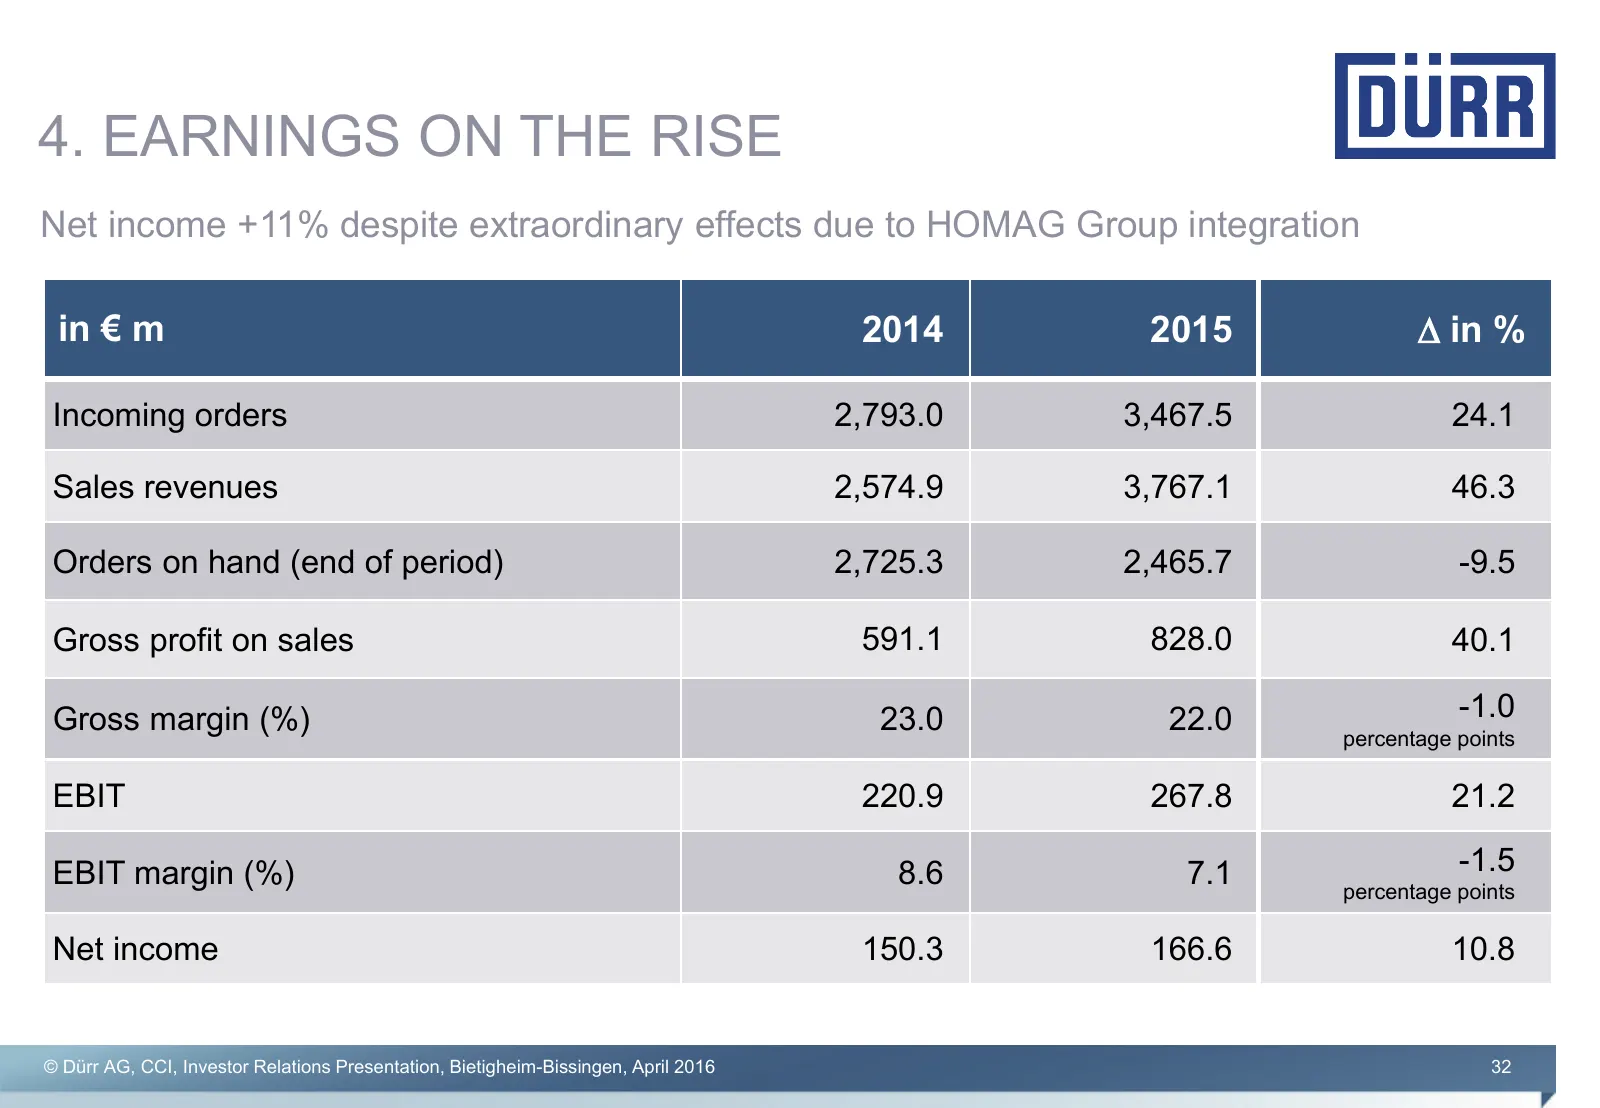
4. EARNINGS ON THE RISE Net income +11% despite extraordinary effects due to HOMAG Group integration in € m 2014 2015 ∆ in % Incoming orders 2,793.0 3,467.5 24.1 Sales revenues 2,574.9 3,767.1 46.3 Orders on hand (end of period) 2,725.3 2,465.7 -9.5 Gross profit on sales 591.1 828.0 40.1 Gross margi
Slide 33: Strong Cash Generating Ability
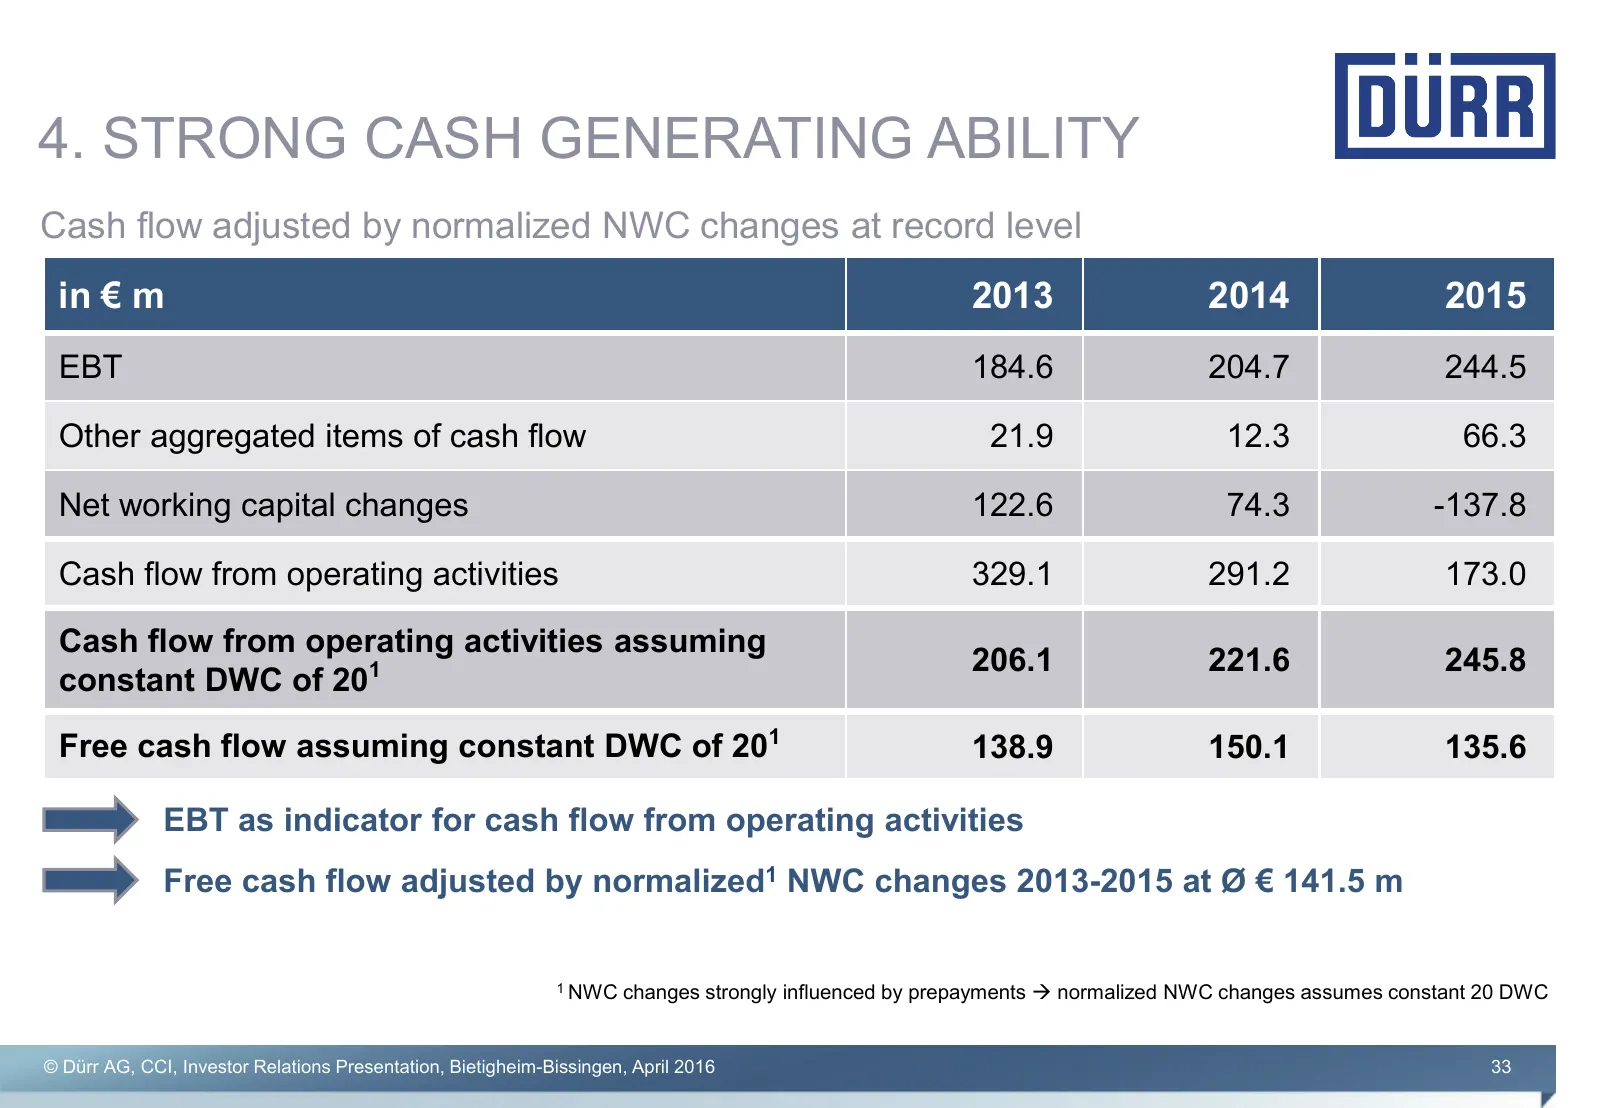
4. STRONG CASH GENERATING ABILITY Cash flow adjusted by normalized NWC changes at record level in € m 2013 2014 2015 EBT 184.6 204.7 244.5 Other aggregated items of cash flow 21.9 12.3 66.3 Net working capital changes 122.6 74.3 -137.8 Cash flow from operating activities 329.1 291.2 173.0 Cash flow
Slide 34: Solid Financial Ratios
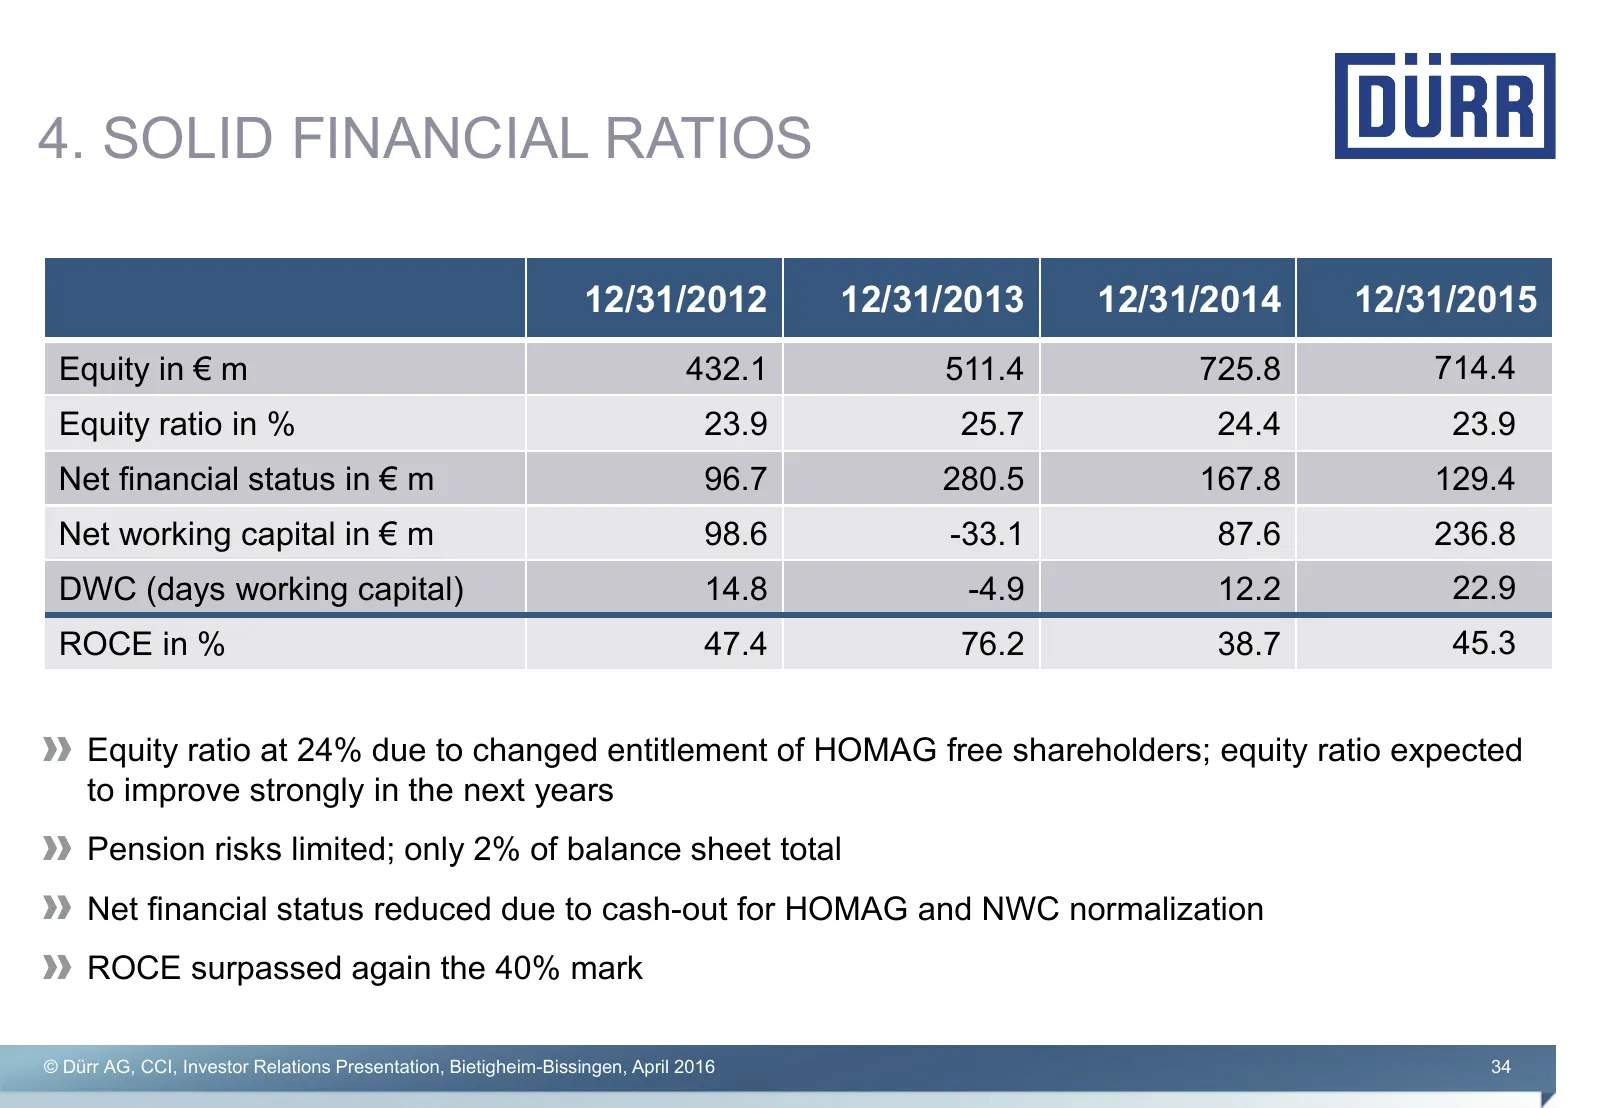
4. SOLID FINANCIAL RATIOS 12/31/2012 12/31/2013 12/31/2014 12/31/2015 Equity in € m 432.1 511.4 725.8 714.4 Equity ratio in % 23.9 25.7 24.4 23.9 Net financial status in € m 96.7 280.5 167.8 129.4 Net working capital in € m 98.6 -33.1 87.6 236.8 DWC (days working capital) 14.8 -4.9 12.2 22.9 ROCE in
Slide 35: Developed vs. Emerging Car Markets
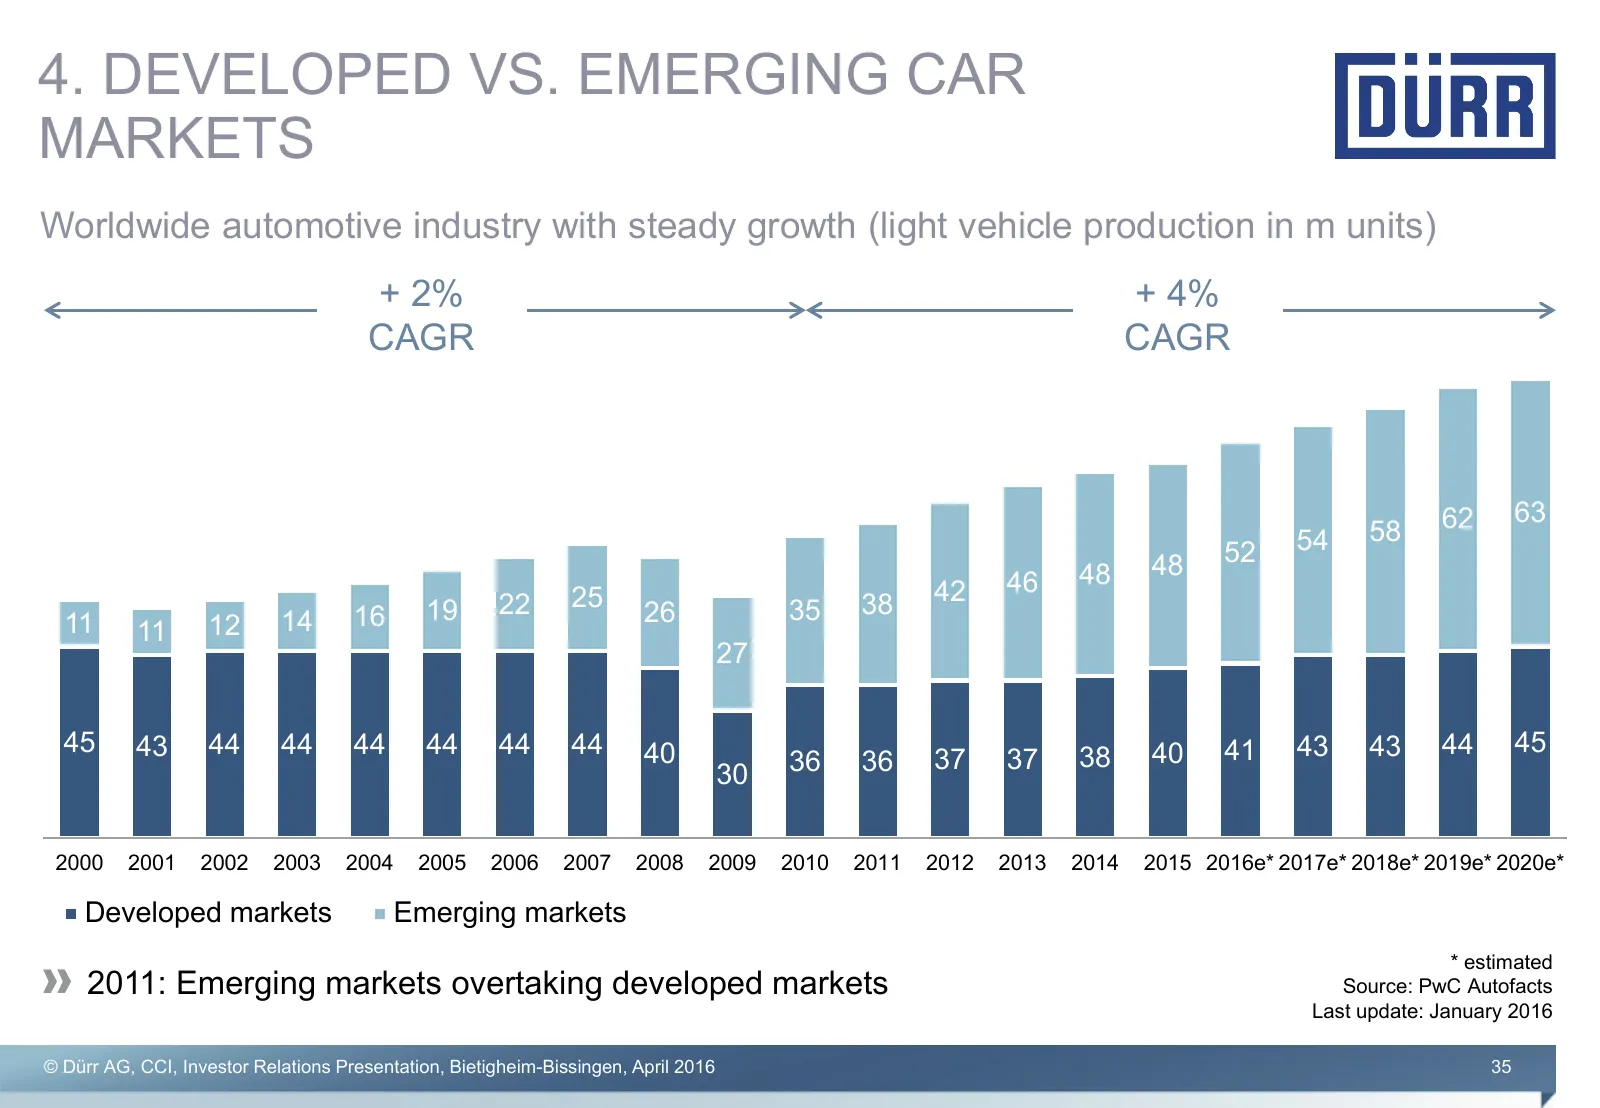
4. DEVELOPED VS. EMERGING CAR MARKETS Worldwide automotive industry with steady growth (light vehicle production in m units) + 2% + 4% CAGR CAGR 62 63 54 58 48 52 46 48 22 25 38 42 11 14 16 19 26 35 11 12 27 45 43 44 44 44 44 44 44 40 40 41 43 43 44 45 36 36 37 37 38 30 2000 2001 2002 2003 2004 2005
Slide 36: Further Growth in Car Market
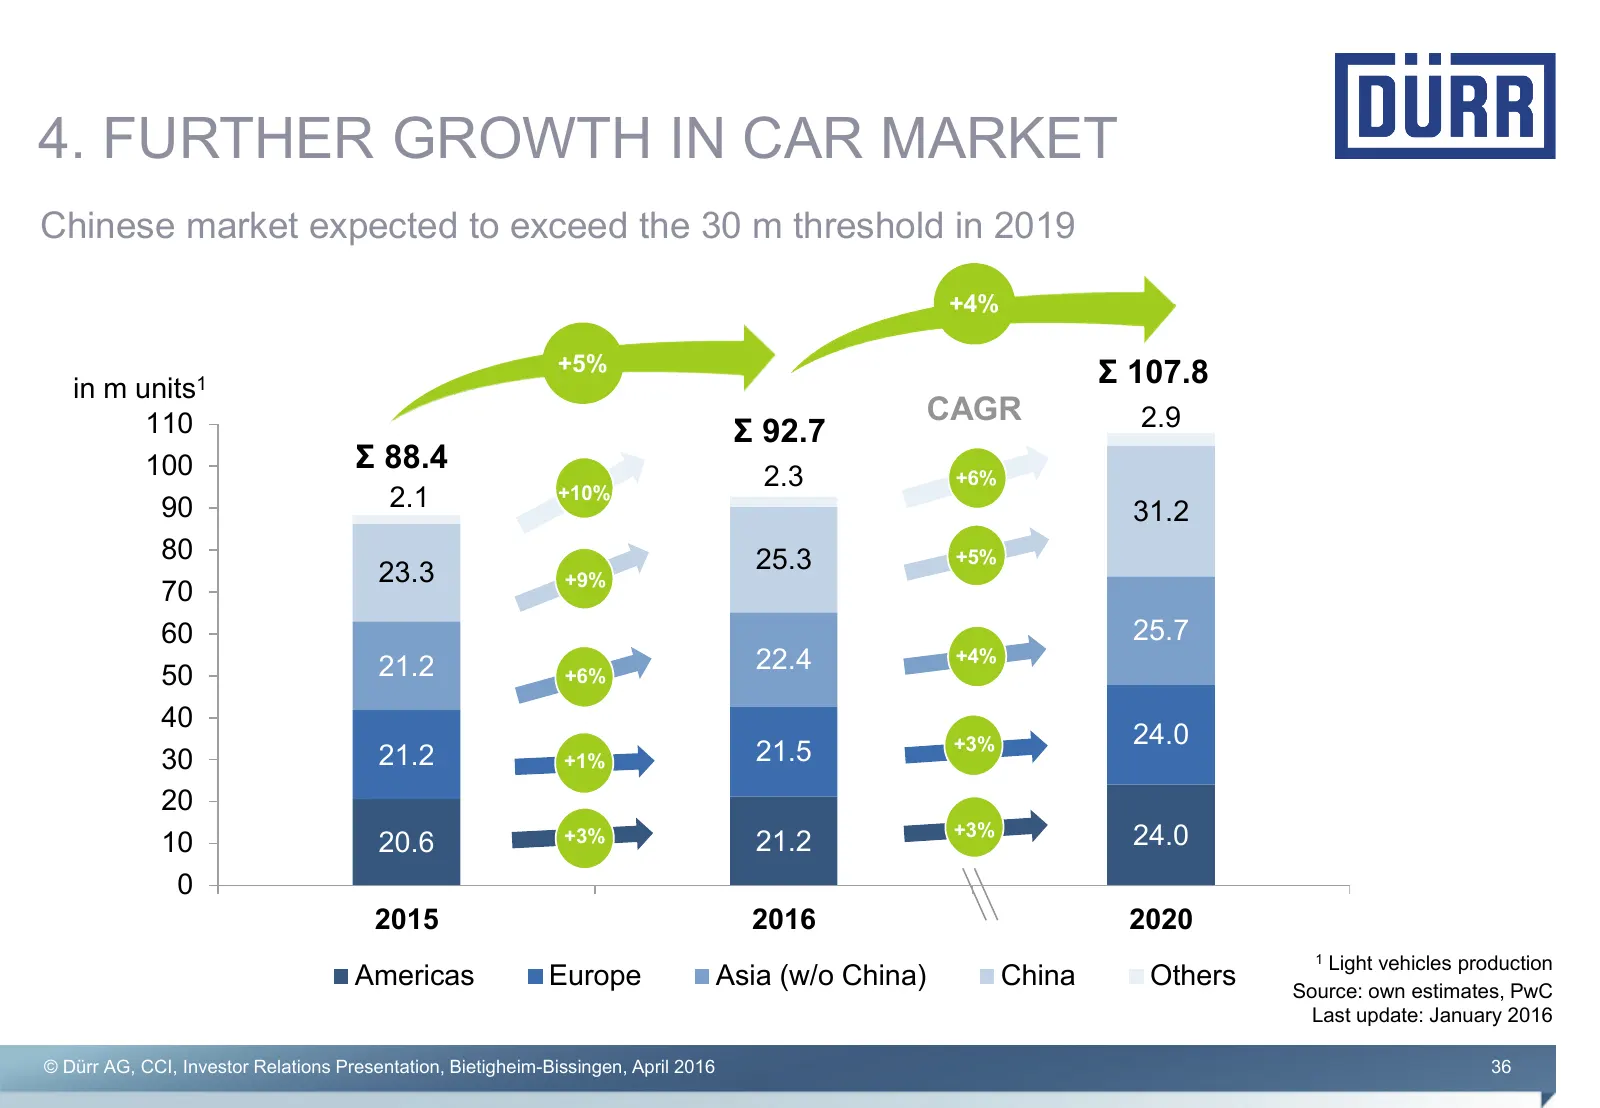
4. FURTHER GROWTH IN CAR MARKET Chinese market expected to exceed the 30 m threshold in 2019 +4% +5% Ʃ 107.8 in m units1 110 CAGR 2.9 Ʃ 92.7 100 Ʃ 88.4 2.3 +6% 90 2.1 +10% 31.2 80 25.3 +5% 23.3 +9% 70 60 25.7 21.2 22.4 +4% 50 +6% 40 +3% 24.0 30 21.2 +1% 21.5 20 +3% +3% 24.0 10 20.6 21.2 0 2015 2016
Slide 37: Global Furniture Market
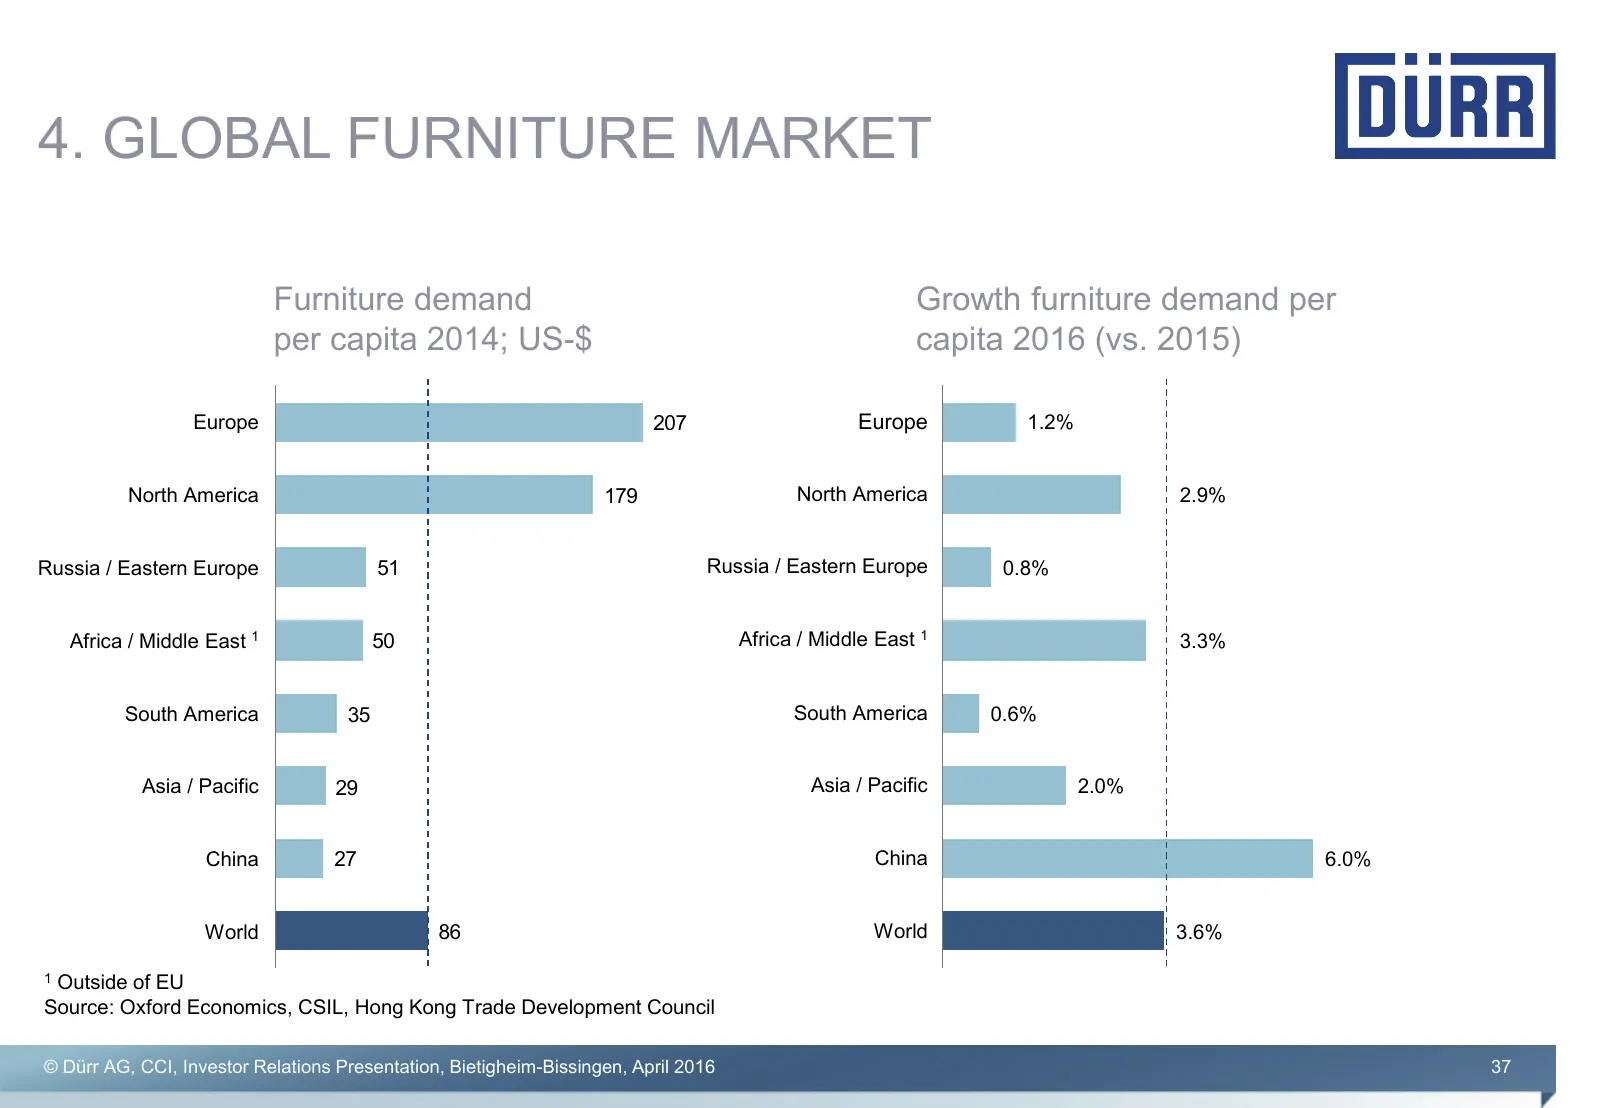
4. GLOBAL FURNITURE MARKET Furniture demand Growth furniture demand per per capita 2014; US-$ capita 2016 (vs. 2015) Europe 207 Europe 1.2% North America 179 North America 2.9% Russia / Eastern Europe 51 Russia / Eastern Europe 0.8% Africa / Middle East 1 50 Africa / Middle East 1 3.3% South America
Slide 38: Outlook Dürr Group 2016
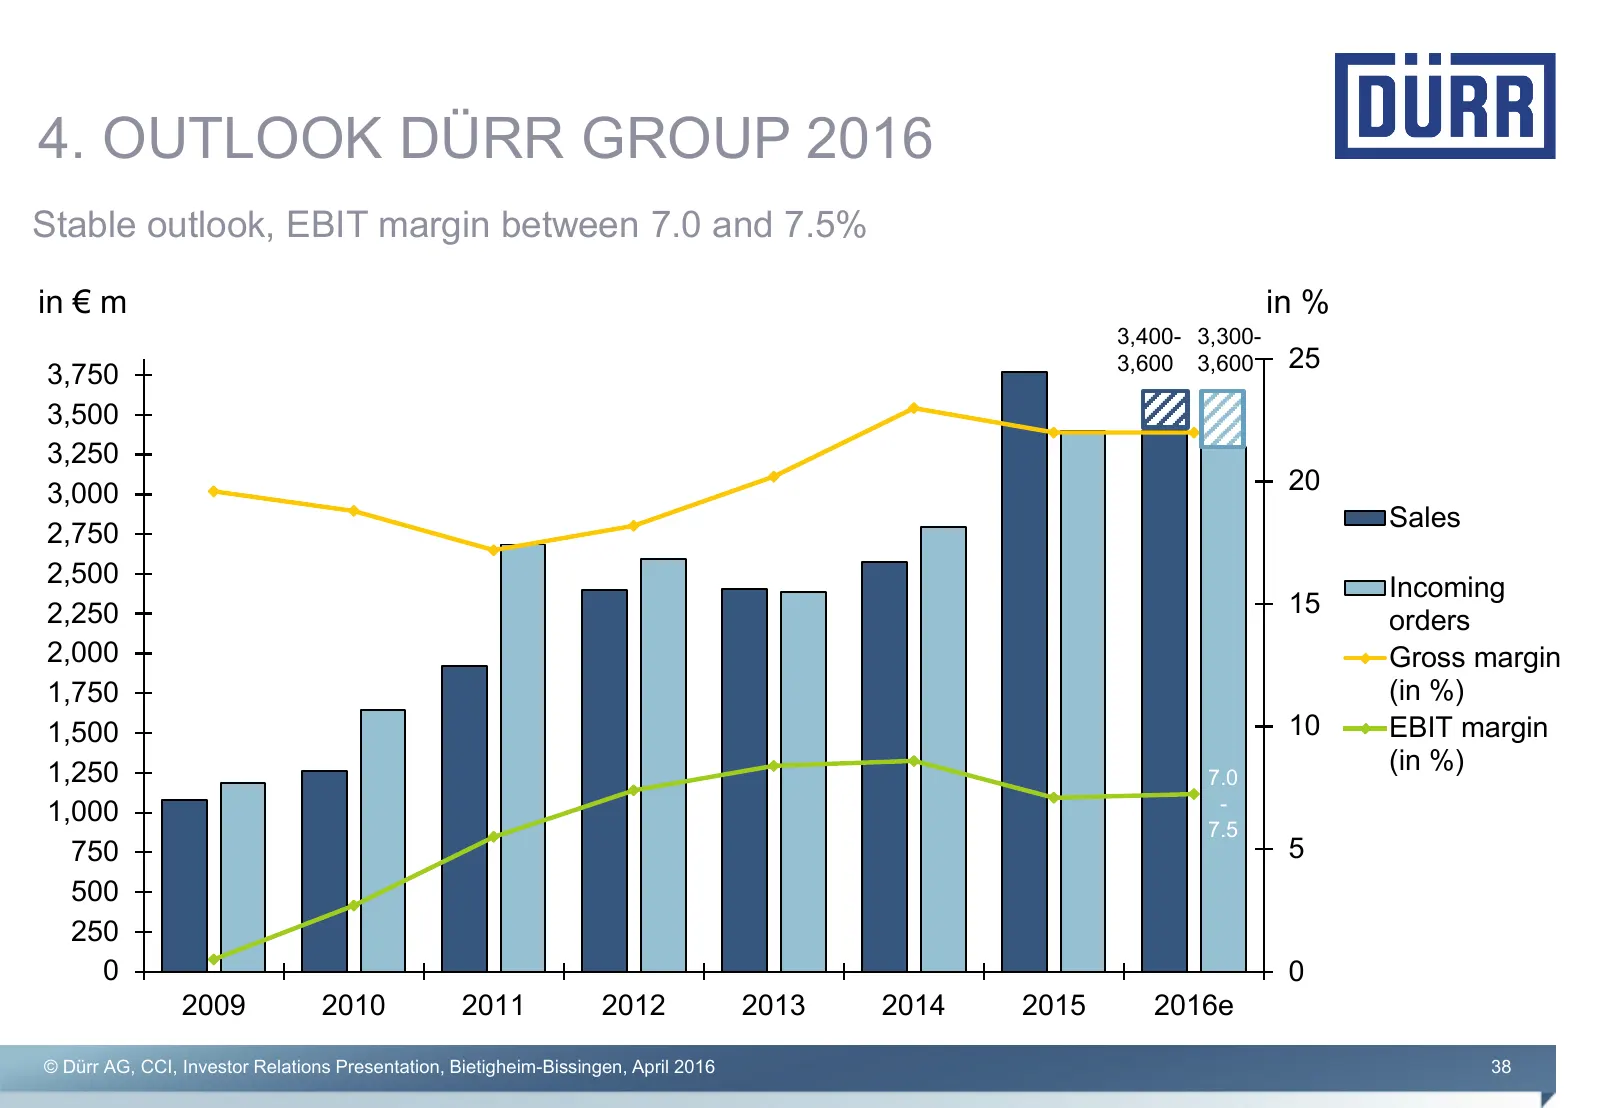
4. OUTLOOK DÜRR GROUP 2016 Stable outlook, EBIT margin between 7.0 and 7.5% in € m in % 3,400- 3,300- 3,600 3,600 25 3,750 3,500 3,250 3,000 20 Sales 2,750 2,500 Incoming 2,250 15 orders 2,000 Gross margin 1,750 (in %) 1,500 10 EBIT margin 1,250 (in %) 7.0 1,000 - 7.5 750 5 500 250 0 0 2009 2010 201
Slide 39: Summary
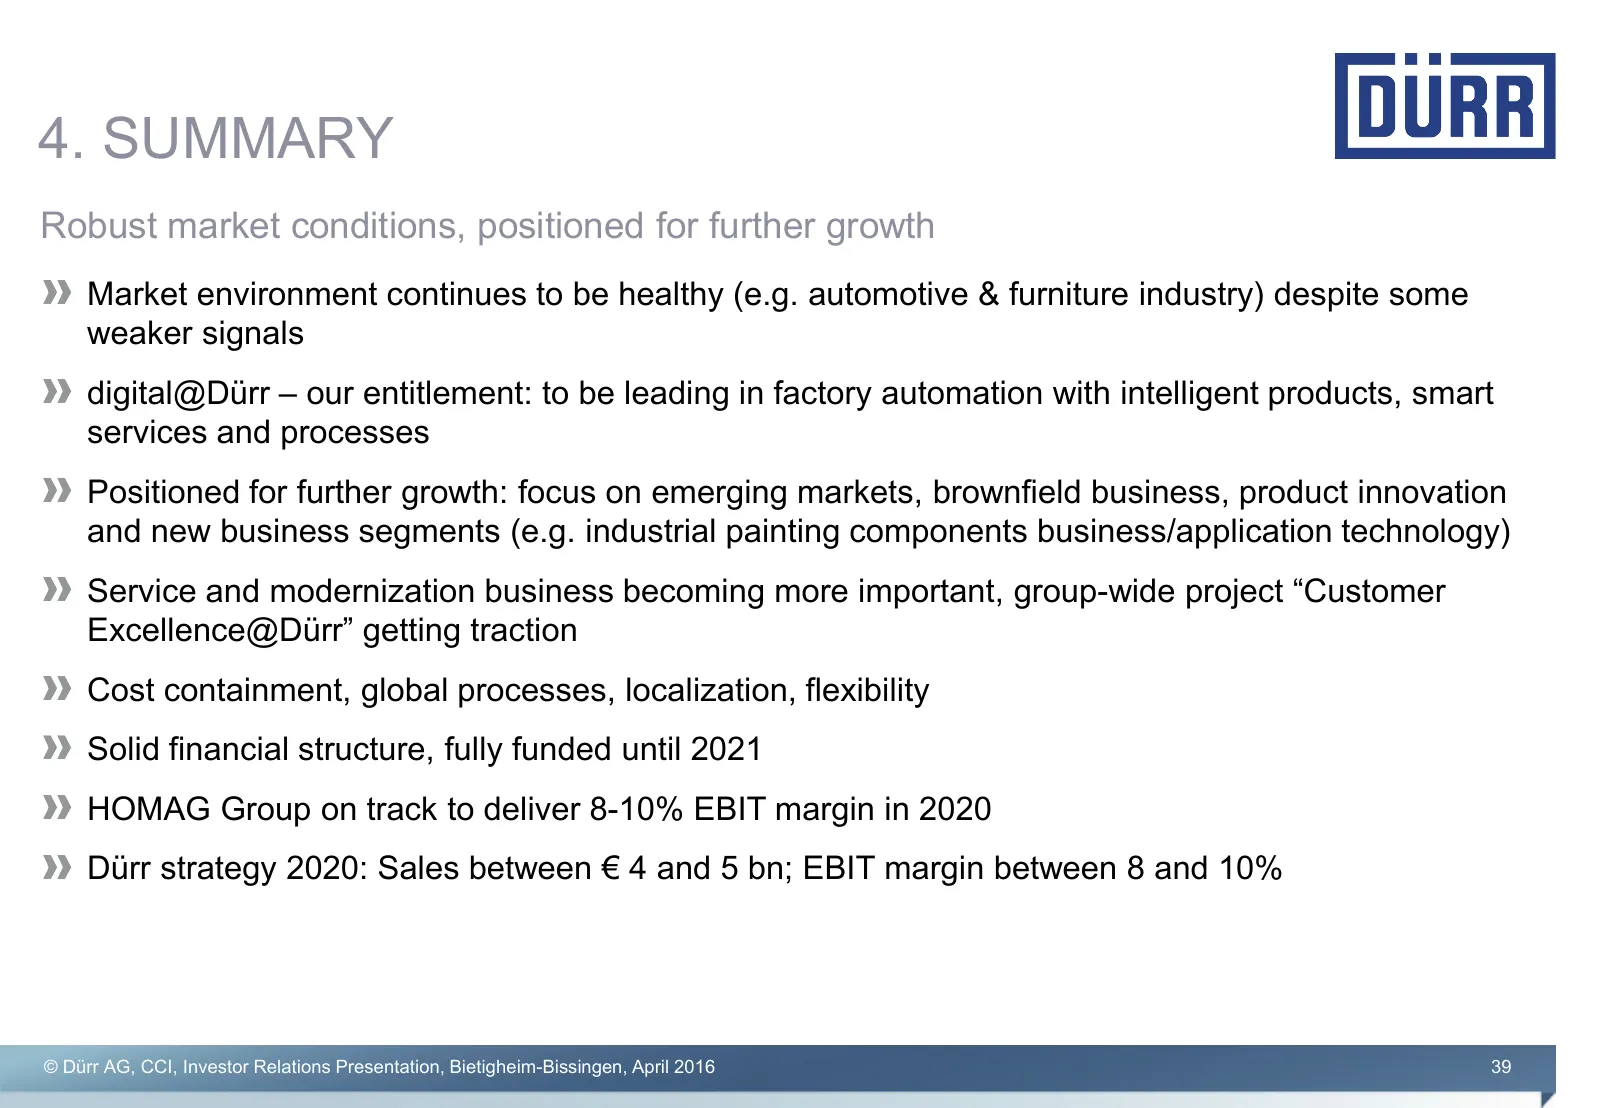
4. SUMMARY Robust market conditions, positioned for further growth Market environment continues to be healthy (e.g. automotive & furniture industry) despite some weaker signals digital@Dürr – our entitlement: to be leading in factory automation with intelligent products, smart services and processes
Slide 40: Financial Calendar
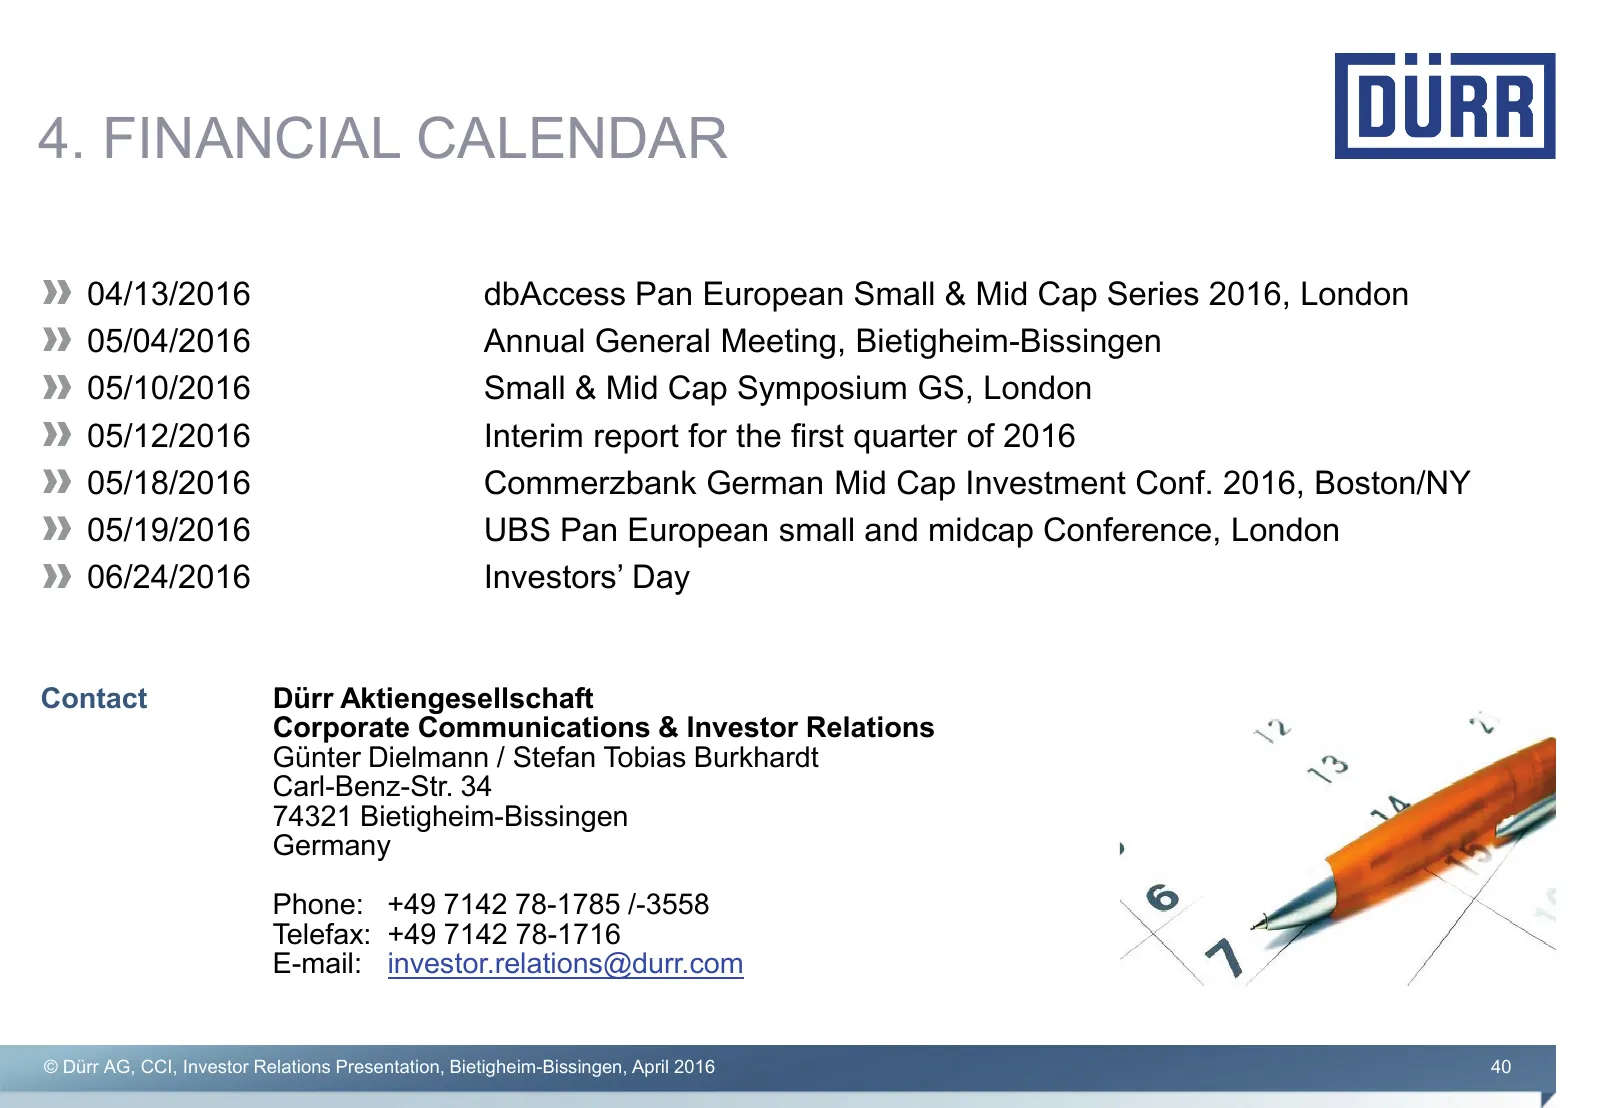
4. FINANCIAL CALENDAR 04/13/2016 dbAccess Pan European Small & Mid Cap Series 2016, London 05/04/2016 Annual General Meeting, Bietigheim-Bissingen 05/10/2016 Small & Mid Cap Symposium GS, London 05/12/2016 Interim report for the first quarter of 2016 05/18/2016 Commerzbank German Mid Cap Investment
Slide 41: Appendix
Appendix © Dürr AG, CCI, Investor Relations Presentation, Bietigheim-Bissingen, April 2016 41
Slide 42: Takeover of HOMAG Group
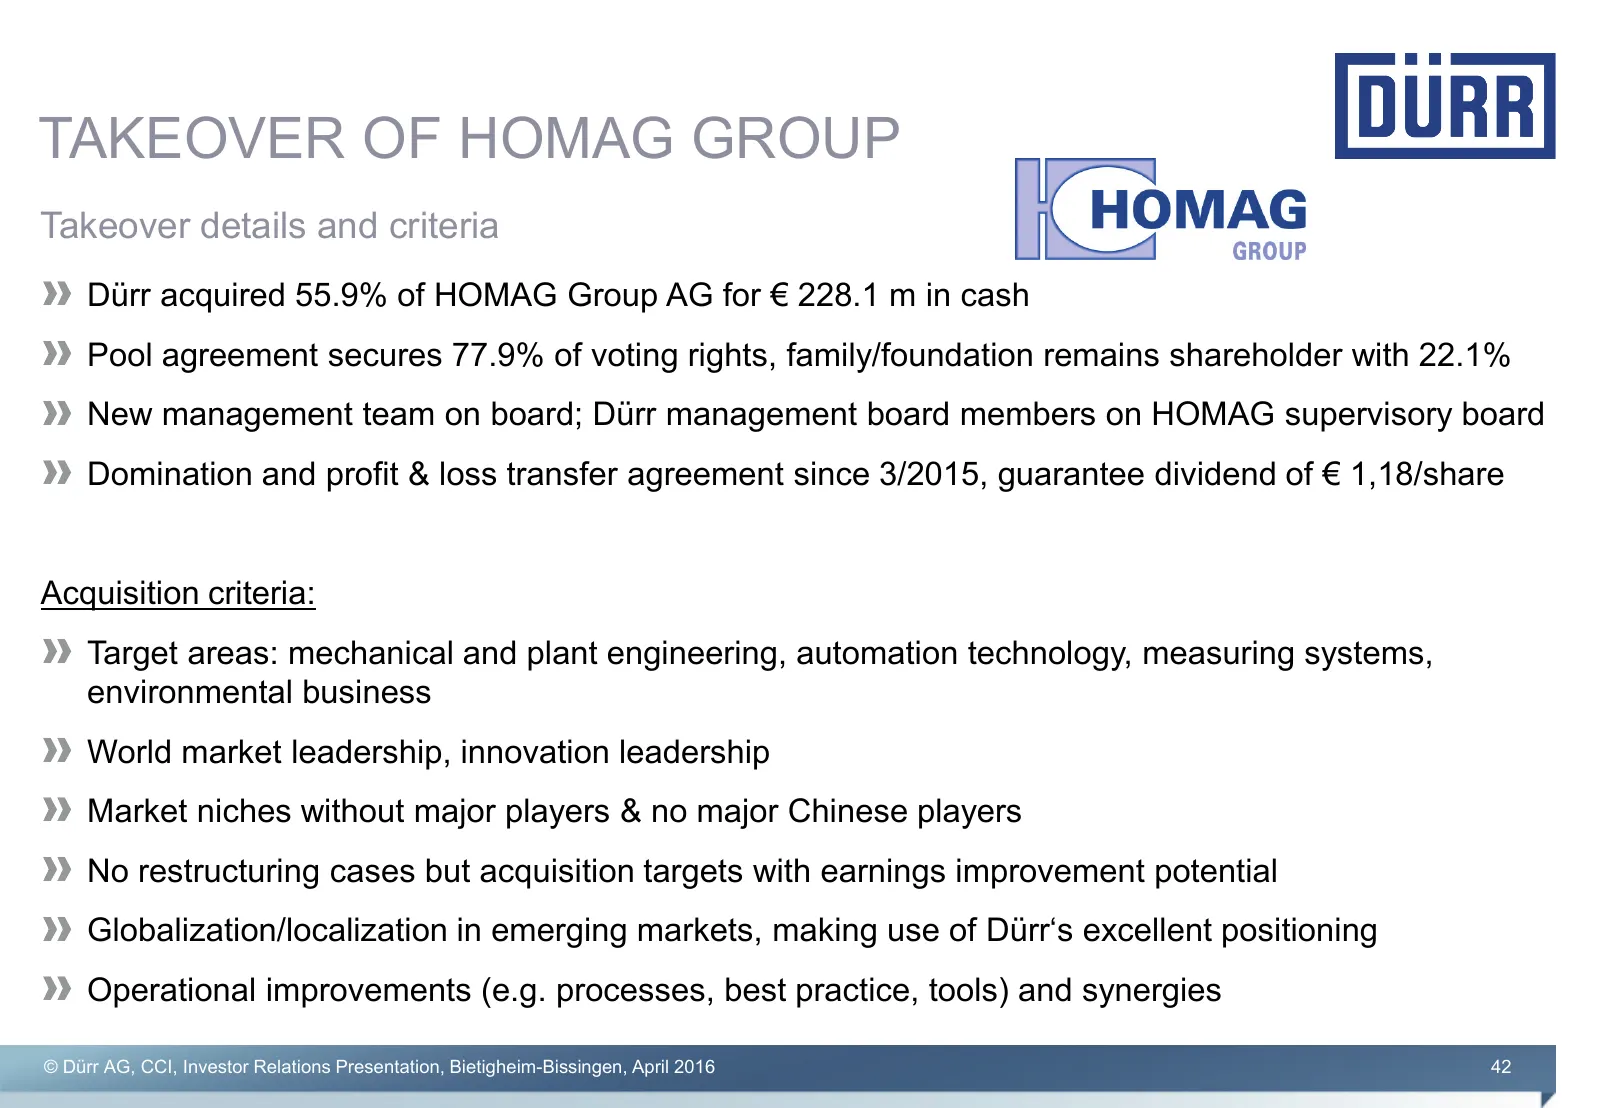
TAKEOVER OF HOMAG GROUP Takeover details and criteria Dürr acquired 55.9% of HOMAG Group AG for € 228.1 m in cash Pool agreement secures 77.9% of voting rights, family/foundation remains shareholder with 22.1% New management team on board; Dürr management board members on HOMAG supervisory board Dom
Slide 43: Shareholder Structure/Dividend Policy
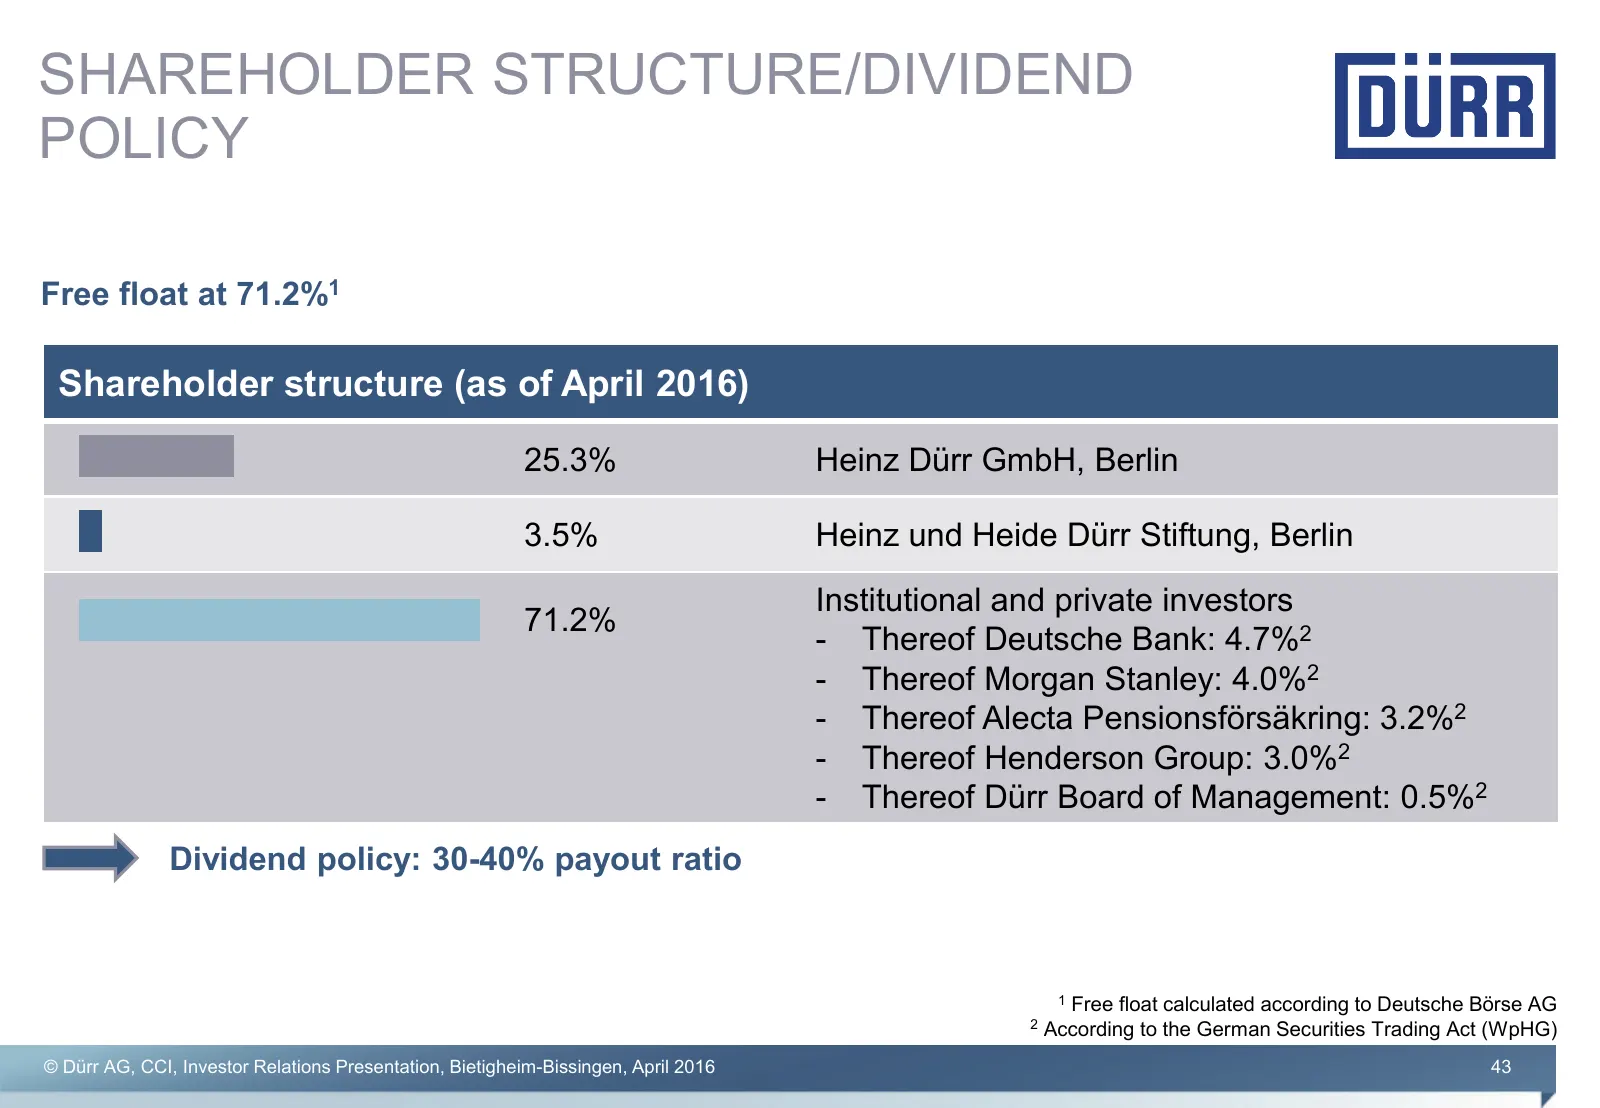
SHAREHOLDER STRUCTURE/DIVIDEND POLICY Free float at 71.2%1 Shareholder structure (as of April 2016) 25.3% Heinz Dürr GmbH, Berlin 3.5% Heinz und Heide Dürr Stiftung, Berlin Institutional and private investors 71.2% - Thereof Deutsche Bank: 4.7%2 - Thereof Morgan Stanley: 4.0%2 - Thereof Alecta Pensi
Slide 44: Market Share Dürr/Competitors
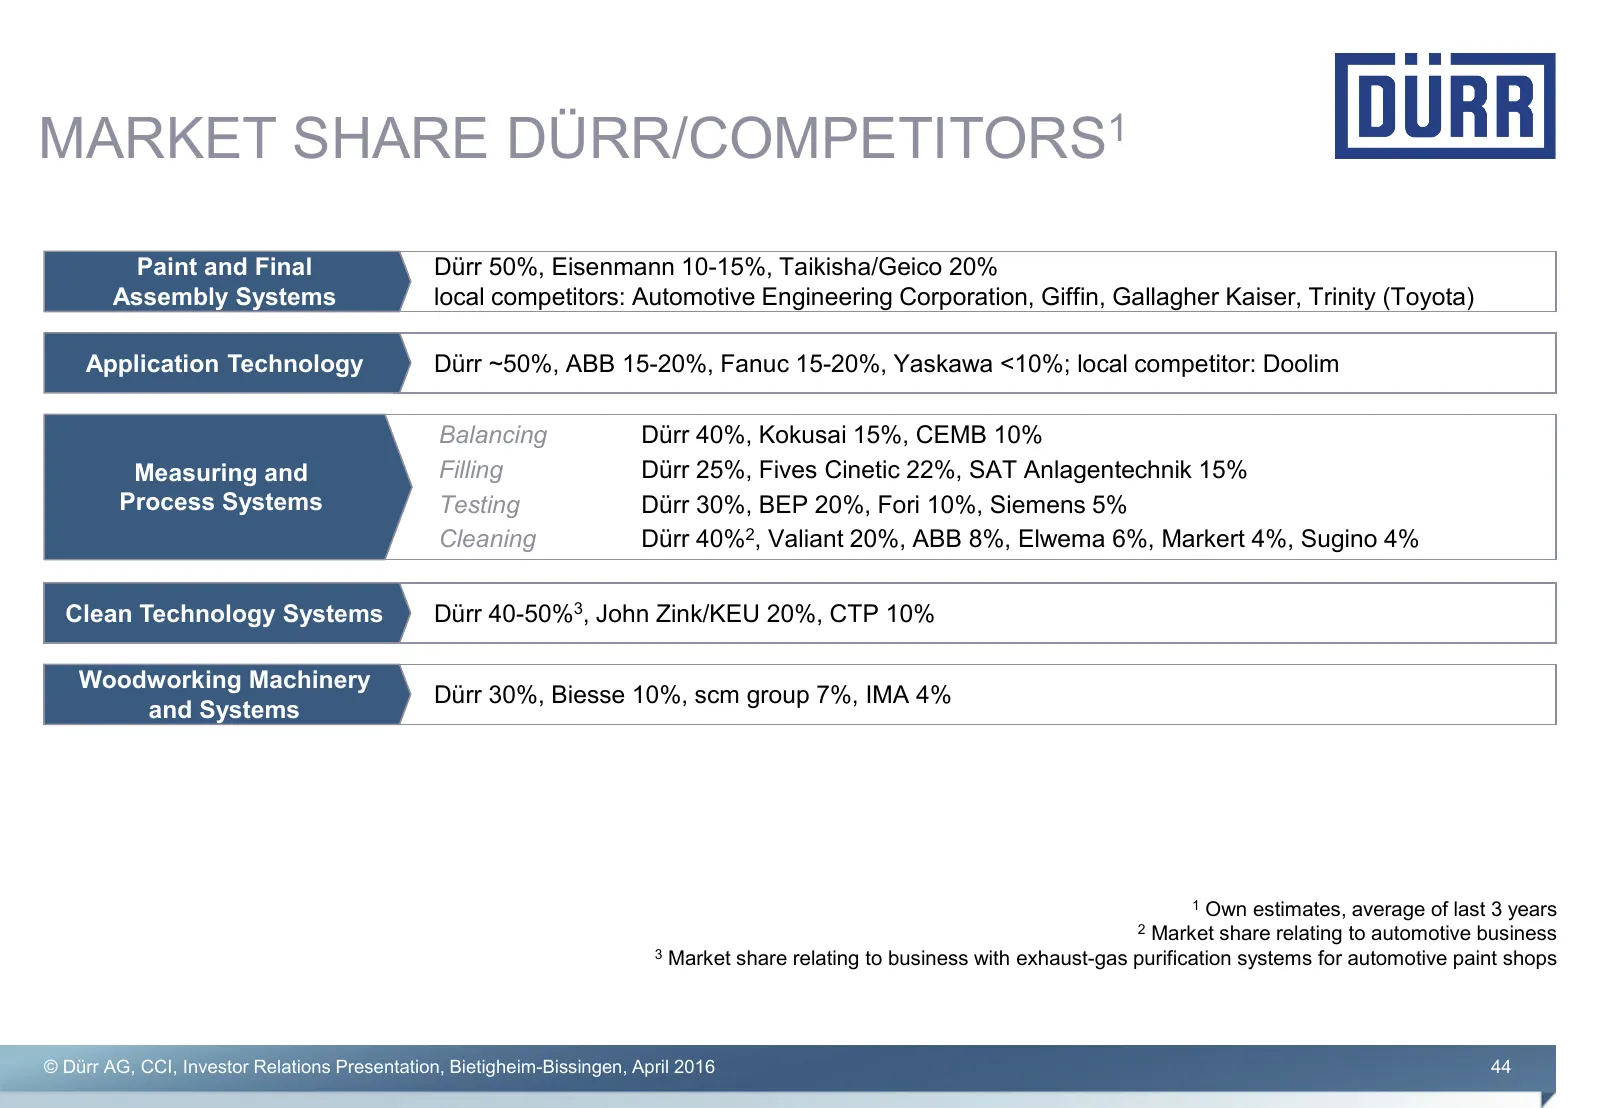
MARKET SHARE DÜRR/COMPETITORS1 Paint and Final Dürr 50%, Eisenmann 10-15%, Taikisha/Geico 20% Assembly Systems local competitors: Automotive Engineering Corporation, Giffin, Gallagher Kaiser, Trinity (Toyota) Application Technology Dürr ~50%, ABB 15-20%, Fanuc 15-20%, Yaskawa <10%; local competitor:
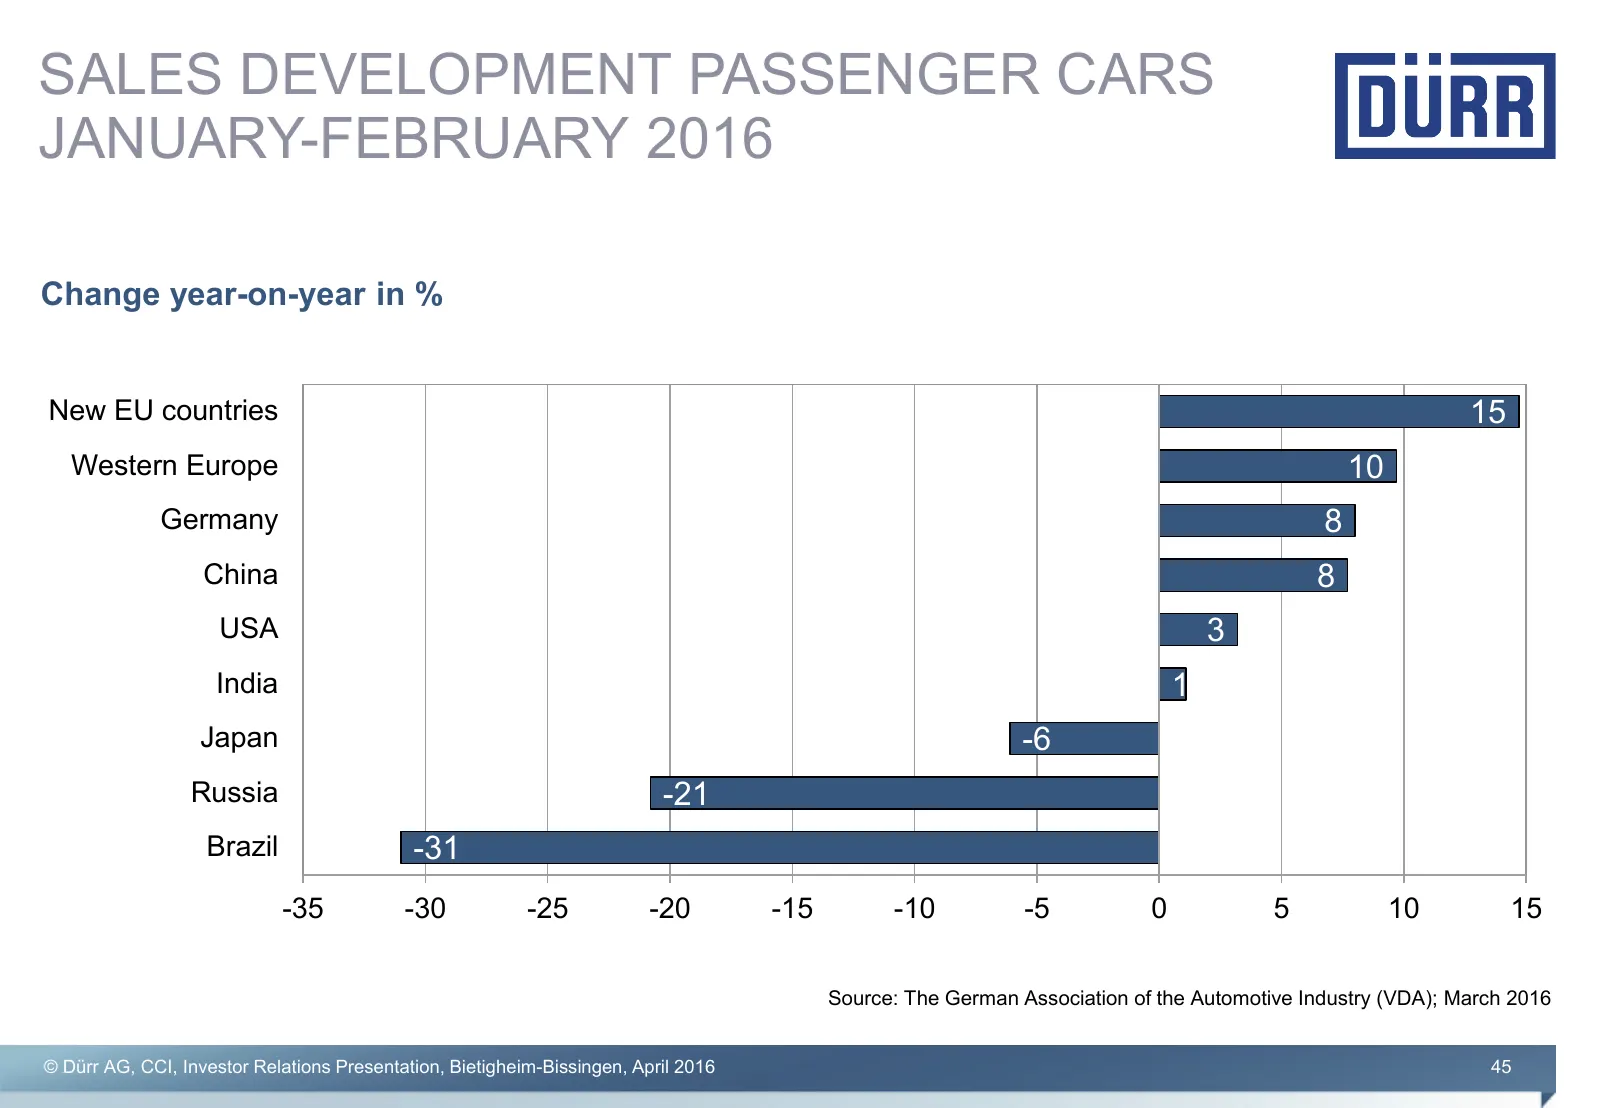
Slide 45: Sales Development Passenger Cars January-February 2016
SALES DEVELOPMENT PASSENGER CARS JANUARY-FEBRUARY 2016 Change year-on-year in % New EU countries 15 Western Europe 10 Germany 8 China 8 USA 3 India 1 Japan -6 Russia -21 Brazil -31 -35 -30 -25 -20 -15 -10 -5 0 5 10 15 Source: The German Association of the Automotive Industry (VDA); March 2016 © Dürr
Source: Internet Archive copy of durr.com
More decks from Durr AG
 Q3 2026 Earnings Presentation33 slides · Nov 12, 2026
 Q2 2026 Earnings Presentation39 slides · Aug 6, 2026
 Q1 2026 Earnings Presentation35 slides · May 12, 2026
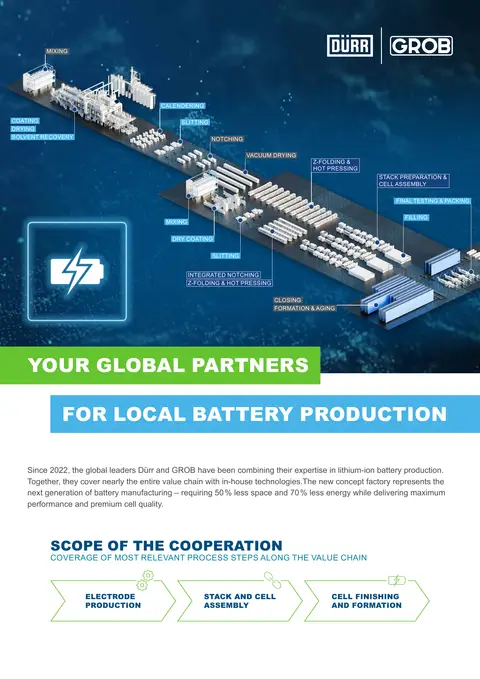 Fact Sheet (2025)2 slides · Dec 2, 2025
 Q3 2025 Earnings Presentation46 slides · Nov 13, 2025
 Q2 2025 Earnings Presentation31 slides · Jul 24, 2025