Nielsen — Investor Day (December 2020)
96 slides from Nielsen's investor day presentation, Dec 9, 2020
Slide 1: Investor Day, December 9th, 2020
Exhibit 99.2 December 9th, 2020 Copyright © 2020 The Nielsen Company (US), LLC. Confidential and proprietary. Do not distribute. 1 Copyright © 2020 The Nielsen Company (US), LLC. Confidential and proprietary. Do not distribute.Exhibit 99.2 December 9th, 2020 Copyright © 2020 The Nielsen Company (US),

Slide 2: Welcome & Agenda
WELCOME & AGENDA Sara Gubins SVP, Investor Relations and Treasury Copyright © 2020 The Nielsen Company (US), LLC. Confidential and proprietary. Do not distribute. 2 Copyright © 2020 The Nielsen Company (US), LLC. Confidential and proprietary. Do not distribute. WELCOME & AGENDA Sara Gubins SVP, Invest
Slide 3: Forward-Looking Statements
FORWARD-LOOKING STATEMENTS This presentation includes information that could constitute forward-looking statements made pursuant to the safe harbor provision of the Private Securities Litigation Reform Act of 1995. These statements include those set forth below relating to the proposed sale by Niels
Slide 4: Additional Information and Where to Find It
ADDITIONAL INFORMATION AND WHERE TO FIND IT This communication relates to the proposed transaction involving Nielsen. In connection with the proposed transaction, Nielsen has filed and will be filing relevant materials with the SEC, including the Proxy Statement. This communication is not a substitute
Slide 5: Today's Agenda
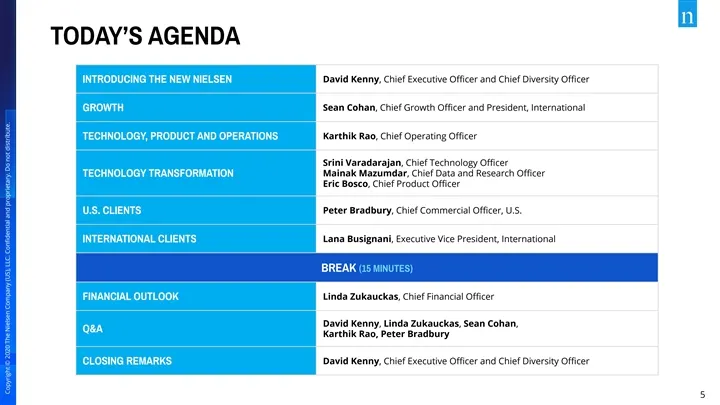
TODAY’S AGENDA David Kenny, Chief Executive Officer and Chief Diversity Officer INTRODUCING THE NEW NIELSEN GROWTH Sean Cohan, Chief Growth Officer and President, International Karthik Rao, Chief Operating Officer TECHNOLOGY, PRODUCT AND OPERATIONS Srini Varadarajan, Chief Technology Officer Mainak Mazumdar,
Slide 6: Introducing the New Nielsen
INTRODUCING THE NEW NIELSEN David Kenny Chief Executive Officer and Chief Diversity Officer Copyright © 2020 The Nielsen Company (US), LLC. Confidential and proprietary. Do not distribute. 6 Copyright © 2020 The Nielsen Company (US), LLC. Confidential and proprietary. Do not distribute. INTRODUCING THE NE
Slide 7: New Nielsen: New Growth, New Culture, Compelling Financial Model
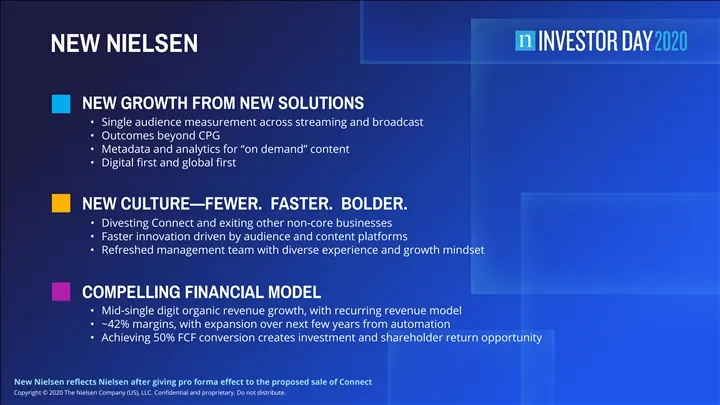
NEW NIELSEN NEW GROWTH FROM NEW SOLUTIONS • Single audience measurement across streaming and broadcast • Outcomes beyond CPG • Metadata and analytics for “on demand” content • Digital first and global first NEW CULTURE—FEWER. FASTER. BOLDER. • Divesting Connect and exiting other non-core businesses •
Slide 8: Diversified and Growing Business
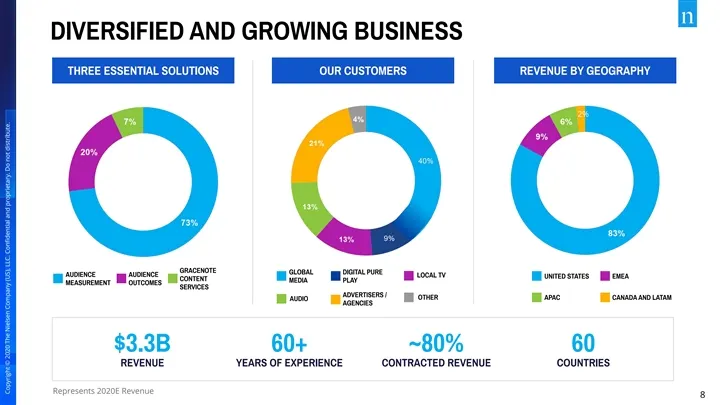
DIVERSIFIED AND GROWING BUSINESS THREE ESSENTIAL SOLUTIONS OUR CUSTOMERS REVENUE BY GEOGRAPHY 2% GRACENOTE GLOBAL DIGITAL PURE AUDIENCE AUDIENCE LOCAL TV UNITED STATES EMEA CONTENT MEDIA PLAY MEASUREMENT OUTCOMES SERVICES ADVERTISERS / OTHER APAC CANADA AND LATAM AUDIO AGENCIES $3.3B 60+ ~80% 60 REV
Slide 9: At Inflection Point to Drive Higher Growth
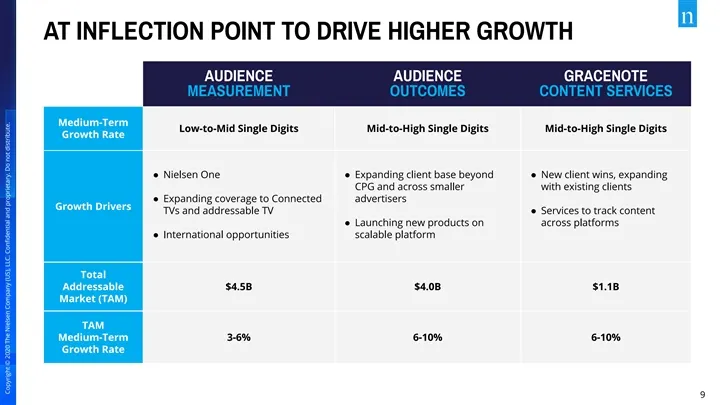
AT INFLECTION POINT TO DRIVE HIGHER GROWTH AUDIENCE AUDIENCE GRACENOTE MEASUREMENT OUTCOMES CONTENT SERVICES Medium-Term Low-to-Mid Single Digits Mid-to-High Single Digits Mid-to-High Single Digits Growth Rate ● Nielsen One ● Expanding client base beyond ● New client wins, expanding CPG and across s
Slide 10: Nielsen One: Delivering Cross-Media Currency
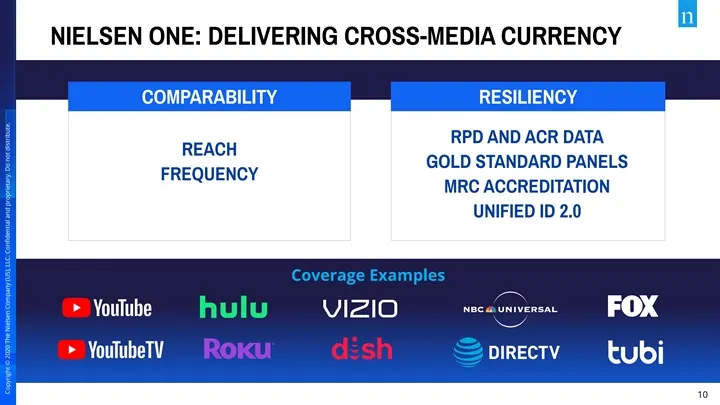
NIELSEN ONE: DELIVERING CROSS-MEDIA CURRENCY COMPARABILITY RESILIENCY RPD AND ACR DATA REACH GOLD STANDARD PANELS FREQUENCY MRC ACCREDITATION UNIFIED ID 2.0 Coverage Examples 10 Copyright © 2020 The Nielsen Company (US), LLC. Confidential and proprietary. Do not distribute.NIELSEN ONE: DELIVERING CRO
Slide 11: New Nielsen Has a Growth Mindset
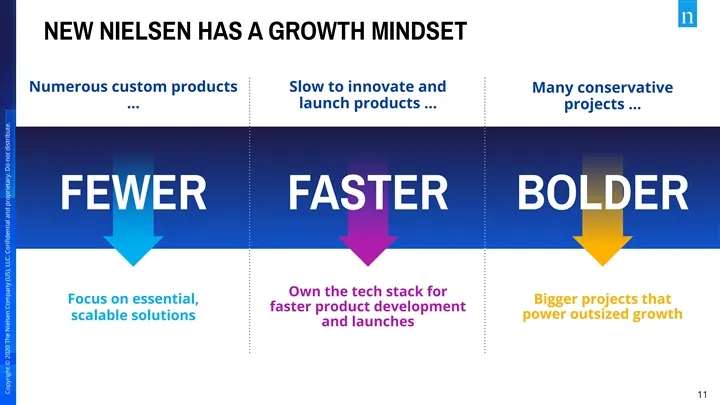
NEW NIELSEN HAS A GROWTH MINDSET Numerous custom products Slow to innovate and Many conservative … launch products … projects … FEWER FASTER BOLDER Own the tech stack for Focus on essential, Bigger projects that faster product development power outsized growth scalable solutions and launches 11 Copy
Slide 12: Talented Leadership Team Driving Transformation
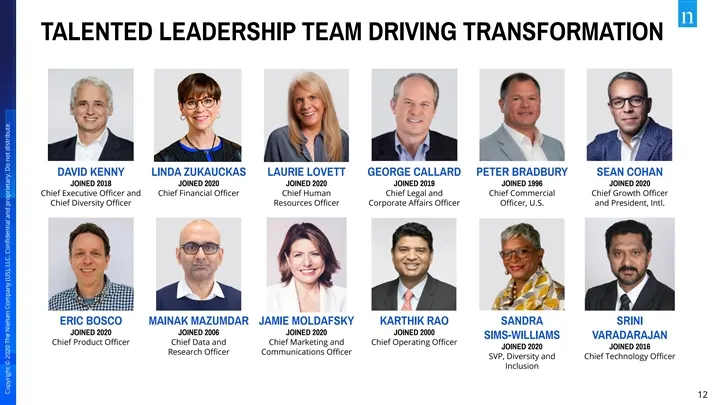
TALENTED LEADERSHIP TEAM DRIVING TRANSFORMATION DAVID KENNY LINDA ZUKAUCKAS LAURIE LOVETT GEORGE CALLARD PETER BRADBURY SEAN COHAN JOINED 2018 JOINED 2020 JOINED 2020 JOINED 2019 JOINED 1996 JOINED 2020 Chief Executive Officer and Chief Financial Officer Chief Human Chief Legal and Chief Commercial Chie
Slide 13: Resetting the Baseline for the New Nielsen
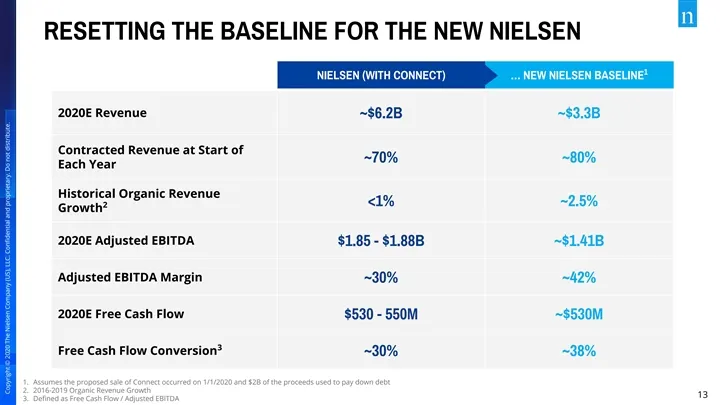
RESETTING THE BASELINE FOR THE NEW NIELSEN 1 NIELSEN (WITH CONNECT) … NEW NIELSEN BASELINE 2020E Revenue ~$6.2B ~$3.3B Contracted Revenue at Start of ~70% ~80% Each Year Historical Organic Revenue <1% ~2.5% 2 Growth 2020E Adjusted EBITDA $1.85 - $1.88B ~$1.41B Adjusted EBITDA Margin ~30% ~42% 2020E
Slide 14: Nielsen's Medium-Term Financial Framework
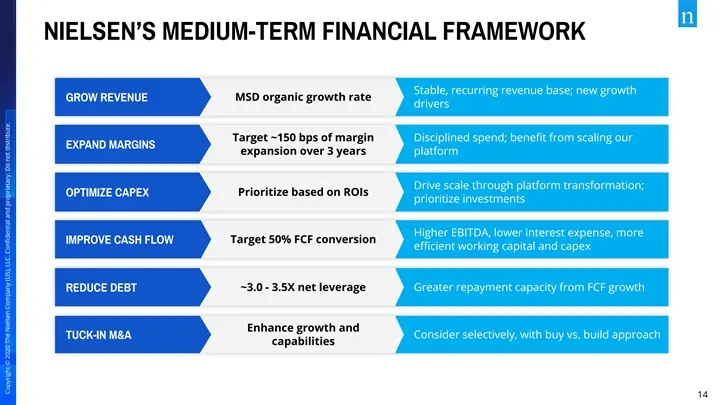
NIELSEN’S MEDIUM-TERM FINANCIAL FRAMEWORK Stable, recurring revenue base; new growth GROW REVENUE MSD organic growth rate drivers Target ~150 bps of margin Disciplined spend; benefit from scaling our EXPAND MARGINS expansion over 3 years platform Drive scale through platform transformation; Prioritiz
Slide 15: Audience Is Everything: Strategic Framework
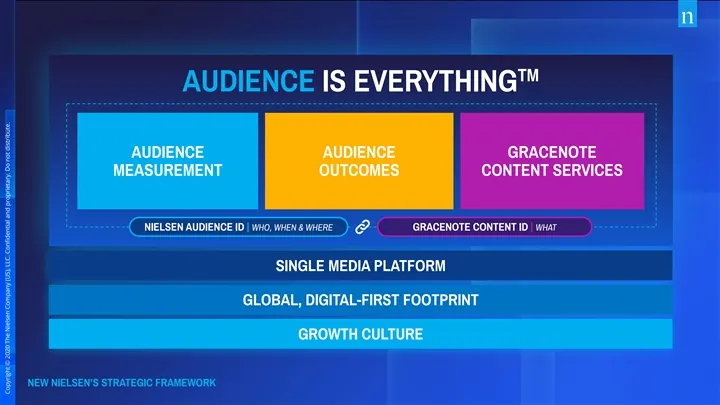
TM AUDIENCE IS EVERYTHING AUDIENCE AUDIENCE GRACENOTE MEASUREMENT OUTCOMES CONTENT SERVICES NIELSEN AUDIENCE ID | WHO, WHEN & WHERE GRACENOTE CONTENT ID | WHAT SINGLE MEDIA PLATFORM GLOBAL, DIGITAL-FIRST FOOTPRINT GROWTH CULTURE NEW NIELSEN’S STRATEGIC FRAMEWORK 15 Copyright © 2020 The Nielsen Compa
Slide 16: Growth
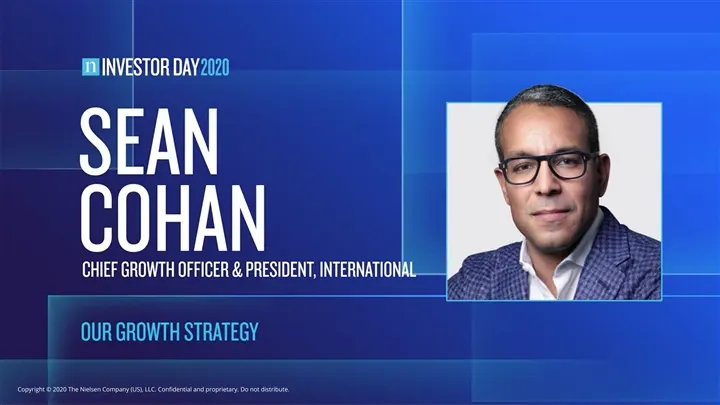
GROWTH Sean Cohan Chief Growth Officer and President, International Copyright © 2020 The Nielsen Company (US), LLC. Confidential and proprietary. Do not distribute. 16 Copyright © 2020 The Nielsen Company (US), LLC. Confidential and proprietary. Do not distribute. GROWTH Sean Cohan Chief Growth Officer an
Slide 17: Today's Growth Discussion
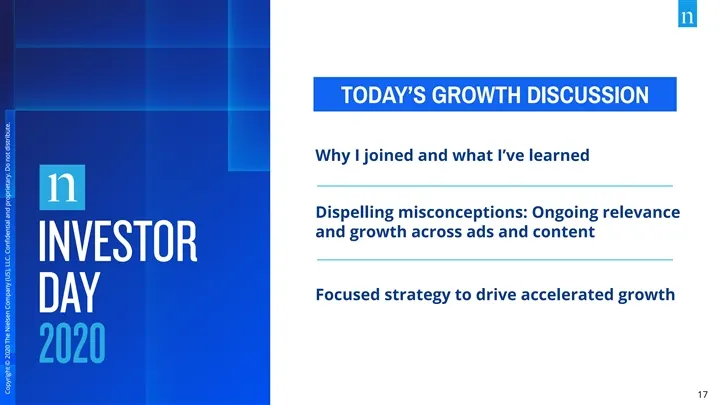
TODAY’S GROWTH DISCUSSION Why I joined and what I’ve learned Dispelling misconceptions: Ongoing relevance and growth across ads and content Focused strategy to drive accelerated growth 17 Copyright © 2020 The Nielsen Company (US), LLC. Confidential and proprietary. Do not distribute. Copyright © 2020
Slide 18: Nielsen: What We Do
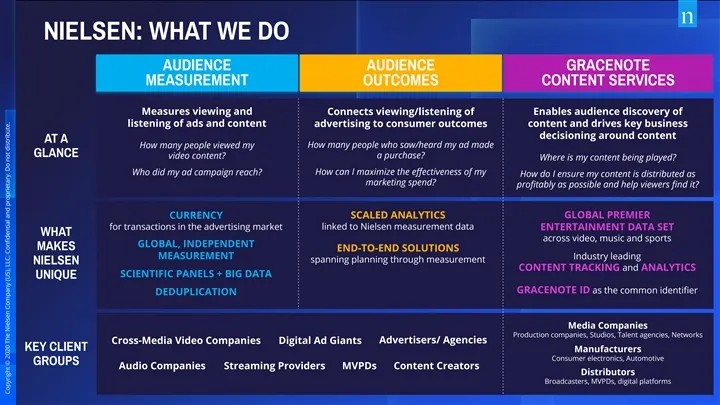
NIELSEN: WHAT WE DO AUDIENCE AUDIENCE GRACENOTE MEASUREMENT OUTCOMES CONTENT SERVICES Measures viewing and Connects viewing/listening of Enables audience discovery of listening of ads and content advertising to consumer outcomes content and drives key business decisioning around content AT A How man
Slide 19: Investor Misconceptions About Nielsen's Growth
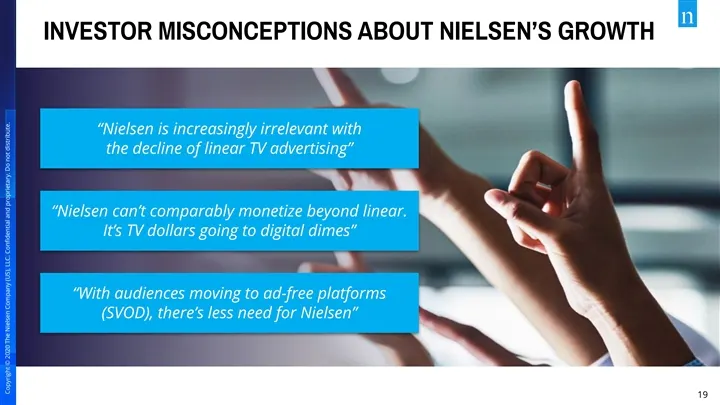
INVESTOR MISCONCEPTIONS ABOUT NIELSEN’S GROWTH “Nielsen is increasingly irrelevant with the decline of linear TV advertising” “Nielsen can’t comparably monetize beyond linear. It’s TV dollars going to digital dimes” “With audiences moving to ad-free platforms (SVOD), there’s less need for Nielsen” 1
Slide 20: Misconception 1: Irrelevant with Decline of Linear TV
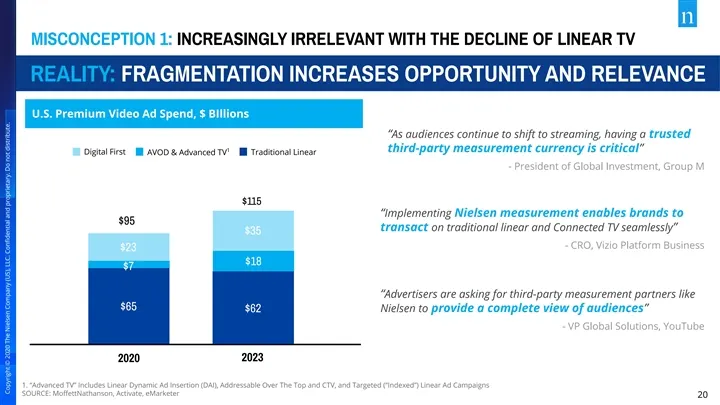
MISCONCEPTION 1: INCREASINGLY IRRELEVANT WITH THE DECLINE OF LINEAR TV REALITY: FRAGMENTATION INCREASES OPPORTUNITY AND RELEVANCE U.S. Premium Video Ad Spend, $ BIllions “As audiences continue to shift to streaming, having a trusted 1 third-party measurement currency is critical” Digital First AVOD
Slide 21: Misconception 2: Nielsen Can't Monetize Beyond Linear
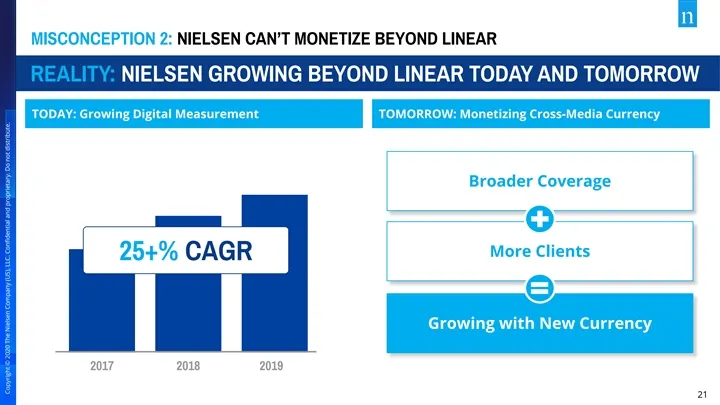
MISCONCEPTION 2: NIELSEN CAN’T MONETIZE BEYOND LINEAR REALITY: NIELSEN GROWING BEYOND LINEAR TODAY AND TOMORROW TODAY: Growing Digital Measurement TOMORROW: Monetizing Cross-Media Currency Broader Coverage More Clients 25+% CAGR Growing with New Currency 2017 2018 2019 21 25+% CAGR 2017 2018 2019 Co
Slide 22: Misconception 3: Audiences Moving to SVOD
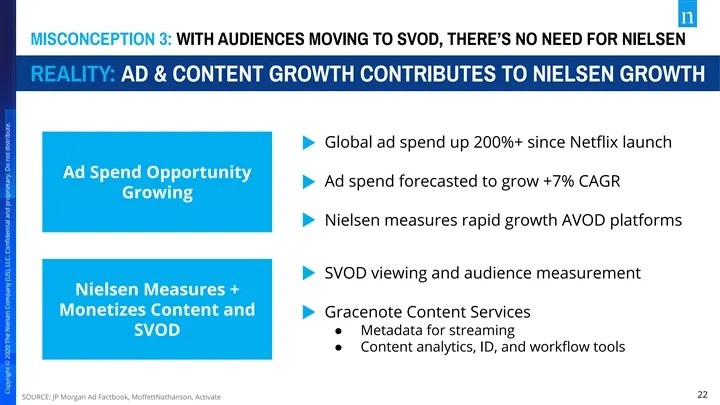
MISCONCEPTION 3: WITH AUDIENCES MOVING TO SVOD, THERE’S NO NEED FOR NIELSEN REALITY: AD & CONTENT GROWTH CONTRIBUTES TO NIELSEN GROWTH Global ad spend up 200%+ since Netflix launch Ad Spend Opportunity Ad spend forecasted to grow +7% CAGR Growing Nielsen measures rapid growth AVOD platforms SVOD view
Slide 23: New Nielsen's Strategic Framework
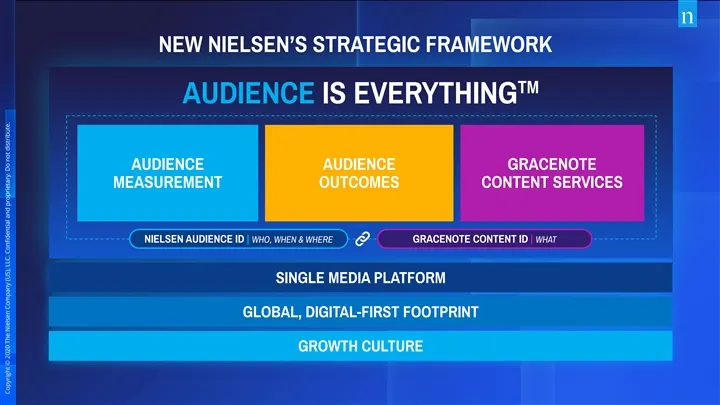
NEW NIELSEN’S STRATEGIC FRAMEWORK TM AUDIENCE IS EVERYTHING AUDIENCE AUDIENCE GRACENOTE MEASUREMENT OUTCOMES CONTENT SERVICES NIELSEN AUDIENCE ID | WHO, WHEN & WHERE GRACENOTE CONTENT ID | WHAT SINGLE MEDIA PLATFORM GLOBAL, DIGITAL-FIRST FOOTPRINT GROWTH CULTURE 23 Copyright © 2020 The Nielsen Compa
Slide 24: Audience Measurement Market Today: Rapid Change
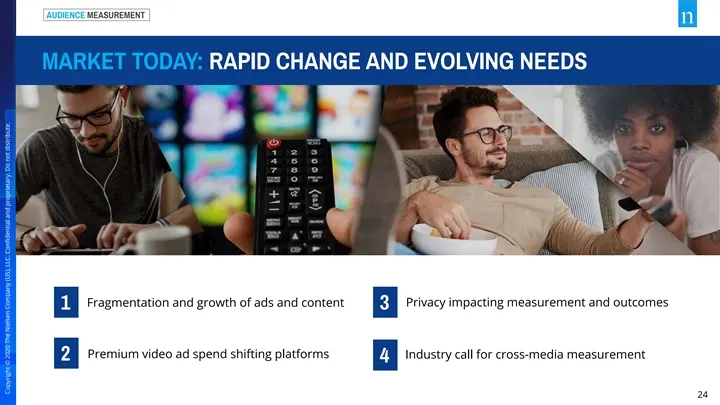
AUDIENCE MEASUREMENT MARKET TODAY: RAPID CHANGE AND EVOLVING NEEDS Fragmentation and growth of ads and content Privacy impacting measurement and outcomes 1 3 Premium video ad spend shifting platforms Industry call for cross-media measurement 2 4 24 Copyright © 2020 The Nielsen Company (US), LLC. Con
Slide 25: Delivering Critical Cross-Media Currency
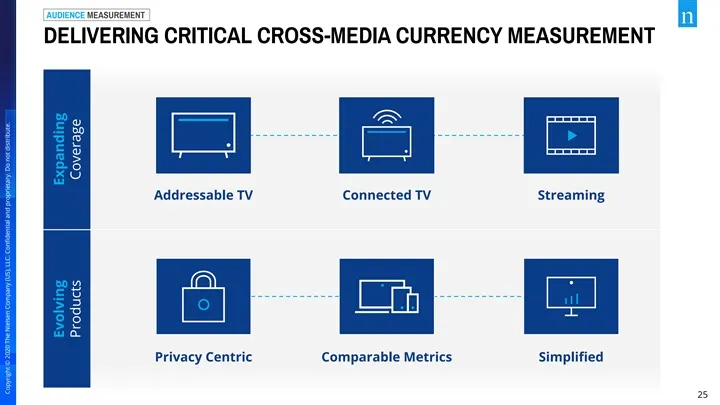
AUDIENCE MEASUREMENT DELIVERING CRITICAL CROSS-MEDIA CURRENCY MEASUREMENT Addressable TV Connected TV Streaming Privacy Centric Comparable Metrics Simplified Portfolio 25 Copyright © 2020 The Nielsen Company (US), LLC. Confidential and proprietary. Do not distribute. Evolving Expanding Products Covera
Slide 26: Audience Measurement: Positioned to Grow
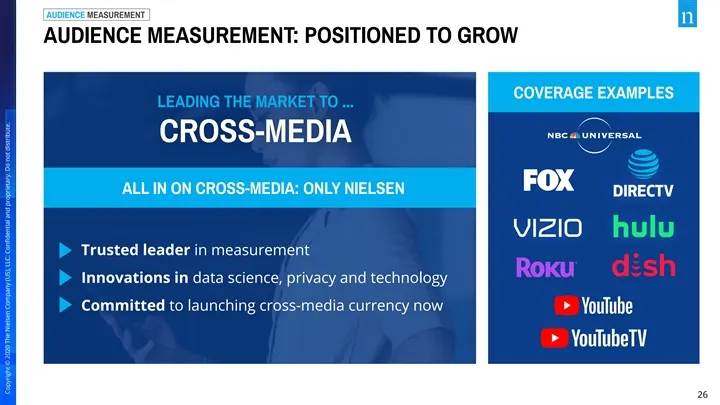
AUDIENCE MEASUREMENT AUDIENCE MEASUREMENT: POSITIONED TO GROW COVERAGE EXAMPLES LEADING THE MARKET TO ... CROSS-MEDIA ALL IN ON CROSS-MEDIA: ONLY NIELSEN Trusted leader in measurement Innovations in data science, privacy and technology Committed to launching cross-media currency now 26 Copyright © 2
Slide 27: Audience Outcomes: Marketer's Challenge
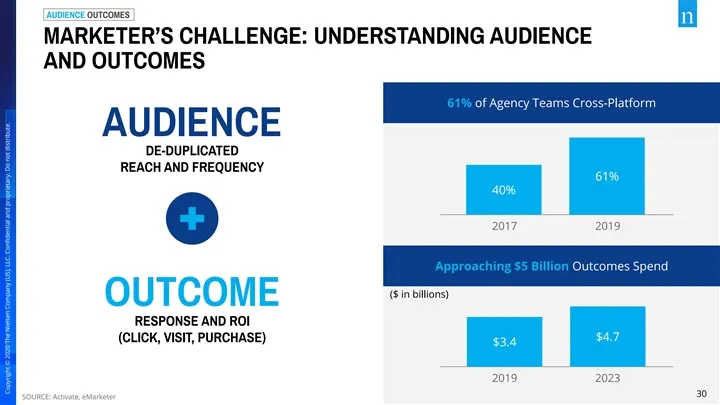
AUDIENCE OUTCOMES MARKETER’S CHALLENGE: UNDERSTANDING AUDIENCE AND OUTCOMES 61% of Agency Teams Cross-Platform AUDIENCE DE-DUPLICATED REACH AND FREQUENCY 61% 40% 2017 2019 Approaching $5 Billion Outcomes Spend ($ in billions) OUTCOME RESPONSE AND ROI $4.7 (CLICK, VISIT, PURCHASE) $3.4 2019 2023 30 2
Slide 28: Audience Outcomes: In-Flight Initiatives
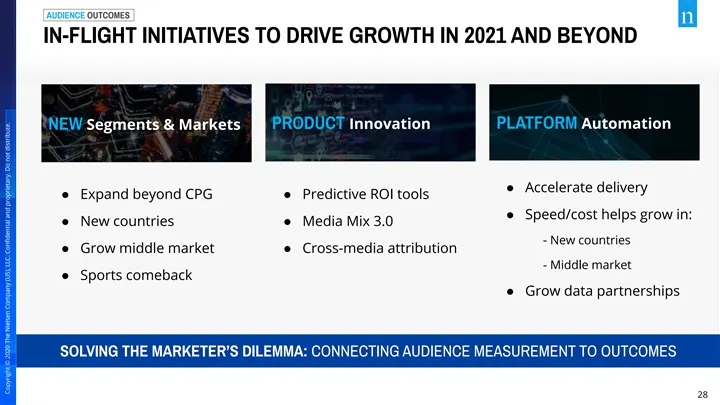
AUDIENCE OUTCOMES IN-FLIGHT INITIATIVES TO DRIVE GROWTH IN 2021 AND BEYOND PRODUCT Innovation PLATFORM Automation NEW Segments & Markets ● Accelerate delivery ● Expand beyond CPG ● Predictive ROI tools ● Speed/cost helps grow in: ● New countries ● Media Mix 3.0 - New countries ● Grow middle market ●
Slide 29: Gracenote Content Services: Growth Opportunities
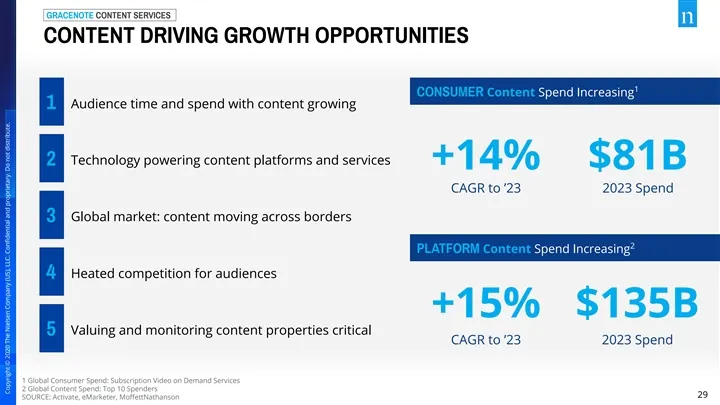
GRACENOTE CONTENT SERVICES CONTENT DRIVING GROWTH OPPORTUNITIES 1 CONSUMER Content Spend Increasing Audience time and spend with content growing 1 Technology powering content platforms and services 2 +14% $81B CAGR to ’23 2023 Spend Global market: content moving across borders 3 2 PLATFORM Content S
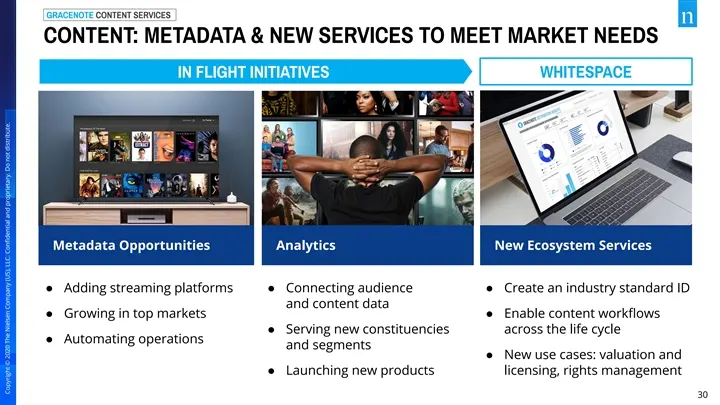
Slide 30: Content: Metadata & New Services
GRACENOTE CONTENT SERVICES CONTENT: METADATA & NEW SERVICES TO MEET MARKET NEEDS IN FLIGHT INITIATIVES WHITESPACE Metadata Opportunities Analytics New Ecosystem Services ● Adding streaming platforms ● Connecting audience ● Create an industry standard ID and content data ● Growing in top markets ● En
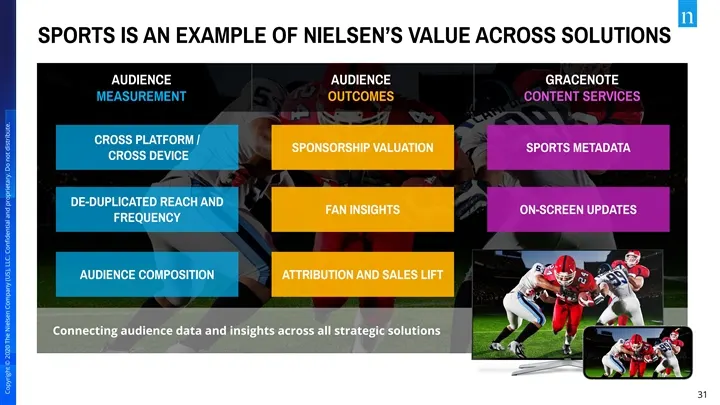
Slide 31: Sports: Nielsen's Value Across Solutions
SPORTS IS AN EXAMPLE OF NIELSEN’S VALUE ACROSS SOLUTIONS AUDIENCE AUDIENCE GRACENOTE MEASUREMENT OUTCOMES CONTENT SERVICES CROSS PLATFORM / SPONSORSHIP VALUATION SPORTS METADATA CROSS DEVICE DE-DUPLICATED REACH AND FAN INSIGHTS ON-SCREEN UPDATES FREQUENCY AUDIENCE COMPOSITION ATTRIBUTION AND SALES L
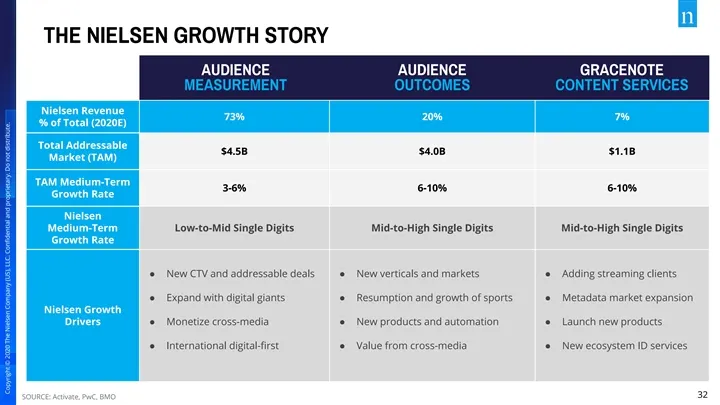
Slide 32: The Nielsen Growth Story
THE NIELSEN GROWTH STORY AUDIENCE AUDIENCE GRACENOTE MEASUREMENT OUTCOMES CONTENT SERVICES Nielsen Revenue 73% 20% 7% % of Total (2020E) Total Addressable $4.5B $4.0B $1.1B Market (TAM) TAM Medium-Term 3-6% 6-10% 6-10% Growth Rate Nielsen Medium-Term Low-to-Mid Single Digits Mid-to-High Single Digit
Slide 33: Our Product Transformation
OUR PRODUCT TRANSFORMATION Karthik Rao Chief Operating Officer Copyright © 2020 The Nielsen Company (US), LLC. Confidential and proprietary. Do not distribute. 33 Copyright © 2020 The Nielsen Company (US), LLC. Confidential and proprietary. Do not distribute. OUR PRODUCT TRANSFORMATION Karthik Rao Chief
Slide 34: Technology Underpins Our Transformation
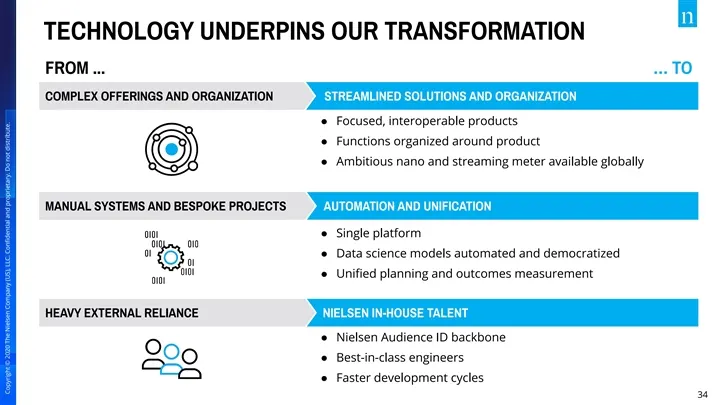
TECHNOLOGY UNDERPINS OUR TRANSFORMATION FROM ... … TO COMPLEX OFFERINGS AND ORGANIZATION STREAMLINED SOLUTIONS AND ORGANIZATION ● Focused, interoperable products ● Functions organized around product ● Ambitious nano and streaming meter available globally MANUAL SYSTEMS AND BESPOKE PROJECTS AUTOMATIO
Slide 35: The Media Platform: One Architecture for All
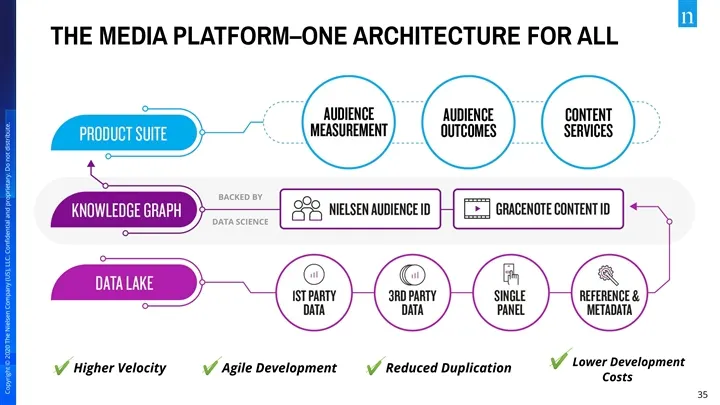
THE MEDIA PLATFORM–ONE ARCHITECTURE FOR ALL BACKED BY DATA SCIENCE ✔ Lower Development ✔ Higher Velocity✔ Agile Development✔ Reduced Duplication Costs 35 Copyright © 2020 The Nielsen Company (US), LLC. Confidential and proprietary. Do not distribute.THE MEDIA PLATFORM–ONE ARCHITECTURE FOR ALL BACKED
Slide 36: Field Transformation Driving Efficiency & Innovation
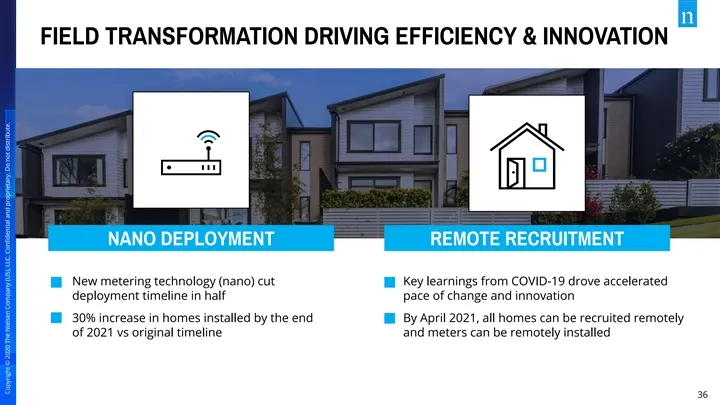
FIELD TRANSFORMATION DRIVING EFFICIENCY & INNOVATION NANO DEPLOYMENT REMOTE RECRUITMENT New metering technology (nano) cut Key learnings from COVID-19 drove accelerated deployment timeline in half pace of change and innovation 30% increase in homes installed by the end By April 2021, all homes can b
Slide 37: Driving the Industry Forward with Cross Media
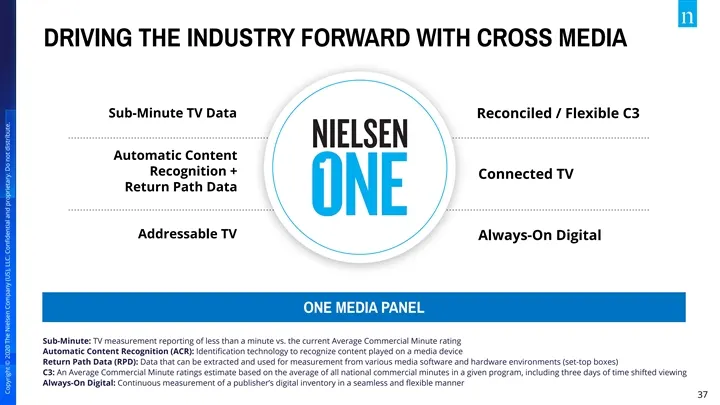
DRIVING THE INDUSTRY FORWARD WITH CROSS MEDIA Sub-Minute TV Data Reconciled / Flexible C3 Automatic Content Recognition + Connected TV Return Path Data Addressable TV Always-On Digital ONE MEDIA PANEL Sub-Minute: TV measurement reporting of less than a minute vs. the current Average Commercial Minut
Slide 38: Investing for Growth
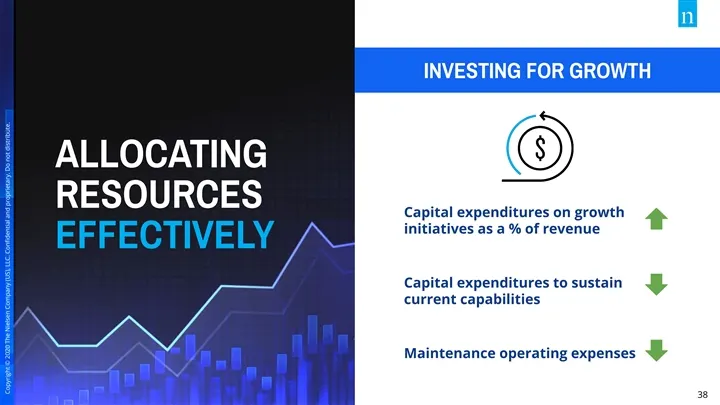
INVESTING FOR GROWTH ALLOCATING RESOURCES Capital expenditures on growth initiatives as a % of revenue EFFECTIVELY Capital expenditures to sustain current capabilities Maintenance operating expenses 38 Copyright © 2020 The Nielsen Company (US), LLC. Confidential and proprietary. Do not distribute.INV
Slide 39: Organized for Success
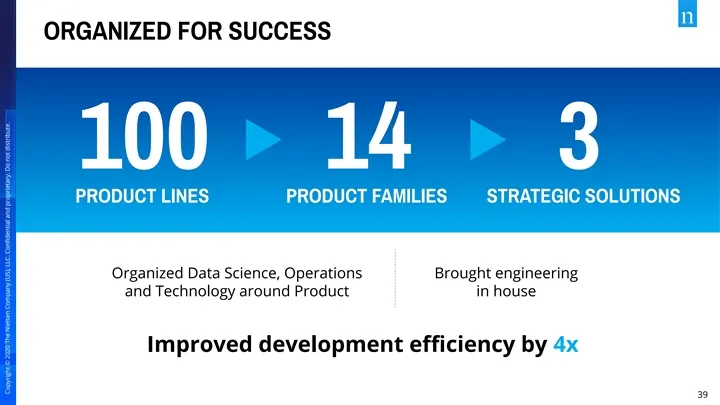
ORGANIZED FOR SUCCESS 100 14 3 PRODUCT LINES PRODUCT FAMILIES STRATEGIC SOLUTIONS Organized Data Science, Operations Brought engineering and Technology around Product in house Improved development efficiency by 4x 39 Copyright © 2020 The Nielsen Company (US), LLC. Confidential and proprietary. Do not d
Slide 40: Everything Is Connected
EVERYTHING IS CONNECTED We’ve reduced complexity and increased focus All of our solutions use one platform 40 Copyright © 2020 The Nielsen Company (US), LLC. Confidential and proprietary. Do not distribute.EVERYTHING IS CONNECTED We’ve reduced complexity and increased focus All of our solutions use o
Slide 41: Technology Platform Transformation
TECHNOLOGY PLATFORM TRANSFORMATION Srini Varadarajan Chief Technology Officer Copyright © 2020 The Nielsen Company (US), LLC. Confidential and proprietary. Do not distribute. 41 Copyright © 2020 The Nielsen Company (US), LLC. Confidential and proprietary. Do not distribute. TECHNOLOGY PLATFORM TRANSFORM
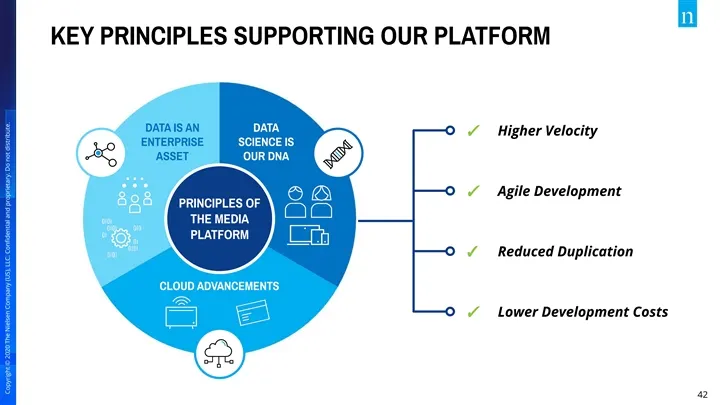
Slide 42: Key Principles Supporting Our Platform
KEY PRINCIPLES SUPPORTING OUR PLATFORM DATA IS AN DATA ✓ Higher Velocity CLOUD ADVANCEMENTS ENTERPRISE SCIENCE IS ASSET OUR DNA ✓ Agile Development PRINCIPLES OF THE MEDIA PLATFORM ✓ Reduced Duplication ✓ Lower Development Costs 42 Copyright © 2020 The Nielsen Company (US), LLC. Confidential and prop
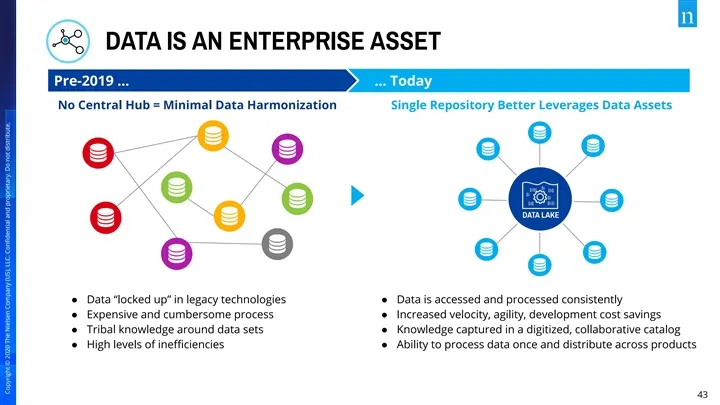
Slide 43: Data Is an Enterprise Asset
DATA IS AN ENTERPRISE ASSET Pre-2019 … … Today No Central Hub = Minimal Data Harmonization Single Repository Better Leverages Data Assets DATA LAKE ● Data “locked up” in legacy technologies ● Data is accessed and processed consistently ● Expensive and cumbersome process ● Increased velocity, agility
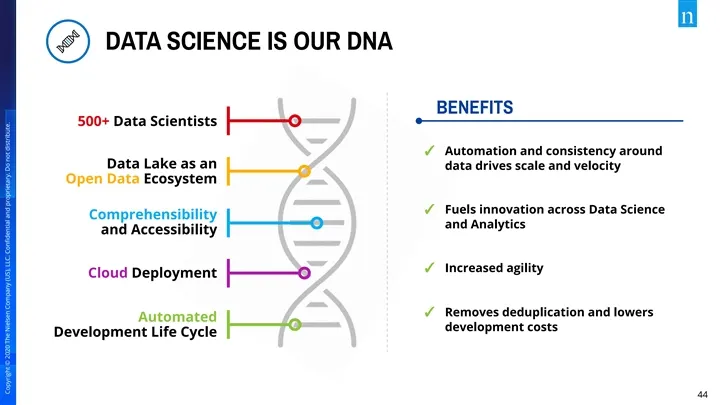
Slide 44: Data Science Is Our DNA
DATA SCIENCE IS OUR DNA BENEFITS 500+ Data Scientists ✓ Automation and consistency around Data Lake as an data drives scale and velocity Open Data Ecosystem ✓ Fuels innovation across Data Science Comprehensibility and Analytics and Accessibility ✓ Increased agility Cloud Deployment ✓ Removes dedupli
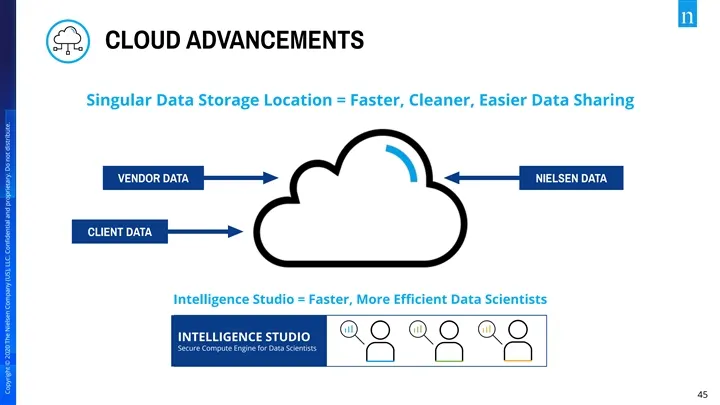
Slide 45: Cloud Advancements
CLOUD ADVANCEMENTS Singular Data Storage Location = Faster, Cleaner, Easier Data Sharing VENDOR DATA NIELSEN DATA CLIENT DATA Intelligence Studio = Faster, More Efficient Data Scientists INTELLIGENCE STUDIO Secure Compute Engine for Data Scientists 45 Copyright © 2020 The Nielsen Company (US), LLC. Co
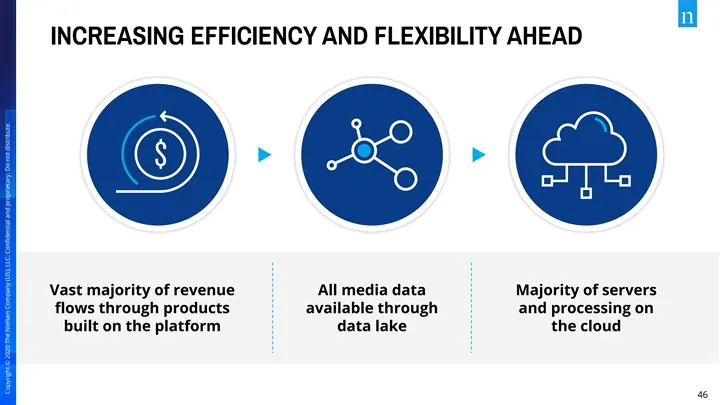
Slide 46: Increasing Efficiency and Flexibility Ahead
INCREASING EFFICIENCY AND FLEXIBILITY AHEAD Vast majority of revenue All media data Majority of servers flows through products available through and processing on built on the platform data lake the cloud 46 Copyright © 2020 The Nielsen Company (US), LLC. Confidential and proprietary. Do not distribut
Slide 47: Data Science Transformation
DATA SCIENCE TRANSFORMATION Mainak Mazumdar Chief Data and Research Officer Copyright © 2020 The Nielsen Company (US), LLC. Confidential and proprietary. Do not distribute. 47 Copyright © 2020 The Nielsen Company (US), LLC. Confidential and proprietary. Do not distribute. DATA SCIENCE TRANSFORMATION Mai
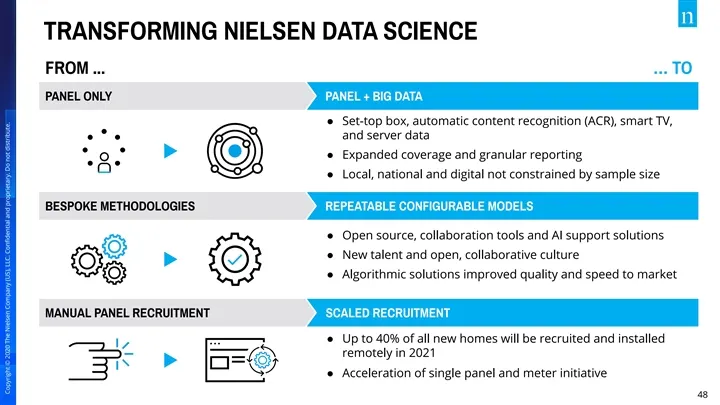
Slide 48: Transforming Nielsen Data Science
TRANSFORMING NIELSEN DATA SCIENCE FROM ... … TO PANEL ONLY PANEL + BIG DATA ● Set-top box, automatic content recognition (ACR), smart TV, and server data ● Expanded coverage and granular reporting ● Local, national and digital not constrained by sample size BESPOKE METHODOLOGIES REPEATABLE CONFIGURA
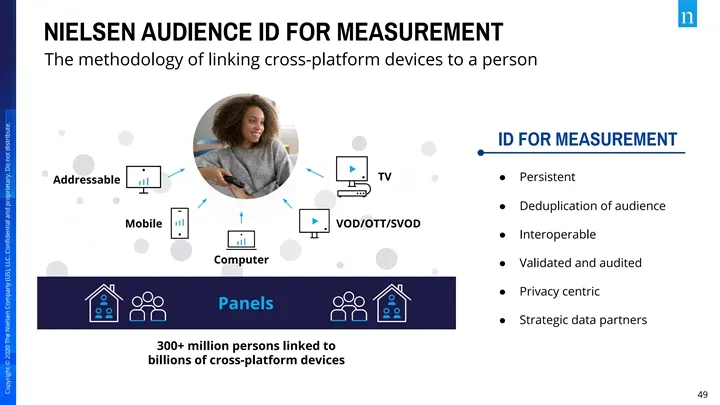
Slide 49: Nielsen Audience ID for Measurement
NIELSEN AUDIENCE ID FOR MEASUREMENT The methodology of linking cross-platform devices to a person ID for Measurement ID FOR MEASUREMENT ● Persistent TV ● Persistent Addressable ● Deduplication of audience ● Interoperable ● Deduplication of audience ● Validated and audited Mobile VOD/OTT/SVOD ● Inter
Slide 50: Audience and Content: The Knowledge Graph
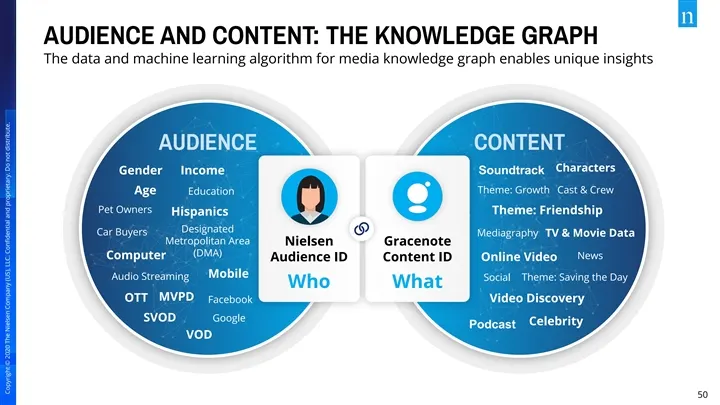
AUDIENCE AND CONTENT: THE KNOWLEDGE GRAPH The data and machine learning algorithm for media knowledge graph enables unique insights AUDIENCE CONTENT Characters Soundtrack Gender Income Theme: Growth Cast & Crew Age Education Pet Owners Theme: Friendship Hispanics Designated Car Buyers Mediagraphy TV
Slide 51: Example: Audience and Content ID Inform Content Creators
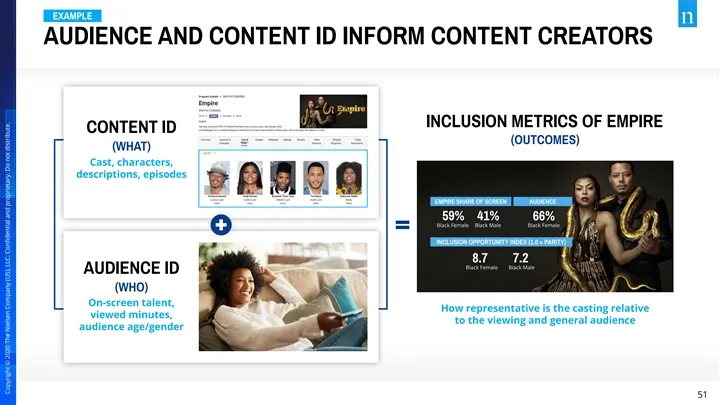
EXAMPLE AUDIENCE AND CONTENT ID INFORM CONTENT CREATORS INCLUSION METRICS OF EMPIRE CONTENT ID (OUTCOMES) (WHAT) Cast, characters, descriptions, episodes AUDIENCE ID (WHO) On-screen talent, How representative is the casting relative viewed minutes, to the viewing and general audience audience age/ge
Slide 52: Product Offering Transformation
PRODUCT OFFERING TRANSFORMATION Eric Bosco Chief Product Officer Copyright © 2020 The Nielsen Company (US), LLC. Confidential and proprietary. Do not distribute. 52 Copyright © 2020 The Nielsen Company (US), LLC. Confidential and proprietary. Do not distribute. PRODUCT OFFERING TRANSFORMATION Eric Bosco
Slide 53: Audience Is Everything: Strategic Framework
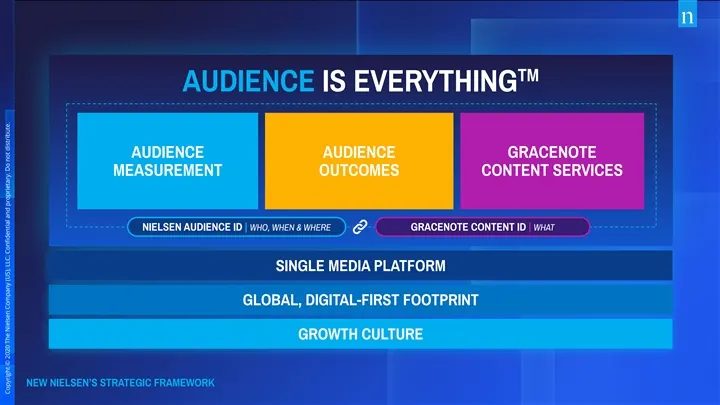
TM AUDIENCE IS EVERYTHING AUDIENCE AUDIENCE GRACENOTE MEASUREMENT OUTCOMES CONTENT SERVICES NIELSEN AUDIENCE ID | WHO, WHEN & WHERE GRACENOTE CONTENT ID | WHAT SINGLE MEDIA PLATFORM GLOBAL, DIGITAL-FIRST FOOTPRINT GROWTH CULTURE NEW NIELSEN’S STRATEGIC FRAMEWORK 53 Copyright © 2020 The Nielsen Compa
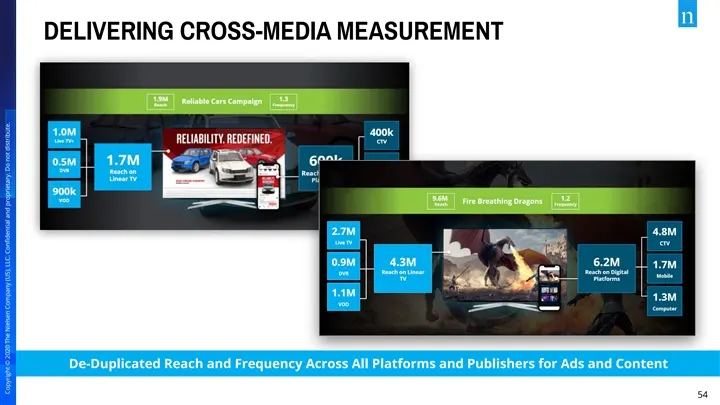
Slide 54: Delivering Cross-Media Measurement
DELIVERING CROSS-MEDIA MEASUREMENT De-Duplicated Reach and Frequency Across All Platforms and Publishers for Ads and Content 54 Copyright © 2020 The Nielsen Company (US), LLC. Confidential and proprietary. Do not distribute.DELIVERING CROSS-MEDIA MEASUREMENT De-Duplicated Reach and Frequency Across A
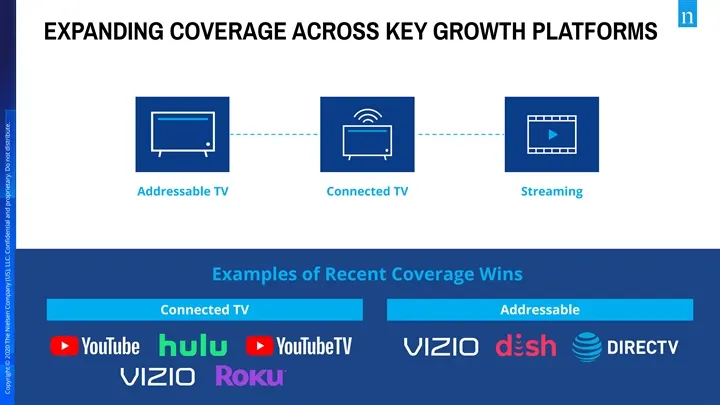
Slide 55: Expanding Coverage Across Key Growth Platforms
EXPANDING COVERAGE ACROSS KEY GROWTH PLATFORMS Addressable TV Connected TV Streaming Examples of Recent Coverage Wins Connected TV Addressable 55 Copyright © 2020 The Nielsen Company (US), LLC. Confidential and proprietary. Do not distribute.EXPANDING COVERAGE ACROSS KEY GROWTH PLATFORMS Addressable
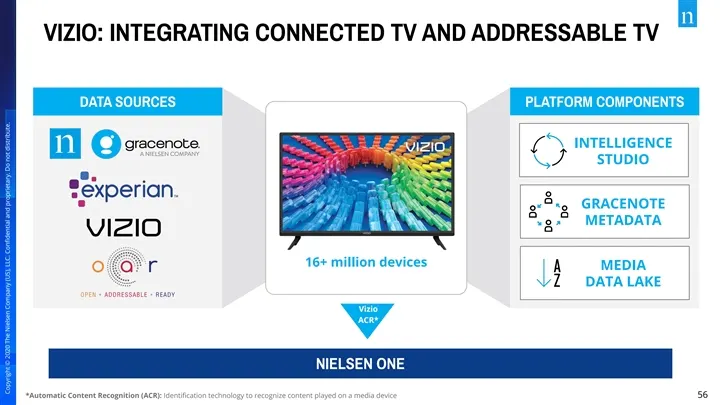
Slide 56: Vizio: Integrating Connected TV and Addressable TV
VIZIO: INTEGRATING CONNECTED TV AND ADDRESSABLE TV DATA SOURCES PLATFORM COMPONENTS INTELLIGENCE STUDIO GRACENOTE METADATA 16+ million devices MEDIA DATA LAKE Vizio ACR* NIELSEN ONE *Automatic Content Recognition (ACR): Identification technology to recognize content played on a media device 56 Copyri
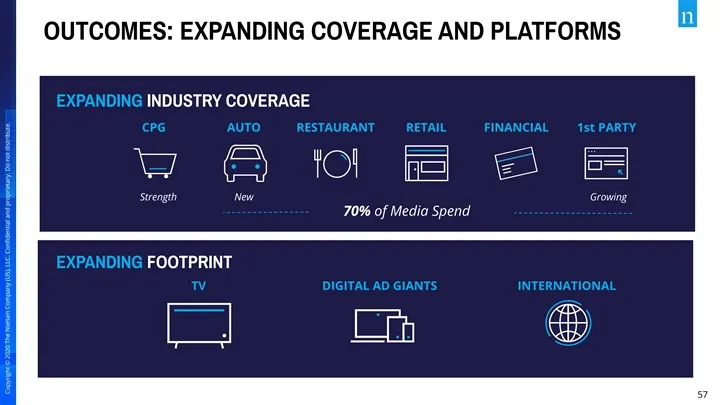
Slide 57: Outcomes: Expanding Coverage and Platforms
OUTCOMES: EXPANDING COVERAGE AND PLATFORMS EXPANDING INDUSTRY COVERAGE CPG AUTO RESTAURANT RETAIL FINANCIAL 1st PARTY Strength New Growing 70% of Media Spend EXPANDING FOOTPRINT TV DIGITAL AD GIANTS INTERNATIONAL 57 Copyright © 2020 The Nielsen Company (US), LLC. Confidential and proprietary. Do not
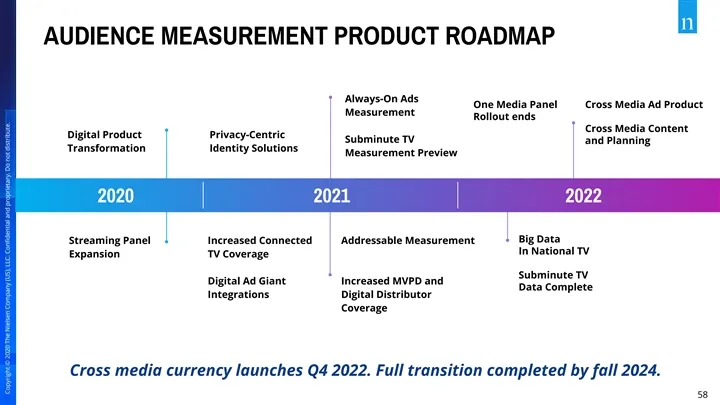
Slide 58: Audience Measurement Product Roadmap
AUDIENCE MEASUREMENT PRODUCT ROADMAP Always-On Ads One Media Panel Cross Media Ad Product 2022 Measurement Rollout ends Cross Media Content Digital Product Privacy-Centric Subminute TV and Planning Transformation Identity Solutions Measurement Preview 2020 2021 2022 Outcomes Measurement Big Data Str
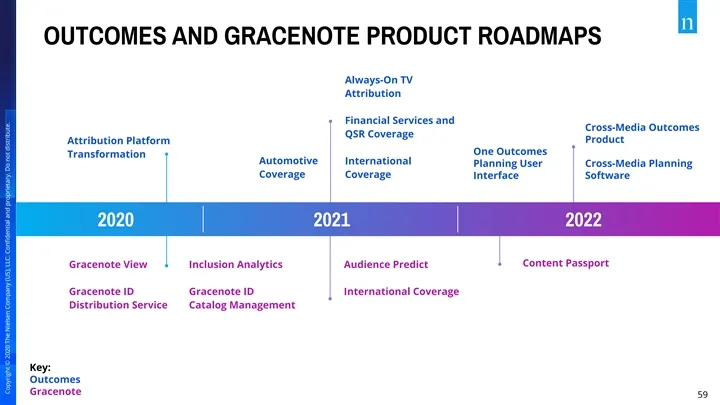
Slide 59: Outcomes and Gracenote Product Roadmaps
OUTCOMES AND GRACENOTE PRODUCT ROADMAPS Always-On TV Attribution Financial Services and Cross-Media Outcomes QSR Coverage 2022 Product Attribution Platform One Outcomes Transformation Automotive International Planning User Cross-Media Planning Coverage Coverage Interface Software 2020 2021 2022 Outc
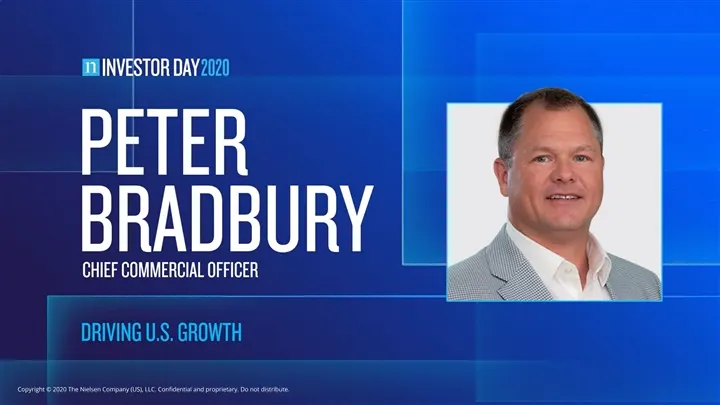
Slide 60: Driving U.S. Growth
DRIVING U.S. GROWTH Peter Bradbury Chief Commercial Officer Copyright © 2020 The Nielsen Company (US), LLC. Confidential and proprietary. Do not distribute. 60 Copyright © 2020 The Nielsen Company (US), LLC. Confidential and proprietary. Do not distribute. DRIVING U.S. GROWTH Peter Bradbury Chief Commer
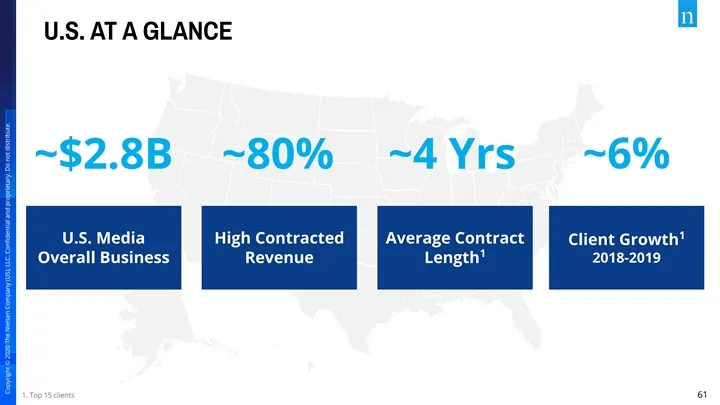
Slide 61: U.S. at a Glance
U.S. AT A GLANCE ~$2.8B ~80% ~4 Yrs ~6% 1 U.S. Media High Contracted Average Contract Client Growth 1 Overall Business Revenue Length 2018-2019 1. Top 15 clients 61 Copyright © 2020 The Nielsen Company (US), LLC. Confidential and proprietary. Do not distribute.U.S. AT A GLANCE ~$2.8B ~80% ~4 Yrs ~6%
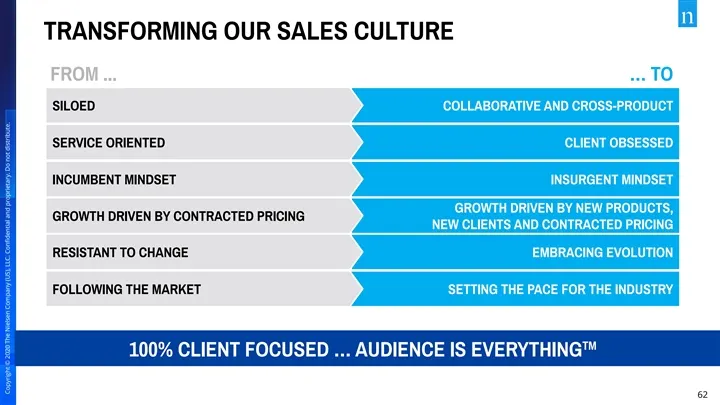
Slide 62: Transforming Our Sales Culture
TRANSFORMING OUR SALES CULTURE FROM ... … TO SILOED COLLABORATIVE AND CROSS-PRODUCT SERVICE ORIENTED CLIENT OBSESSED INCUMBENT MINDSET INSURGENT MINDSET GROWTH DRIVEN BY NEW PRODUCTS, GROWTH DRIVEN BY CONTRACTED PRICING NEW CLIENTS AND CONTRACTED PRICING RESISTANT TO CHANGE EMBRACING EVOLUTION FOLLO
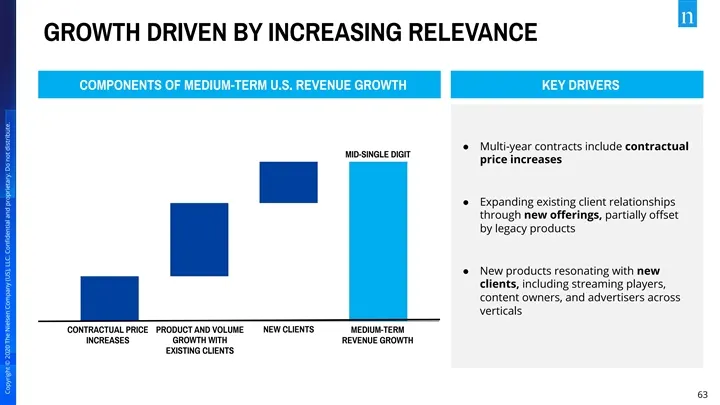
Slide 63: Growth Driven by Increasing Relevance
GROWTH DRIVEN BY INCREASING RELEVANCE COMPONENTS OF MEDIUM-TERM U.S. REVENUE GROWTH KEY DRIVERS ● Multi-year contracts include contractual MID-SINGLE DIGIT price increases ● Expanding existing client relationships through new offerings, partially offset by legacy products ● New products resonating wit
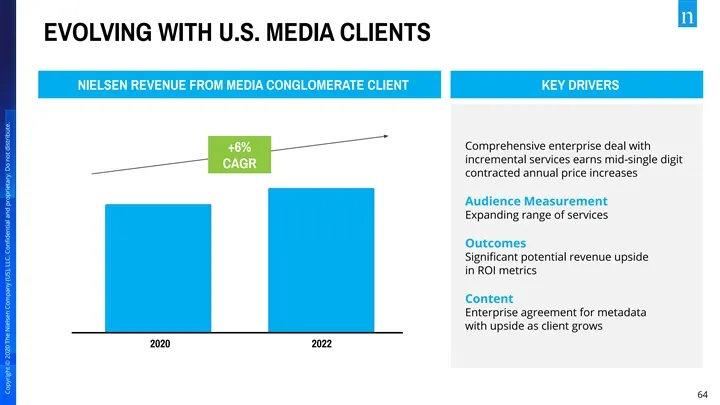
Slide 64: Evolving with U.S. Media Clients
EVOLVING WITH U.S. MEDIA CLIENTS NIELSEN REVENUE FROM MEDIA CONGLOMERATE CLIENT KEY DRIVERS Comprehensive enterprise deal with +6% incremental services earns mid-single digit CAGR contracted annual price increases Audience Measurement Expanding range of services Outcomes Significant potential revenue
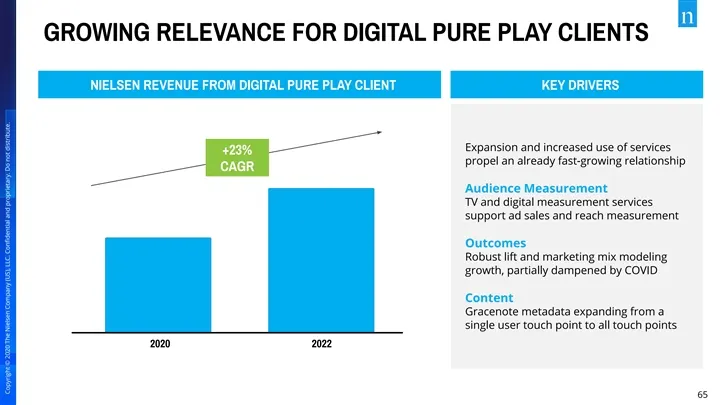
Slide 65: Growing Relevance for Digital Pure Play Clients
GROWING RELEVANCE FOR DIGITAL PURE PLAY CLIENTS NIELSEN REVENUE FROM DIGITAL PURE PLAY CLIENT KEY DRIVERS Expansion and increased use of services +23% propel an already fast-growing relationship CAGR Audience Measurement TV and digital measurement services support ad sales and reach measurement Outc
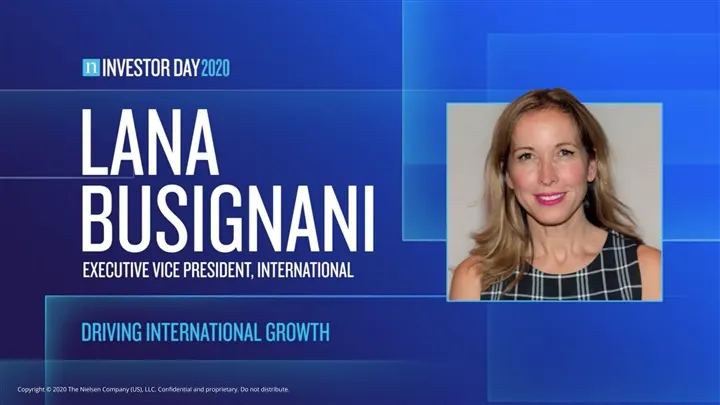
Slide 66: Driving International Growth
DRIVING INTERNATIONAL GROWTH Lana Busignani Executive Vice President, International Copyright © 2020 The Nielsen Company (US), LLC. Confidential and proprietary. Do not distribute. 66 Copyright © 2020 The Nielsen Company (US), LLC. Confidential and proprietary. Do not distribute. DRIVING INTERNATIONAL
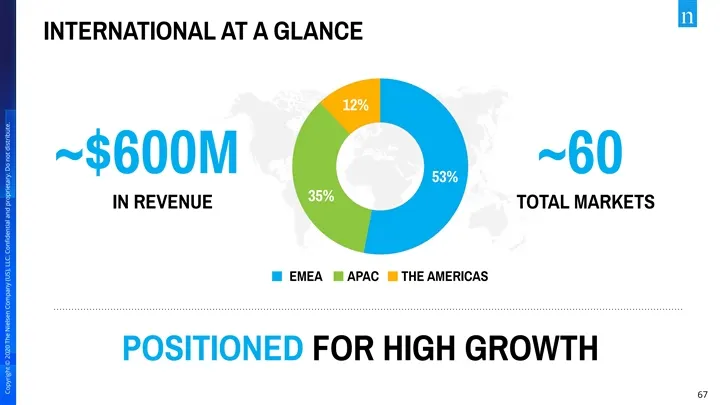
Slide 67: International at a Glance
INTERNATIONAL AT A GLANCE 12% ~$600M ~60 53% 35% IN REVENUE TOTAL MARKETS EMEA APAC THE AMERICAS POSITIONED FOR HIGH GROWTH 67 Copyright © 2020 The Nielsen Company (US), LLC. Confidential and proprietary. Do not distribute.INTERNATIONAL AT A GLANCE 12% ~$600M ~60 53% 35% IN REVENUE TOTAL MARKETS EMEA
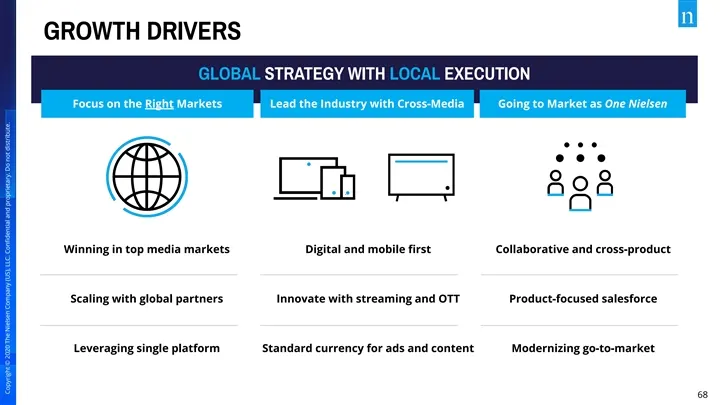
Slide 68: Growth Drivers: Global Strategy with Local Execution
GROWTH DRIVERS GLOBAL STRATEGY WITH LOCAL EXECUTION Focus on the Right Markets Lead the Industry with Cross-Media Going to Market as One Nielsen Winning in top media markets Digital and mobile first Collaborative and cross-product Scaling with global partners Innovate with streaming and OTT Product-f
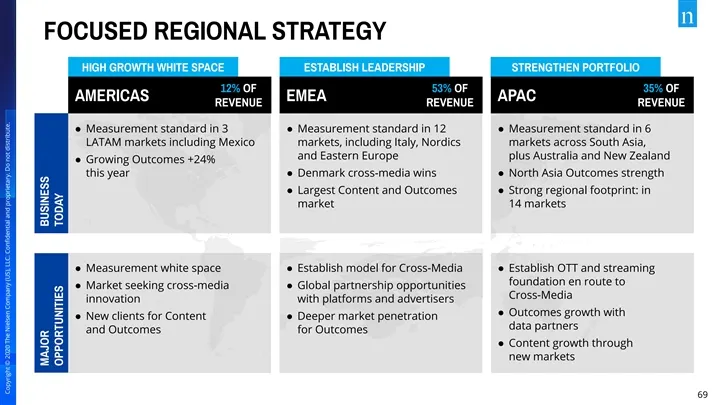
Slide 69: Focused Regional Strategy
FOCUSED REGIONAL STRATEGY HIGH GROWTH WHITE SPACE ESTABLISH LEADERSHIP STRENGTHEN PORTFOLIO 12% OF 53% OF 35% OF AMERICAS EMEA APAC REVENUE REVENUE REVENUE ● Measurement standard in 3 ● Measurement standard in 12 ● Measurement standard in 6 LATAM markets including Mexico markets, including Italy, No
Slide 70: Medium-Term Growth Drivers
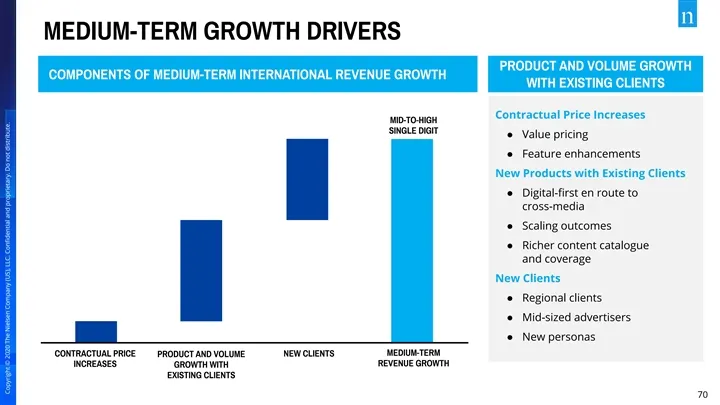
MEDIUM-TERM GROWTH DRIVERS PRODUCT AND VOLUME GROWTH COMPONENTS OF MEDIUM-TERM INTERNATIONAL REVENUE GROWTH WITH EXISTING CLIENTS Contractual Price Increases MID-TO-HIGH SINGLE DIGIT ● Value pricing ● Feature enhancements New Products with Existing Clients ● Digital-first en route to cross-media ● Sc
Slide 71: Financial Outlook
FINANCIAL OUTLOOK Linda Zukauckas Chief Financial Officer Copyright © 2020 The Nielsen Company (US), LLC. Confidential and proprietary. Do not distribute. 71 Copyright © 2020 The Nielsen Company (US), LLC. Confidential and proprietary. Do not distribute. FINANCIAL OUTLOOK Linda Zukauckas Chief Financial
Slide 72: Today's Discussion
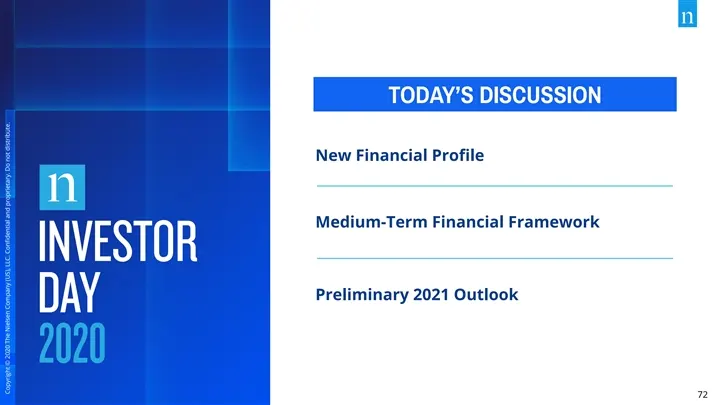
TODAY’S DISCUSSION New Financial Profile Medium-Term Financial Framework Preliminary 2021 Outlook 72 Copyright © 2020 The Nielsen Company (US), LLC. Confidential and proprietary. Do not distribute.TODAY’S DISCUSSION New Financial Profile Medium-Term Financial Framework Preliminary 2021 Outlook 72 Copyr
Slide 73: Shareholder Value Creation Framework
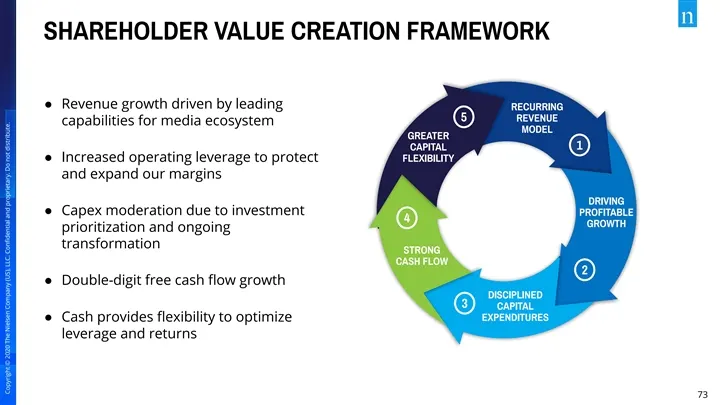
SHAREHOLDER VALUE CREATION FRAMEWORK ● Revenue growth driven by leading RECURRING 5 REVENUE capabilities for media ecosystem MODEL GREATER 1 CAPITAL ● Increased operating leverage to protect FLEXIBILITY and expand our margins DRIVING ● Capex moderation due to investment PROFITABLE 4 GROWTH prioritiz
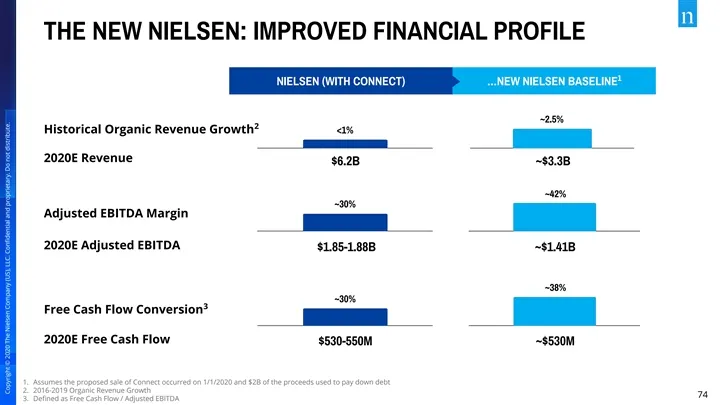
Slide 74: The New Nielsen: Improved Financial Profile
THE NEW NIELSEN: IMPROVED FINANCIAL PROFILE 1 NIELSEN (WITH CONNECT) …NEW NIELSEN BASELINE ~2.5% 2 Historical Organic Revenue Growth <1% 2020E Revenue $6.2B ~$3.3B ~42% ~30% Adjusted EBITDA Margin 2020E Adjusted EBITDA $1.85-1.88B ~$1.41B ~38% ~30% 3 Free Cash Flow Conversion 2020E Free Cash Flow $5
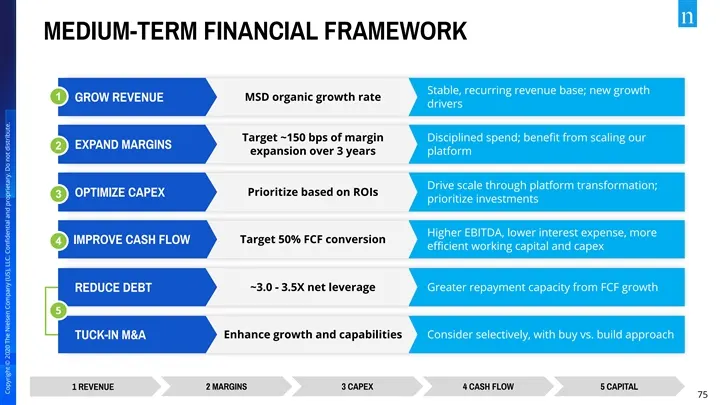
Slide 75: Medium-Term Financial Framework
MEDIUM-TERM FINANCIAL FRAMEWORK Stable, recurring revenue base; new growth 1 MSD organic growth rate GROW REVENUE drivers Target ~150 bps of margin Disciplined spend; benefit from scaling our EXPAND MARGINS 2 expansion over 3 years platform Drive scale through platform transformation; Prioritize base
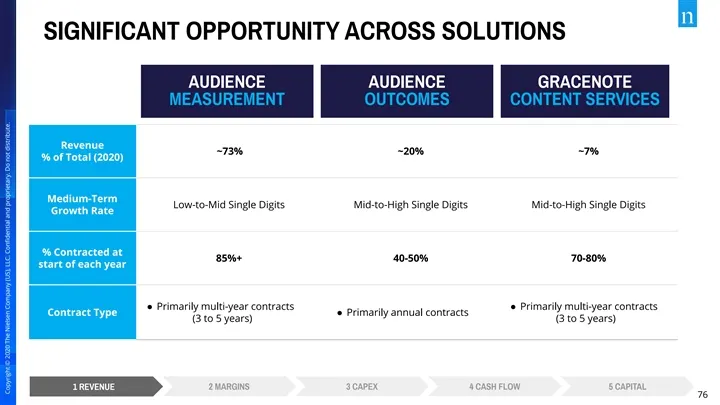
Slide 76: Significant Opportunity Across Solutions
SIGNIFICANT OPPORTUNITY ACROSS SOLUTIONS AUDIENCE AUDIENCE GRACENOTE MEASUREMENT OUTCOMES CONTENT SERVICES Revenue ~73%75 ~20% ~7% % of Total (2020) Medium-Term Low-to-Mid Single Digits Mid-to-High Single Digits Mid-to-High Single Digits Growth Rate % Contracted at 85%+ 40-50% 70-80% start of each y
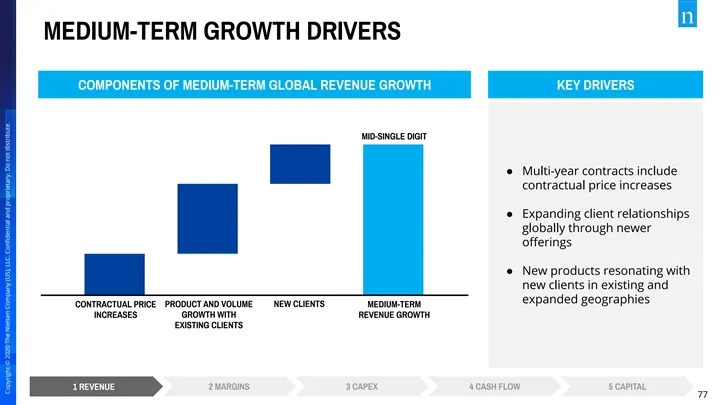
Slide 77: Medium-Term Growth Drivers
MEDIUM-TERM GROWTH DRIVERS COMPONENTS OF MEDIUM-TERM GLOBAL REVENUE GROWTH KEY DRIVERS MID-SINGLE DIGIT ● Multi-year contracts include contractual price increases ● Expanding client relationships globally through newer offerings ● New products resonating with new clients in existing and expanded geog
Slide 78: Strong Margins with Further Expansion
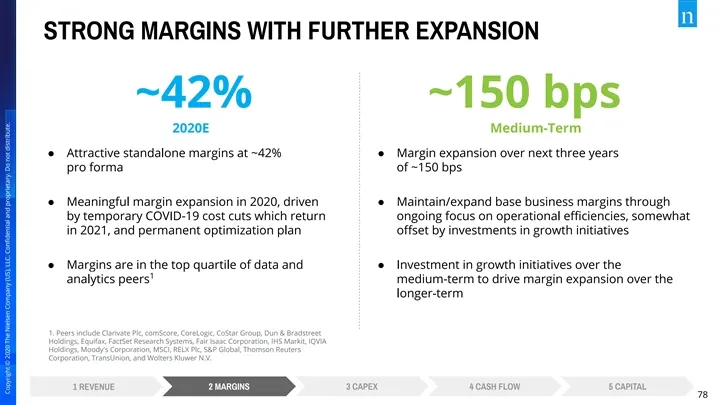
STRONG MARGINS WITH FURTHER EXPANSION ~42% ~150 bps 2020E Medium-Term ● Attractive standalone margins at ~42% ● Margin expansion over next three years pro forma of ~150 bps ● Meaningful margin expansion in 2020, driven ● Maintain/expand base business margins through by temporary COVID-19 cost cuts w
Slide 79: Focusing Capital Expenditures on Key Initiatives
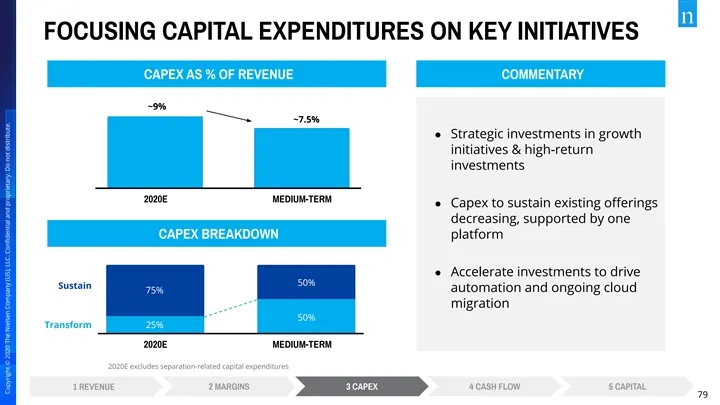
FOCUSING CAPITAL EXPENDITURES ON KEY INITIATIVES CAPEX AS % OF REVENUE COMMENTARY ~9% ~7.5% ● Strategic investments in growth initiatives & high-return investments 2020E MEDIUM-TERM ● Capex to sustain existing offerings decreasing, supported by one CAPEX BREAKDOWN platform ● Accelerate investments to
Slide 80: Multiple Levers to Improve FCF Conversion
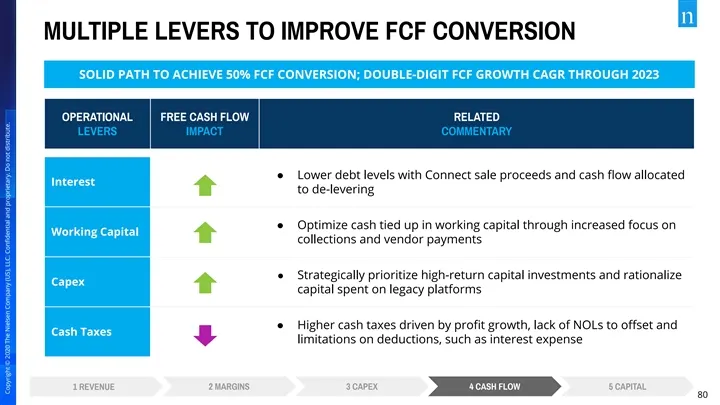
MULTIPLE LEVERS TO IMPROVE FCF CONVERSION SOLID PATH TO ACHIEVE 50% FCF CONVERSION; DOUBLE-DIGIT FCF GROWTH CAGR THROUGH 2023 OPERATIONAL FREE CASH FLOW RELATED LEVERS IMPACT COMMENTARY ● Lower debt levels with Connect sale proceeds and cash flow allocated Interest to de-levering ● Optimize cash tied
Slide 81: Near-Term Focus on De-Levering
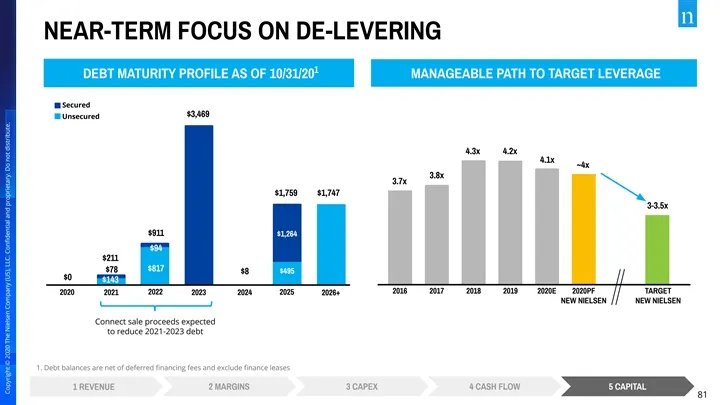
NEAR-TERM FOCUS ON DE-LEVERING 1 DEBT MATURITY PROFILE AS OF 10/31/20 MANAGEABLE PATH TO TARGET LEVERAGE Secured $3,469 Unsecured 4.3x 4.2x 4.1x ~4x 3.8x 3.7x $1,759 $1,747 3-3.5x $911 $1,264 $94 $211 $817 $78 $8 $495 $0 $143 2016 2017 2018 2019 2020E 2020PF TARGET 2020 2021 2022 2023 2024 2025 2026
Slide 82: A Balanced Capital Allocation Strategy
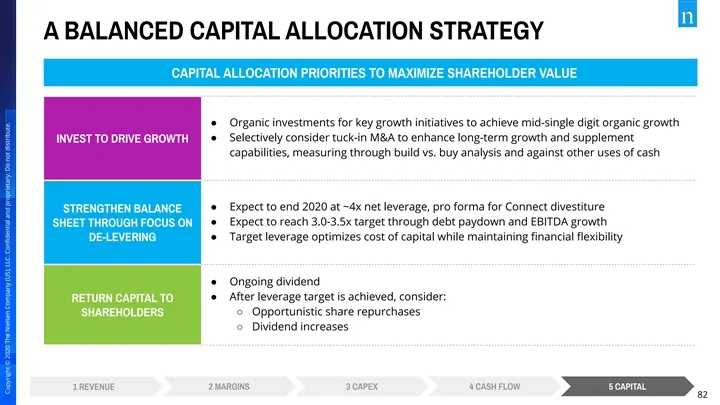
A BALANCED CAPITAL ALLOCATION STRATEGY CAPITAL ALLOCATION PRIORITIES TO MAXIMIZE SHAREHOLDER VALUE ● Organic investments for key growth initiatives to achieve mid-single digit organic growth ● Selectively consider tuck-in M&A to enhance long-term growth and supplement INVEST TO DRIVE GROWTH capabili
Slide 83: 2020 Pro Forma & 2021 Preliminary Outlook
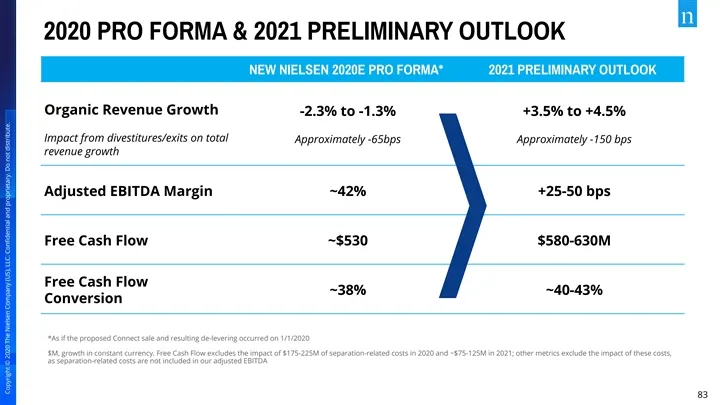
2020 PRO FORMA & 2021 PRELIMINARY OUTLOOK NEW NIELSEN 2020E PRO FORMA* 2021 PRELIMINARY OUTLOOK Organic Revenue Growth -2.3% to -1.3% +3.5% to +4.5% Impact from divestitures/exits on total Approximately -65bps Approximately -150 bps revenue growth Adjusted EBITDA Margin ~42% +25-50 bps Free Cash Flo
Slide 84: Driving Shareholder Value
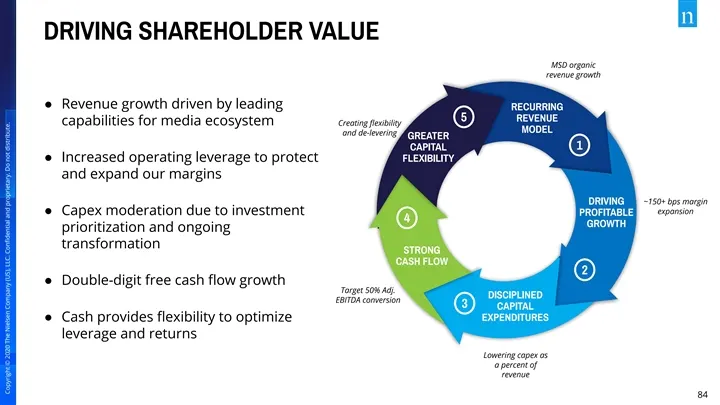
DRIVING SHAREHOLDER VALUE MSD organic revenue growth ● Revenue growth driven by leading RECURRING 5 REVENUE capabilities for media ecosystem Creating flexibility MODEL and de-levering GREATER 1 CAPITAL ● Increased operating leverage to protect FLEXIBILITY and expand our margins DRIVING ~150+ bps marg

Slide 85: Q&A
Q&A 85 Copyright © 2020 The Nielsen Company (US), LLC. Confidential and proprietary. Do not distribute. Copyright © 2020 The Nielsen Company (US), LLC. Confidential and proprietary. Do not distribute. Q&A 85 Copyright © 2020 The Nielsen Company (US), LLC. Confidential and proprietary. Do not distribute
Slide 86: Appendix
APPENDIX 86 Copyright © 2020 The Nielsen Company (US), LLC. Confidential and proprietary. Do not distribute. Copyright © 2020 The Nielsen Company (US), LLC. Confidential and proprietary. Do not distribute. APPENDIX 86 Copyright © 2020 The Nielsen Company (US), LLC. Confidential and proprietary. Do not
Slide 87: Certain Non-GAAP Measures
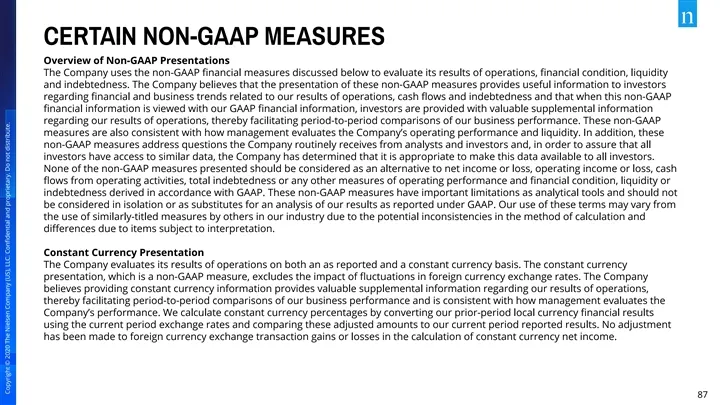
CERTAIN NON-GAAP MEASURES Overview of Non-GAAP Presentations The Company uses the non-GAAP financial measures discussed below to evaluate its results of operations, financial condition, liquidity and indebtedness. The Company believes that the presentation of these non-GAAP measures provides useful in
Slide 88: Certain Non-GAAP Measures (continued)
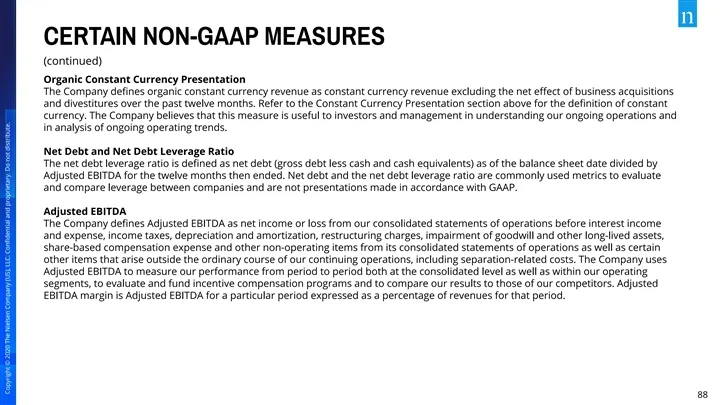
CERTAIN NON-GAAP MEASURES (continued) Organic Constant Currency Presentation The Company defines organic constant currency revenue as constant currency revenue excluding the net effect of business acquisitions and divestitures over the past twelve months. Refer to the Constant Currency Presentation se
Slide 89: Certain Non-GAAP Measures (continued)
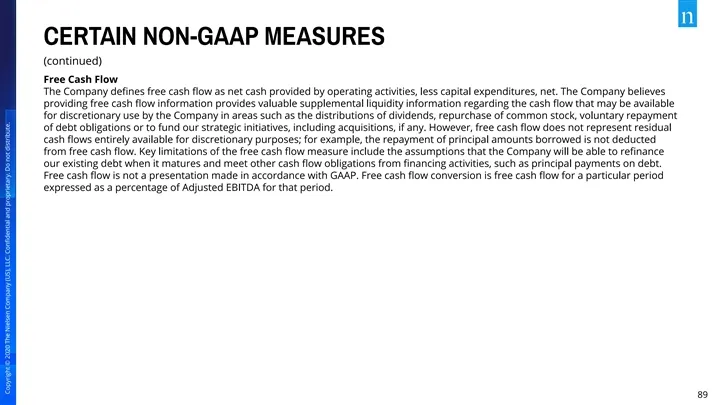
CERTAIN NON-GAAP MEASURES (continued) Free Cash Flow The Company defines free cash flow as net cash provided by operating activities, less capital expenditures, net. The Company believes providing free cash flow information provides valuable supplemental liquidity information regarding the cash flow tha
Slide 90: Revenue Reconciliation
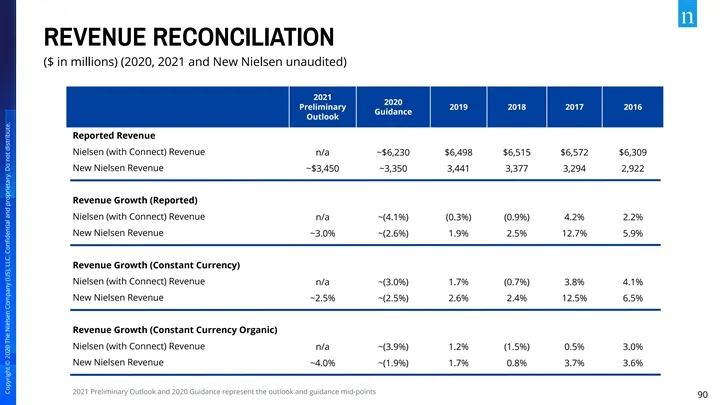
REVENUE RECONCILIATION ($ in millions) (2020, 2021 and New Nielsen unaudited) 2021 2020 Preliminary 2019 2018 2017 2016 Guidance Outlook Reported Revenue Nielsen (with Connect) Revenue n/a ~$6,230 $6,498 $6,515 $6,572 $6,309 New Nielsen Revenue ~$3,450 ~3,350 3,441 3,377 3,294 2,922 Revenue Growth (
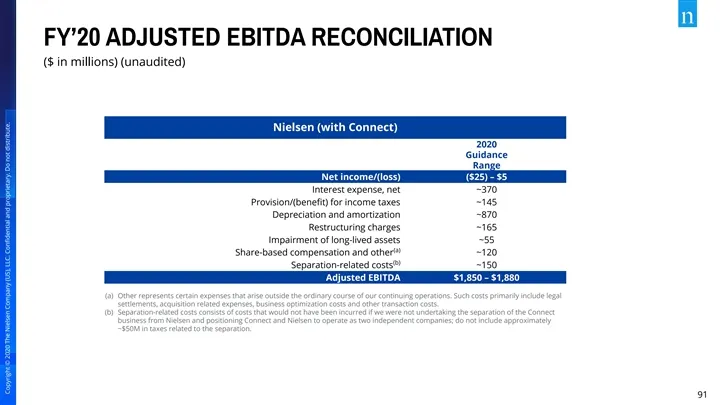
Slide 91: FY'20 Adjusted EBITDA Reconciliation
FY’20 ADJUSTED EBITDA RECONCILIATION ($ in millions) (unaudited) Nielsen (with Connect) 2020 Guidance Range Net income/(loss) ($25) – $5 Interest expense, net ~370 Provision/(benefit) for income taxes ~145 Depreciation and amortization ~870 Restructuring charges ~165 Impairment of long-lived assets ~
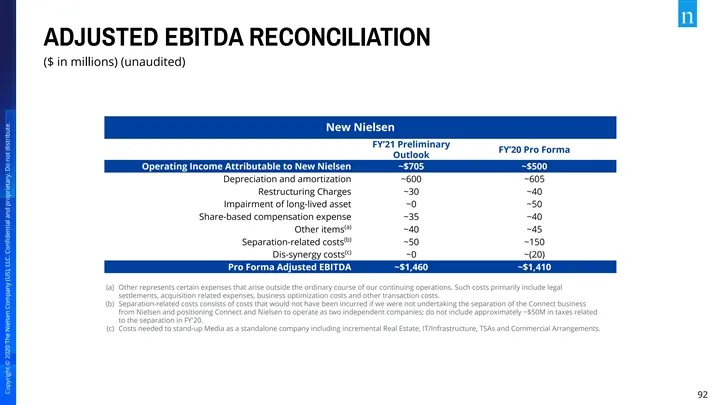
Slide 92: Adjusted EBITDA Reconciliation
ADJUSTED EBITDA RECONCILIATION ($ in millions) (unaudited) New Nielsen FY’21 Preliminary FY’20 Pro Forma Outlook Operating Income Attributable to New Nielsen ~$705 ~$500 Depreciation and amortization ~600 ~605 Restructuring Charges ~30 ~40 Impairment of long-lived asset ~0 ~50 Share-based compensati
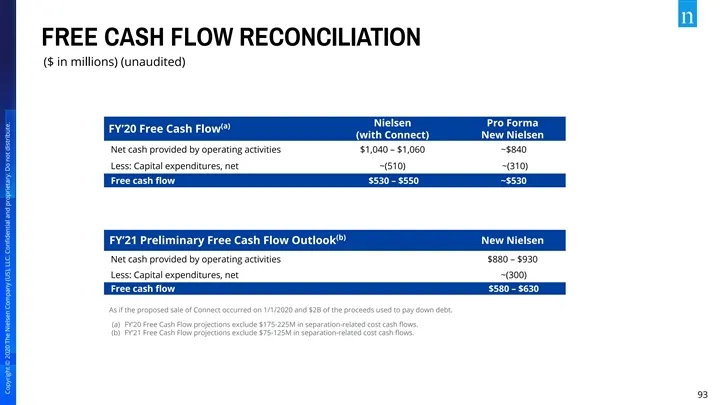
Slide 93: Free Cash Flow Reconciliation
FREE CASH FLOW RECONCILIATION ($ in millions) (unaudited) Nielsen Pro Forma (a) FY’20 Free Cash Flow (with Connect) New Nielsen Net cash provided by operating activities $1,040 – $1,060 ~$840 Less: Capital expenditures, net ~(510) ~(310) Free cash flow $530 – $550 ~$530 (b) FY’21 Preliminary Free Cas
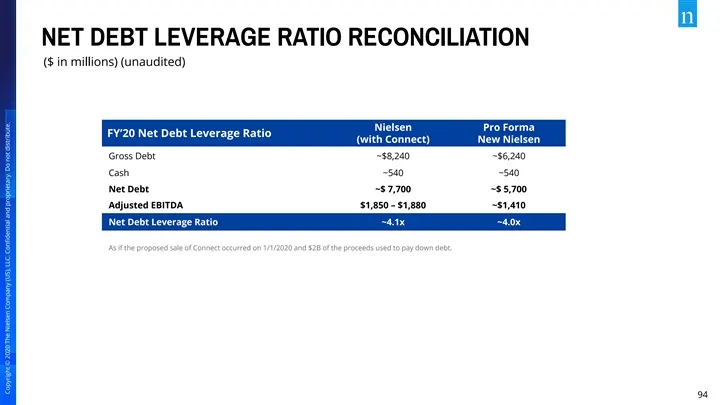
Slide 94: Net Debt Leverage Ratio Reconciliation
NET DEBT LEVERAGE RATIO RECONCILIATION ($ in millions) (unaudited) Nielsen Pro Forma FY’20 Net Debt Leverage Ratio (with Connect) New Nielsen Gross Debt ~$8,240 ~$6,240 Cash ~540 ~540 Net Debt ~$ 7,700 ~$ 5,700 Adjusted EBITDA $1,850 – $1,880 ~$1,410 Net Debt Leverage Ratio ~4.1x ~4.0x As if the pro
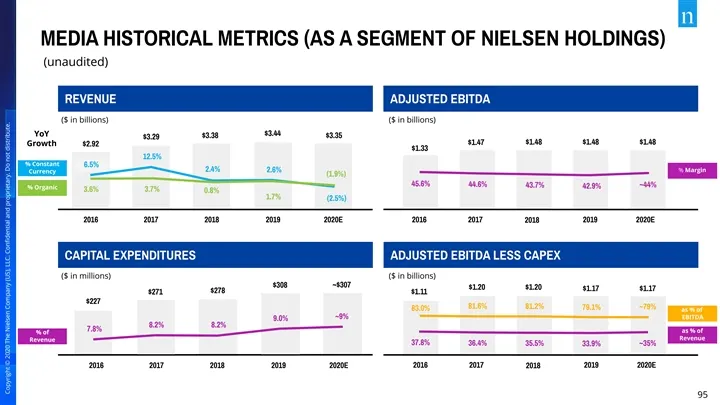
Slide 95: Media Historical Metrics
MEDIA HISTORICAL METRICS (AS A SEGMENT OF NIELSEN HOLDINGS) (unaudited) REVENUE ADJUSTED EBITDA ($ in billions) ($ in billions) $3.44 YoY $3.38 $3.35 $3.29 $1.47 $1.48 $1.48 $1.48 Growth $2.92 $1.33 12.5% % Constant 6.5% 2.4% 2.6% % Margin Currency (1.9%) 45.6% 44.6% ~44% 43.7% % Organic 42.9% 3.6%

Slide 96: Nielsen Investor Relations
NIELSEN INVESTOR RELATIONS ir@nielsen.com +1.646.654.8153 nielsen.com/investors 96 Copyright © 2020 The Nielsen Company (US), LLC. Confidential and proprietary. Do not distribute. NIELSEN INVESTOR RELATIONS ir@nielsen.com +1.646.654.8153 nielsen.com/investors 96 Copyright © 2020 The Nielsen Company (
Source: SEC EDGAR · 8-K filed Dec 9, 2020
More decks from Nielsen Holdings PLC
 Proxy Contest (April 2022)71 slides · Apr 26, 2022
 Q4 2021 Earnings Presentation29 slides · Feb 28, 2022
 Q3 2021 Earnings Presentation27 slides · Oct 28, 2021
 Q2 2021 Earnings Presentation27 slides · Jul 29, 2021
 Q1 2021 Earnings Presentation29 slides · May 6, 2021
 Q4 2020 Earnings Presentation34 slides · Feb 25, 2021