Lakeland Bancorp — Q3 2020 Earnings Presentation
22 slides from Lakeland Bancorp's earnings presentation, Oct 22, 2020
Slide 1: Third Quarter 2020 Investors Presentation
Exhibit 99.1 THIRD QUARTER 2020 INVESTORS PRESENTATION Exhibit 99.1 THIRD QUARTER 2020 INVESTORS PRESENTATION
Slide 2: Forward-Looking Statements
Forward-Looking Statements The information disclosed in this document, conditions nationally, regionally and in the including the statements regarding the Company’s markets, the nature and timing of prospective impact of COVID-19 includes various actions of the Federal Reserve Board and other forwar
Slide 3: Corporate Profile
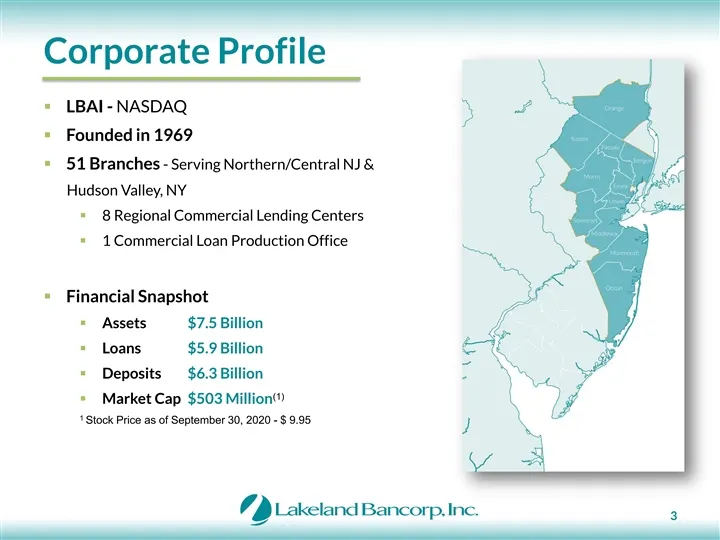
Corporate Profile § LBAI - NASDAQ § Founded in 1969 § 51 Branches - Serving Northern/Central NJ & Hudson Valley, NY § 8 Regional Commercial Lending Centers § 1 Commercial Loan Production Office § Financial Snapshot § Assets $7.5 Billion § Loans $5.9 Billion § Deposits $6.3 Billion (1) § Market Cap $

Slide 4: Who We Are
Who We Are Half a century after opening for business in Newfoundland, NJ. We have grown to a network of over 50 offices, committed to meeting the financial needs of local residents & businesses, and are proud to be characterized as the following. Traditional Commercial Bank Conservative & Consistent
Slide 5: Balanced Loan Portfolio
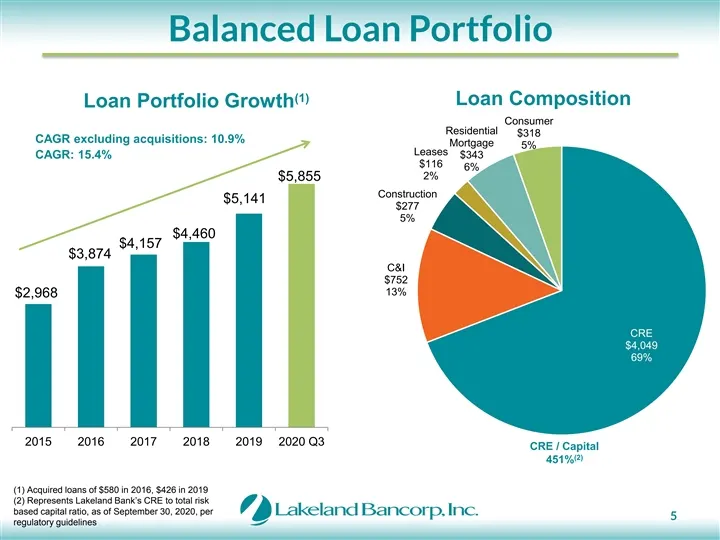
Balanced Loan Portfolio (1) Loan Composition Loan Portfolio Growth Consumer Residential $318 CAGR excluding acquisitions: 10.9% Mortgage 5% Leases $343 CAGR: 15.4% $116 6% 2% $5,855 Construction $5,141 $277 5% $4,460 $4,157 $3,874 C&I $752 13% $2,968 CRE $4,049 69% 2015 2016 2017 2018 2019 2020 Q3 C
Slide 6: Commercial Loan Portfolio
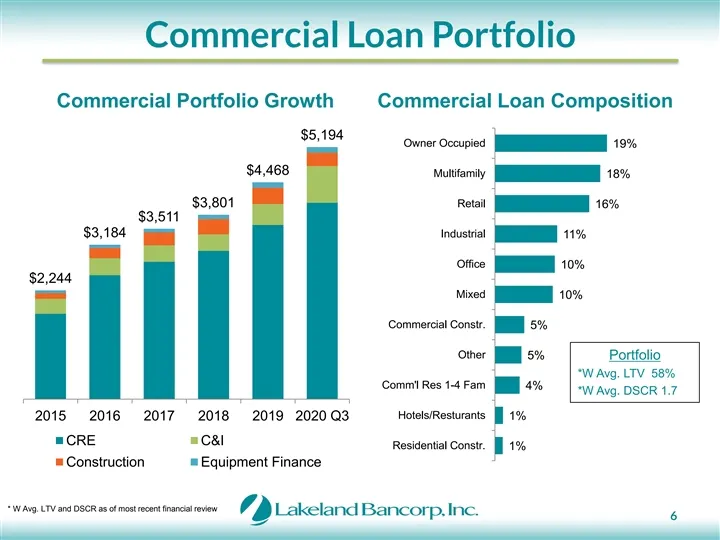
Commercial Loan Portfolio Commercial Portfolio Growth Commercial Loan Composition $5,194 Owner Occupied 19% $4,468 Multifamily 18% $3,801 Retail 16% $3,511 $3,184 Industrial 11% Office 10% $2,244 Mixed 10% Commercial Constr. 5% Other 5% Portfolio *W Avg. LTV 58% Comm'l Res 1-4 Fam 4% *W Avg. DSCR 1.
Slide 7: Commercial Loan Forbearance
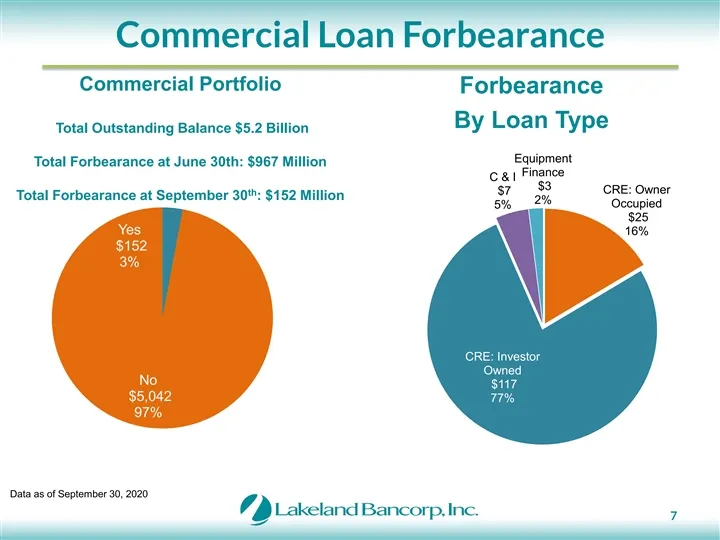
Commercial Loan Forbearance Commercial Portfolio Forbearance By Loan Type Total Outstanding Balance $5.2 Billion Equipment Total Forbearance at June 30th: $967 Million Finance C & I $3 CRE: Owner $7 th Total Forbearance at September 30 : $152 Million 2% Occupied 5% $25 Yes 16% $152 3% CRE: Investor
Slide 8: Commercial Loan Forbearance Detail
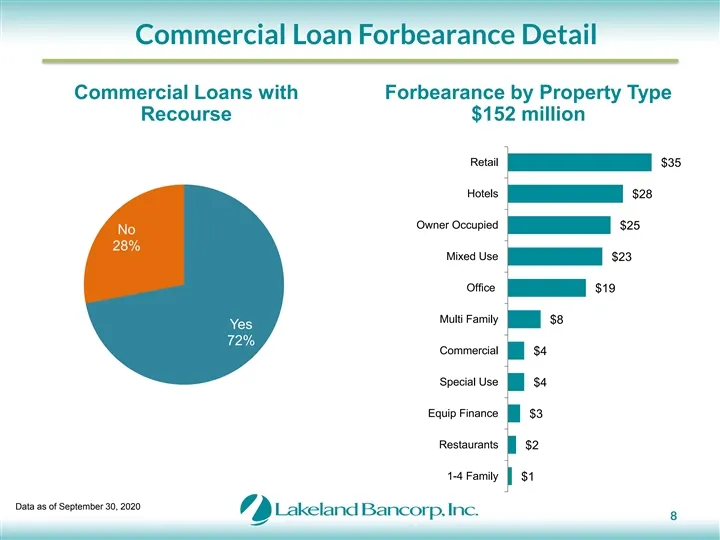
Commercial Loan Forbearance Detail Commercial Loans with Forbearance by Property Type Recourse $152 million Retail $35 Hotels $28 Owner Occupied $25 No 28% Mixed Use $23 Office $19 Multi Family $8 Yes 72% Commercial $4 Special Use $4 Equip Finance $3 Restaurants $2 1-4 Family $1 Data as of September
Slide 9: Commercial Loan Deferment
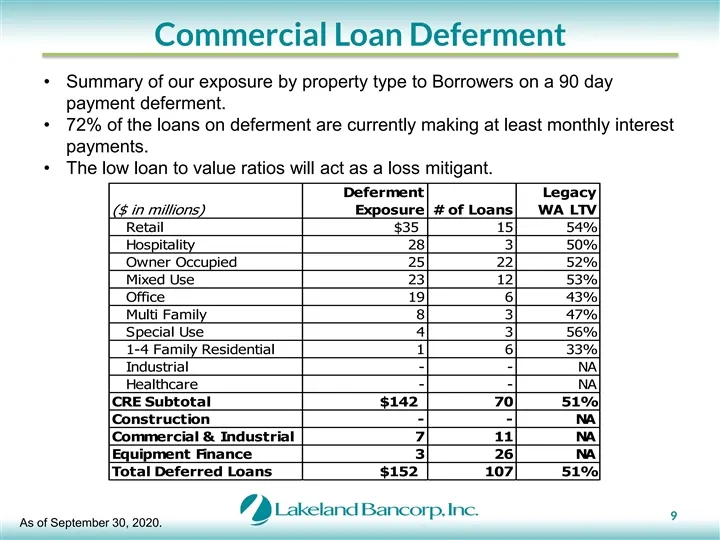
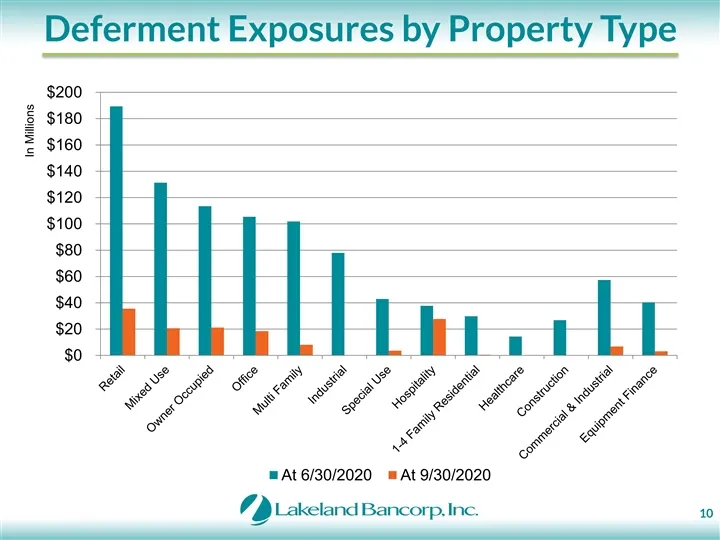
Commercial Loan Deferment • Summary of our exposure by property type to Borrowers on a 90 day payment deferment. • 72% of the loans on deferment are currently making at least monthly interest payments. • The low loan to value ratios will act as a loss mitigant. Deferment Legacy ($ in millions) Expos
Slide 10: Deferment Exposures by Property Type
Deferment Exposures by Property Type $200 $180 $160 $140 $120 $100 $80 $60 $40 $20 $0 At 6/30/2020 At 9/30/2020 10 In Millions Deferment Exposures by Property Type $200 $180 $160 $140 $120 $100 $80 $60 $40 $20 $0 At 6/30/2020 At 9/30/2020 10 In Millions
Slide 11: Residential and Consumer Loan Forbearance
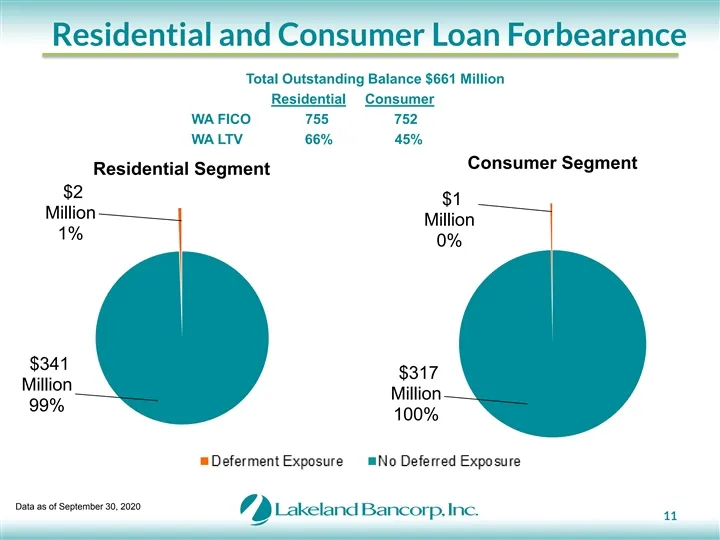
Residential and Consumer Loan Forbearance Total Outstanding Balance $661 Million Residential Consumer WA FICO 755 752 WA LTV 66% 45% Consumer Segment Residential Segment $2 $1 Million Million 1% 0% $341 $317 Million Million 99% 100% Data as of September 30, 2020 11 Residential and Consumer Loan Forb
Slide 12: Strong Asset Quality
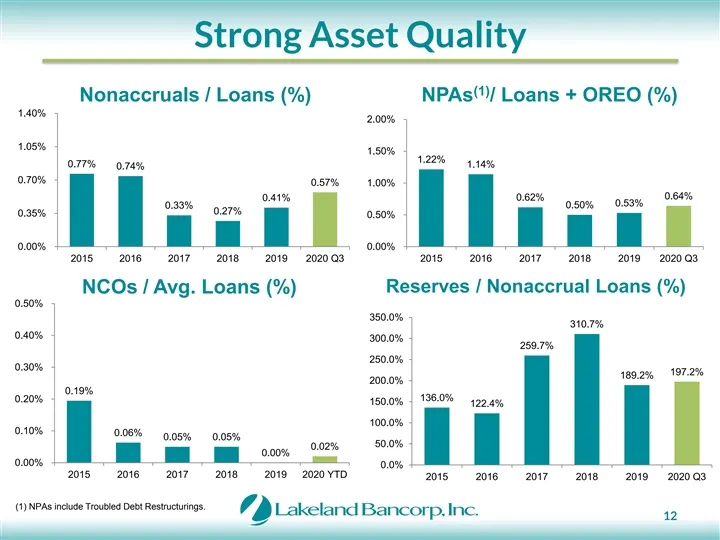
Strong Asset Quality (1) Nonaccruals / Loans (%) NPAs / Loans + OREO (%) 1.40% 2.00% 1.05% 1.50% 1.22% 0.77% 1.14% 0.74% 0.70% 0.57% 1.00% 0.64% 0.41% 0.62% 0.53% 0.50% 0.33% 0.27% 0.35% 0.50% 0.00% 0.00% 2015 2016 2017 2018 2019 2020 Q3 2015 2016 2017 2018 2019 2020 Q3 Reserves / Nonaccrual Loans (
Slide 13: Core Deposit Focus
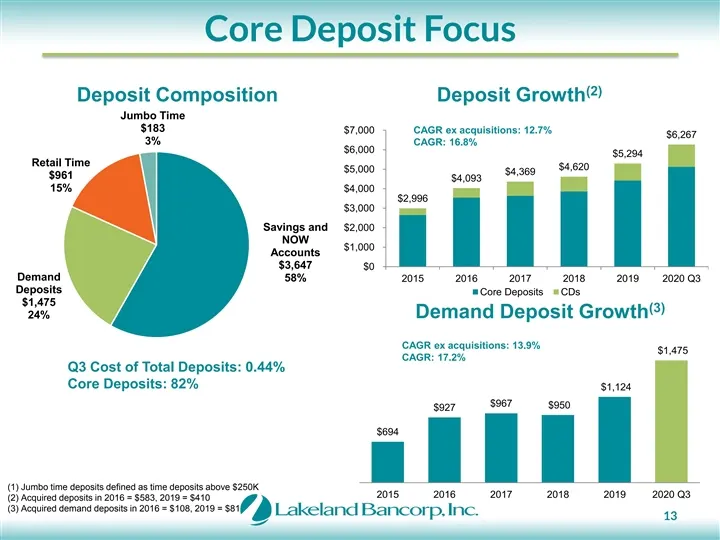
Core Deposit Focus (2) Deposit Composition Deposit Growth Jumbo Time $183 $7,000 CAGR ex acquisitions: 12.7% $6,267 3% CAGR: 16.8% $6,000 $5,294 Retail Time $4,620 $5,000 $4,369 $961 $4,093 15% $4,000 $2,996 $3,000 Savings and $2,000 NOW $1,000 Accounts $3,647 $0 Demand 58% 2015 2016 2017 2018 2019
Slide 14: NJ Deposit Market Share
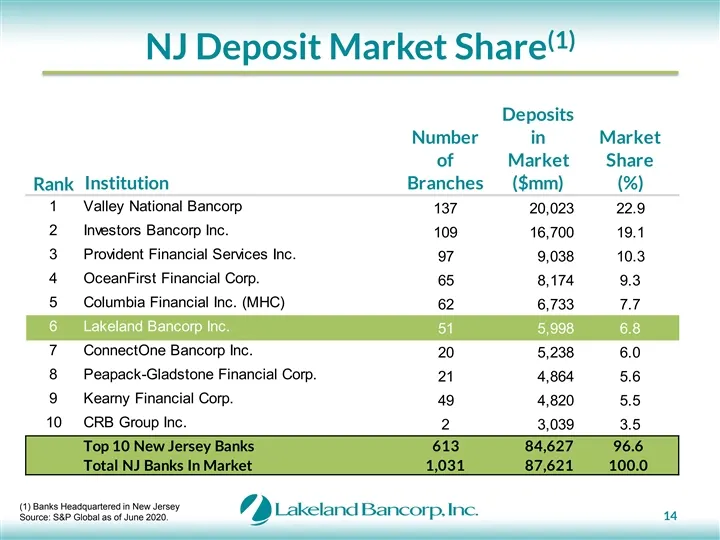
(1) NJ Deposit Market Share Deposits Number in Market of Market Share Institution Branches ($mm) (%) Rank 1 Valley National Bancorp 137 2 0,023 22.9 2 Investors Bancorp Inc. 109 16,700 19.1 3 Provident Financial Services Inc. 97 9,038 10.3 4 OceanFirst Financial Corp. 65 8,174 9.3 5 Columbia Financi
Slide 15: Investment Securities Portfolio
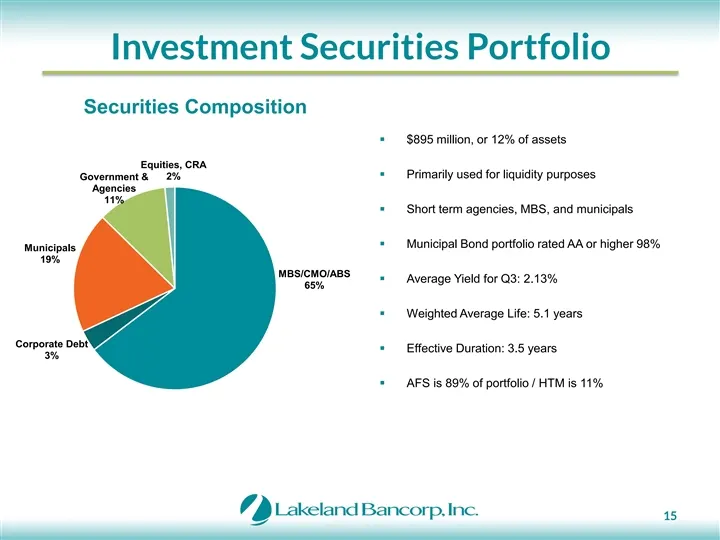
Investment Securities Portfolio Securities Composition § $895 million, or 12% of assets Equities, CRA § Primarily used for liquidity purposes Government & 2% Agencies 11% § Short term agencies, MBS, and municipals § Municipal Bond portfolio rated AA or higher 98% Municipals 19% MBS/CMO/ABS § Average
Slide 16: Mergers & Acquisitions
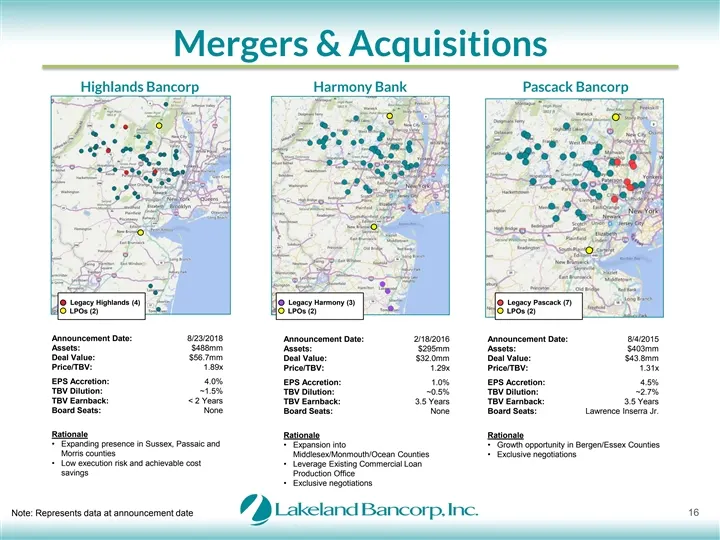
Mergers & Acquisitions Highlands Bancorp Harmony Bank Pascack Bancorp 0 120 131 Legacy Highlands (4) Legacy Harmony (3) Legacy Pascack (7) LPOs (2) LPOs (2) LPOs (2) Announcement Date: 8/23/2018 Announcement Date: 2/18/2016 Announcement Date: 8/4/2015 Assets: $488mm Assets: $295mm Assets: $403mm Dea
Slide 17: Franchise Growth
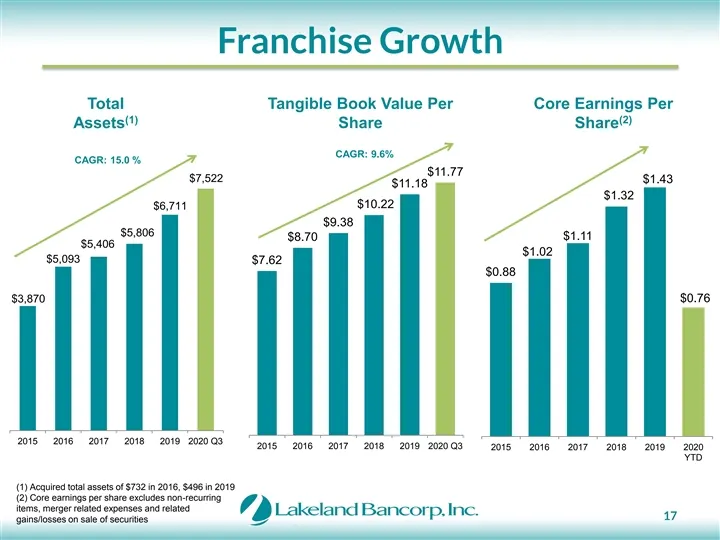
Franchise Growth Total Tangible Book Value Per Core Earnings Per (1) (2) Assets Share Share CAGR: 9.6% CAGR: 15.0 % $11.77 $7,522 $1.43 $11.18 $1.32 $10.22 $6,711 $9.38 $5,806 $1.11 $8.70 $5,406 $1.02 $5,093 $7.62 $0.88 $0.76 $3,870 2015 2016 2017 2018 2019 2020 Q3 2015 2016 2017 2018 2019 2020 Q3 2
Slide 18: Consistent Profitability
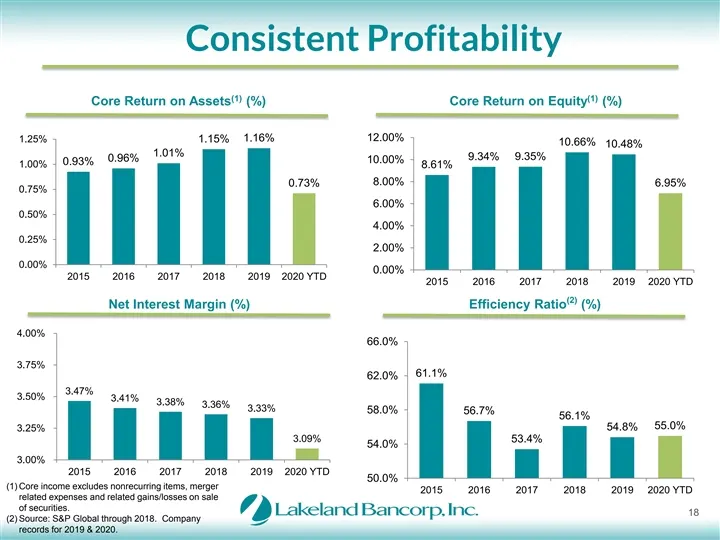
Consistent Profitability (1) (1) Core Return on Assets (%) Core Return on Equity (%) 12.00% 1.25% 1.16% 1.15% 10.66% 10.48% 1.01% 9.34% 9.35% 0.96% 10.00% 0.93% 1.00% 8.61% 8.00% 0.73% 6.95% 0.75% 6.00% 0.50% 4.00% 0.25% 2.00% 0.00% 0.00% 2015 2016 2017 2018 2019 2020 YTD 2015 2016 2017 2018 2019 20
Slide 19: 2020 Quarter Highlights
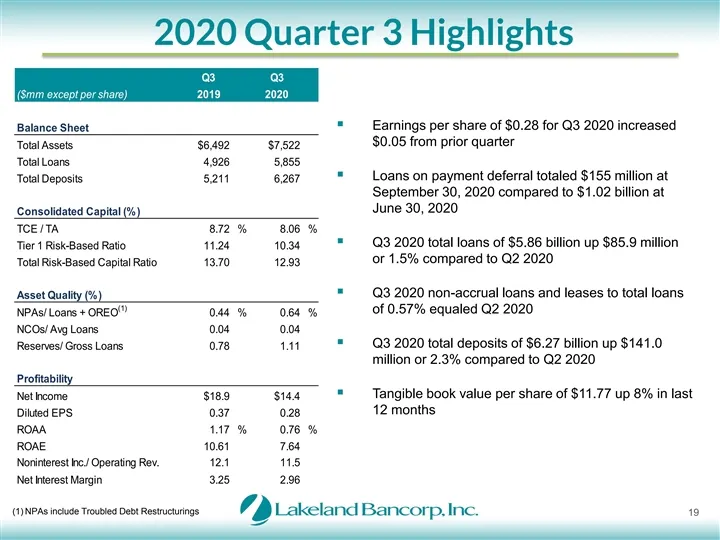
2020 Quarter 3 Highlights Q3 Q3 ($mm except per share) 2019 2020 § Earnings per share of $0.28 for Q3 2020 increased Balance Sheet $0.05 from prior quarter Total Assets $6,492 $7,522 Total Loans 4,926 5,855 § Loans on payment deferral totaled $155 million at Total Deposits 5,211 6,267 September 30,
Slide 20: Dividend History
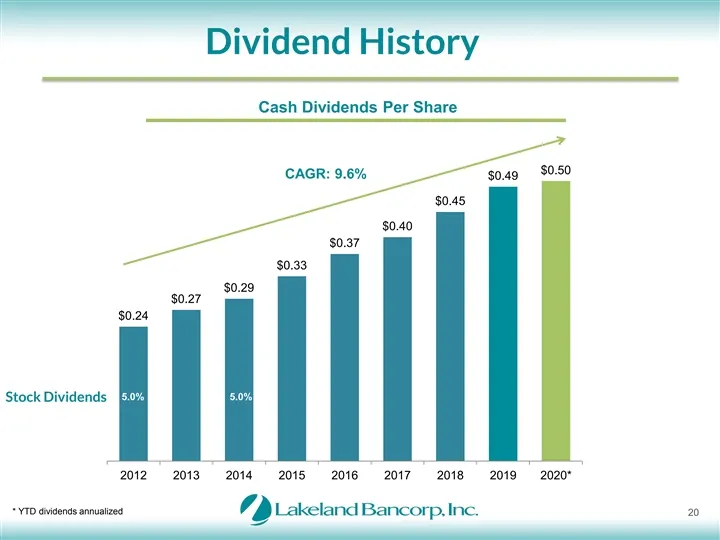
Dividend History Cash Dividends Per Share $0.50 CAGR: 9.6% $0.49 $0.45 $0.40 $0.37 $0.33 $0.29 $0.27 $0.24 5.0% 5.0% Stock Dividends 2012 2013 2014 2015 2016 2017 2018 2019 2020* * YTD dividends annualized 20 Dividend History Cash Dividends Per Share $0.50 CAGR: 9.6% $0.49 $0.45 $0.40 $0.37 $0.33 $0
Slide 21: LBAI Executive Summary
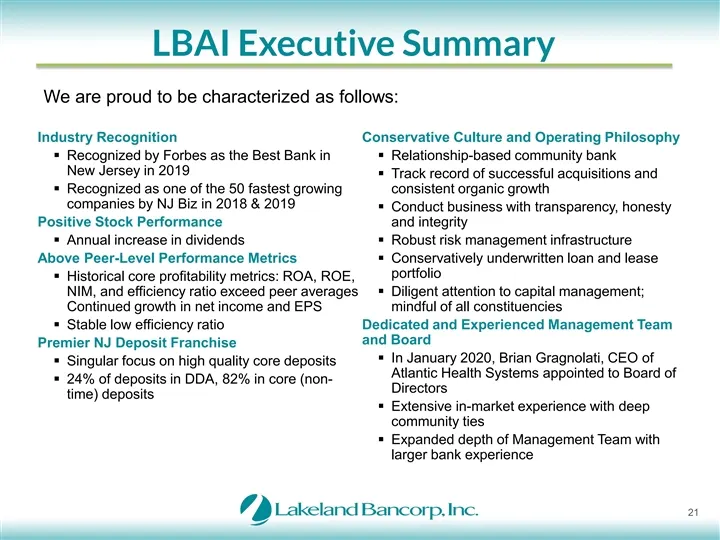
LBAI Executive Summary We are proud to be characterized as follows: Industry Recognition Conservative Culture and Operating Philosophy § Recognized by Forbes as the Best Bank in § Relationship-based community bank New Jersey in 2019 § Track record of successful acquisitions and § Recognized as one o

Slide 22: Oak Ridge Road | Oak Ridge, NJ 07438 | t: 973-697-2000 | LakelandBank.com |
250 Oak Ridge Road | Oak Ridge, NJ 07438 | t: 973-697-2000 | LakelandBank.com | Stock symbol: LBAI 250 Oak Ridge Road | Oak Ridge, NJ 07438 | t: 973-697-2000 | LakelandBank.com | Stock symbol: LBAI
Source: SEC EDGAR · 8-K filed Oct 22, 2020
More decks from Lakeland Bancorp Inc
 Merger or Acquisition (September 2022)26 slides · Sep 27, 2022
 Q4 2021 Earnings Presentation18 slides · Jan 26, 2022
 Q3 2021 Earnings Presentation18 slides · Oct 26, 2021
 IPO Roadshow (September 2021)33 slides · Sep 8, 2021
 Debt Investor Presentation (September 2021)31 slides · Sep 7, 2021
 Merger or Acquisition (July 2021)12 slides · Jul 12, 2021