Home Point Capital — Investor Presentation (March 2021)
29 slides from Home Point Capital's investor presentation, Mar 25, 2021
Slide 1: Confidential Investor Presentation March 2021
Confidential Investor Presentation March 2021
Slide 2: Forward-Looking Statements
Forward-Looking Statements 2 This presentation contains certain “forward-looking statements,” as that term is defined in the U.S. federal securities laws. In addition, from time to time, Home Point Capital Inc. (“we,” “our,” “us” or the “Company”) or its representatives have made, or may make, forwa
Slide 3: Home Point Capital at a Glance
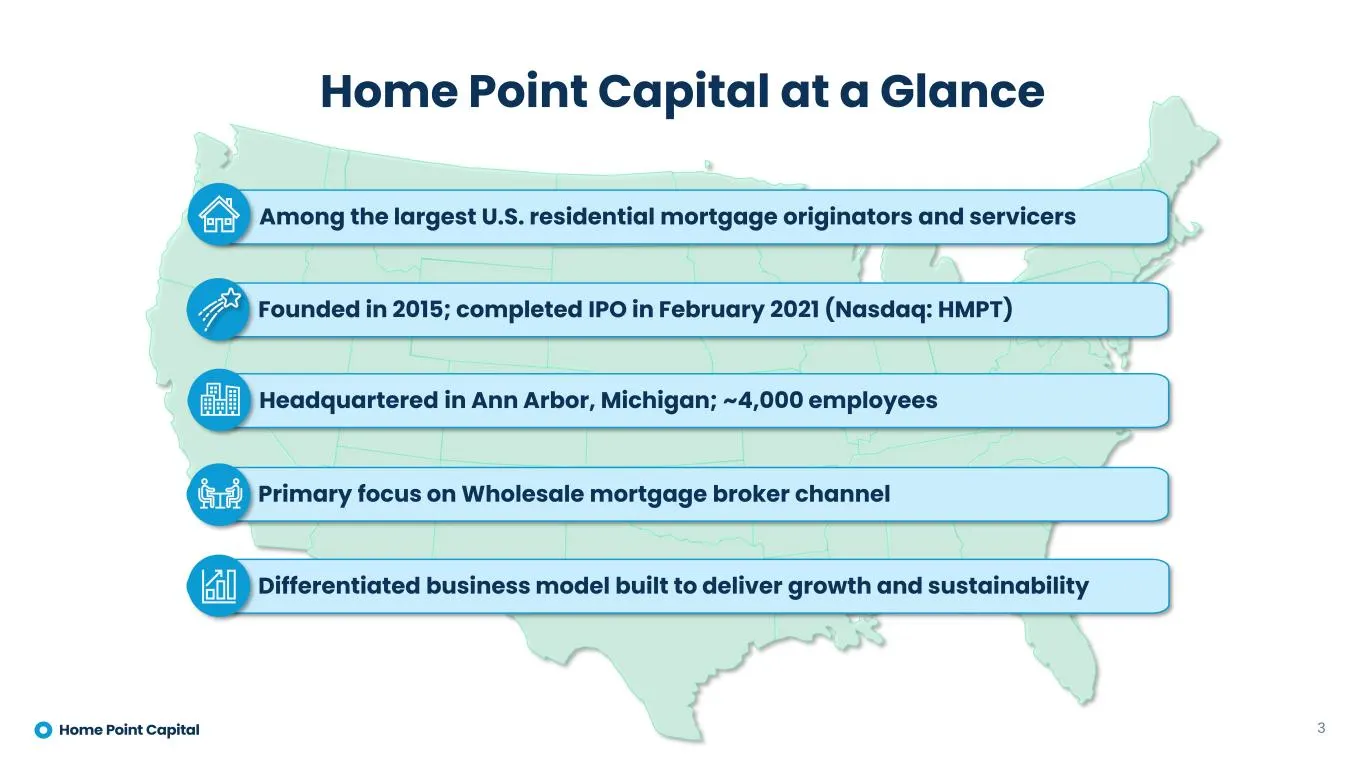
Home Point Capital at a Glance 3 Among the largest U.S. residential mortgage originators and servicers Founded in 2015; completed IPO in February 2021 (Nasdaq: HMPT) Headquartered in Ann Arbor, Michigan; ~4,000 employees Primary focus on Wholesale mortgage broker channel Differentiated business mode
Slide 4: A Different, Better Kind of Mortgage Company
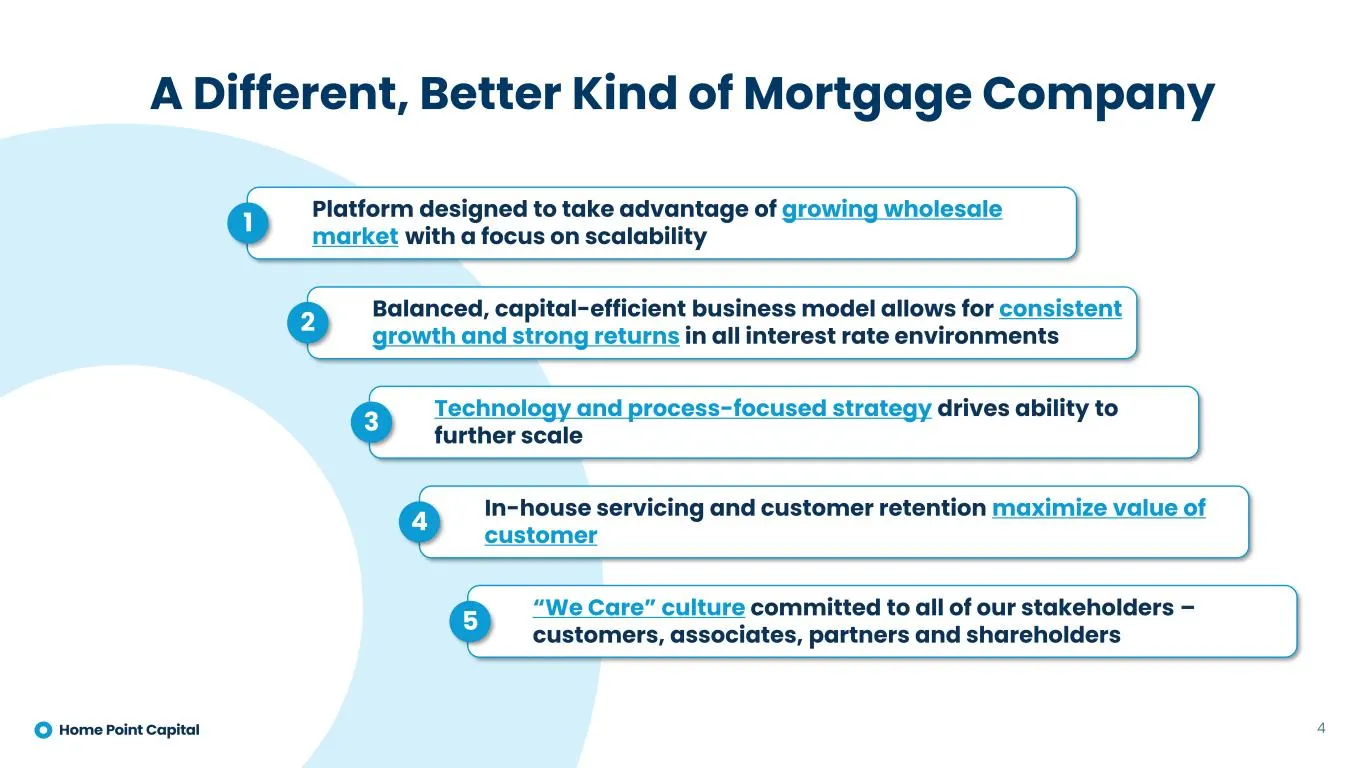
4 Balanced, capital-efficient business model allows for consistent growth and strong returns in all interest rate environments2 In-house servicing and customer retention maximize value of customer4 “We Care” culture committed to all of our stakeholders – customers, associates, partners and sharehold
Slide 5: Home Point Capital by the Numbers
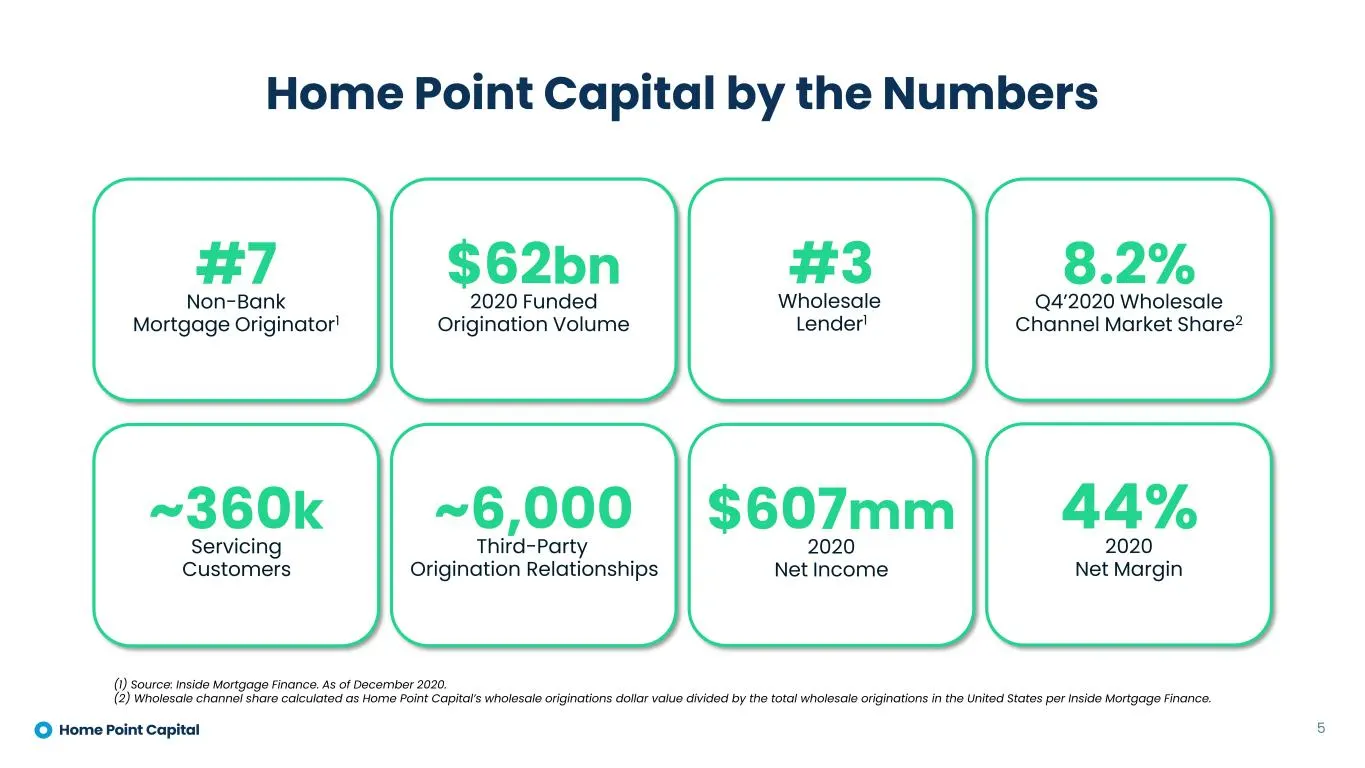
Home Point Capital by the Numbers $62bn 2020 Funded Origination Volume 8.2% Q4’2020 Wholesale Channel Market Share2 ~360k Servicing Customers $607mm 2020 Net Income 44% 2020 Net Margin 5 #7 Non-Bank Mortgage Originator1 ~6,000 Third-Party Origination Relationships #3 Wholesale Lender1 (1) Source: In
Slide 6: Platform Built to Support Sustainable Growth
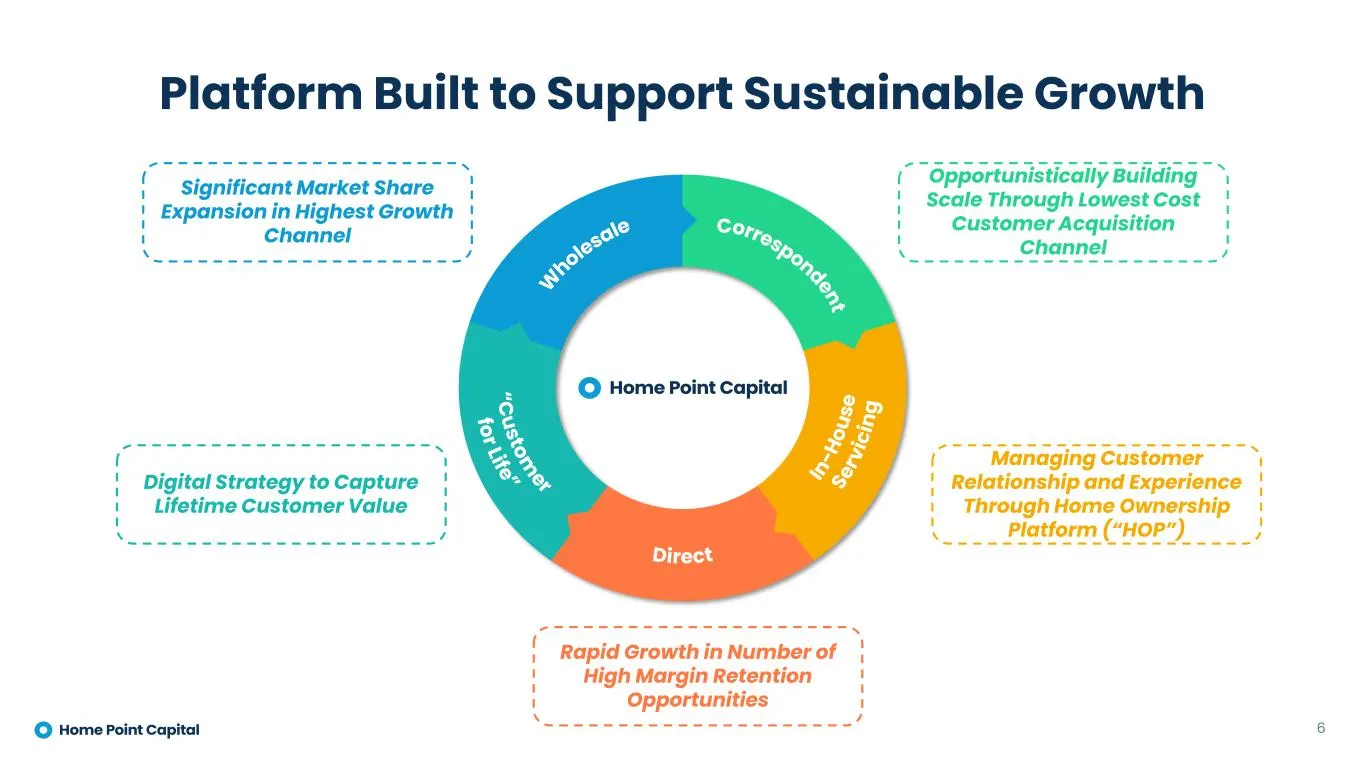
Platform Built to Support Sustainable Growth 6 Significant Market Share Expansion in Highest Growth Channel Opportunistically Building Scale Through Lowest Cost Customer Acquisition Channel Managing Customer Relationship and Experience Through Home Ownership Platform (“HOP”) Rapid Growth in Number o
Slide 7: Our Mission is to Create Financially Healthy, Happy Homeowners
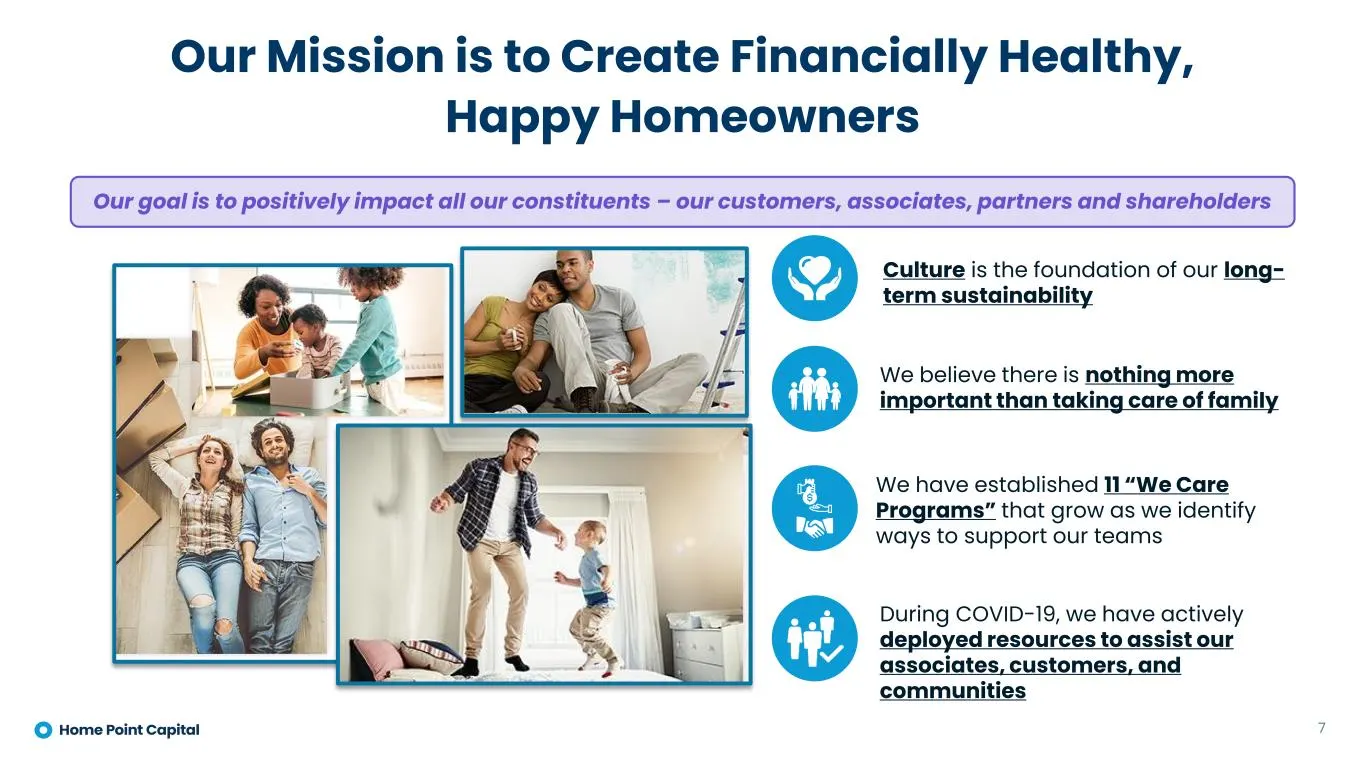
Our Mission is to Create Financially Healthy, Happy Homeowners 7 Culture is the foundation of our long- term sustainability Our goal is to positively impact all our constituents – our customers, associates, partners and shareholders We believe there is nothing more important than taking care of fami
Slide 8: Massive Addressable Market
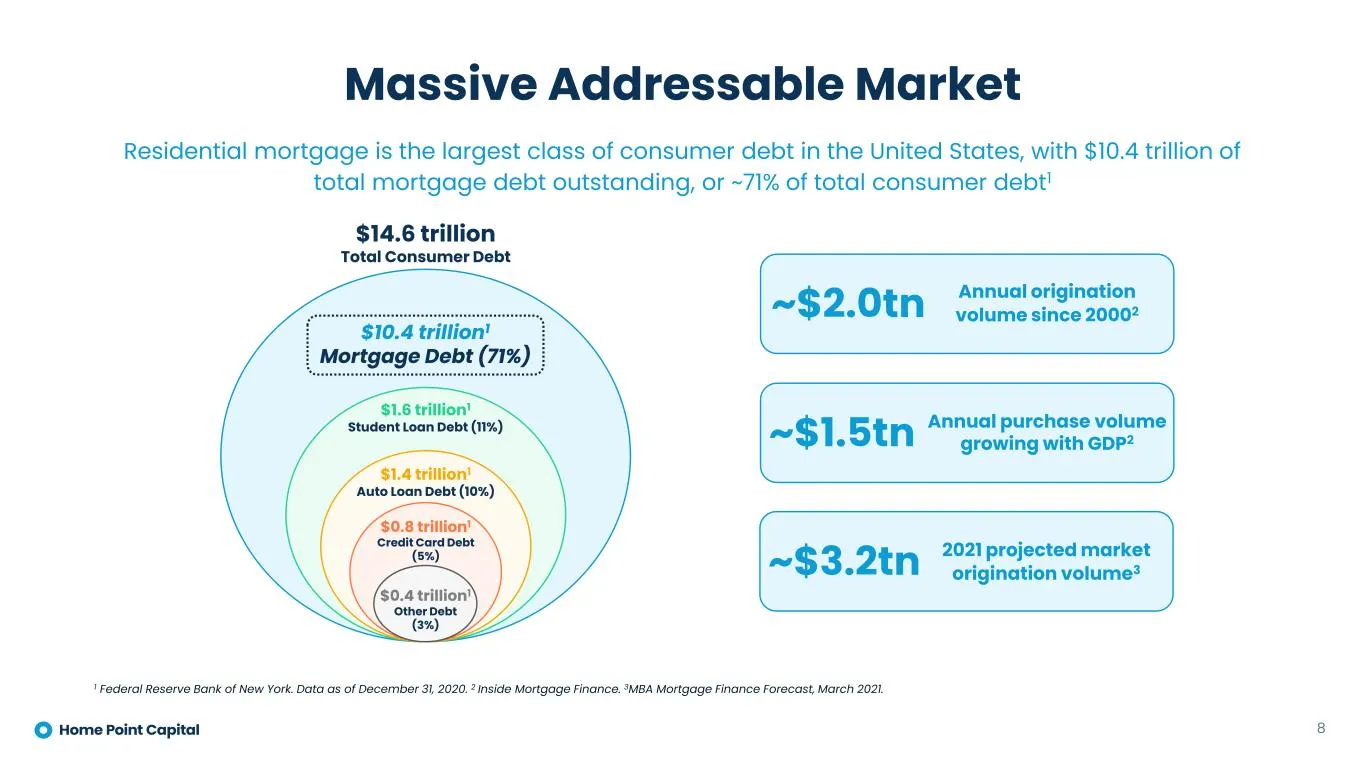
Massive Addressable Market Residential mortgage is the largest class of consumer debt in the United States, with $10.4 trillion of total mortgage debt outstanding, or ~71% of total consumer debt1 8 ~$2.0tn Annual originationvolume since 20002 ~$1.5tn Annual purchase volume growing with GDP2 $14.6 tr
Slide 9: Well-Positioned in Rapidly Growing Channel
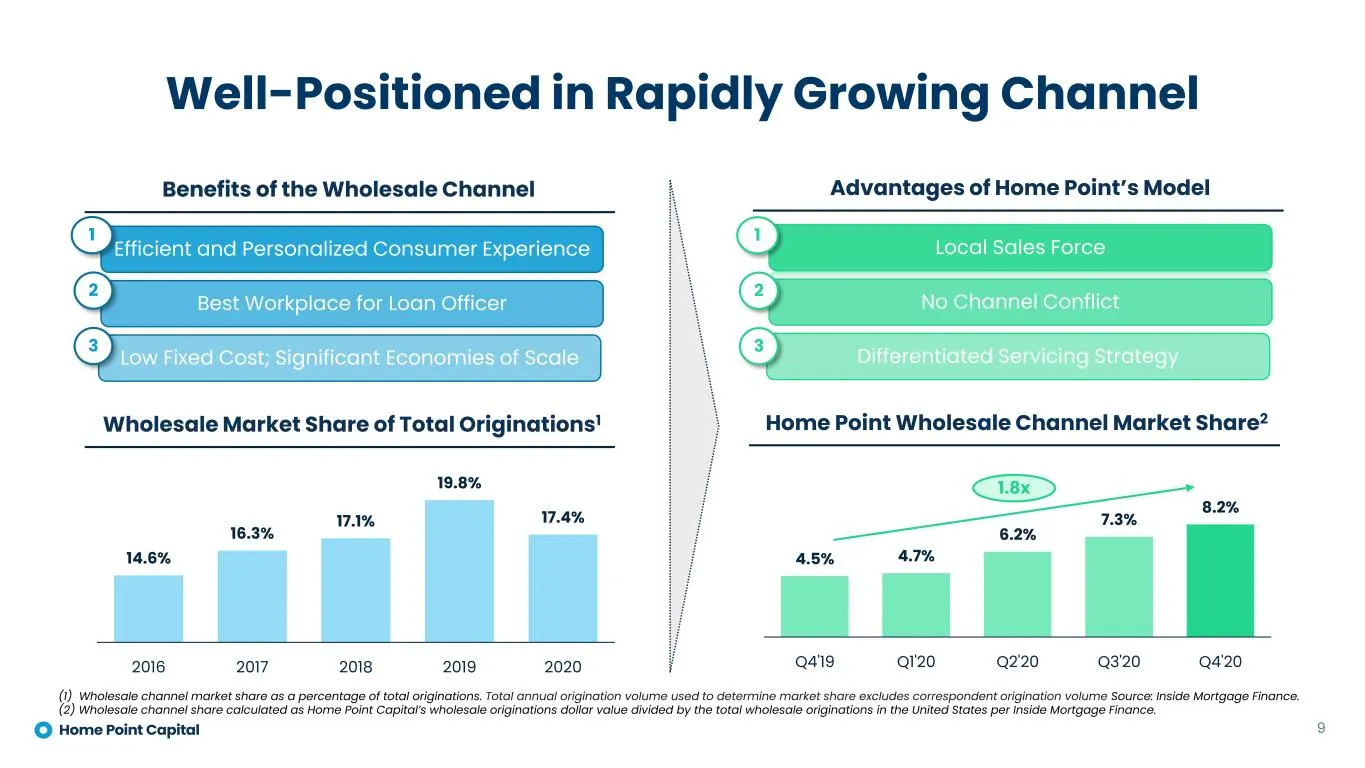
Well-Positioned in Rapidly Growing Channel 9 Efficient and Personalized Consumer Experience 1 Best Workplace for Loan Officer 2 Low Fixed Cost; Significant Economies of Scale 3 Benefits of the Wholesale Channel Wholesale Market Share of Total Originations1 14.6% 16.3% 17.1% 19.8% 17.4% 2016 2017 201
Slide 10: Value Proposition Drives Broker Partner Growth
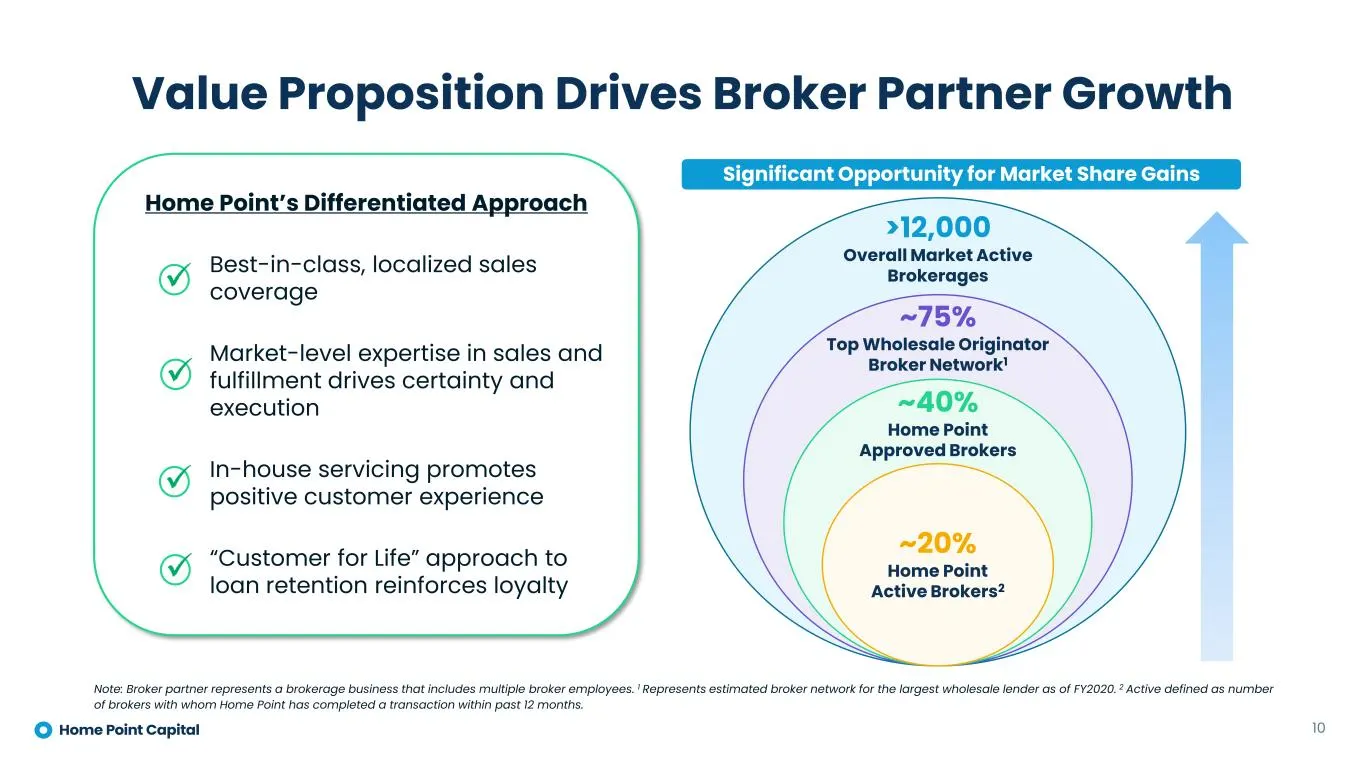
Value Proposition Drives Broker Partner Growth Home Point’s Differentiated Approach ✓ Best-in-class, localized sales coverage ✓ Market-level expertise in sales and fulfillment drives certainty and execution ✓ In-house servicing promotes positive customer experience ✓ “Customer for Life” approach to
Slide 11: Accelerating Growth in Wholesale Channel
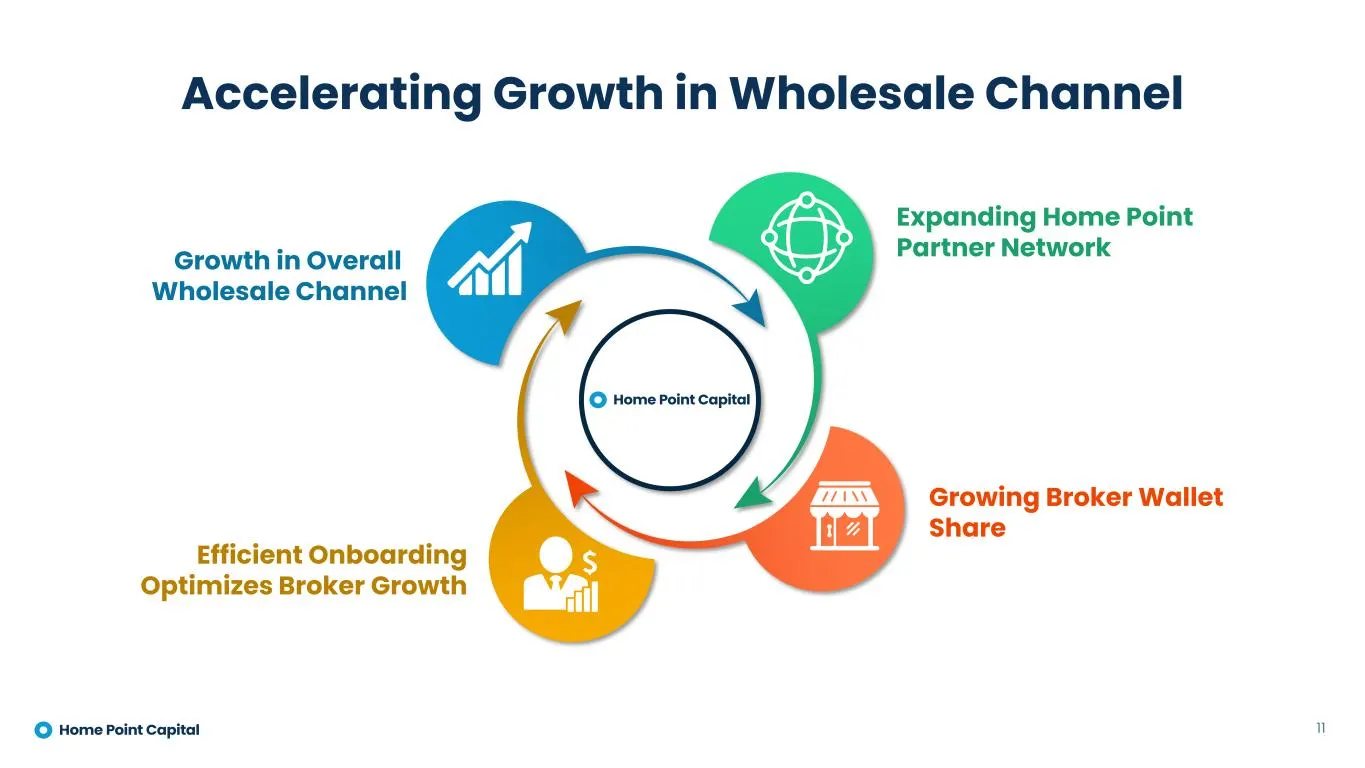
Accelerating Growth in Wholesale Channel 11 Growth in Overall Wholesale Channel Efficient Onboarding Optimizes Broker Growth Growing Broker Wallet Share Expanding Home Point Partner Network
Slide 12: Strategic Benefits of Correspondent & Direct Channels
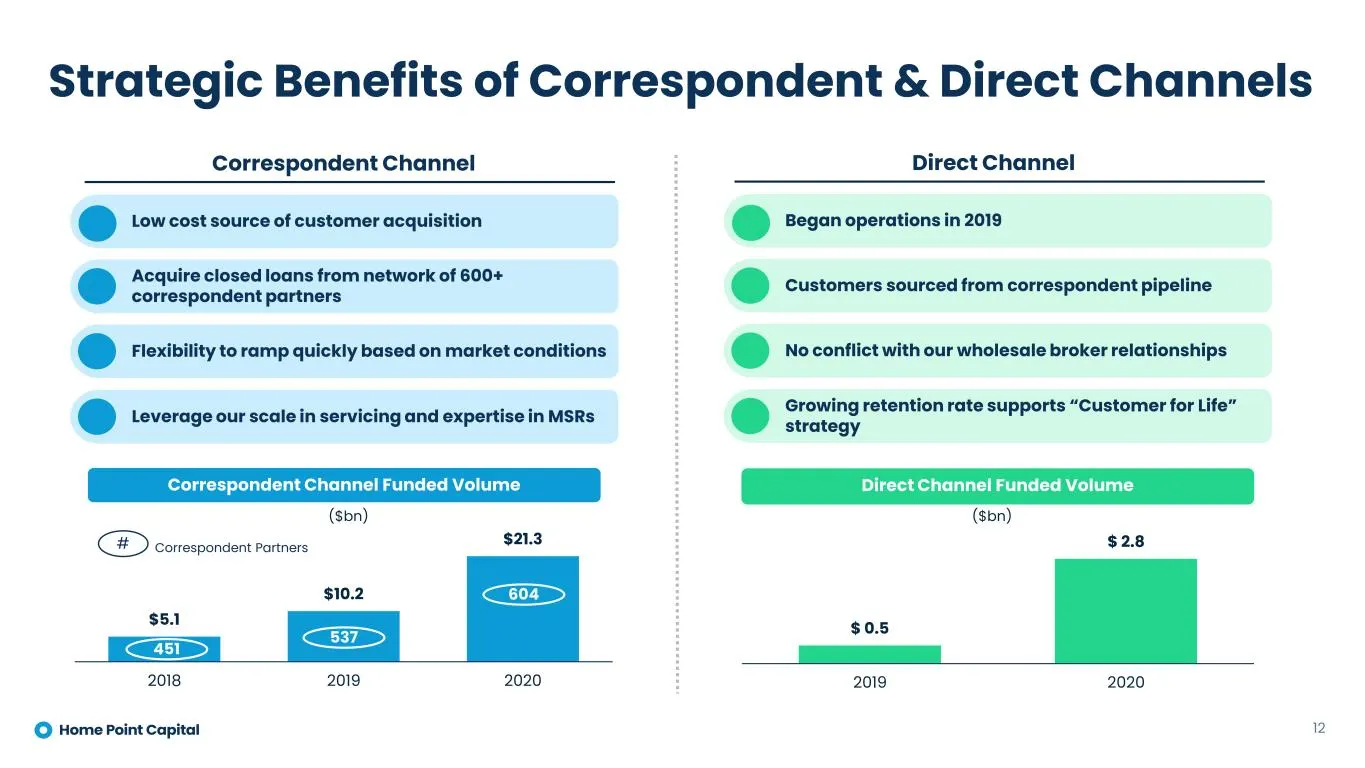
Strategic Benefits of Correspondent & Direct Channels $5.1 $10.2 $21.3 2018 2019 2020 ($bn) 451 537 604 Correspondent Partners 12 Direct Channel Funded Volume $ 0.5 $ 2.8 2019 2020 Correspondent Channel Funded Volume Flexibility to ramp quickly based on market conditions Leverage our scale in servic
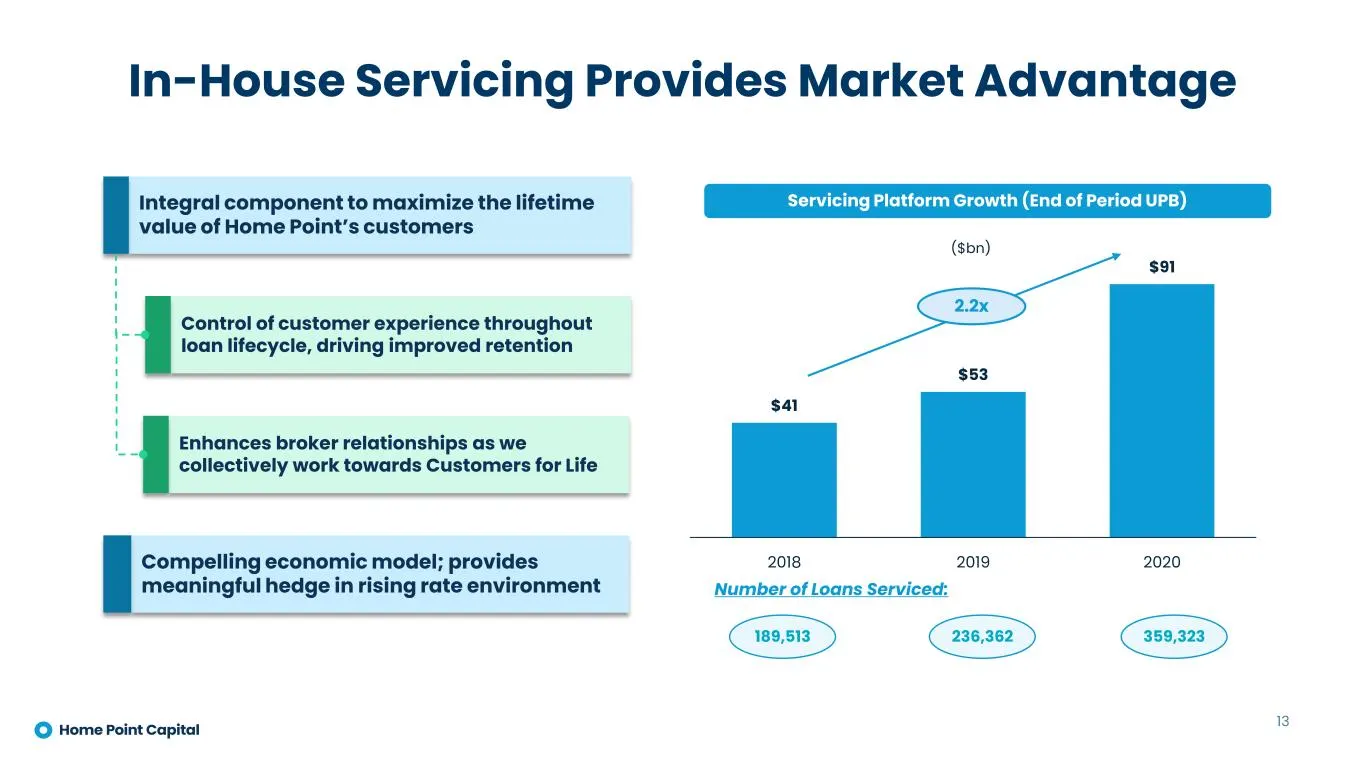
Slide 13: In-House Servicing Provides Market Advantage
13 Integral component to maximize the lifetime value of Home Point’s customers Control of customer experience throughout loan lifecycle, driving improved retention Enhances broker relationships as we collectively work towards Customers for Life Compelling economic model; provides meaningful hedge in
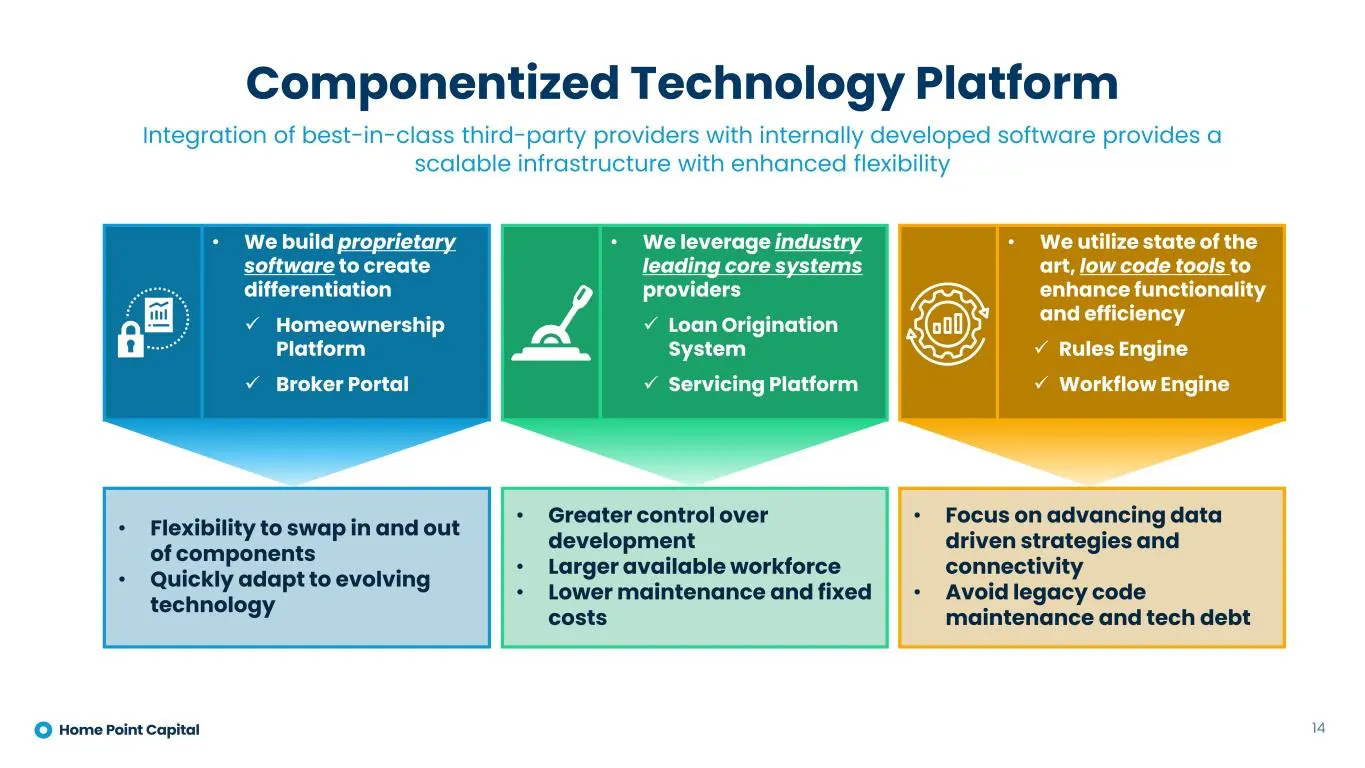
Slide 14: Componentized Technology Platform
Componentized Technology Platform Integration of best-in-class third-party providers with internally developed software provides a scalable infrastructure with enhanced flexibility 14 • We build proprietary software to create differentiation ✓ Homeownership Platform ✓ Broker Portal • We leverage ind
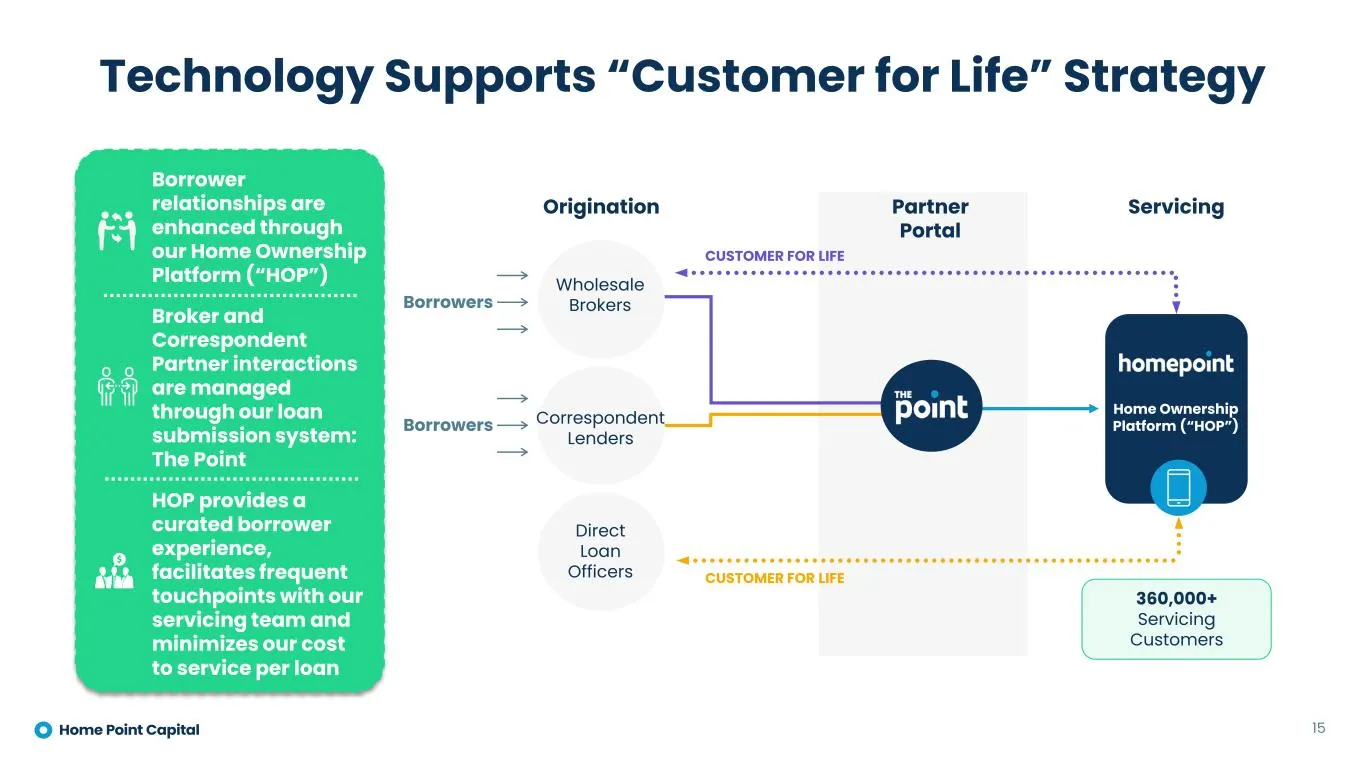
Slide 15: Technology Supports "Customer for Life" Strategy
Technology Supports “Customer for Life” Strategy 15 Origination ServicingPartner Portal Wholesale Brokers Direct Loan Officers Borrowers CUSTOMER FOR LIFE CUSTOMER FOR LIFE Borrowers 360,000+ Servicing Customers Home Ownership Platform (“HOP”)Correspondent Lenders Borrower relationships are enhanced
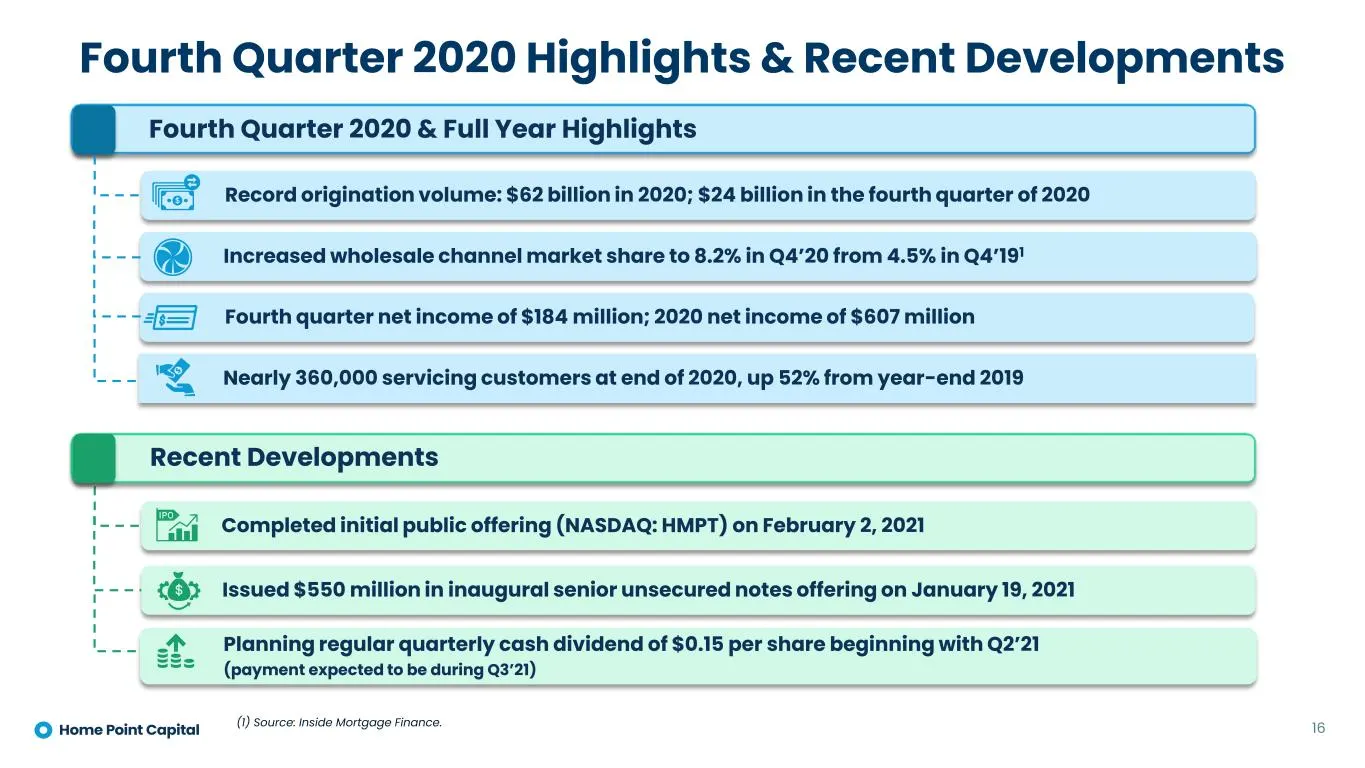
Slide 16: Fourth Quarter 2020 Highlights & Recent Developments
16 Record origination volume: $62 billion in 2020; $24 billion in the fourth quarter of 2020 Fourth Quarter 2020 Highlights & Recent Developments Fourth Quarter 2020 & Full Year Highlights Fourth quarter net income of $184 million; 2020 net income of $607 million Increased wholesale channel market s
Slide 17: Record Performance Across the Platform in 2020
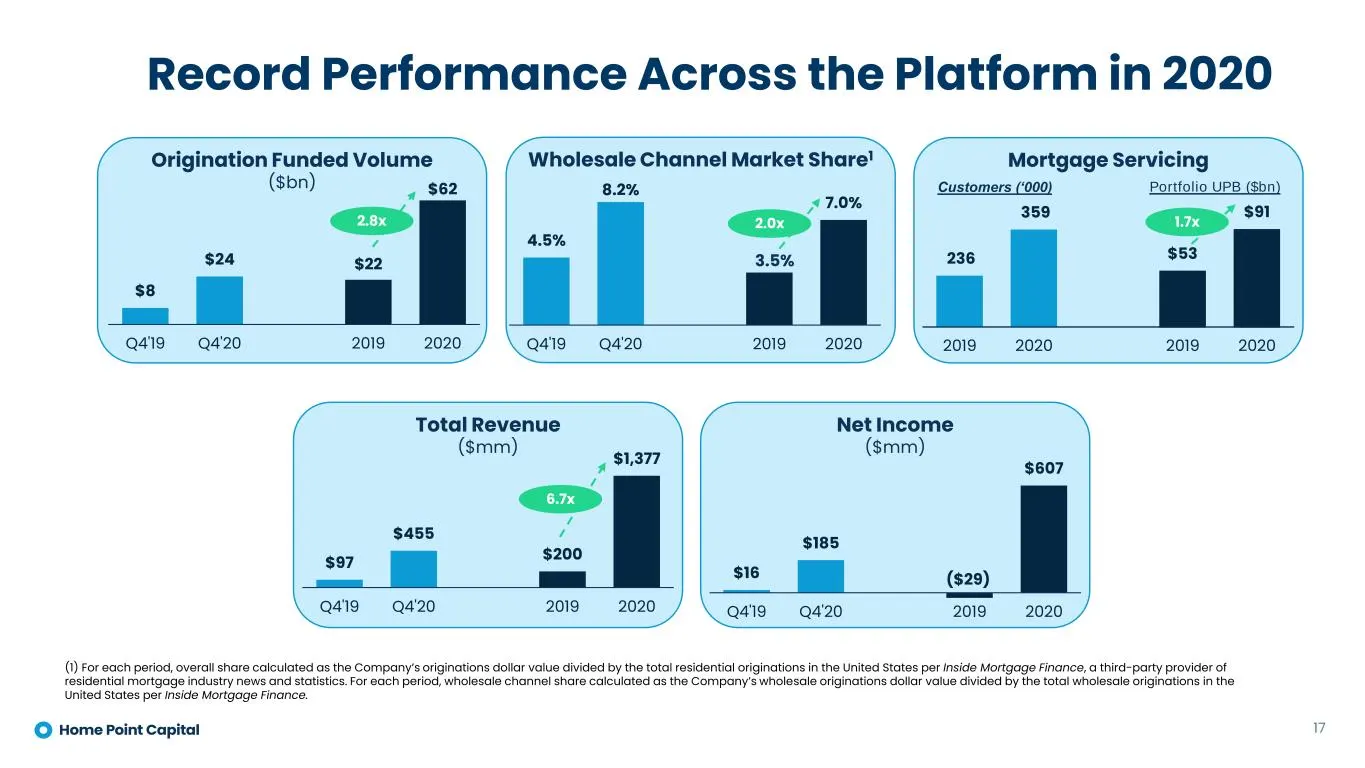
Net Income ($mm) Record Performance Across the Platform in 2020 17 Total Revenue ($mm) Origination Funded Volume ($bn) Mortgage Servicing $8 $24 $22 $62 Q4'19 Q4'20 2019 2020 $97 $455 $200 $1,377 Q4'19 Q4'20 2019 2020 $16 $185 ($29) $607 Q4'19 Q4'20 2019 2020 236 359 2019 2020 2019 2020 2.8x 6.7x $5
Slide 18: Fourth Quarter and 2020 Financial Results
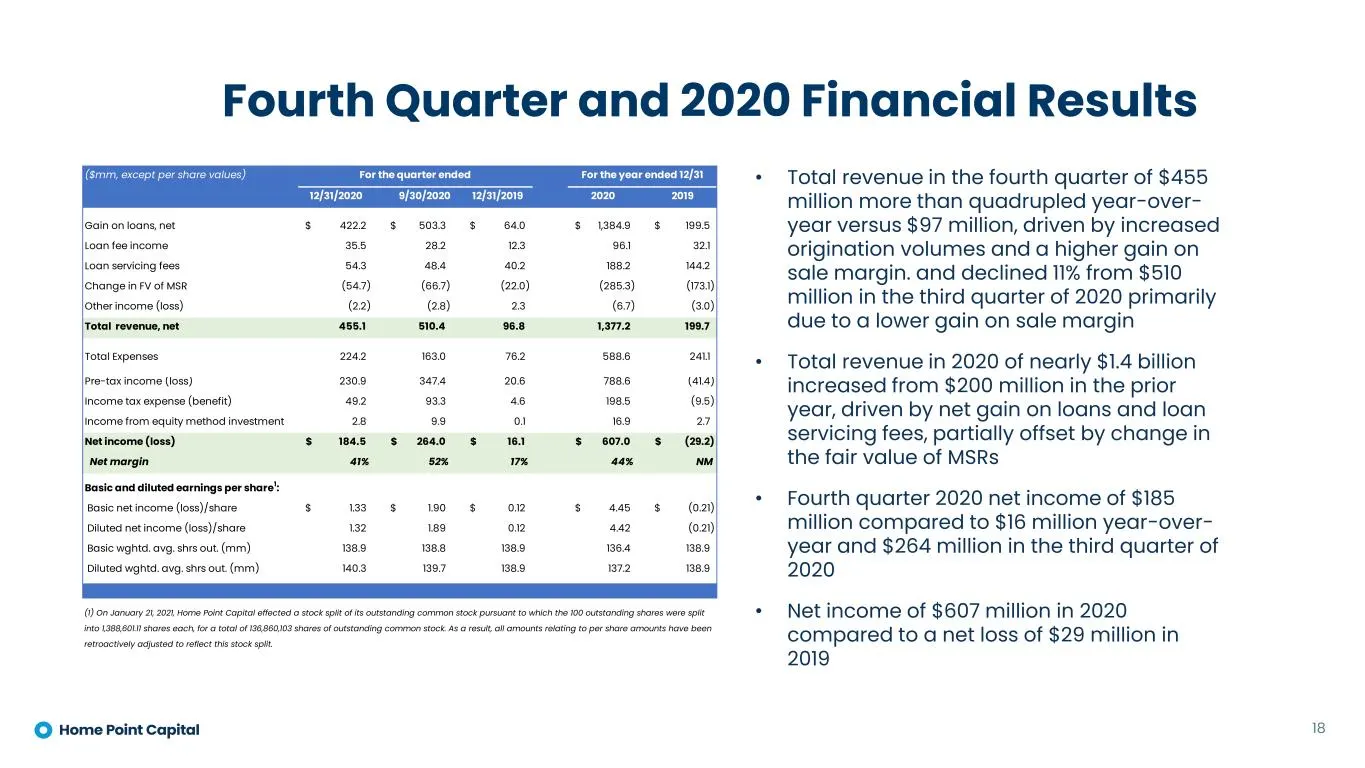
Fourth Quarter and 2020 Financial Results 18 • Total revenue in the fourth quarter of $455 million more than quadrupled year-over- year versus $97 million, driven by increased origination volumes and a higher gain on sale margin. and declined 11% from $510 million in the third quarter of 2020 primar
Slide 19: Sequential Volume Growth Across All Channels
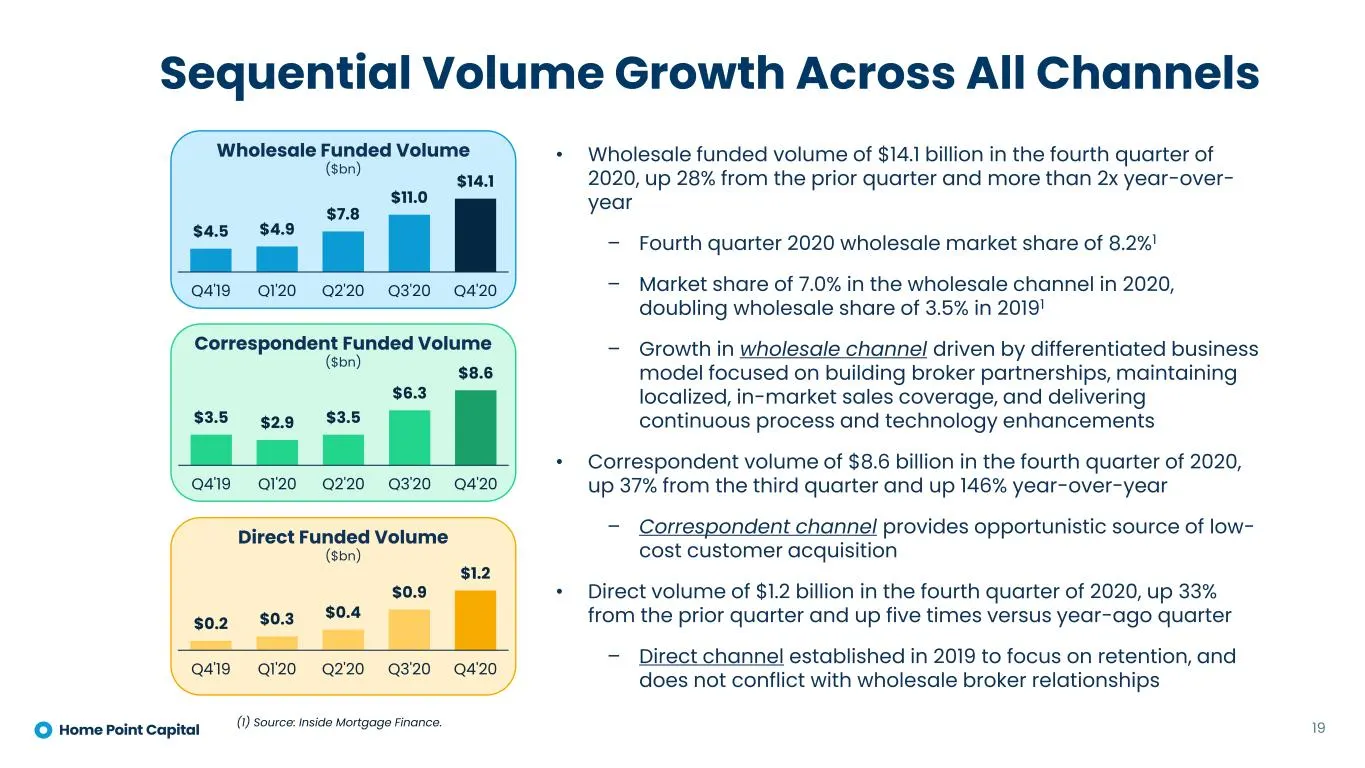
Sequential Volume Growth Across All Channels 19 Wholesale Funded Volume ($bn) $4.5 $4.9 $7.8 $11.0 $14.1 Q4'19 Q1'20 Q2'20 Q3'20 Q4'20 Direct Funded Volume ($bn) $0.2 $0.3 $0.4 $0.9 $1.2 Q4'19 Q1'20 Q2'20 Q3'20 Q4'20 Correspondent Funded Volume ($bn) $3.5 $2.9 $3.5 $6.3 $8.6 Q4'19 Q1'20 Q2'20 Q3'20
Slide 20: Origination Segment Highlights
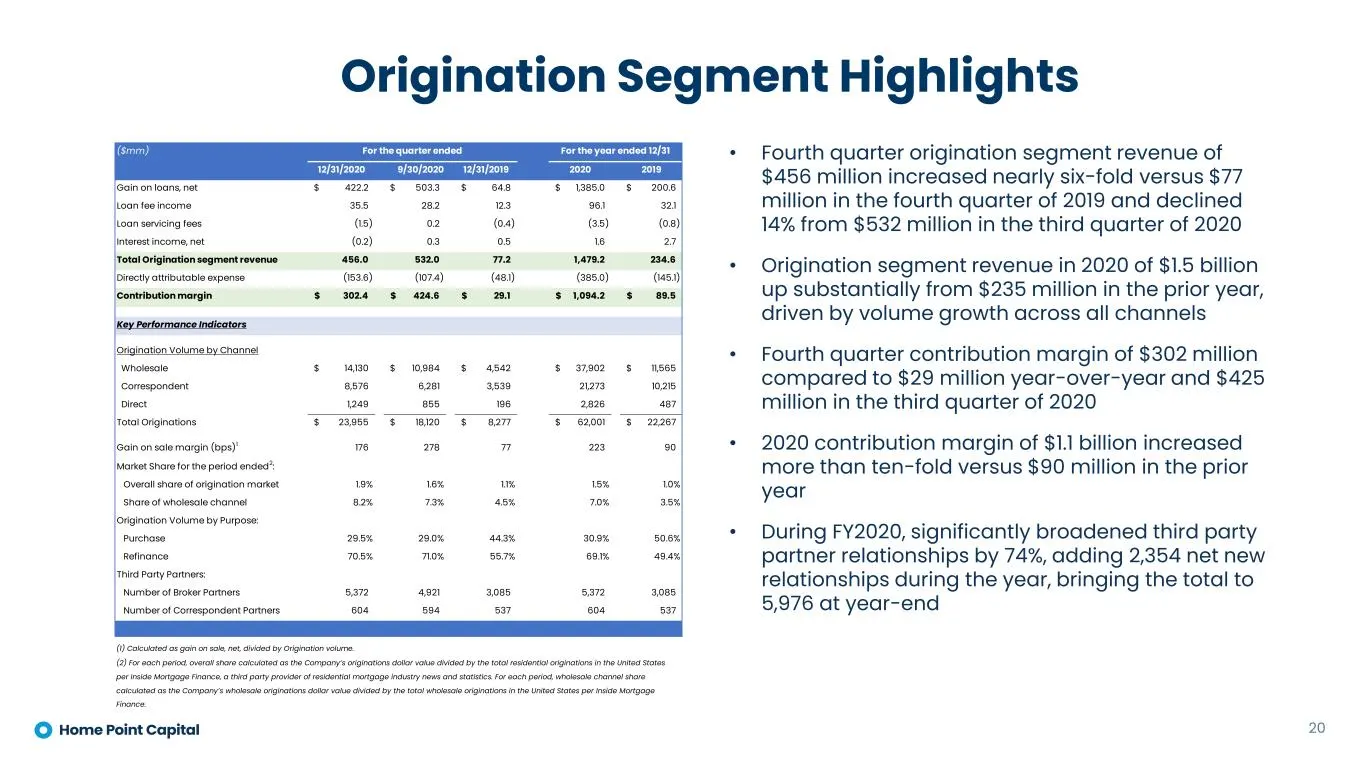
Origination Segment Highlights 20 • Fourth quarter origination segment revenue of $456 million increased nearly six-fold versus $77 million in the fourth quarter of 2019 and declined 14% from $532 million in the third quarter of 2020 • Origination segment revenue in 2020 of $1.5 billion up substanti
Slide 21: Servicing Segment Highlights
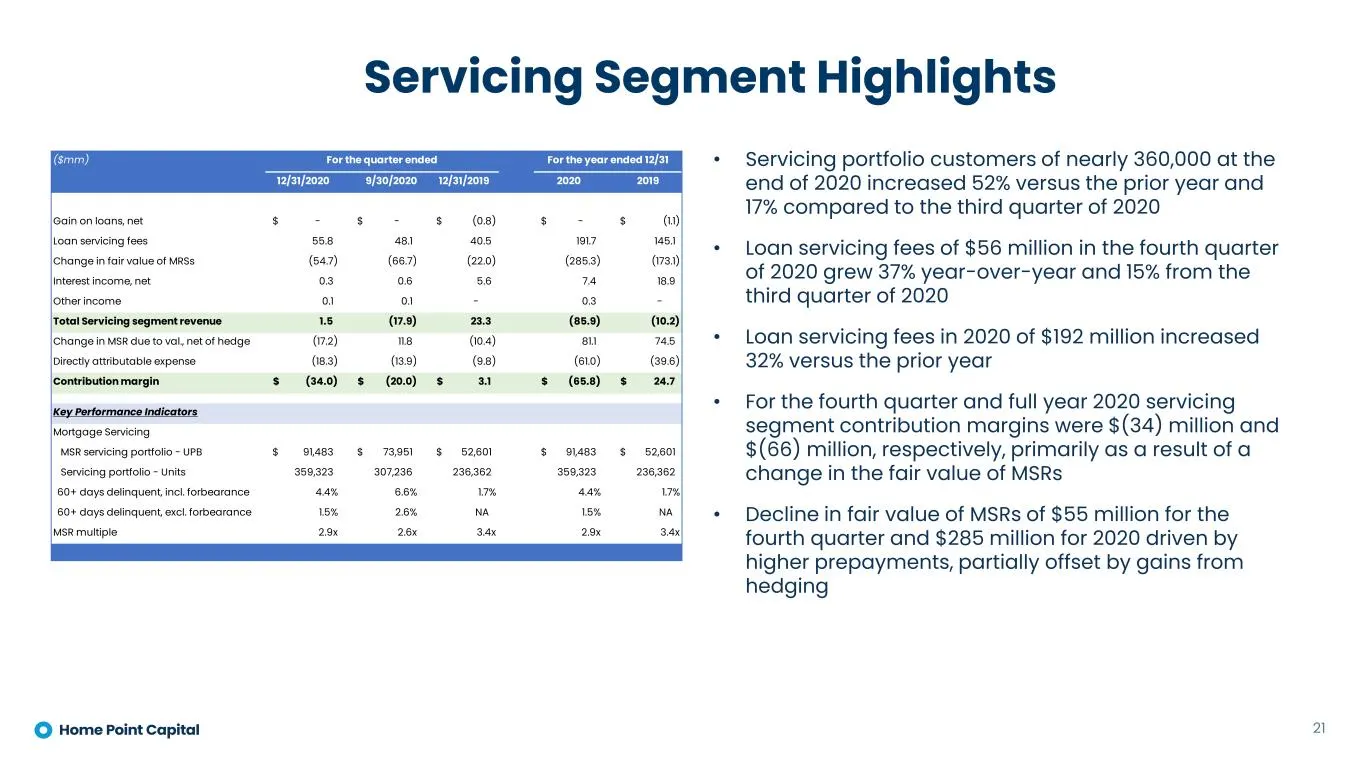
Servicing Segment Highlights 21 • Servicing portfolio customers of nearly 360,000 at the end of 2020 increased 52% versus the prior year and 17% compared to the third quarter of 2020 • Loan servicing fees of $56 million in the fourth quarter of 2020 grew 37% year-over-year and 15% from the third qua
Slide 22: Balance Sheet Highlights
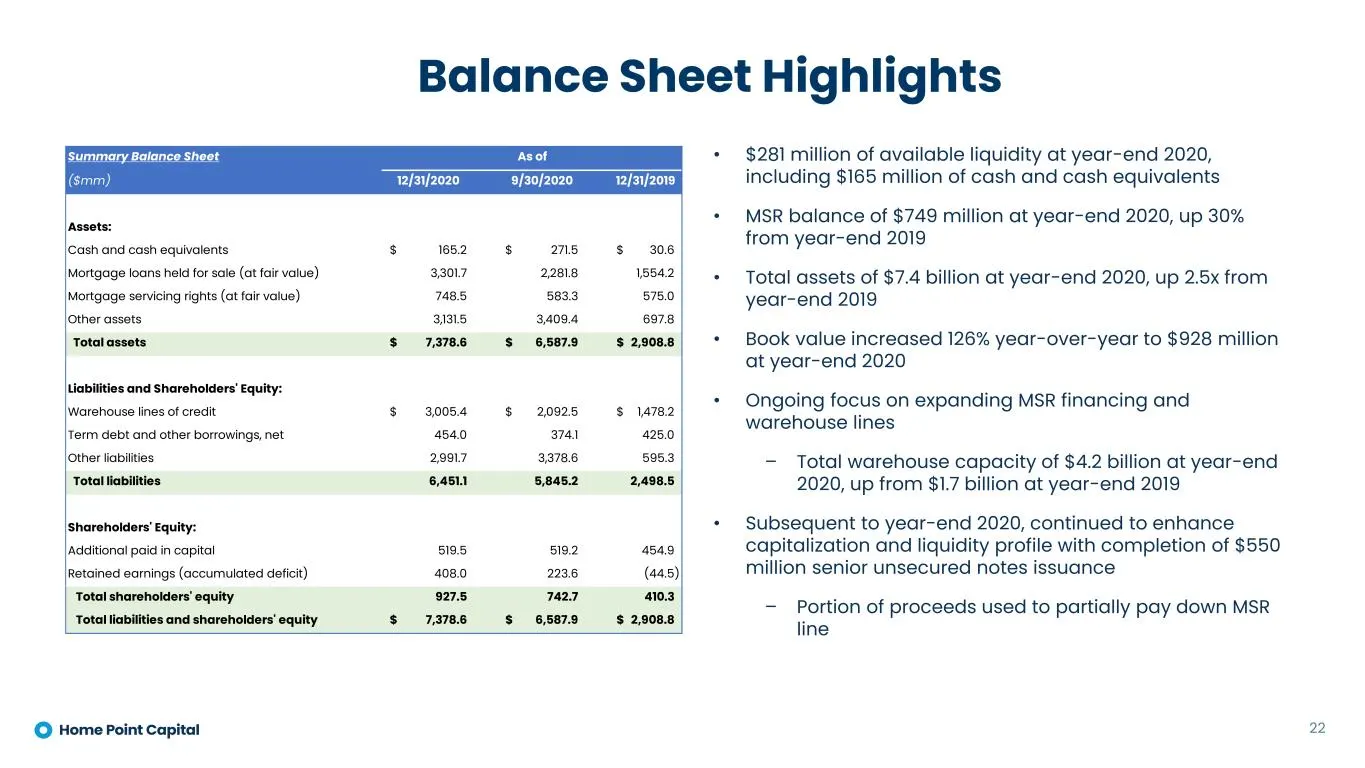
Balance Sheet Highlights 22 • $281 million of available liquidity at year-end 2020, including $165 million of cash and cash equivalents • MSR balance of $749 million at year-end 2020, up 30% from year-end 2019 • Total assets of $7.4 billion at year-end 2020, up 2.5x from year-end 2019 • Book value i
Slide 23: A Different, Better Kind of Mortgage Company
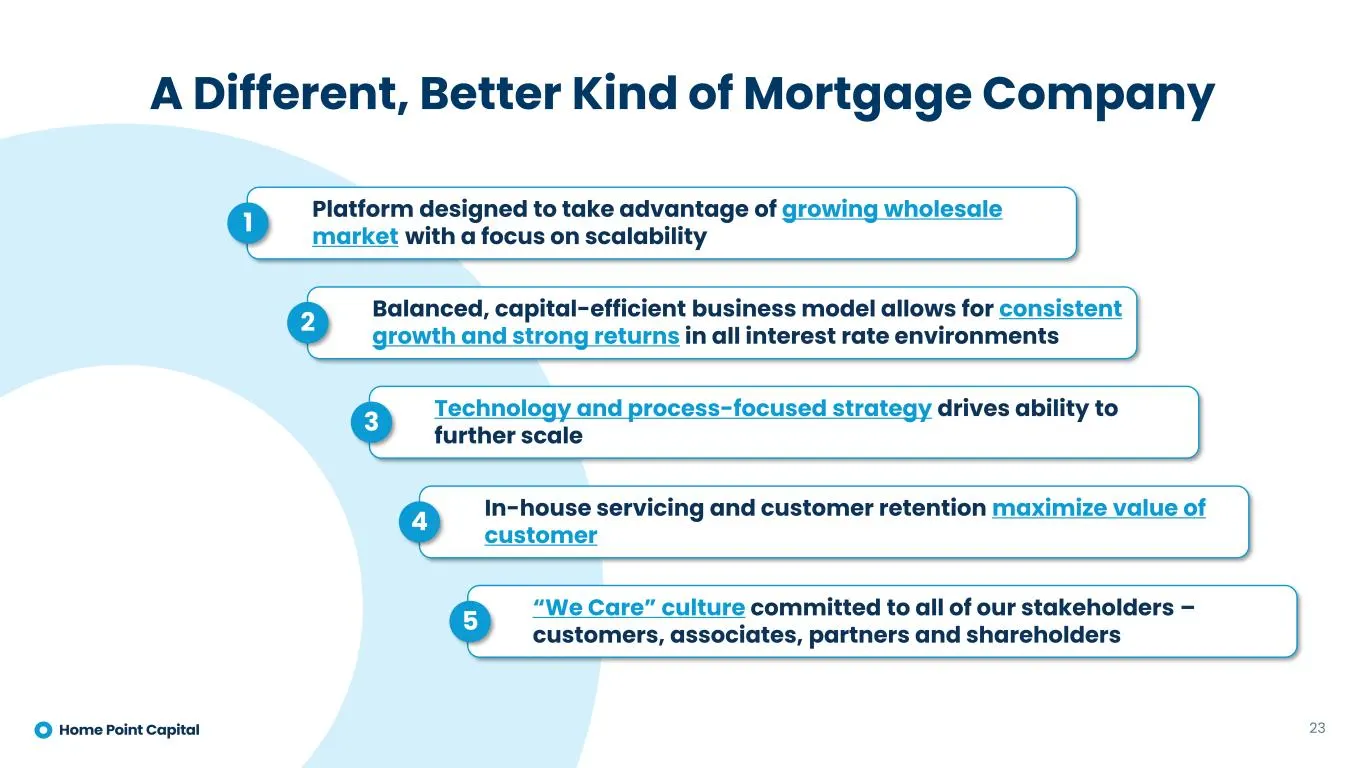
23 Balanced, capital-efficient business model allows for consistent growth and strong returns in all interest rate environments2 In-house servicing and customer retention maximize value of customer4 “We Care” culture committed to all of our stakeholders – customers, associates, partners and sharehol
Slide 24: Appendix
Appendix (© Home Point Capital
Slide 25: Detailed Income Statement
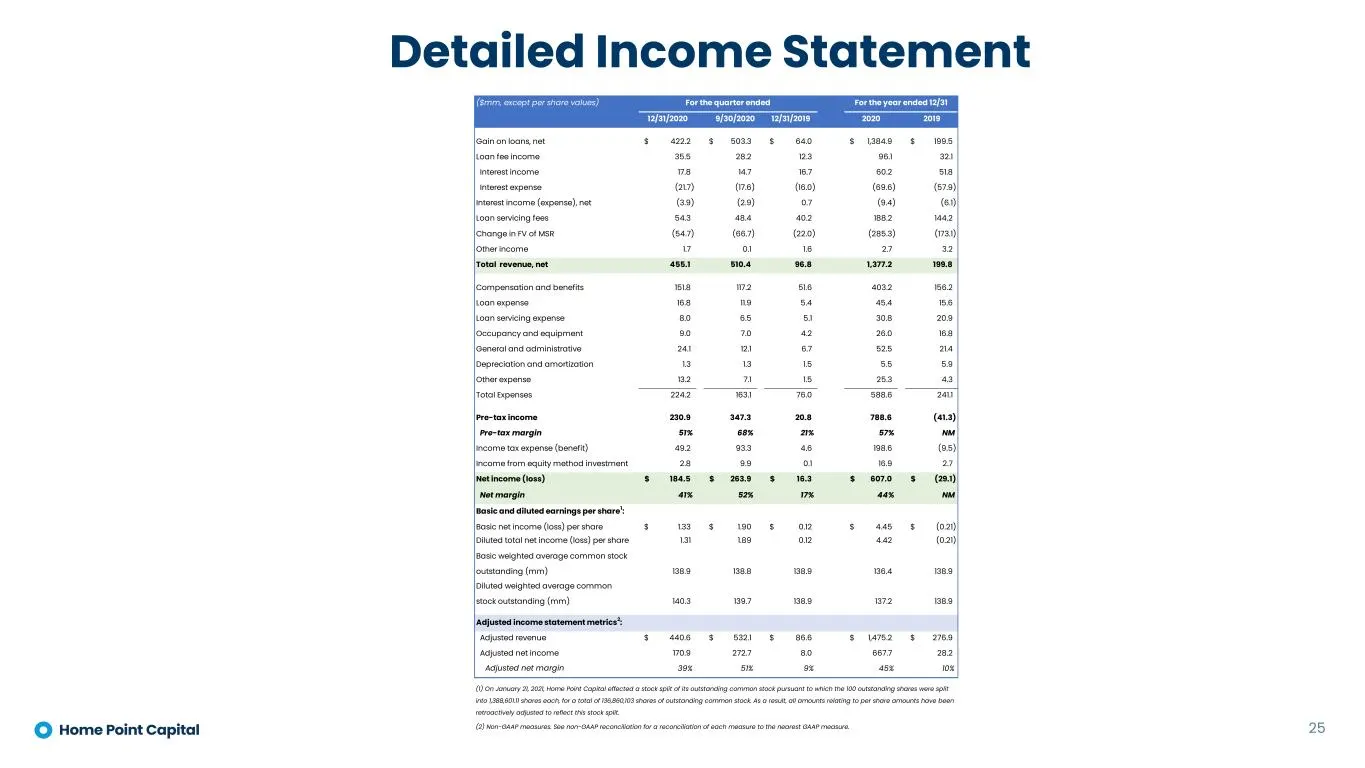
Detailed Income Statement 25 ($mm, except per share values) 12/31/2020 9/30/2020 12/31/2019 2020 2019 Gain on loans, net 422.2$ 503.3$ 64.0$ 1,384.9$ 199.5$ Loan fee income 35.5 28.2 12.3 96.1 32.1 Interest income 17.8 14.7 16.7 60.2 51.8 Interest expense (21.7) (17.6) (16.0) (69.6) (57.9) Interest
Slide 26: Detailed Balance Sheet
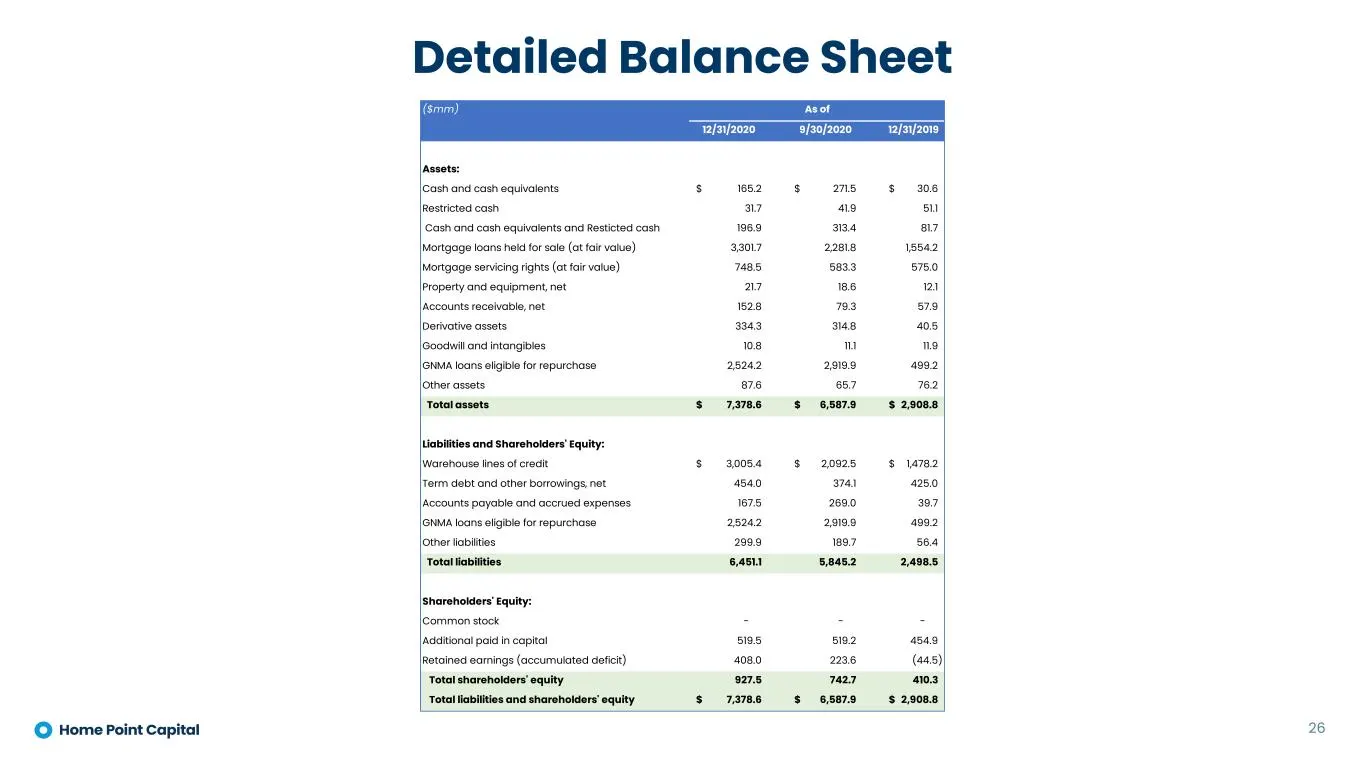
Detailed Balance Sheet 26 ($mm) 12/31/2020 9/30/2020 12/31/2019 Assets: Cash and cash equivalents 165.2$ 271.5$ 30.6$ Restricted cash 31.7 41.9 51.1 Cash and cash equivalents and Resticted cash 196.9 313.4 81.7 Mortgage loans held for sale (at fair value) 3,301.7 2,281.8 1,554.2 Mortgage servicing r
Slide 27: Non-GAAP to GAAP Reconciliations
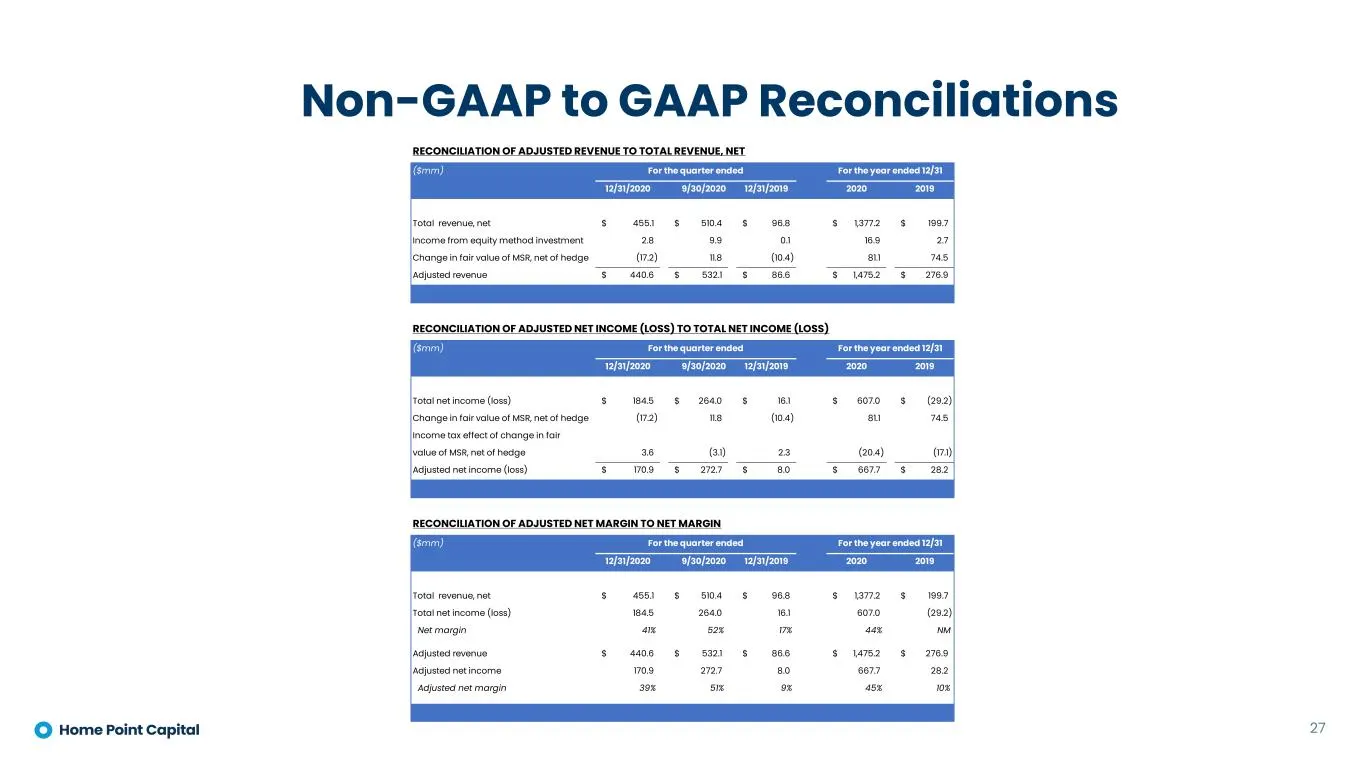
Non-GAAP to GAAP Reconciliations 27 RECONCILIATION OF ADJUSTED REVENUE TO TOTAL REVENUE, NET ($mm) 12/31/2020 9/30/2020 12/31/2019 2020 2019 Total revenue, net 455.1$ 510.4$ 96.8$ 1,377.2$ 199.7$ Income from equity method investment 2.8 9.9 0.1 16.9 2.7 Change in fair value of MSR, net of hedge (17.
Slide 28: Non-GAAP measures definitions
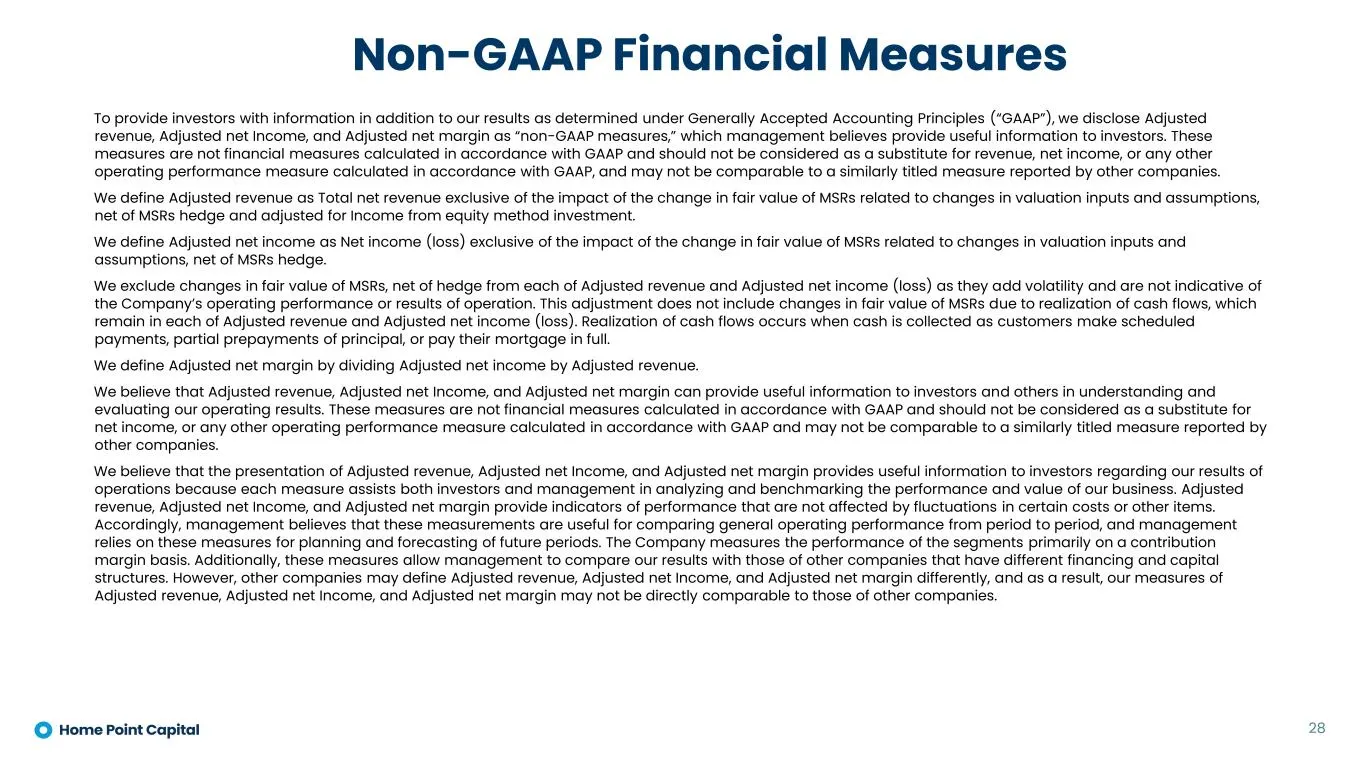
To provide investors with information in addition to our results as determined under Generally Accepted Accounting Principles (“GAAP”), we disclose Adjusted revenue, Adjusted net Income, and Adjusted net margin as “non-GAAP measures,” which management believes provide useful information to investors

Slide 29: Photo courtesy of Nasdaq Inc.
Photo courtesy of Nasdaq Inc.
Source: SEC EDGAR · 8-K filed Mar 25, 2021
More decks from Home Point Capital Inc
 Merger or Acquisition (May 2023)5 slides · May 10, 2023
 Q4 2022 Earnings Presentation17 slides · Mar 9, 2023
 Q3 2022 Earnings Presentation18 slides · Nov 10, 2022
 Q2 2022 Earnings Presentation18 slides · Aug 11, 2022
 Investor Presentation (June 2022)19 slides · Jun 13, 2022
 Q1 2022 Earnings Presentation18 slides · May 12, 2022