Emaar Properties (P.J.S.C) · DFM:EMAAR
Emaar Properties (P.J.S.C) — Emaar Properties — FY 2017 Earnings Presentation
55 slides from Emaar Properties (P.J.S.C)'s earnings presentation, Mar 6, 2018
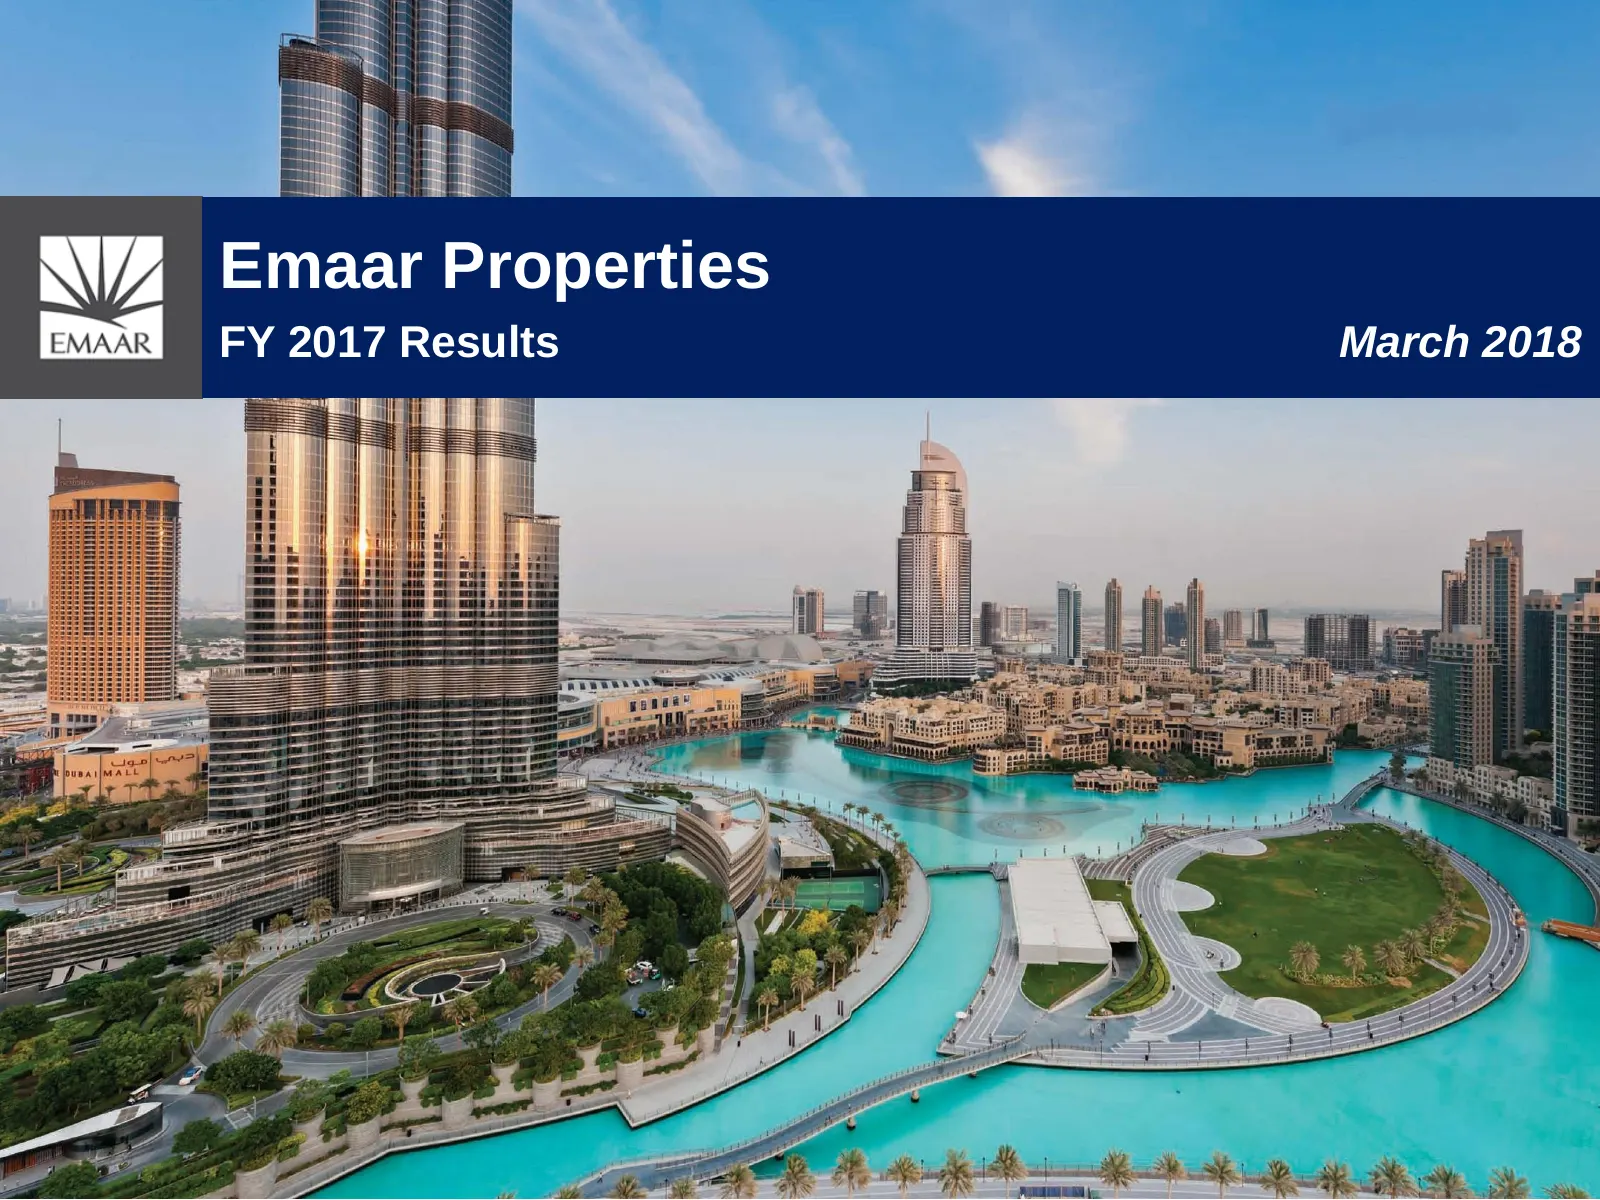
Slide 1: Emaar Properties FY 2017 Results
Emaar Properties FY 2017 Results March 2018
Slide 2: Disclaimer
Disclaimer Emaar Properties PJSC, for themselves and for Emaar Group, give notice that: The particulars of this presentation do not constitute any part of an offer or a contract. Given that the presentation contains information based on forecasts and roll outs, all statements contained in this prese
Slide 3: Table of Contents
Table of Contents KEY HIGHLIGHTS INCOME STATEMENT BALANCE SHEET OPERATIONAL OVERVIEW APPENDIX FY 2017 Results Presentation 6 March 2018 Page 2
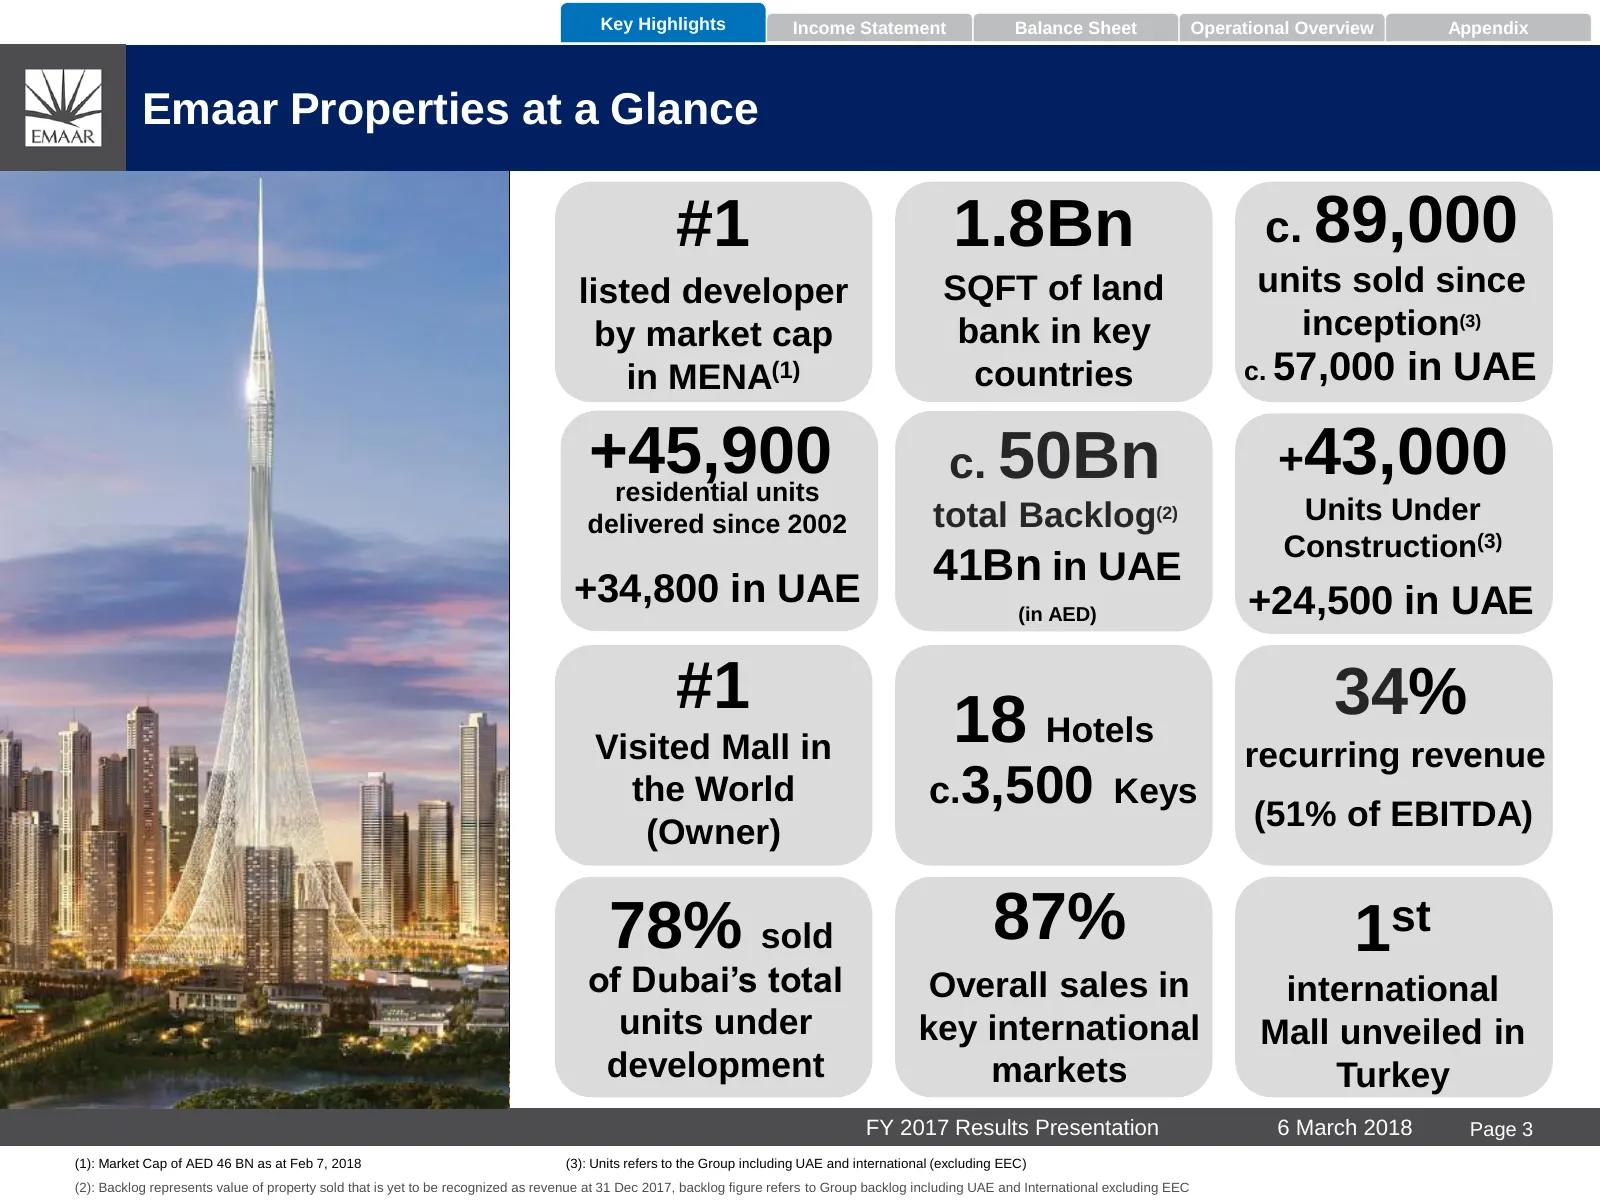
Slide 4: Emaar Properties at a Glance
Key Highlights Income Statement Balance Sheet Operational Overview Appendix Emaar Properties at a Glance #1 1.8Bn c. 89,000 listed developer SQFT of land units sold since by market cap bank in key inception(3) in MENA(1) countries c. 57,000 in UAE +45,900 residential units c. 50Bn +43,000 delivered
Slide 5: Key Financial Highlights for the Group
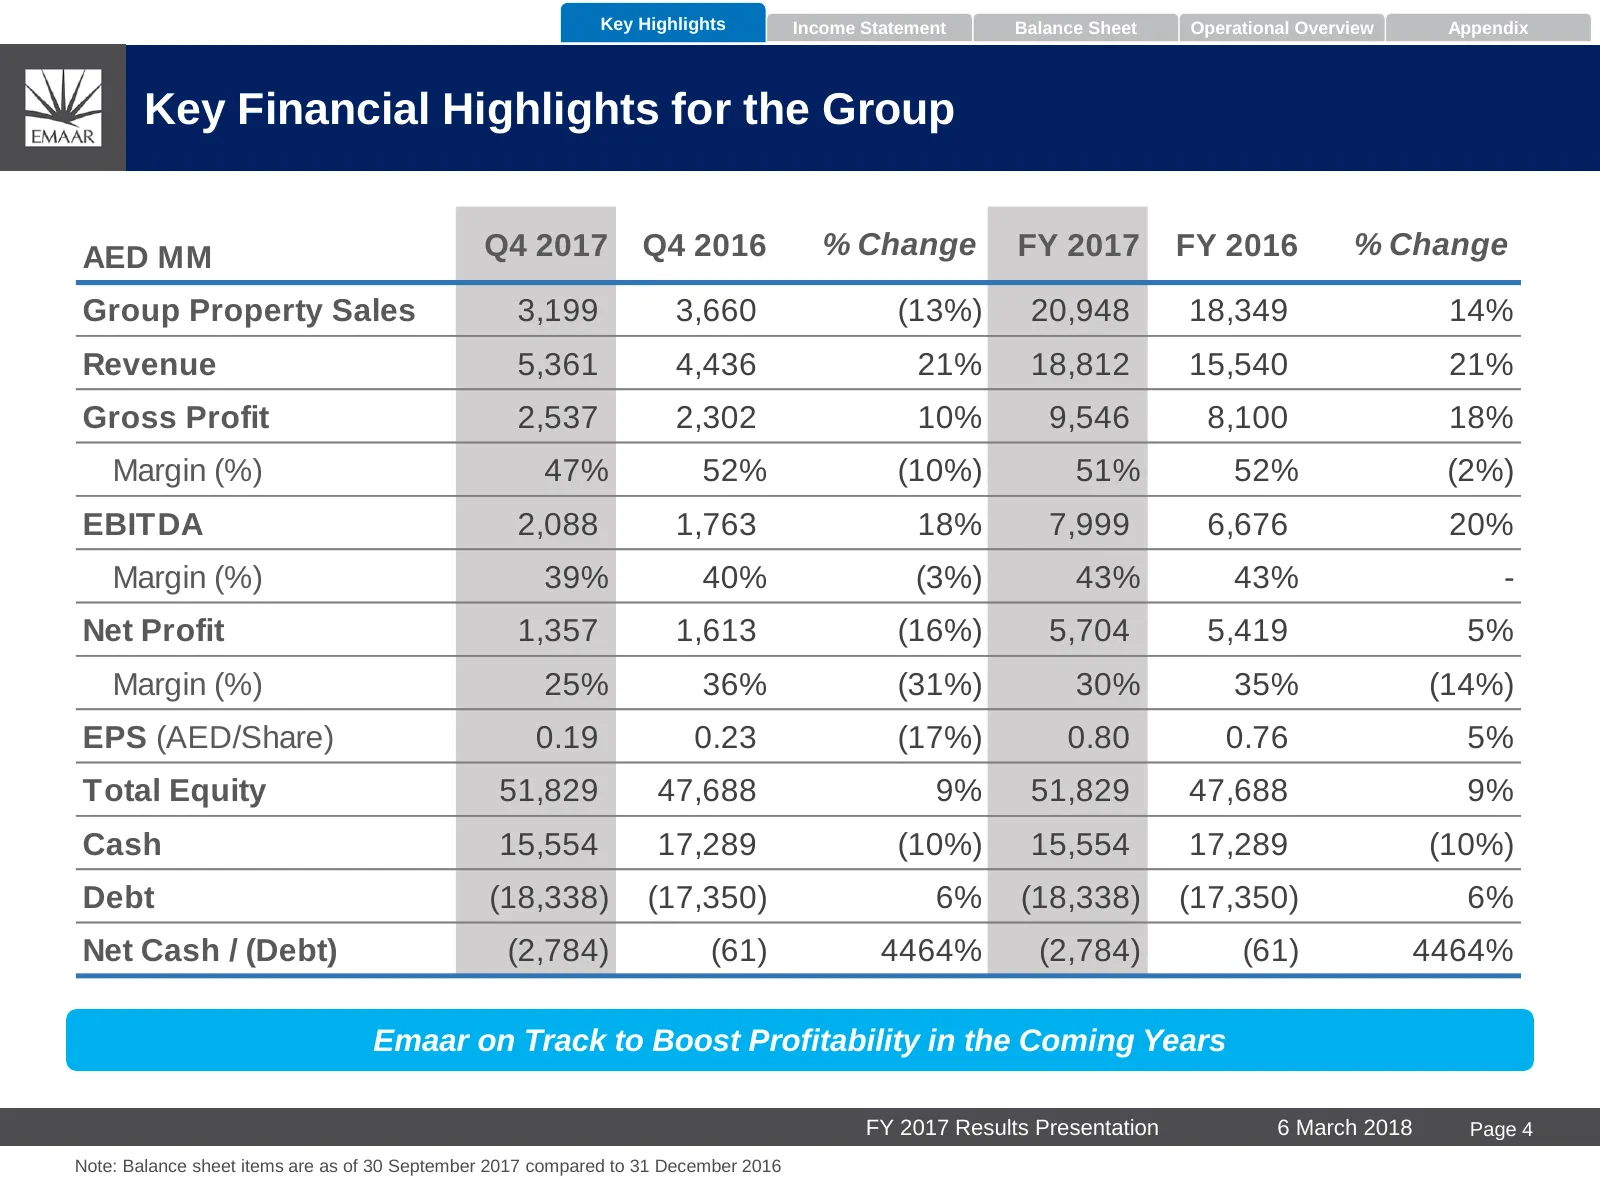
Key Highlights Income Statement Balance Sheet Operational Overview Appendix Key Financial Highlights for the Group AED MM Q4 2017 Q4 2016 % Change FY 2017 FY 2016 % Change Group Property Sales 3,199 3,660 (13%) 20,948 18,349 14% Revenue 5,361 4,436 21% 18,812 15,540 21% Gross Profit 2,537 2,302 10%
Slide 6: Key Achievements – FY 2017
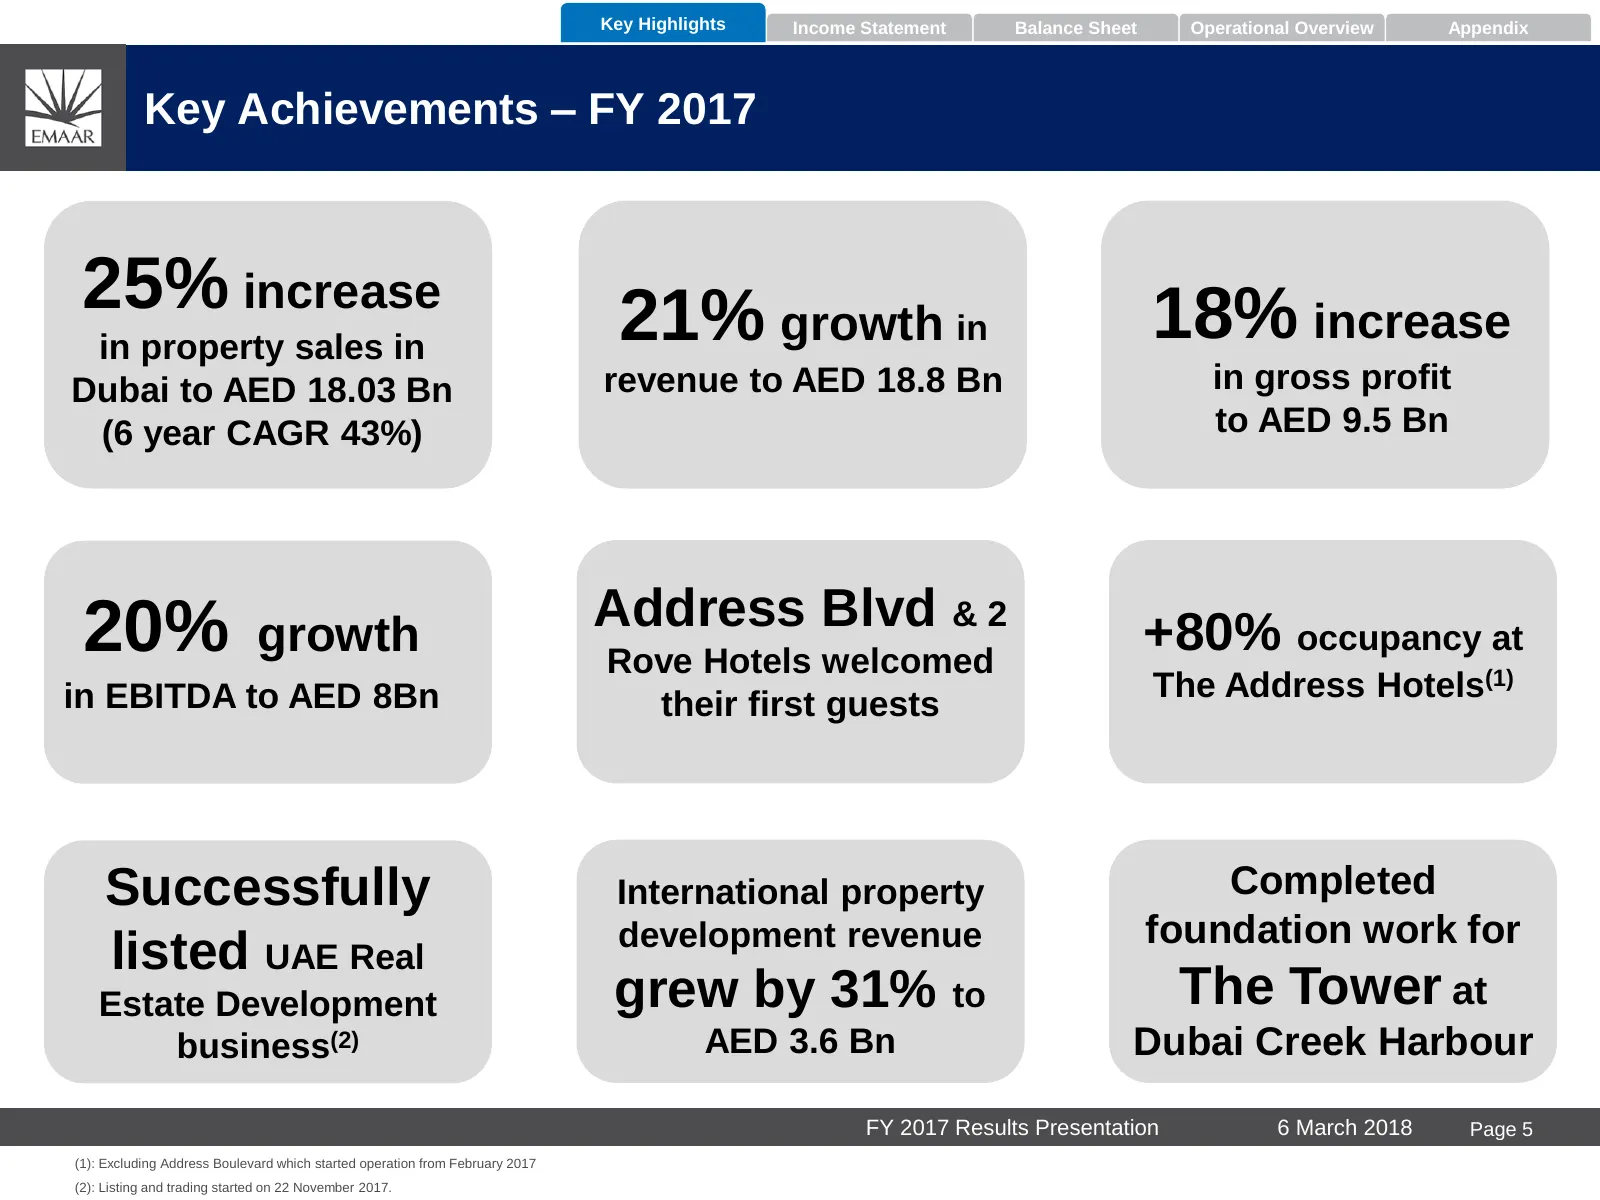
Key Highlights Income Statement Balance Sheet Operational Overview Appendix Key Achievements – FY 2017 25% increase 21% growth in 18% increase in property sales in Dubai to AED 18.03 Bn revenue to AED 18.8 Bn in gross profit (6 year CAGR 43%) to AED 9.5 Bn 20% growth Address Blvd & 2 +80% occupancy
Slide 7: Results by Segment
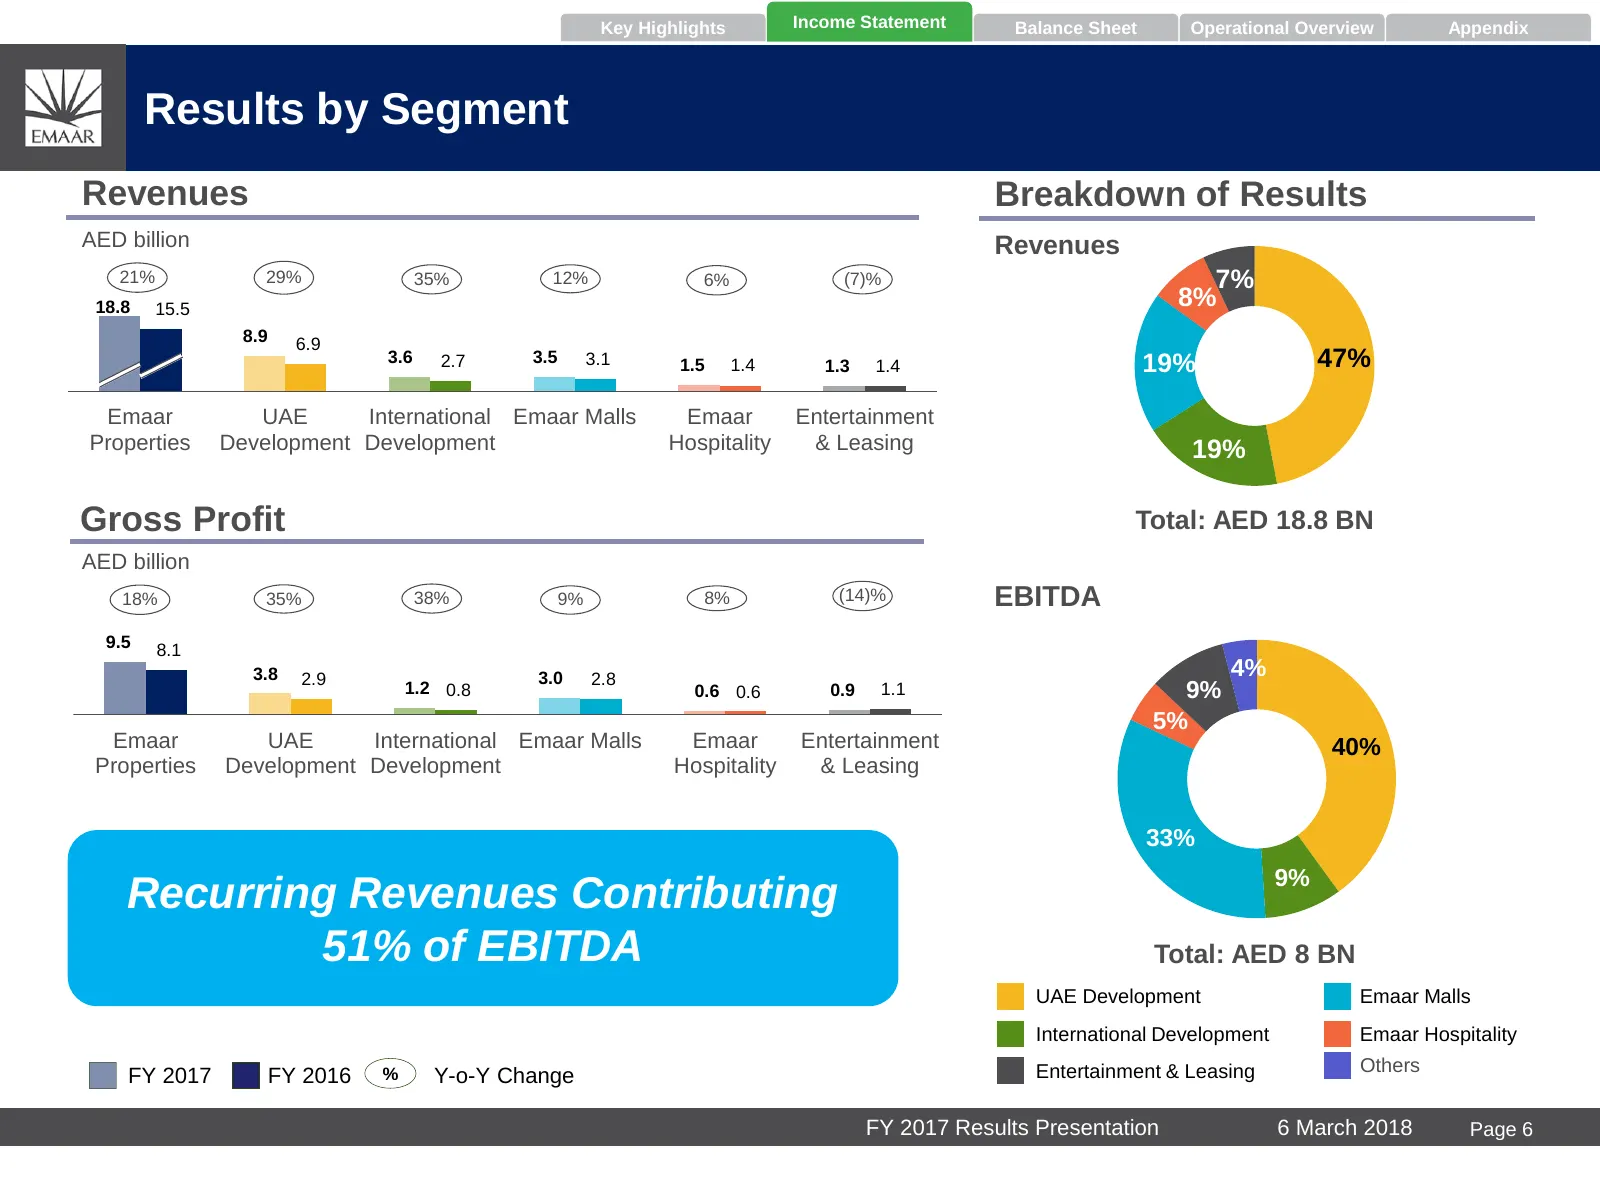
Key Highlights Income Statement Balance Sheet Operational Overview Appendix Results by Segment Revenues Breakdown of Results AED billion Revenues 21% 29% 35% 12% 6% (7)% 7% 18.8 15.5 8% 8.9 6.9 3.6 2.7 3.5 3.1 1.5 1.4 1.3 1.4 19% 47% Emaar UAE International Emaar Malls Emaar Entertainment Properties
Slide 8: Balance Sheet Overview
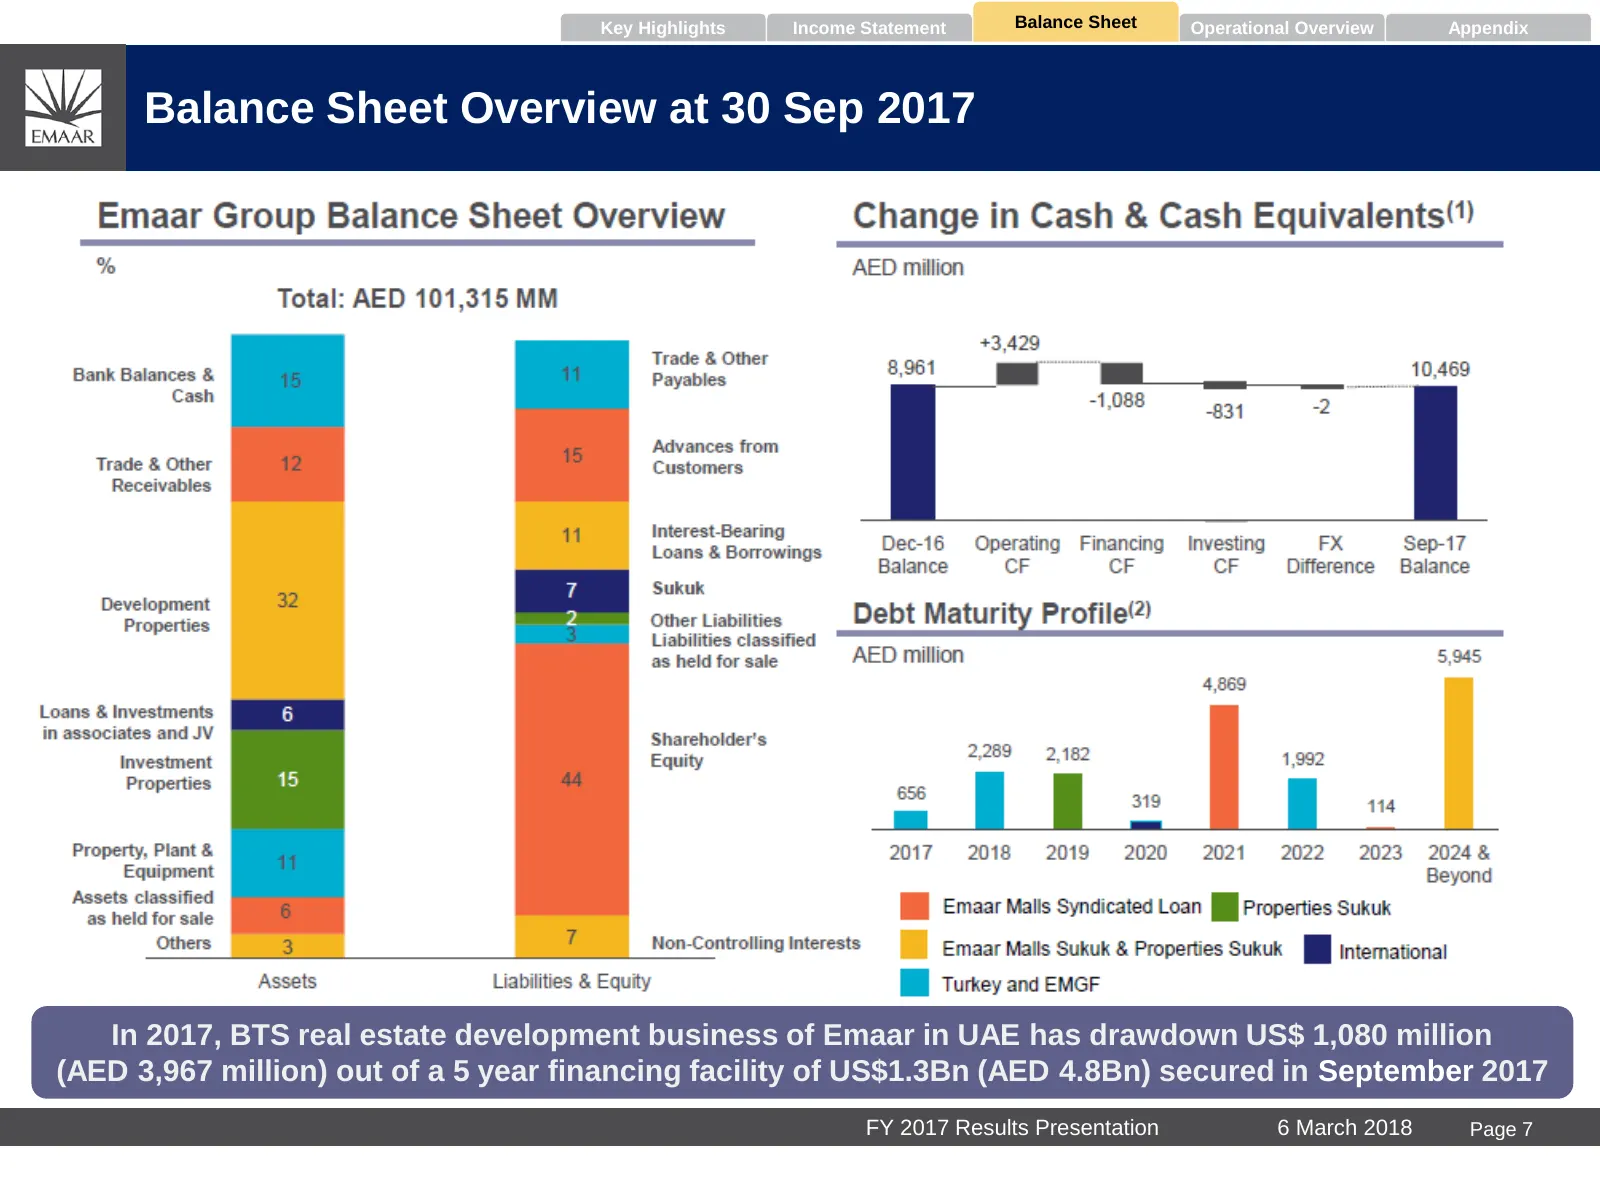
Key Highlights Income Statement Balance Sheet Operational Overview Appendix Balance Sheet Overview at 30 Sep 2017 Emaar Group Balance Sheet Overview Change in Cash & Cash Equivalents(1) % AED million Total: AED 112,752 MM Bank Balances & Trade & Other 13 Payables Cash 19 Advances from 13 Customers T
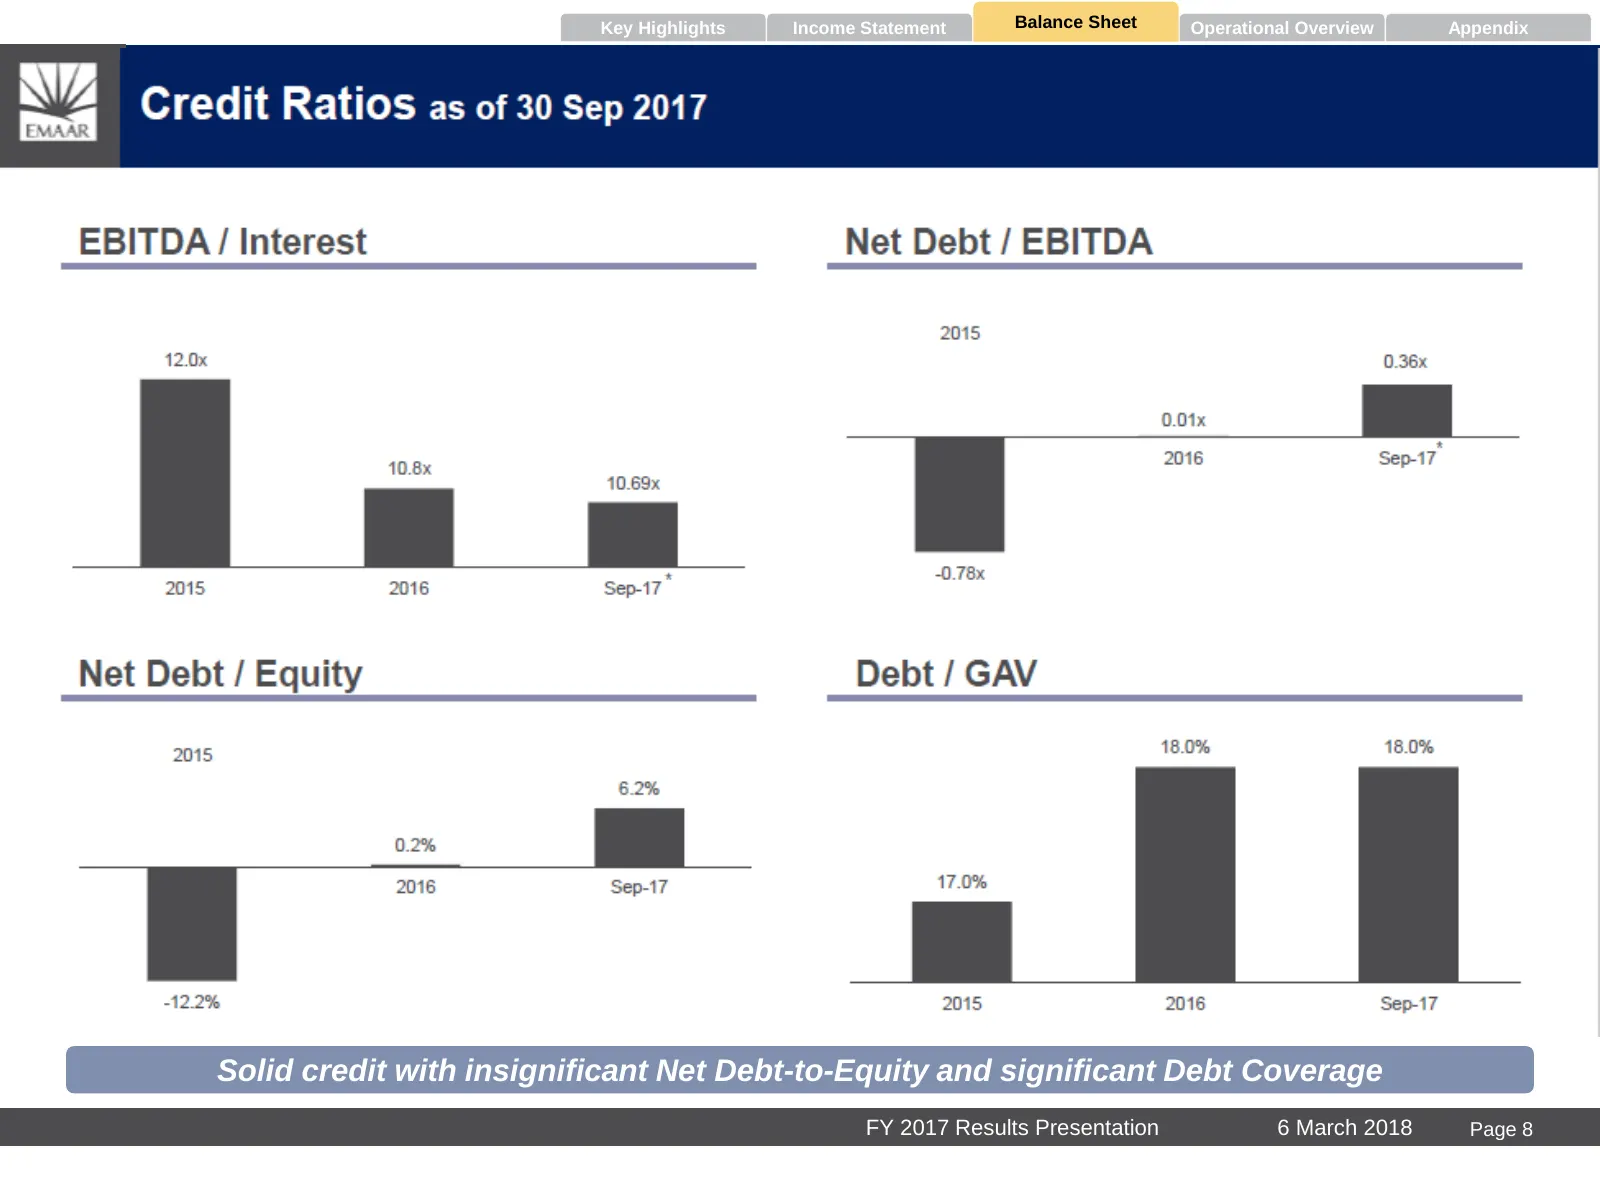
Slide 9: Credit Ratios as of Dec 2017
Key Highlights Income Statement Balance Sheet Operational Overview Appendix BS items to be Credit Ratios as of 30 Dec 2017 presented as of sep.17 for EFG EBITDA / Interest Net Debt / EBITDA 12.0x 0.06x 2015 0.01x * 10.8x 10.9x 2015 2016 2017 -0.78x 2015 2016 2017 Net Debt / Equity Debt / GAV 2015 19
Slide 10: UAE Development
UAE Development
Slide 11: UAE Development Overview
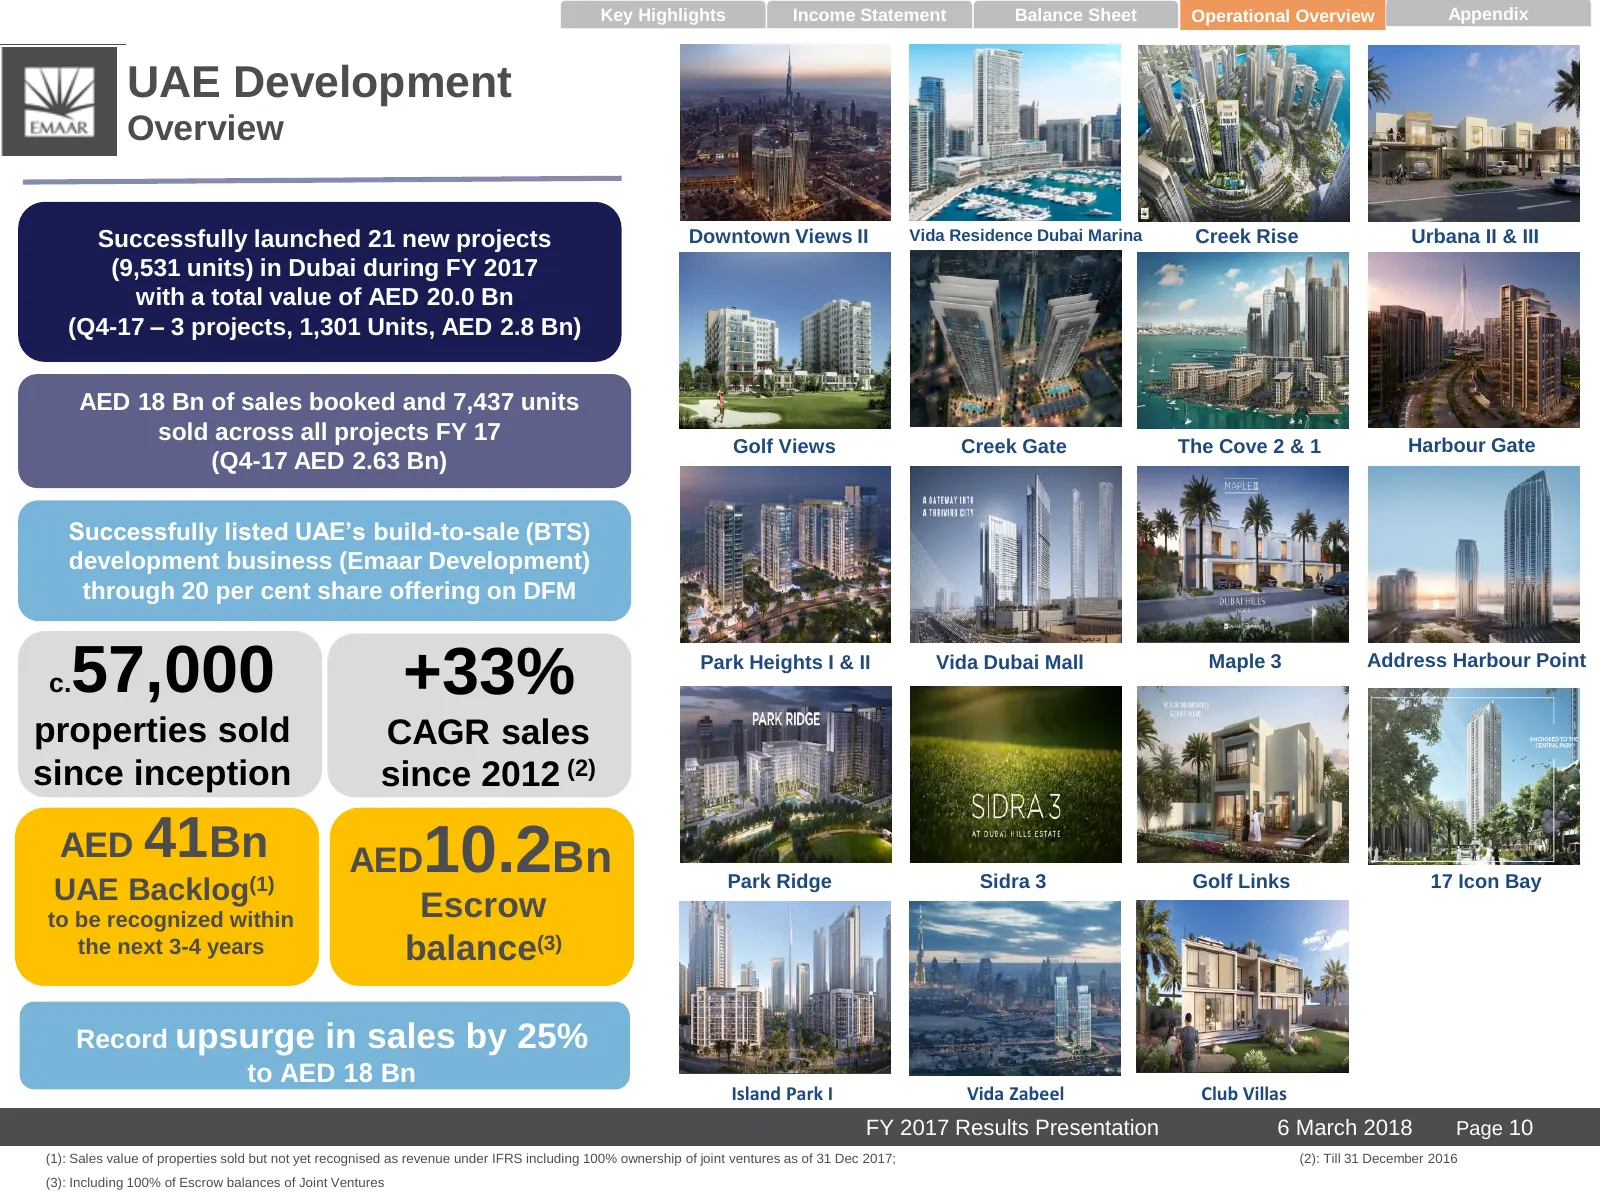
Key Highlights Income Statement Balance Sheet Operational Overview Appendix UAE Development Overview Successfully launched 21 new projects Downtown Views II Vida Residence Dubai Marina Creek Rise Urbana II & III (9,531 units) in Dubai during FY 2017 with a total value of AED 20.0 Bn (Q4-17 – 3 proje
Slide 12: UAE Development - at a glance
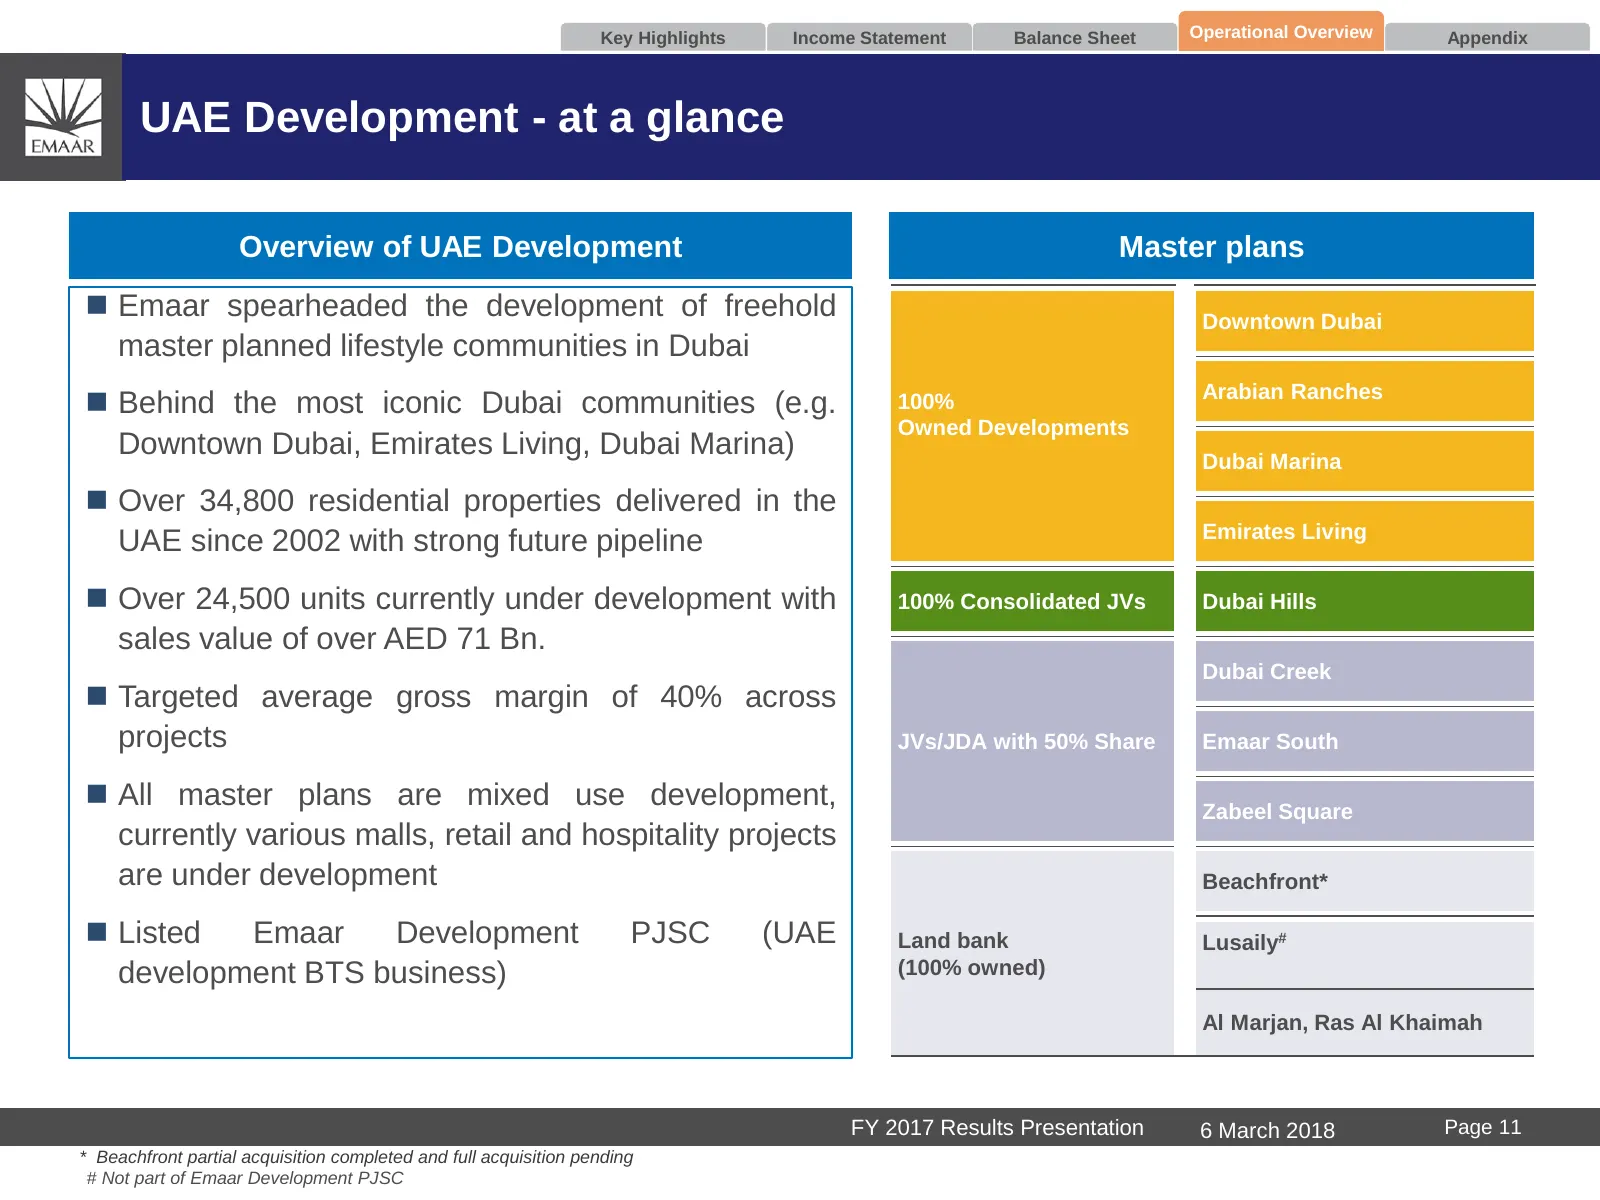
Key Highlights Income Statement Balance Sheet Operational Overview Appendix UAE Development - at a glance Overview of UAE Development Master plans Emaar spearheaded the development of freehold Downtown Dubai master planned lifestyle communities in Dubai Arabian Ranches Behind the most iconic Dub
Slide 13: UAE Development - The strategy going forward
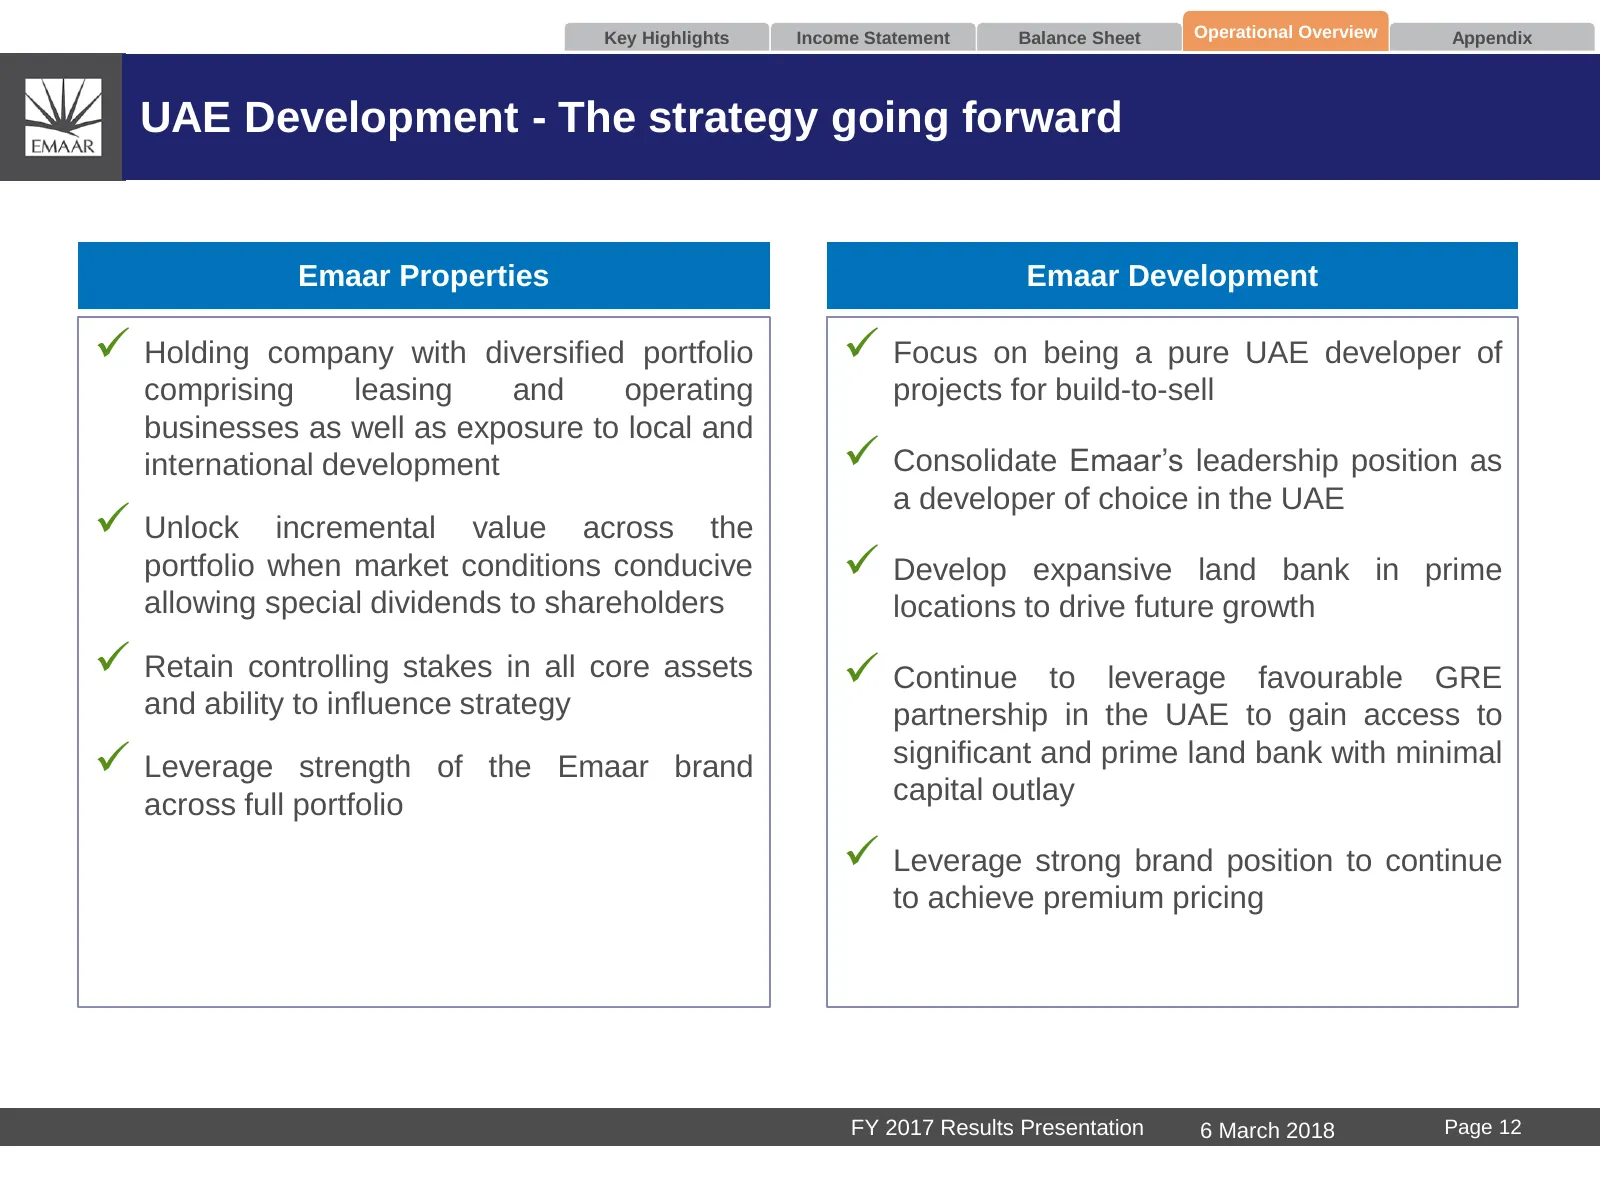
Key Highlights Income Statement Balance Sheet Operational Overview Appendix UAE Development - The strategy going forward Emaar Properties Emaar Development Holding company with diversified portfolio Focus on being a pure UAE developer of comprising leasing and operating projects for build-to-sel
Slide 14: UAE Development - Overview
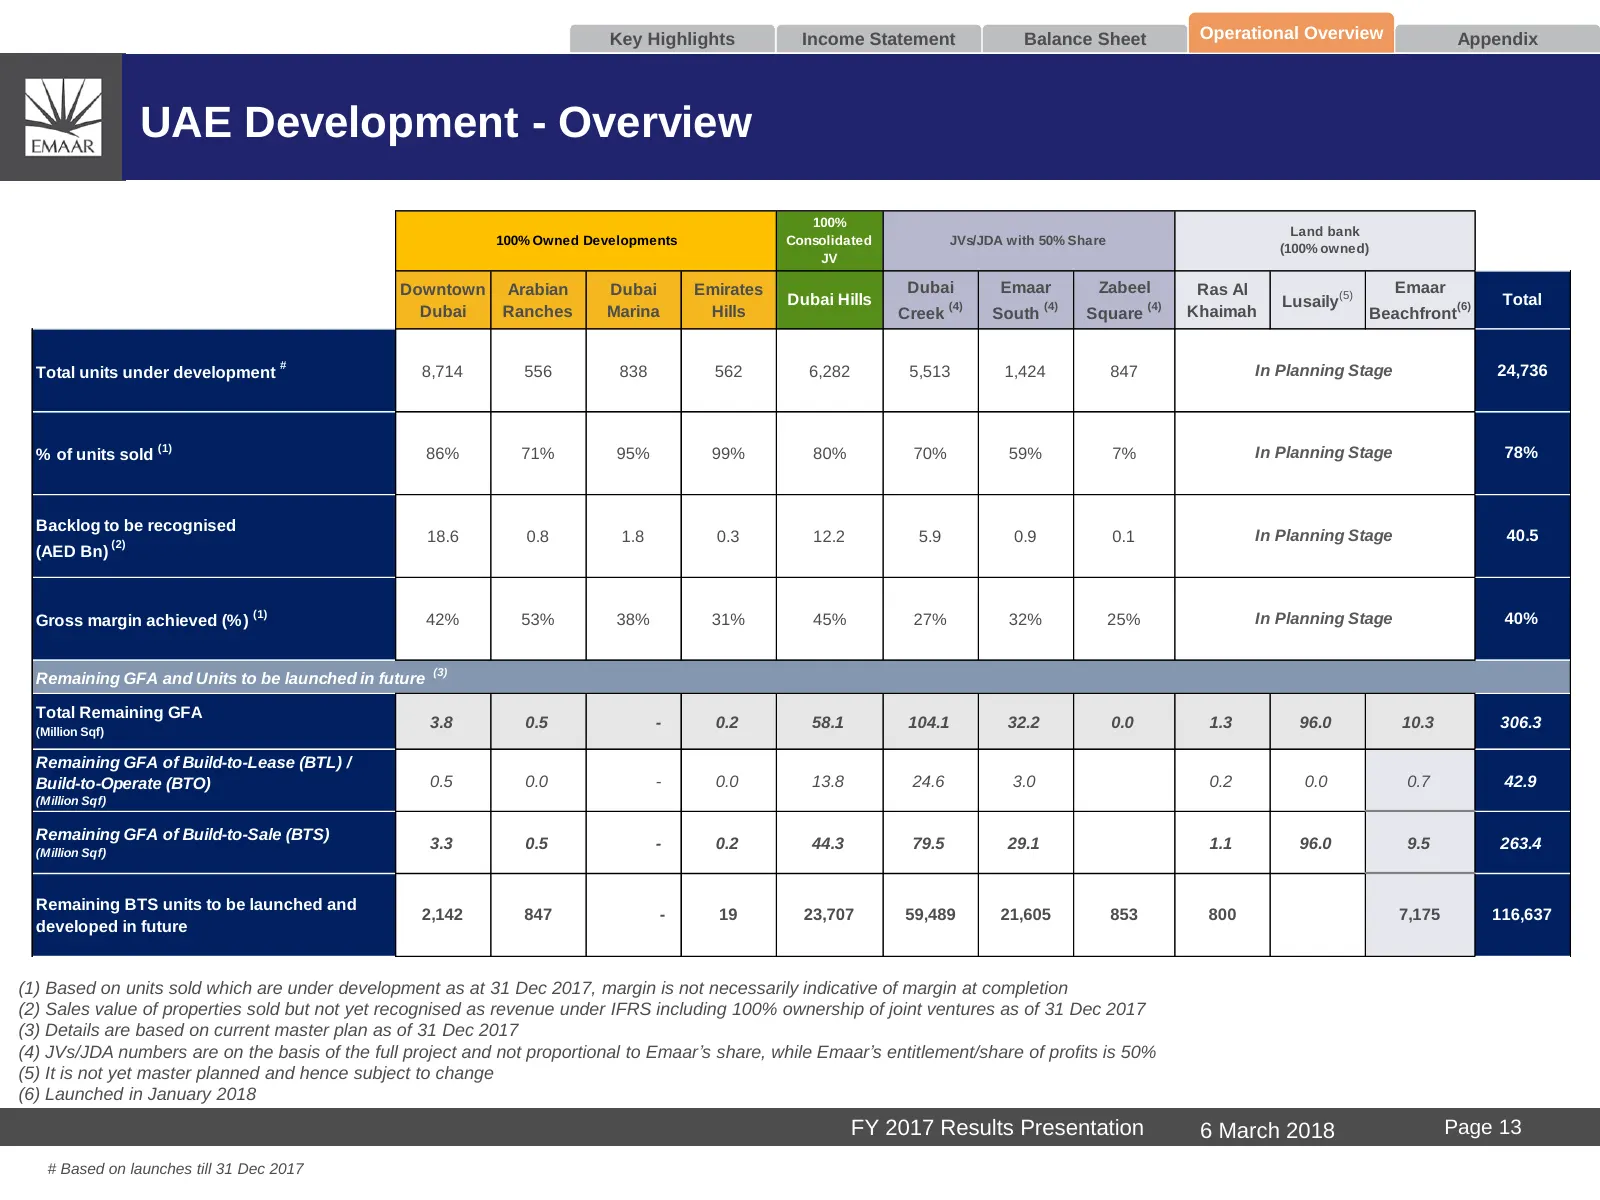
Key Highlights Income Statement Balance Sheet Operational Overview Appendix UAE Development - Overview 100% Land bank 100% Owned Developments Consolidated JVs/JDA with 50% Share (100% owned) JV Downtown Arabian Dubai Emirates Dubai Emaar Zabeel Ras Al Emaar Dubai Hills Lusaily(5) Total Dubai Ranches
Slide 15: Emaar Development - Financial Performance
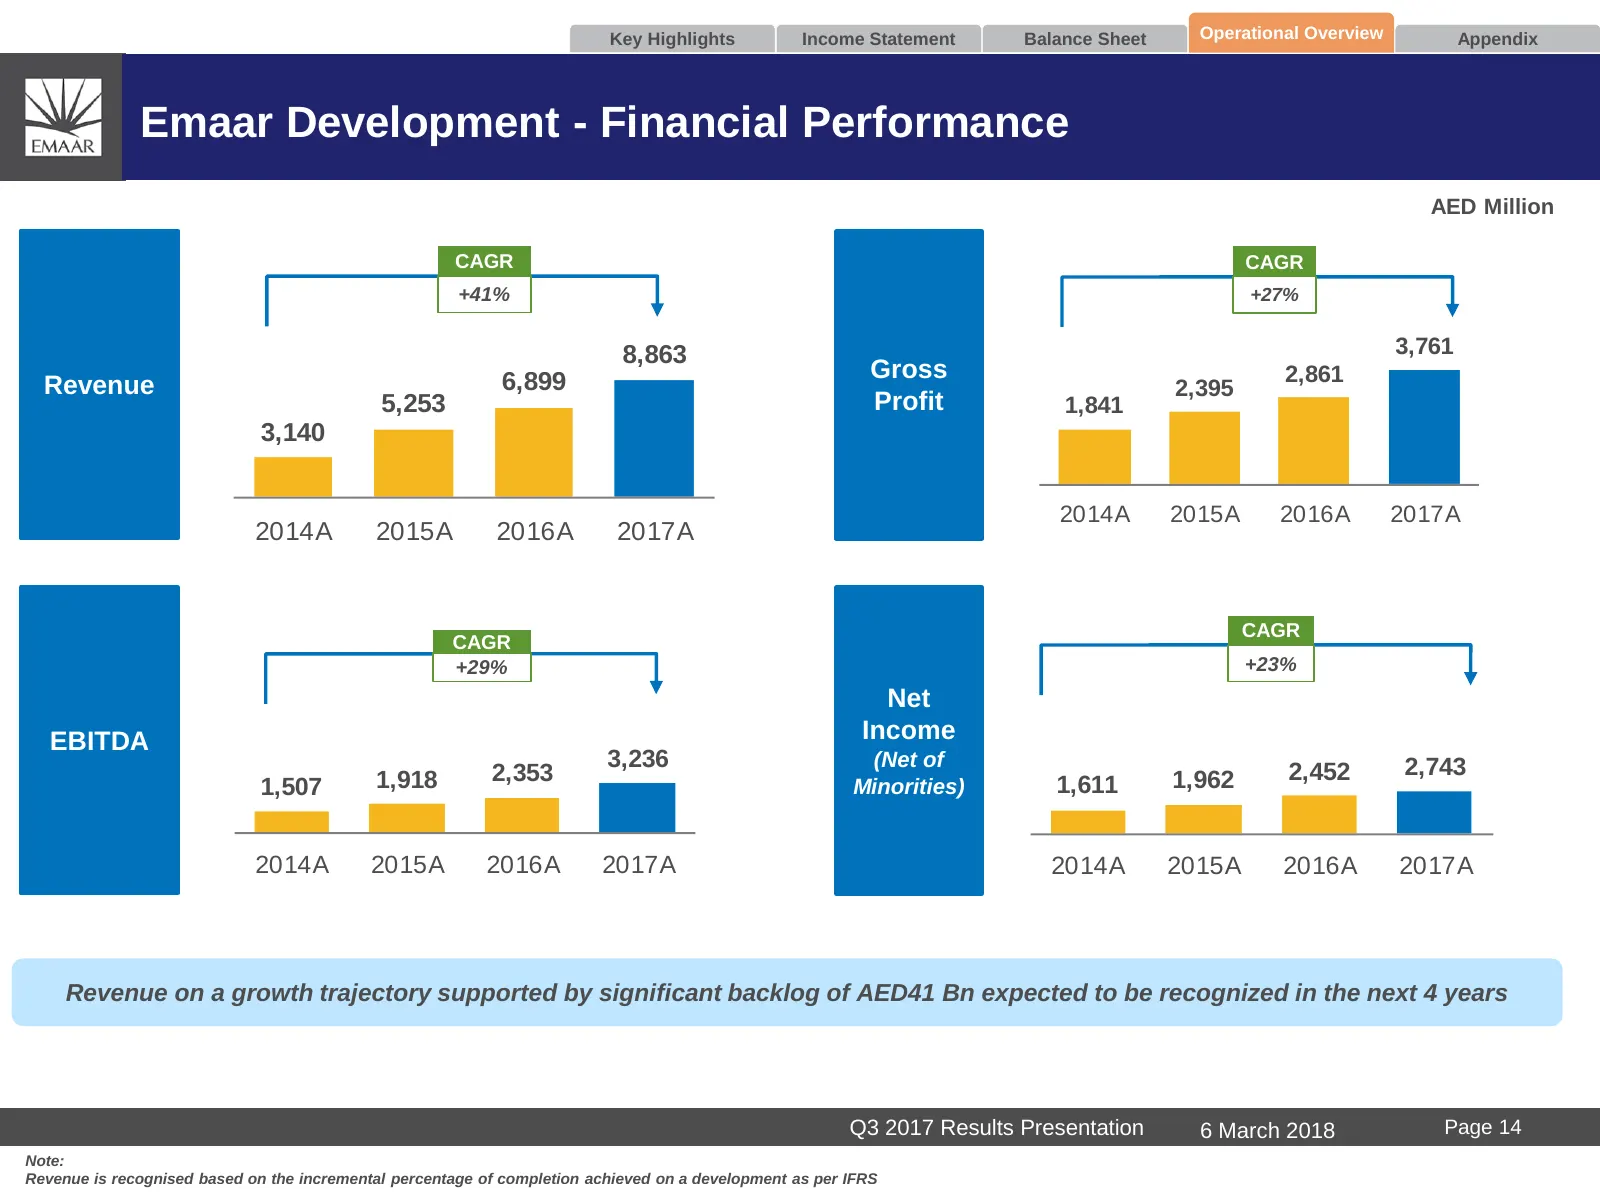
Key Highlights Income Statement Balance Sheet Operational Overview Appendix Emaar Development - Financial Performance AED Million CAGR CAGR +41% +27% 8,863 3,761 6,899 Gross 2,861 Revenue 2,395 5,253 Profit 1,841 3,140 2014A 2015A 2016A 2017A 2014A 2015A 2016A 2017A CAGR CAGR +29% +23% Net EBITDA In
Slide 16: Emaar Development - Balance Sheet Overview
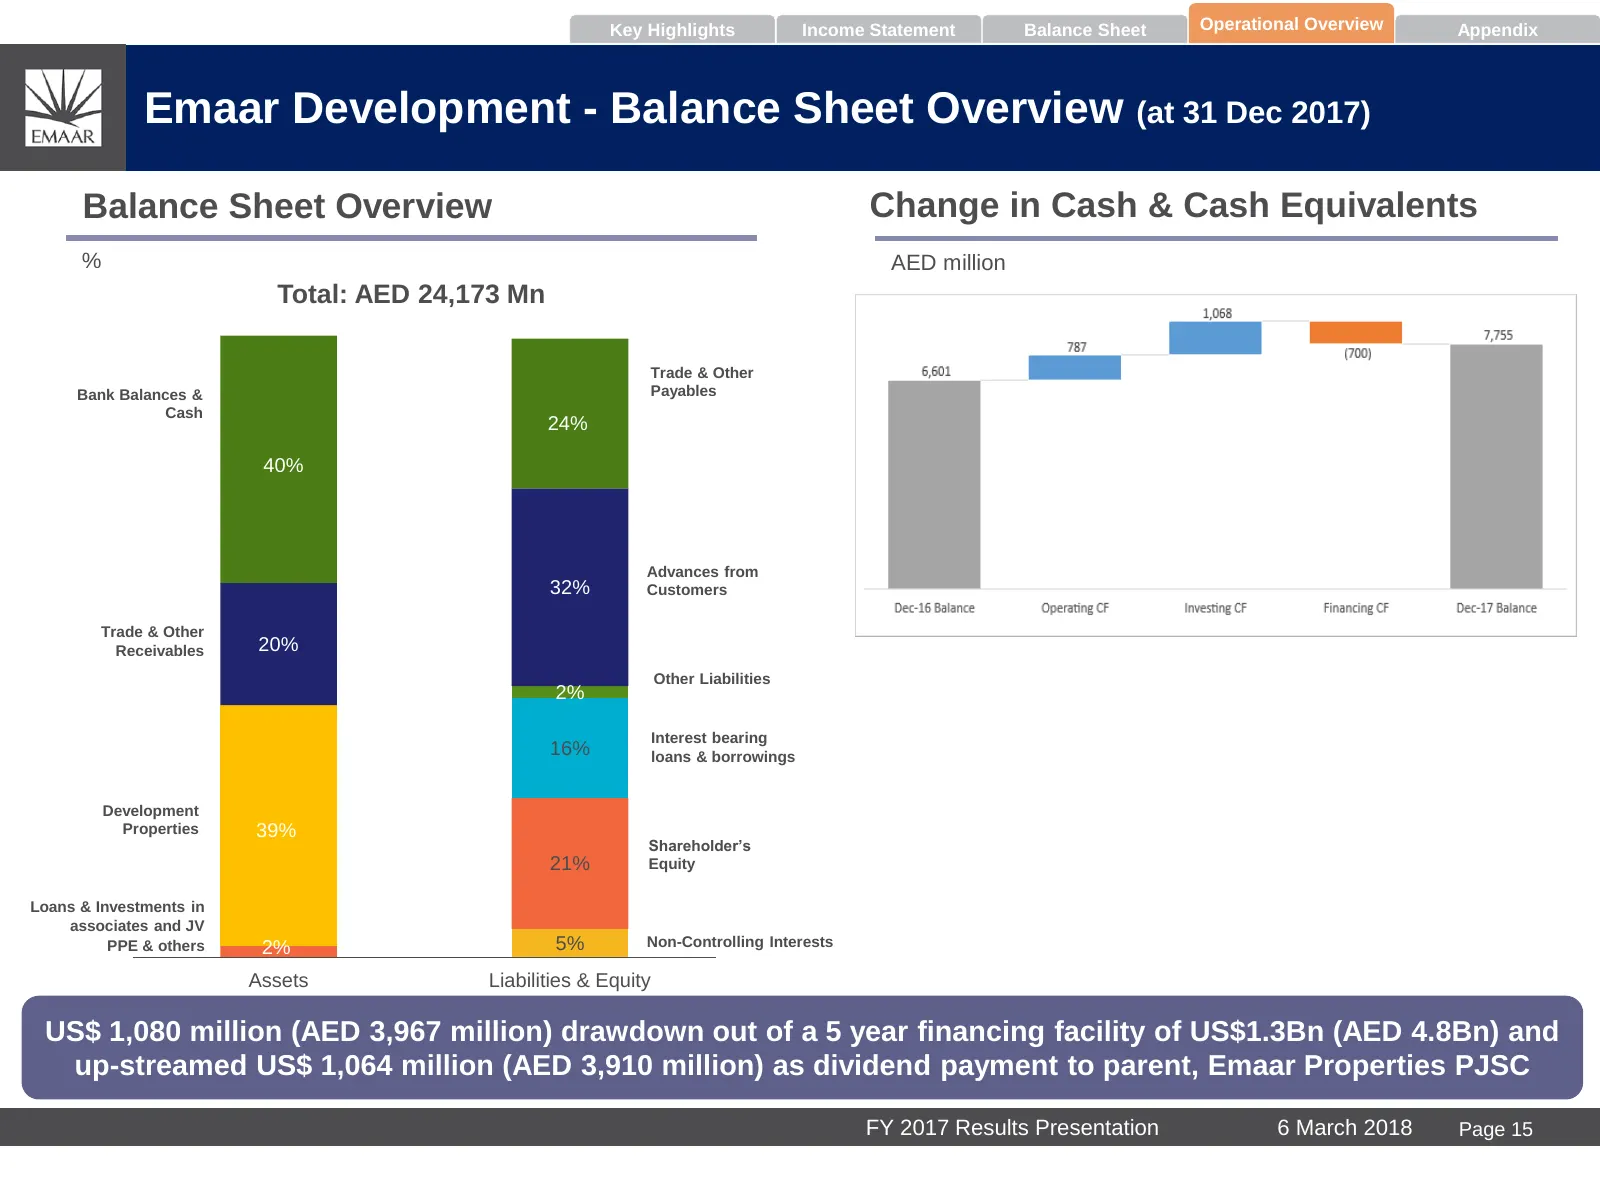
Key Highlights Income Statement Balance Sheet Operational Overview Appendix Emaar Development - Balance Sheet Overview (at 31 Dec 2017) Balance Sheet Overview Change in Cash & Cash Equivalents % AED million Total: AED 24,173 Mn Trade & Other Bank Balances & Payables Cash 24% 40% Advances from 32% Cu
Slide 17: International Development
International Development
Slide 18: International Development Overview
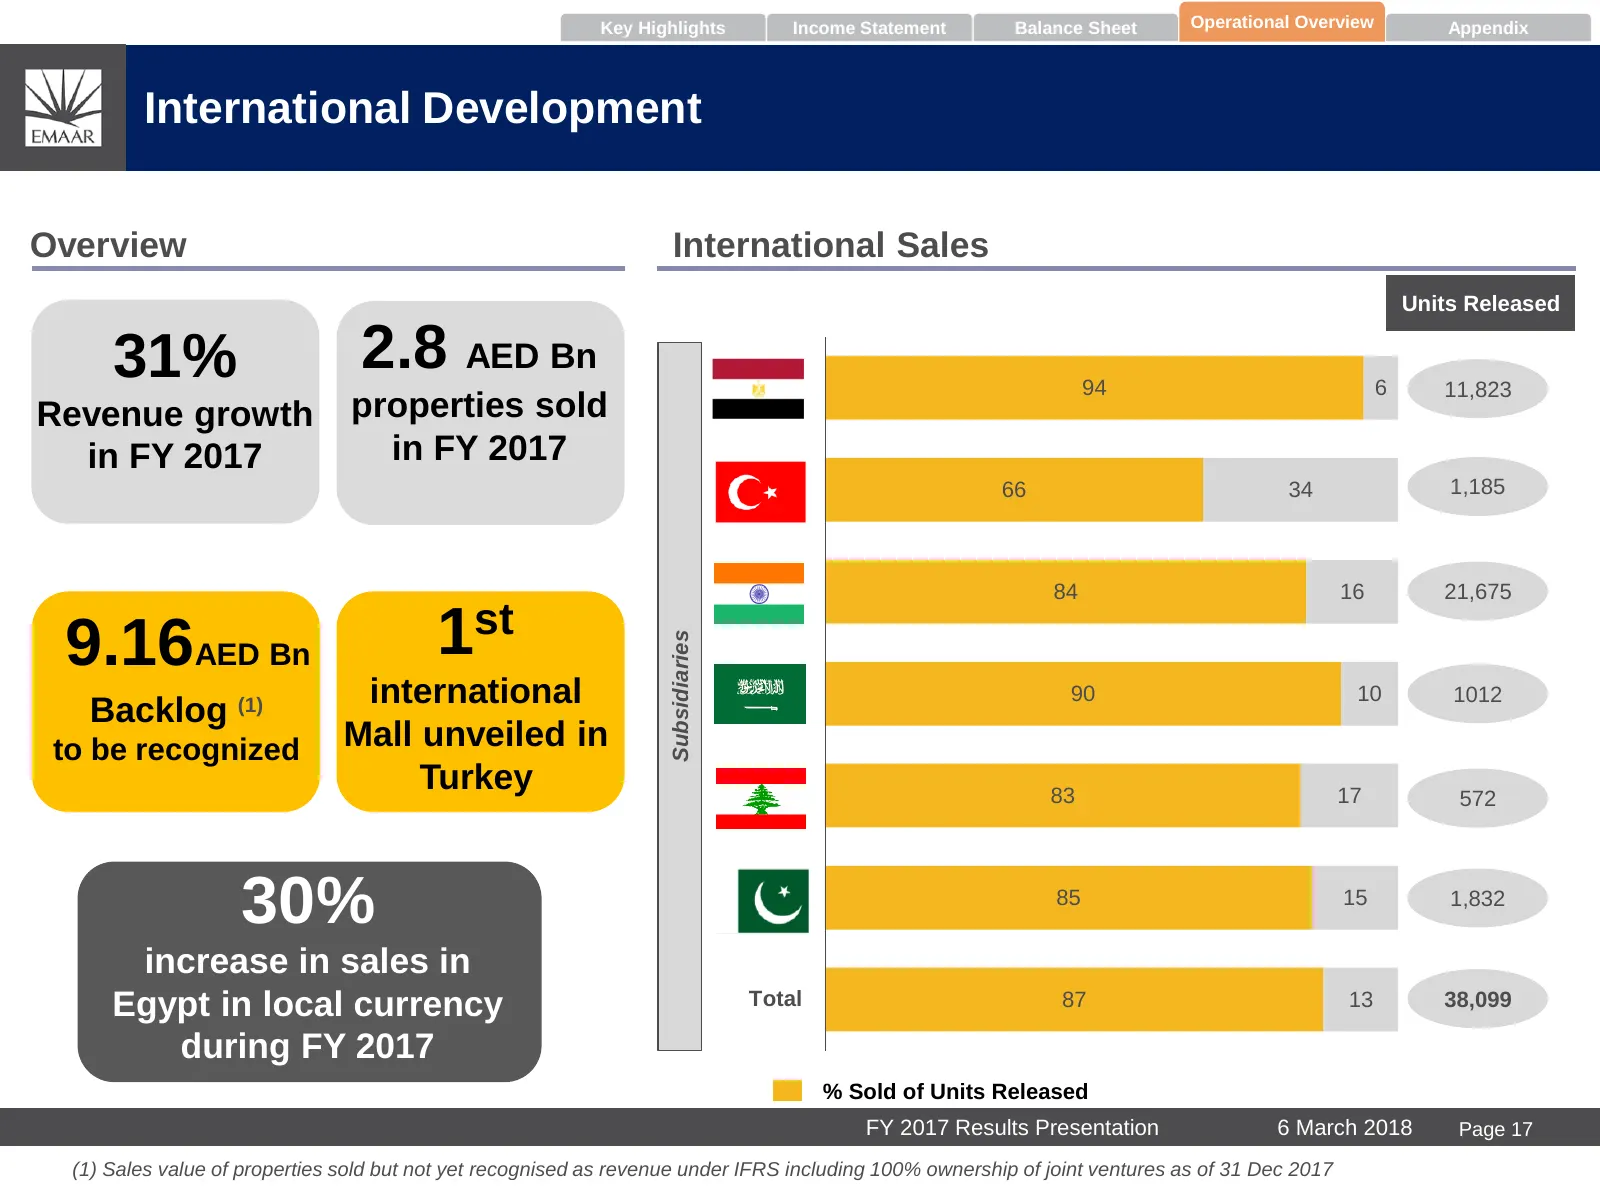
Key Highlights Income Statement Balance Sheet Operational Overview Appendix International Development Overview International Sales Units Released 31% 2.8 AED Bn Egy 94 6 11,823 Revenue growth properties sold pt in FY 2017 in FY 2017 Turk 1,185 66 34 ey Indi 84 16 21,675 a 9.16AED Bn 1st Subsidiaries
Slide 19: Emaar Misr for Development
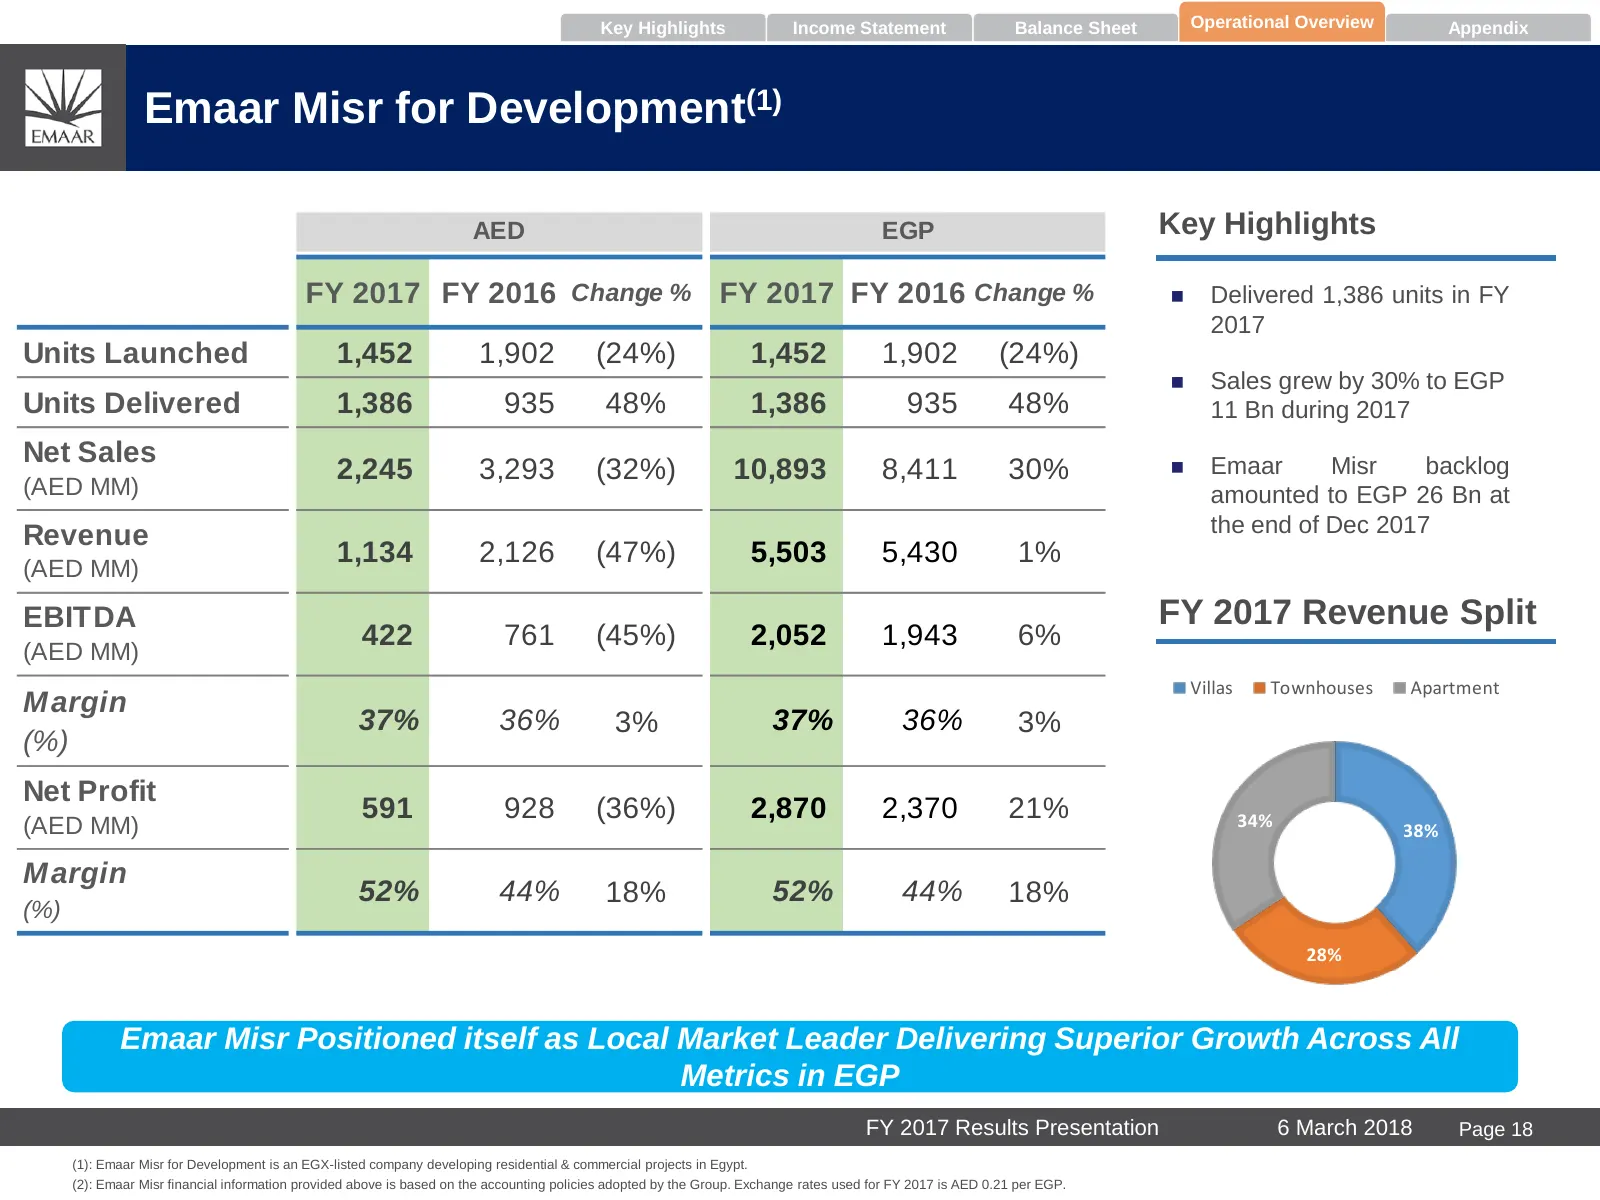
Key Highlights Income Statement Balance Sheet Operational Overview Appendix Emaar Misr for Development(1) AED EGP Key Highlights FY 2017 FY 2016 Change % FY 2017 FY 2016 Change % Delivered 1,386 units in FY 2017 Units Launched 1,452 1,902 (24%) 1,452 1,902 (24%) Sales grew by 30% to EGP Units De
Slide 20: Emaar Malls
Emaar Malls FY 2017 Results Presentation 6 March 2018 Page 19
Slide 21: Emaar Malls – Key Highlights
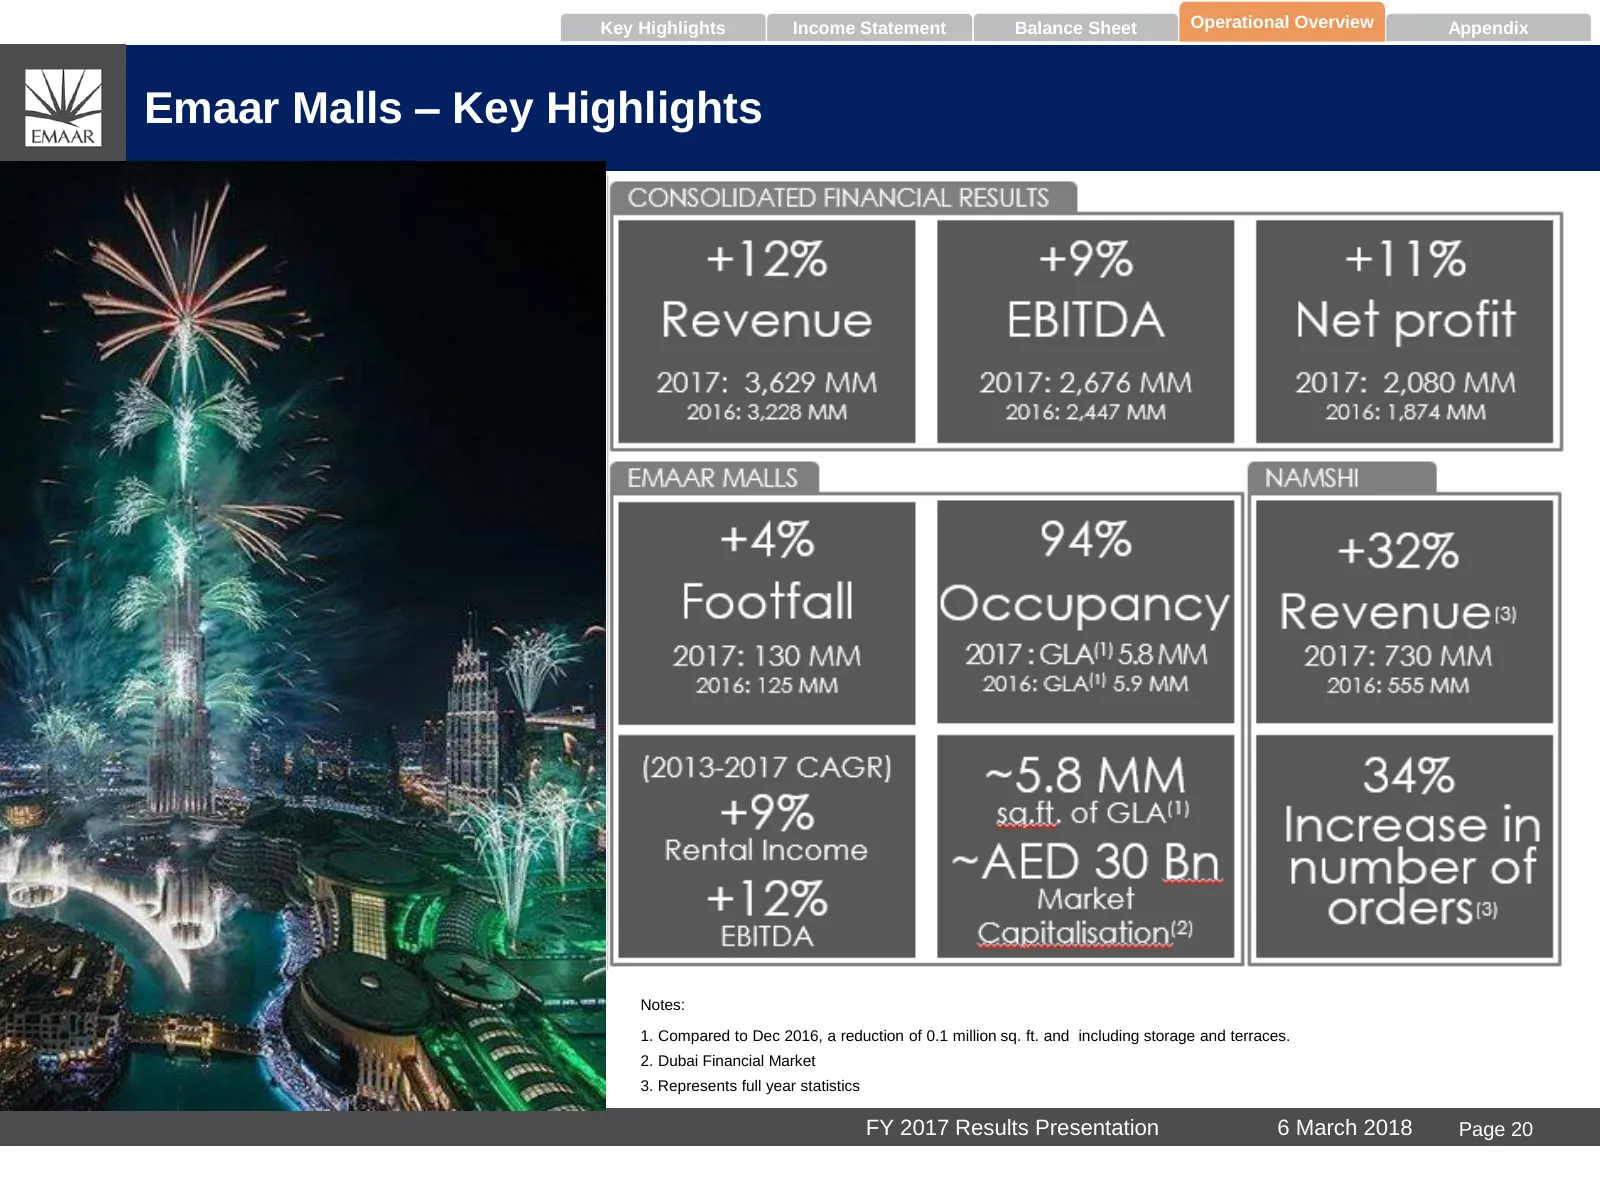
Key Highlights Income Statement Balance Sheet Operational Overview Appendix Emaar Malls – Key Highlights Notes: 1. Compared to Dec 2016, a reduction of 0.1 million sq. ft. and including storage and terraces. 2. Dubai Financial Market – 16 February 2018 3. Represents full year statistics FY 2017 Resu
Slide 22: Emaar Malls - Performance
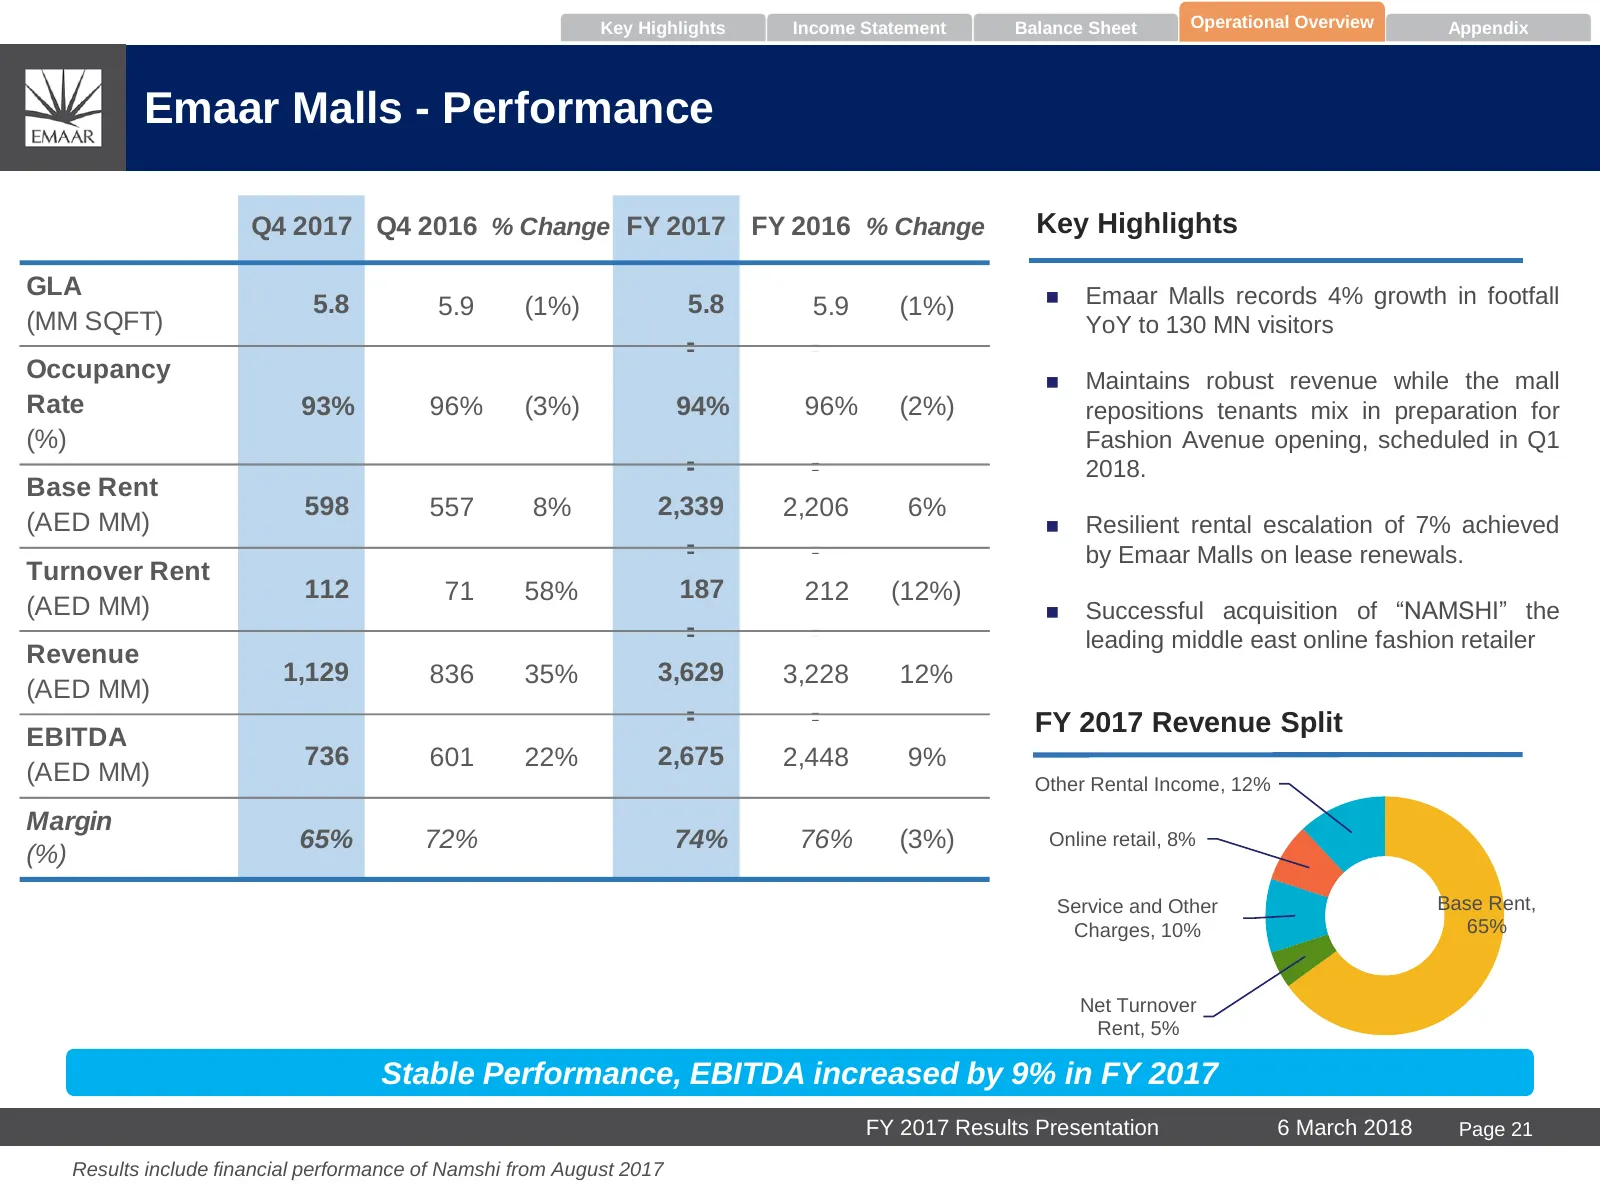
Key Highlights Income Statement Balance Sheet Operational Overview Appendix Emaar Malls - Performance Q4 2017 Q4 2016 % Change FY 2017 FY 2016 % Change Key Highlights GLA Emaar Malls records 4% growth in footfall 5.8 5.9 (1%) 5.8 5.9 (1%) (MM SQFT) YoY to 130 MN visitors -- -- Occupancy Maintain
Slide 23: Emaar Malls - Rental Income
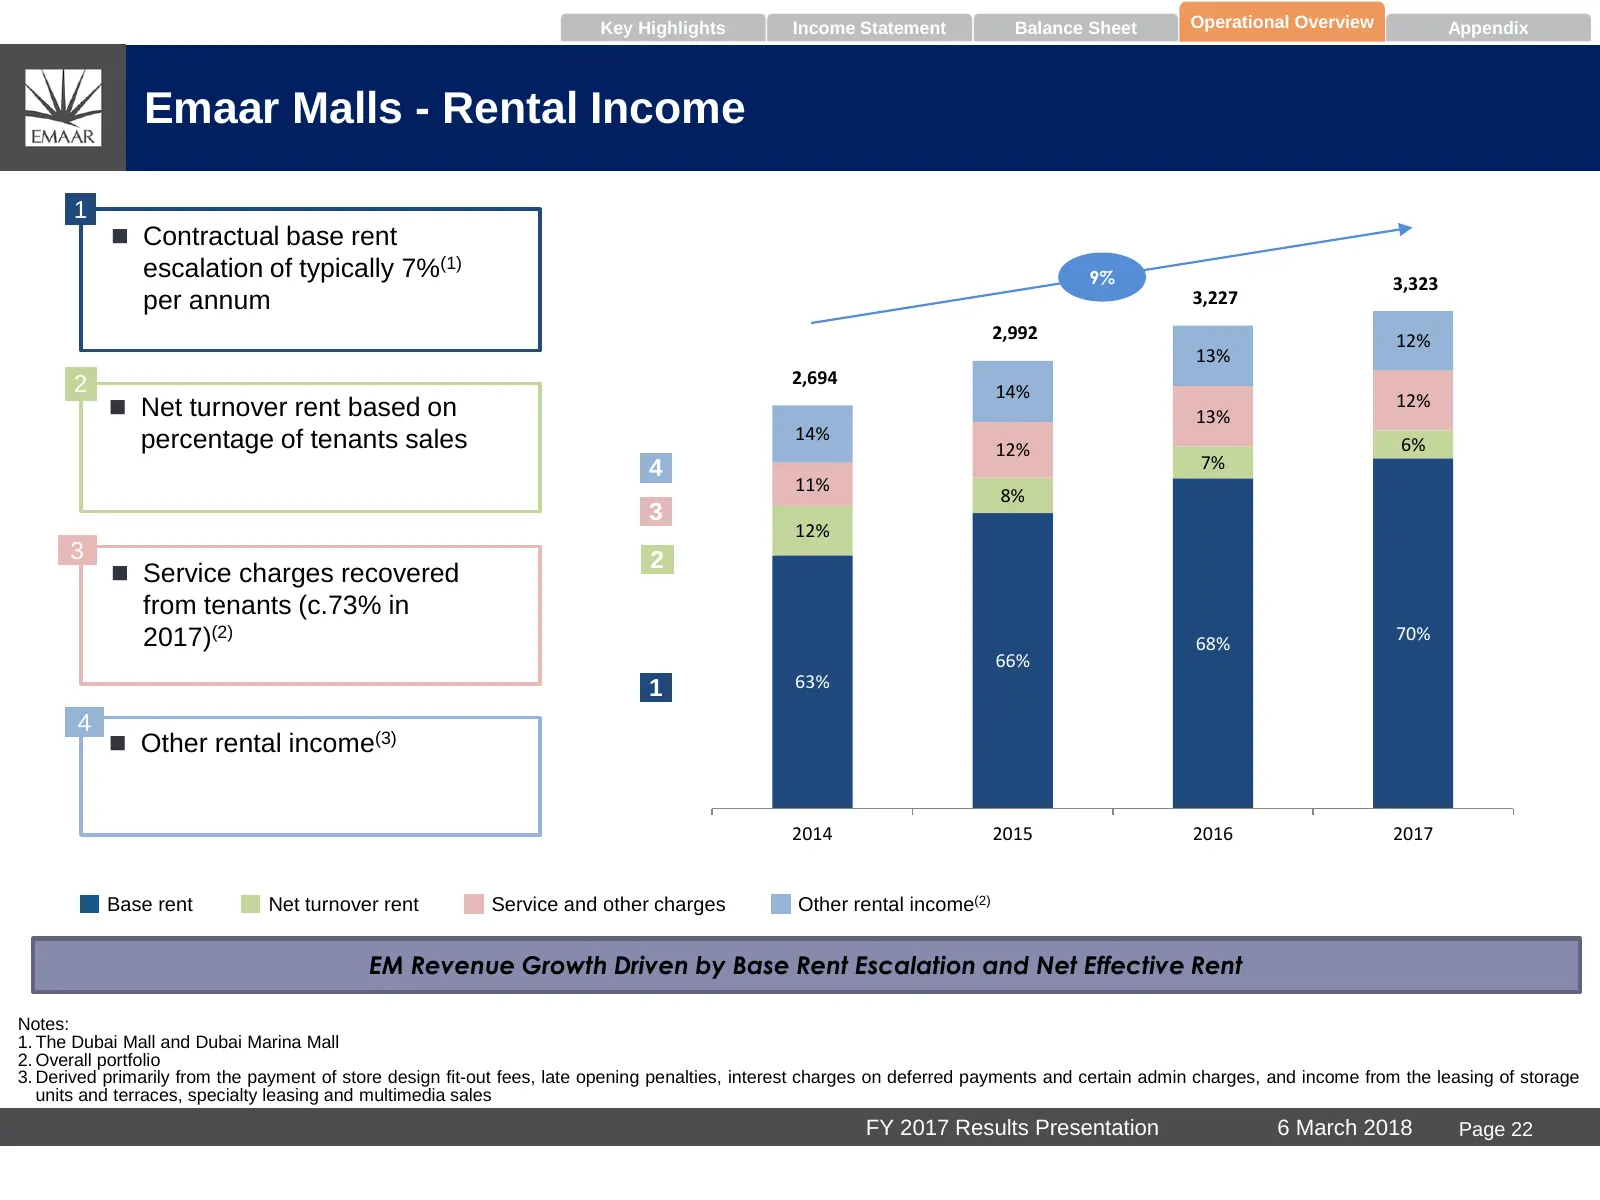
Key Highlights Income Statement Balance Sheet Operational Overview Appendix Emaar Malls - Rental Income 1 Contractual base rent escalation of typically 7%(1) 9% 3,323 per annum 3,227 2,992 12% 13% 2 2,694 14% 12% Net turnover rent based on 13% percentage of tenants sales 14% 12% 6% 4 7% 11% 8% 3
Slide 24: Emaar Malls - The Dubai Mall Expansions
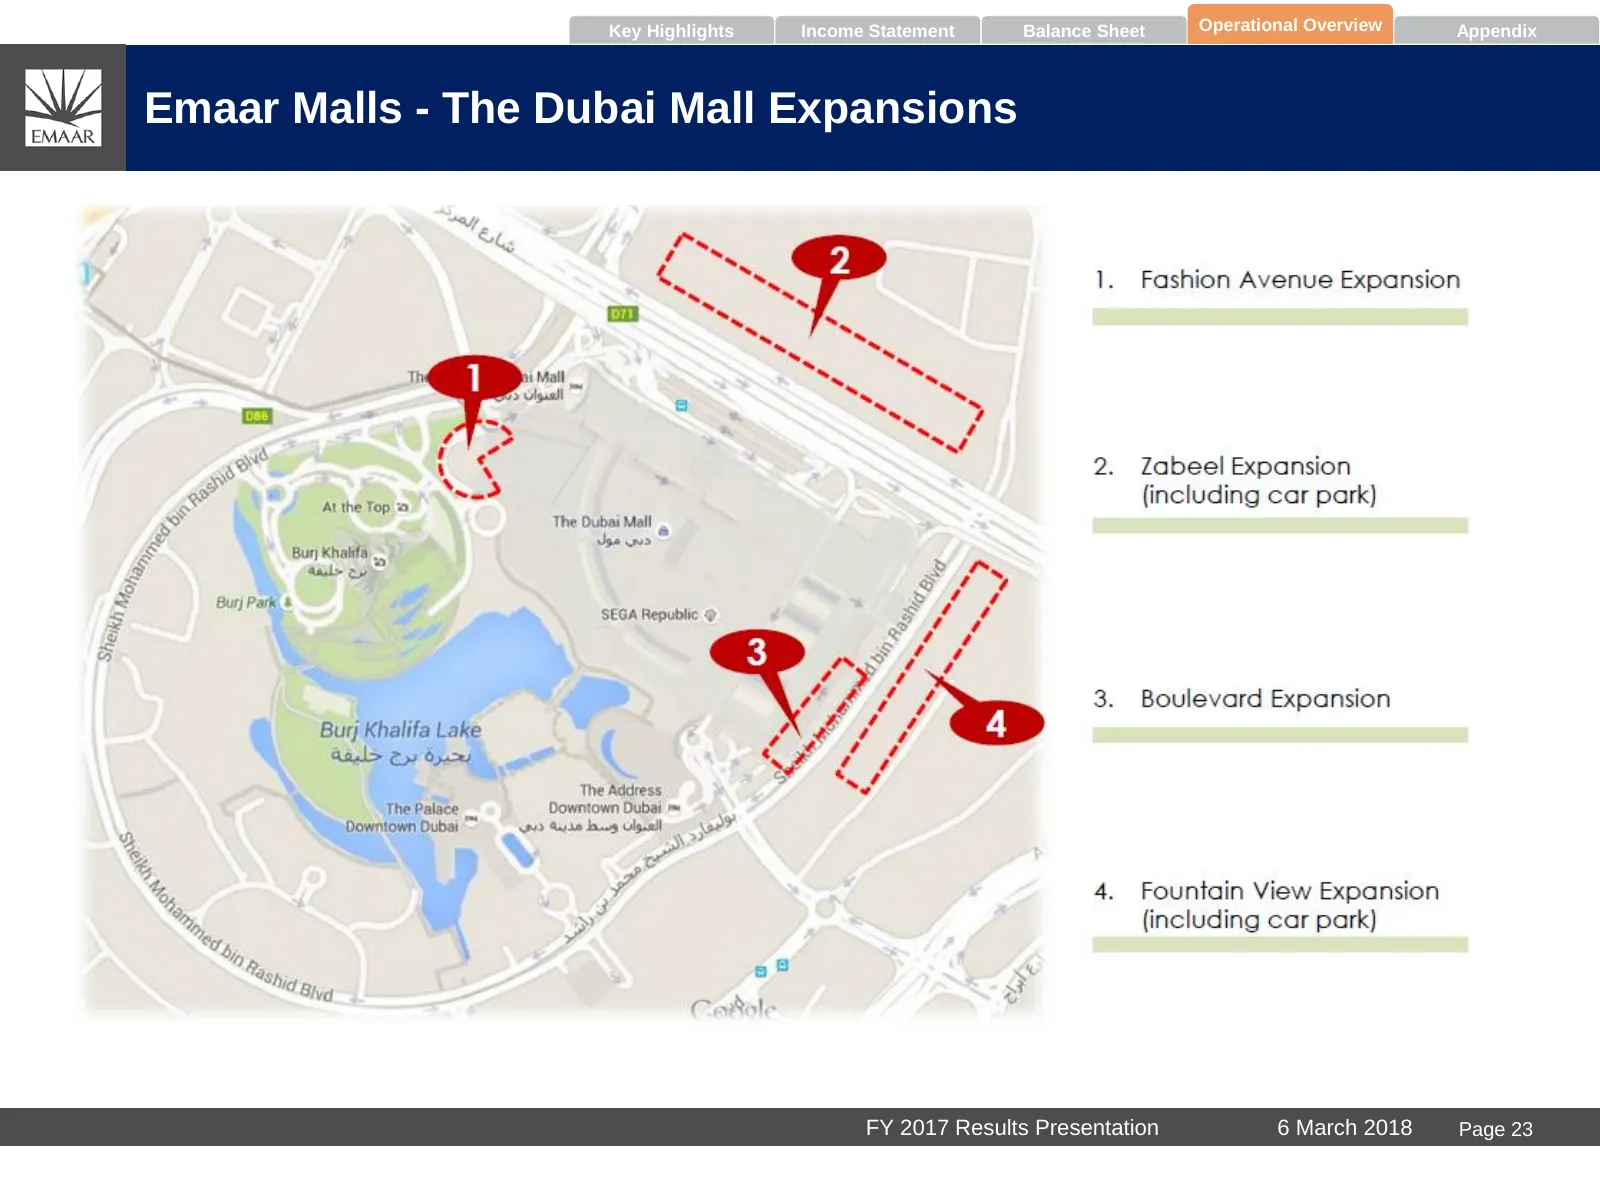
Key Highlights Income Statement Balance Sheet Operational Overview Appendix Emaar Malls - The Dubai Mall Expansions FY 2017 Results Presentation 6 March 2018 Page 23
Slide 25: Emaar Malls – Key Strengths
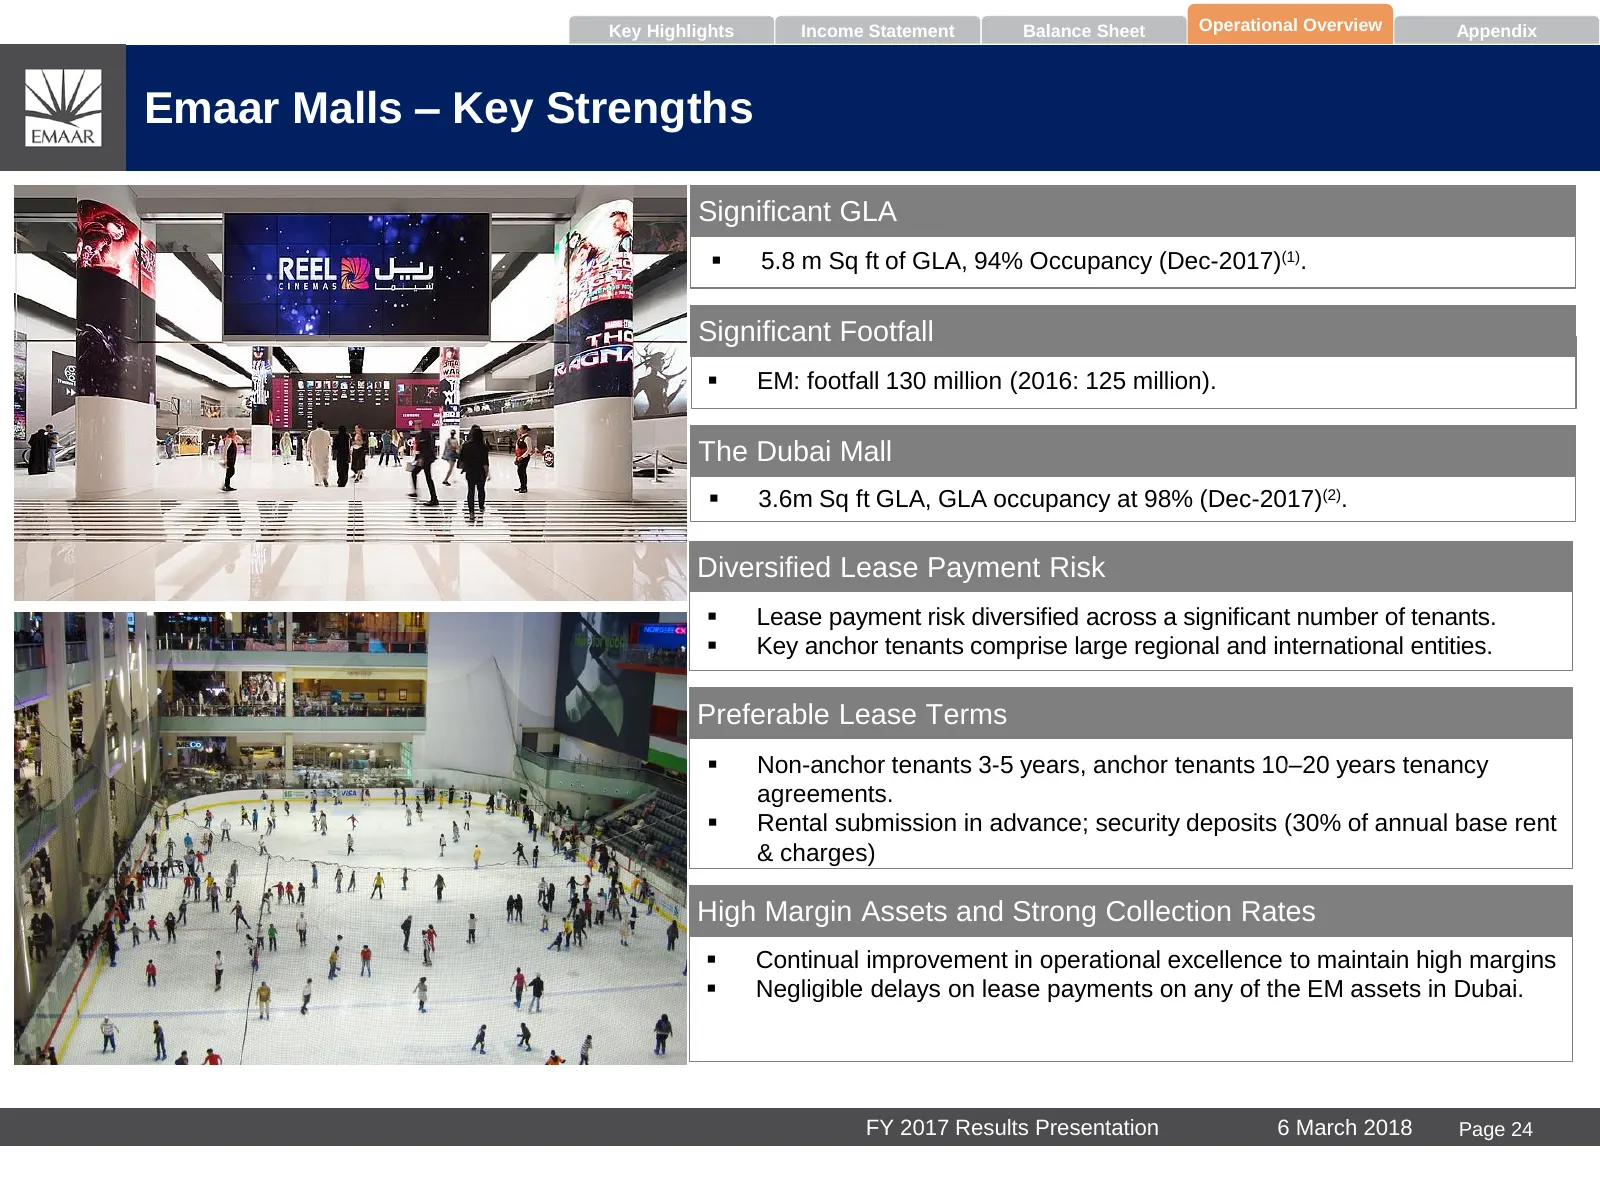
Key Highlights Income Statement Balance Sheet Operational Overview Appendix Emaar Malls – Key Strengths Significant GLA 5.8 m Sq ft of GLA, 94% Occupancy (Dec-2017)(1). Significant Footfall EM: footfall 130 million (2016: 125 million). The Dubai Mall 3.6m Sq ft GLA, GLA occupancy at 98% (Dec-2
Slide 26: Emaar Malls – Key Strengths (contd…)
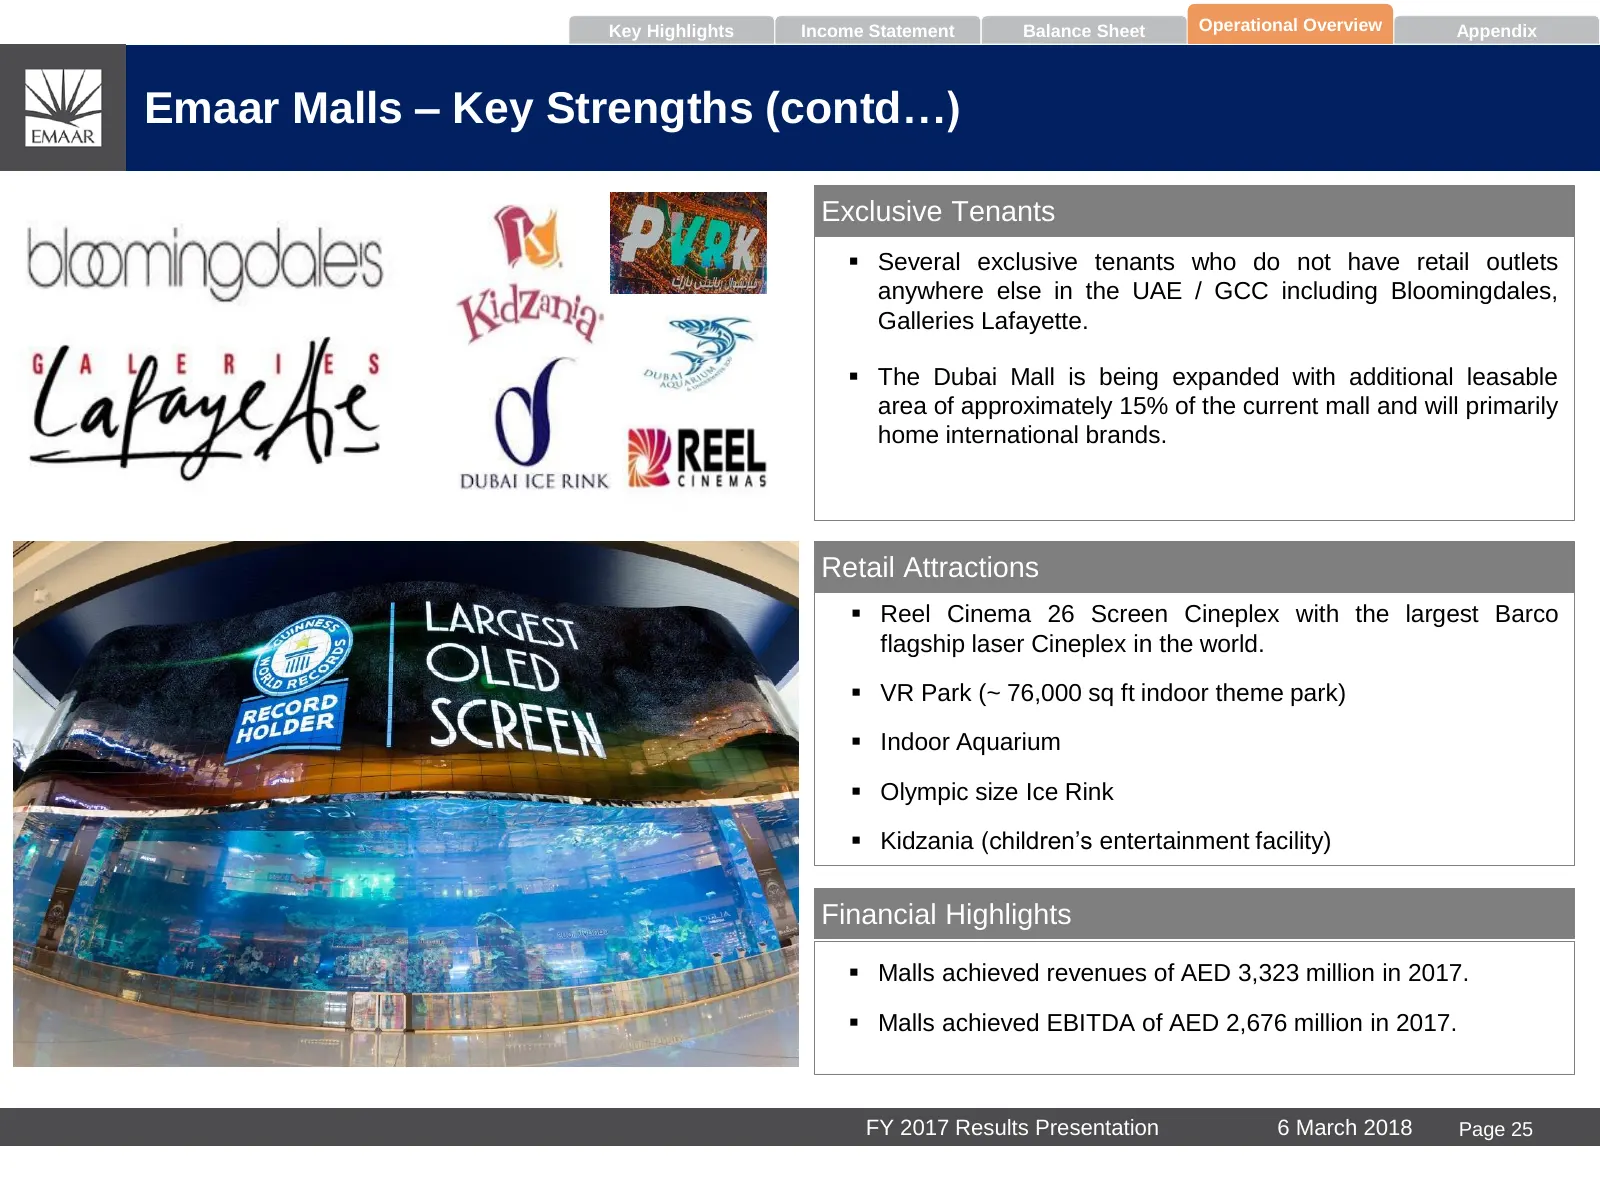
Key Highlights Income Statement Balance Sheet Operational Overview Appendix Emaar Malls – Key Strengths (contd…) Exclusive Tenants Several exclusive tenants who do not have retail outlets anywhere else in the UAE / GCC including Bloomingdales, Galleries Lafayette. The Dubai Mall is being expande
Slide 27: Emaar Malls – Lease Renewal Status
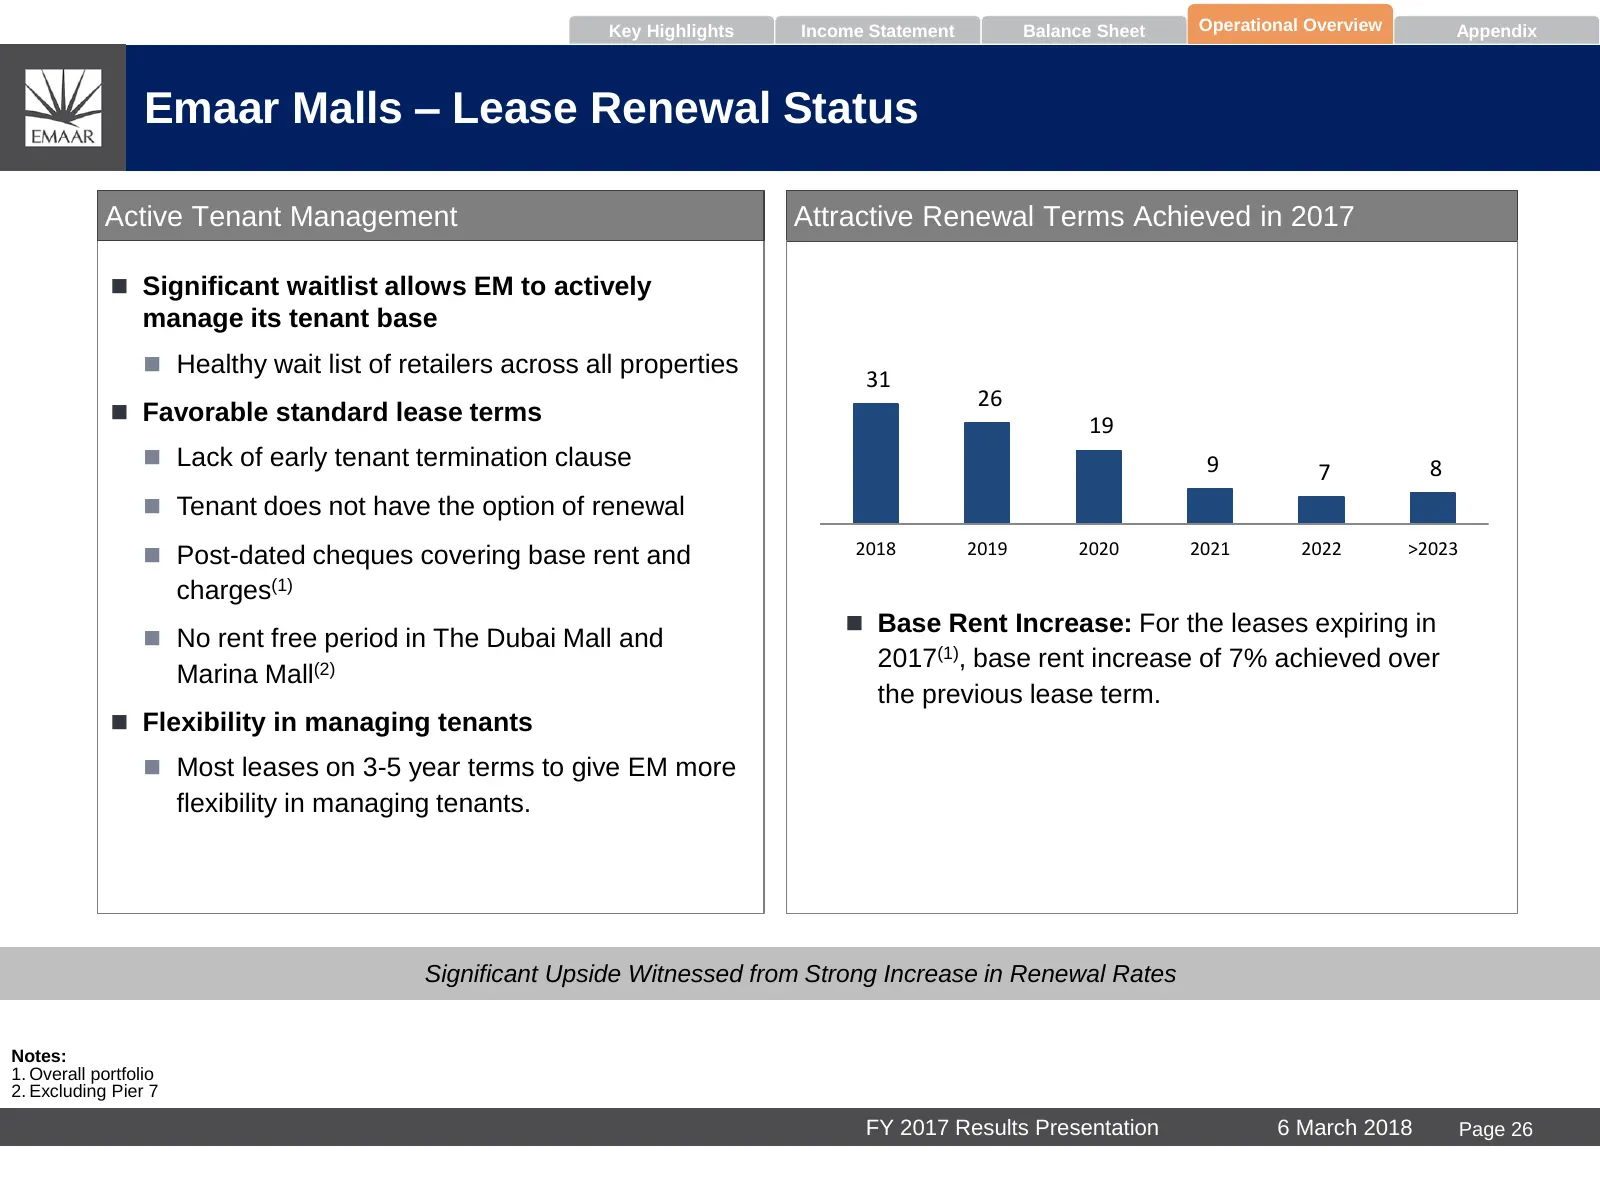
Key Highlights Income Statement Balance Sheet Operational Overview Appendix Emaar Malls – Lease Renewal Status Active Tenant Management Attractive Renewal Terms Achieved in 2017 Significant waitlist allows EM to actively manage its tenant base Healthy wait list of retailers across all properties
Slide 28: Hospitality Group
Hospitality Group
Slide 29: Hospitality Group
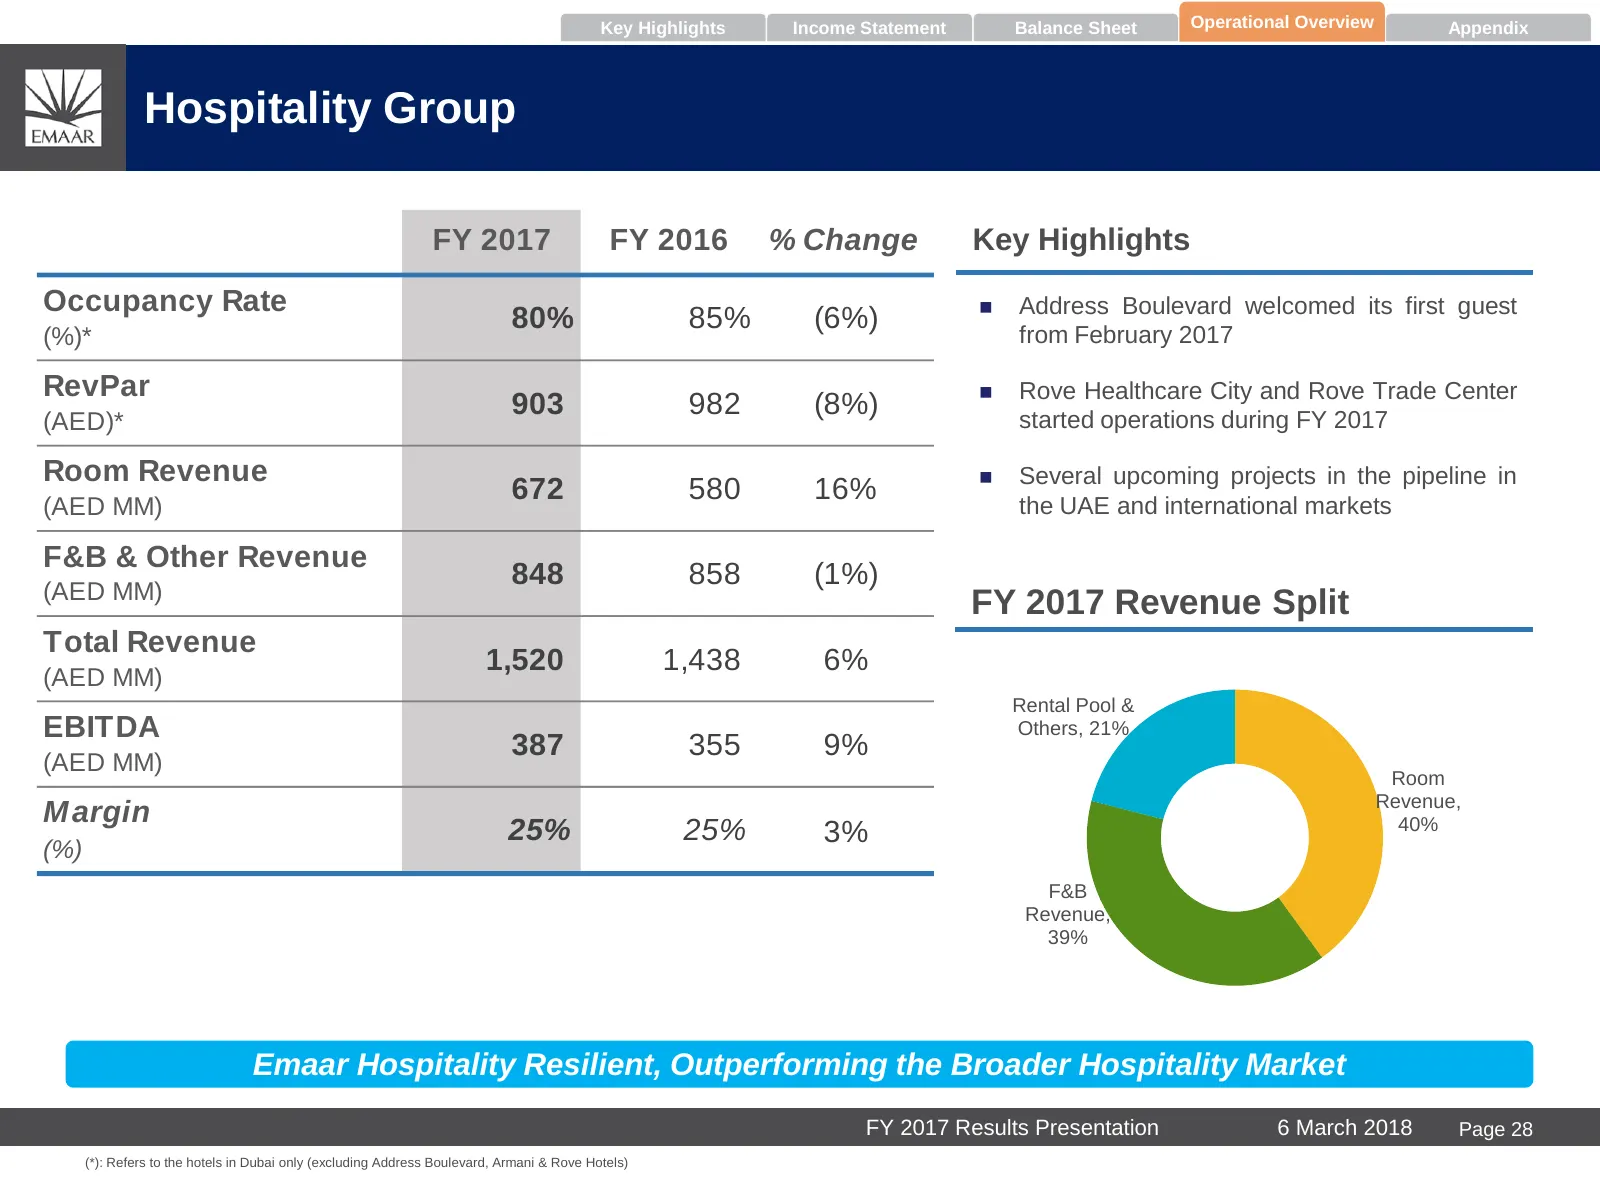
Key Highlights Income Statement Balance Sheet Operational Overview Appendix Hospitality Group FY 2017 FY 2016 % Change Key Highlights Occupancy Rate Address Boulevard welcomed its first guest 80% 85% (6%) from February 2017 (%)* RevPar Rove Healthcare City and Rove Trade Center 903 982 (8%) star
Slide 30: Emaar Hospitality Group: Asset Performance Breakdown
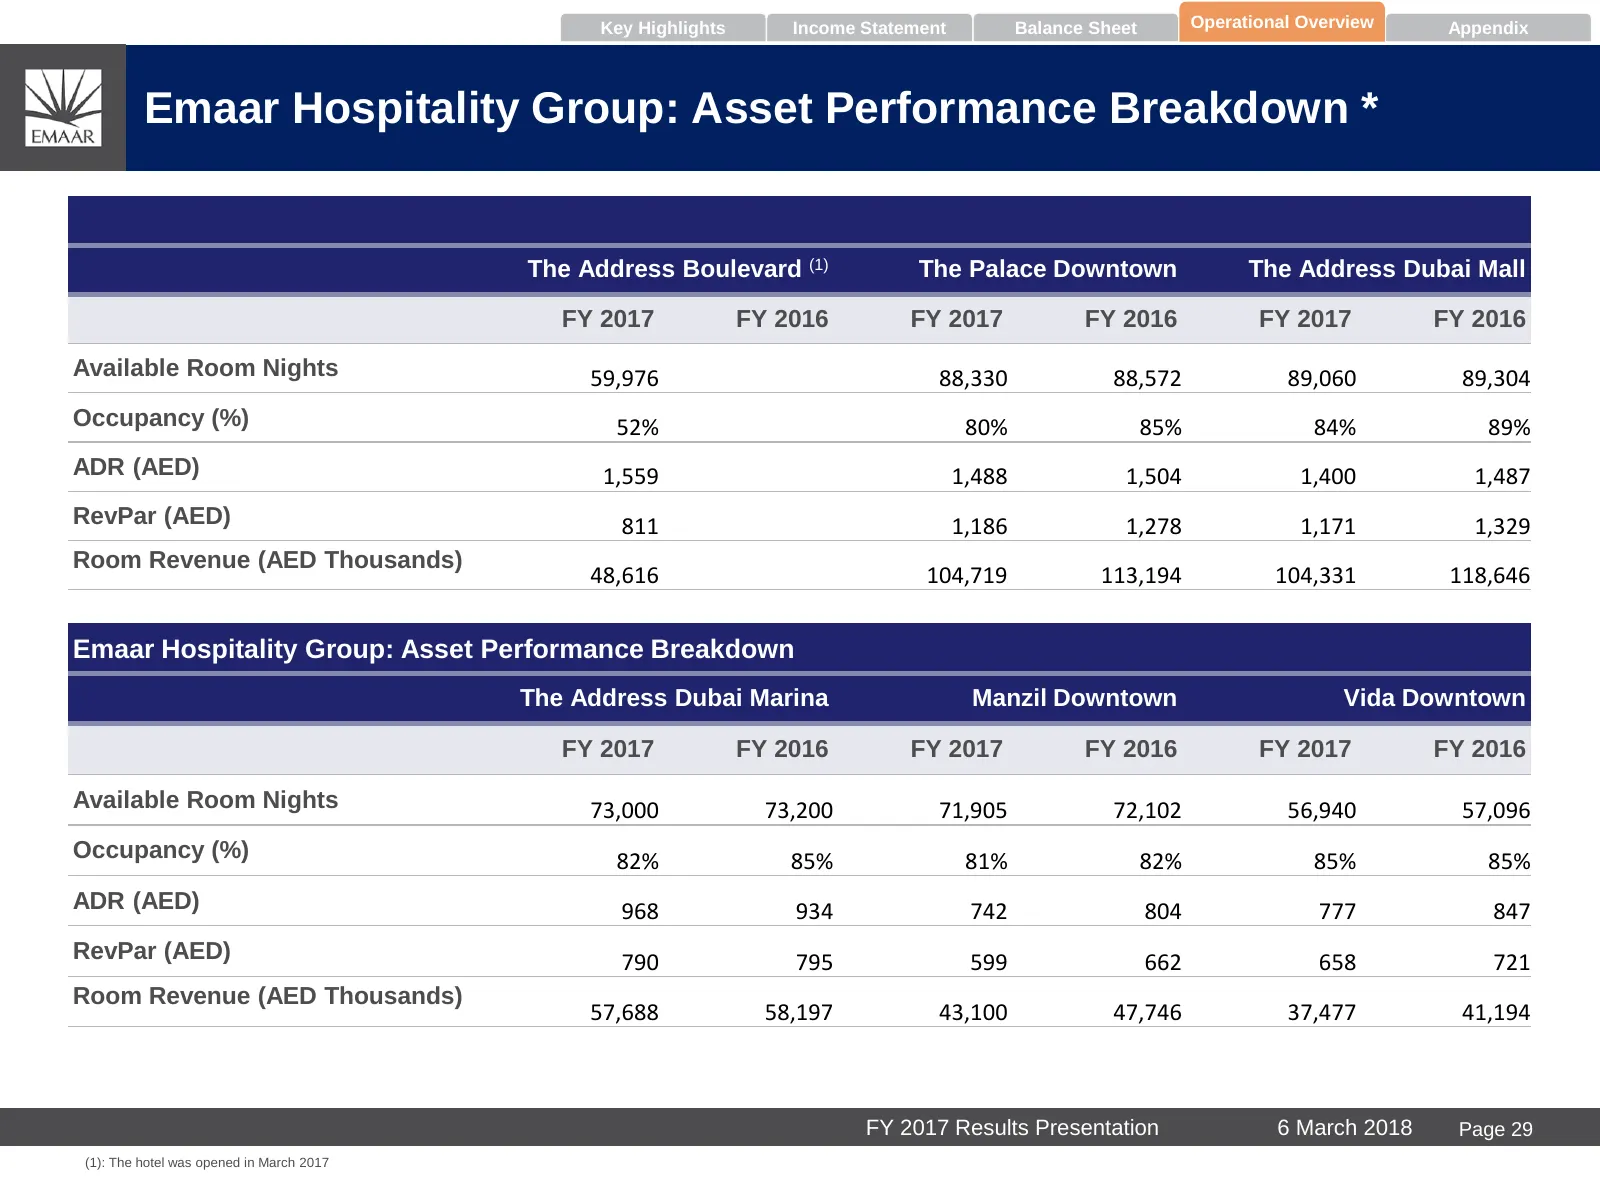
Key Highlights Income Statement Balance Sheet Operational Overview Appendix Emaar Hospitality Group: Asset Performance Breakdown * The Address Boulevard (1) The Palace Downtown The Address Dubai Mall FY 2017 FY 2016 FY 2017 FY 2016 FY 2017 FY 2016 Available Room Nights 59,976 88,330 88,572 89,060 89
Slide 31: Summary
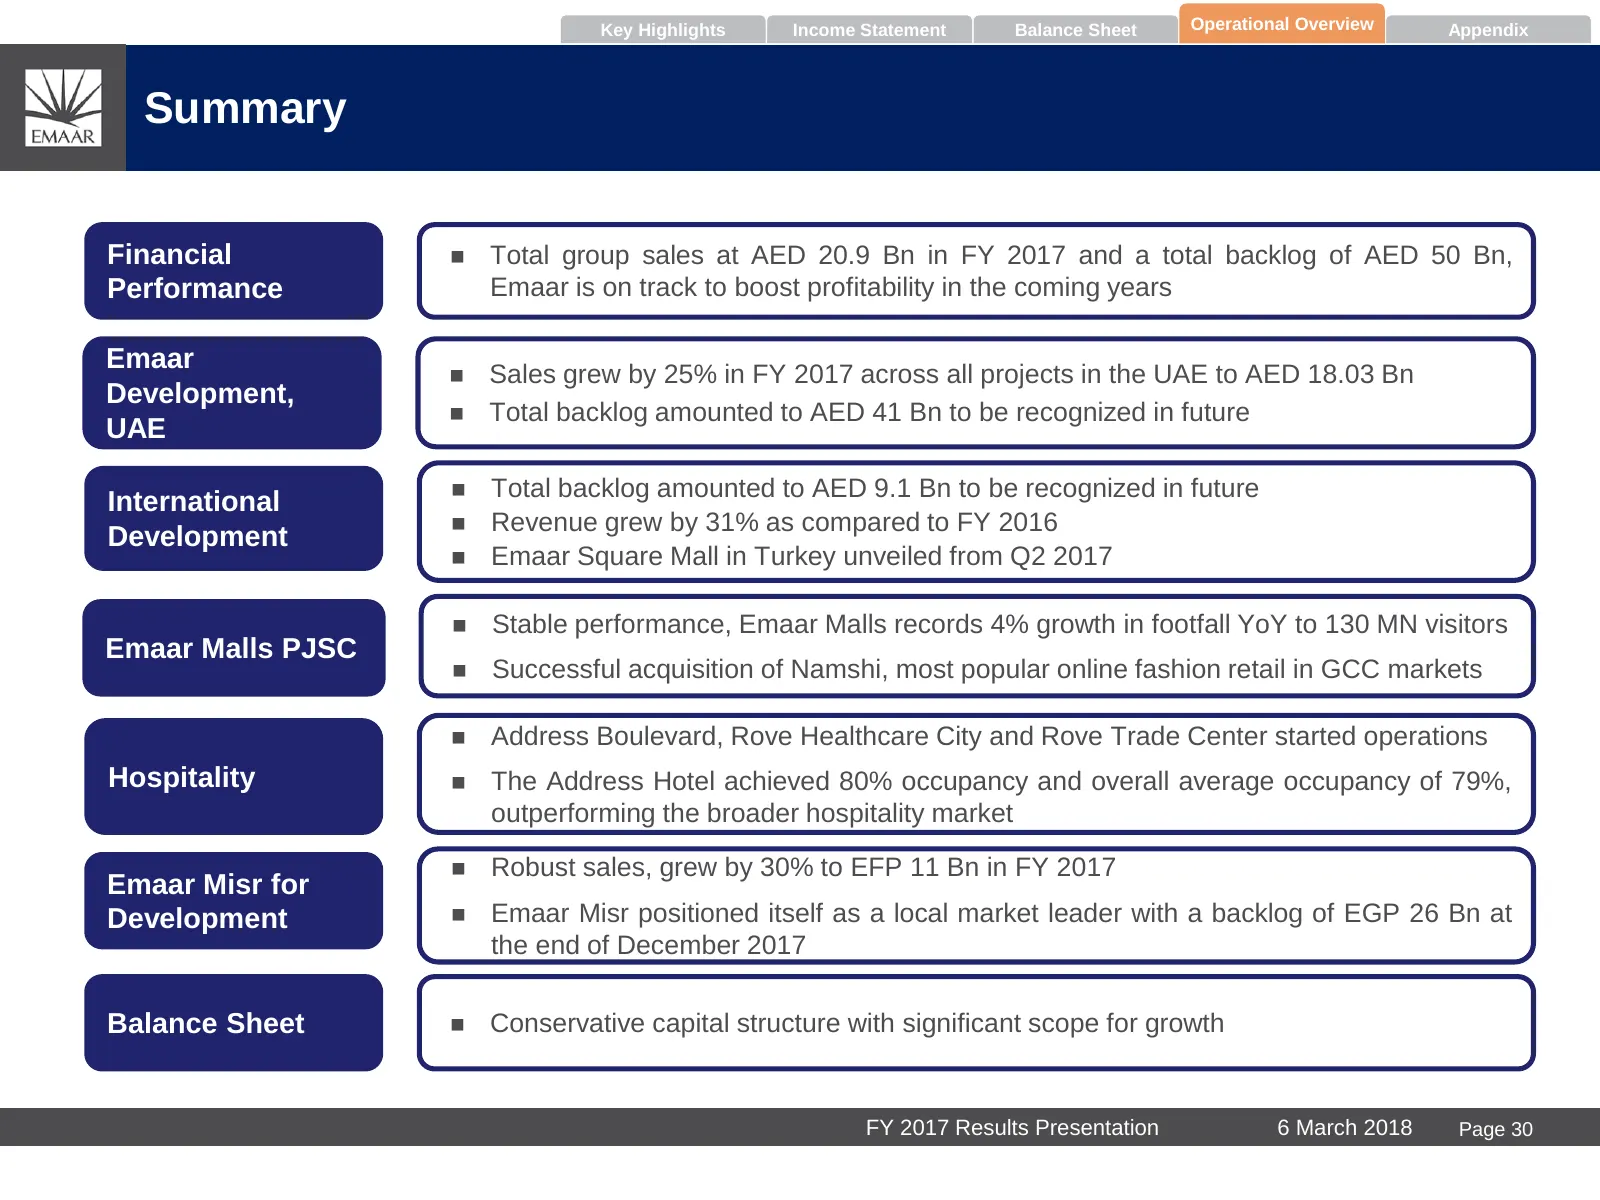
Key Highlights Income Statement Balance Sheet Operational Overview Appendix Summary Financial Total group sales at AED 20.9 Bn in FY 2017 and a total backlog of AED 50 Bn, Performance Emaar is on track to boost profitability in the coming years Emaar Sales grew by 25% in FY 2017 across all proje
Slide 32: Appendix
NW end Appendix
Slide 33: Appendix A – Overview of Divisions and Strategy
Appendix A – Overview of Divisions and Strategy
Slide 34: Overview of Divisions of Emaar Properties
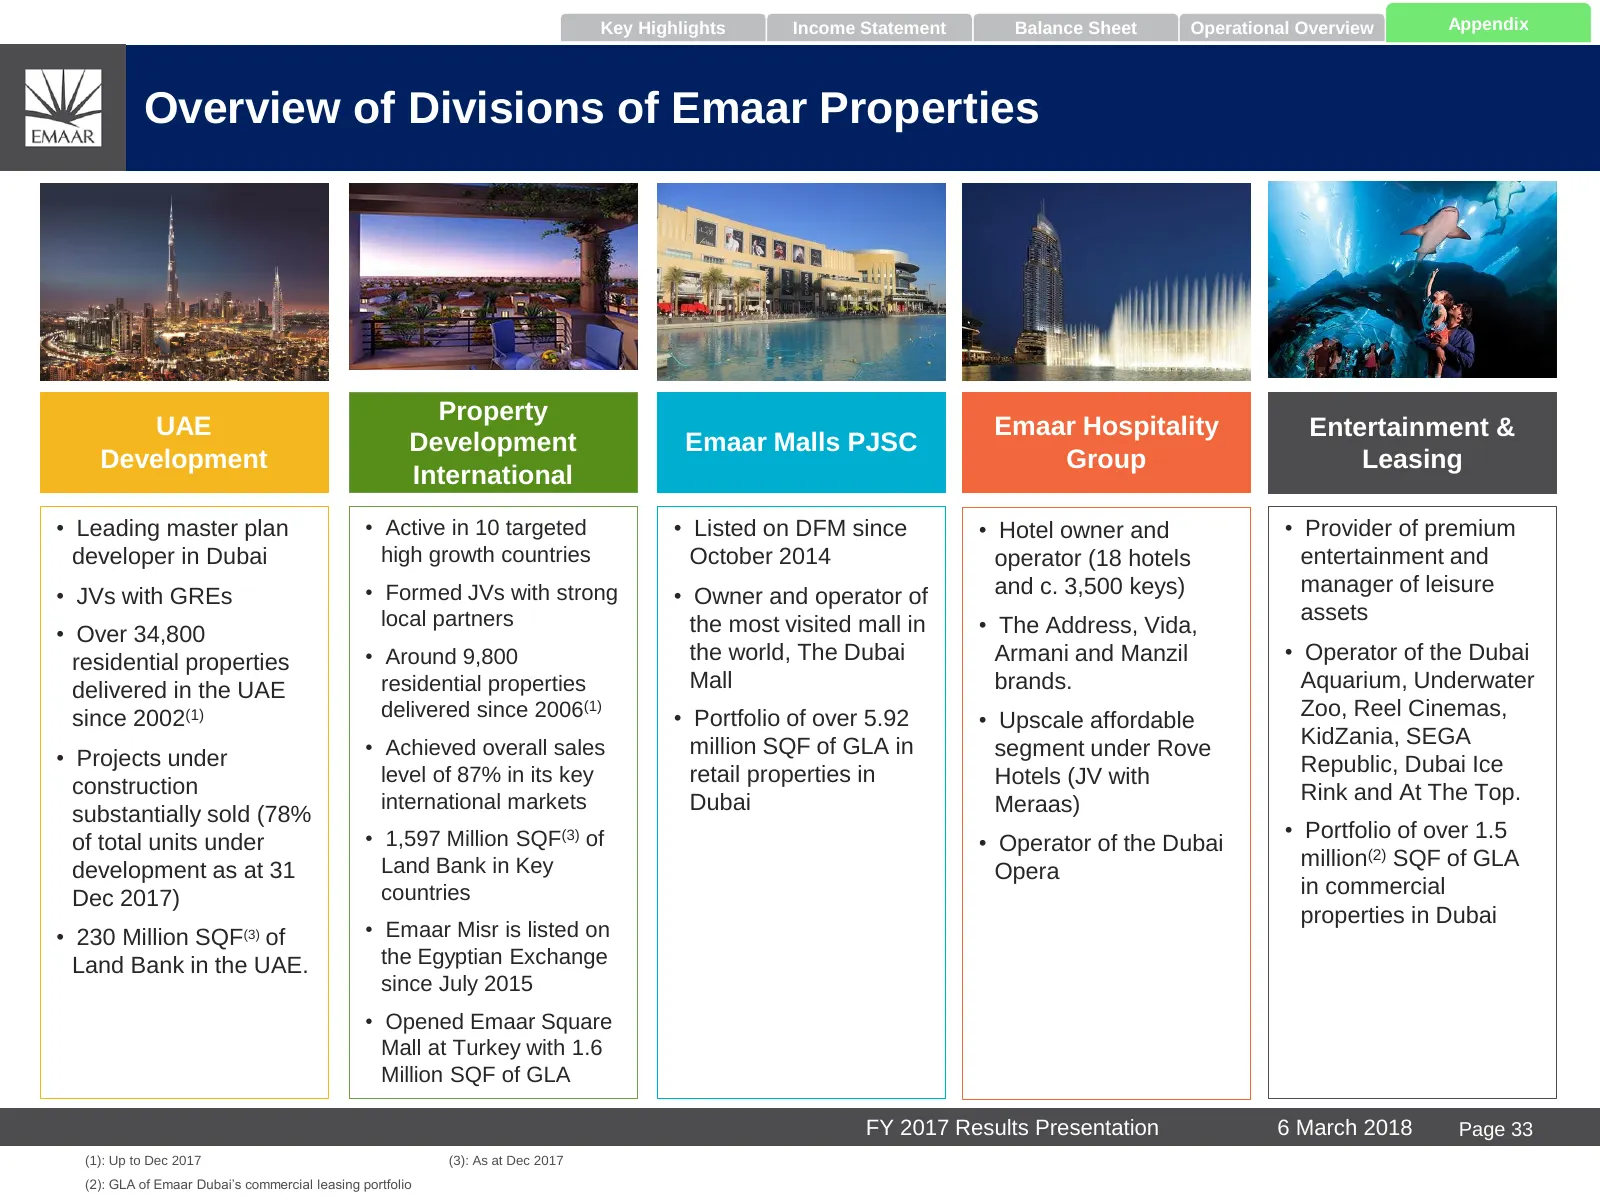
Key Highlights Income Statement Balance Sheet Operational Overview Appendix Overview of Divisions of Emaar Properties Property UAE Emaar Hospitality Entertainment & Development Emaar Malls PJSC Development Group Leasing International • Leading master plan • Active in 10 targeted • Listed on DFM sinc
Slide 35: Strategy
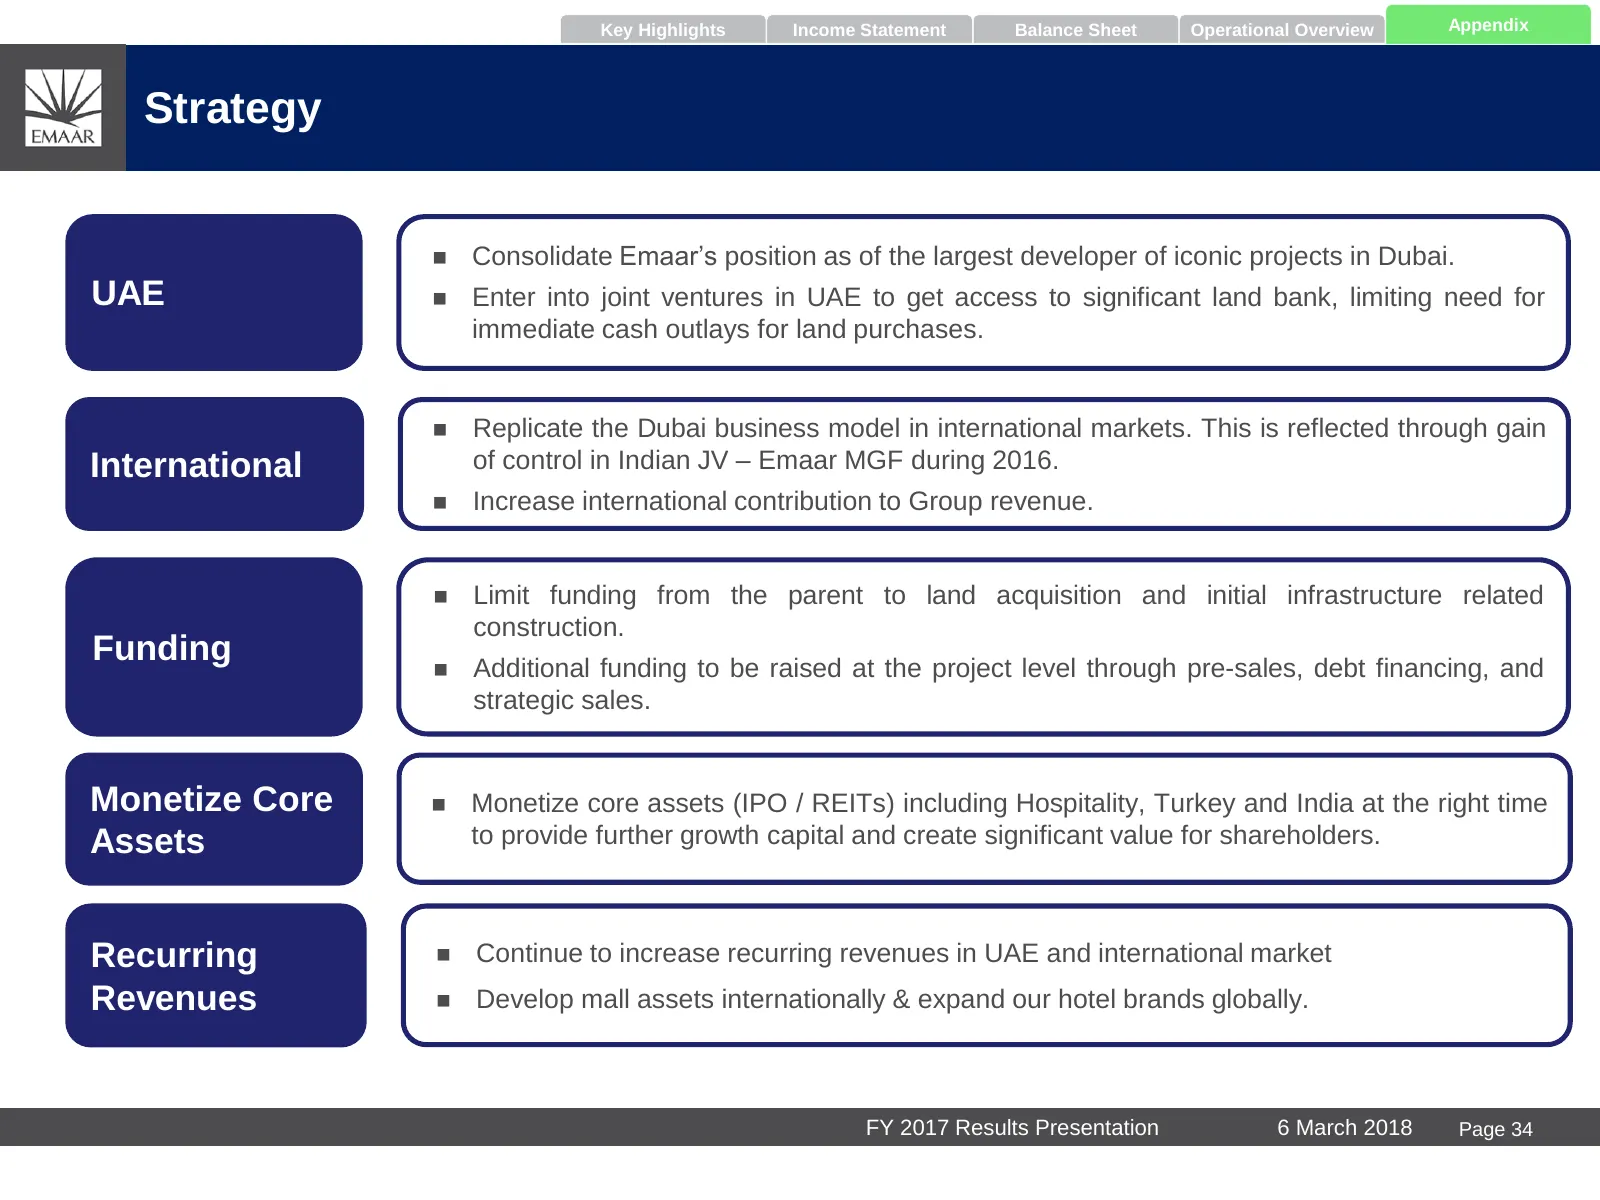
Key Highlights Income Statement Balance Sheet Operational Overview Appendix Strategy Consolidate Emaar’s position as of the largest developer of iconic projects in Dubai. UAE Enter into joint ventures in UAE to get access to significant land bank, limiting need for immediate cash outlays for lan
Slide 36: Appendix B – Overview of UAE Development
Appendix B – Overview of UAE Development
Slide 37: Projects overview
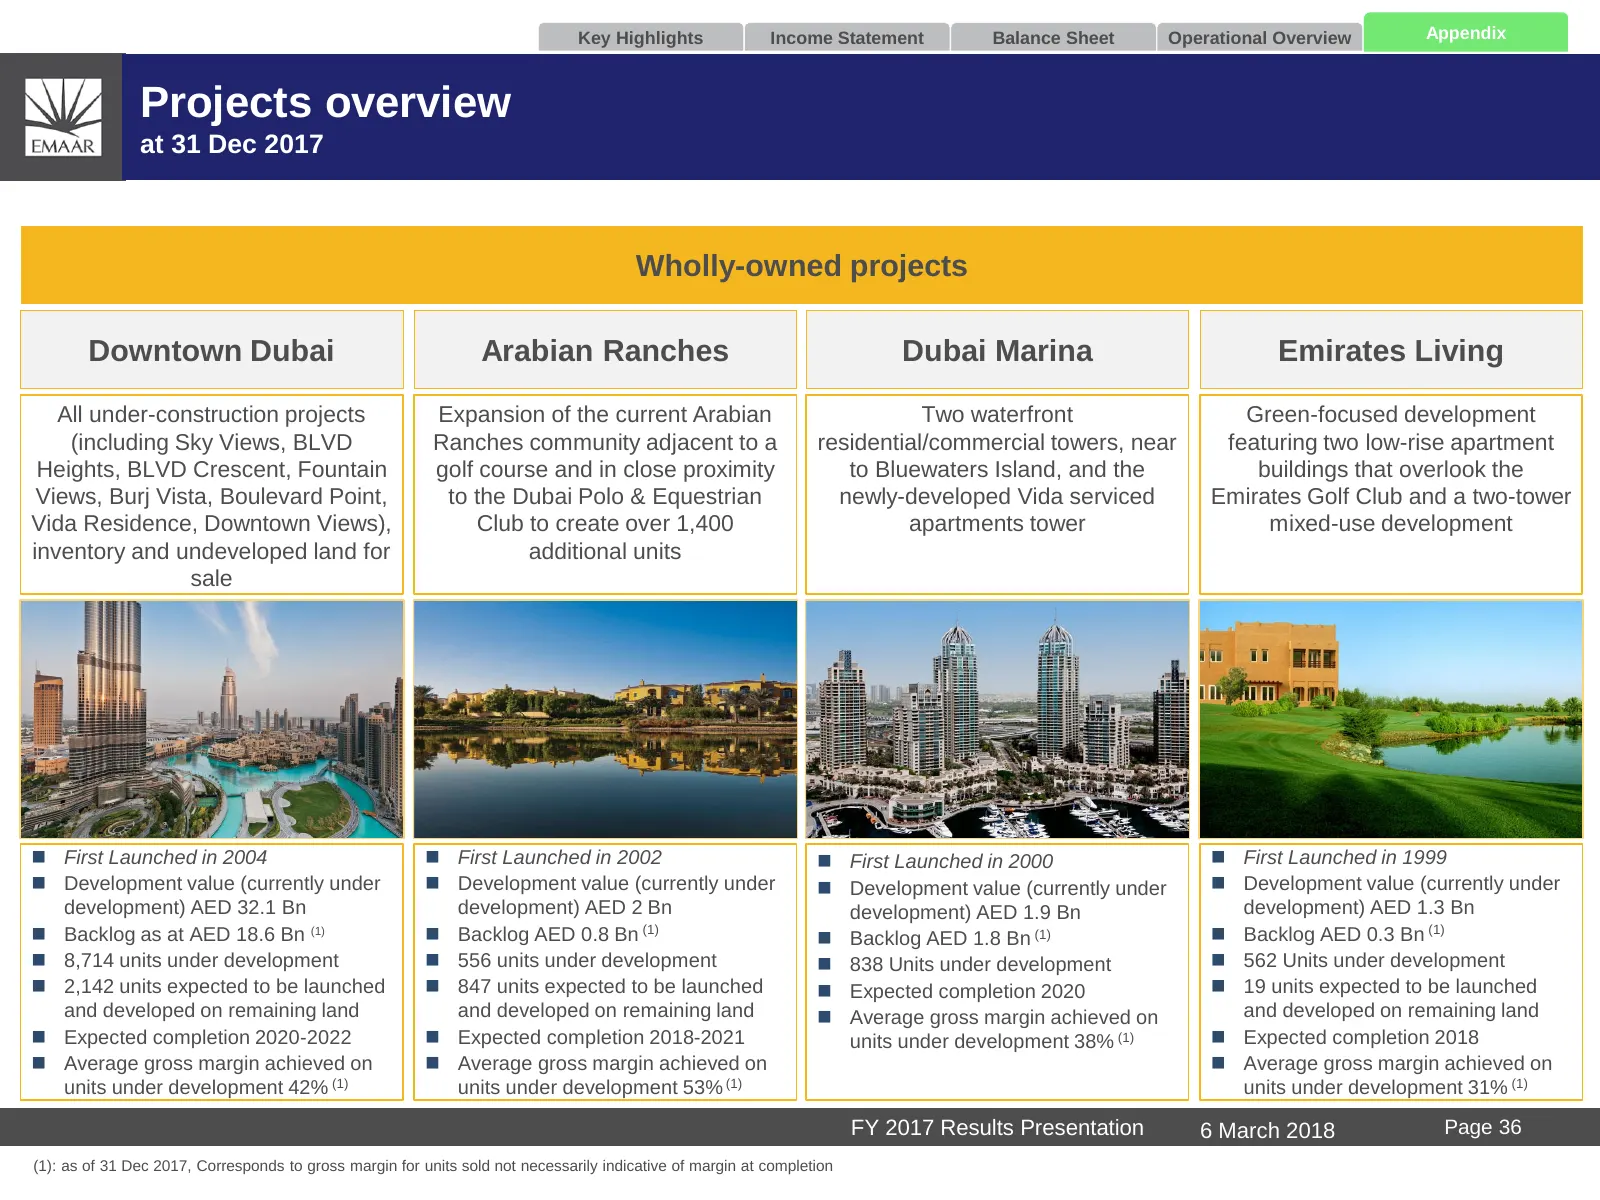
Key Highlights Income Statement Balance Sheet Operational Overview Appendix Projects overview at 31 Dec 2017 Wholly-owned projects Downtown Dubai Arabian Ranches Dubai Marina Emirates Living All under-construction projects Expansion of the current Arabian Two waterfront Green-focused development (in
Slide 38: Projects overview (cont’d)
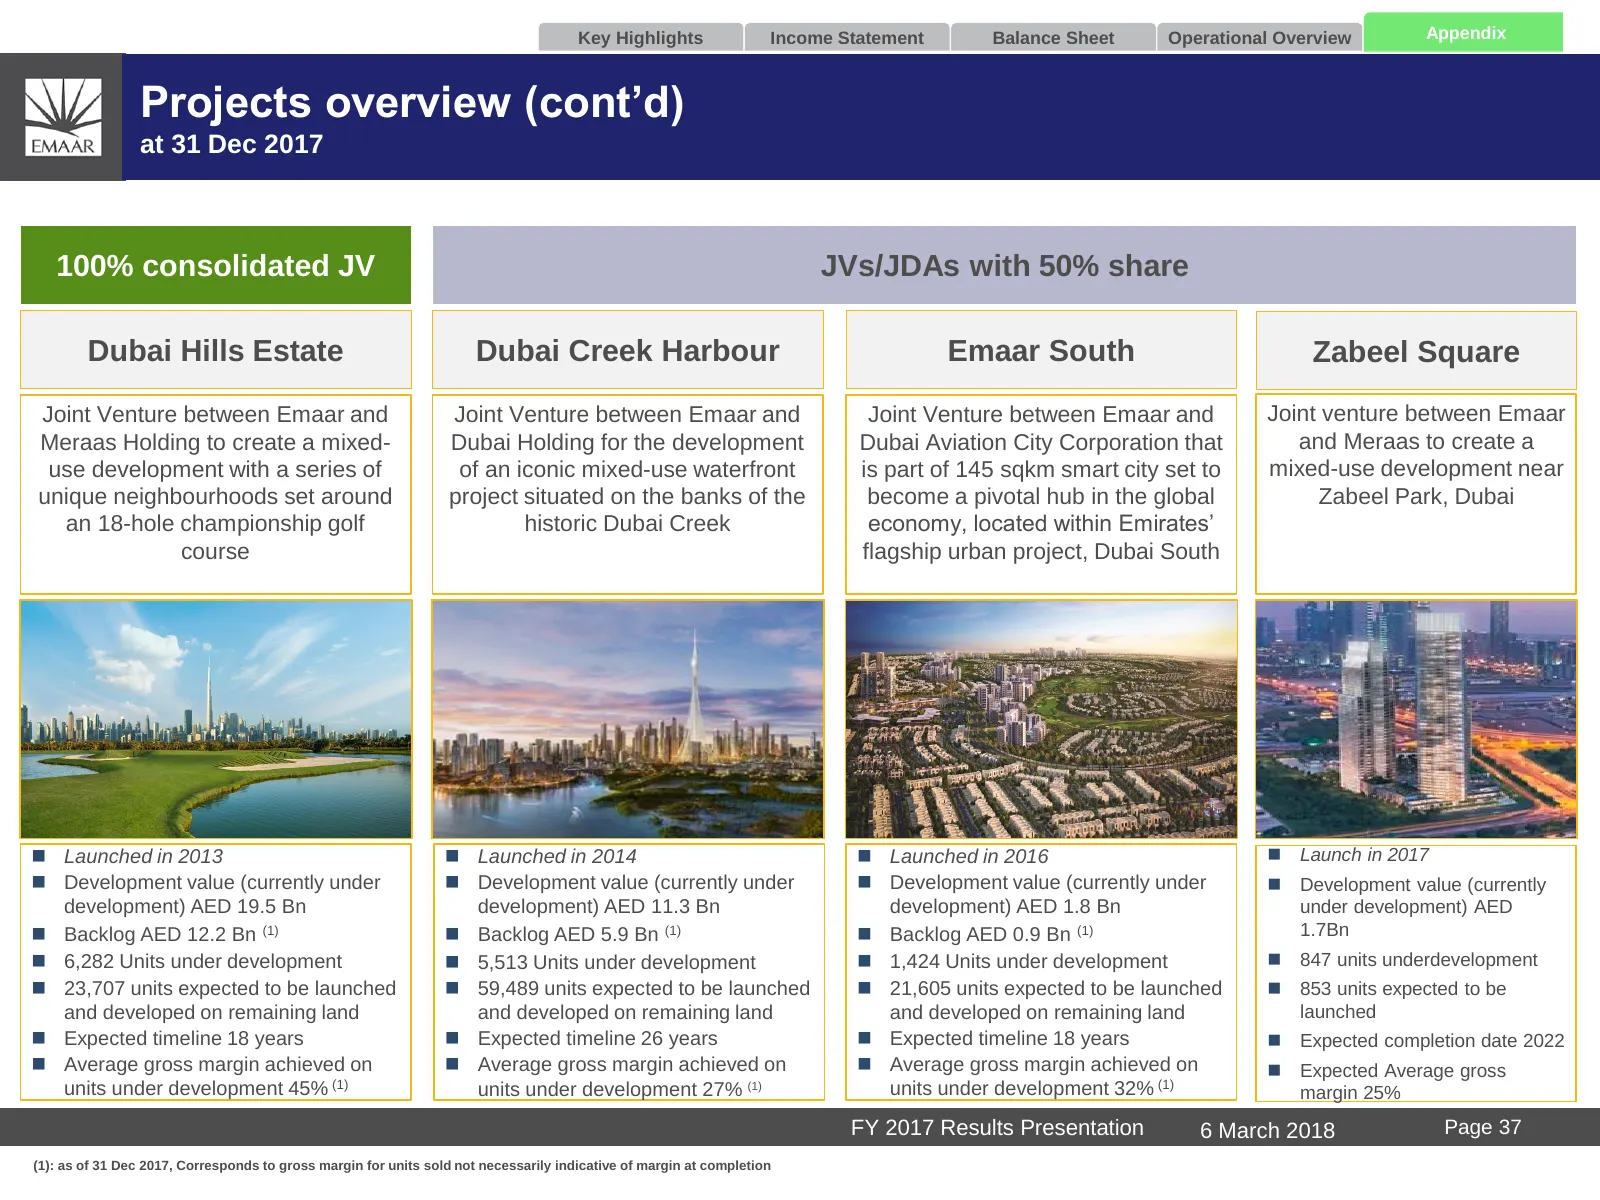
Key Highlights Income Statement Balance Sheet Operational Overview Appendix Projects overview (cont’d) at 31 Dec 2017 100% consolidated JV JVs/JDAs with 50% share Dubai Hills Estate Dubai Creek Harbour Emaar South Zabeel Square Joint Venture between Emaar and Joint Venture between Emaar and Joint Ve
Slide 39: Projects overview (cont’d)
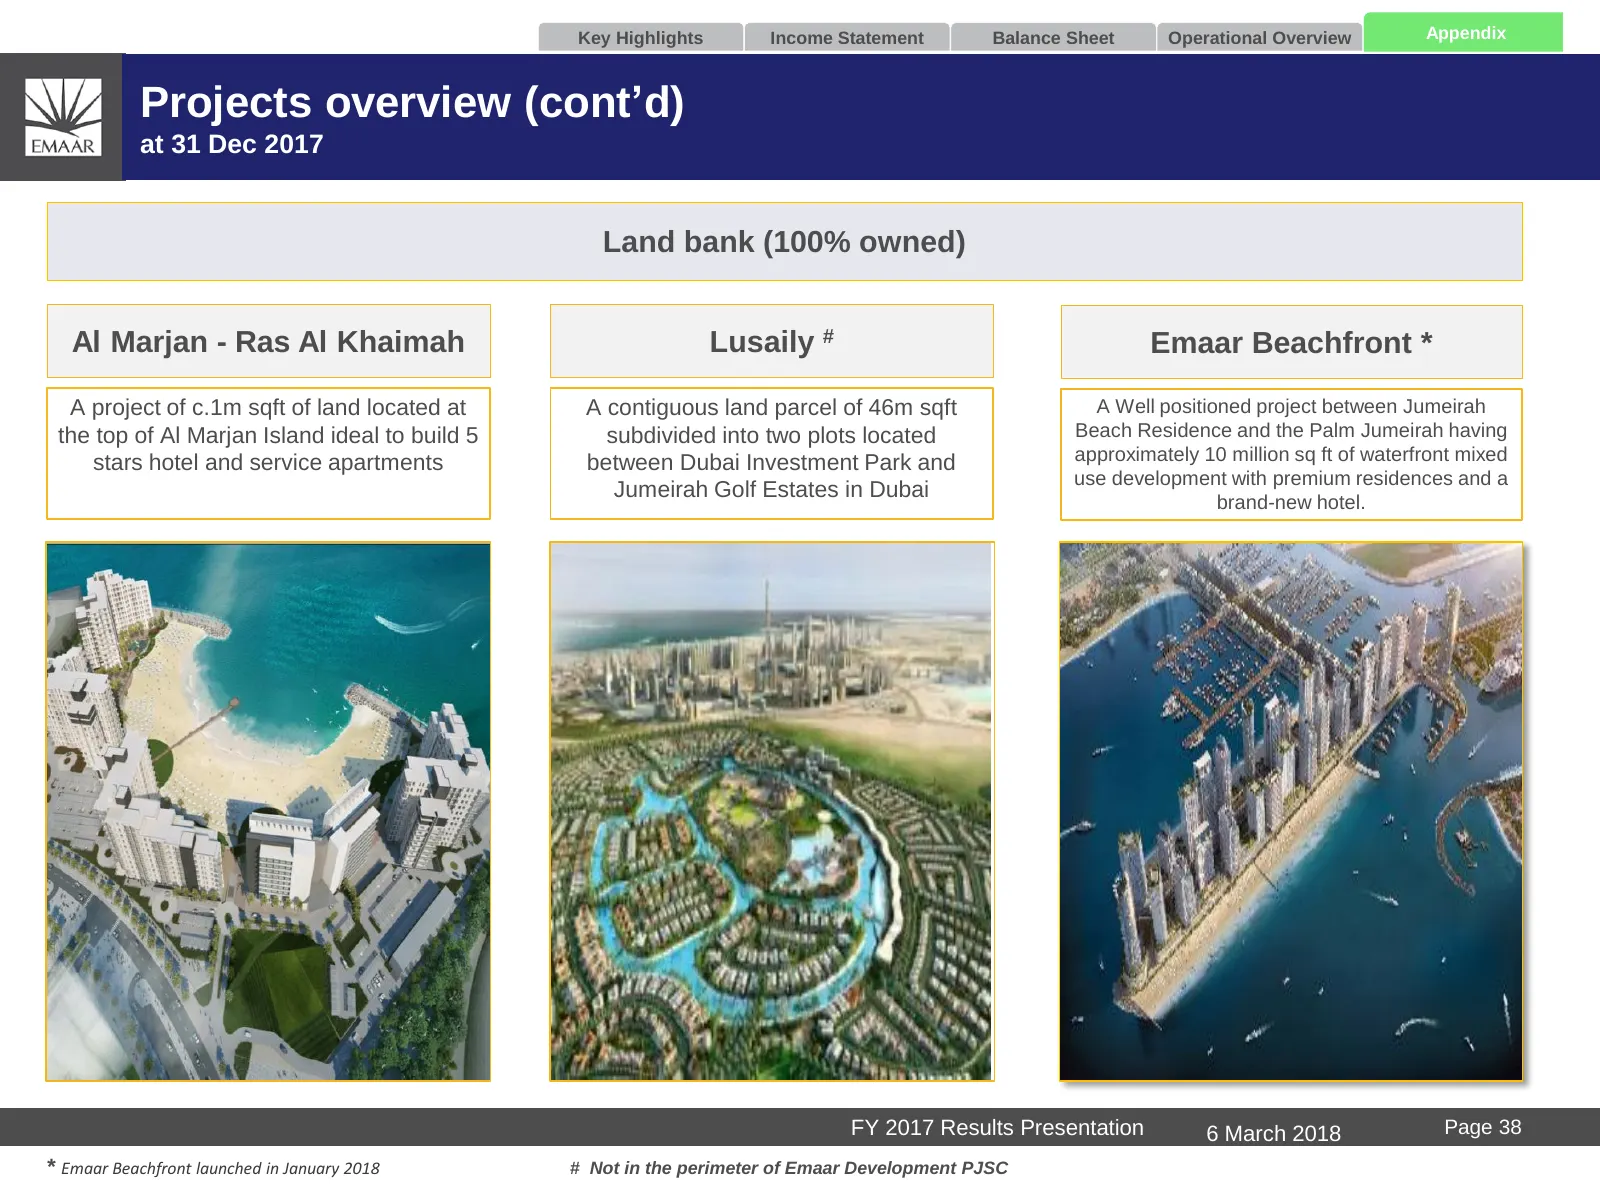
Key Highlights Income Statement Balance Sheet Operational Overview Appendix Projects overview (cont’d) at 31 Dec 2017 Land bank (100% owned) Al Marjan - Ras Al Khaimah Lusaily # Emaar Beachfront * A project of c.1m sqft of land located at A contiguous land parcel of 46m sqft A Well positioned projec
Slide 40: Overview of projects under development
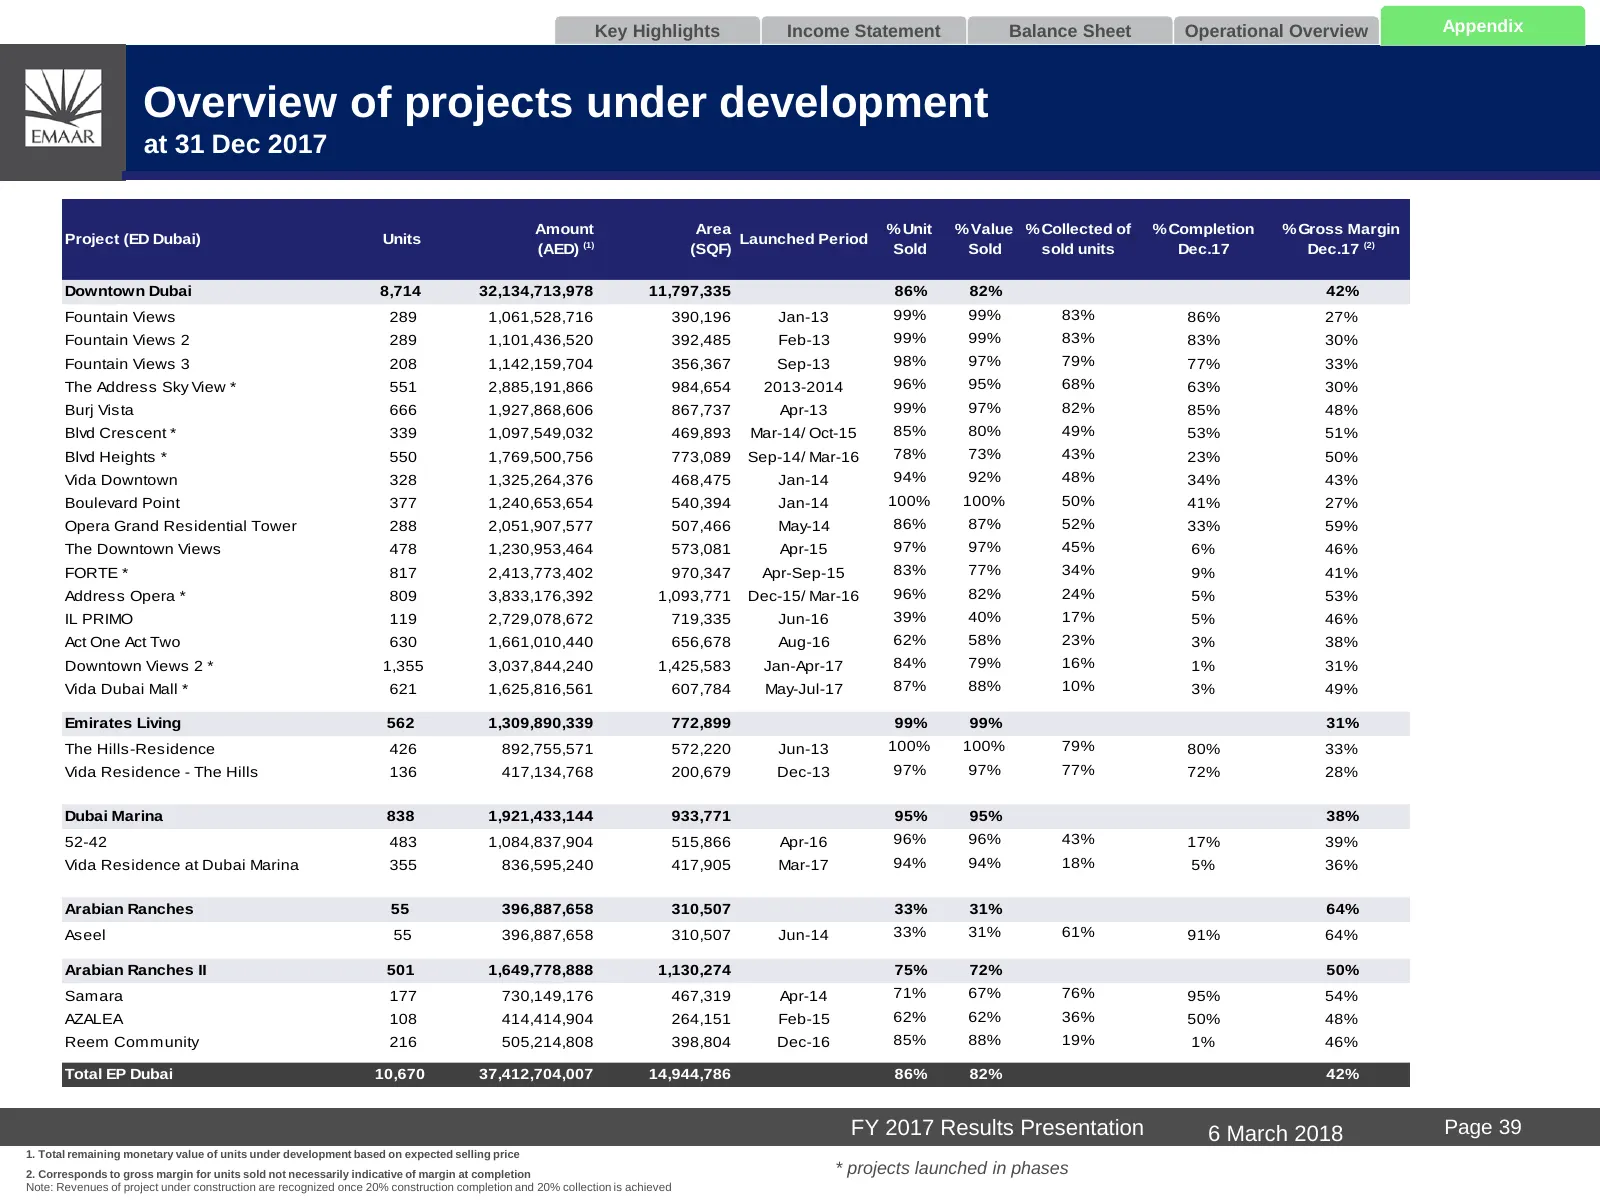
Key Highlights Income Statement Balance Sheet Operational Overview Appendix Overview of projects under development at 31 Dec 2017 Amount Area % Unit % Value % Collected of % Completion % Gross Margin Project (ED Dubai) Units Launched Period (AED) (1) (SQF) Sold Sold sold units Dec.17 Dec.17 (2) Down
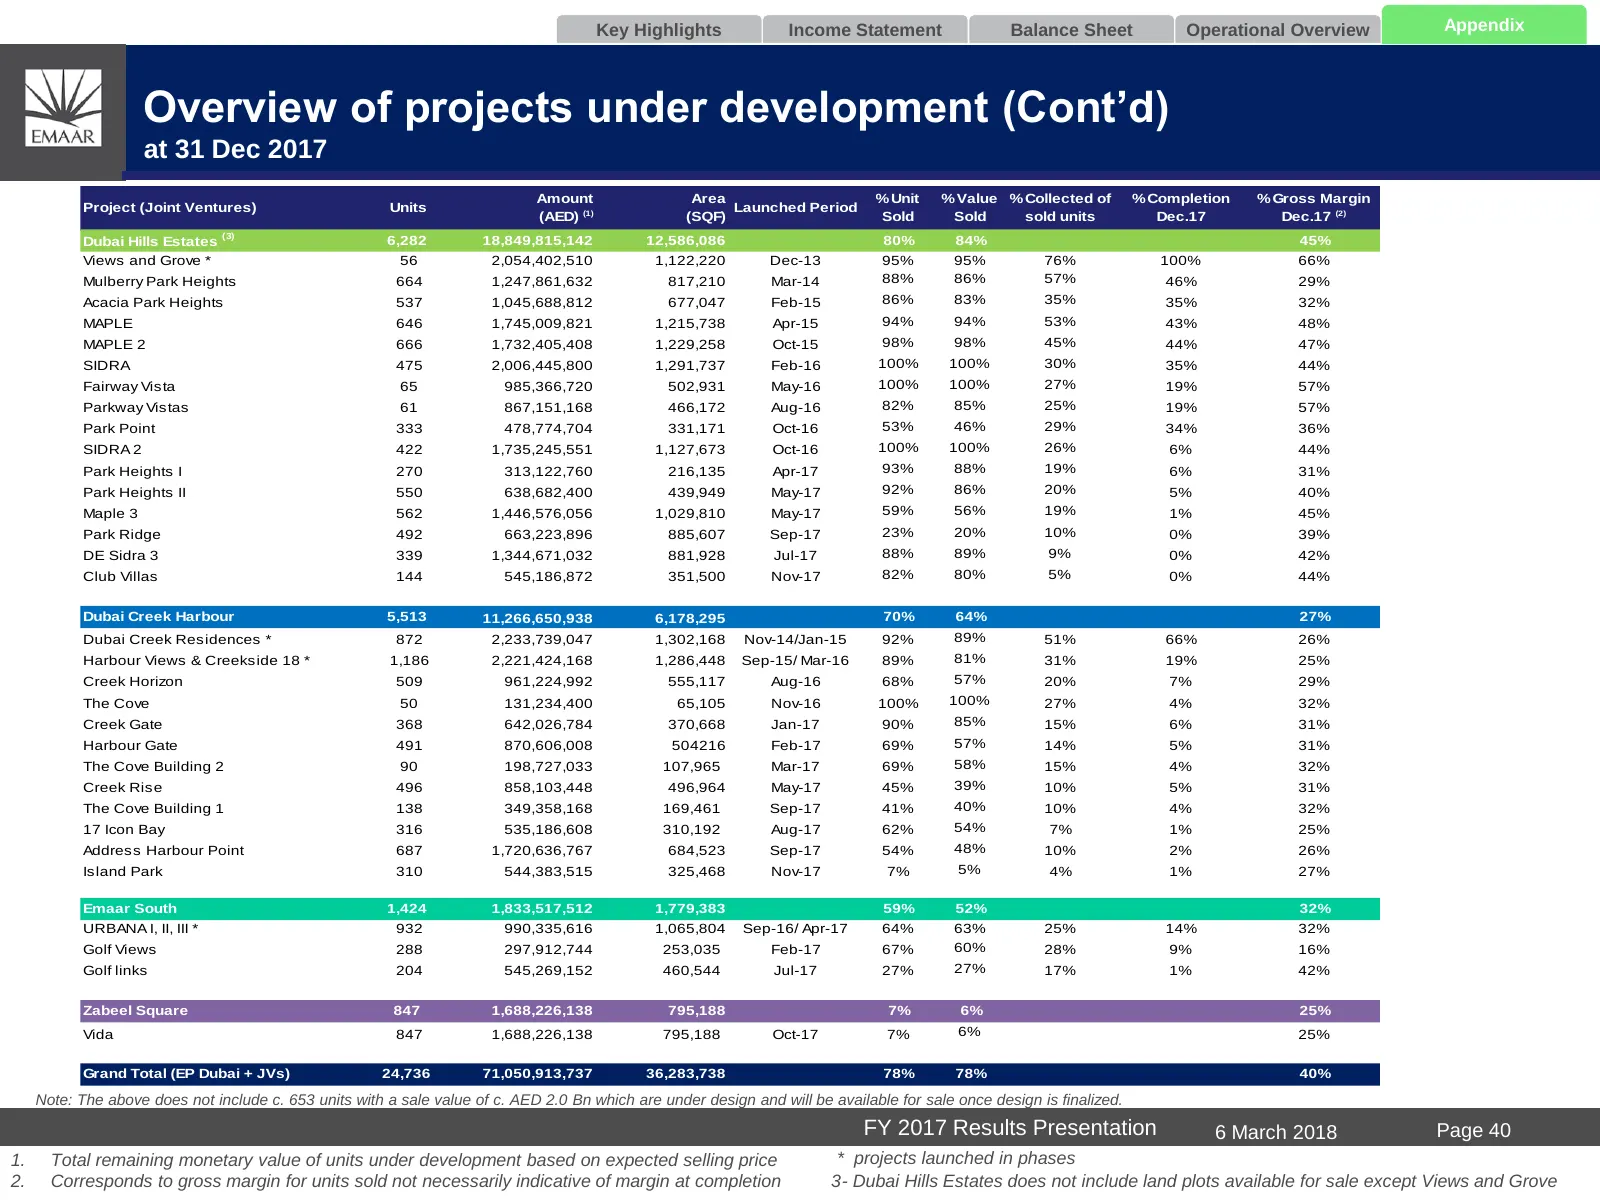
Slide 41: Overview of projects under development (Cont’d)
Key Highlights Income Statement Balance Sheet Operational Overview Appendix Overview of projects under development (Cont’d) at 31 Dec 2017 Amount Area % Unit % Value % Collected of % Completion % Gross Margin Project (Joint Ventures) Units Launched Period (AED) (1) (SQF) Sold Sold sold units Dec.17
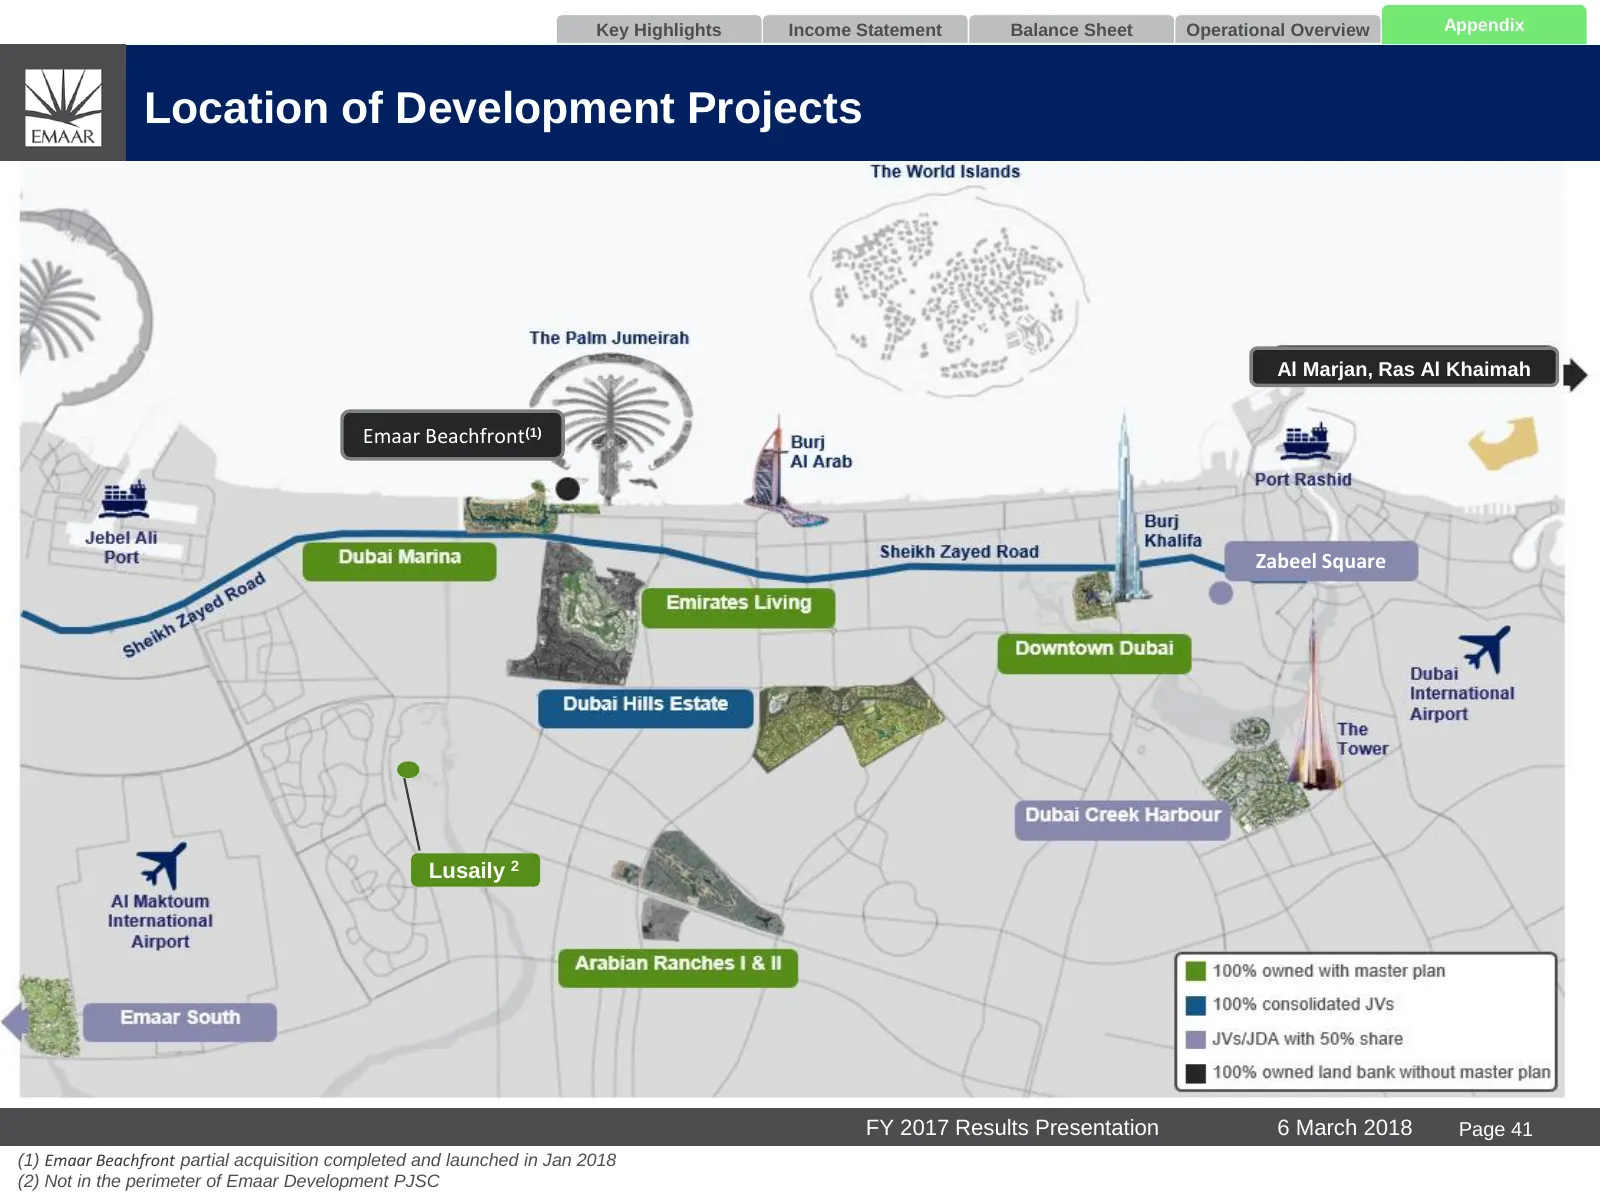
Slide 42: Location of Development Projects
Key Highlights Income Statement Balance Sheet Operational Overview Appendix Location of Development Projects Al Marjan, Ras Al Khaimah Emaar Beachfront(1) Zabeel Square Zaabeel Lusaily 2 FY 2017 Results Presentation 6 March 2018 Page 41 (1) Emaar Beachfront partial acquisition completed and launched
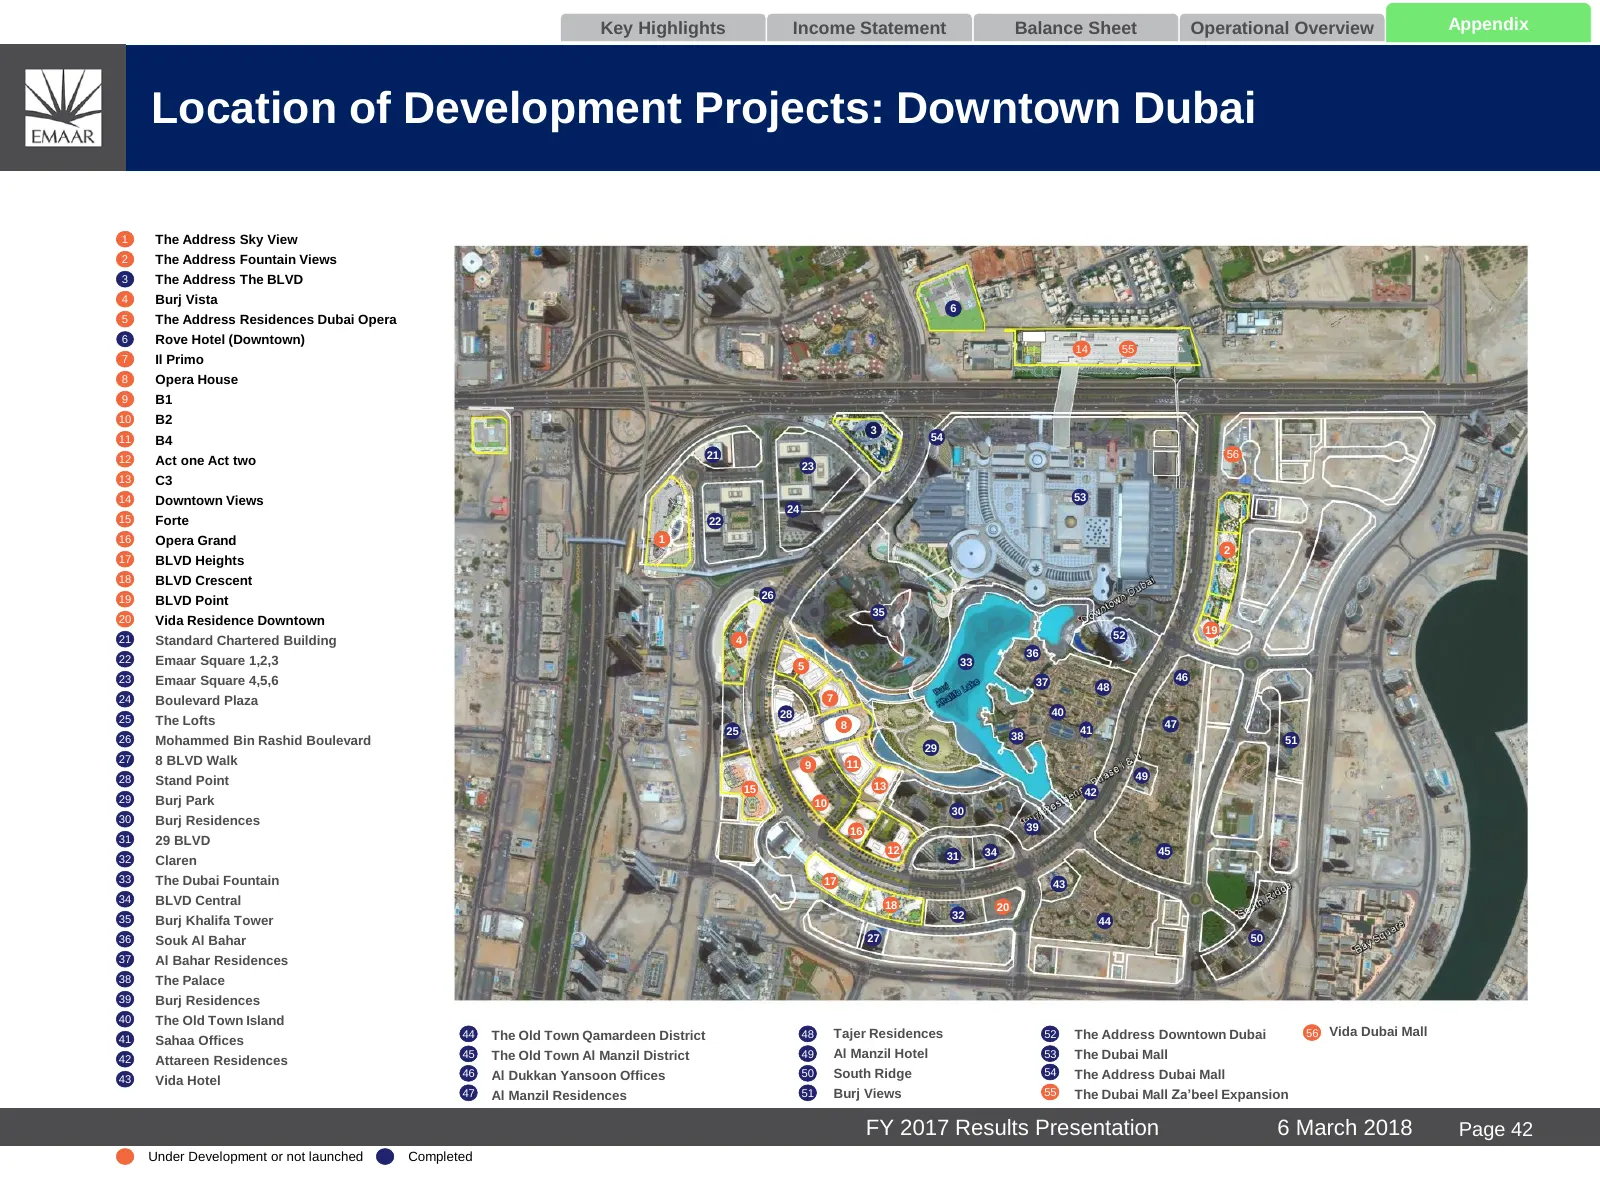
Slide 43: Location of Development Projects: Downtown Dubai
Key Highlights Income Statement Balance Sheet Operational Overview Appendix Location of Development Projects: Downtown Dubai 1 The Address Sky View 2 The Address Fountain Views 3 The Address The BLVD 4 Burj Vista 6 5 The Address Residences Dubai Opera 6 Rove Hotel (Downtown) 14 55 7 Il Primo 8 Opera
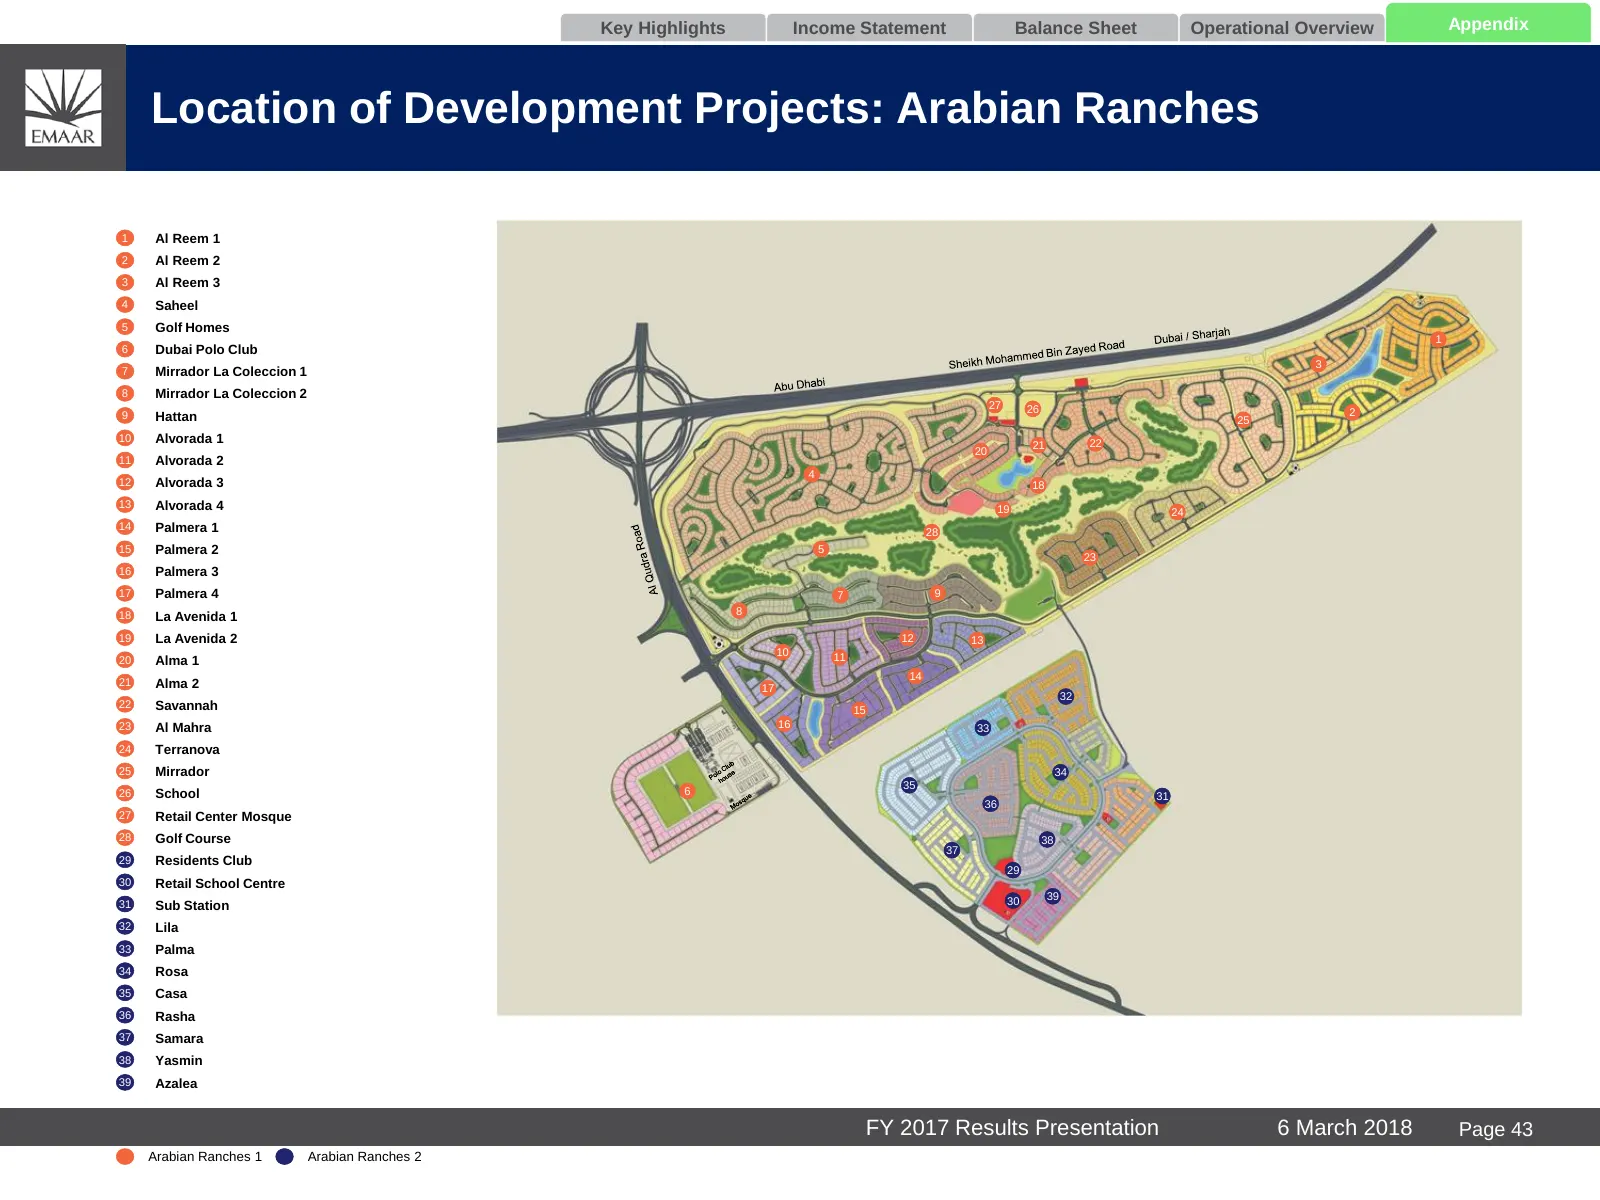
Slide 44: Location of Development Projects: Arabian Ranches
Key Highlights Income Statement Balance Sheet Operational Overview Appendix Location of Development Projects: Arabian Ranches 1 Al Reem 1 2 Al Reem 2 3 Al Reem 3 4 Saheel 5 Golf Homes 1 6 Dubai Polo Club 3 7 Mirrador La Coleccion 1 8 Mirrador La Coleccion 2 27 26 9 Hattan 2 25 10 Alvorada 1 21 22 20
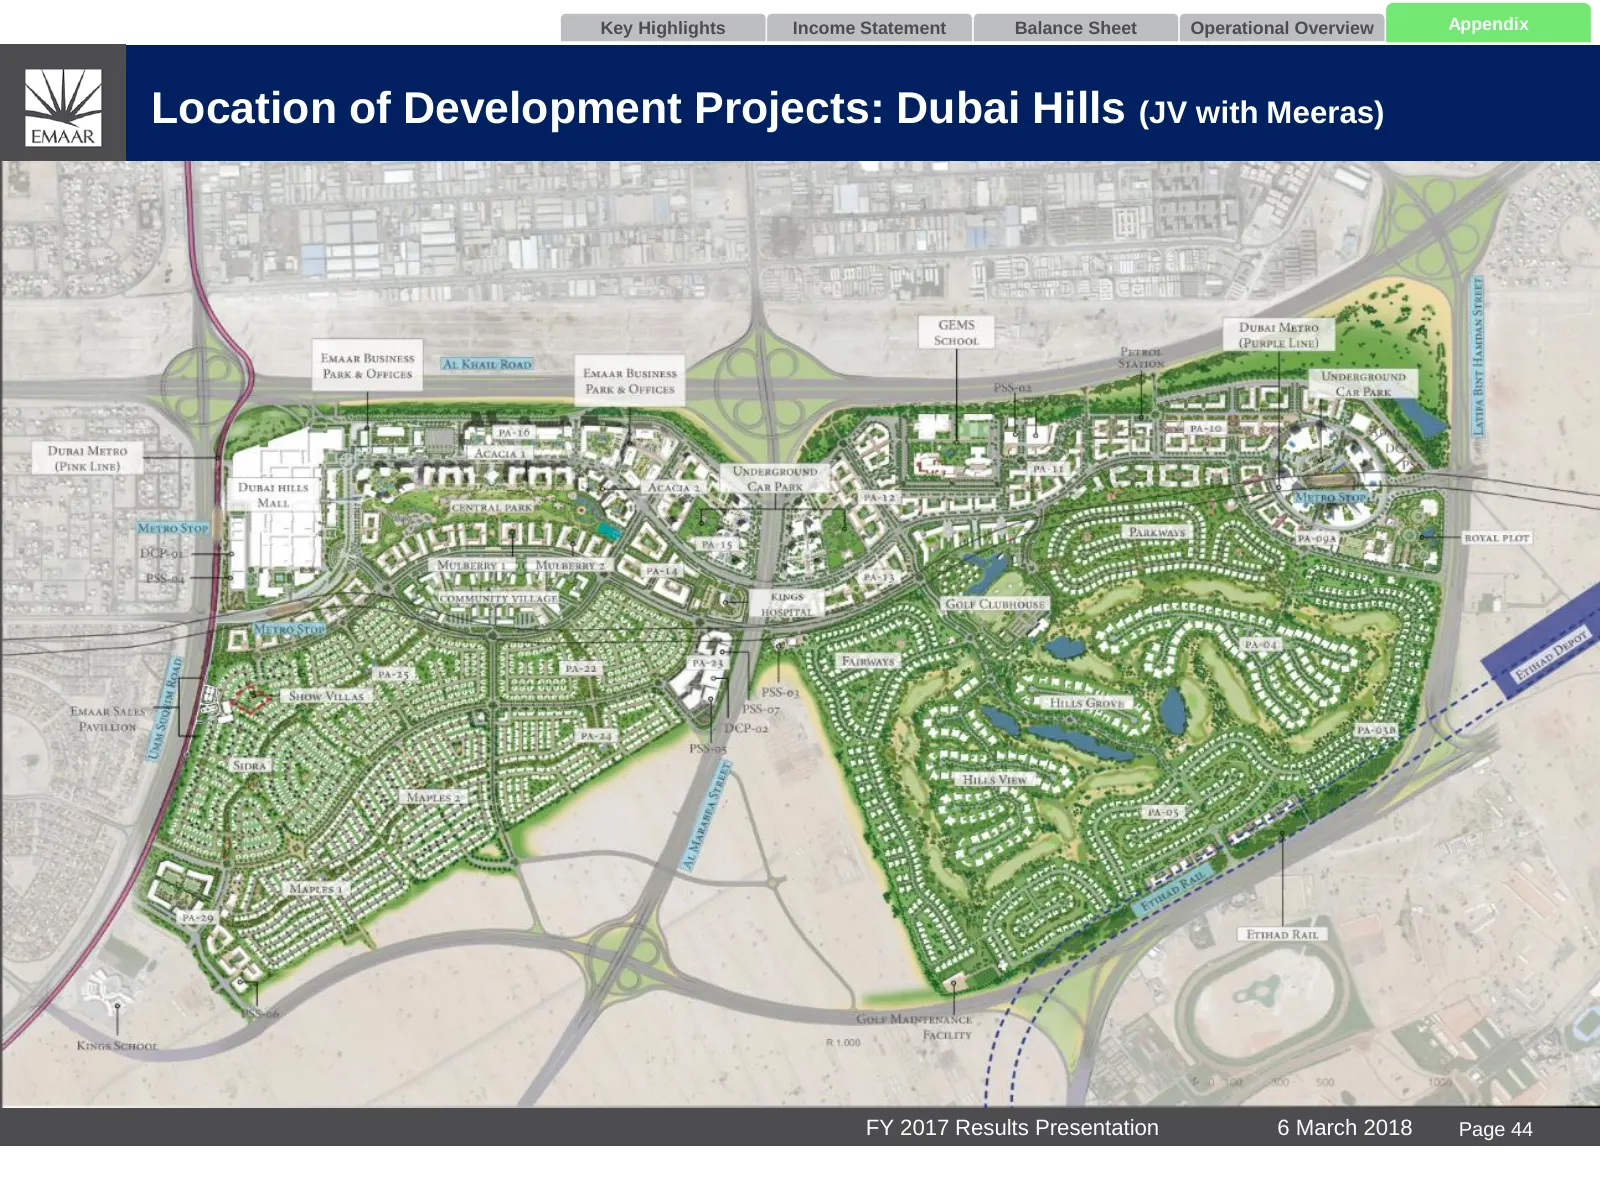
Slide 45: Location of Development Projects: Dubai Hills
Key Highlights Income Statement Balance Sheet Operational Overview Appendix Location of Development Projects: Dubai Hills (JV with Meeras) FY 2017 Results Presentation 6 March 2018 Page 44
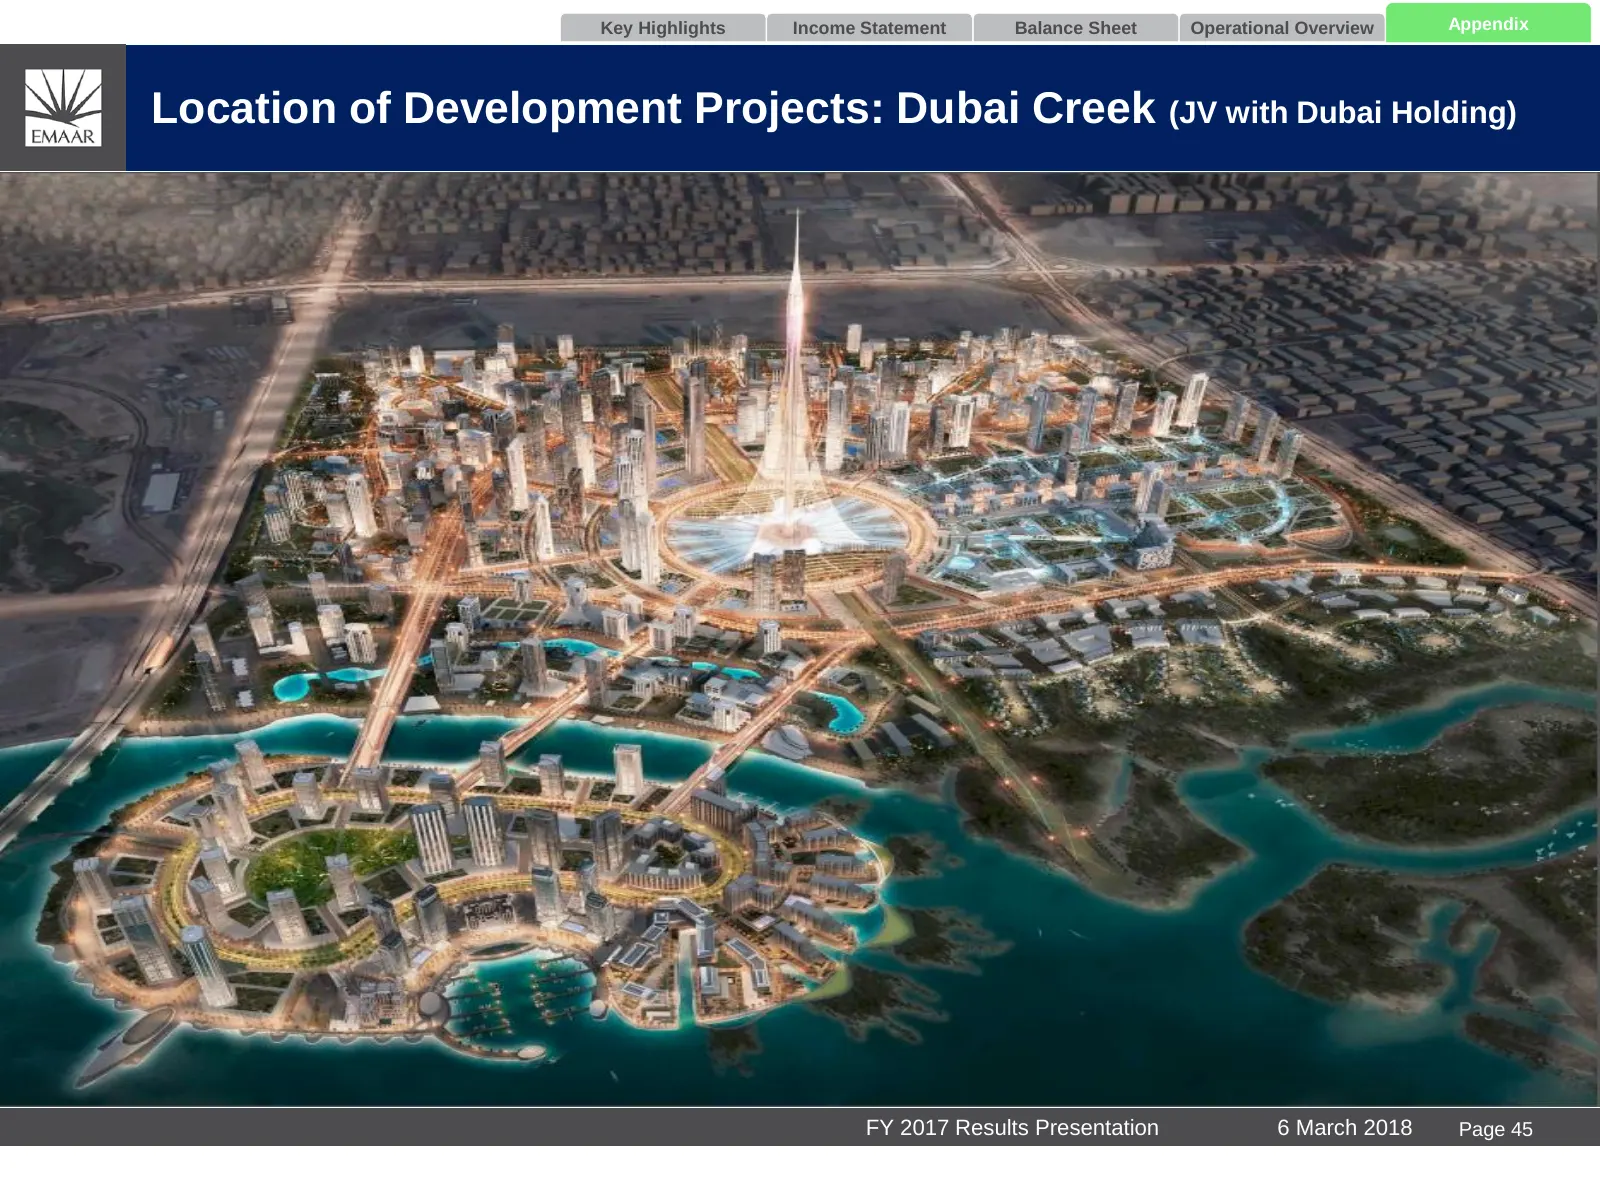
Slide 46: Location of Development Projects: Dubai Creek
Key Highlights Income Statement Balance Sheet Operational Overview Appendix Location of Development Projects: Dubai Creek (JV with Dubai Holding) FY 2017 Results Presentation 6 March 2018 Page 45
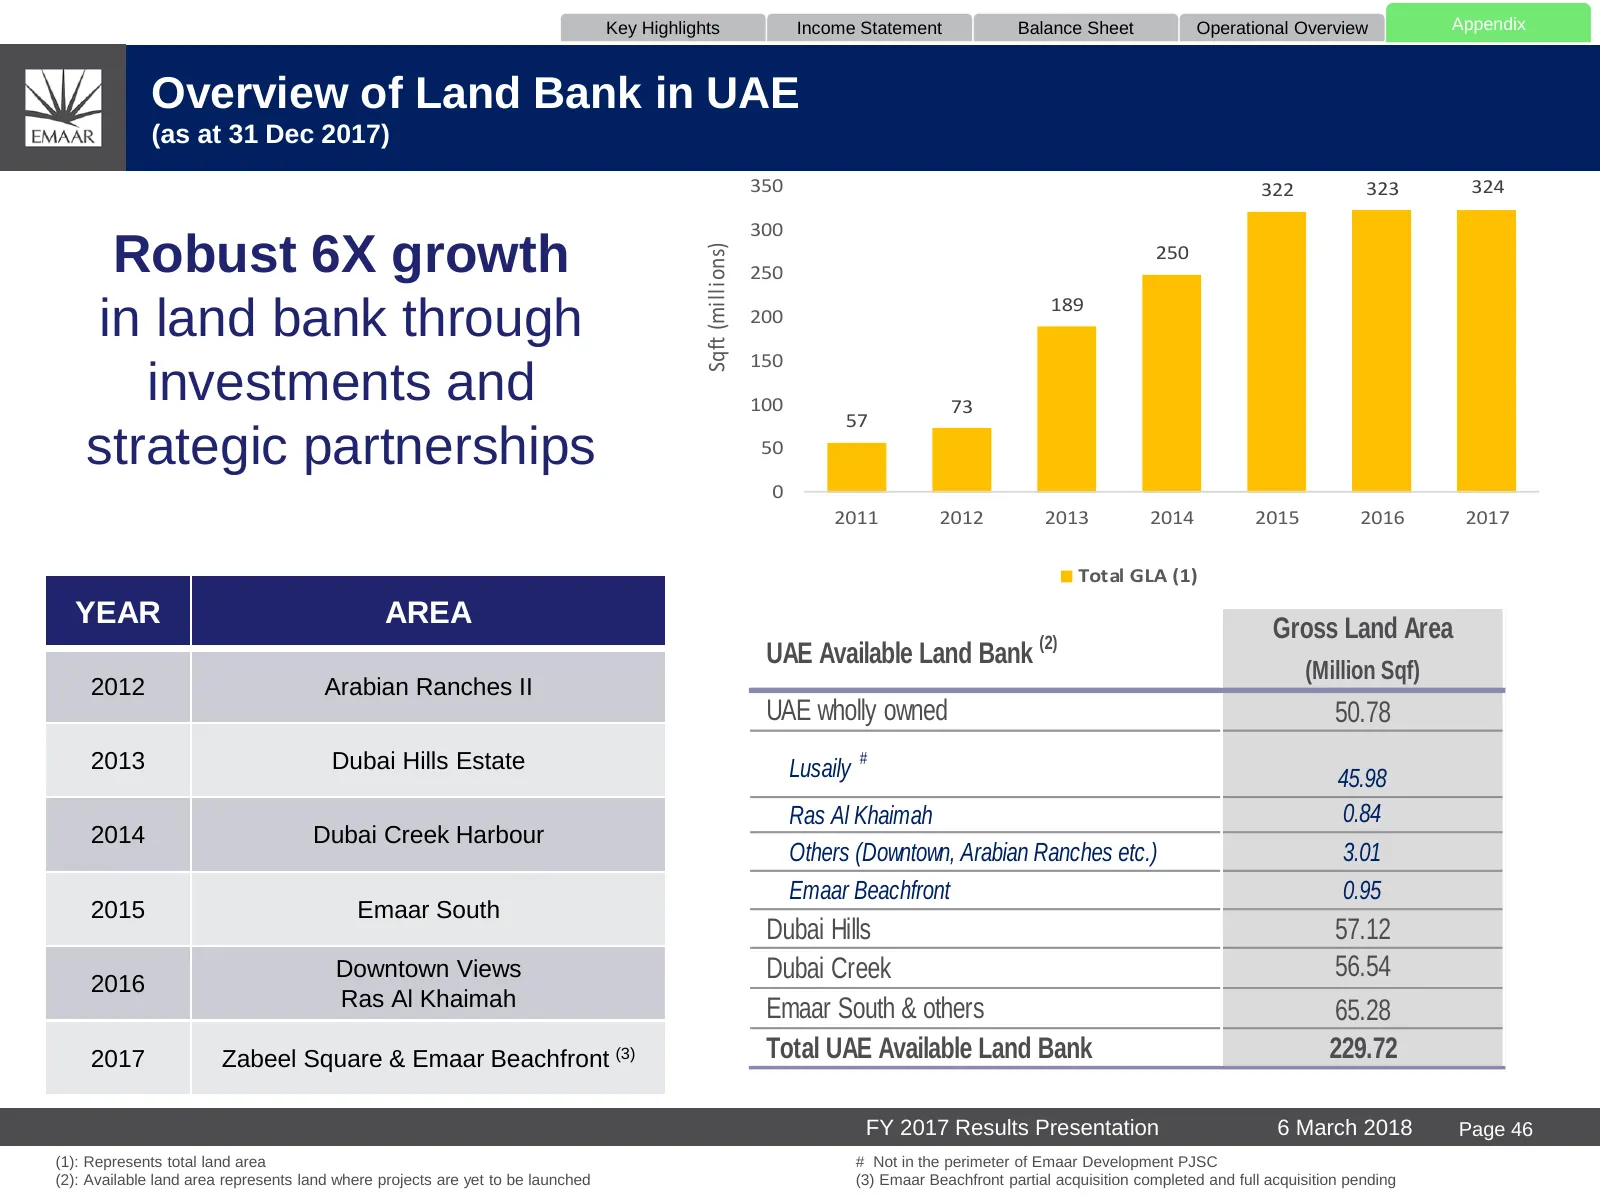
Slide 47: Overview of Land Bank in UAE
Key Highlights Income Statement Balance Sheet Operational Overview Appendix Overview of Land Bank in UAE (as at 31 Dec 2017) 350 322 323 324 300 Robust 6X growth Sqft (millions) 250 250 189 in land bank through 200 150 investments and 100 73 57 strategic partnerships 50 0 2011 2012 2013 2014 2015 20
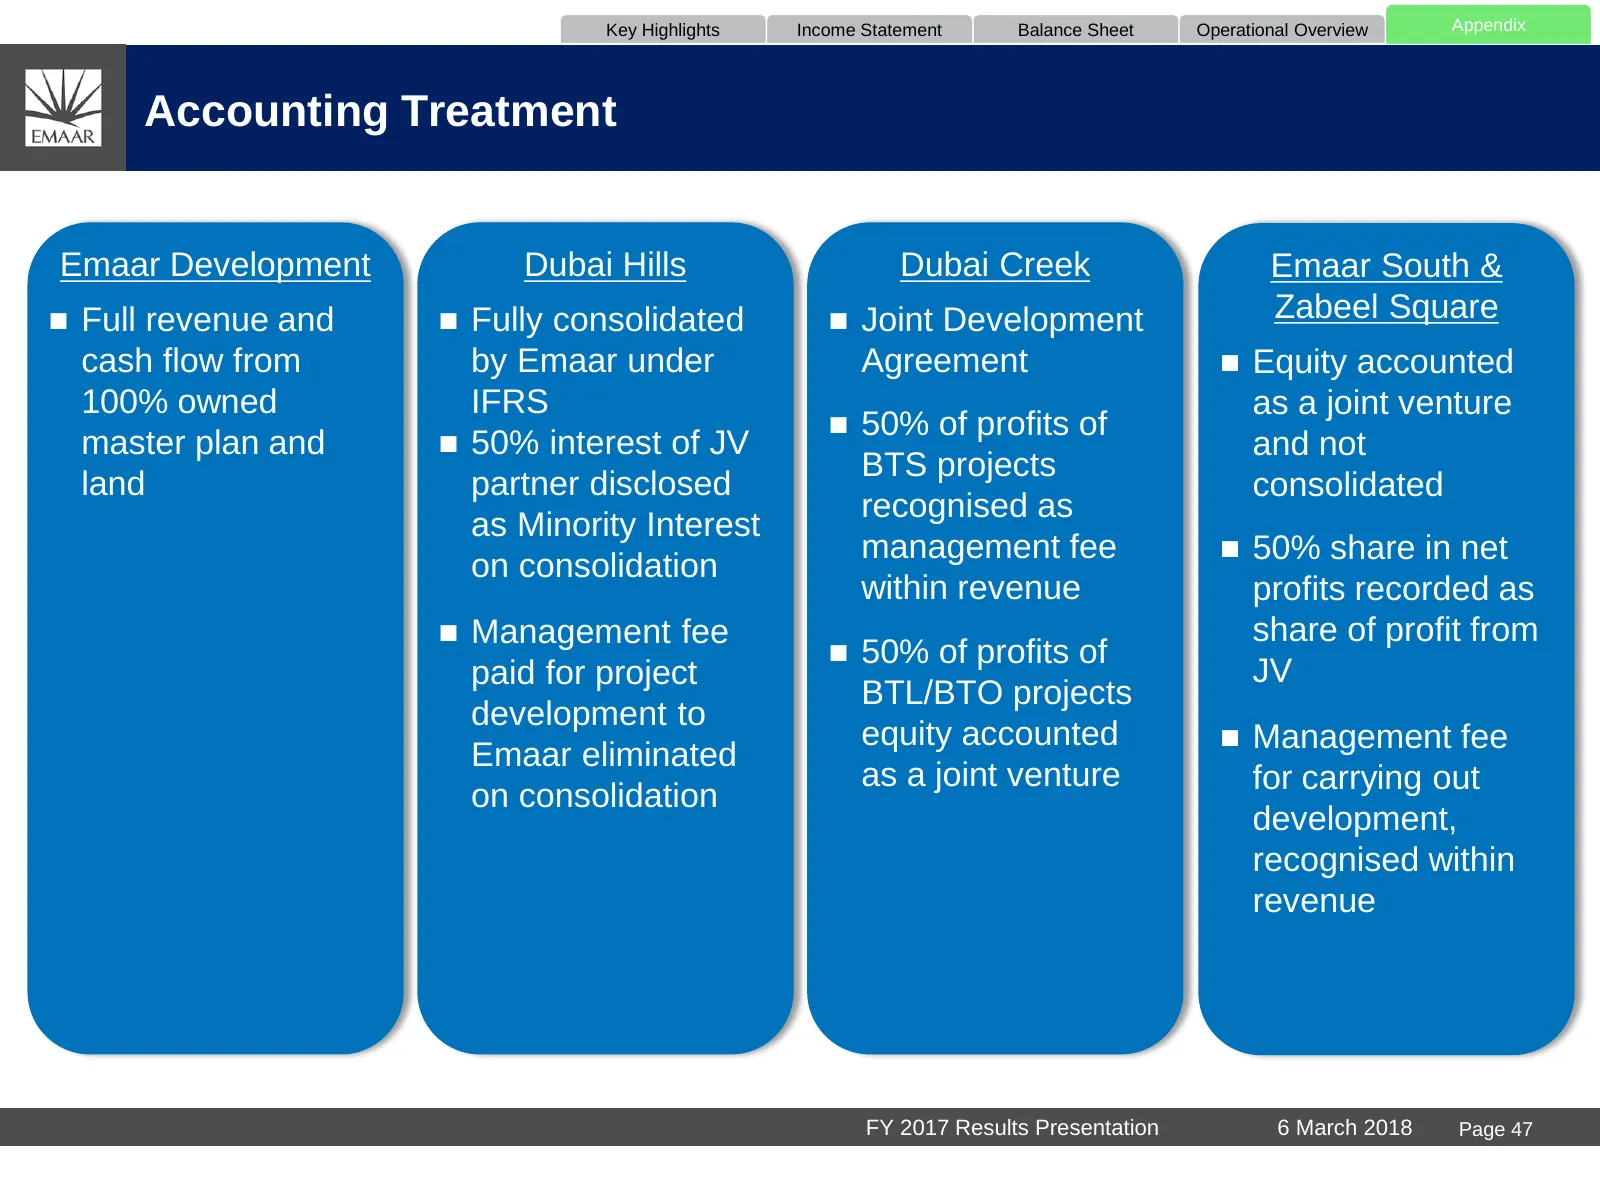
Slide 48: Accounting Treatment
Key Highlights Income Statement Balance Sheet Operational Overview Appendix Accounting Treatment Emaar Development Dubai Hills Dubai Creek Emaar South & Full revenue and Fully consolidated Joint Development Zabeel Square cash flow from by Emaar under Agreement Equity accounted 100% owned IFR
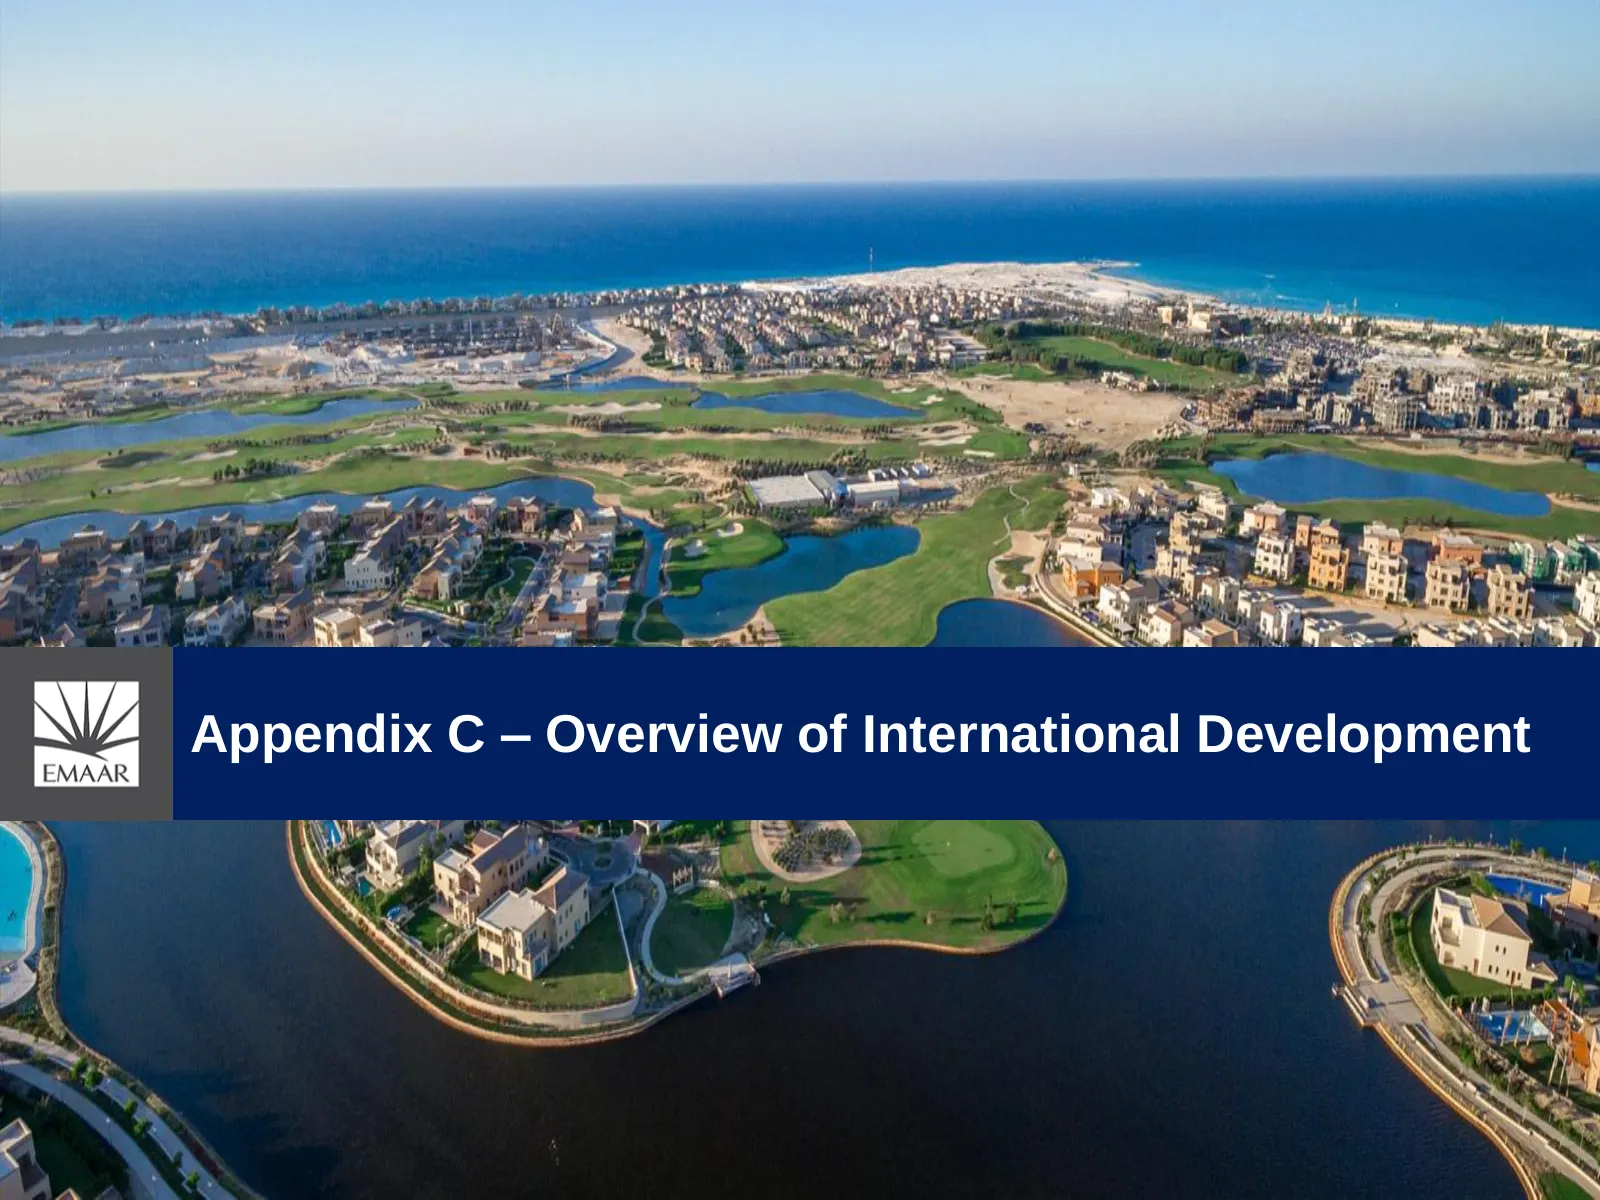
Slide 49: Appendix C – Overview of International Development
Appendix C – Overview of International Development
Slide 50: Overview of International Land Bank
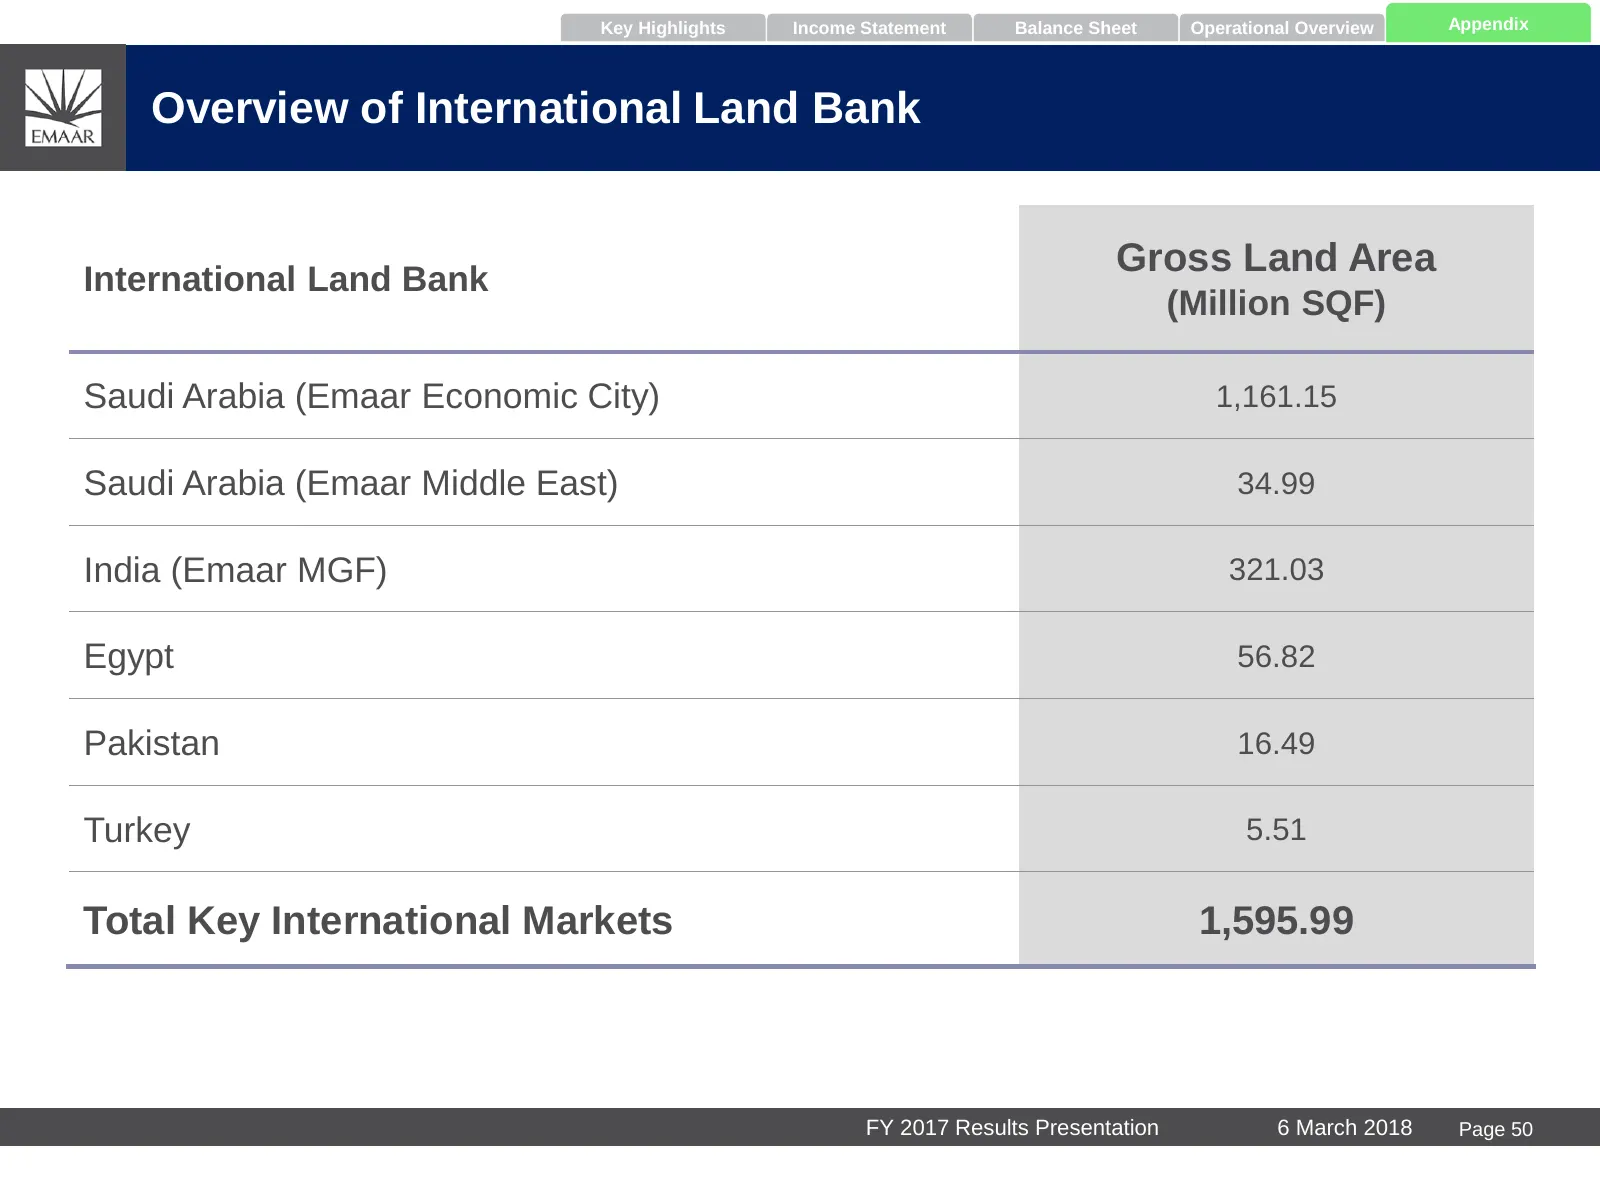
Key Highlights Income Statement Balance Sheet Operational Overview Appendix Overview of International Land Bank International Land Bank Gross Land Area (Million SQF) Saudi Arabia (Emaar Economic City) 1,161.15 Saudi Arabia (Emaar Middle East) 34.99 India (Emaar MGF) 321.03 Egypt 56.82 Pakistan 16.49
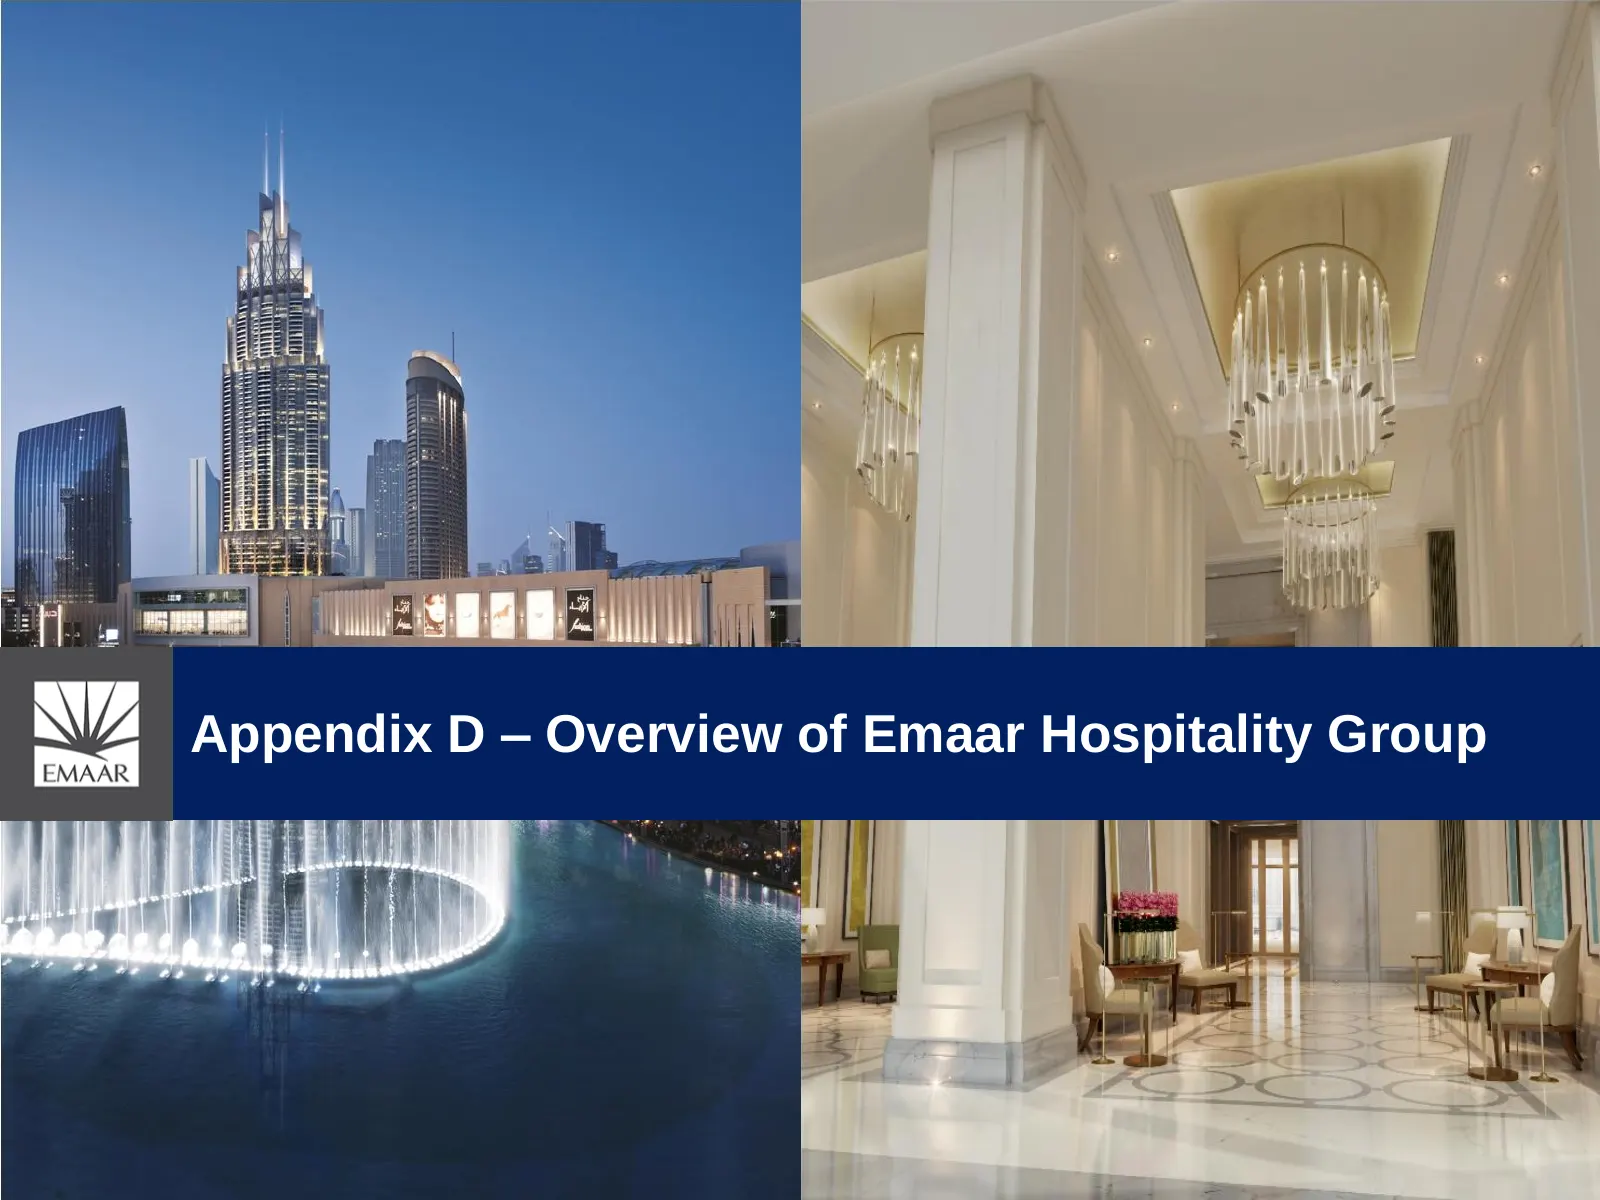
Slide 51: Appendix D – Overview of Emaar Hospitality Group
Appendix D – Overview of Emaar Hospitality Group
Slide 52: Emaar Hospitality Group Portfolio
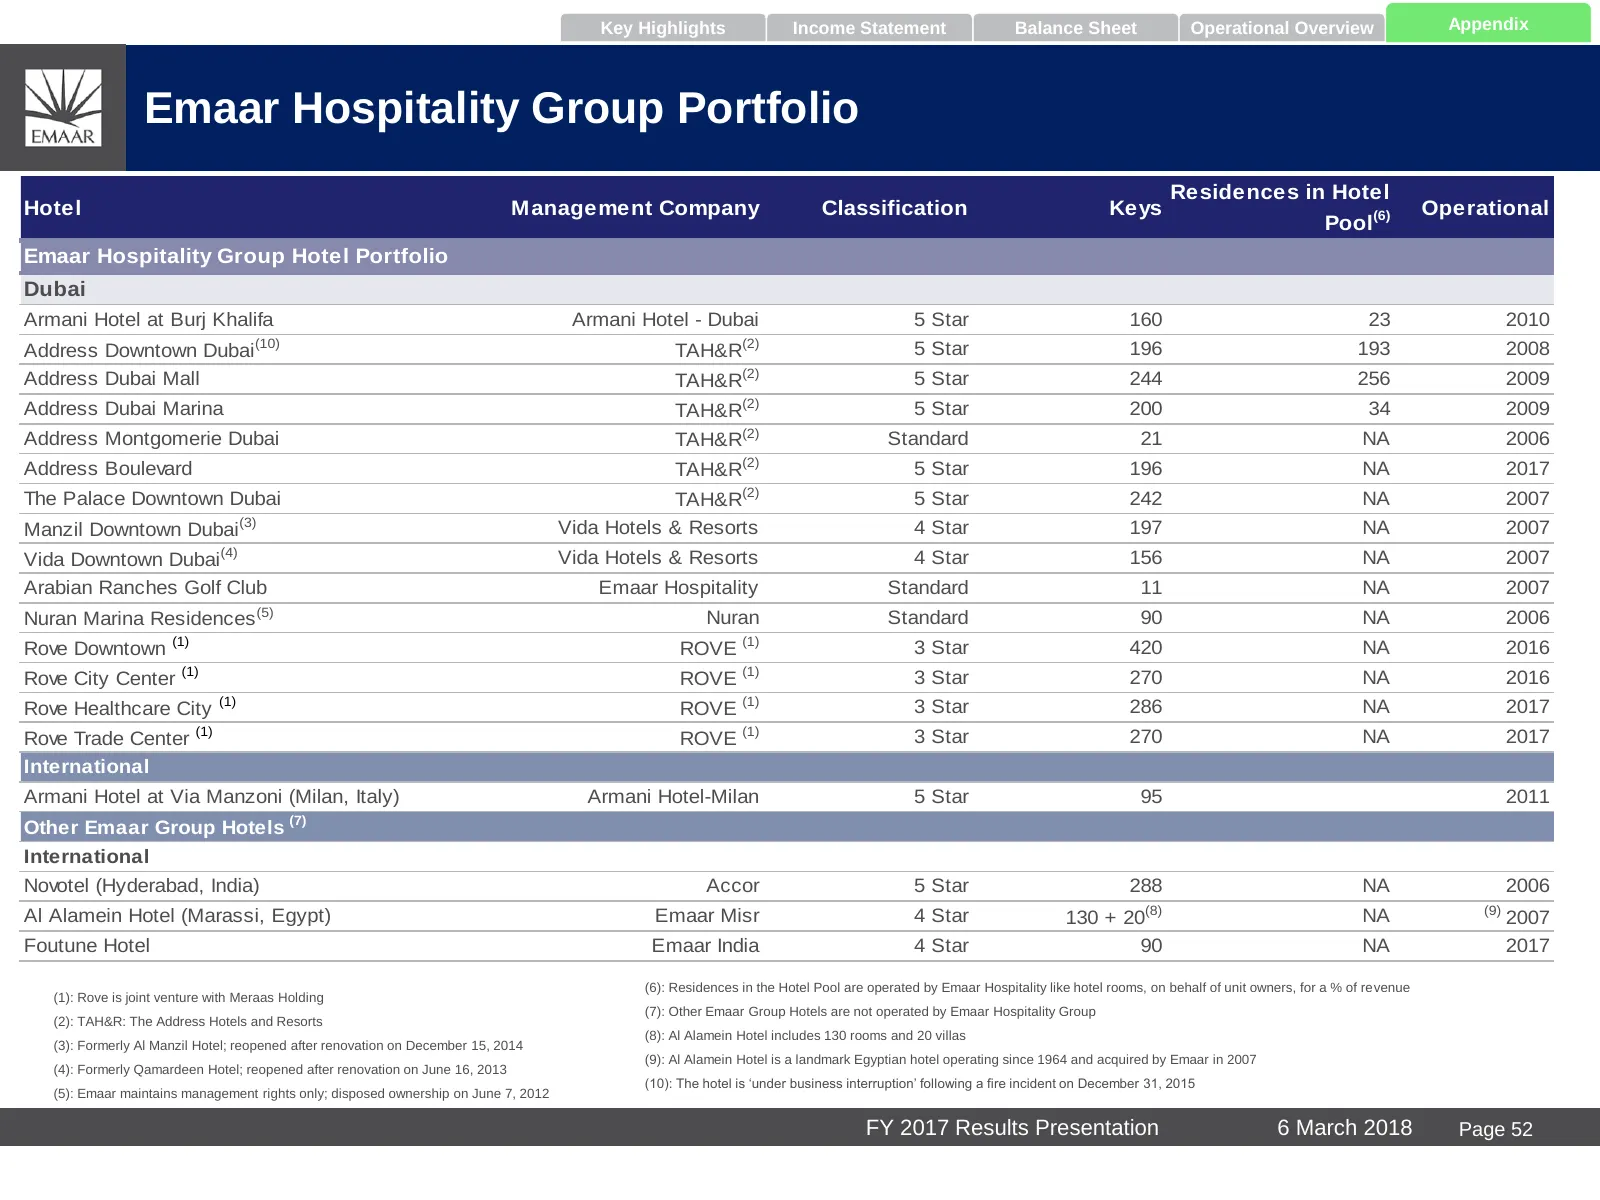
Key Highlights Income Statement Balance Sheet Operational Overview Appendix Emaar Hospitality Group Portfolio Residences in Hotel Hotel Management Company Classification Keys Operational Pool(6) Emaar Hospitality Group Hotel Portfolio Dubai Armani Hotel at Burj Khalifa Armani Hotel - Dubai 5 Star 16
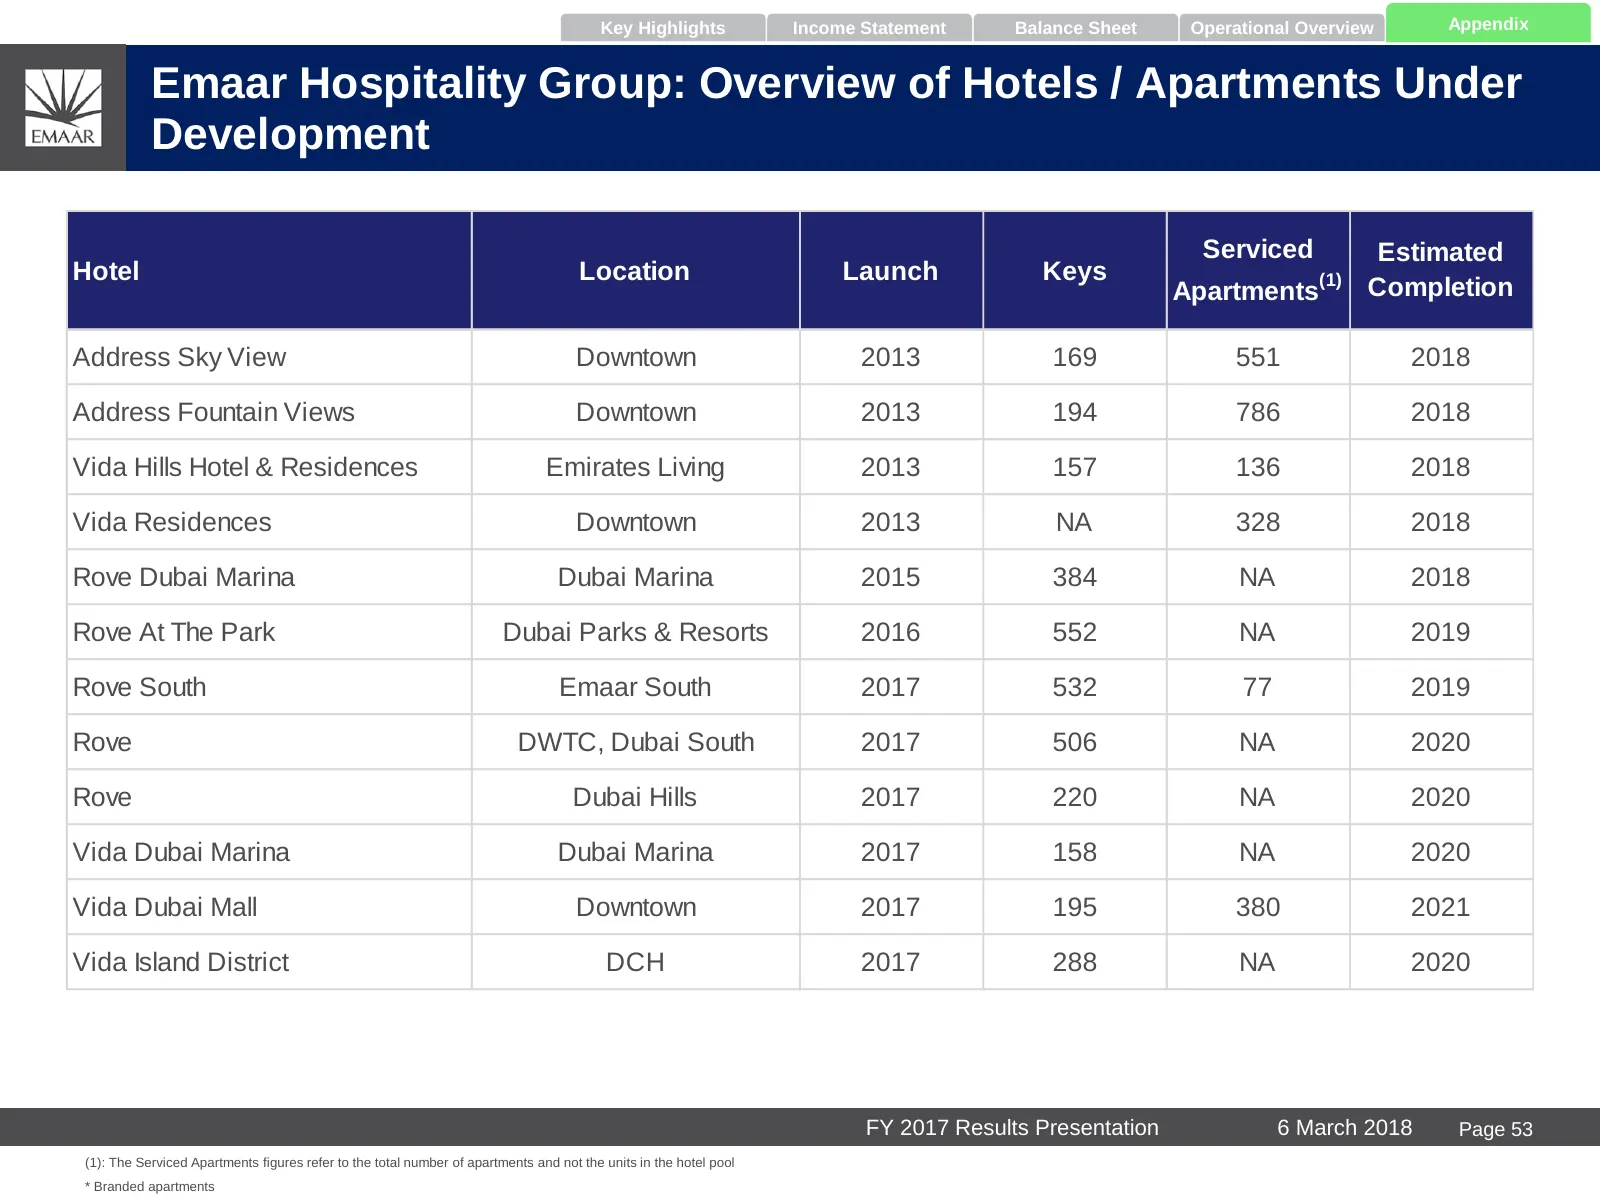
Slide 53: Hotels / Apartments Under Development
Key Highlights Income Statement Balance Sheet Operational Overview Appendix Emaar Hospitality Group: Overview of Hotels / Apartments Under Development Serviced Estimated Hotel Location Launch Keys (1) Apartments Completion Address Sky View Downtown 2013 169 551 2018 Address Fountain Views Downtown 2
Slide 54: Appendix E – Group Structure
Appendix E – Group Structure
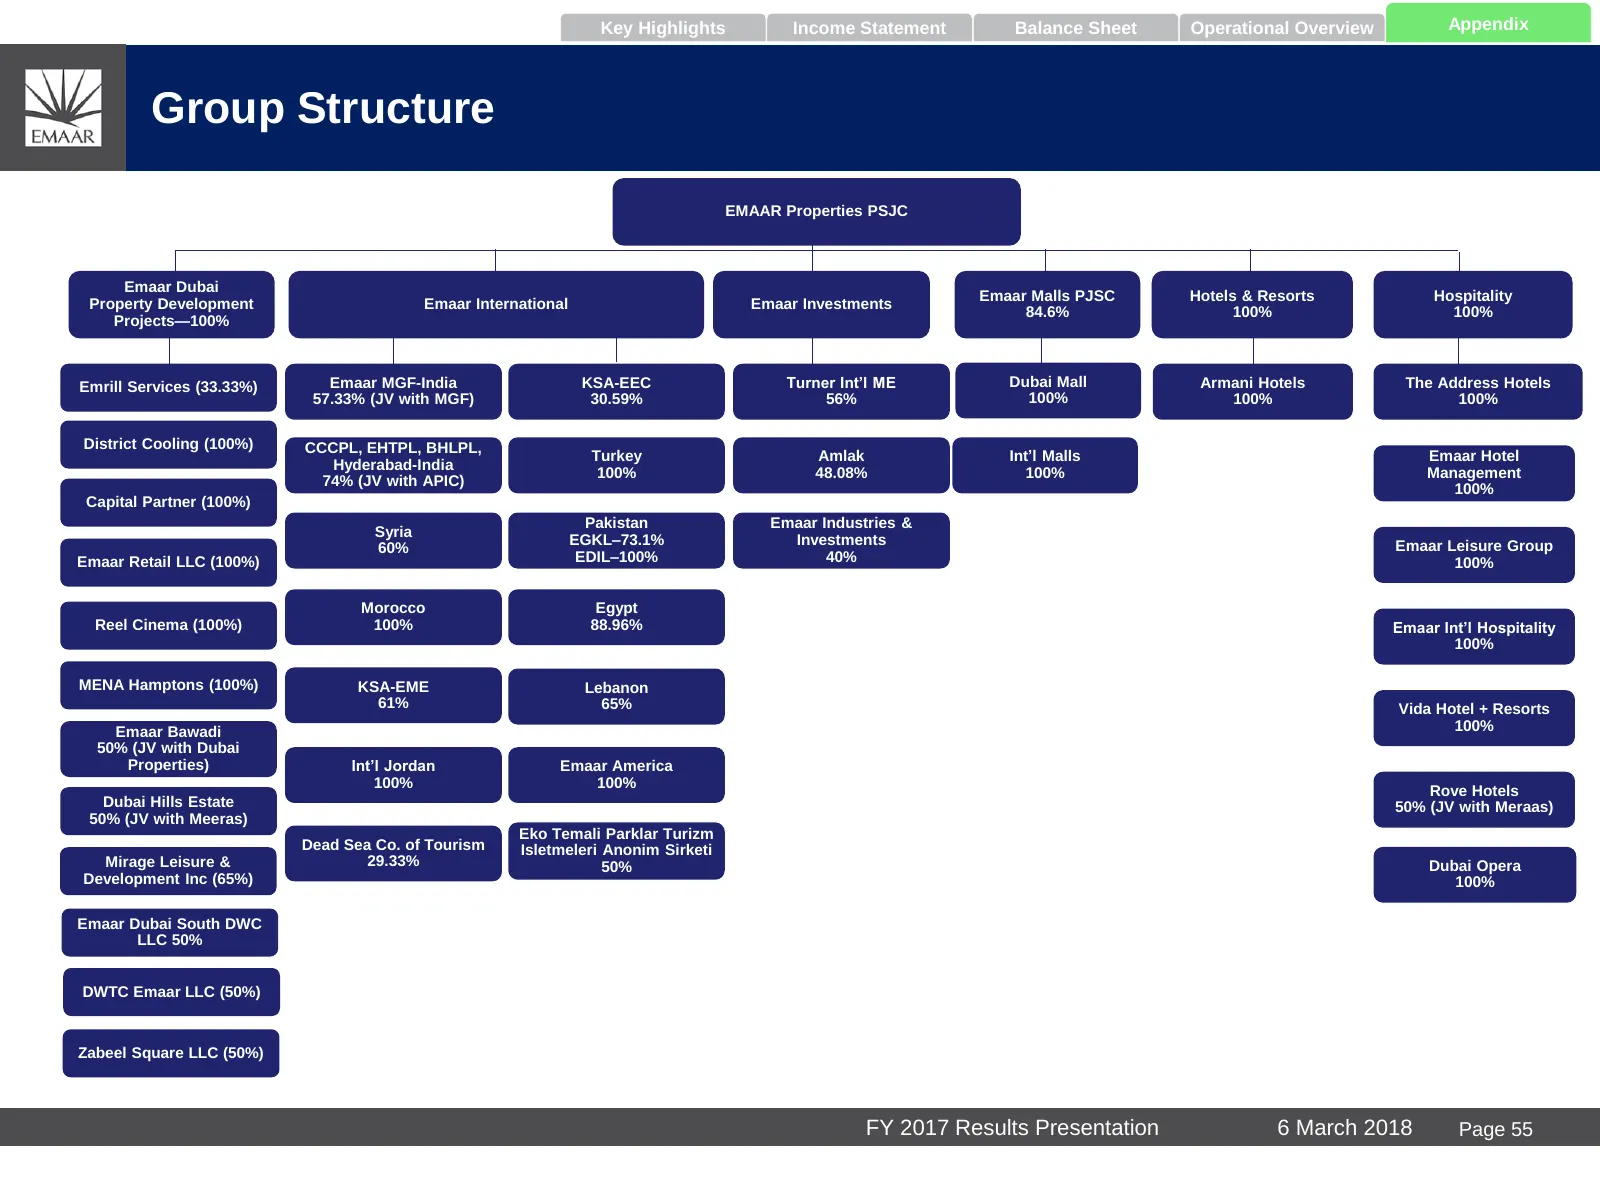
Slide 55: Group Structure
Key Highlights Income Statement Balance Sheet Operational Overview Appendix Group Structure EMAAR Properties PSJC Emaar Dubai Emaar Malls PJSC Hotels & Resorts Hospitality Property Development Emaar International Emaar Investments 84.6% 100% 100% Projects—100% Emrill Services (33.33%) Emaar MGF-Indi
Source: Internet Archive copy of cdn.properties.emaar.com
More decks from Emaar Properties (P.J.S.C)
 H1 2026 Earnings Presentation78 slides · 2026
 Emaar Properties — 9M 2025 Earnings Presentation69 slides · November 2025
 H1 2025 Earnings Presentation69 slides · August 2025
 Emaar Properties — Q1 2025 Earnings Presentation68 slides · May 2025
 Emaar Properties — FY2025 Earnings Presentation71 slides · May 2025
 FY2024 Earnings Presentation70 slides · Feb 24, 2025