Silvergate Capital Corp. · OTC:SICP
Silvergate Capital — Q2 2020 Earnings Presentation
26 slides from Silvergate Capital's earnings presentation, Aug 10, 2020

Slide 1: Silvergate Capital Investor Presentation Second Quarter 2020
Silvergate Capital Investor Presentation Second Quarter 2020
Slide 2: Forward Looking Statements
Forward Looking Statements This presentation contains forward looking statements within the meaning of the Securities and Exchange Act of 1934, as amended, including statements of goals, intentions, and expectations as to future trends, plans, events or results of Company operations and policies and
Slide 3: Introduction
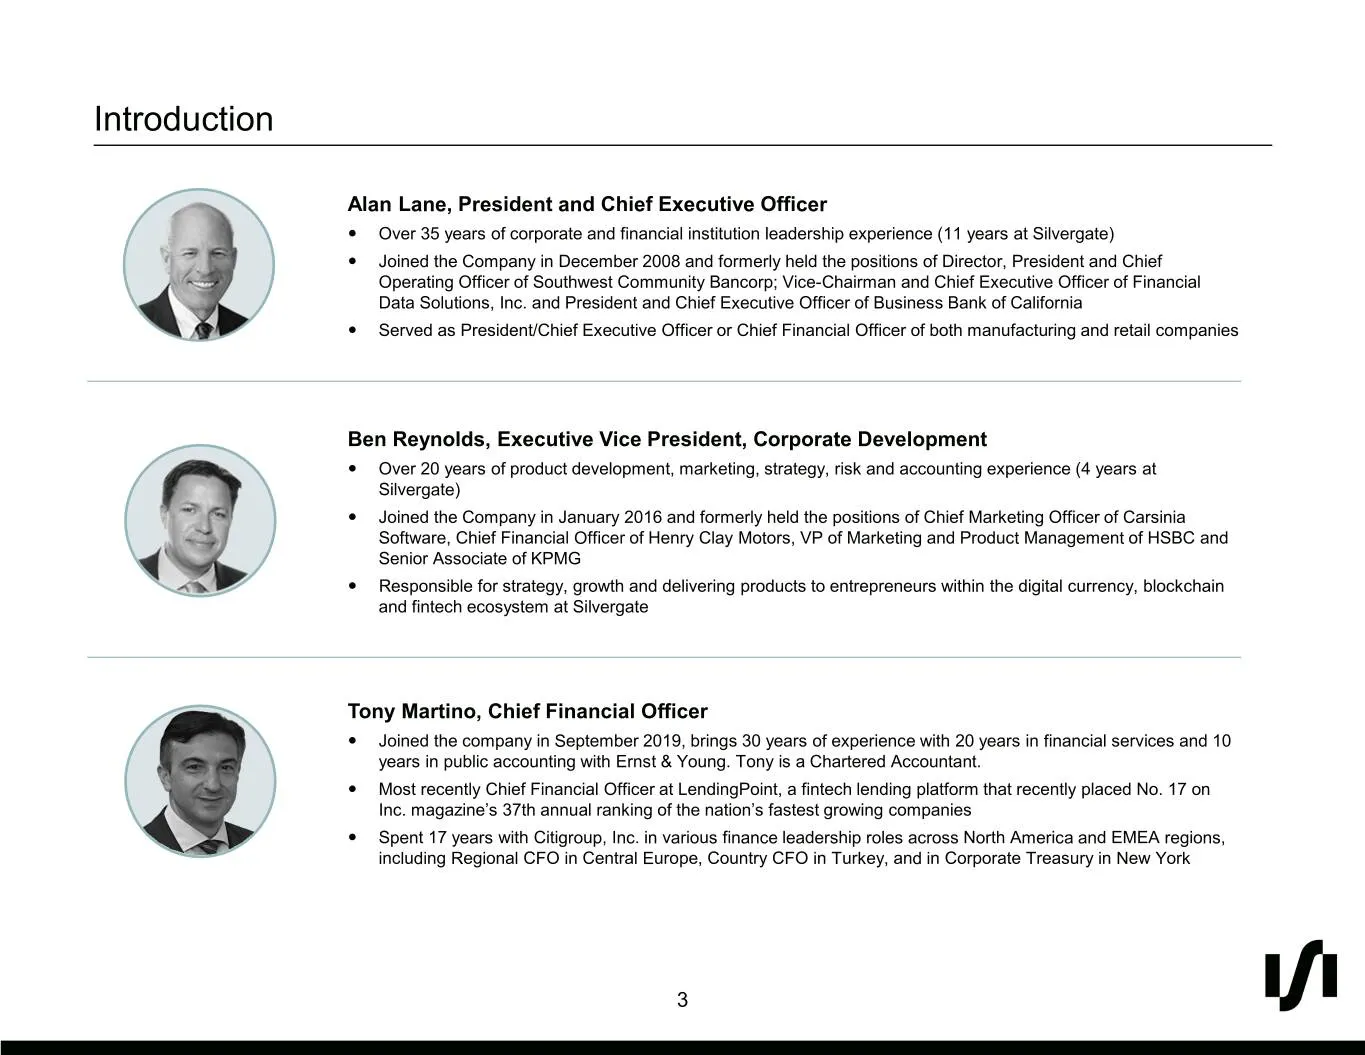
Introduction Alan Lane, President and Chief Executive Officer Over 35 years of corporate and financial institution leadership experience (11 years at Silvergate) Joined the Company in December 2008 and formerly held the positions of Director, President and Chief Operating Officer of Southwest Co
Slide 4: Silvergate Overview
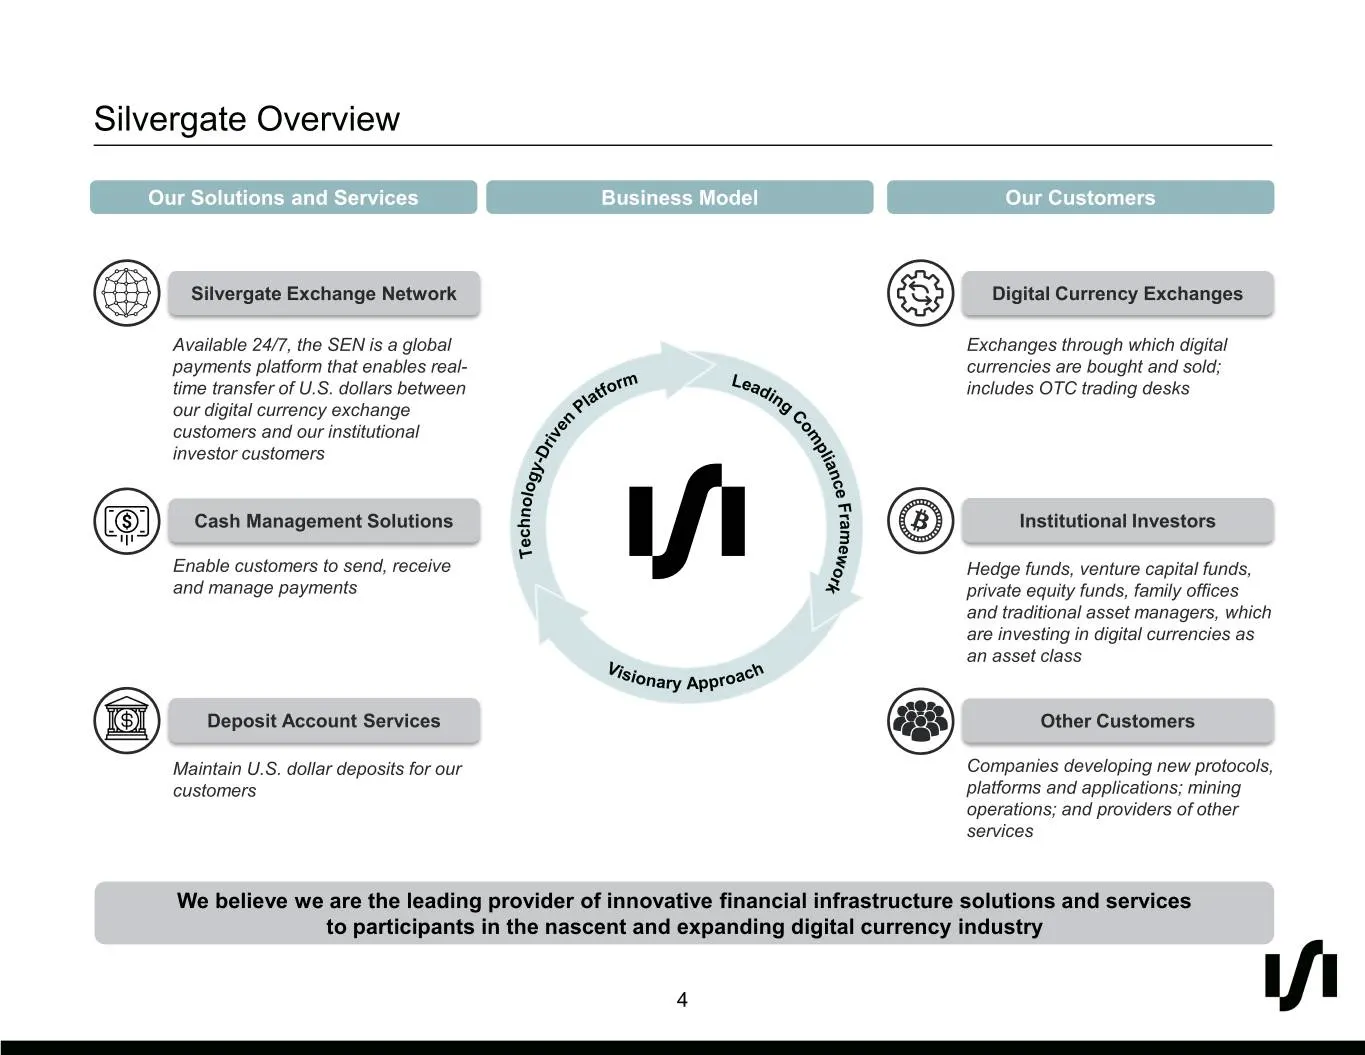
Silvergate Overview Our Solutions and Services Business Model Our Customers Silvergate Exchange Network Digital Currency Exchanges Available 24/7, the SEN is a global Exchanges through which digital payments platform that enables real- currencies are bought and sold; time transfer of U.S. dollars be
Slide 5: Digital Currency Platform Expansion
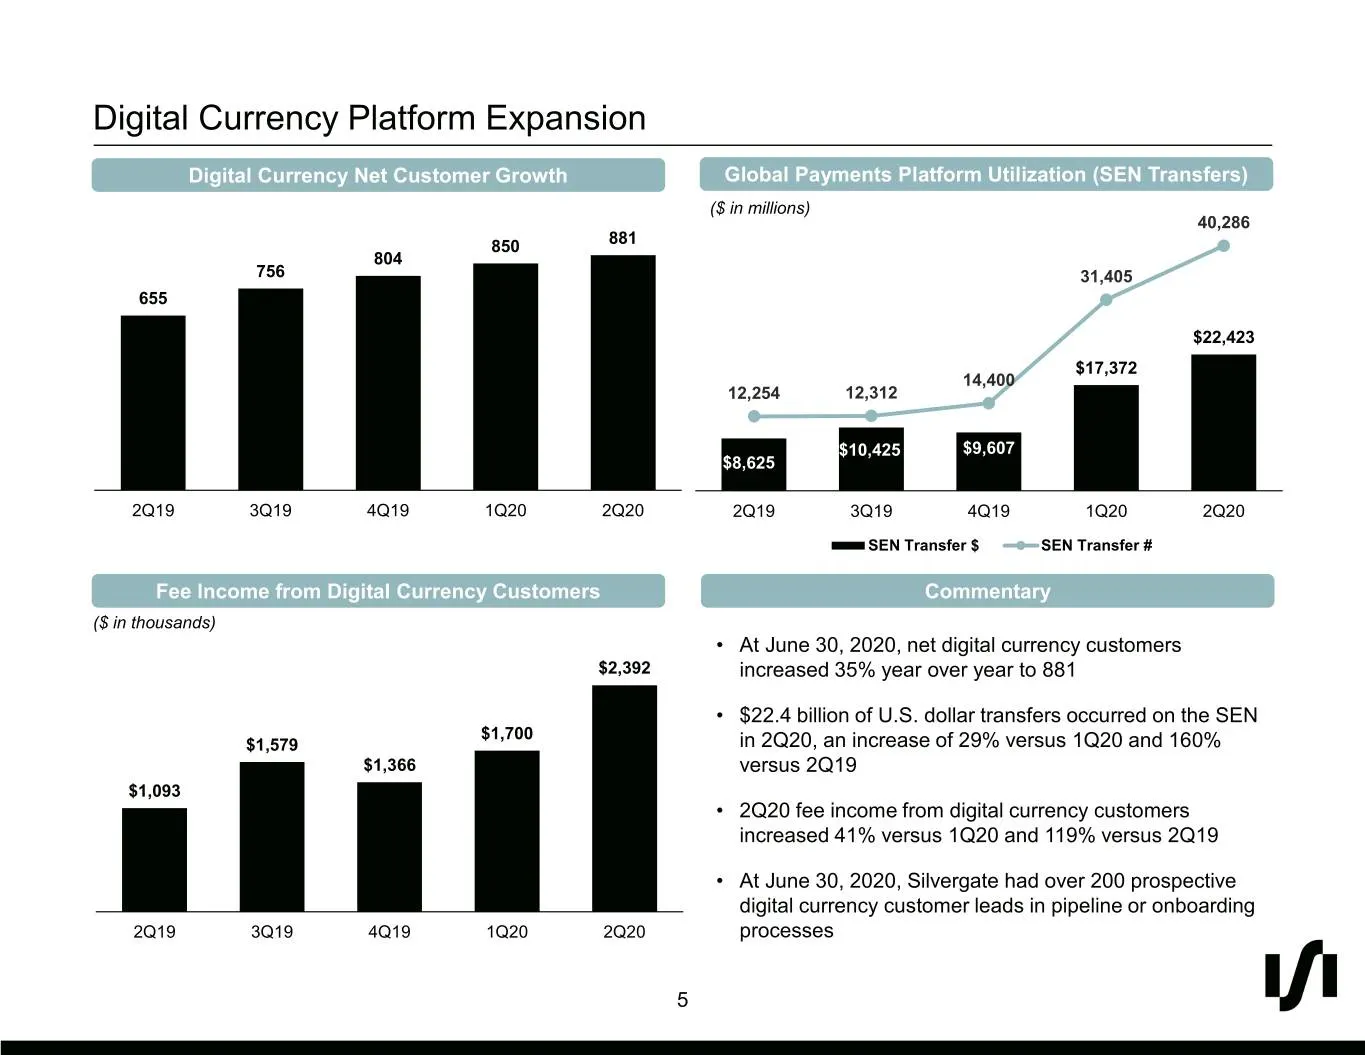
Digital Currency Platform Expansion Digital Currency Net Customer Growth Global Payments Platform Utilization (SEN Transfers) ($ in millions) 40,286 850 881 804 756 31,405 655 $22,423 $17,372 14,400 12,254 12,312 $10,425 $9,607 $8,625 2Q19 3Q19 4Q19 1Q20 2Q20 2Q19 3Q19 4Q19 1Q20 2Q20 SEN Transfer $
Slide 6: Investment Highlights
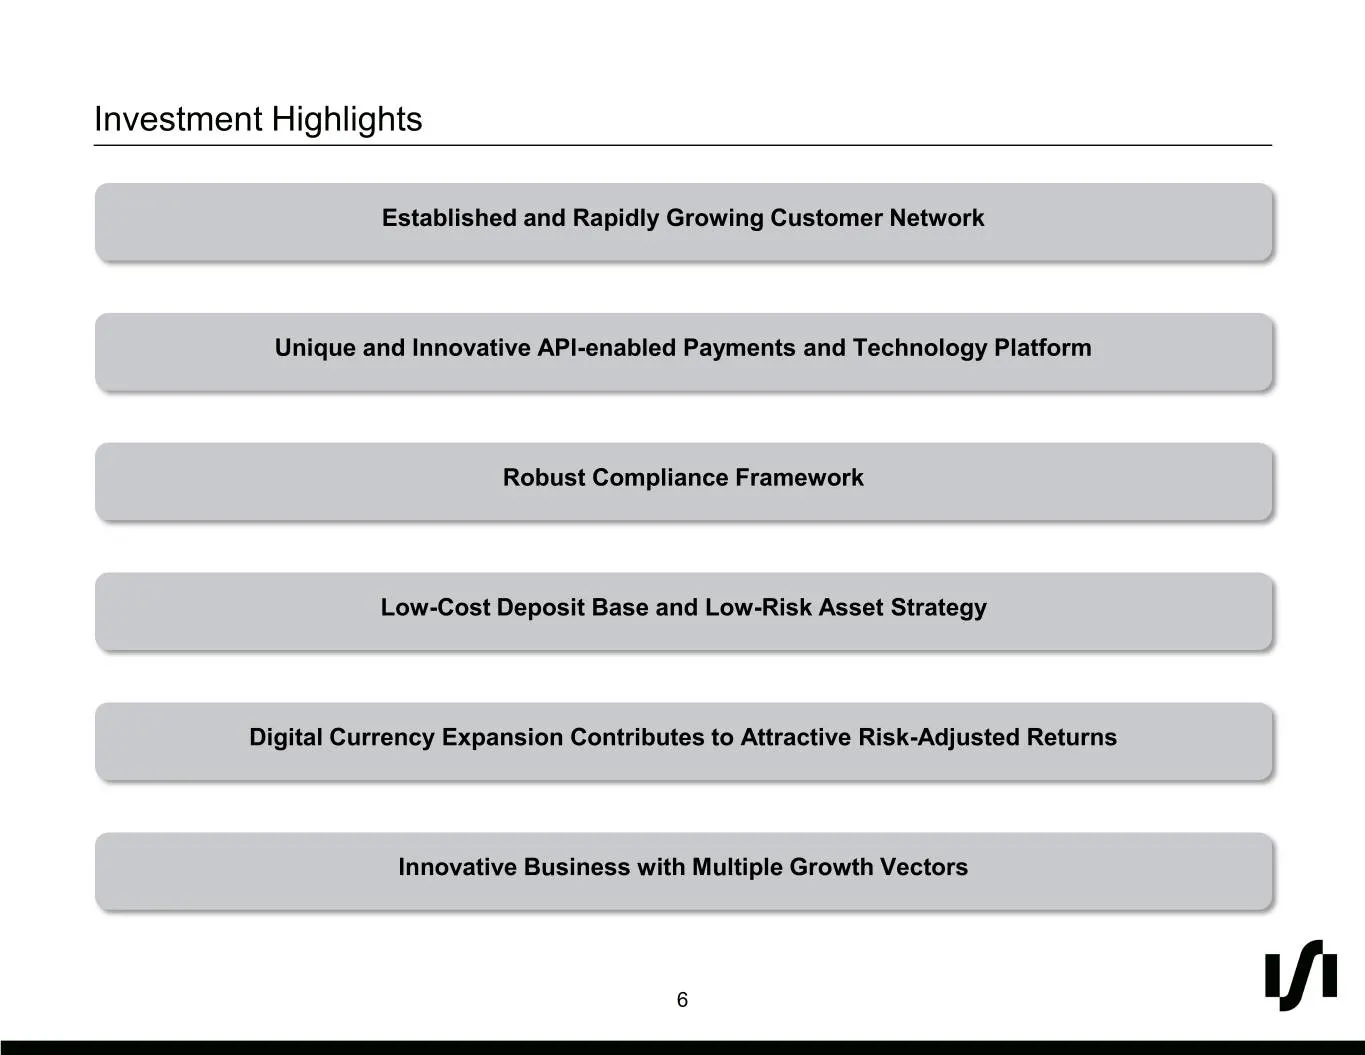
Investment Highlights Established and Rapidly Growing Customer Network Unique and Innovative API-enabled Payments and Technology Platform Robust Compliance Framework Low-Cost Deposit Base and Low-Risk Asset Strategy Digital Currency Expansion Contributes to Attractive Risk-Adjusted Returns Innovativ
Slide 7: Focused on Customers that Consider Digital Currencies a New Asset Class
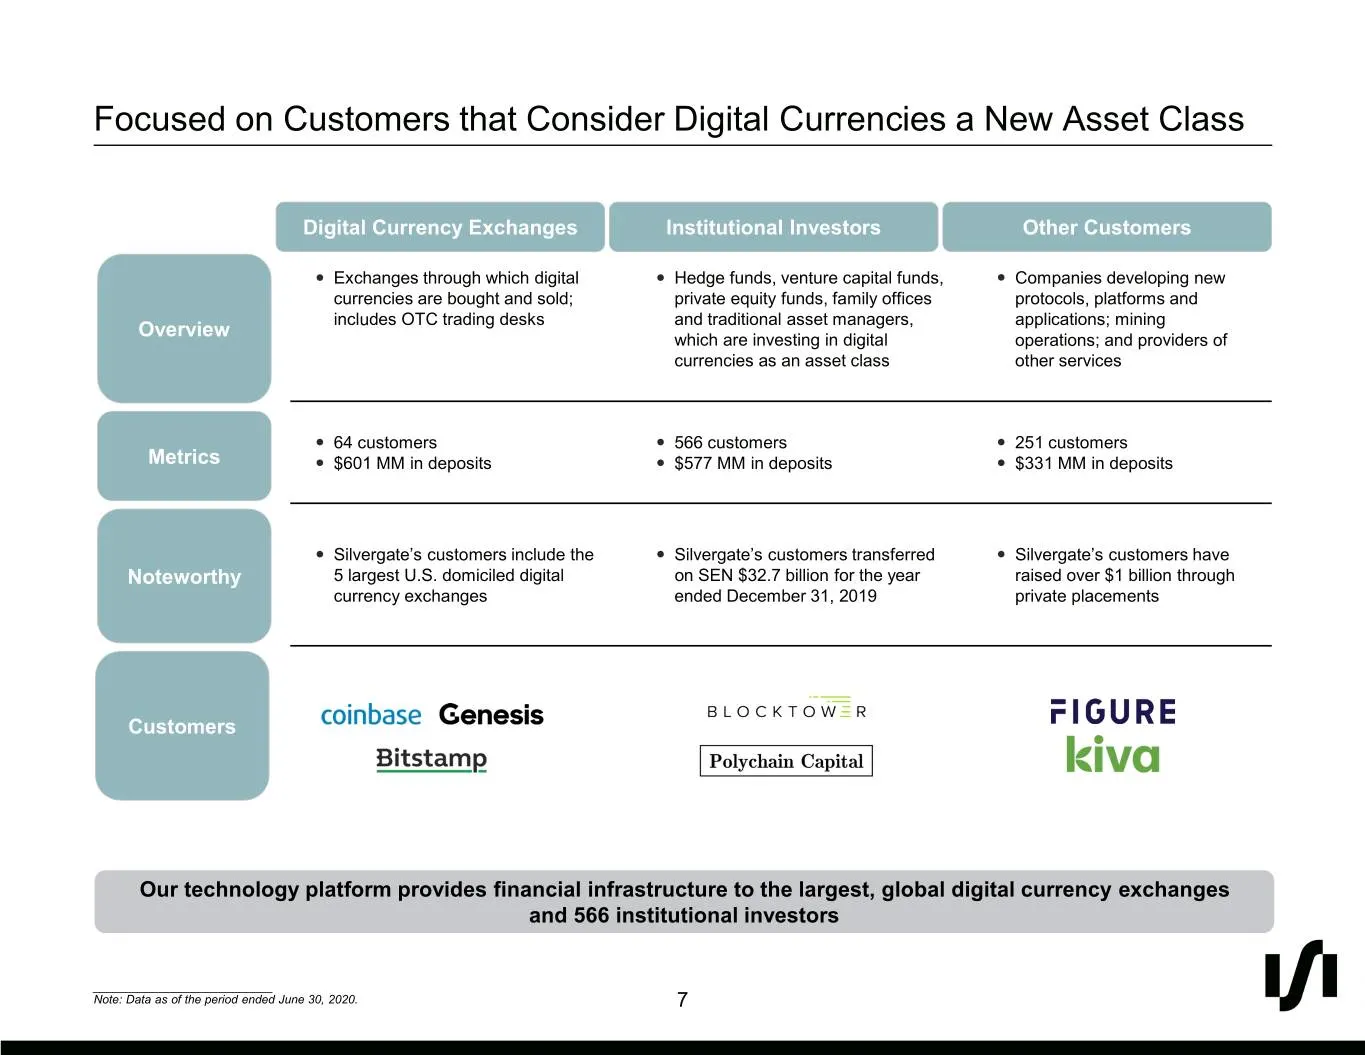
Focused on Customers that Consider Digital Currencies a New Asset Class Digital Currency Exchanges Institutional Investors Other Customers Exchanges through which digital Hedge funds, venture capital funds, Companies developing new currencies are bought and sold; private equity funds, family o
Slide 8: Customers were Previously Limited by Traditional Banking Services
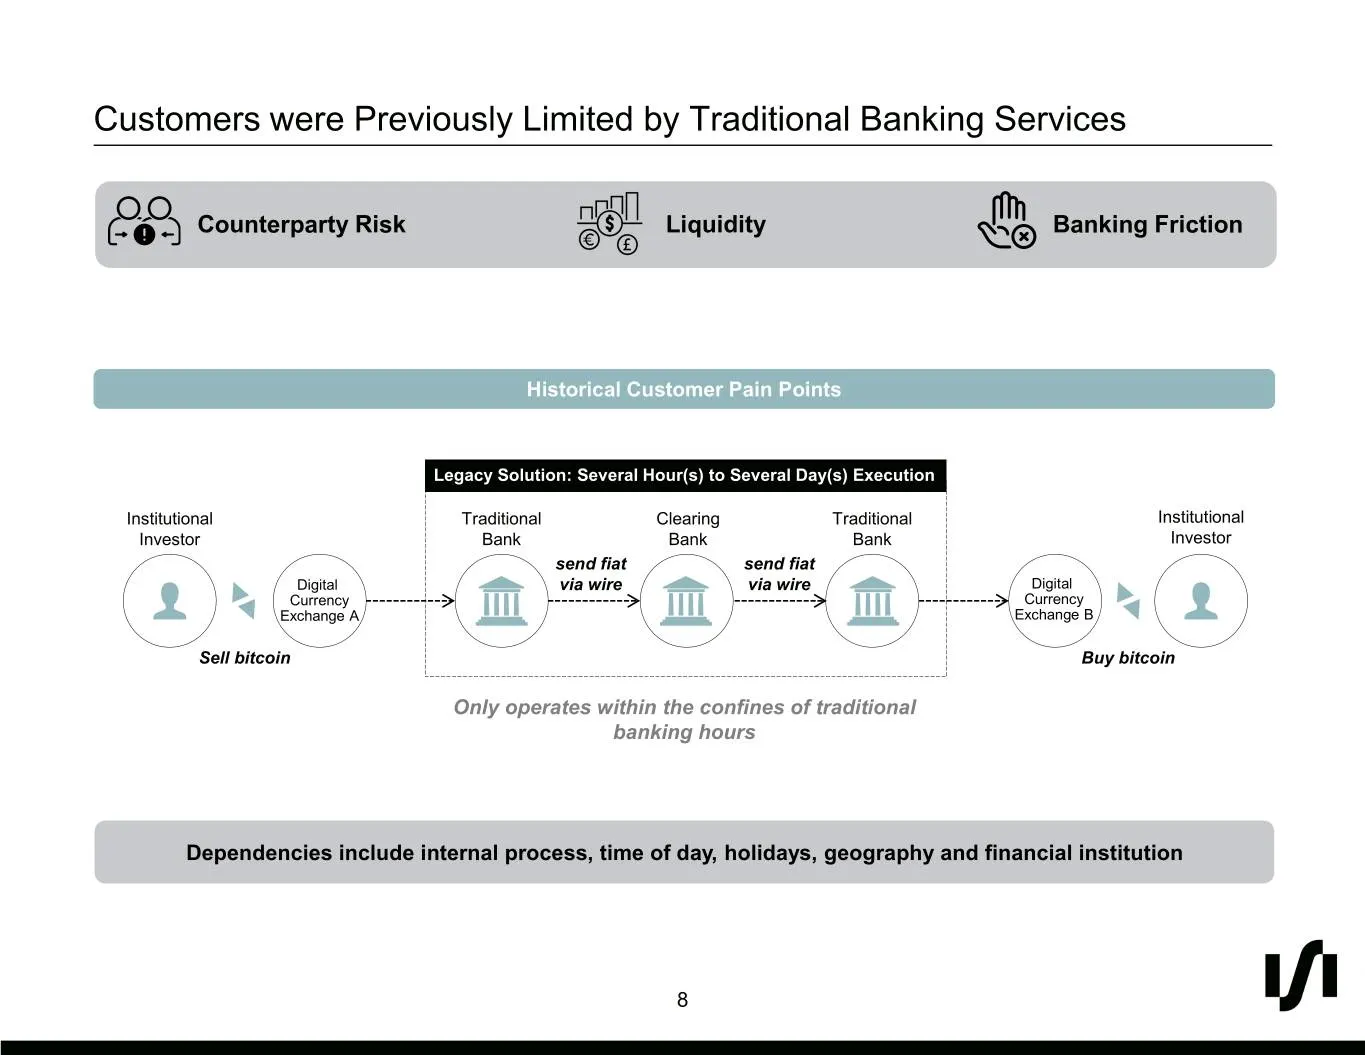
Customers were Previously Limited by Traditional Banking Services Counterparty Risk Liquidity Banking Friction Historical Customer Pain Points Legacy Solution: Several Hour(s) to Several Day(s) Execution Institutional Traditional Clearing Traditional Institutional Investor Bank Bank Bank Investor se
Slide 9: Network Effect of the SEN Creates Barriers to Entry
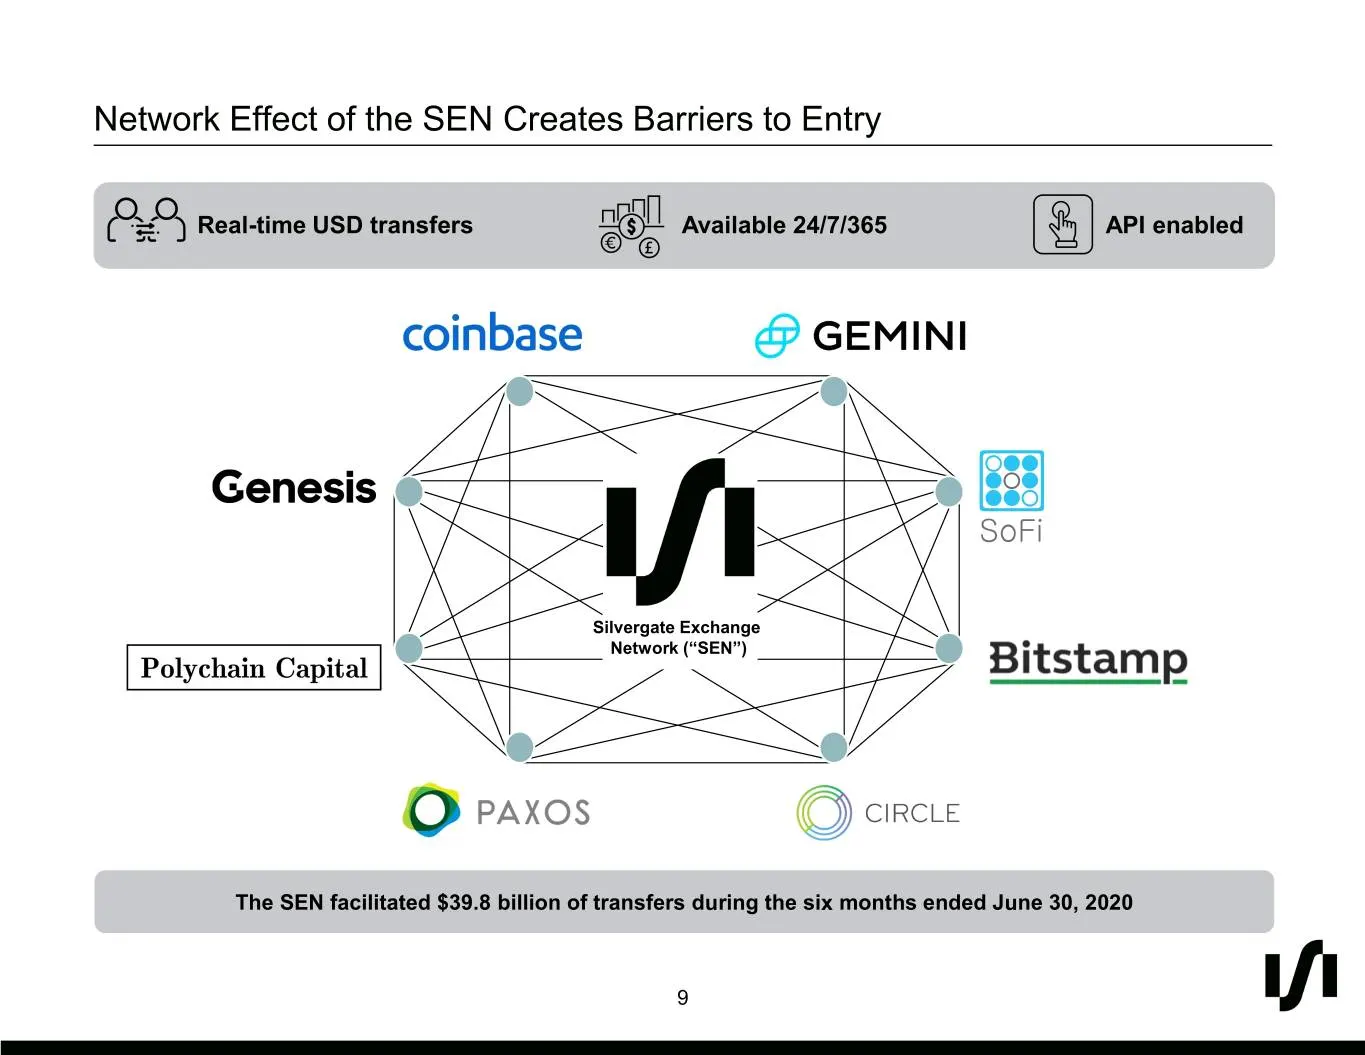
Network Effect of the SEN Creates Barriers to Entry Real-time USD transfers Available 24/7/365 API enabled Silvergate Exchange Network (“SEN”) The SEN facilitated $39.8 billion of transfers during the six months ended June 30, 2020 9
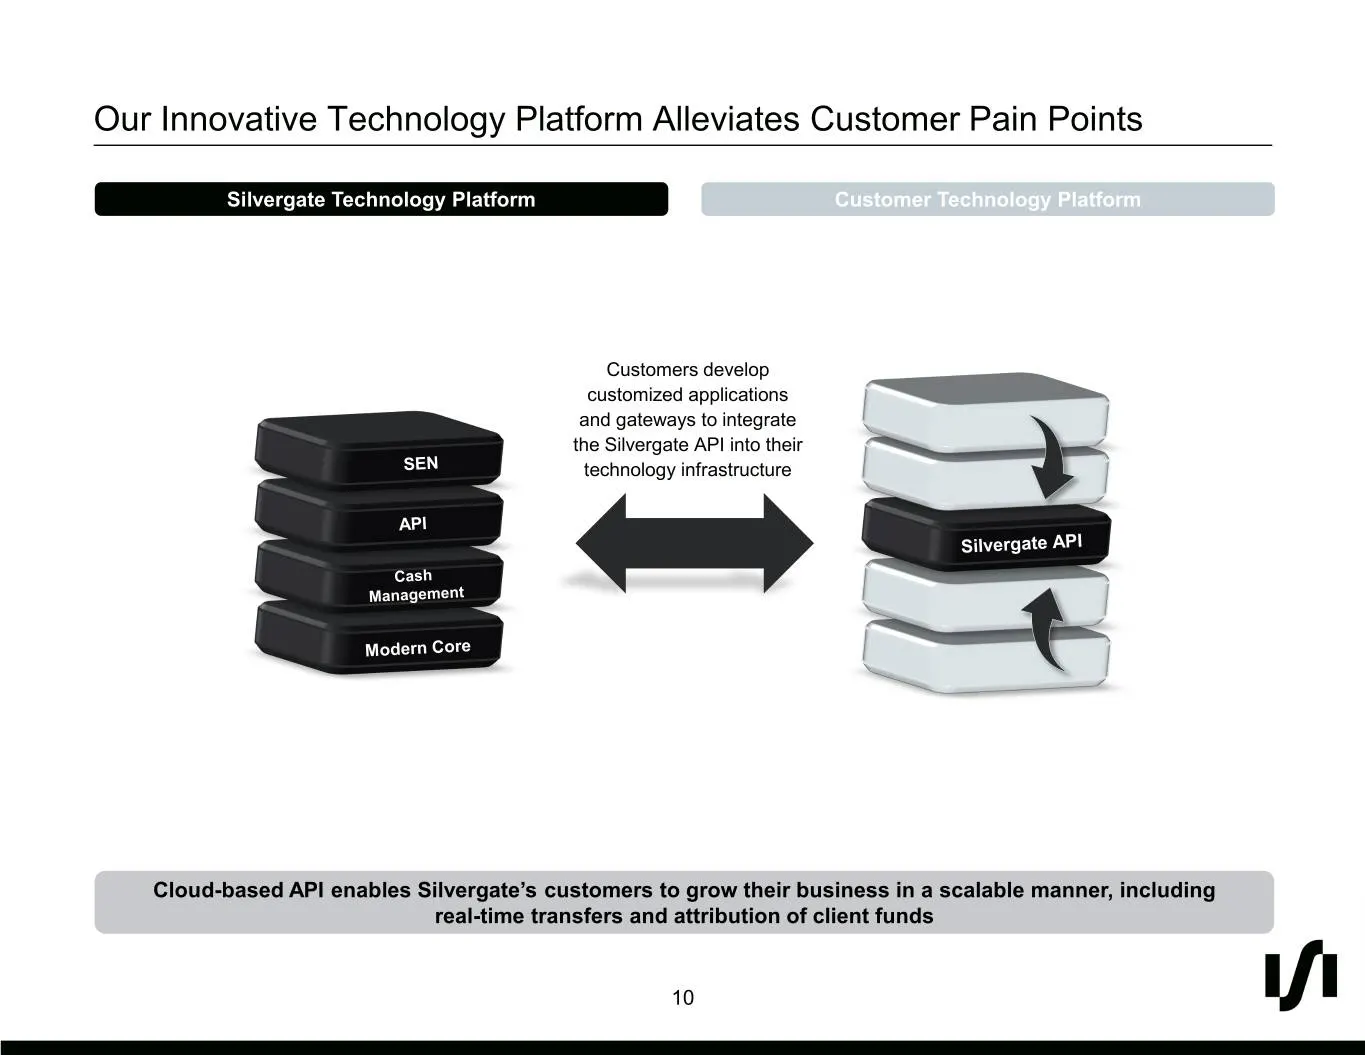
Slide 10: Our Innovative Technology Platform Alleviates Customer Pain Points
Our Innovative Technology Platform Alleviates Customer Pain Points Silvergate Technology Platform Customer Technology Platform Customers develop customized applications and gateways to integrate the Silvergate API into their technology infrastructure Cloud-based API enables Silvergate’s customers to
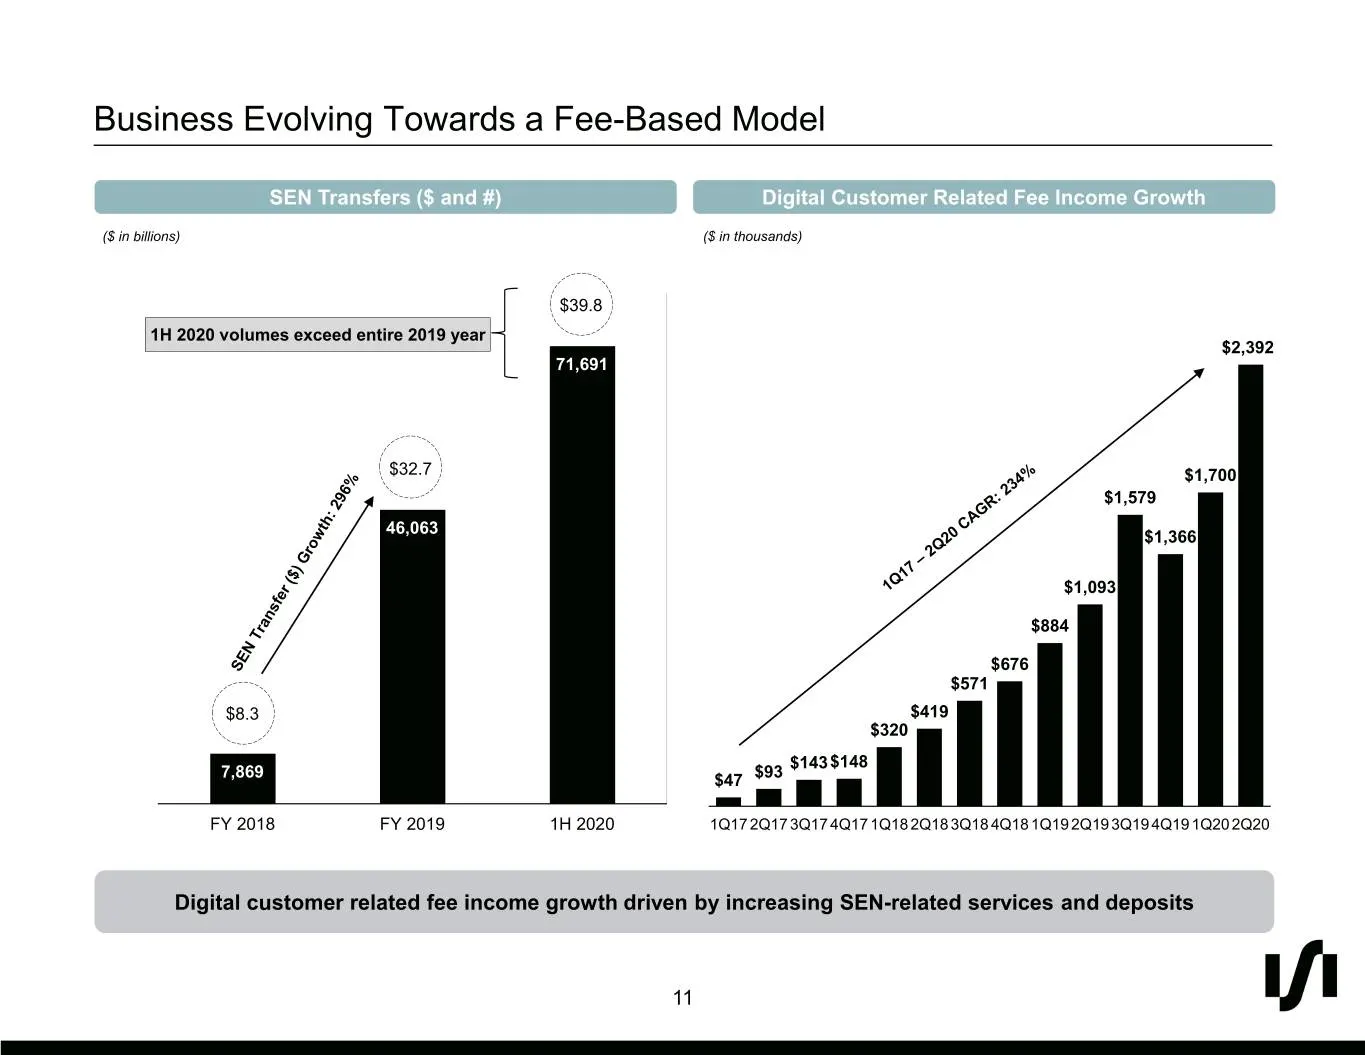
Slide 11: Business Evolving Towards a Fee-Based Model
Business Evolving Towards a Fee-Based Model SEN Transfers ($ and #) Digital Customer Related Fee Income Growth ($ in billions) ($ in thousands) 80,000 $39.8 1H 2020 volumes exceed entire 2019 year 70,000 $2,392 71,691 60,000 $32.7 50,000 $1,700 $1,579 46,063 $1,366 40,000 $1,093 30,000 $884 $676 20,
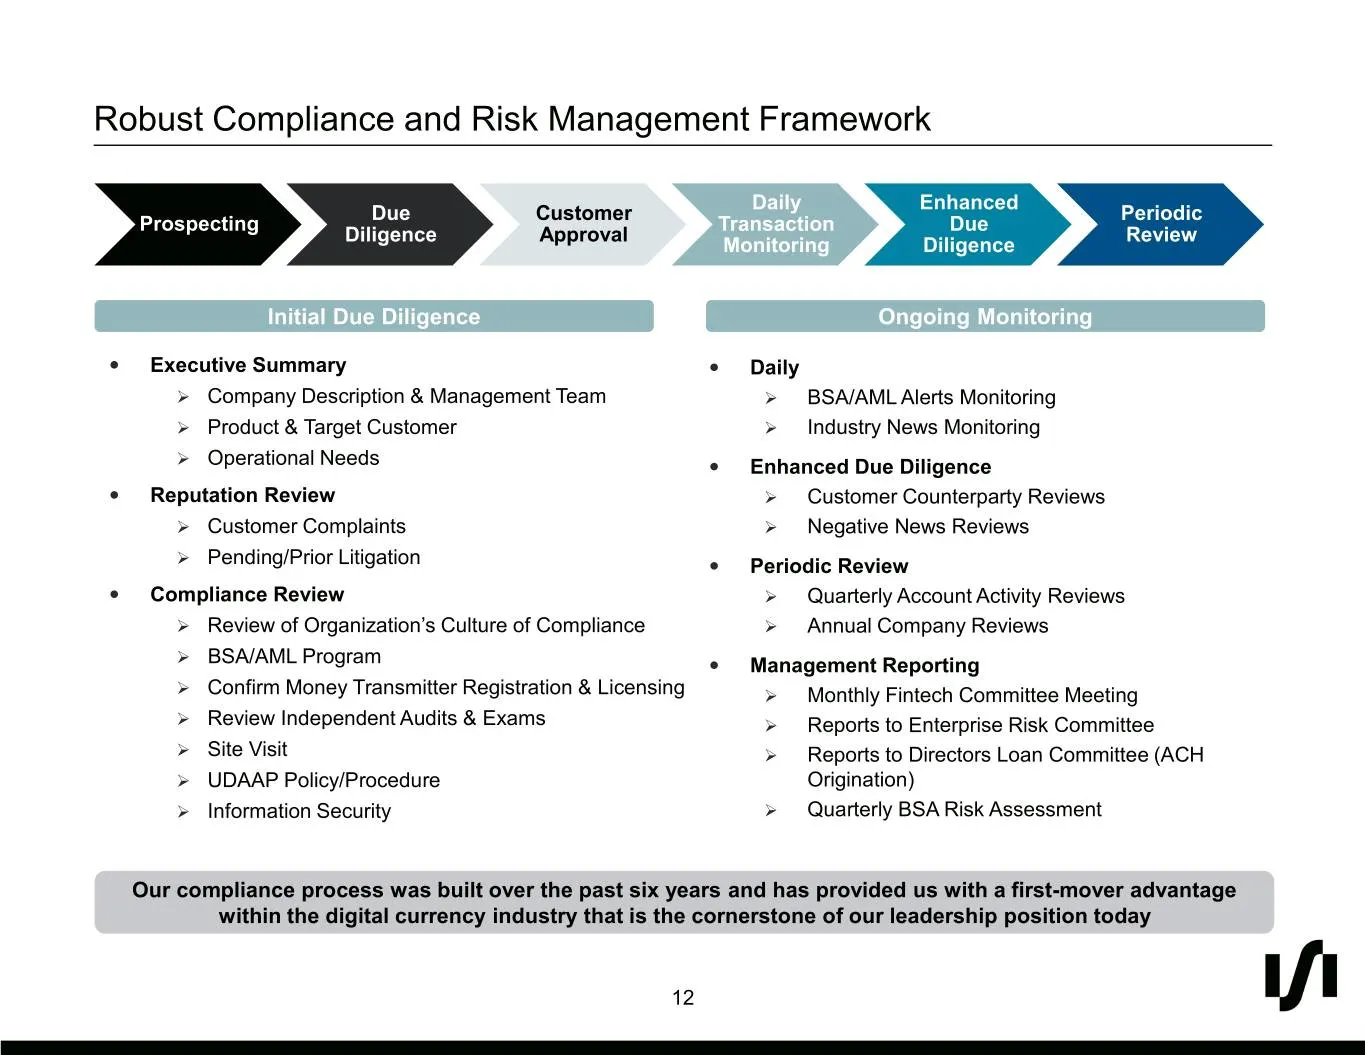
Slide 12: Robust Compliance and Risk Management Framework
Robust Compliance and Risk Management Framework Daily Enhanced Due Customer Periodic Prospecting Transaction Due Diligence Approval Review Monitoring Diligence Initial Due Diligence Ongoing Monitoring Executive Summary Daily Company Description & Management Team BSA/AML Alerts Monitoring P
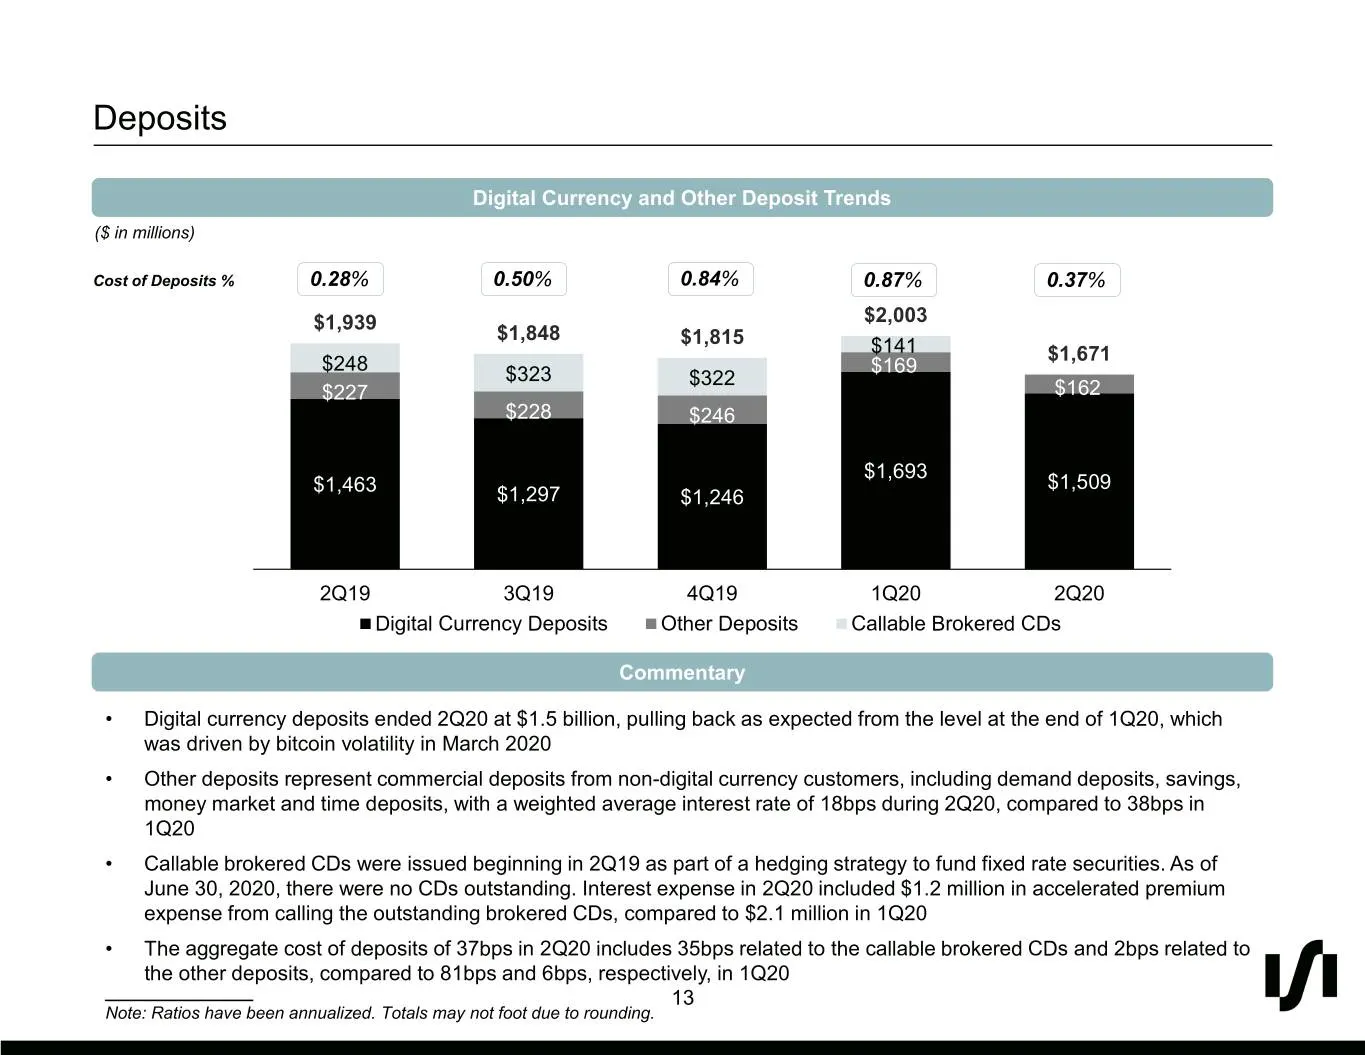
Slide 13: Deposits
Deposits Digital Currency and Other Deposit Trends ($ in millions) Cost of Deposits % 0.28% 0.50% 0.84% 0.87% 0.37% $1,939 $2,003 $1,848 $1,815 $141 $1,671 $248 $169 $323 $322 $227 $162 $228 $246 $1,693 $1,463 $1,509 $1,297 $1,246 2Q19 3Q19 4Q19 1Q20 2Q20 Digital Currency Deposits Other Deposits Cal
Slide 14: Securities and Loan Portfolio
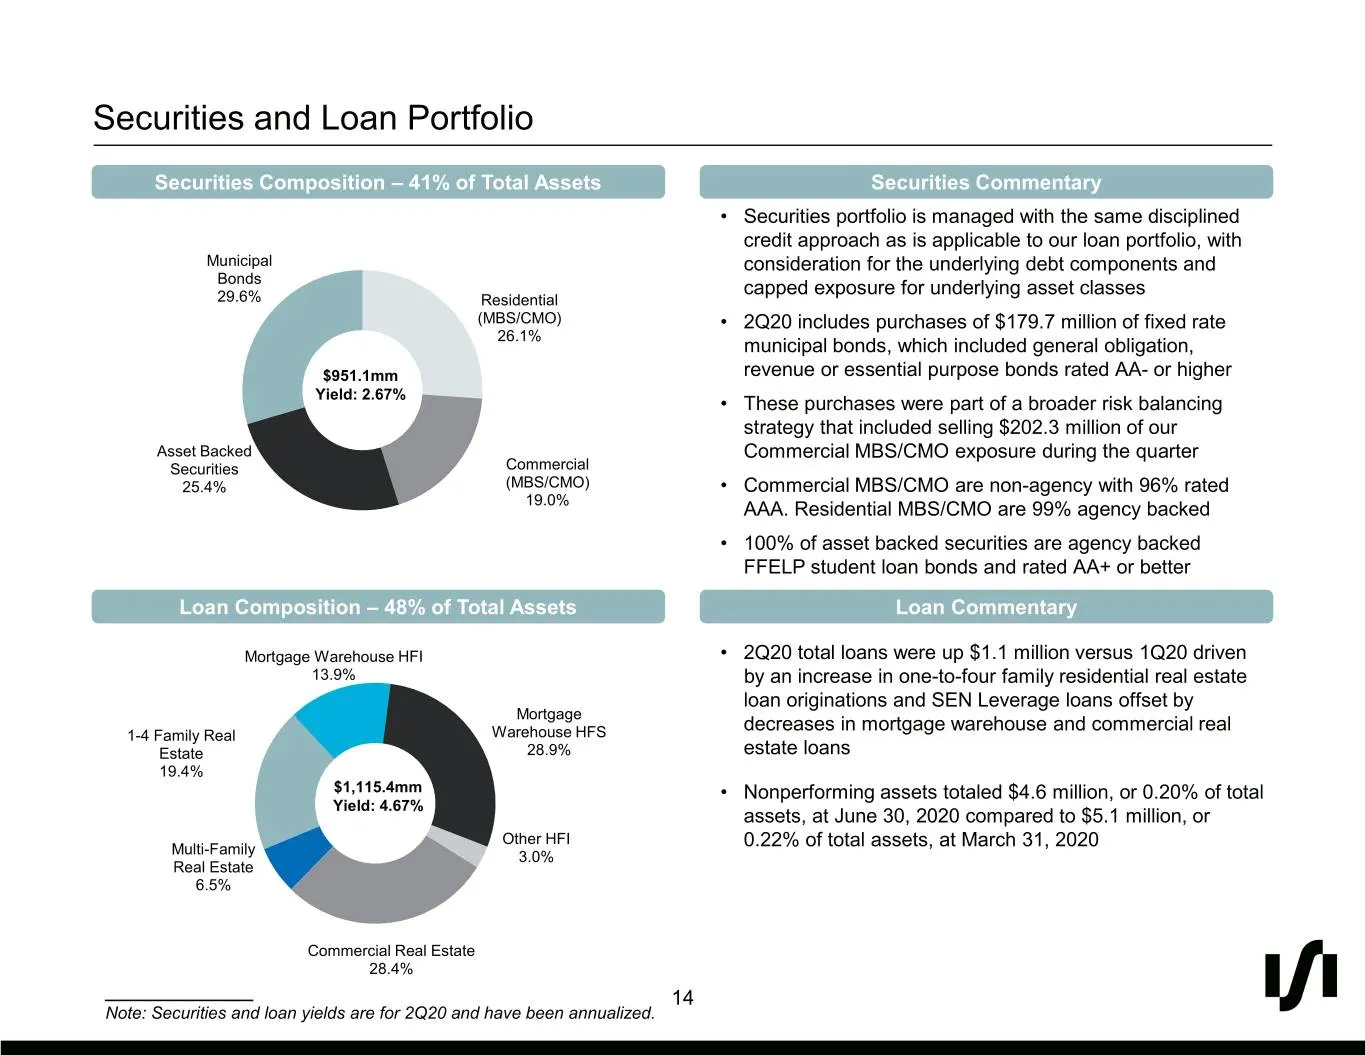
Securities and Loan Portfolio Securities Composition – 41% of Total Assets Securities Commentary • Securities portfolio is managed with the same disciplined credit approach as is applicable to our loan portfolio, with Municipal consideration for the underlying debt components and Bonds capped exposu
Slide 15: Credit Quality
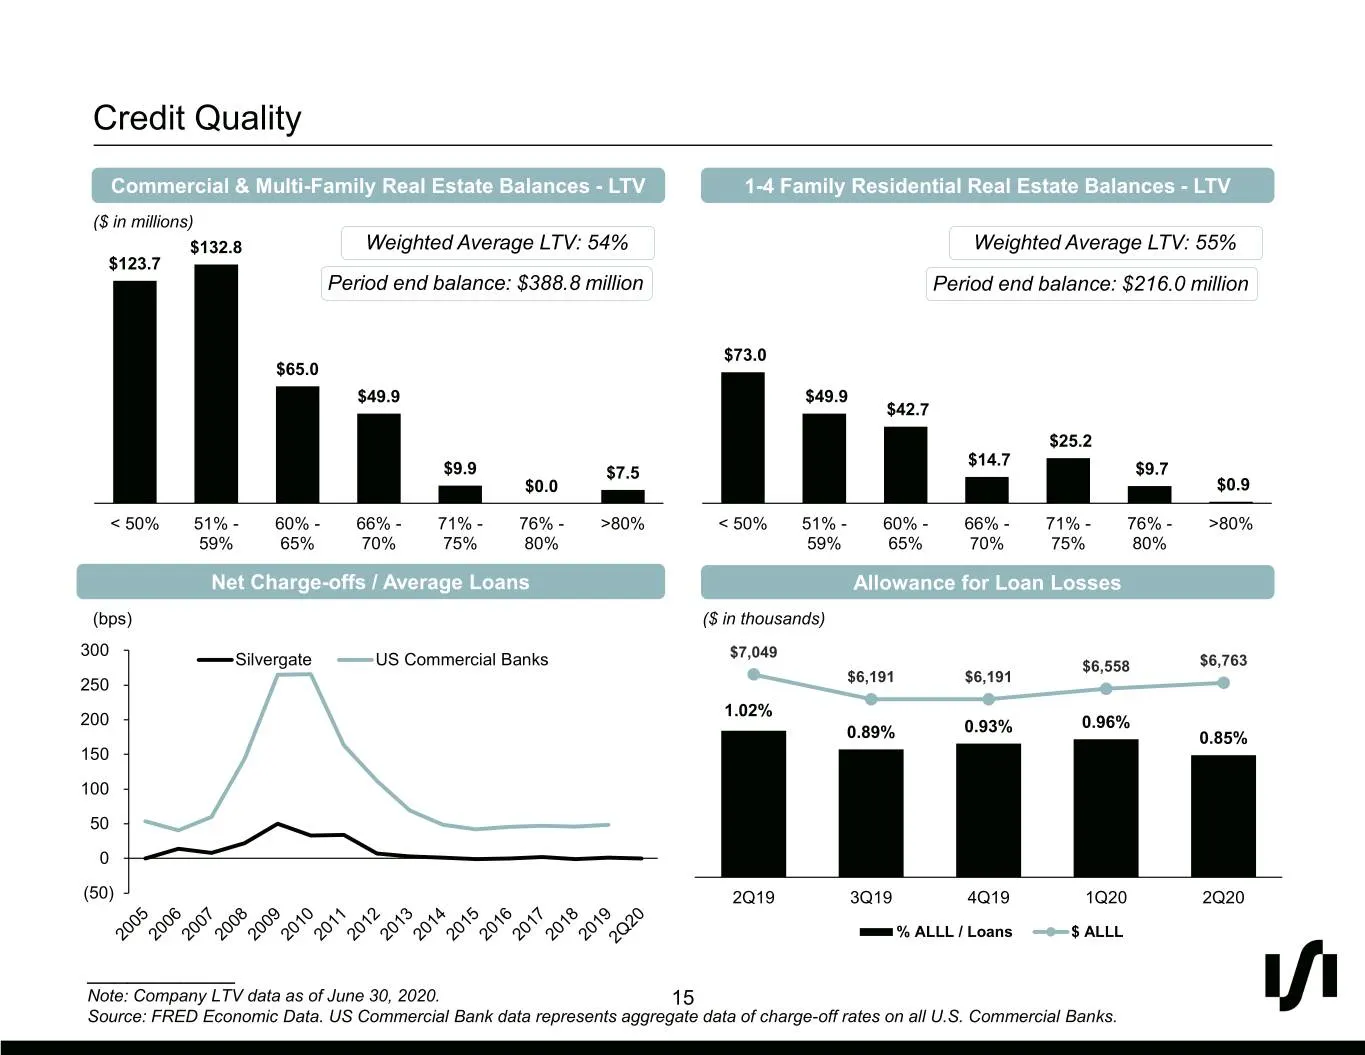
Credit Quality Commercial & Multi-Family Real Estate Balances - LTV 1-4 Family Residential Real Estate Balances - LTV ($ in millions) $132.8 Weighted Average LTV: 54% Weighted Average LTV: 55% $123.7 Period end balance: $388.8 million Period end balance: $216.0 million $73.0 $65.0 $49.9 $49.9 $42.7
Slide 16: 2Q20 Highlights
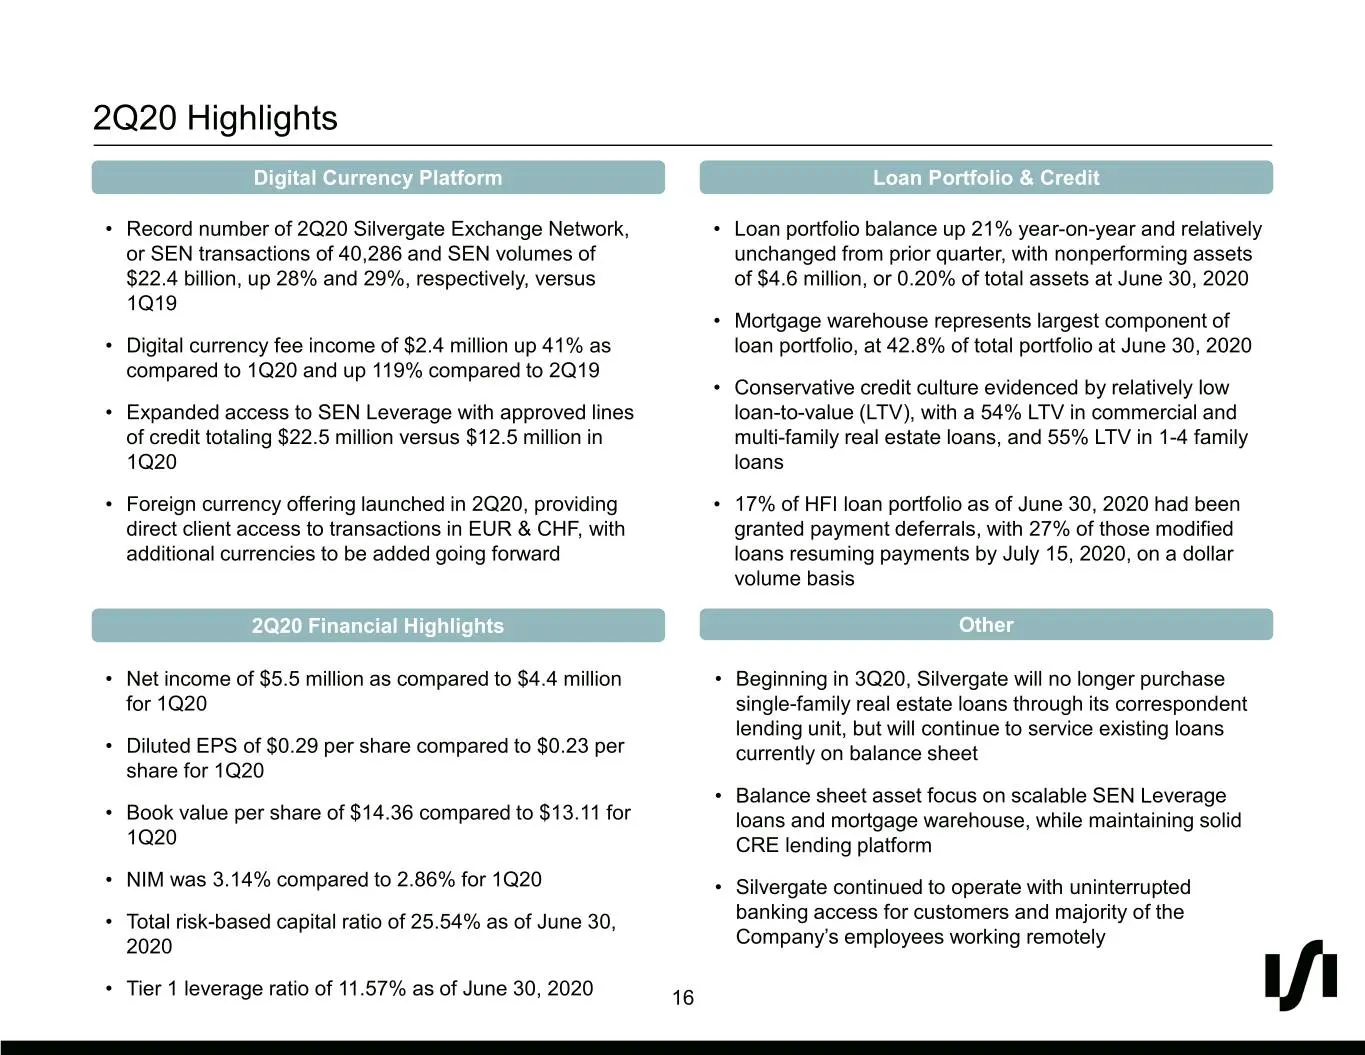
2Q20 Highlights Digital Currency Platform Loan Portfolio & Credit • Record number of 2Q20 Silvergate Exchange Network, • Loan portfolio balance up 21% year-on-year and relatively or SEN transactions of 40,286 and SEN volumes of unchanged from prior quarter, with nonperforming assets $22.4 billion, u
Slide 17: Multiple Avenues for Growth – Leverage Network Effects of SEN
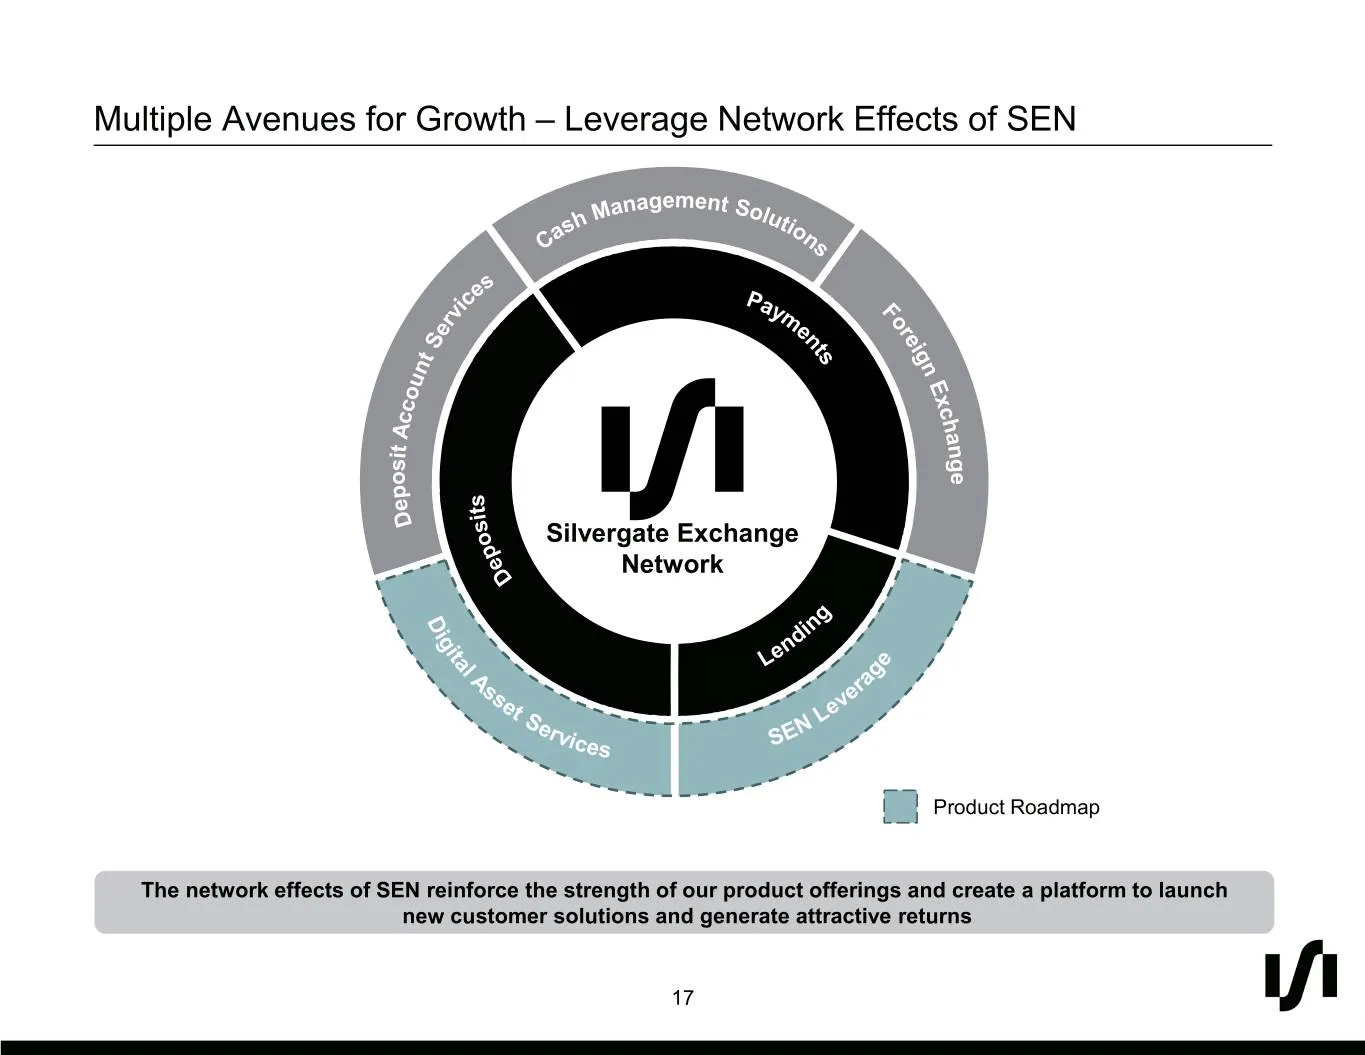
Multiple Avenues for Growth – Leverage Network Effects of SEN Silvergate Exchange Network Product Roadmap The network effects of SEN reinforce the strength of our product offerings and create a platform to launch new customer solutions and generate attractive returns 17

Slide 18: Appendix
Appendix
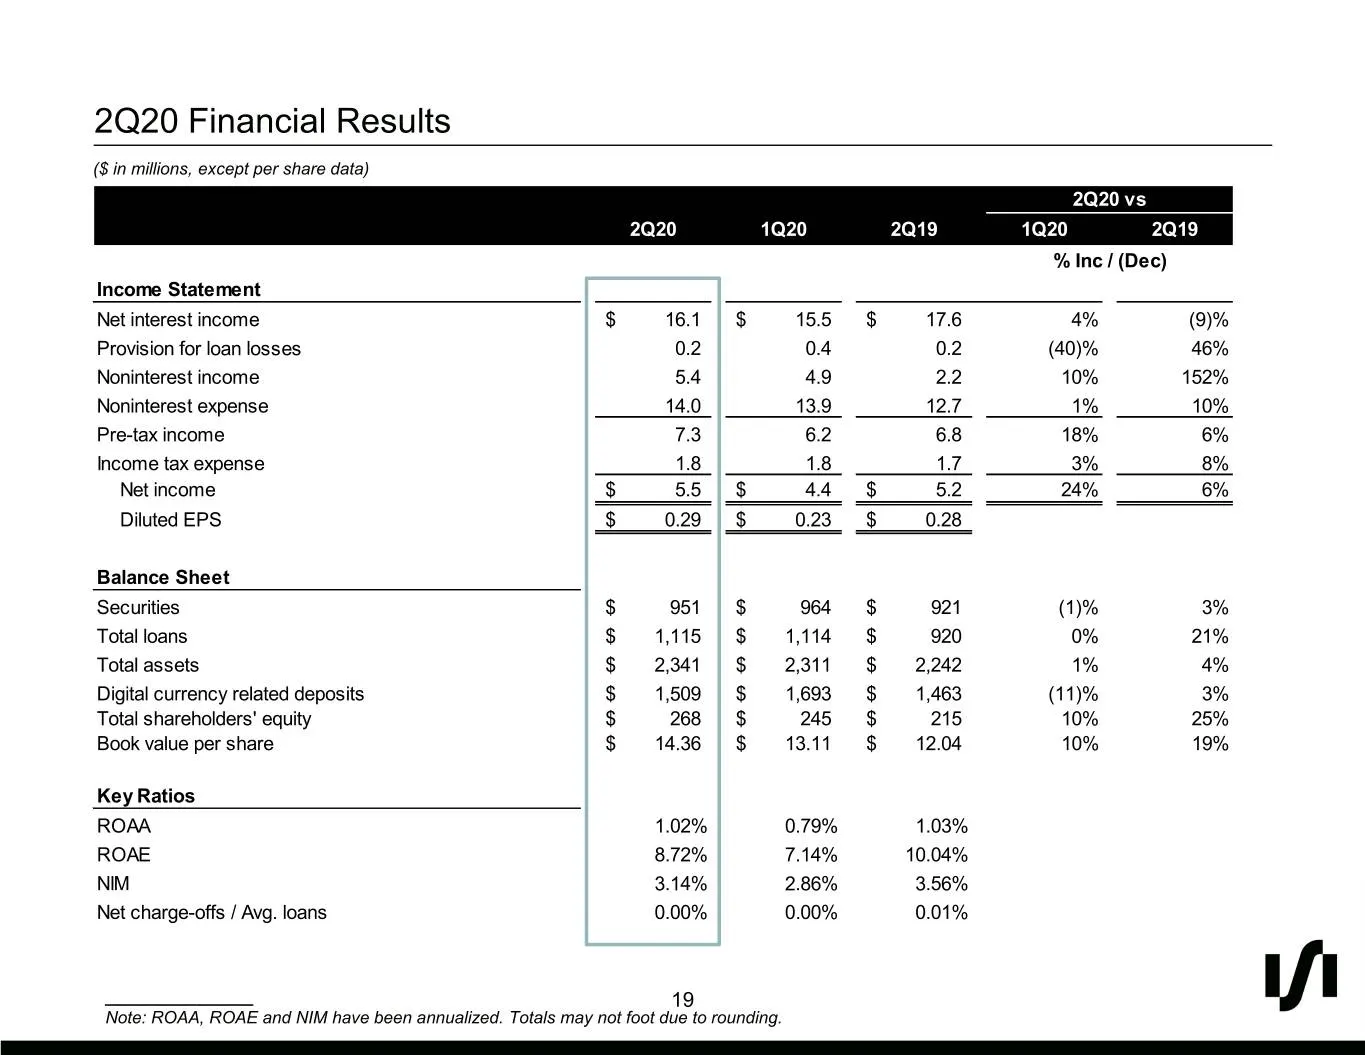
Slide 19: 2Q20 Financial Results
2Q20 Financial Results ($ in millions, except per share data) 2Q20 vs 2Q20 1Q20 2Q19 1Q20 2Q19 % Inc / (Dec) Income Statement Net interest income $ 16.1 $ 15.5 $ 17.6 4% (9)% Provision for loan losses 0.2 0.4 0.2 (40)% 46% Noninterest income 5.4 4.9 2.2 10% 152% Noninterest expense 14.0 13.9 12.7 1%
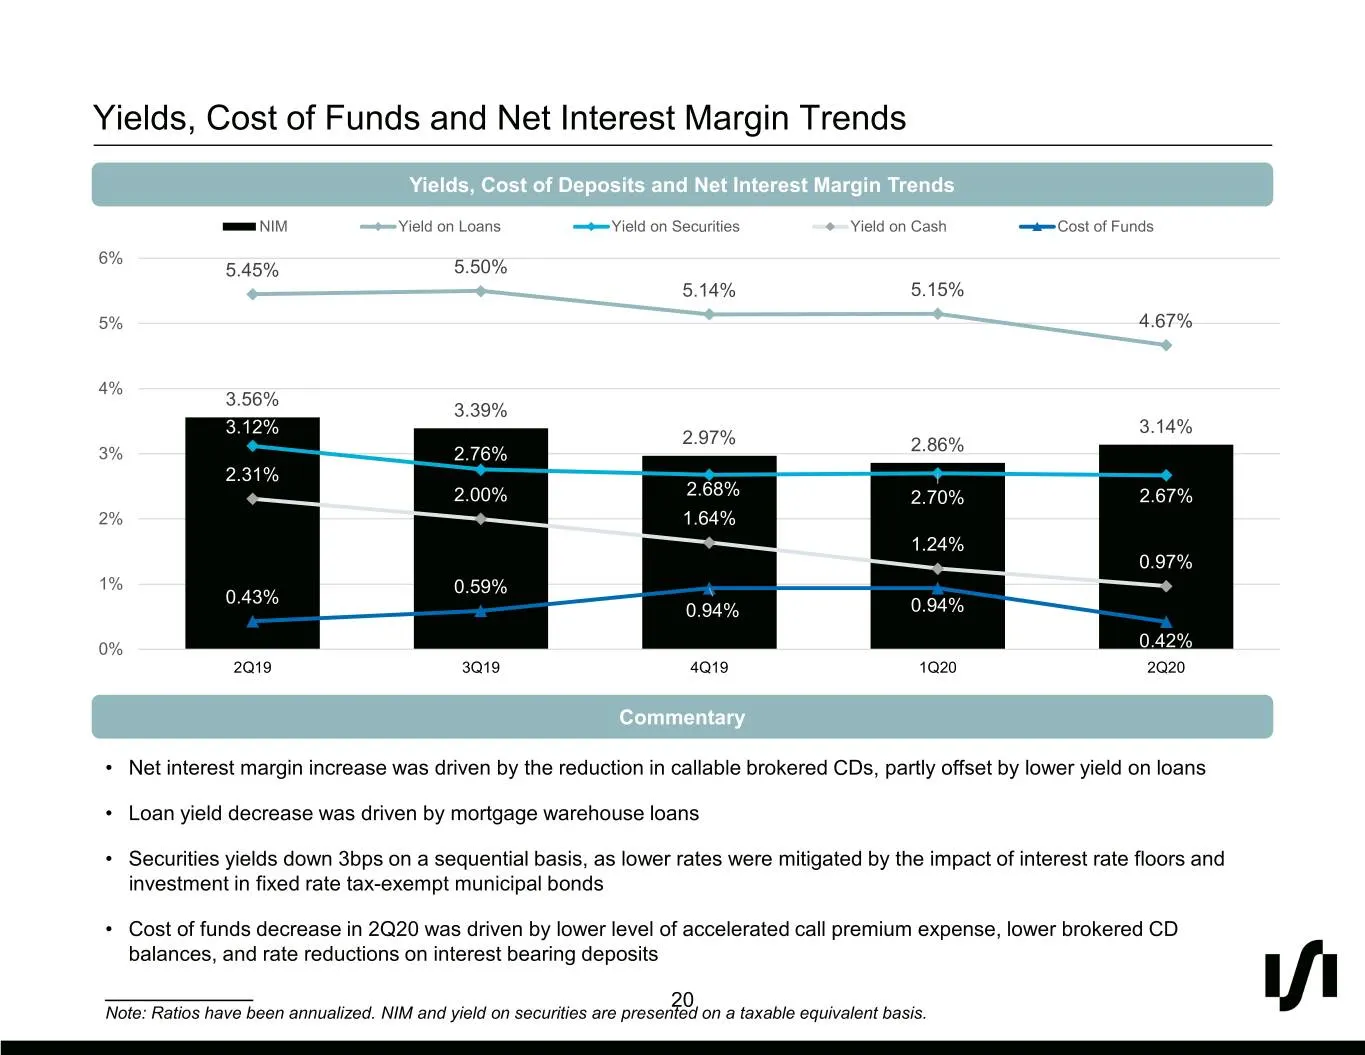
Slide 20: Yields, Cost of Funds and Net Interest Margin Trends
Yields, Cost of Funds and Net Interest Margin Trends Yields, Cost of Deposits and Net Interest Margin Trends NIM Yield on Loans Yield on Securities Yield on Cash Cost of Funds 6% 5.45% 5.50% 5.14% 5.15% 5% 4.67% 4% 3.56% 3.39% 3.12% 3.14% 2.97% 3% 2.76% 2.86% 2.31% 2.00% 2.68% 2.70% 2.67% 2% 1.64% 1
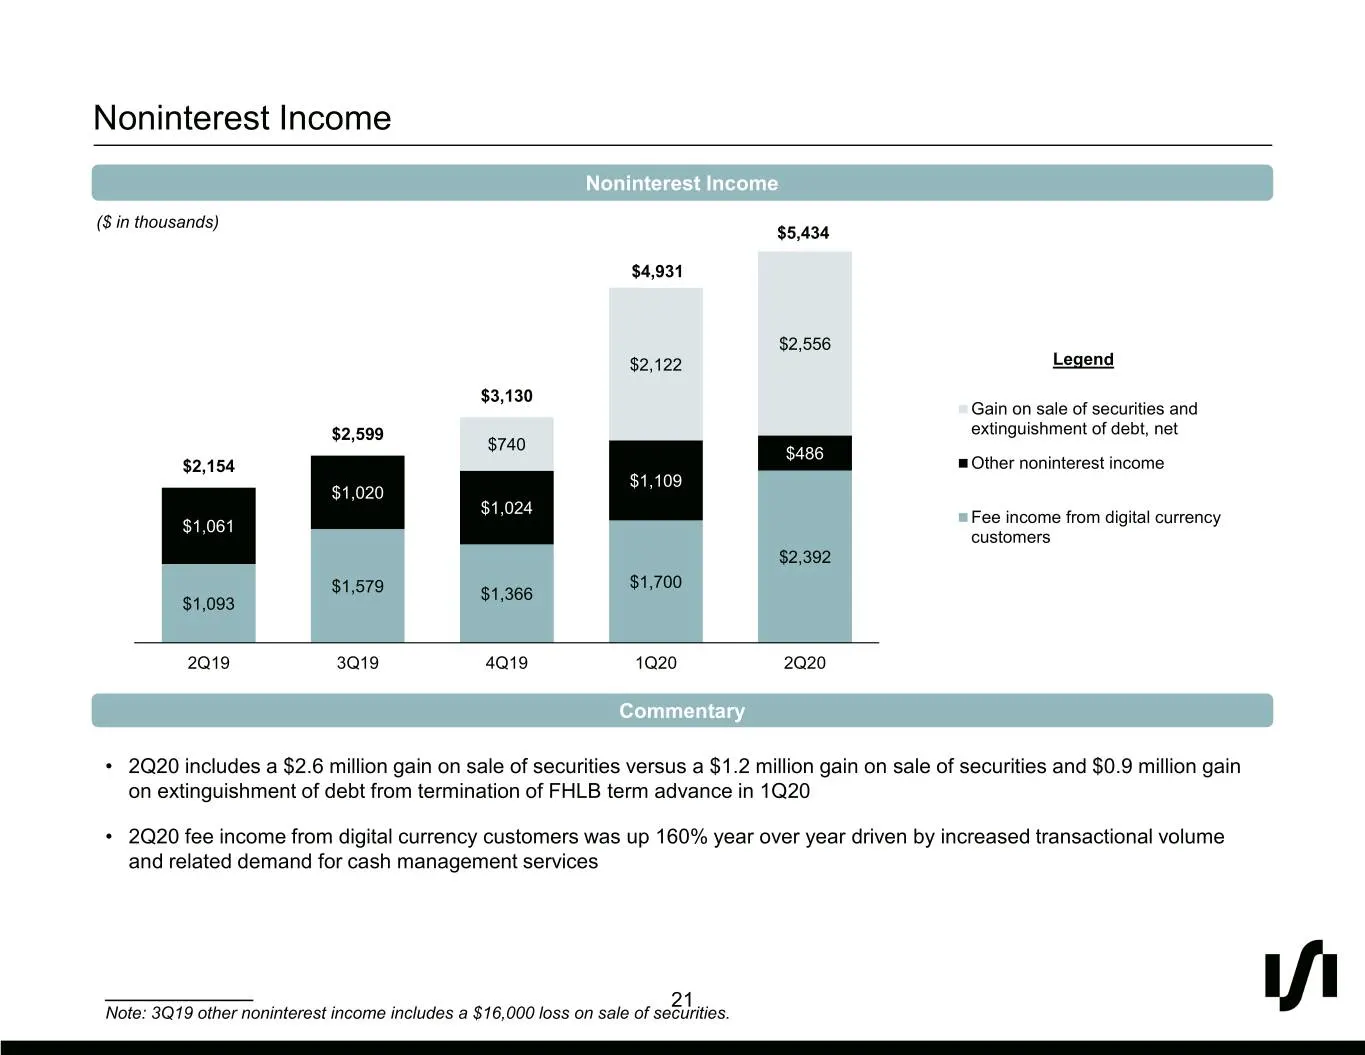
Slide 21: Noninterest Income
Noninterest Income Noninterest Income 6000 ($ in thousands) $5,434 $4,931 5000 $2,556 4000 $2,122 Legend $3,130 Gain on sale of securities and 3000 $2,599 extinguishment of debt, net $740 $486 $2,154 Other noninterest income $1,109 2000 $1,020 $1,024 Fee income from digital currency $1,061 customers
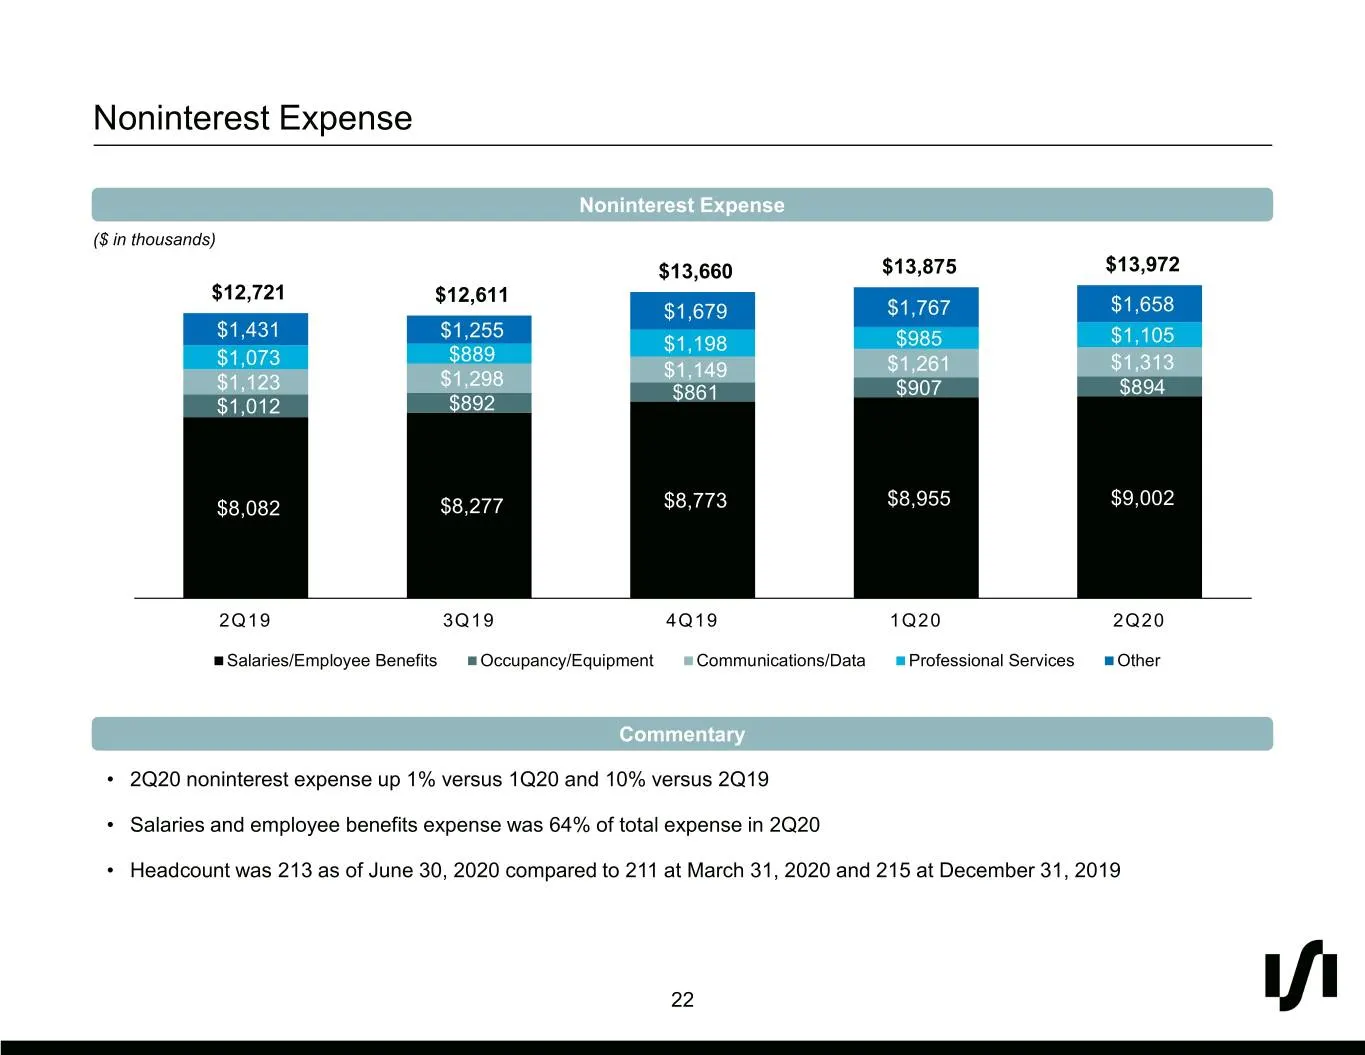
Slide 22: Noninterest Expense
Noninterest Expense Noninterest Expense ($ in thousands) $13,660 $13,875 $13,972 $12,721 $12,611 $1,679 $1,767 $1,658 $1,431 $1,255 $1,198 $985 $1,105 $1,073 $889 $1,261 $1,313 $1,298 $1,149 $1,123 $861 $907 $894 $1,012 $892 $8,082 $8,277 $8,773 $8,955 $9,002 2Q19 3Q19 4Q19 1Q20 2Q20 Salaries/Employ
Slide 23: Loan Portfolio (HFI) & COVID-19 Related Modifications
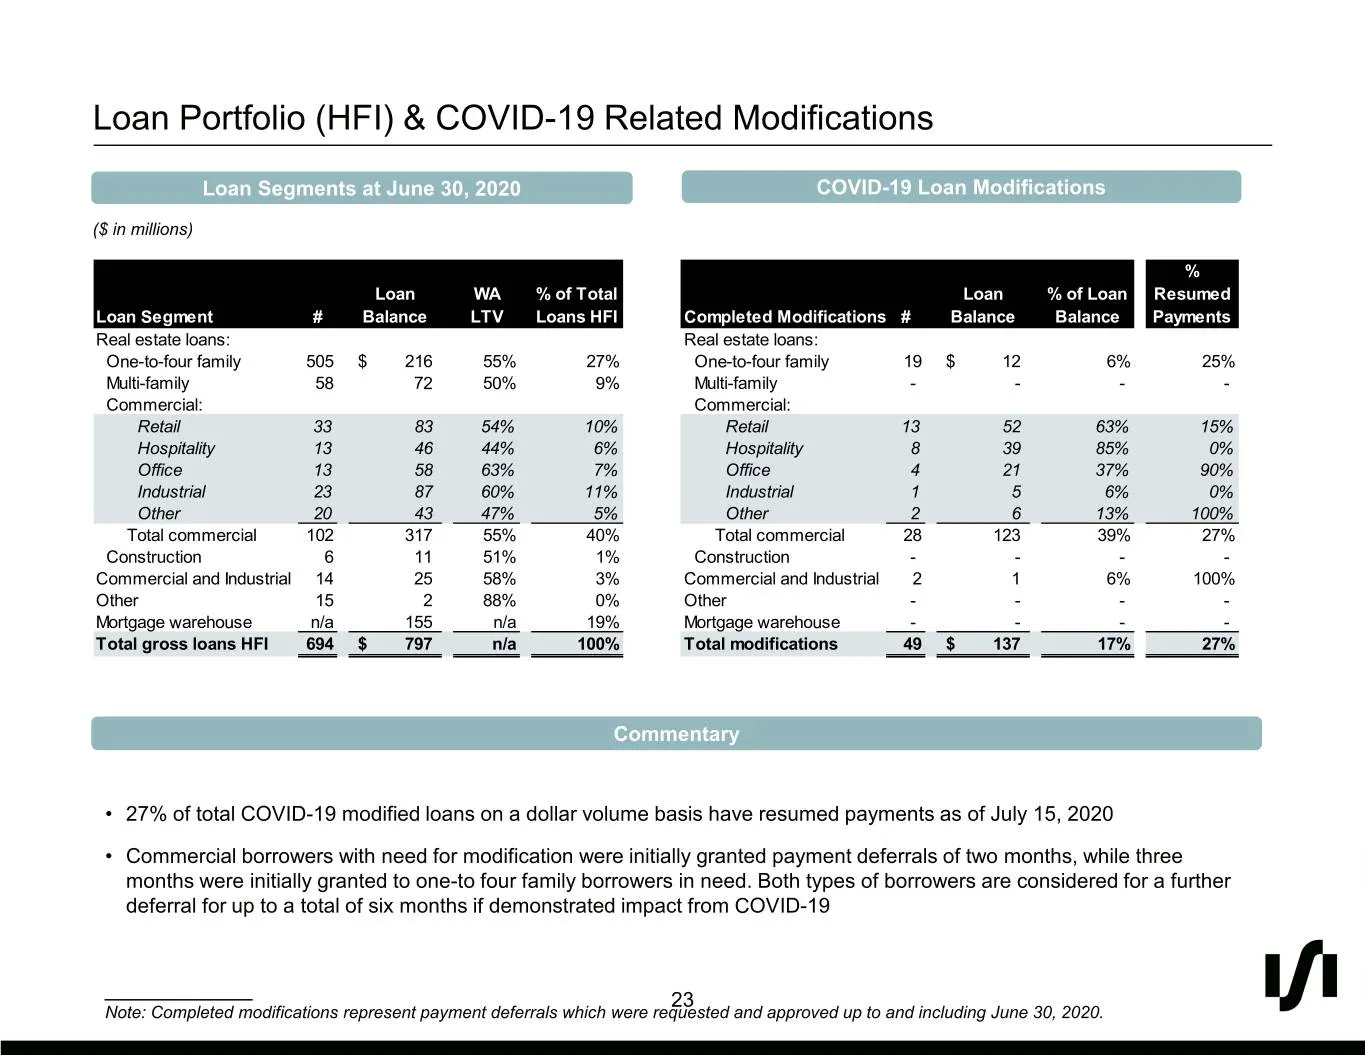
Loan Portfolio (HFI) & COVID-19 Related Modifications Loan Segments at June 30, 2020 COVID-19 Loan Modifications ($ in millions) % Loan WA % of Total Loan % of Loan Resumed Loan Segment # Balance LTV Loans HFI Completed Modifications # Balance Balance Payme nts Real estate loans: Real estate loans:
Slide 24: Capital and Liquidity Ratios
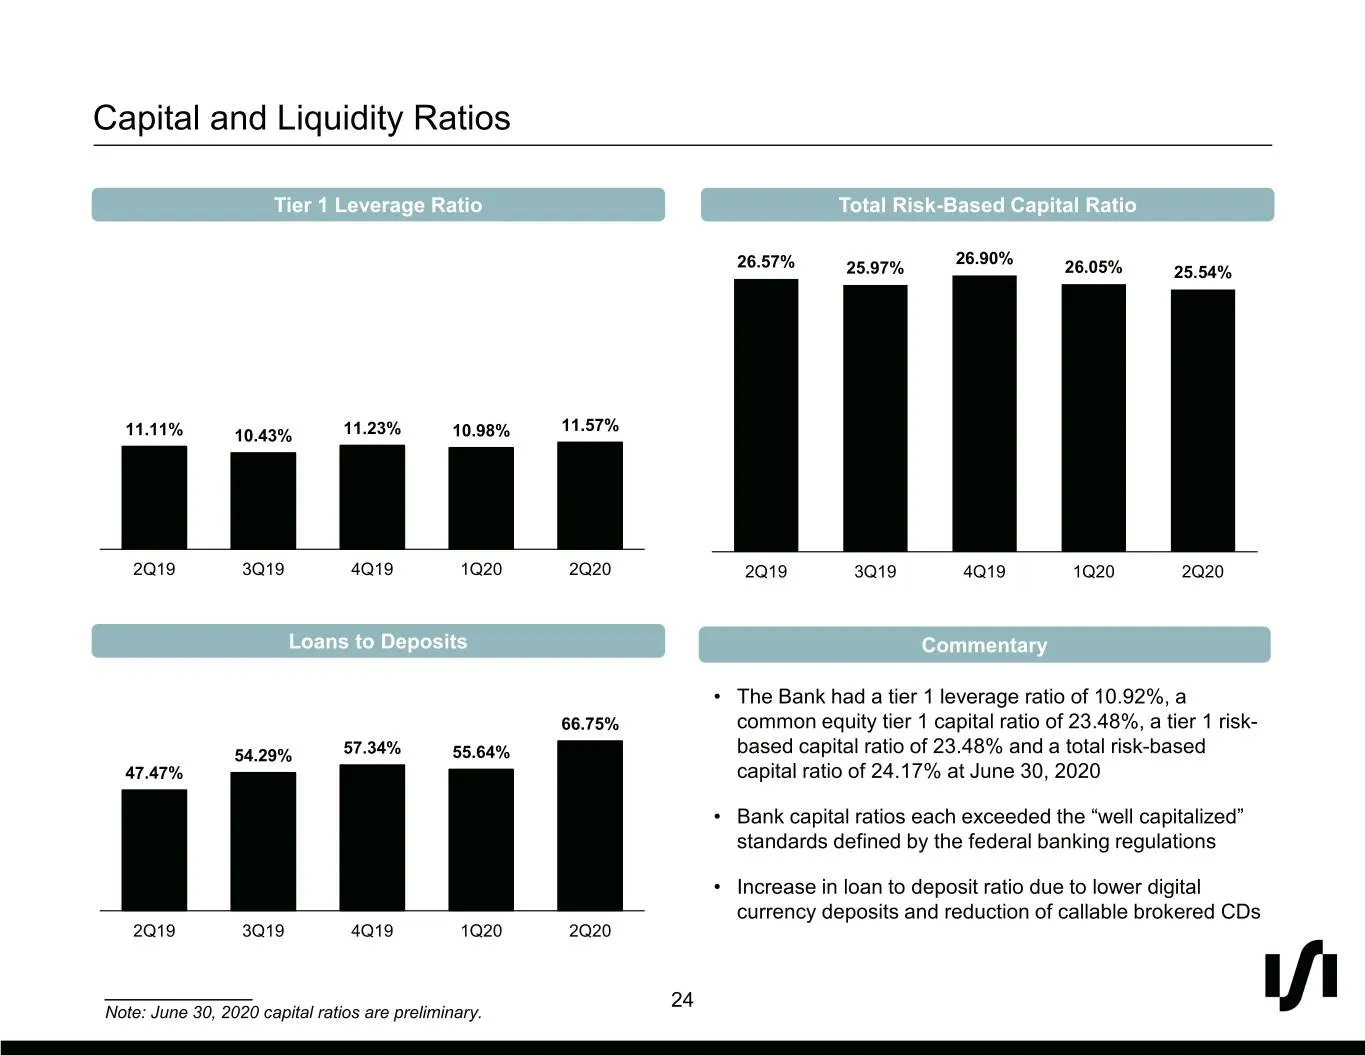
Capital and Liquidity Ratios Tier 1 Leverage Ratio Total Risk-Based Capital Ratio 26.57% 26.90% 25.97% 26.05% 25.54% 11.57% 11.11% 10.43% 11.23% 10.98% 2Q19 3Q19 4Q19 1Q20 2Q20 2Q19 3Q19 4Q19 1Q20 2Q20 Loans to Deposits Commentary • The Bank had a tier 1 leverage ratio of 10.92%, a 66.75% common equ
Slide 25: Summary Financials
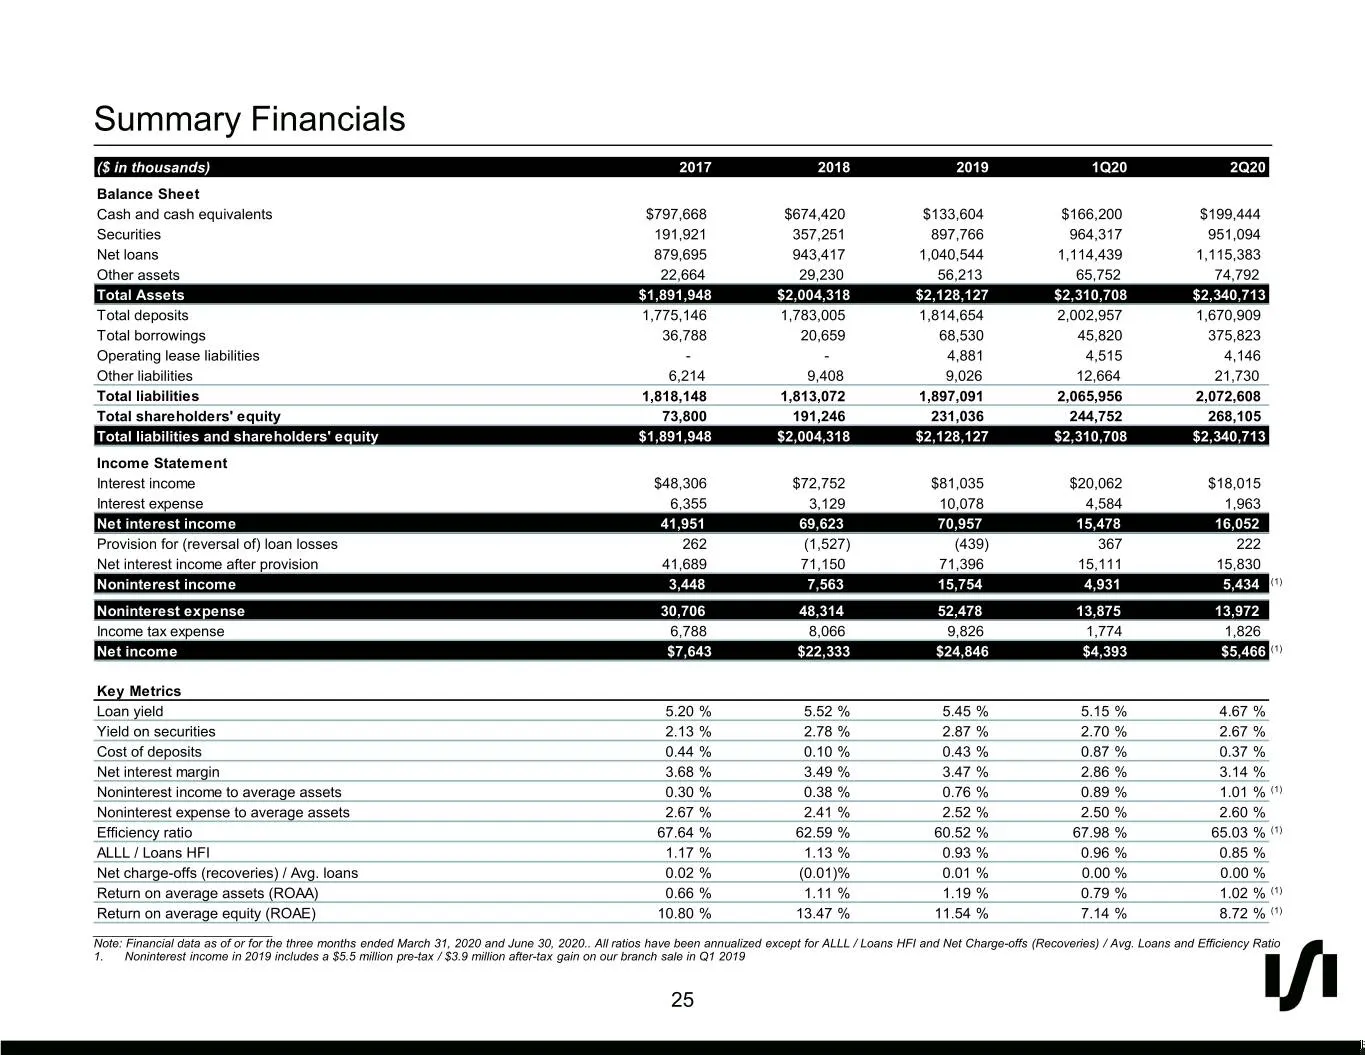
Summary Financials ($ in thousands) 2017 2018 2019 1Q20 2Q20 Balance Sheet Cash and cash equivalents $797,668 $674,420 $133,604 $166,200 $199,444 Securities 191,921 357,251 897,766 964,317 951,094 Net loans 879,695 943,417 1,040,544 1,114,439 1,115,383 Other assets 22,664 29,230 56,213 65,752 74,792
Slide 26: Reconciliation of Non-GAAP Financial Measures
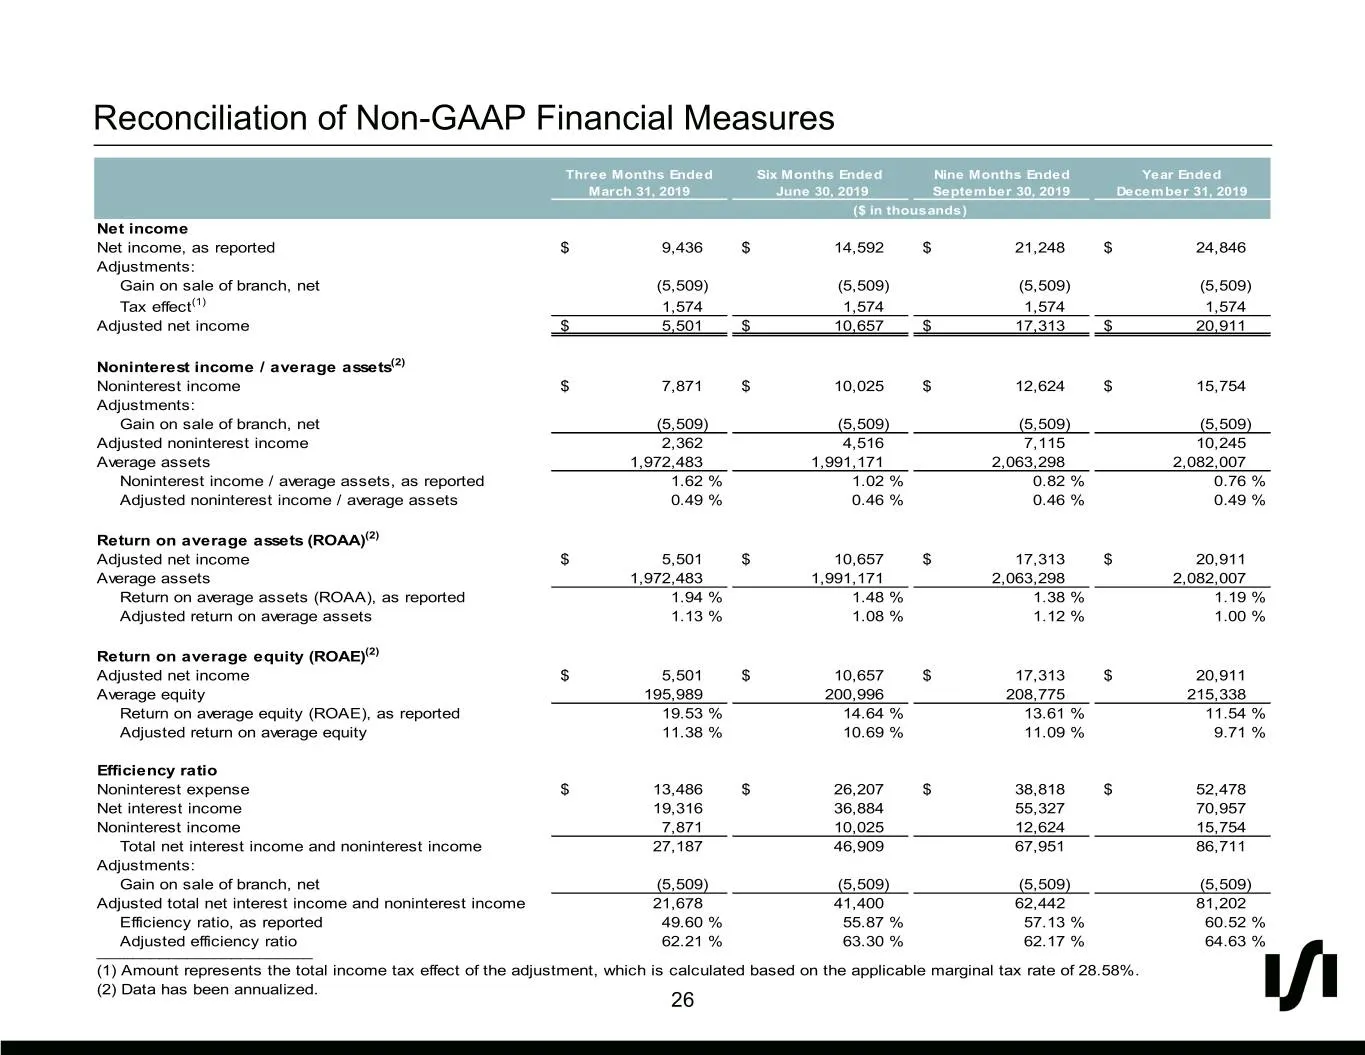
Reconciliation of Non-GAAP Financial Measures Three Months Ended Six Months Ended Nine Months Ended Year Ended March 31, 2019 June 30, 2019 September 30, 2019 December 31, 2019 ($ in thousands) Net income Net income, as reported $ 9,436 $ 14,592 $ 21,248 $ 24,846 Adjustments: Gain on sale of branch,
Source: SEC EDGAR · 8-K filed Aug 10, 2020
More decks from Silvergate Capital Corp.
 Q4 2022 Earnings Presentation11 slides · Jan 17, 2023
 Investor Presentation (November 2022)13 slides · Nov 1, 2022
 Q3 2022 Earnings Presentation10 slides · Oct 18, 2022
 Investor Presentation (August 2022)14 slides · Aug 8, 2022
 Q2 2022 Earnings Presentation10 slides · Jul 19, 2022
 Investor Presentation (May 2022)15 slides · May 10, 2022