Pepco — Non-Deal Roadshow (June 2011)
30 slides from Pepco's roadshow presentation, Jun 24, 2011
Slide 1: June 2011 Investor Meetings
MINNEAPOLIS • CHICAGO • JUNE 27 - 28, 2011 June 2011 Investor Meetings
Slide 2: Safe Harbor Statement
Safe Harbor Statement Some of the statements contained in today’s presentation are forward-looking statements within the meaning of Section 21E of the Securities Exchange Act of 1934, as amended, and are subject to the safe harbor created by the Private Securities Litigation Reform Act of 1995. Thes
Slide 3: PHI's Strategic Focus
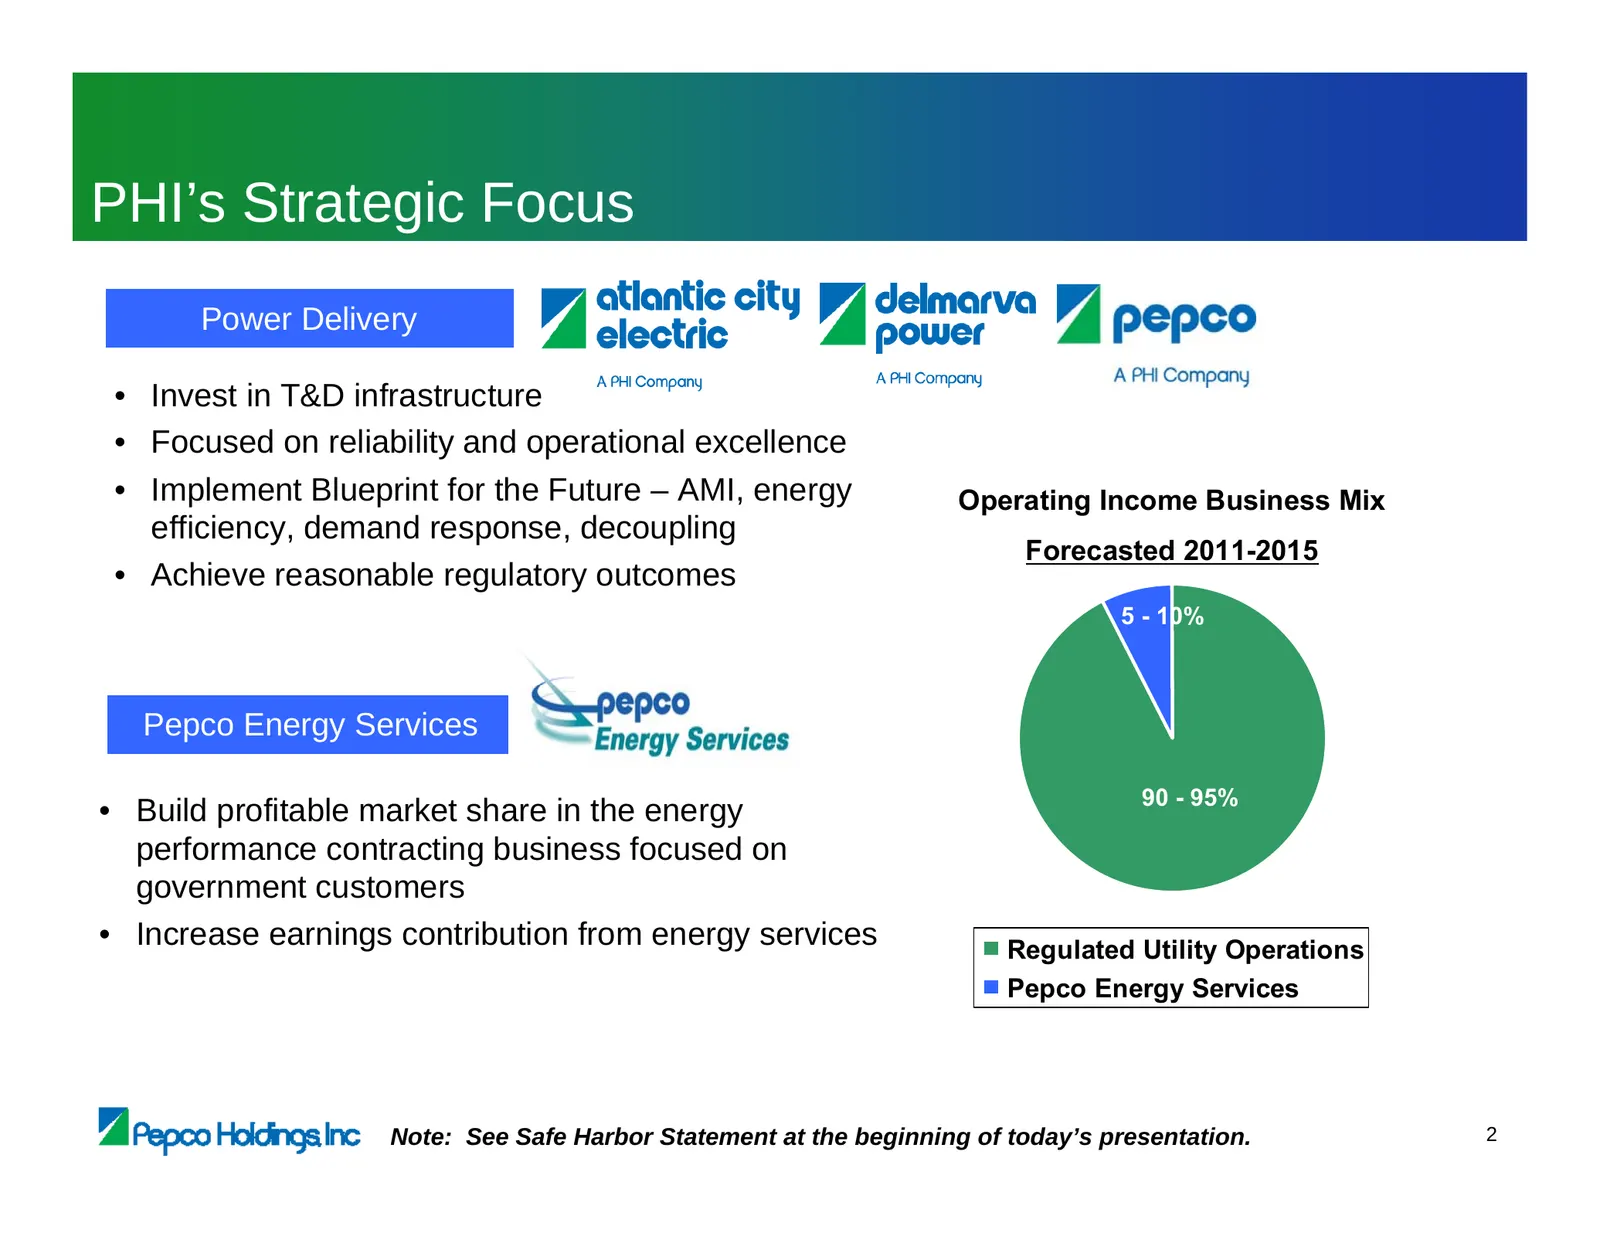
PHI’s Strategic Focus Power Delivery • Invest in T&D infrastructure • Focused on reliability and operational excellence • Implement Blueprint for the Future – AMI, energy Operating Income Business Mix efficiency, demand response, decoupling Forecasted 2011-2015 • Achieve reasonable regulatory outcom
Slide 4: Reliability Enhancement Plan
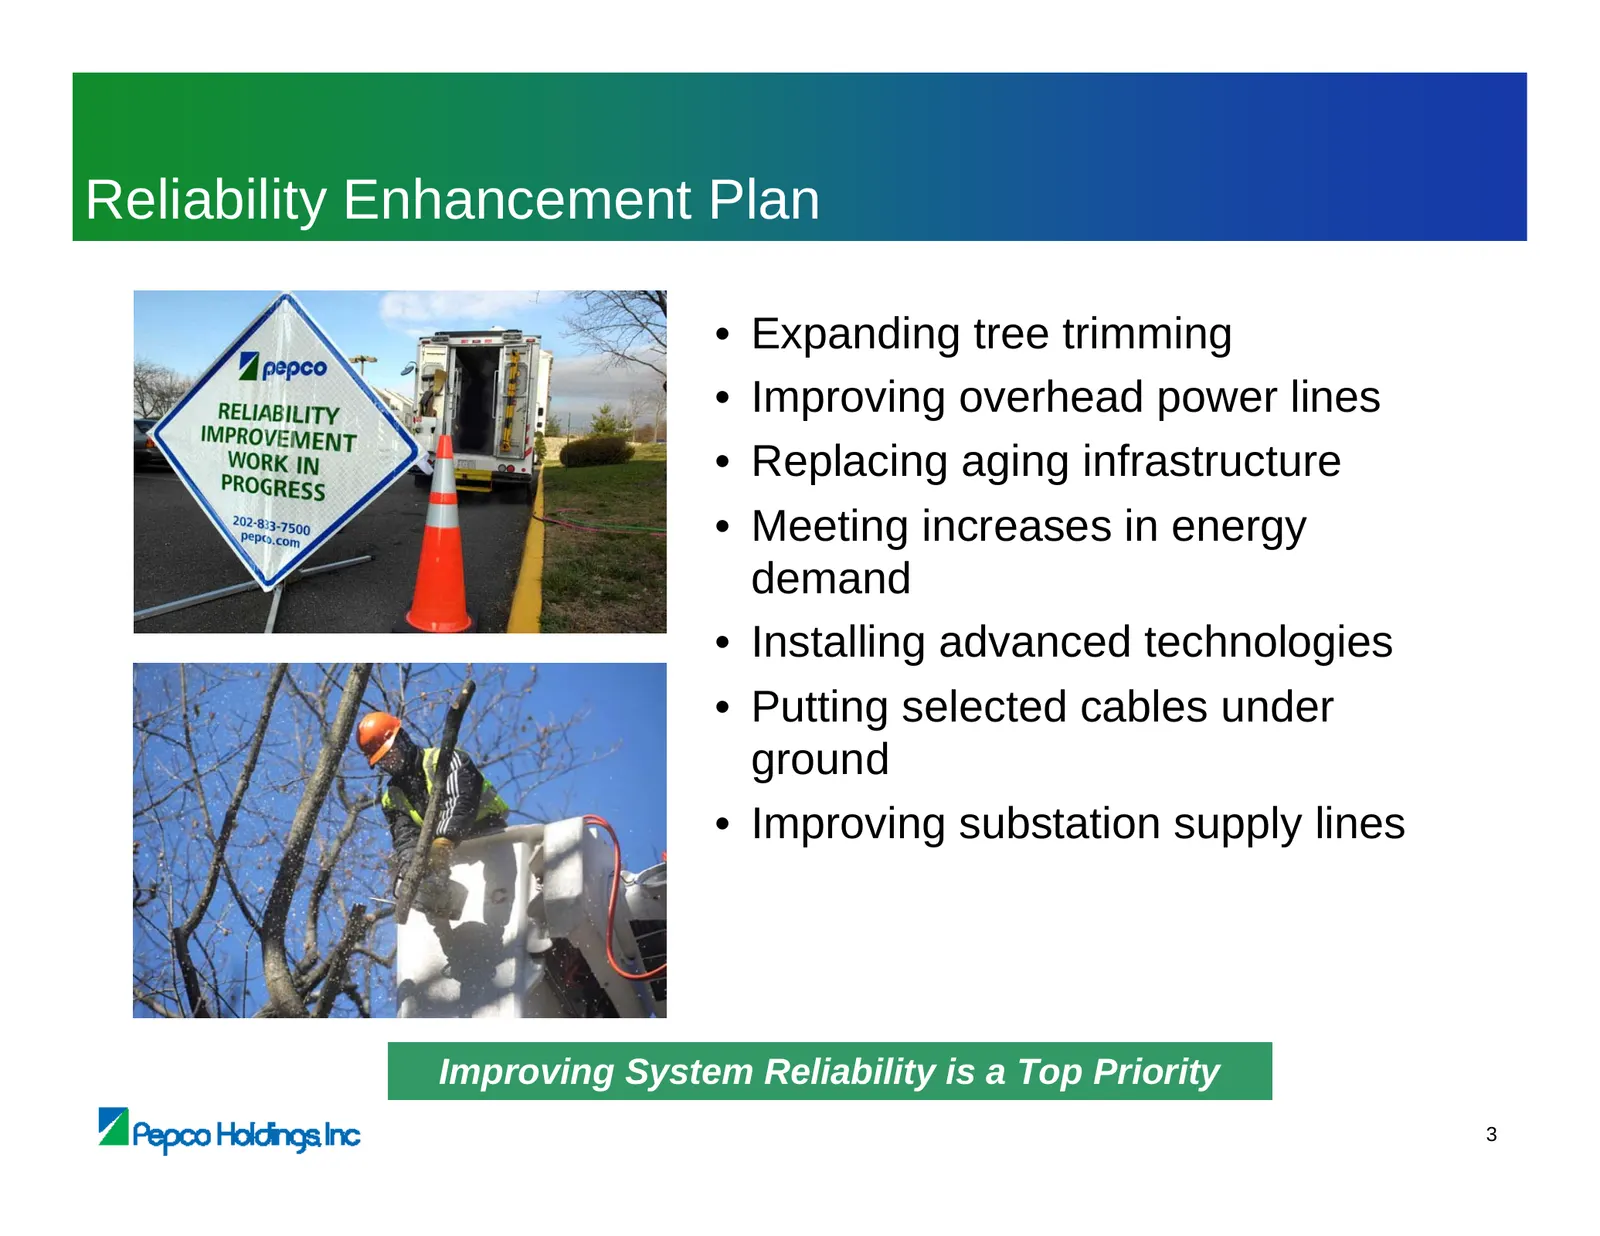
Reliability Enhancement Plan • Expanding tree trimming • Improving overhead power lines • Replacing aging infrastructure • Meeting increases in energy demand • Installing advanced technologies • Putting selected cables under ground • Improving substation supply lines Improving System Reliability is
Slide 5: Power Delivery – Forecast Construction Expenditures 2011-2015
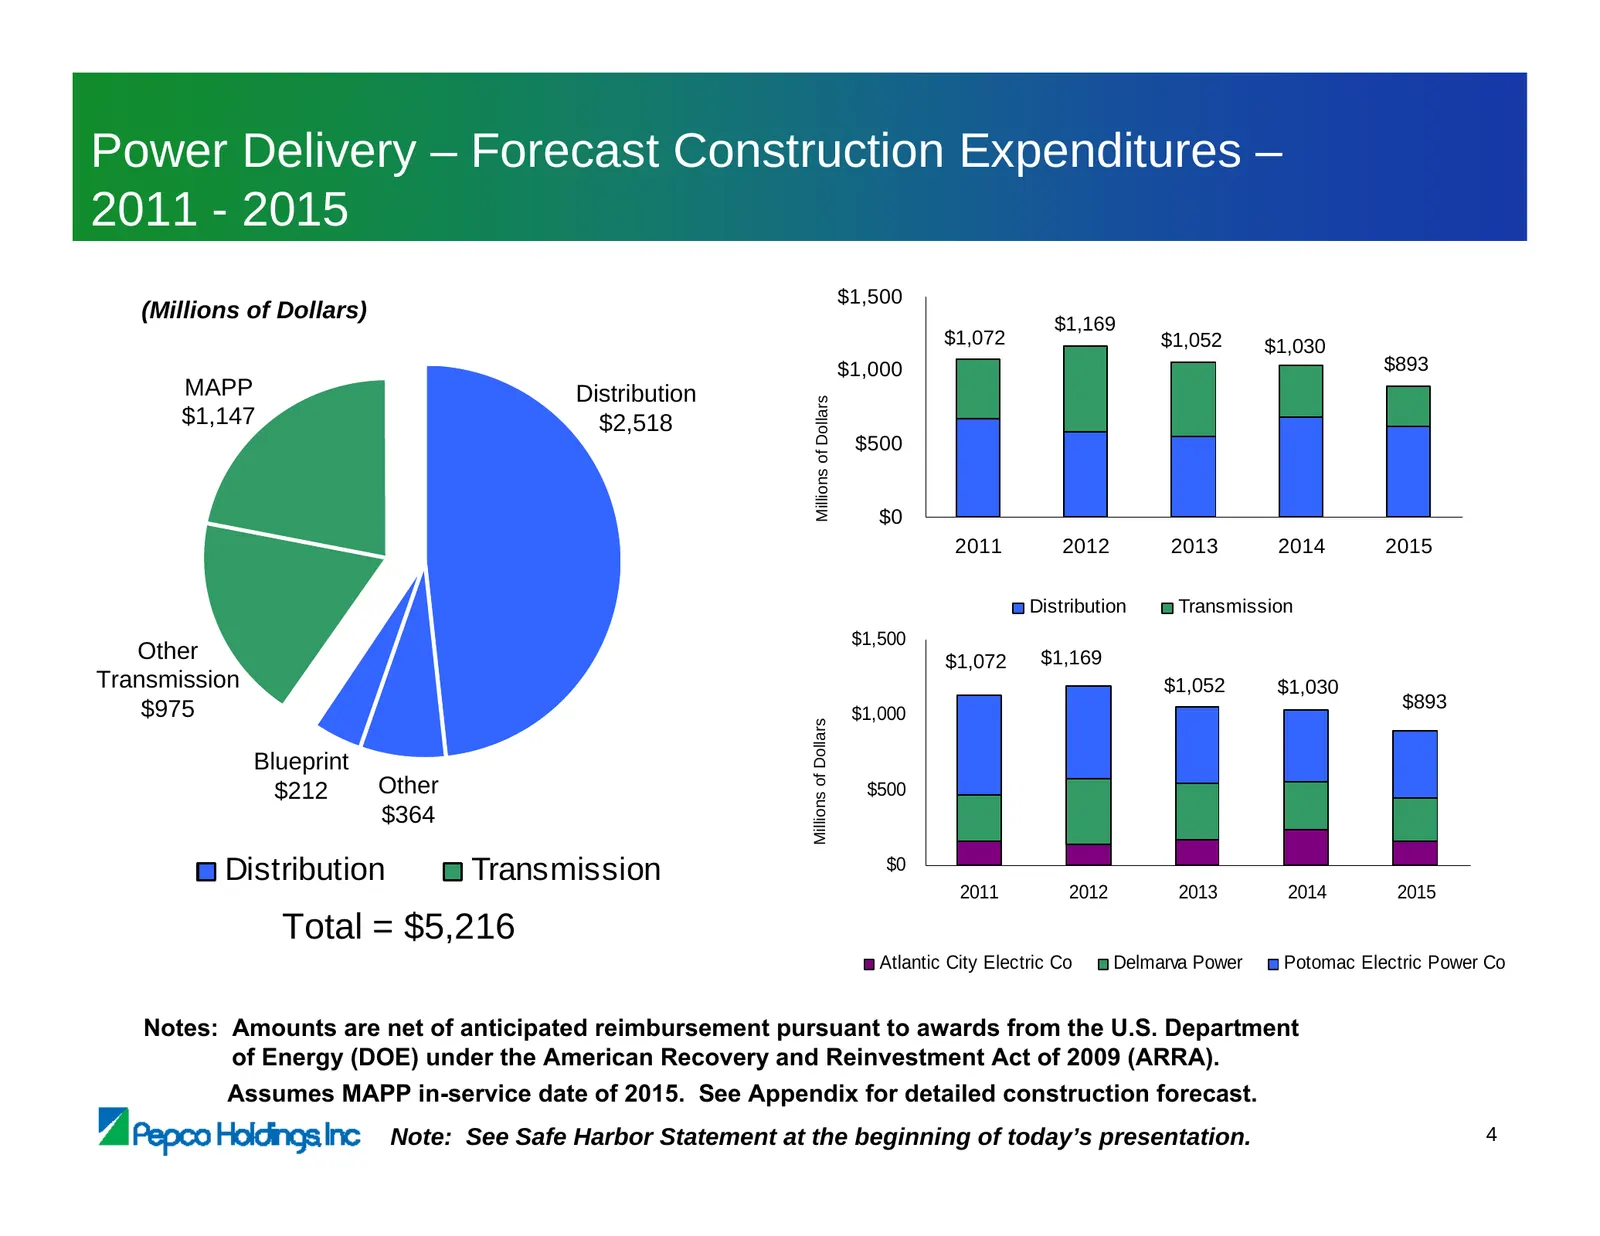
Power Delivery – Forecast Construction Expenditures – 2011 - 2015 $1,500 (Millions of Dollars) $1,169 $1,072 $1,052 $1,030 $1,000 $893 MAPP Distribution Millions of Dollars $1,147 $2,518 $500 $0 2011 2012 2013 2014 2015 Distribution Transmission $1,500 Other $1,072 $1,169 Transmission $1,052 $1,030
Slide 6: Mid-Atlantic Power Pathway – Project Update
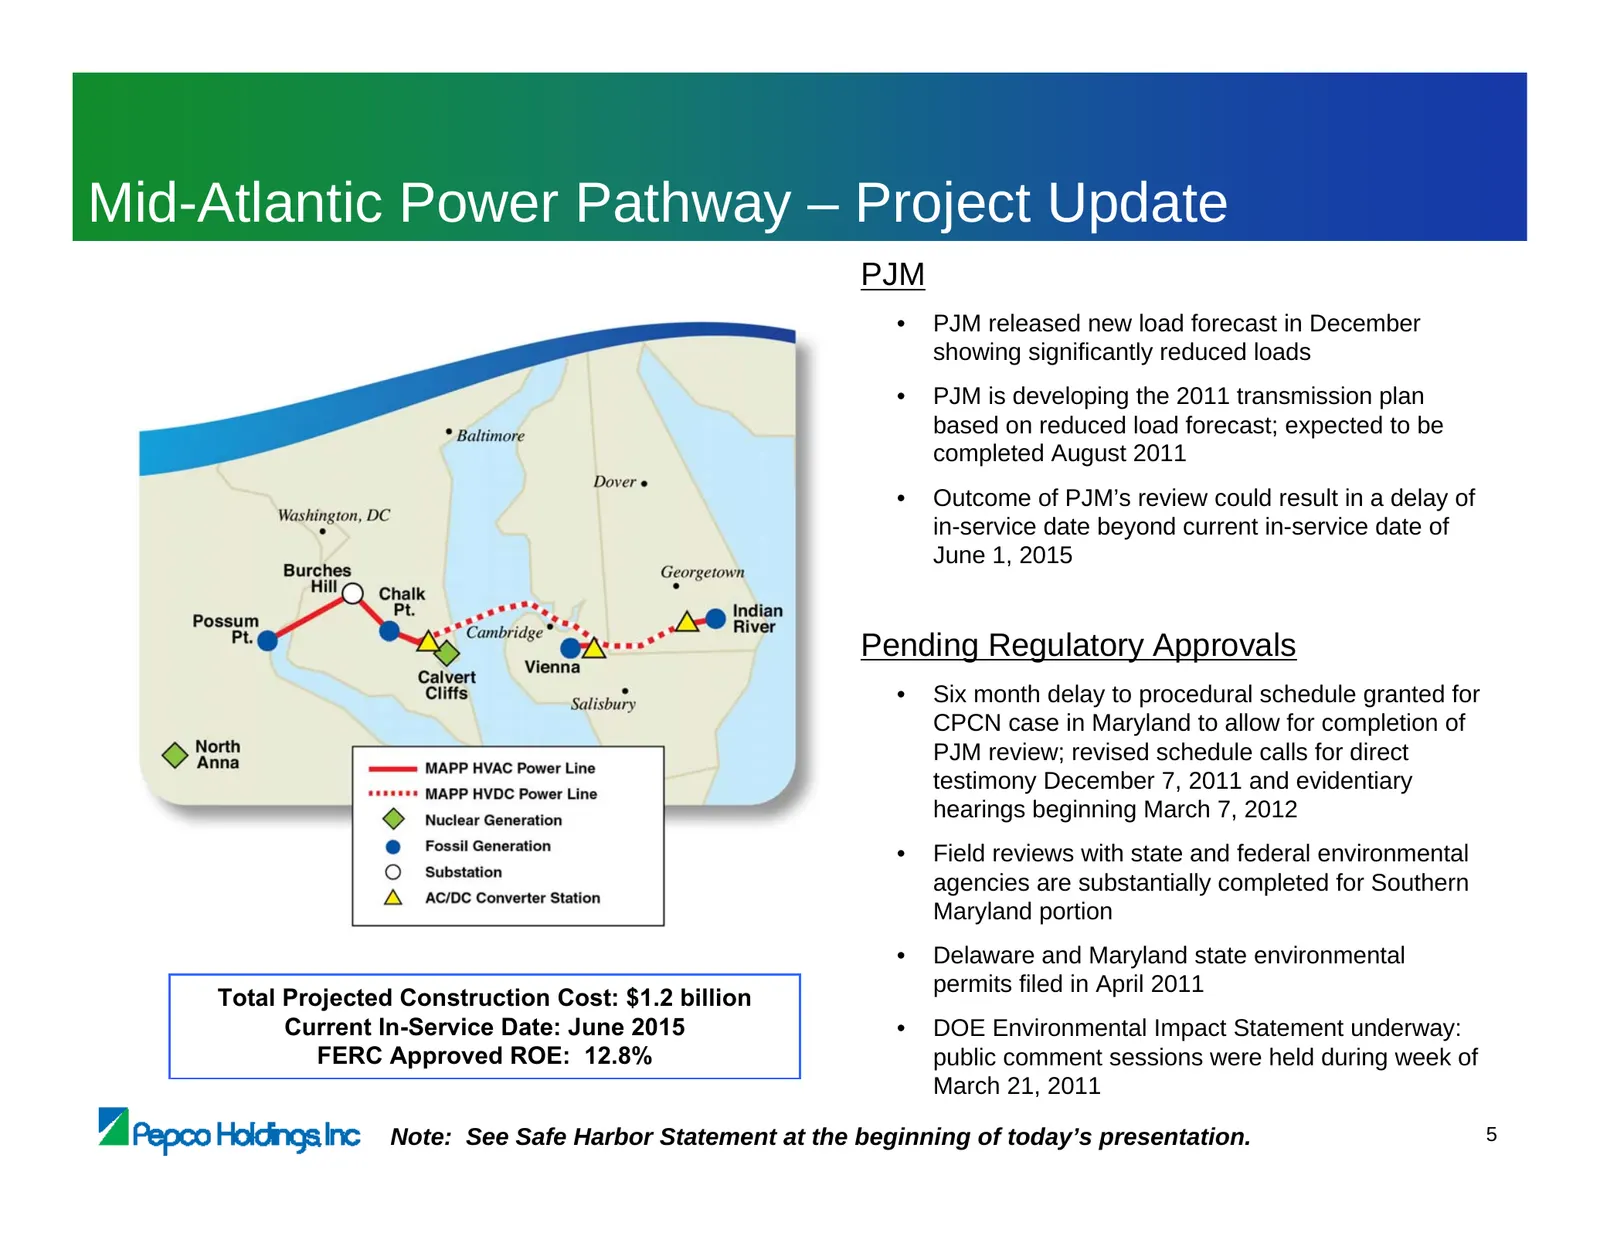
Mid-Atlantic Power Pathway – Project Update PJM • PJM released new load forecast in December showing significantly reduced loads • PJM is developing the 2011 transmission plan based on reduced load forecast; expected to be completed August 2011 • Outcome of PJM’s review could result in a delay of in
Slide 7: Forecast Construction Expenditures – MAPP In-Service Date Scenarios
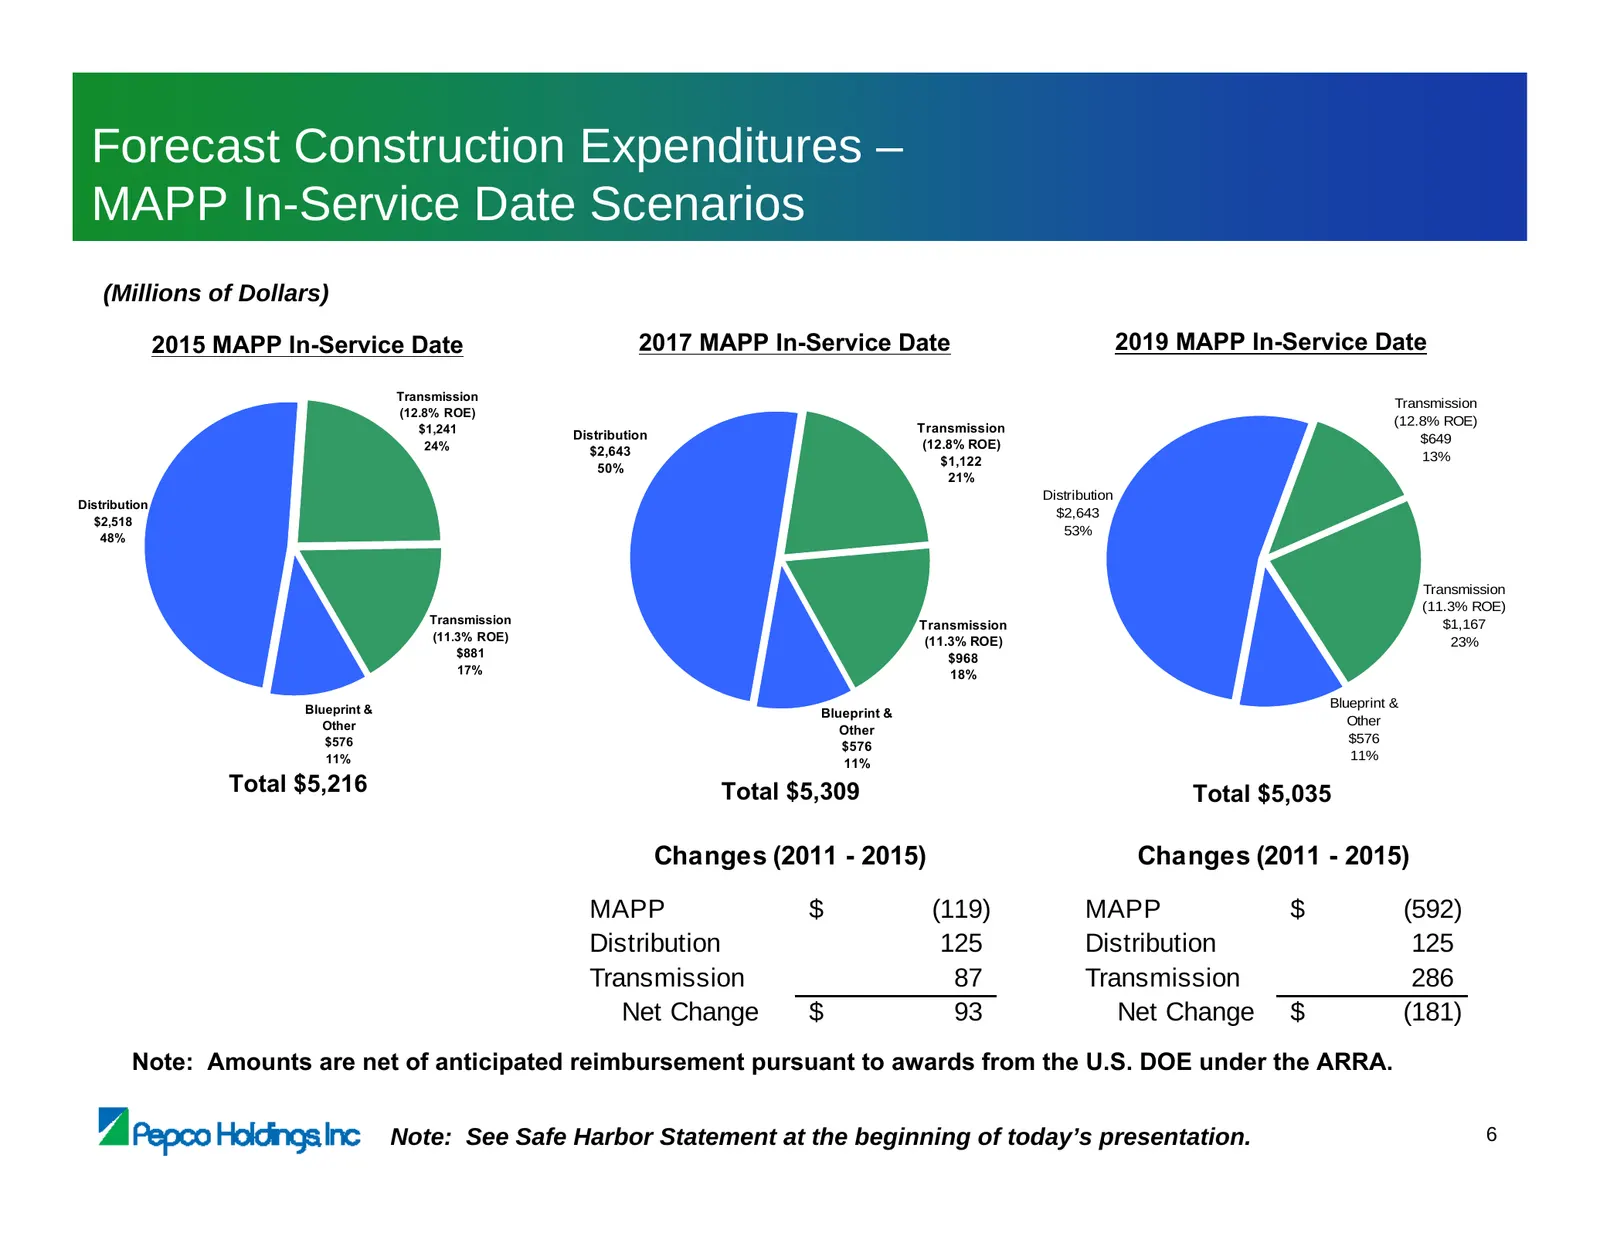
Forecast Construction Expenditures – MAPP In-Service Date Scenarios (Millions of Dollars) 2015 MAPP In-Service Date 2017 MAPP In-Service Date 2019 MAPP In-Service Date Transmission Transmission (12.8% ROE) (12.8% ROE) $1,241 Transmission Distribution $649 24% (12.8% ROE) $2,643 13% $1,122 50% 21% Di
Slide 8: Blueprint for the Future
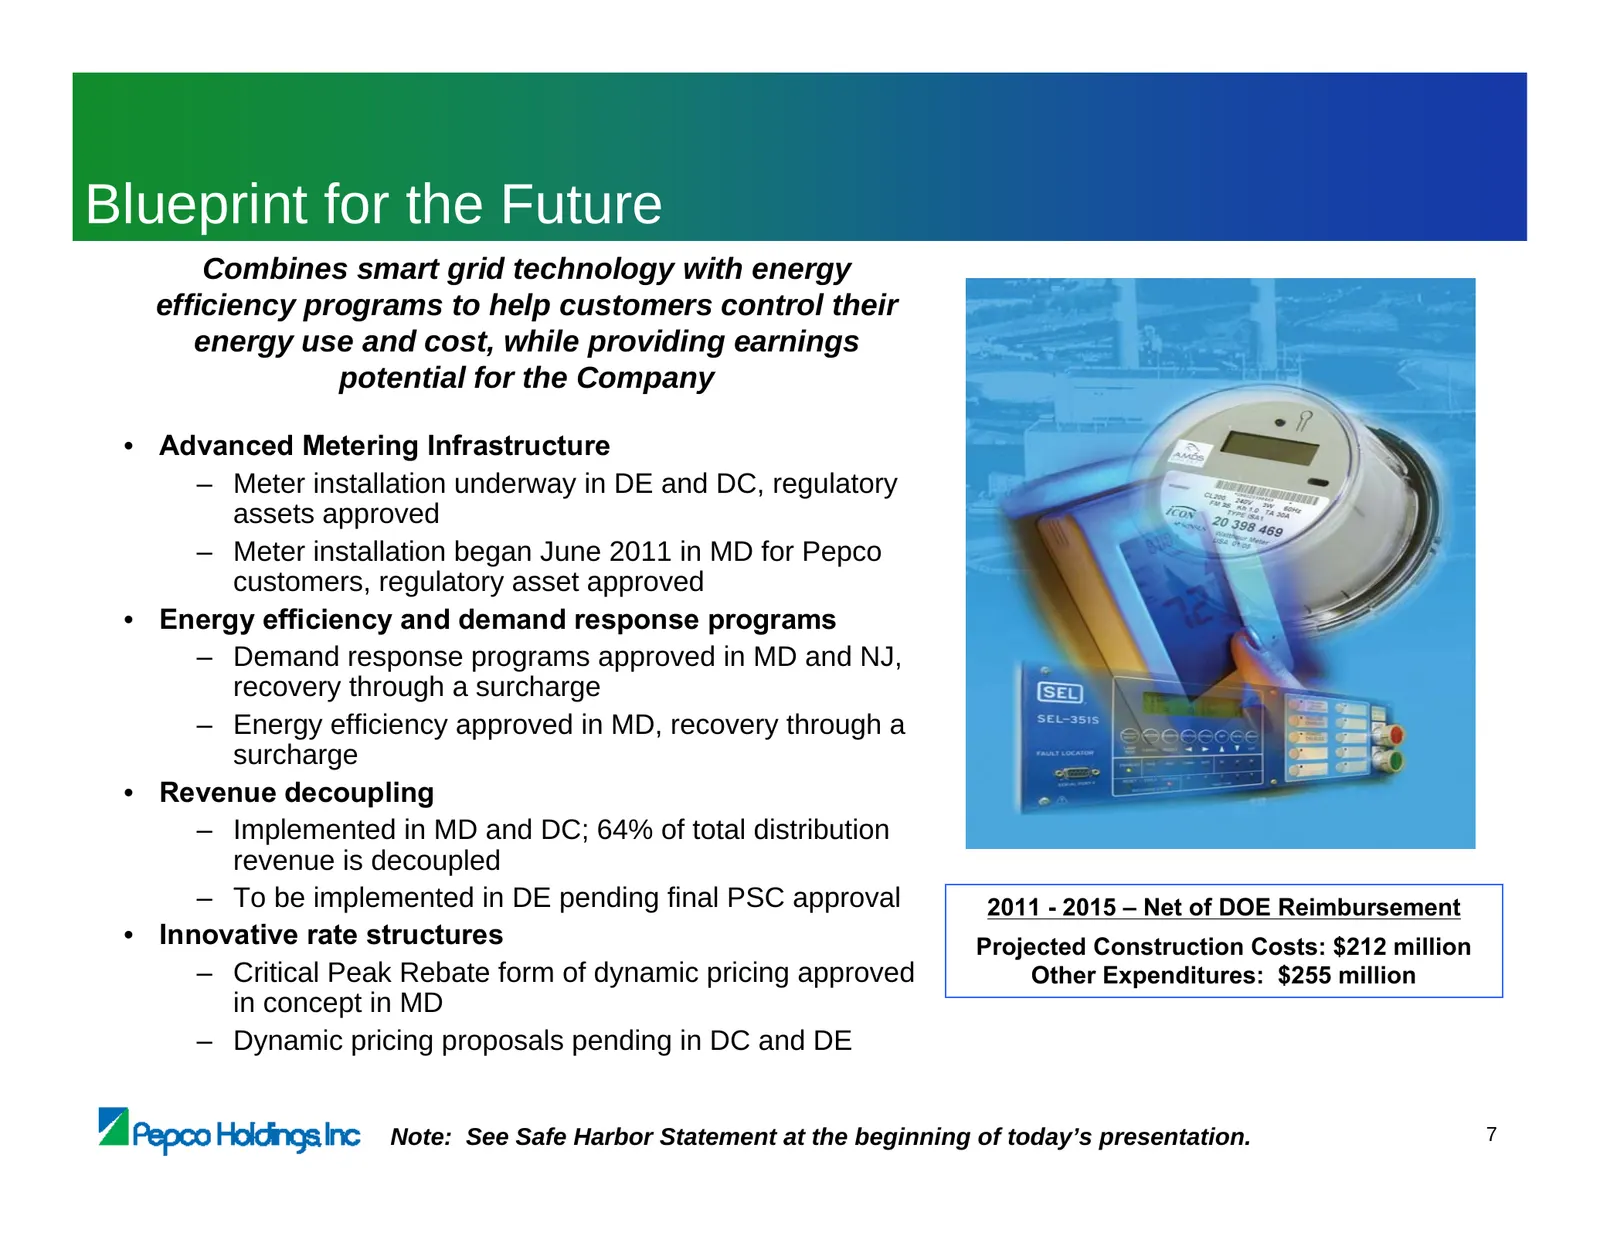
Blueprint for the Future Combines smart grid technology with energy efficiency programs to help customers control their energy use and cost, while providing earnings potential for the Company • Advanced Metering Infrastructure – Meter installation underway in DE and DC, regulatory assets approved –
Slide 9: Regulatory Environment
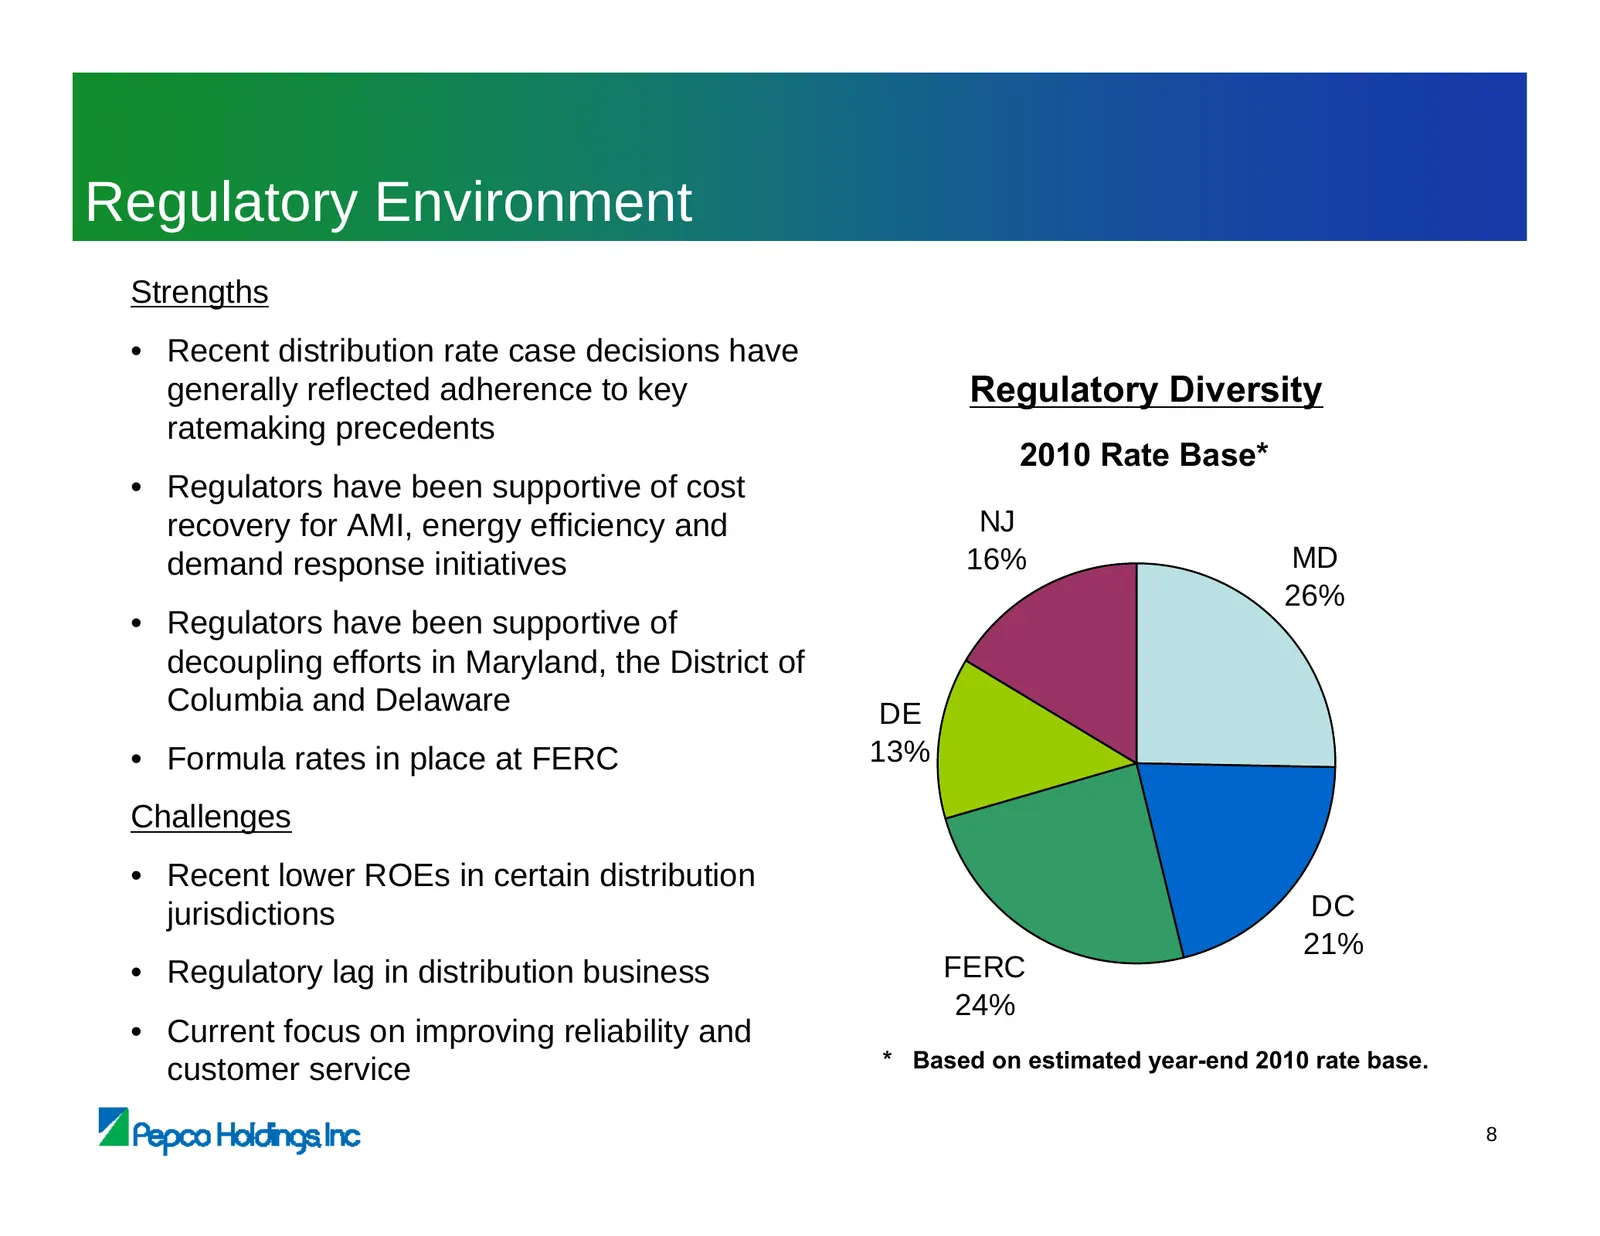
Regulatory Environment Strengths • Recent distribution rate case decisions have generally reflected adherence to key Regulatory Diversity ratemaking precedents 2010 Rate Base* • Regulators have been supportive of cost recovery for AMI, energy efficiency and NJ demand response initiatives 16% MD 26%
Slide 10: Focus on Regulatory Lag
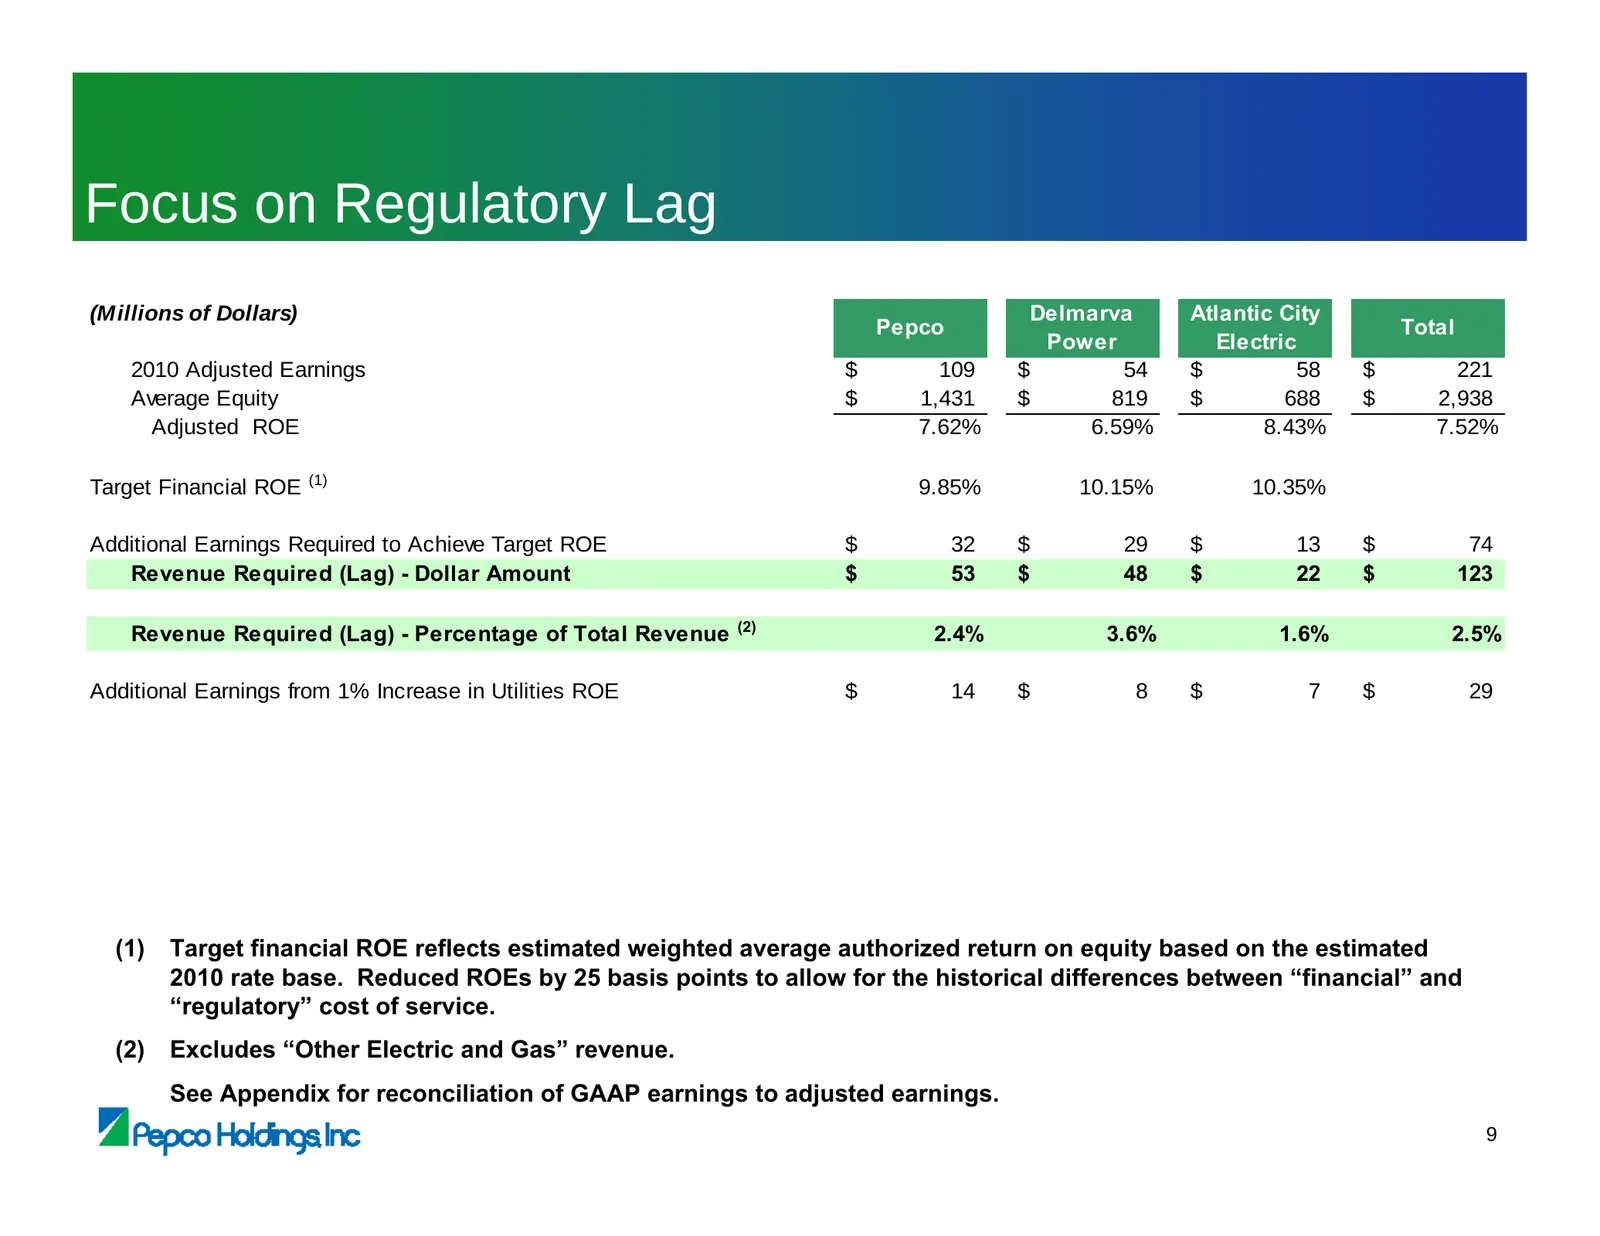
Focus on Regulatory Lag (Millions of Dollars) Delmarva Atlantic City Pepco Total Power Electric 2010 Adjusted Earnings $ 109 $ 54 $ 58 $ 221 Average Equity $ 1,431 $ 819 $ 688 $ 2,938 Adjusted ROE 7.62% 6.59% 8.43% 7.52% Target Financial ROE (1) 9.85% 10.15% 10.35% Additional Earnings Required to Ac
Slide 11: Distribution Rate Cases – Recent Decision, Delmarva Power – Delaware Gas
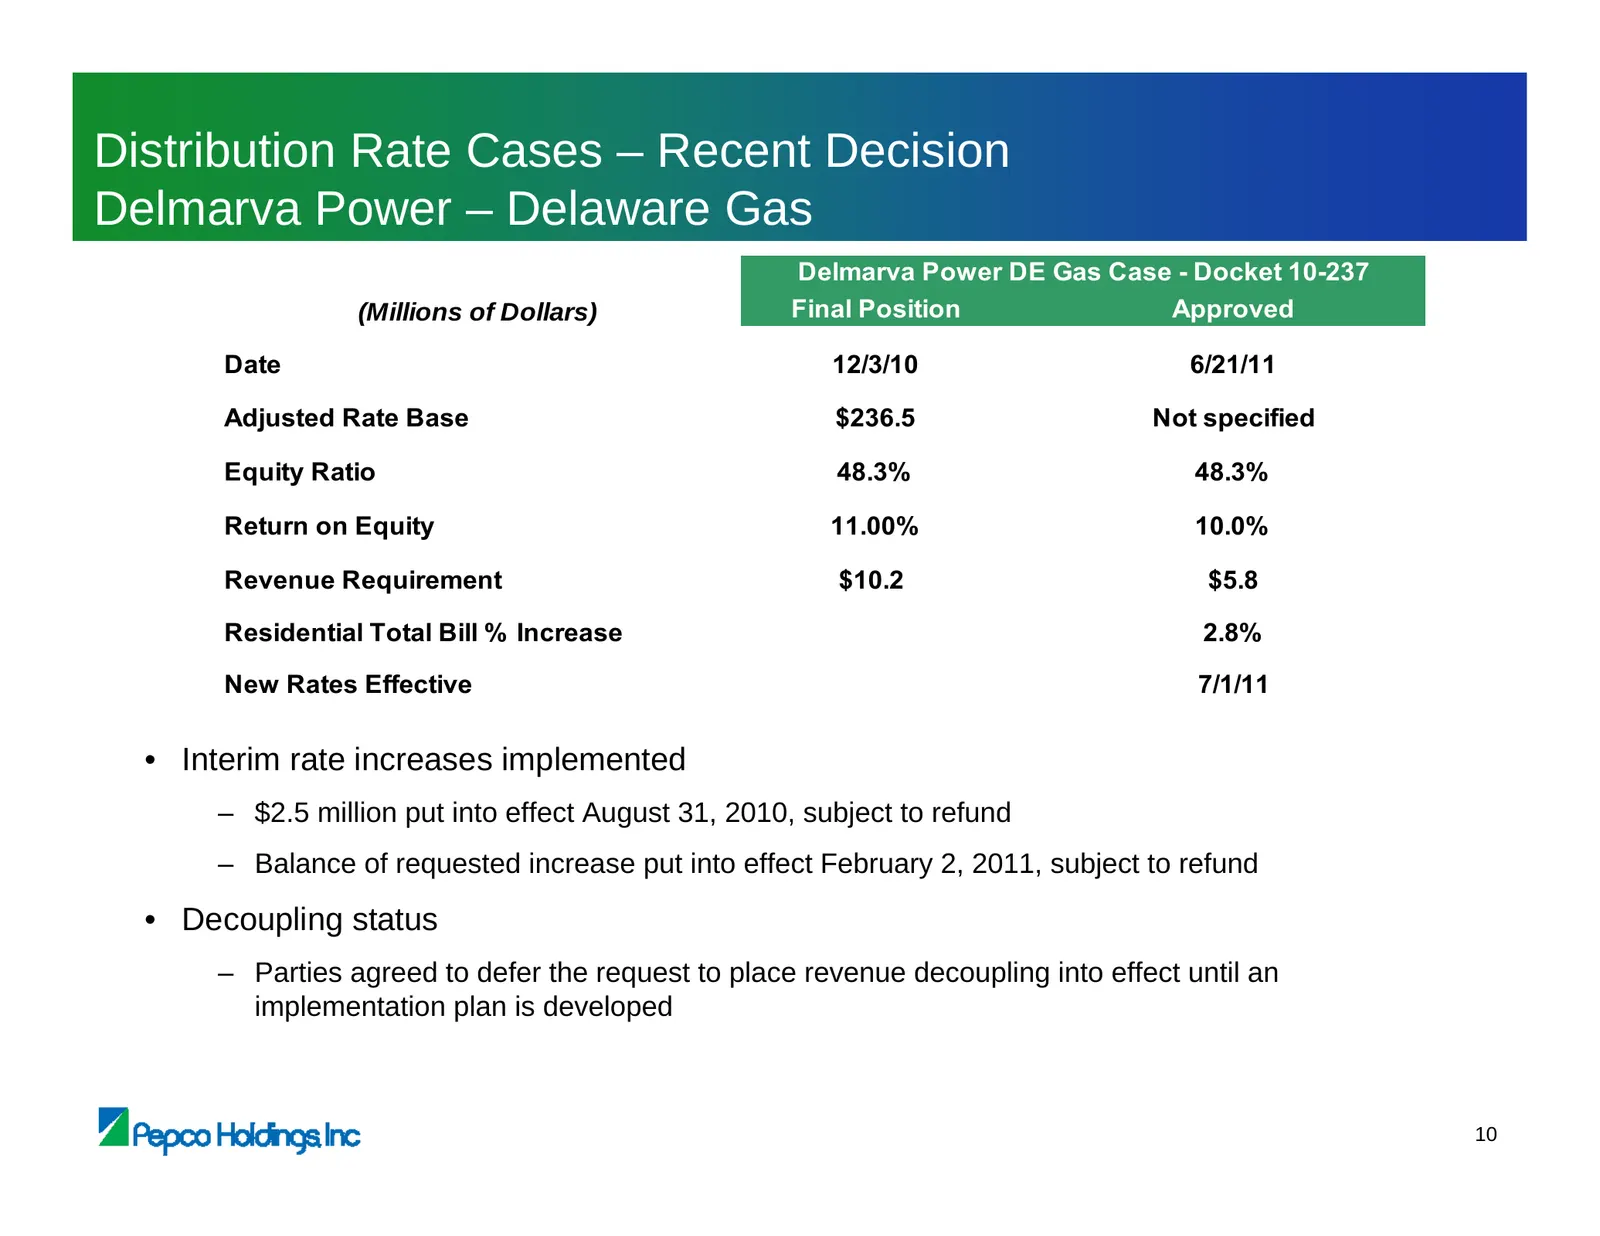
Distribution Rate Cases – Recent Decision Delmarva Power – Delaware Gas Delmarva Power DE Gas Case - Docket 10-237 (Millions of Dollars) Final Position Approved Date 12/3/10 6/21/11 Adjusted Rate Base $236.5 Not specified Equity Ratio 48.3% 48.3% Return on Equity 11.00% 10.0% Revenue Requirement $10
Slide 12: Distribution Rate Cases – Proposed Settlement, Delmarva Power – Maryland
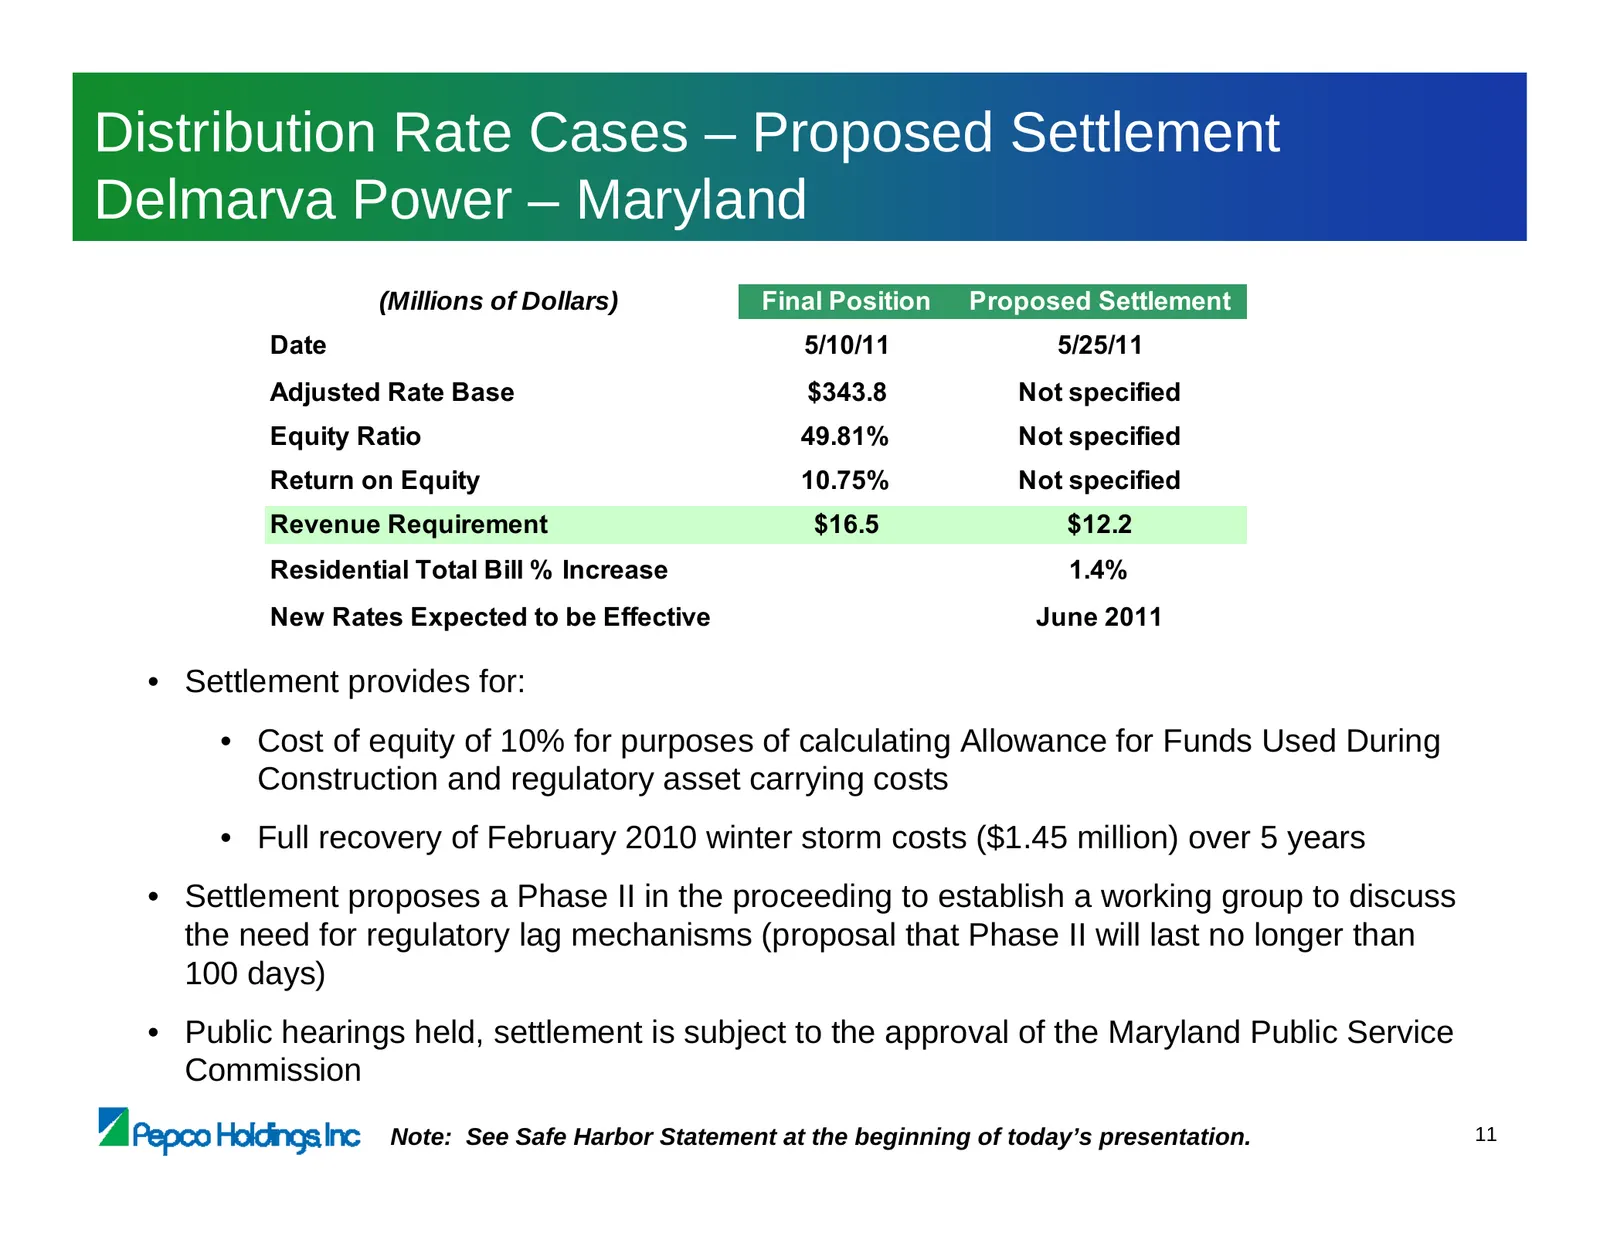
Distribution Rate Cases – Proposed Settlement Delmarva Power – Maryland (Millions of Dollars) Final Position Proposed Settlement Date 5/10/11 5/25/11 Adjusted Rate Base $343.8 Not specified Equity Ratio 49.81% Not specified Return on Equity 10.75% Not specified Revenue Requirement $16.5 $12.2 Reside
Slide 13: Distribution Rate Cases – The Next Cycle
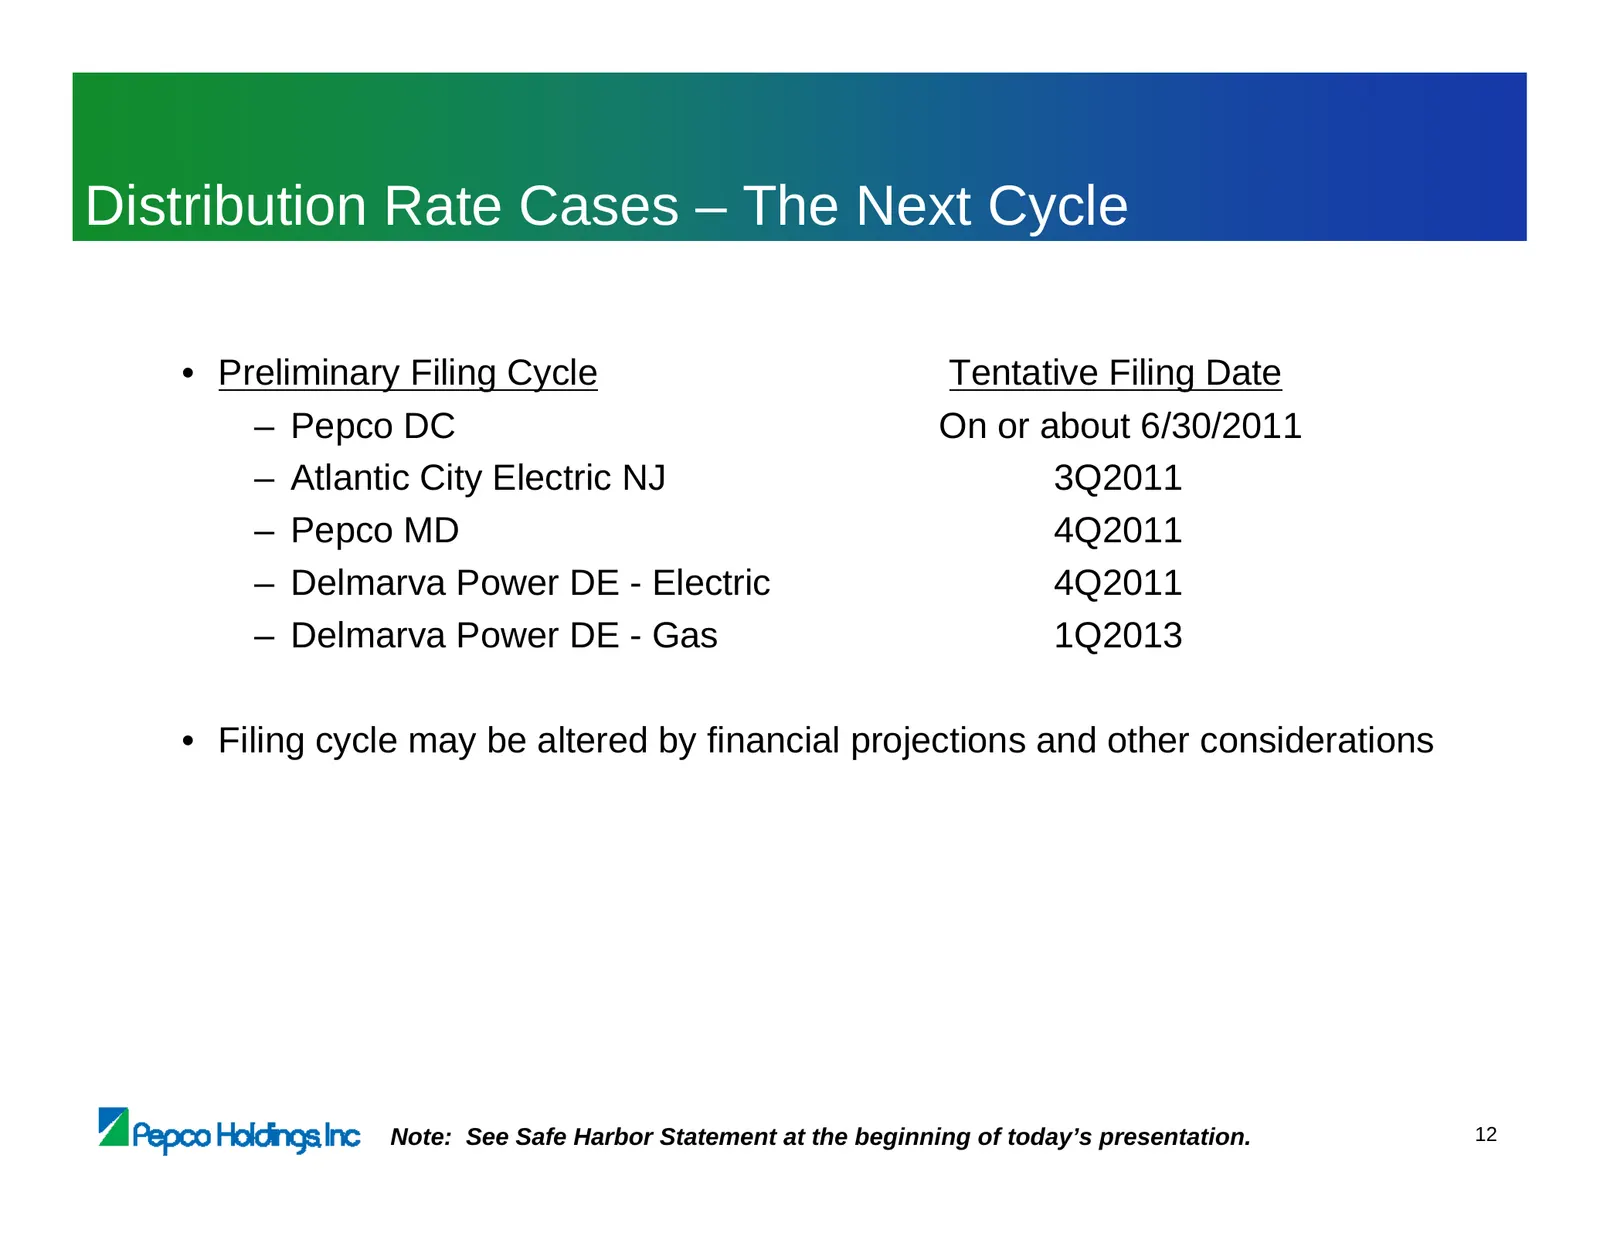
Distribution Rate Cases – The Next Cycle • Preliminary Filing Cycle Tentative Filing Date – Pepco DC On or about 6/30/2011 – Atlantic City Electric NJ 3Q2011 – Pepco MD 4Q2011 – Delmarva Power DE - Electric 4Q2011 – Delmarva Power DE - Gas 1Q2013 • Filing cycle may be altered by financial projection
Slide 14: Pepco Energy Services Overview
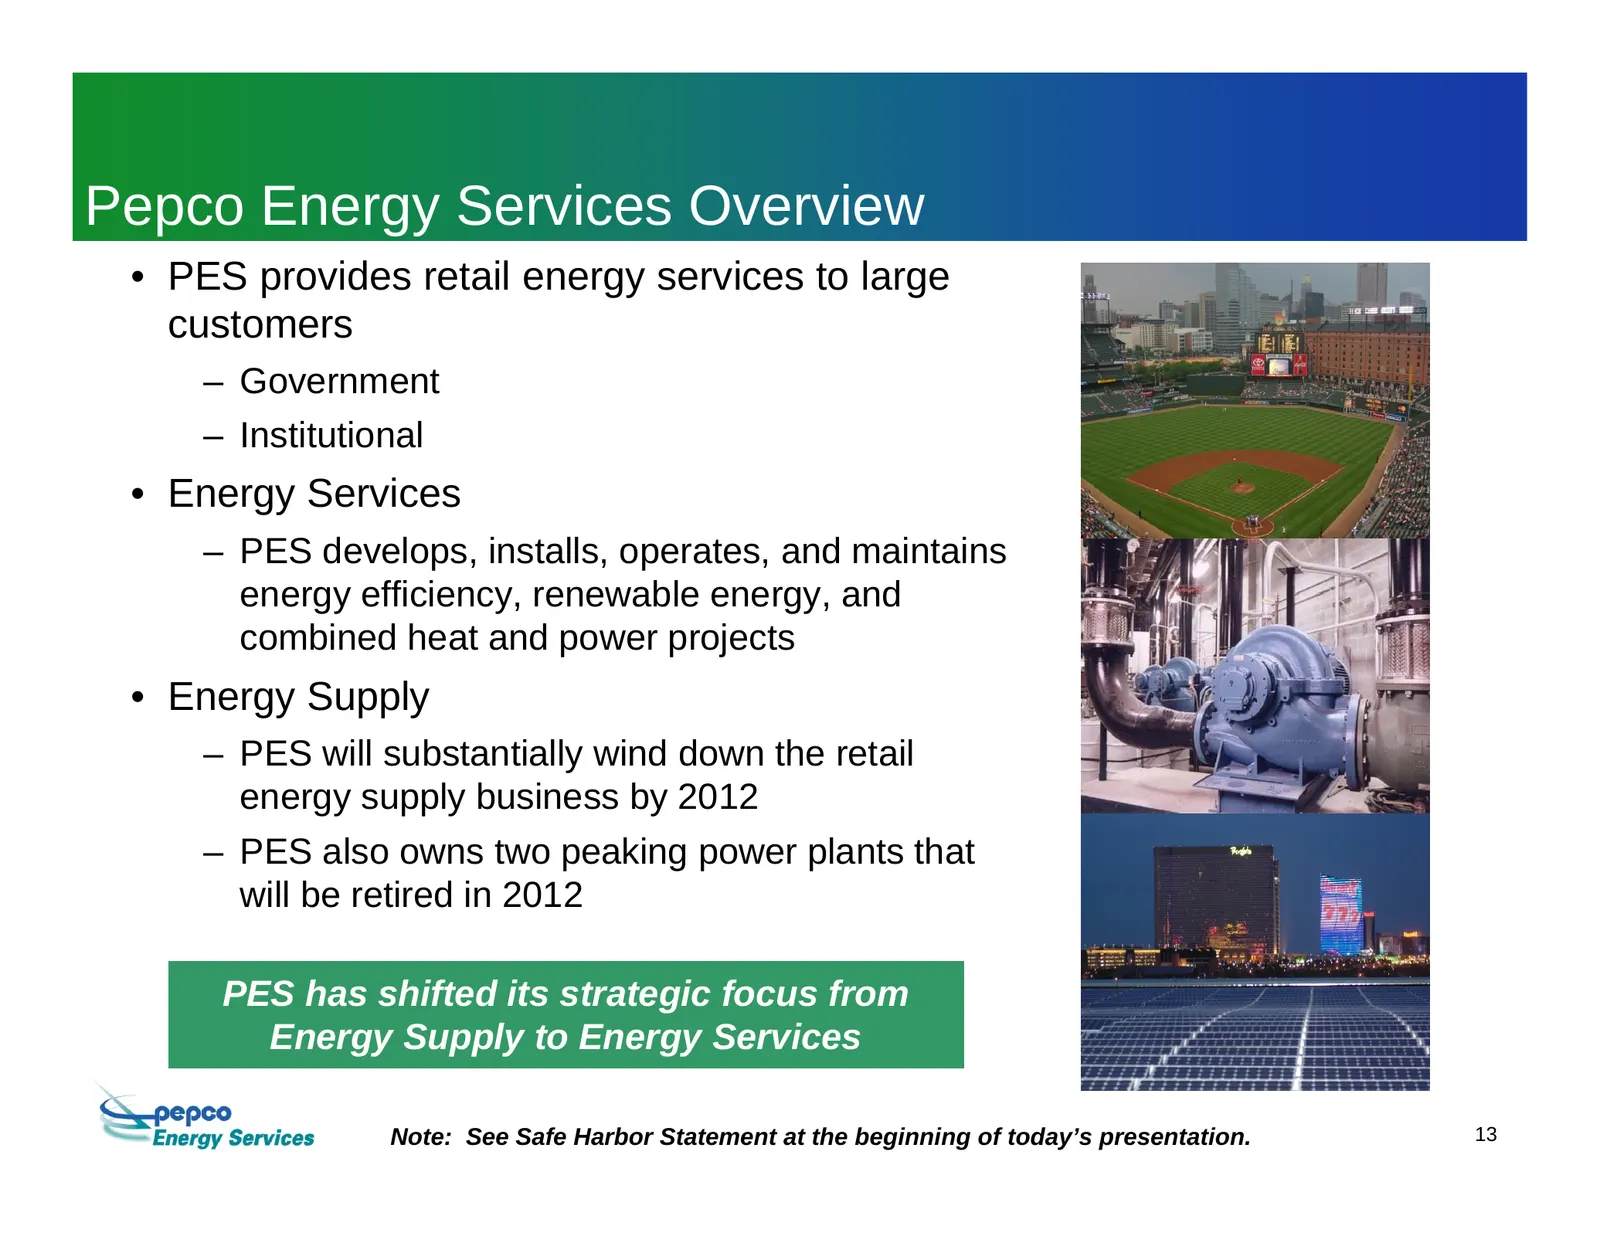
Pepco Energy Services Overview • PES provides retail energy services to large customers – Government – Institutional • Energy Services – PES develops, installs, operates, and maintains energy efficiency, renewable energy, and combined heat and power projects • Energy Supply – PES will substantially
Slide 15: Growing the Energy Services Business
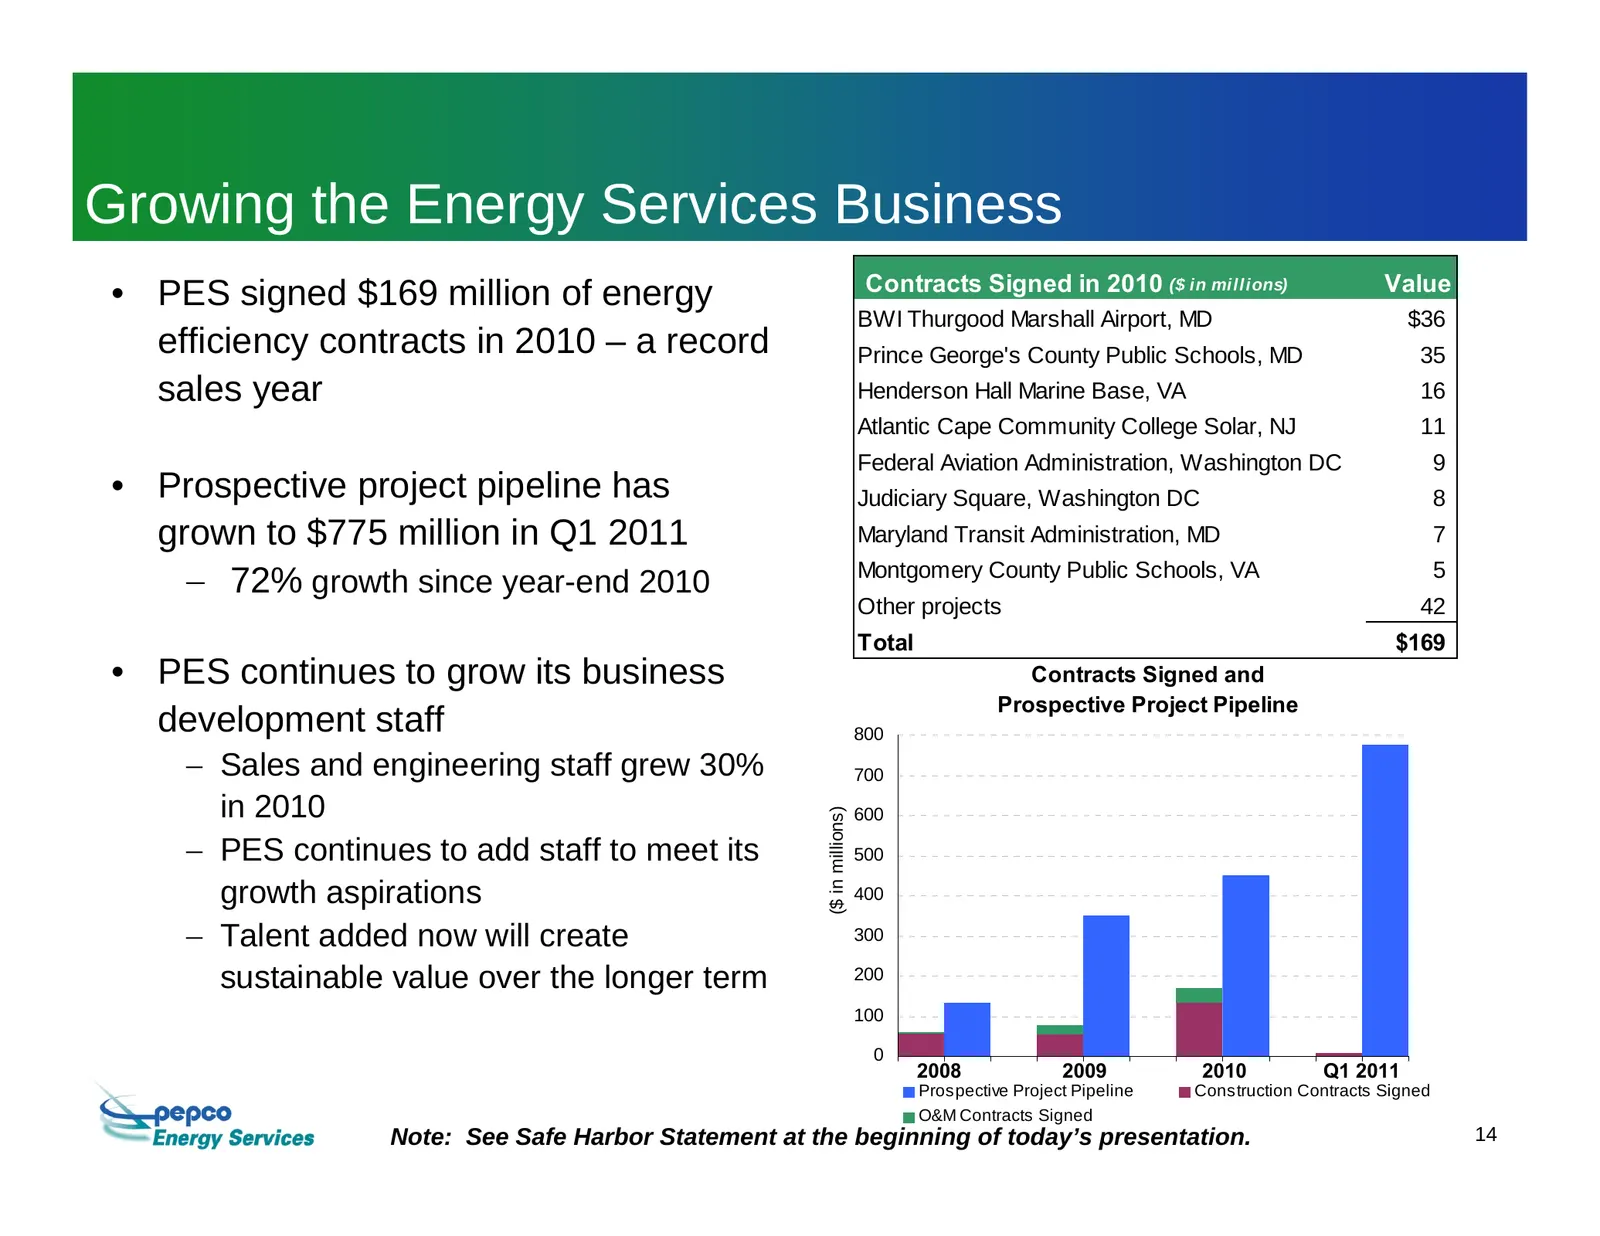
Growing the Energy Services Business Contracts Signed in 2010 ($ in millions) Value • PES signed $169 million of energy BWI Thurgood Marshall Airport, MD $36 efficiency contracts in 2010 – a record Prince George's County Public Schools, MD 35 sales year Henderson Hall Marine Base, VA 16 Atlantic Cap
Slide 16: 2011 – 2012 Financing Activity
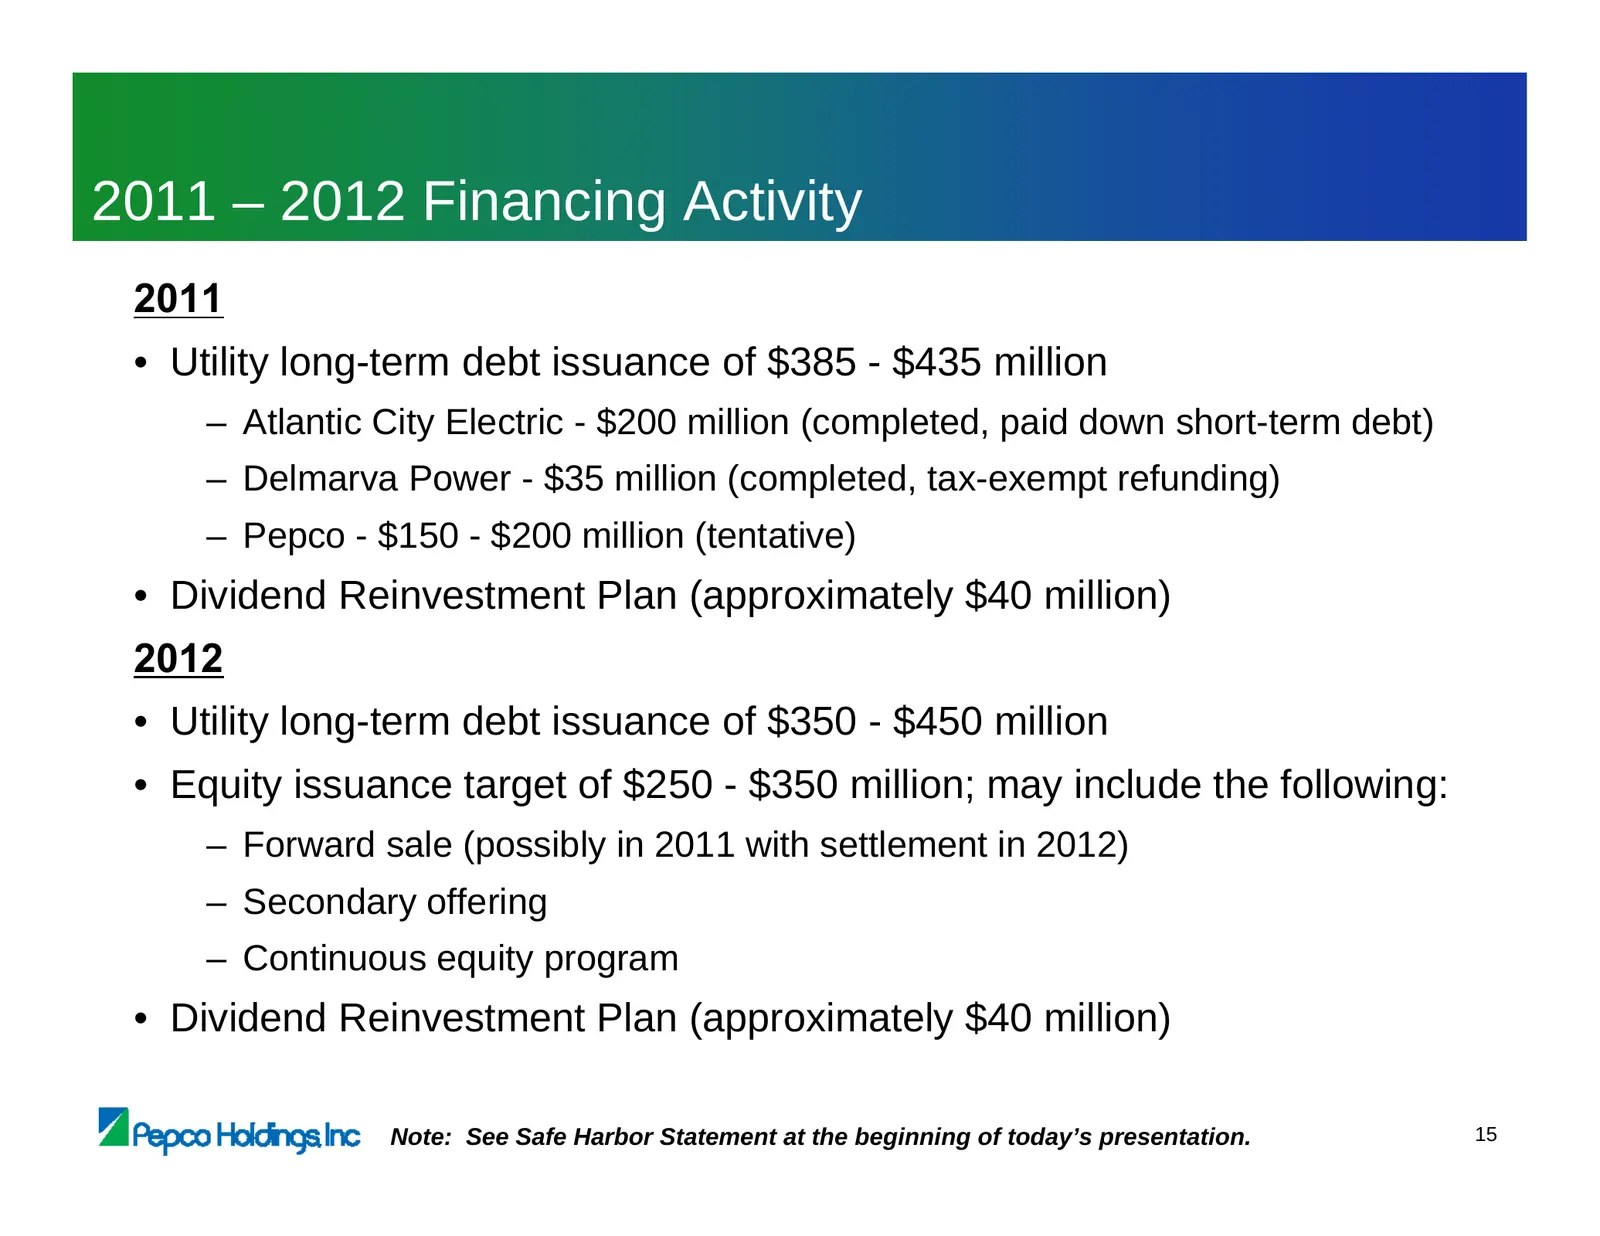
2011 – 2012 Financing Activity 2011 • Utility long-term debt issuance of $385 - $435 million – Atlantic City Electric - $200 million (completed, paid down short-term debt) – Delmarva Power - $35 million (completed, tax-exempt refunding) – Pepco - $150 - $200 million (tentative) • Dividend Reinvestme
Slide 17: 2011 Earnings Guidance
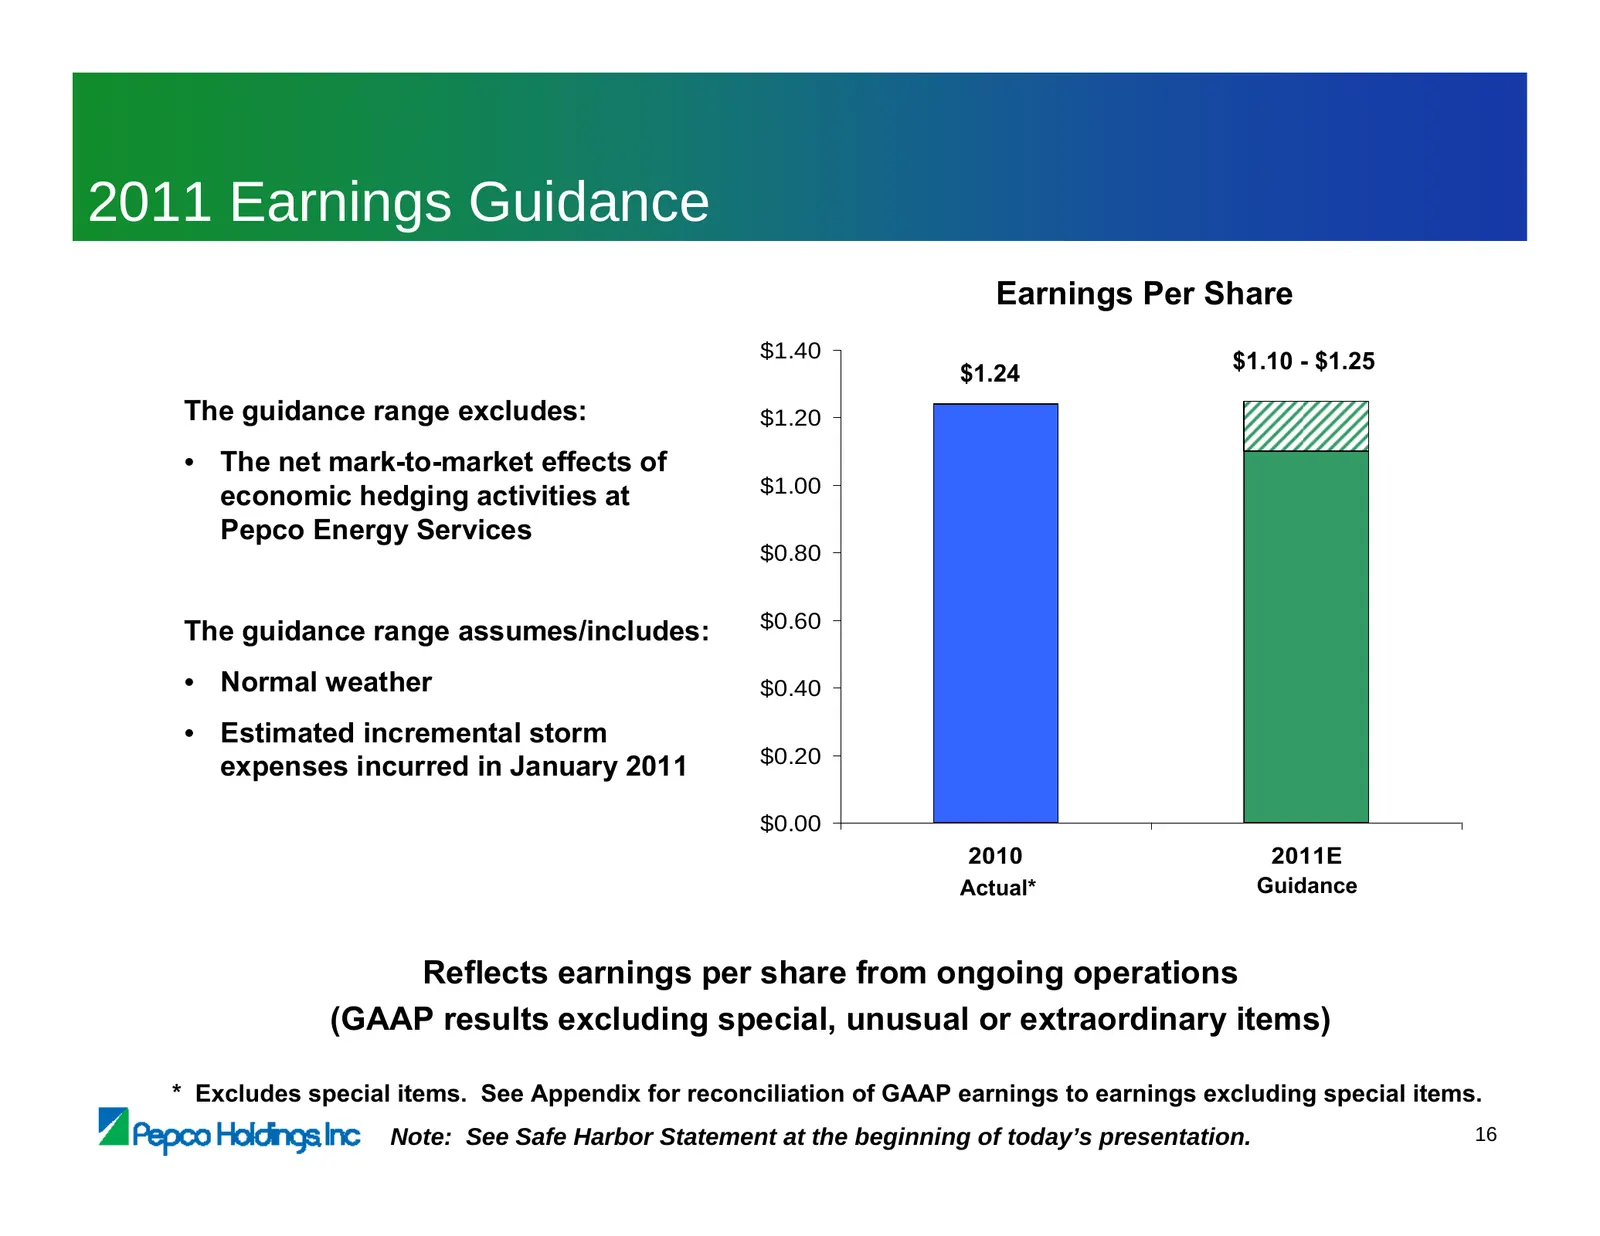
2011 Earnings Guidance Earnings Per Share $1.40 $1.10 - $1.25 $1.24 The guidance range excludes: $1.20 • The net mark-to-market effects of $1.00 economic hedging activities at Pepco Energy Services $0.80 $0.60 The guidance range assumes/includes: • Normal weather $0.40 • Estimated incremental storm
Slide 18: Delivering Value
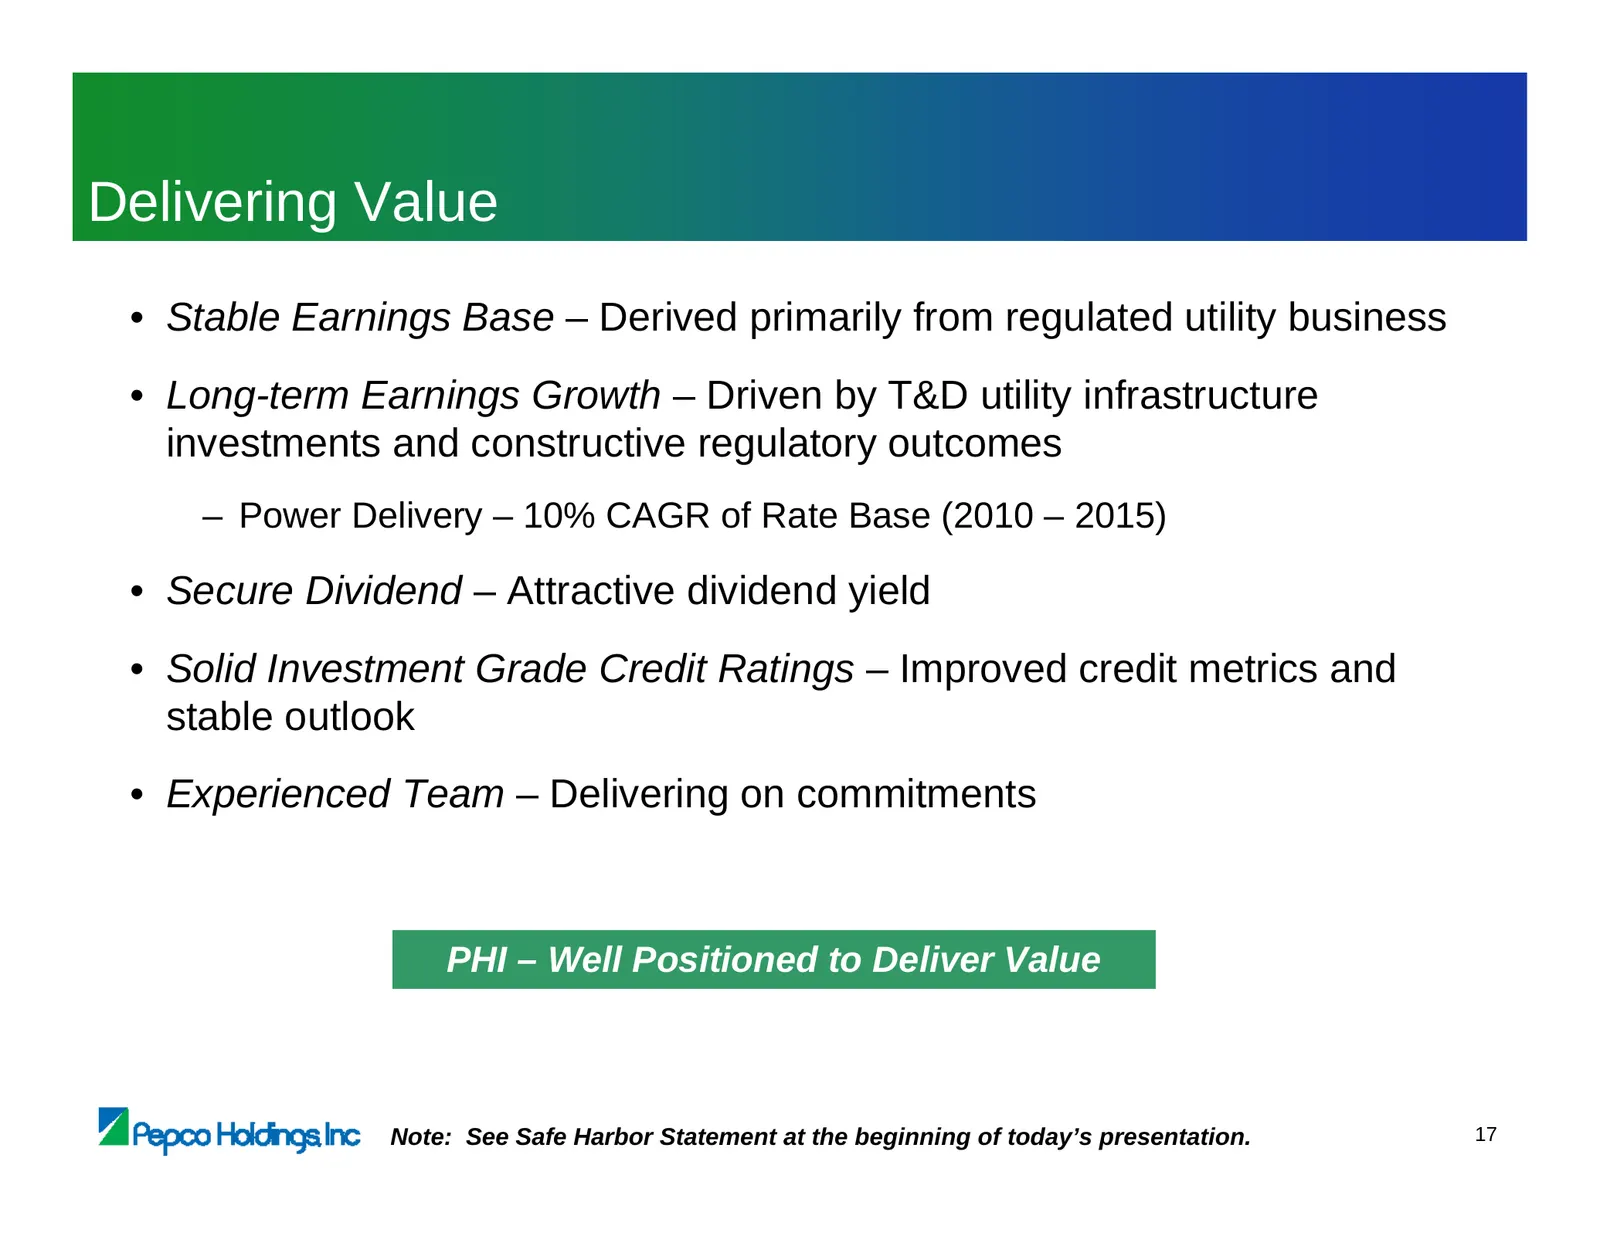
Delivering Value • Stable Earnings Base – Derived primarily from regulated utility business • Long-term Earnings Growth – Driven by T&D utility infrastructure investments and constructive regulatory outcomes – Power Delivery – 10% CAGR of Rate Base (2010 – 2015) • Secure Dividend – Attractive divide
Slide 19: Appendix
Appendix VA Pepco Holdings Inc
Slide 20: Financial Performance – Drivers
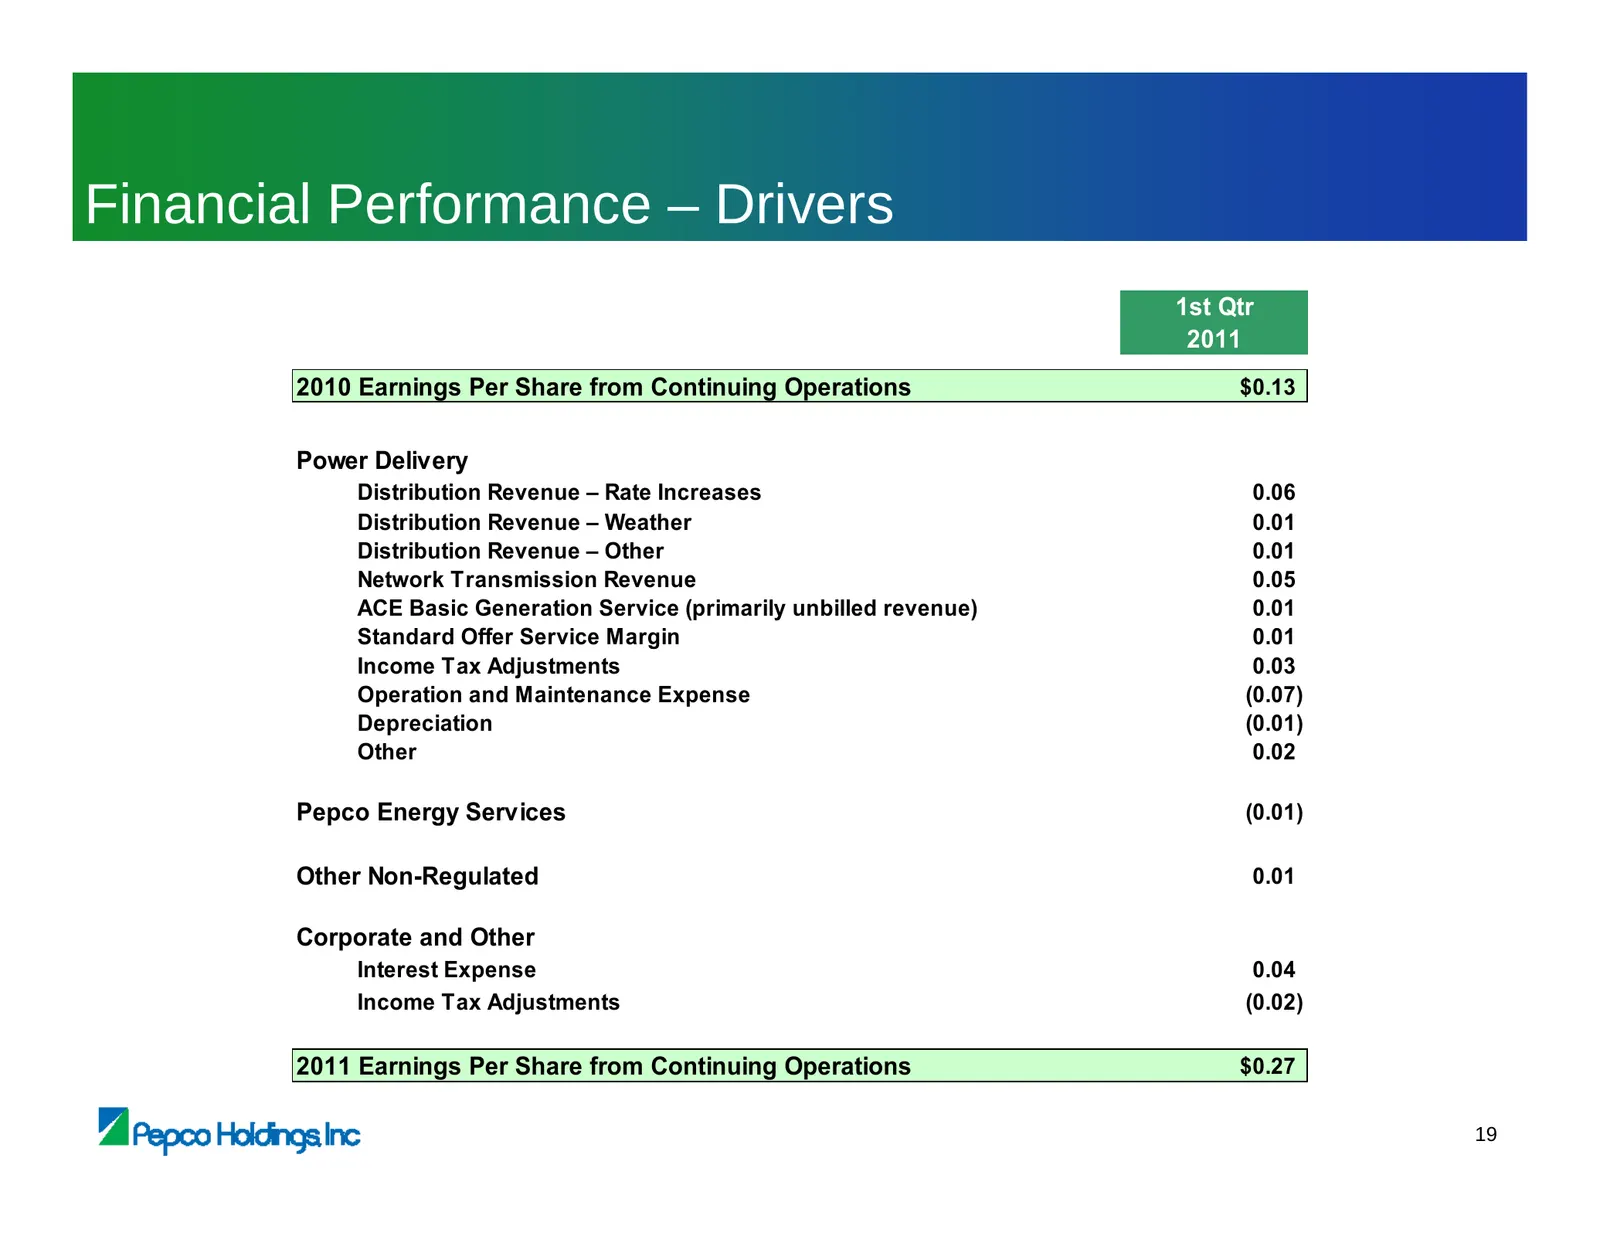
Financial Performance – Drivers 1st Qtr 2011 2010 Earnings Per Share from Continuing Operations $0.13 Power Delivery Distribution Revenue – Rate Increases 0.06 Distribution Revenue – Weather 0.01 Distribution Revenue – Other 0.01 Network Transmission Revenue 0.05 ACE Basic Generation Service (primar
Slide 21: Rate Base Summary
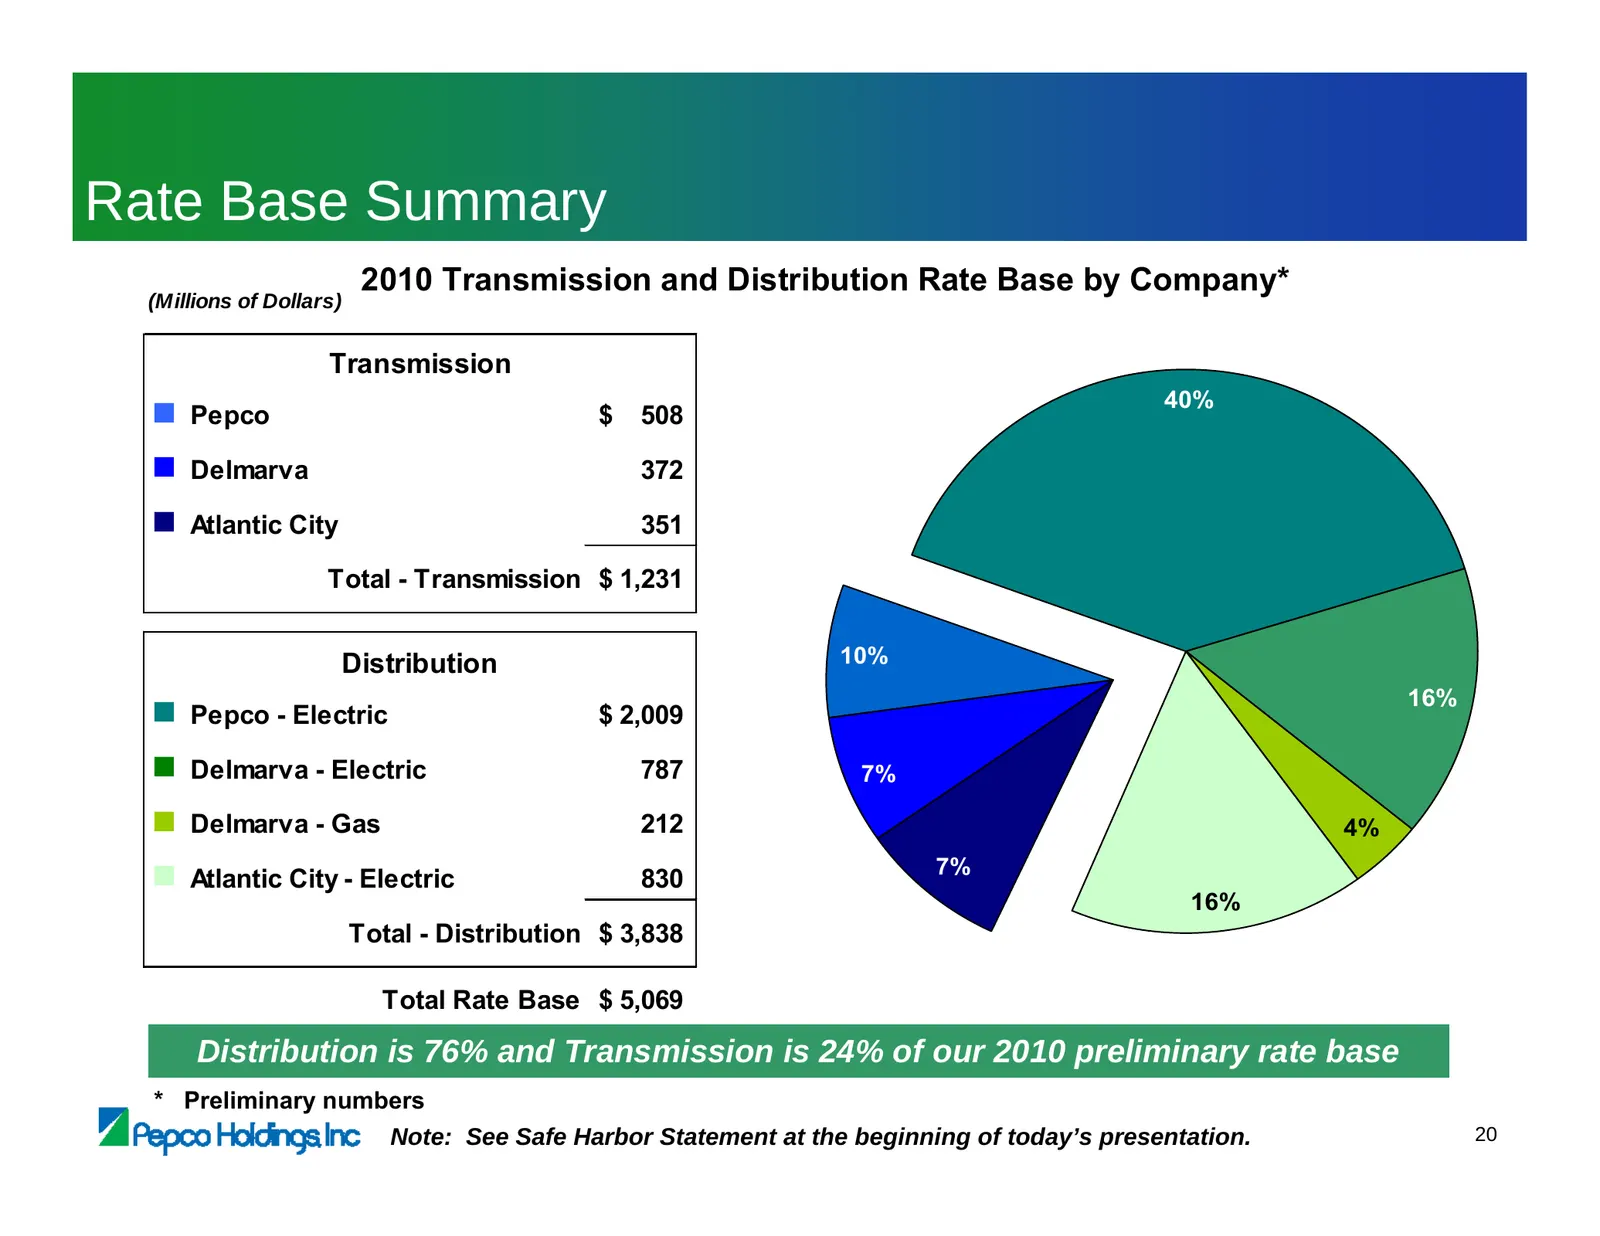
Rate Base Summary 2010 Transmission and Distribution Rate Base by Company* (Millions of Dollars) Transmission ■ Pepco $ 508 40% ■ Delmarva 372 ■ Atlantic City 351 Total - Transmission $ 1,231 7% Distribution 10% ■ Pepco - Electric $ 2,009 16% ■ Delmarva - Electric 787 7% 7% 4 ■ Delmarva - Gas 212 4%
Slide 22: Construction Expenditure Forecast
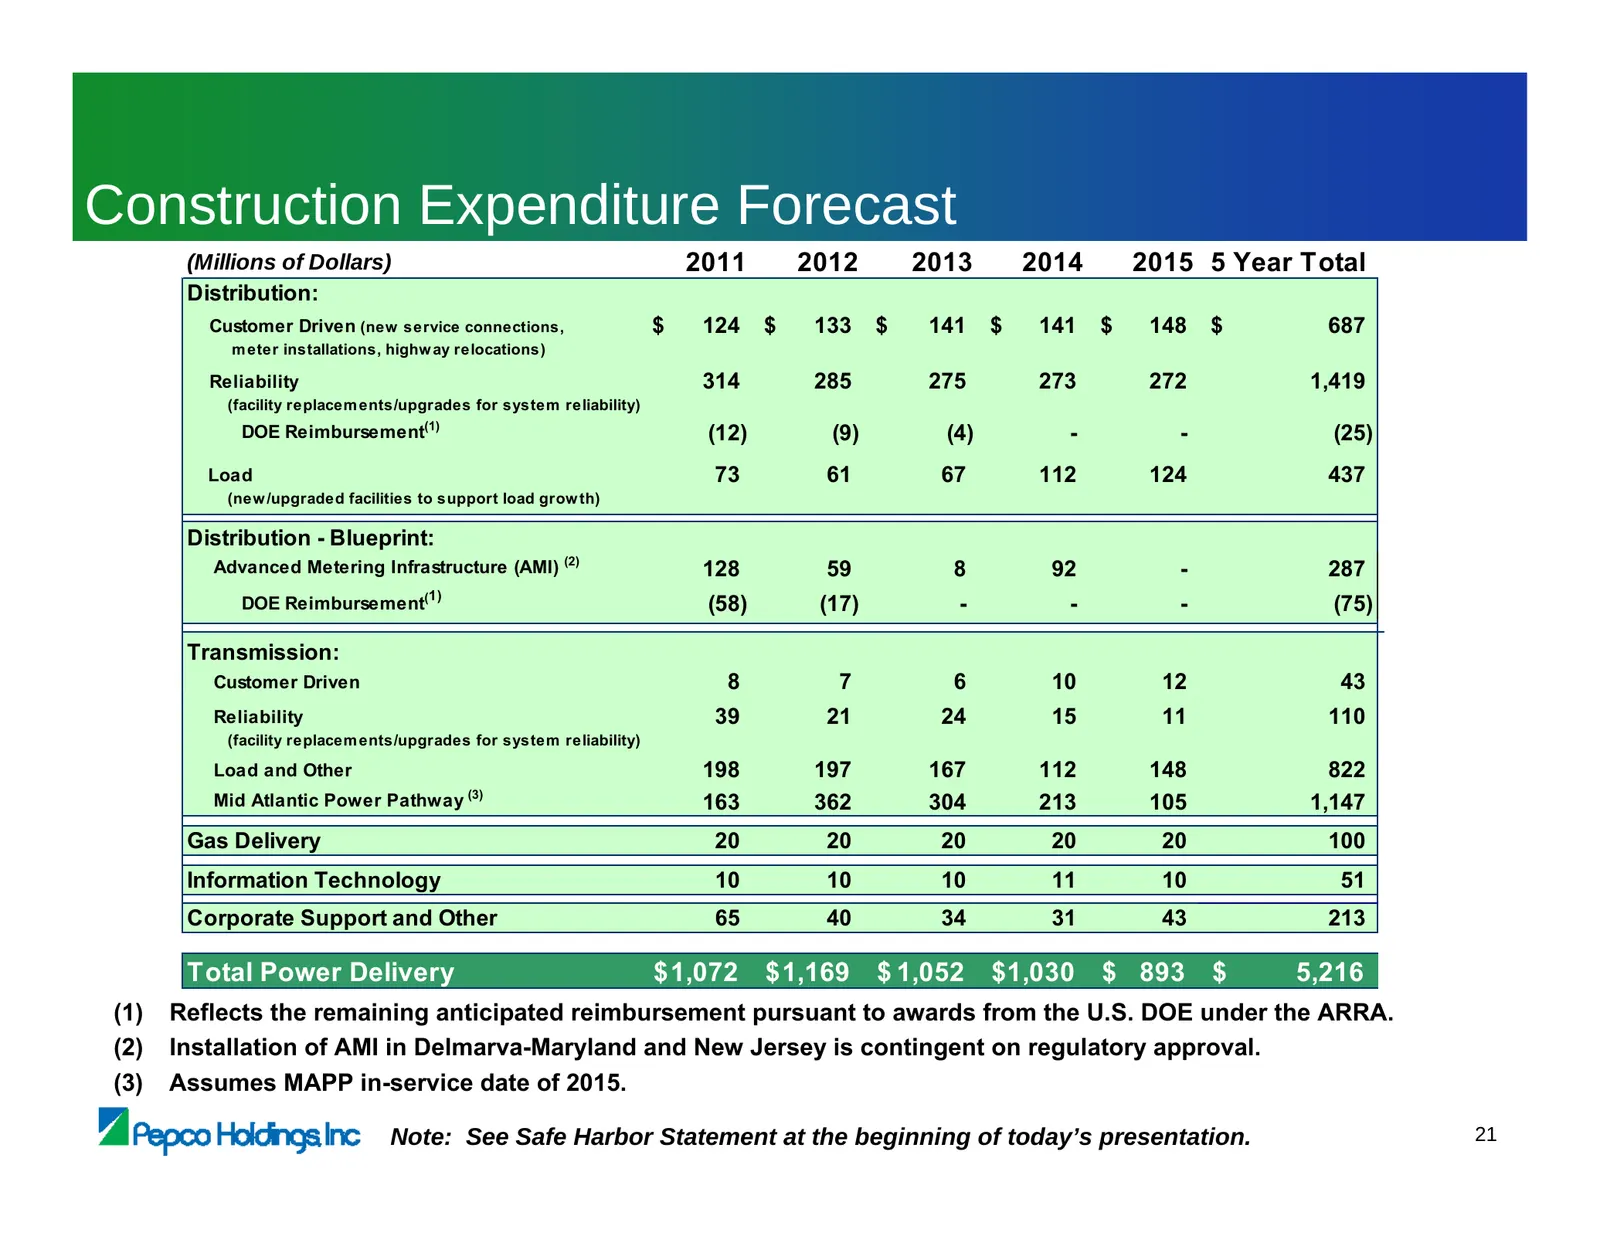
Construction Expenditure Forecast (Millions of Dollars) 2011 2012 2013 2014 2015 5 Year Total Distribution: Customer Driven (new service connections, $ 124 $ 133 $ 141 $ 141 $ 148 $ 687 m eter installations, highw ay relocations) Reliability 314 285 275 273 272 1,419 (facility replacem ents/upgrades
Slide 23: MAPP – Construction Expenditures
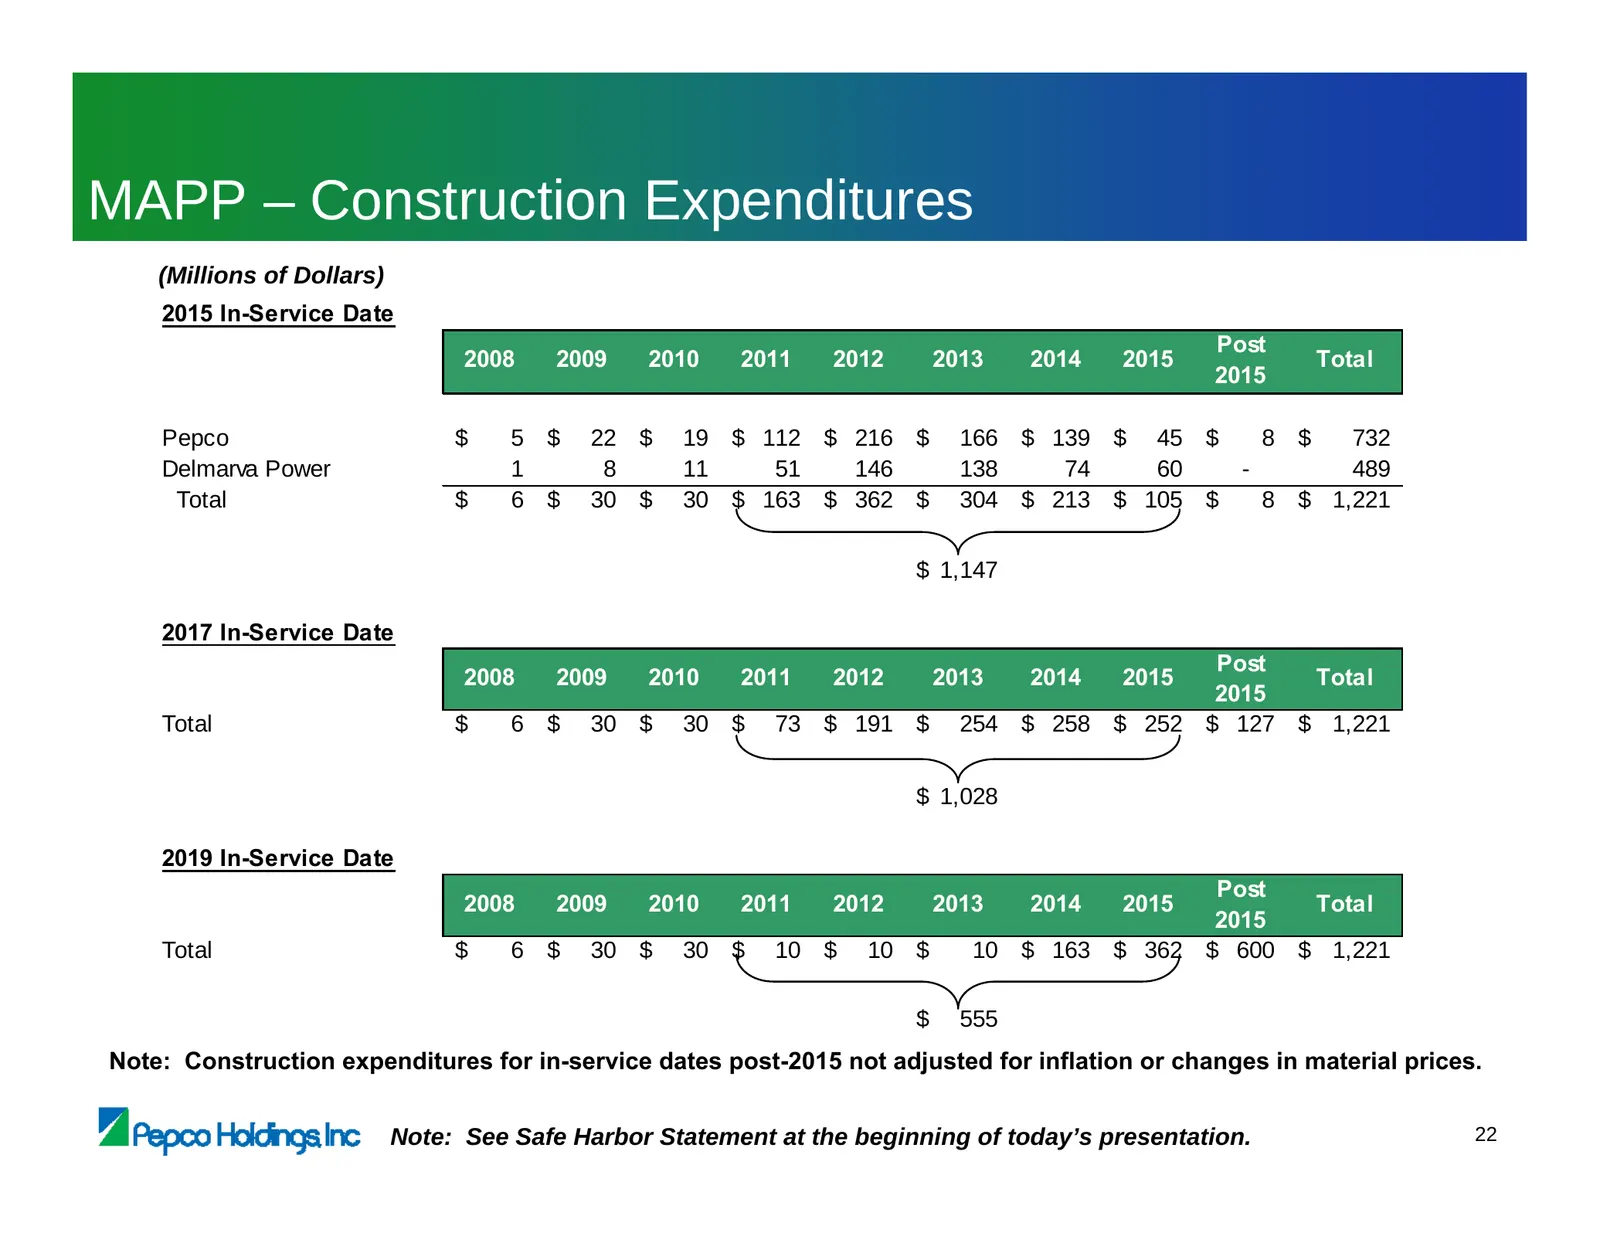
MAPP – Construction Expenditures (Millions of Dollars) 2015 In-Service Date Post 2008 2009 2010 2011 2012 2013 2014 2015 Total 2015 Pepco $ 5 $ 22 $ 19 $ 112 $ 216 $ 166 $ 139 $ 45 $ 8 $ 732 Delmarva Power 1 8 11 51 146 138 74 60 - 489 Total $ 6 $ 30 $ 30 $ 163 $ 362 $ 304 $ 213 $ 105 $ 8 $ 1,221 $
Slide 24: Transmission Rate Base and Earnings – MAPP 2015 In-Service Date Scenario
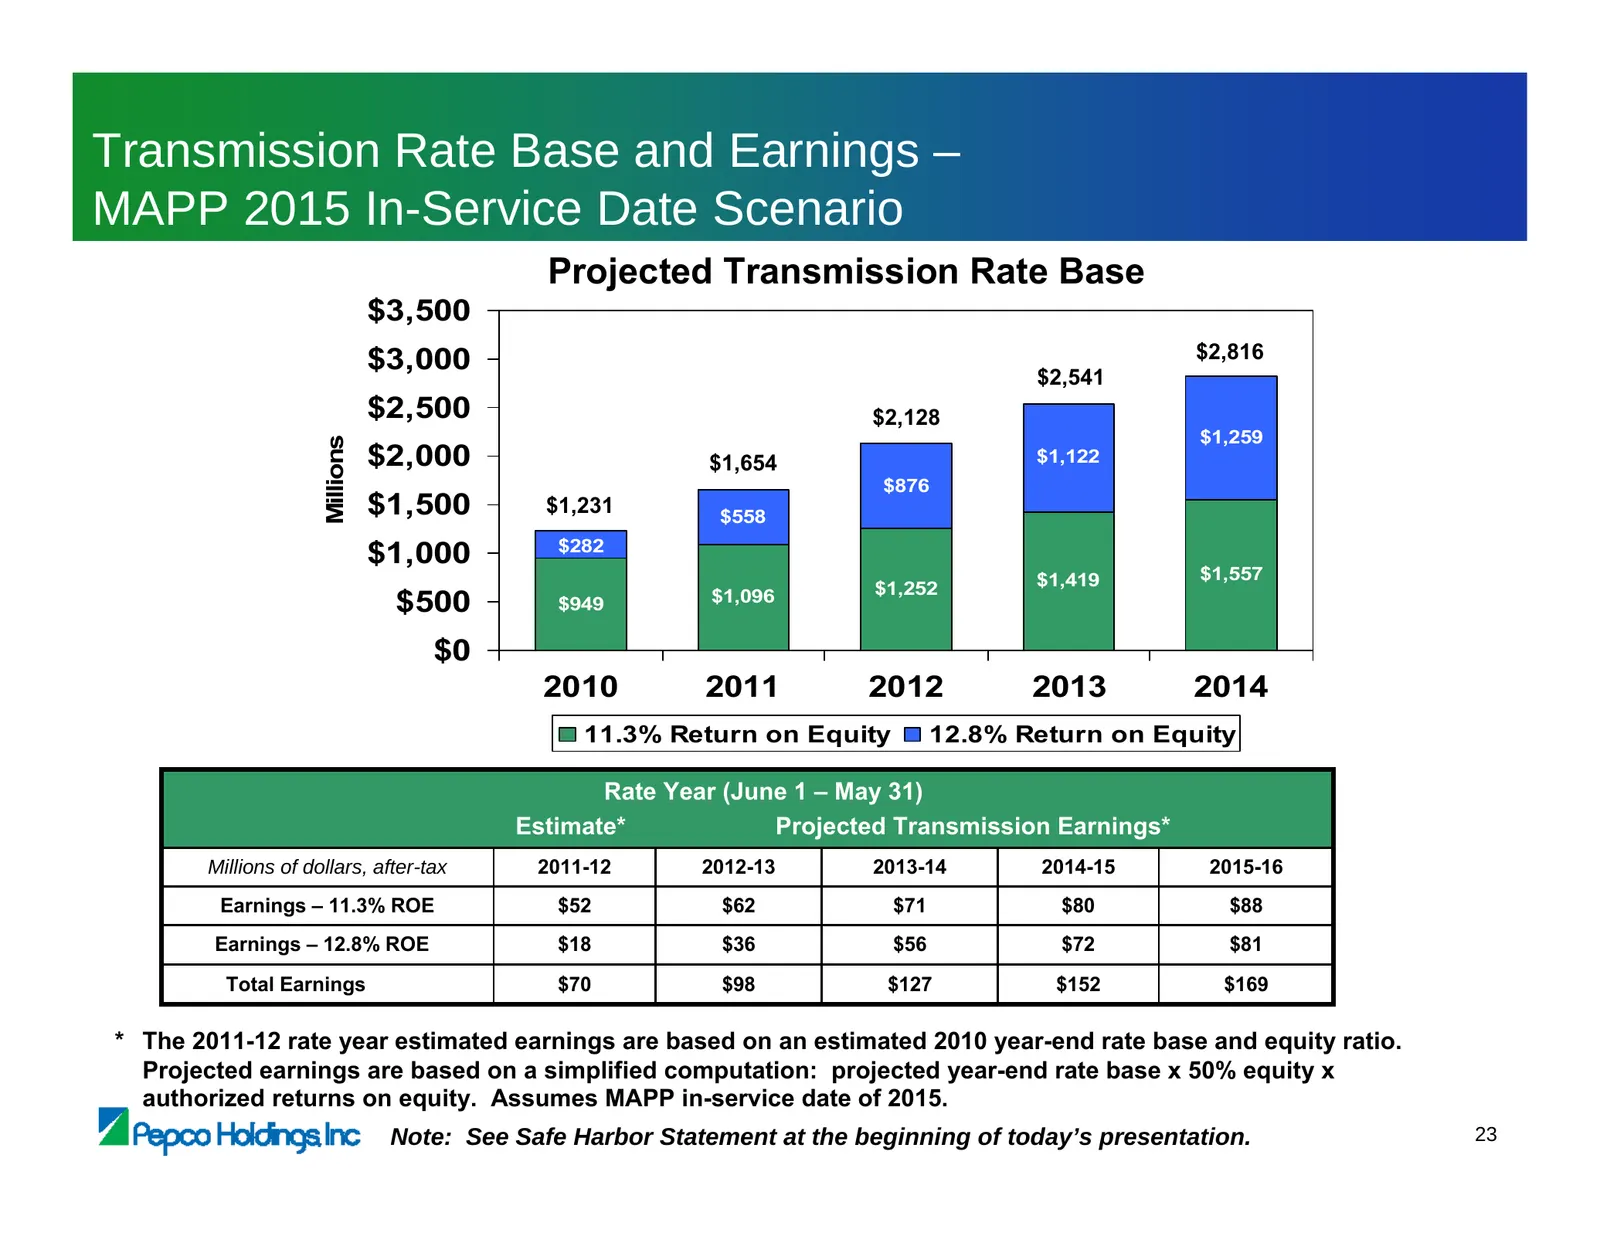
Transmission Rate Base and Earnings – MAPP 2015 In-Service Date Scenario Projected Transmission Rate Base $3,500 $3,000 $2,816 $2,541 $2,500 $2,128 $1,259 Millions $2,000 $1,654 $1,122 $876 $1,500 $1,231 $558 $282 $1,000 $1,419 $1,557 $1,252 $500 $949 $1,096 $0 2010 2011 2012 2013 2014 11.3% Return
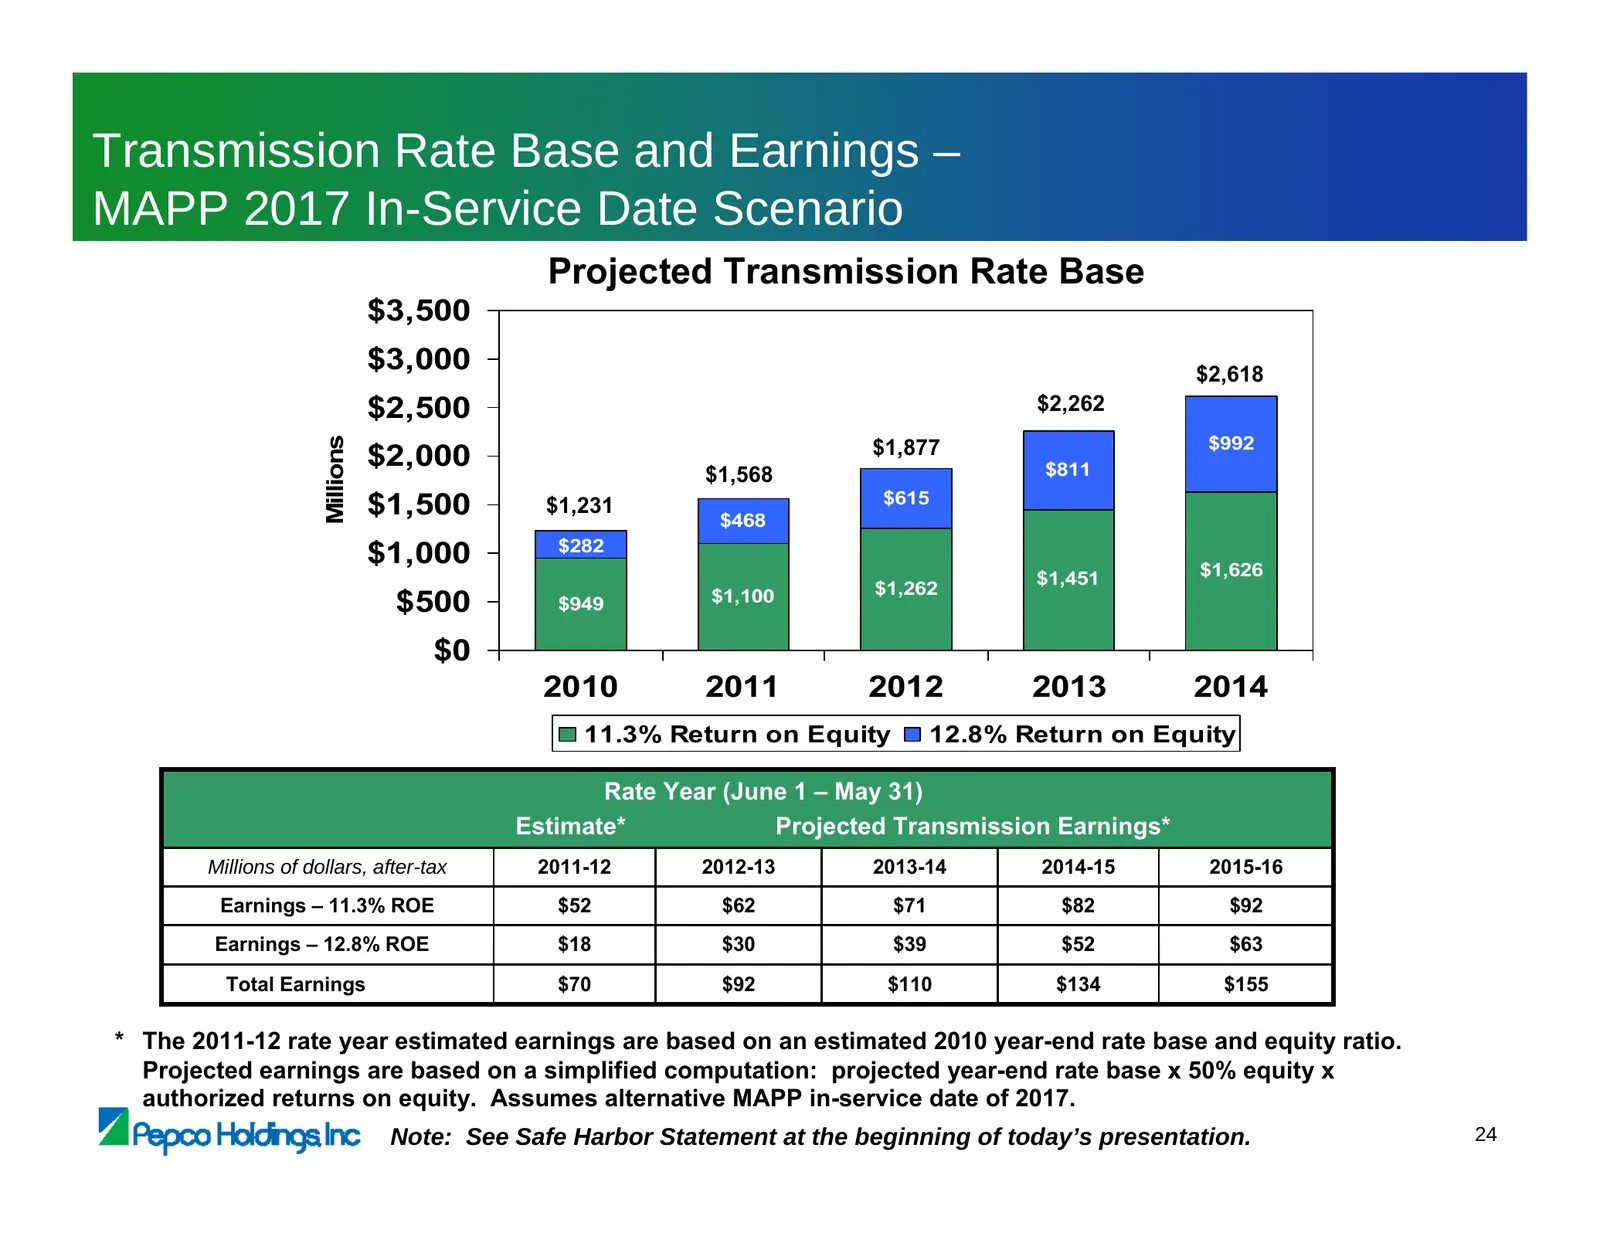
Slide 25: Transmission Rate Base and Earnings – MAPP 2017 In-Service Date Scenario
Transmission Rate Base and Earnings – MAPP 2017 In-Service Date Scenario Projected Transmission Rate Base $3,500 $3,000 $2,618 $2,500 $2,262 $992 Millions $2,000 $1,877 $1,568 $811 $615 $1,500 $1,231 $468 $282 $1,000 $1,626 $1,451 $1,262 $500 $949 $1,100 $0 2010 2011 2012 2013 2014 11.3% Return on E
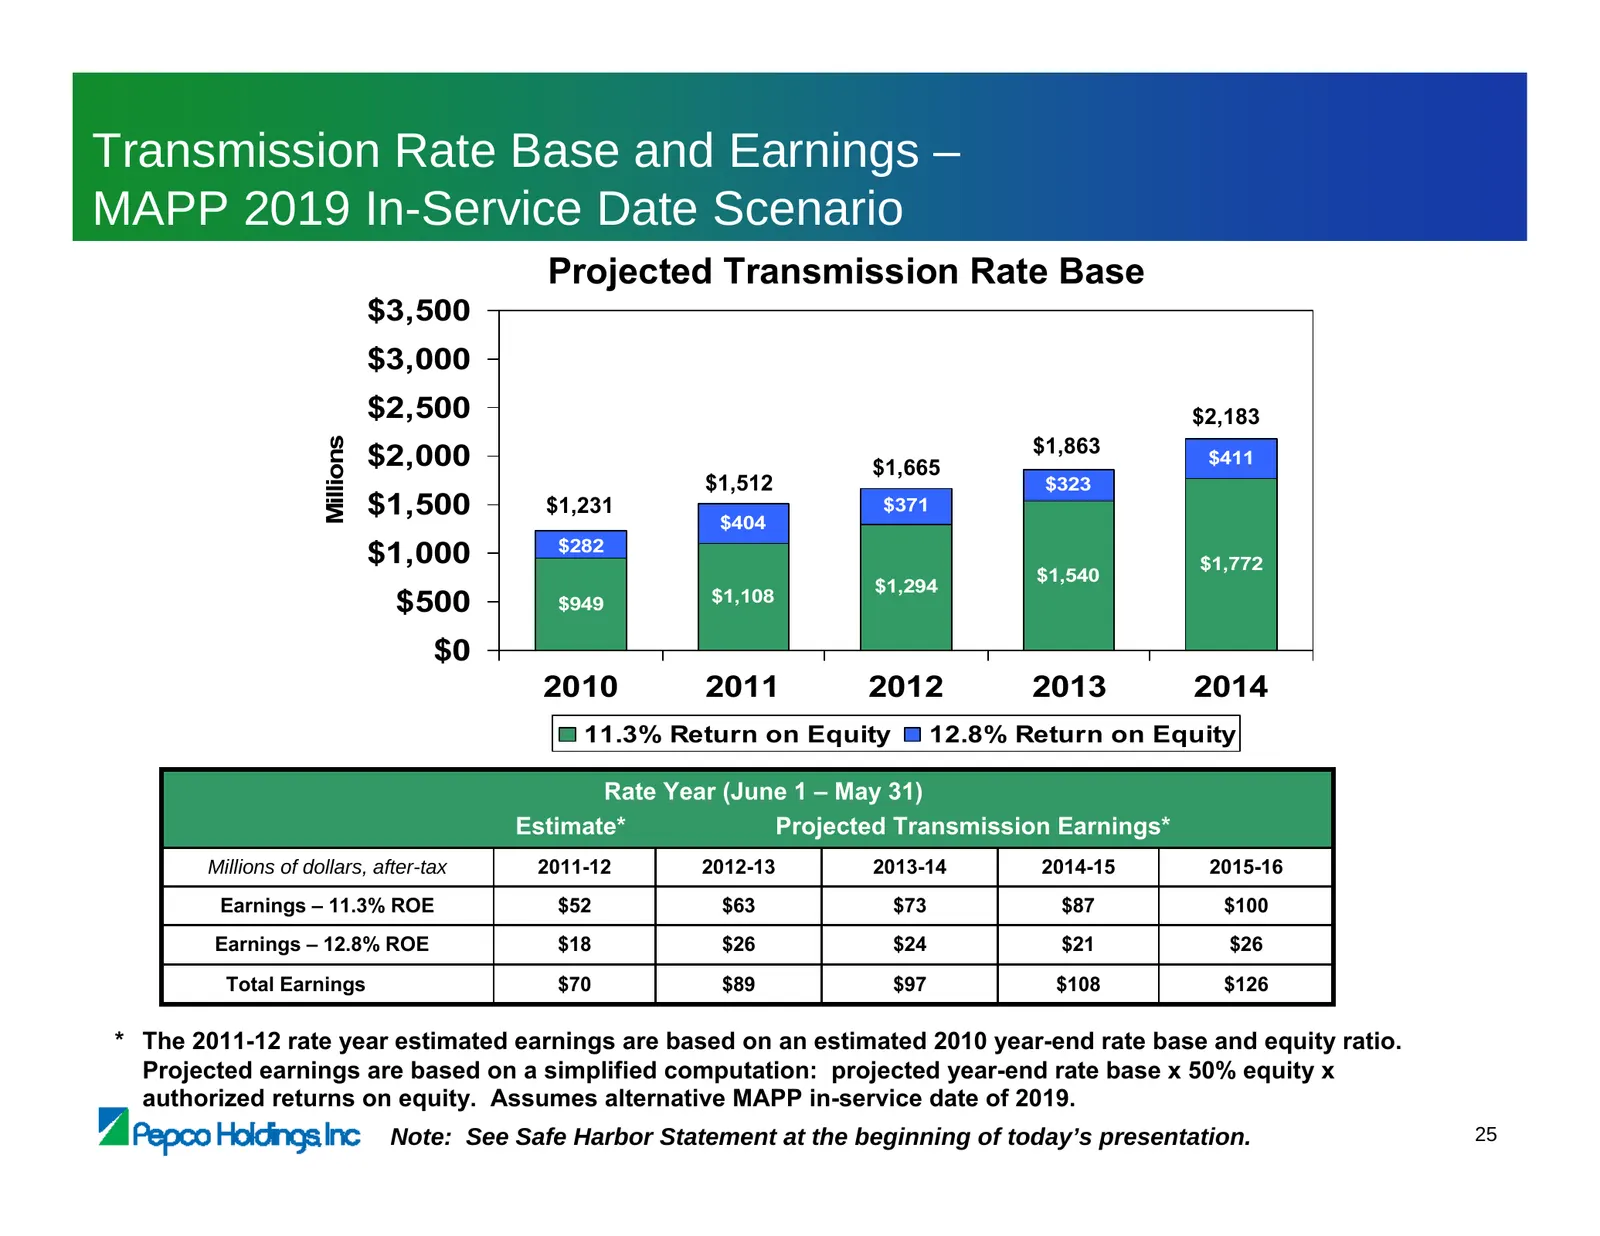
Slide 26: Transmission Rate Base and Earnings – MAPP 2019 In-Service Date Scenario
Transmission Rate Base and Earnings – MAPP 2019 In-Service Date Scenario Projected Transmission Rate Base $3,500 $3,000 $2,500 $2,183 $1,863 Millions $2,000 $1,665 $411 $1,512 $323 $1,500 $1,231 $404 $371 $282 $1,000 $1,772 $1,540 $1,294 $500 $949 $1,108 $0 2010 2011 2012 2013 2014 11.3% Return on E
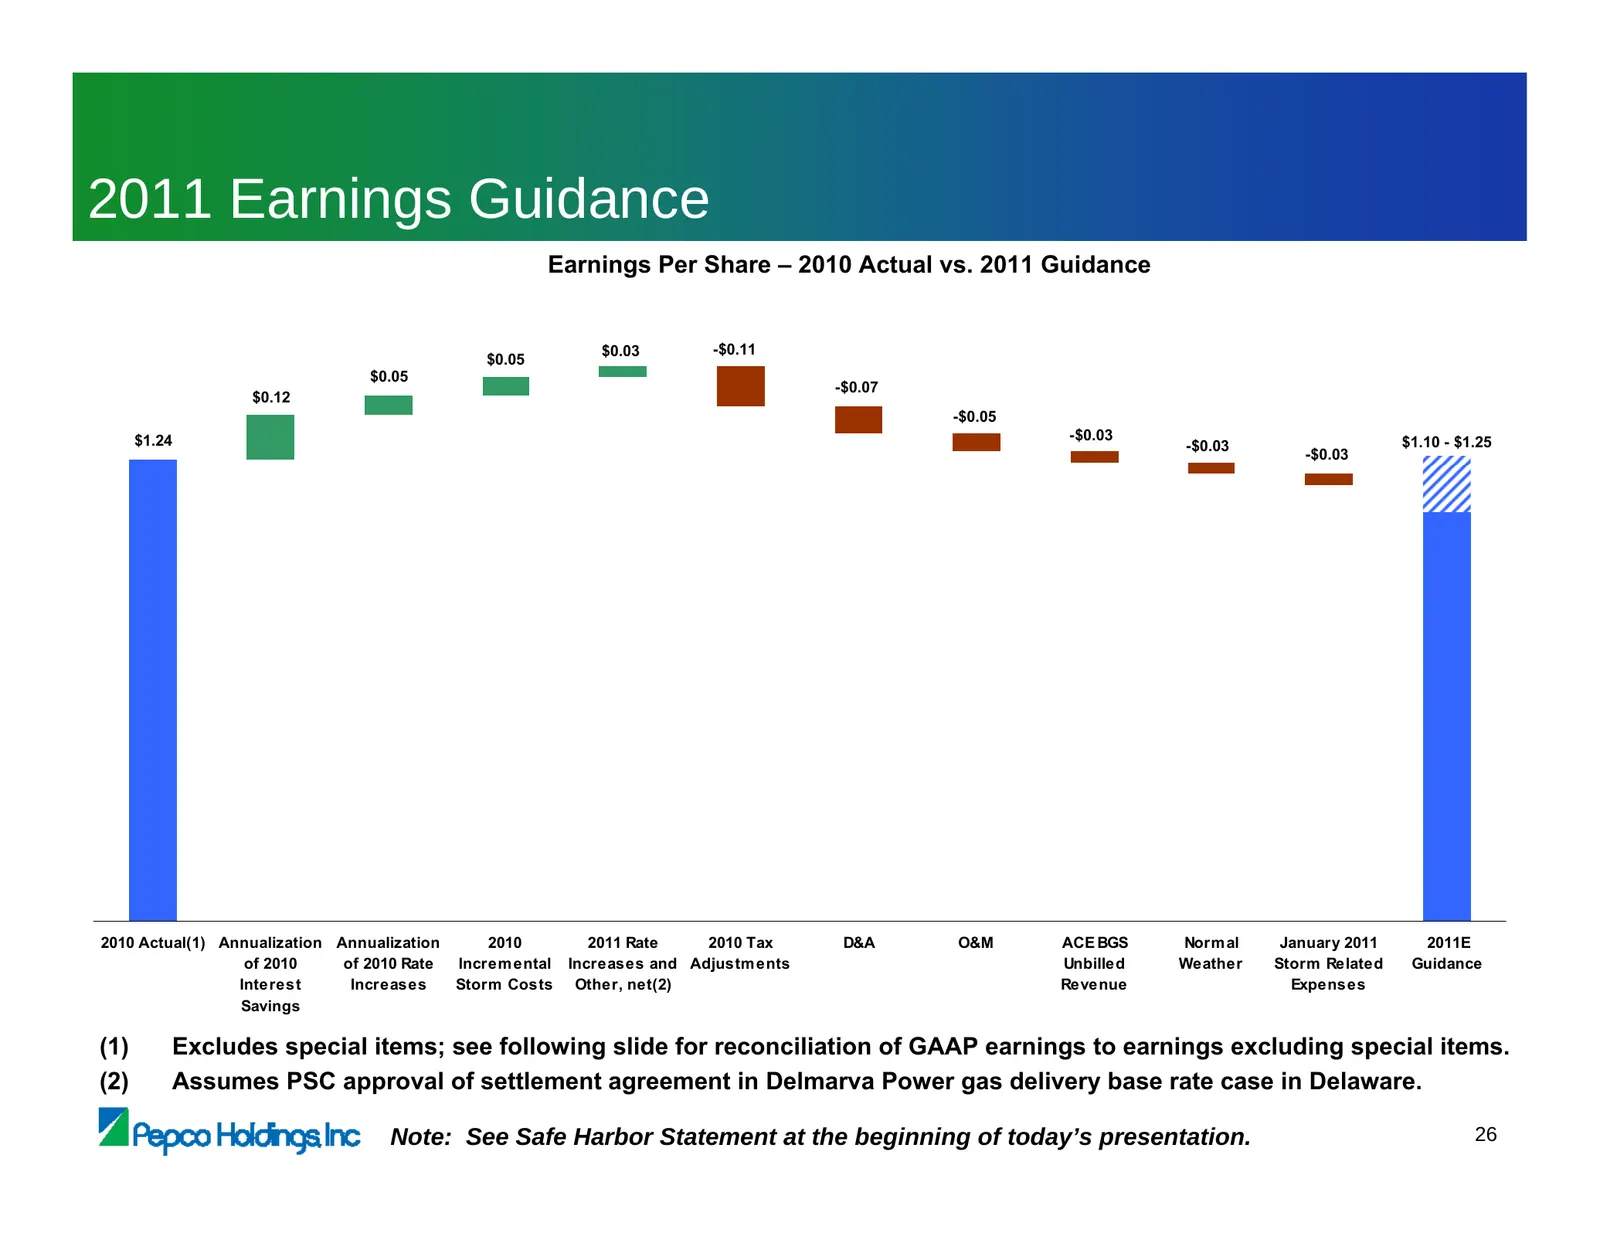
Slide 27: 2011 Earnings Guidance
2011 Earnings Guidance Earnings Per Share – 2010 Actual vs. 2011 Guidance $0.03 -$0.11 $0.05 $0.05 -$0.07 $0.12 -$0.05 $1.24 -$0.03 $1.10 - $1.25 -$0.03 -$0.03 2010 Actual(1) Annualization Annualization 2010 2011 Rate 2010 Tax D&A O&M ACE BGS Norm al January 2011 2011E of 2010 of 2010 Rate Increm en
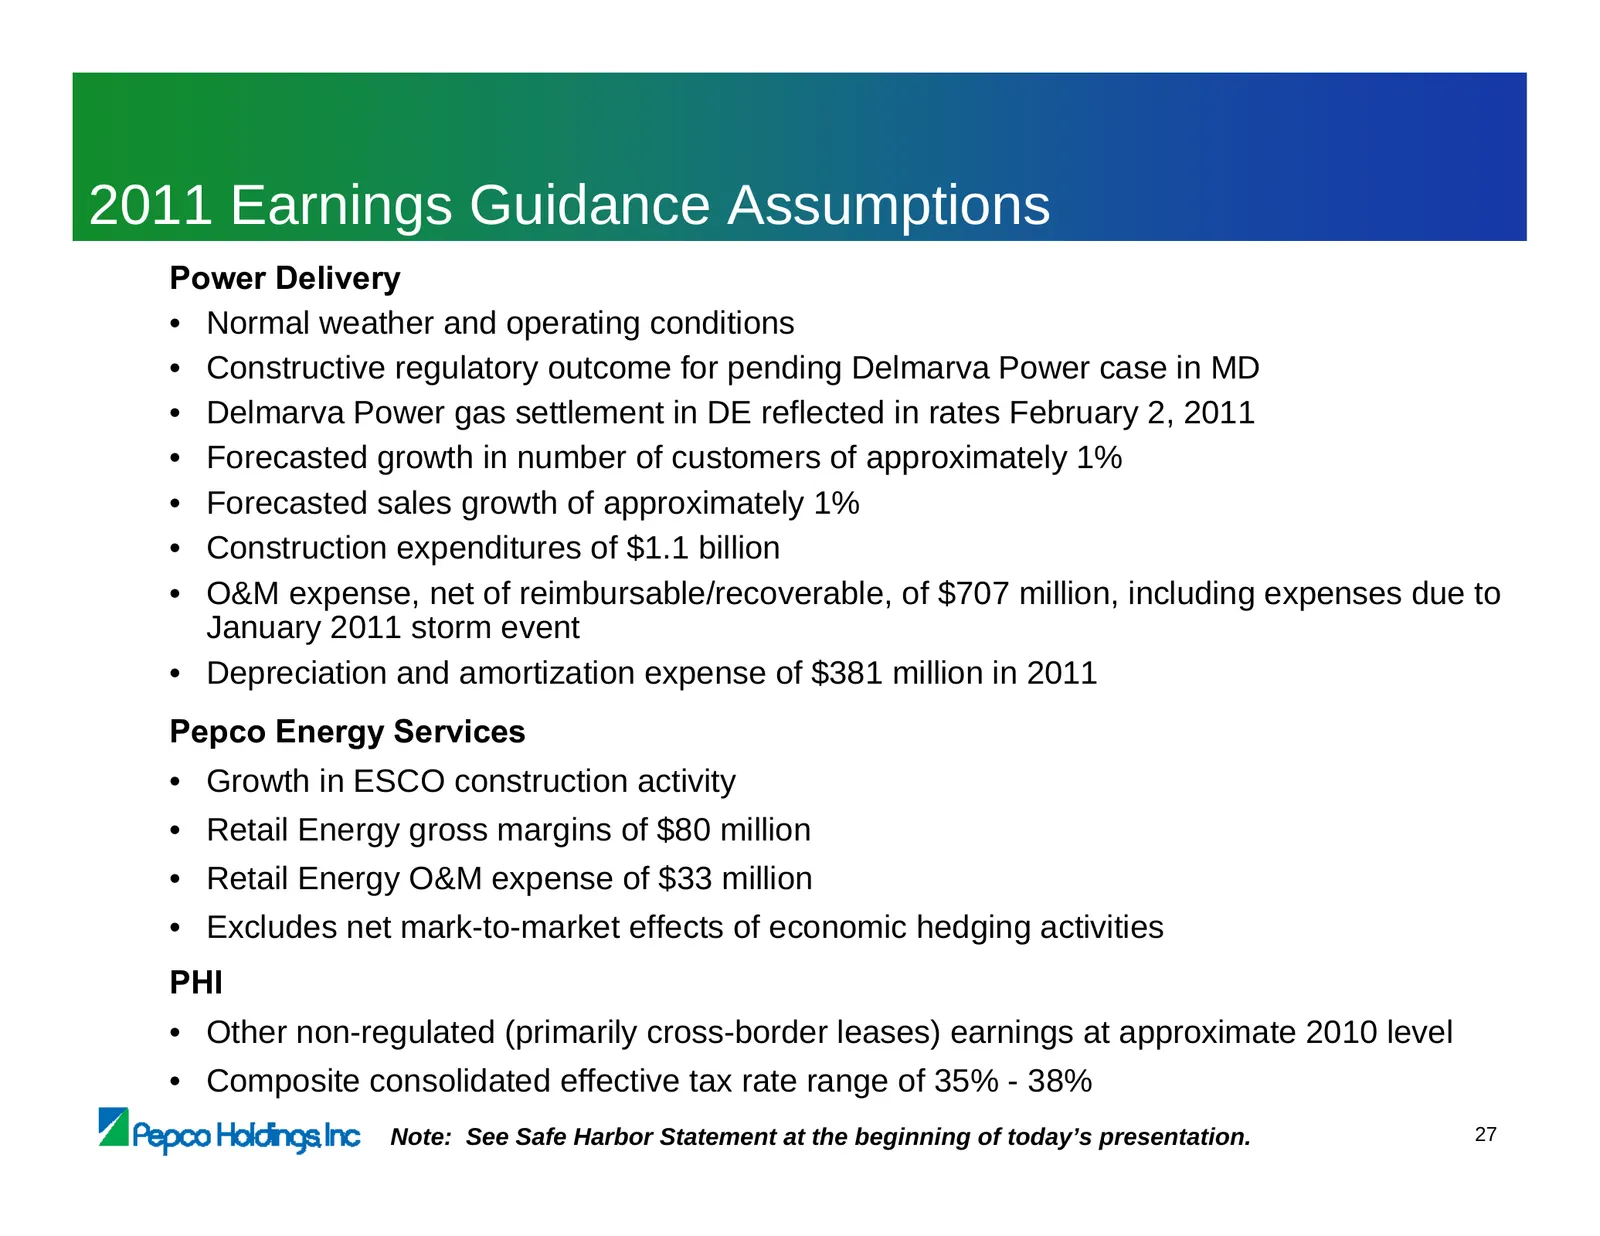
Slide 28: 2011 Earnings Guidance Assumptions
2011 Earnings Guidance Assumptions Power Delivery • Normal weather and operating conditions • Constructive regulatory outcome for pending Delmarva Power case in MD • Delmarva Power gas settlement in DE reflected in rates February 2, 2011 • Forecasted growth in number of customers of approximately 1%
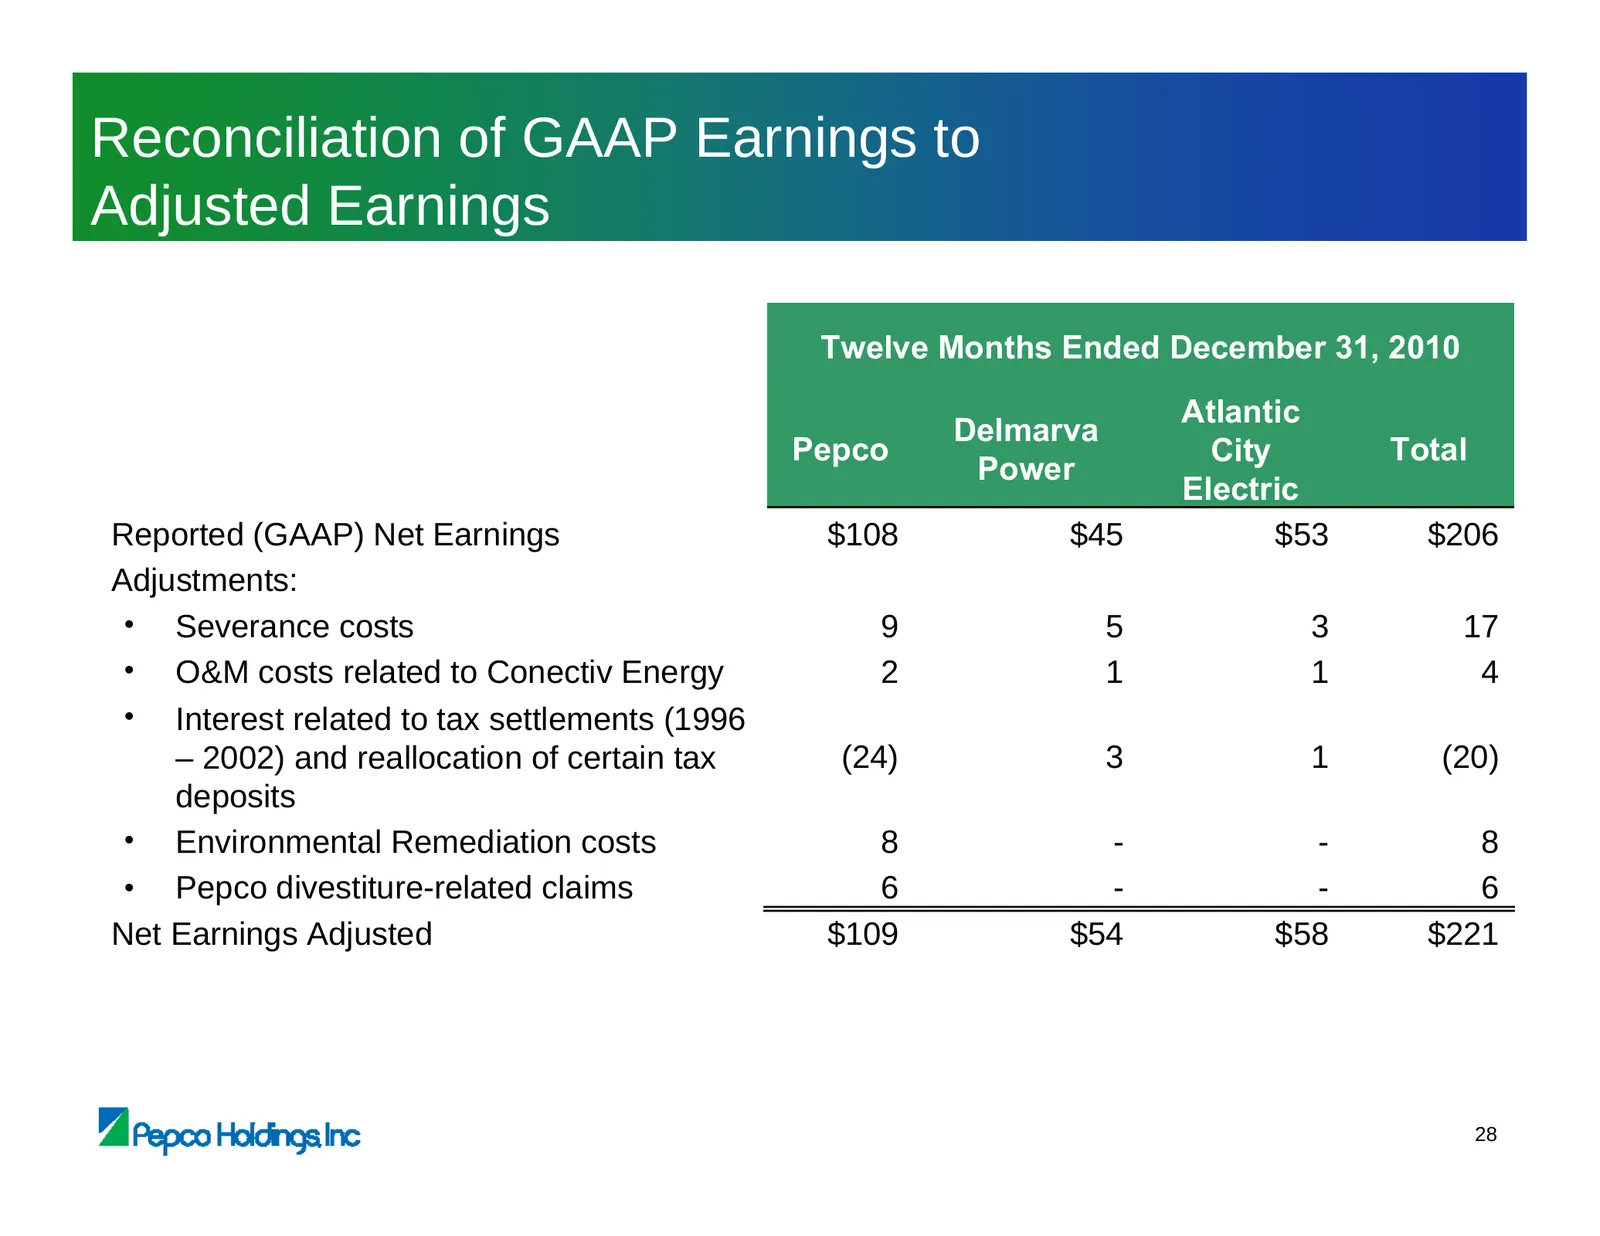
Slide 29: Reconciliation of GAAP Earnings to Adjusted Earnings
Reconciliation of GAAP Earnings to Adjusted Earnings Twelve Months Ended December 31, 2010 Atlantic Delmarva Pepco City Total Power Electric Reported (GAAP) Net Earnings $108 $45 $53 $206 Adjustments: • Severance costs 9 5 3 17 • O&M costs related to Conectiv Energy 2 1 1 4 • Interest related to tax
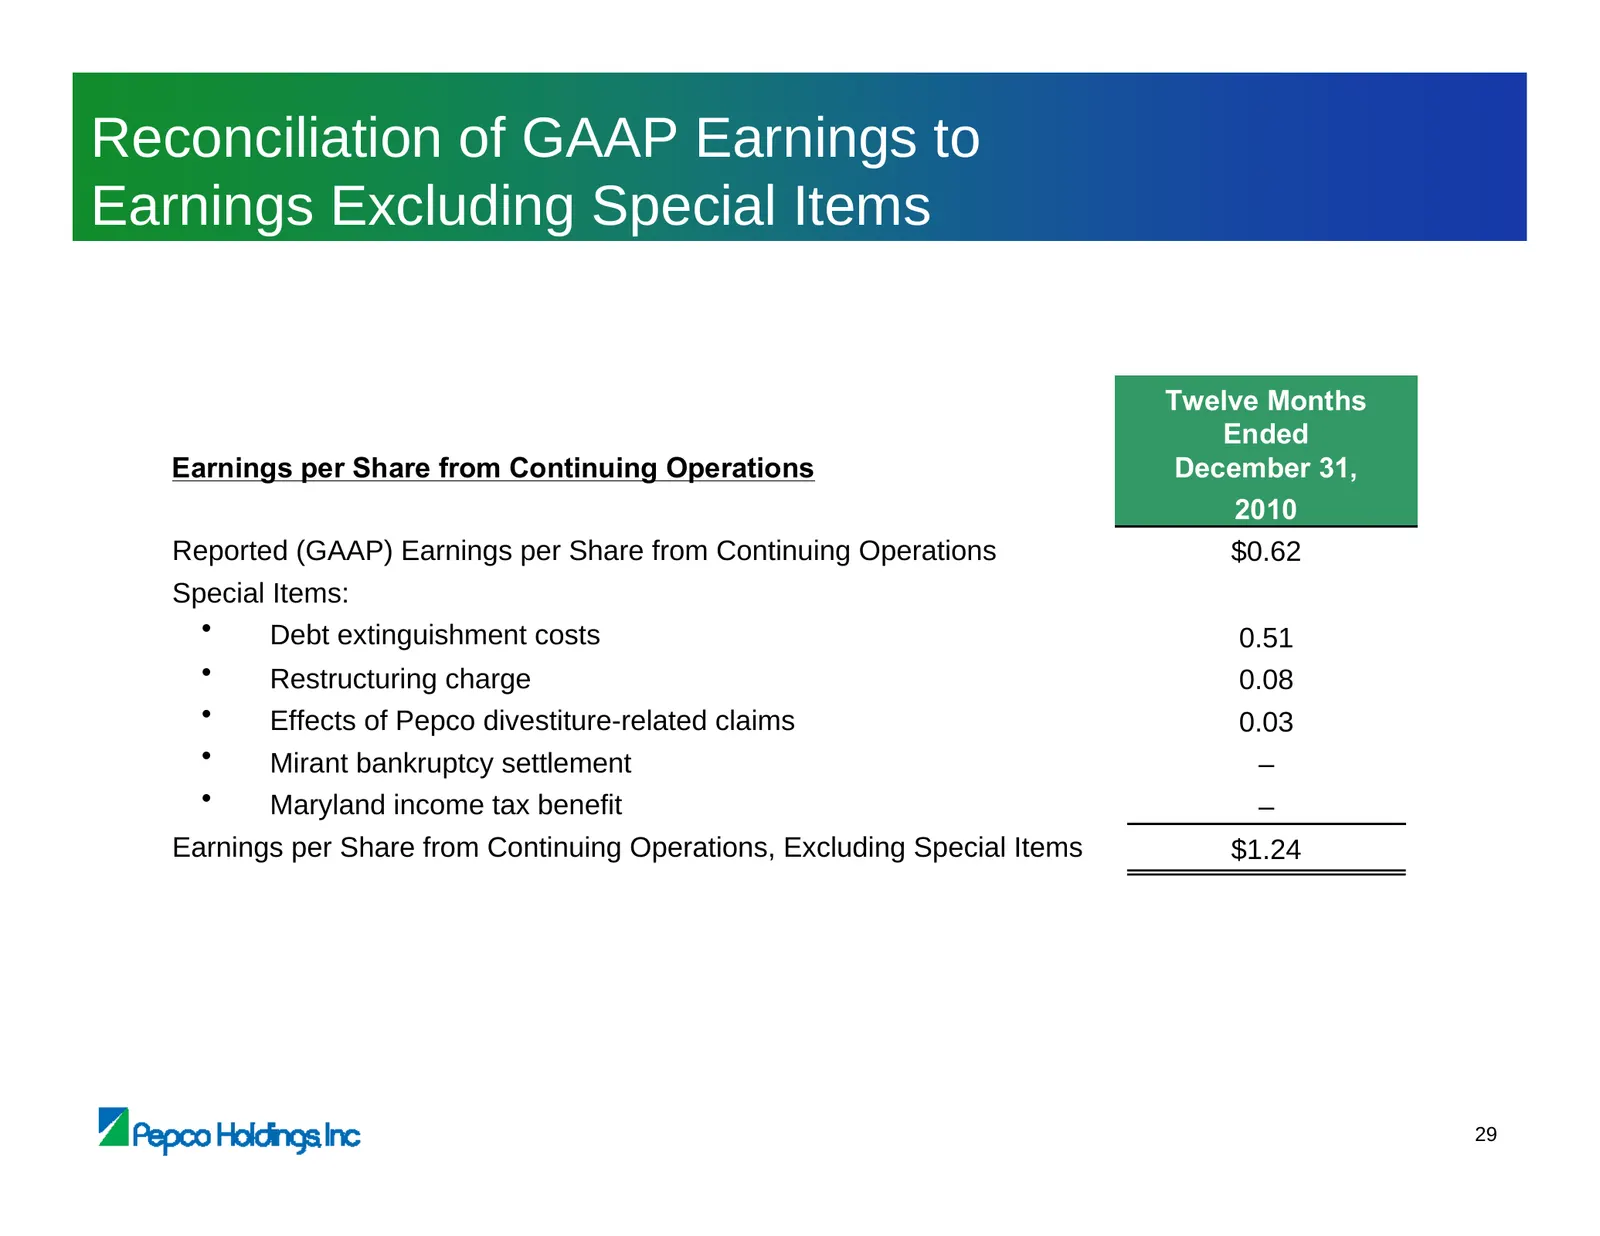
Slide 30: Reconciliation of GAAP Earnings to Earnings Excluding Special Items
Reconciliation of GAAP Earnings to Earnings Excluding Special Items Twelve Months Ended Earnings per Share from Continuing Operations December 31, 2010 Reported (GAAP) Earnings per Share from Continuing Operations $0.62 Special Items: • Debt extinguishment costs 0.51 • Restructuring charge 0.08 • Ef
Source: SEC EDGAR · 8-K filed Jun 24, 2011
More decks from Pepco Holdings Inc
 Merger or Acquisition (August 2014)15 slides · Aug 19, 2014
 Merger or Acquisition (May 2014)44 slides · May 23, 2014
 Q1 2014 Earnings Presentation14 slides · May 7, 2014
 Williams Capital Group Midwest Utilities Seminar (April 2014)35 slides · Apr 9, 2014
 Investor Day (March 2014)109 slides · Mar 21, 2014
 Morgan Stanley Utilities Conference 201439 slides · Feb 28, 2014