Essex Property Trust, Inc. · NYSE:ESS
Essex Property Trust — Citi Conference March 2024
39 slides from Essex Property Trust's conference presentation, March 2024

Slide 1: Investor Presentation March 2024
INVESTOR PRESENTATION Station Park Green | San Mateo, CA MARCH 2024 LIVIA at Scripps Ranch San Diego, CA
Slide 2: Table of Contents
TABLE OF CONTENTS 3 Company Highlights & Track Record 10 Portfolio Overview 14 Key Company Updates 18 West Coast Demand Fundamentals 22 West Coast Supply Fundamentals 26 Guidance & Balance Sheet 30 ESG Highlights 33 Definitions & Reconciliations 2
Slide 3: Company Highlights & Track Record
COMPANY HIGHLIGHTS & TRACK RECORD The Hallie Pasadena, CA 3
Slide 4: Corporate Highlights
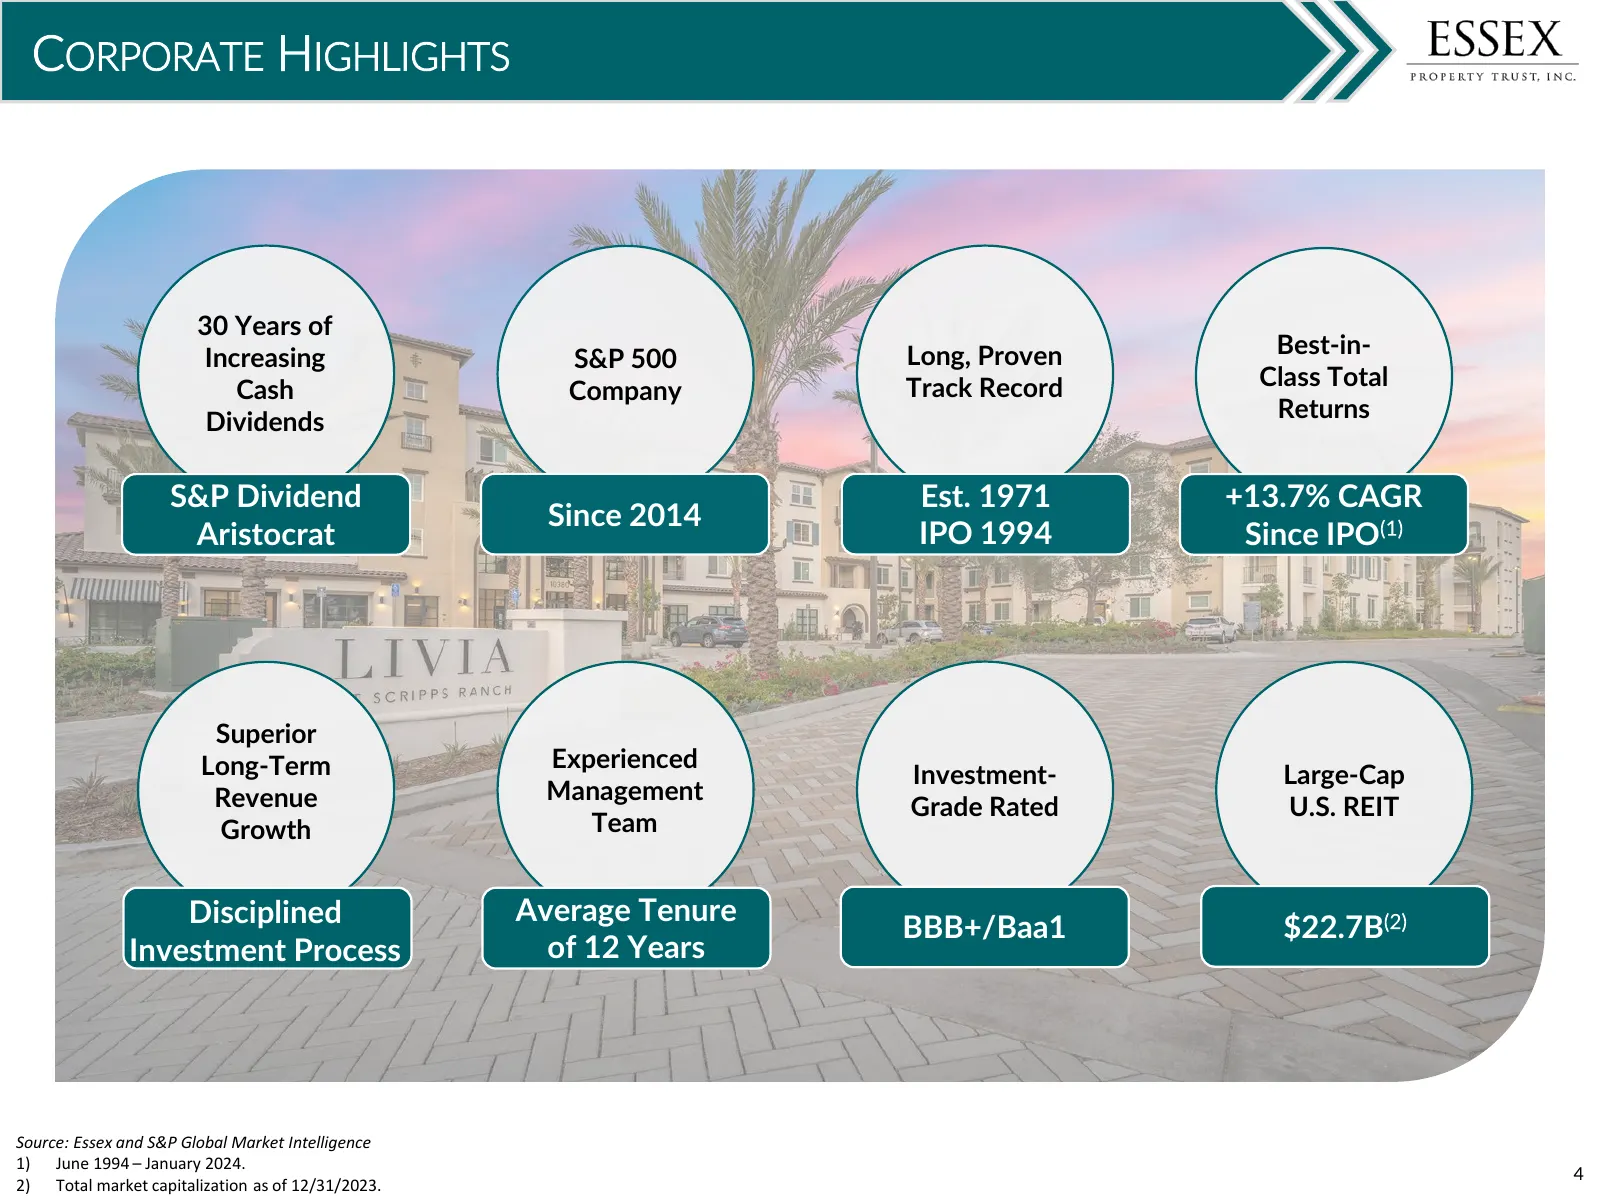
CORPORATE HIGHLIGHTS 30 Years of Increasing Long, Proven Best-in- S&P 500 Cash Track Record Class Total Company Dividends Returns S&P Dividend Est. 1971 +13.7% CAGR Since 2014 Aristocrat IPO 1994 Since IPO Superior Long-Term Experienced Investment- Large-Cap Revenue Management Grade Rated U.S. REIT
Slide 5: Total Returns Outperform
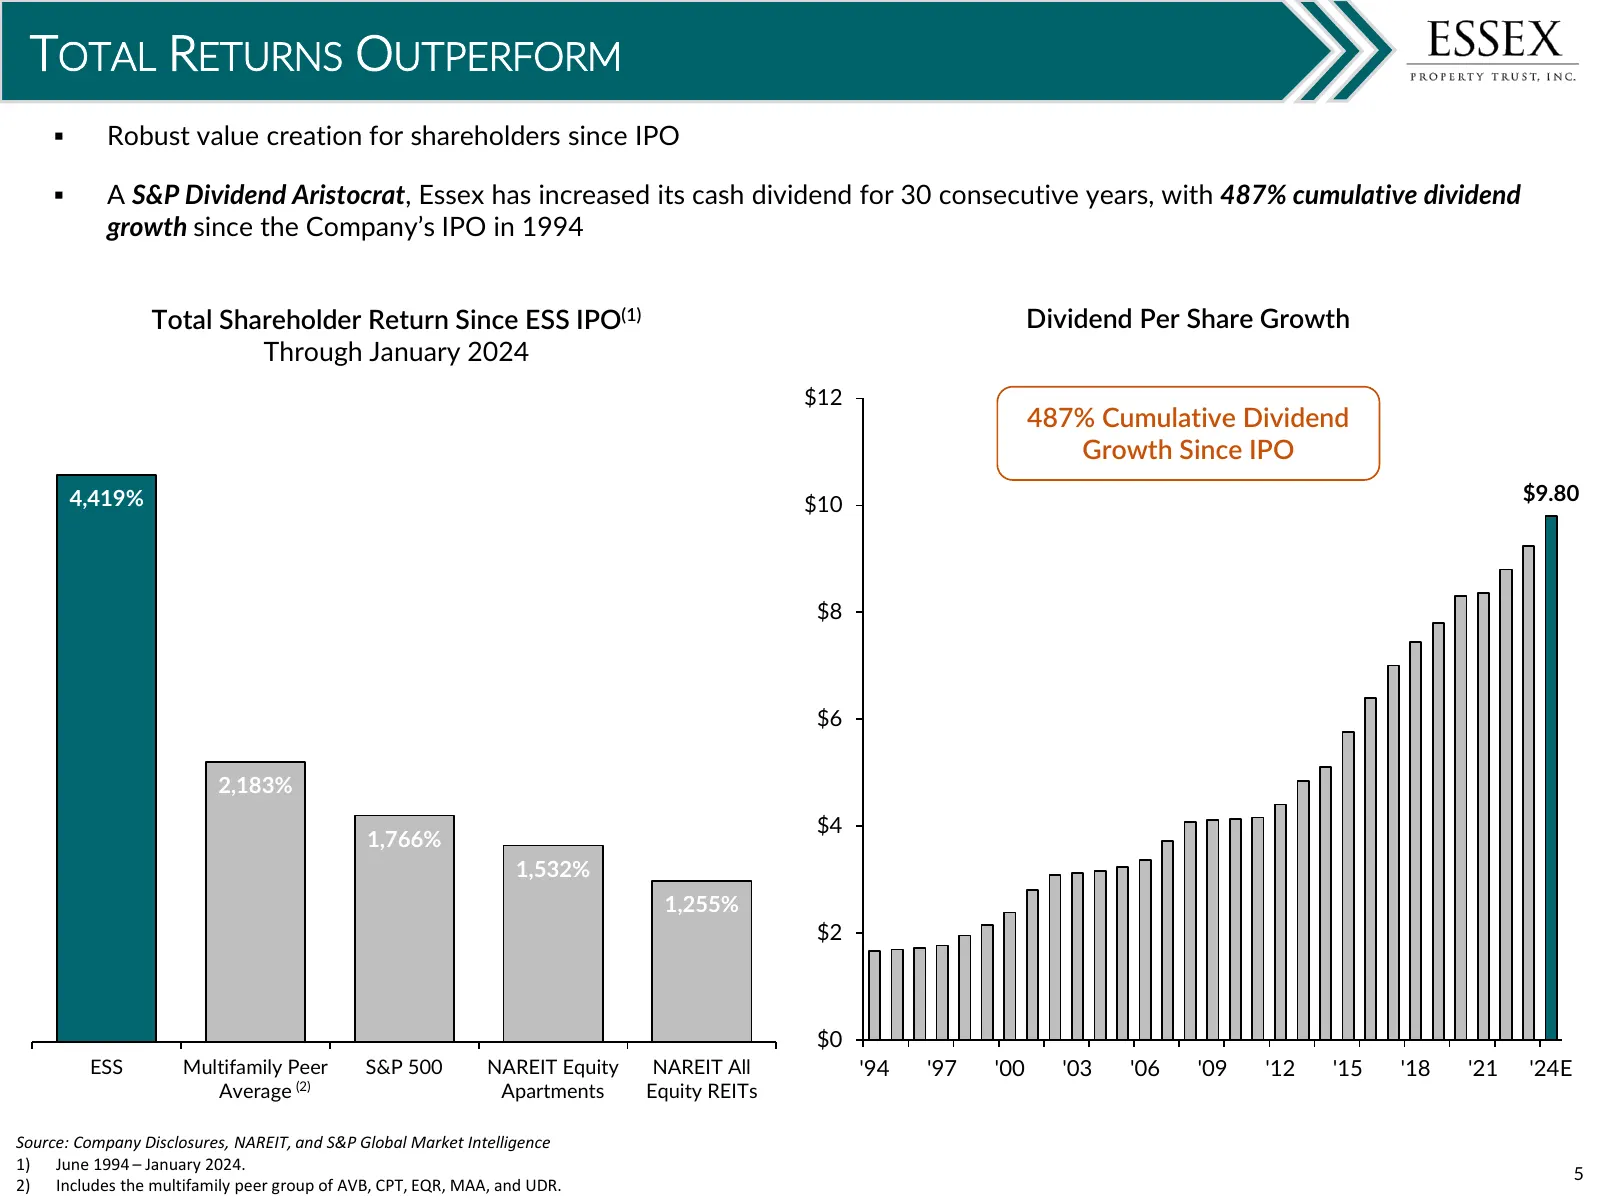
TOTAL RETURNS OUTPERFORM Robust value creation for shareholders since IPO A S&P Dividend Aristocrat, Essex has increased its cash dividend for 30 consecutive years, with 487% cumulative dividend growth since the Company’s IPO in 1994 Total Shareholder Return Since ESS IPO(1) Dividend Per Share G
Slide 6: Core Metrics Outperform
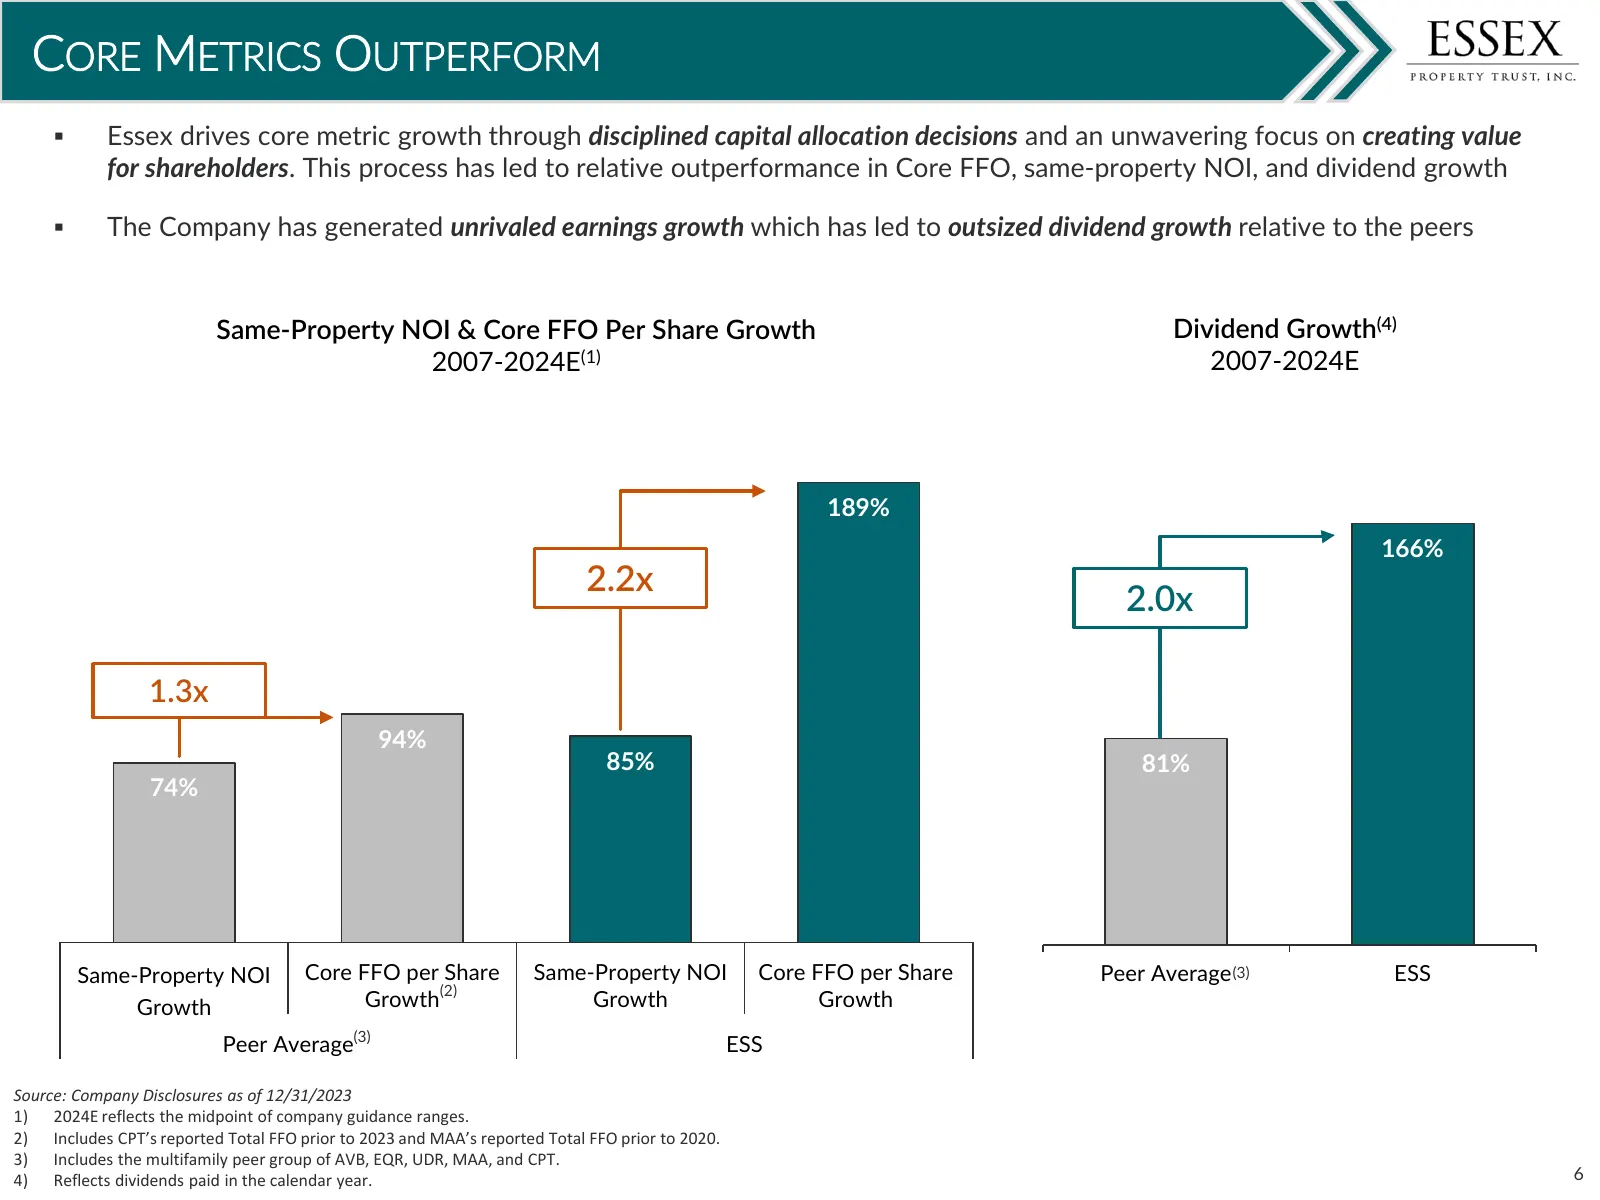
CORE METRICS OUTPERFORM Essex drives core metric growth through disciplined capital allocation decisions and an unwavering focus on creating value for shareholders. This process has led to relative outperformance in Core FFO, same-property NOI, and dividend growth The Company has generated unriv
Slide 7: Key Drivers of Value Creation
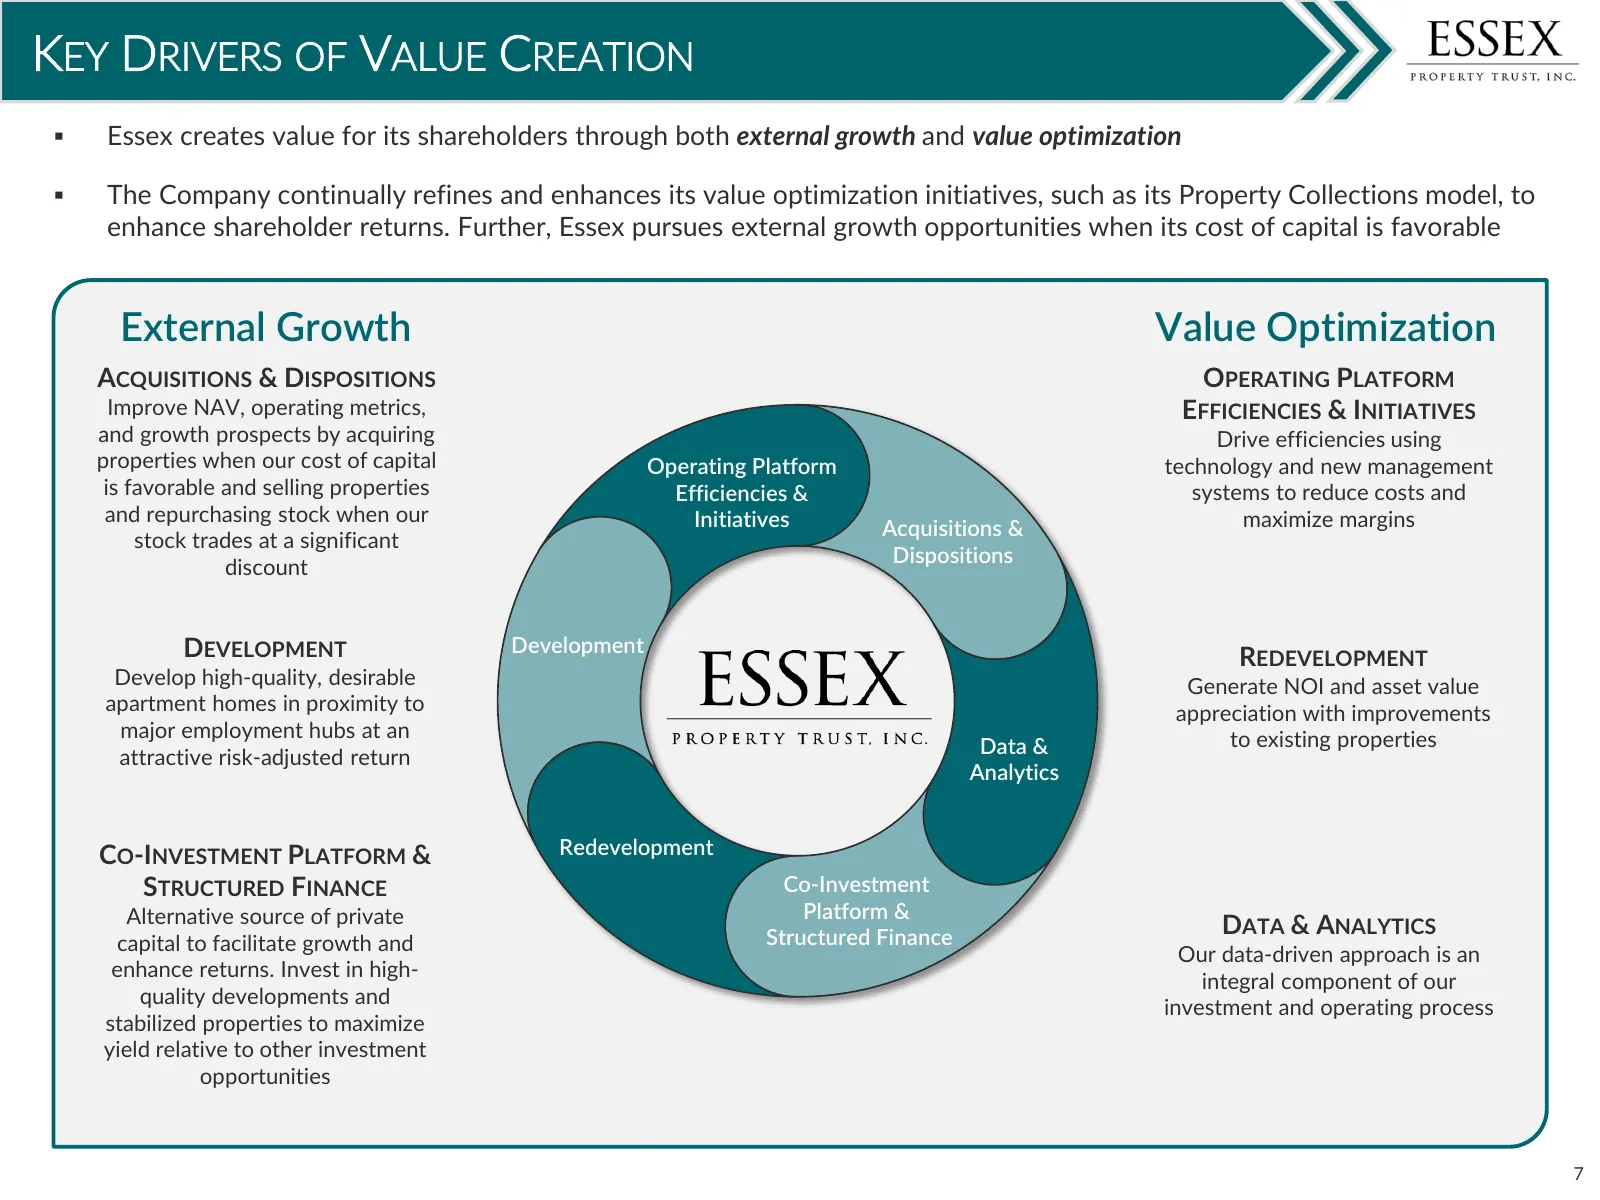
KEY DRIVERS OF VALUE CREATION Essex creates value for its shareholders through both external growth and value optimization The Company continually refines and enhances its value optimization initiatives, such as its Property Collections model, to enhance shareholder returns. Further, Essex pursu
Slide 8: Disciplined Capital Allocation Record
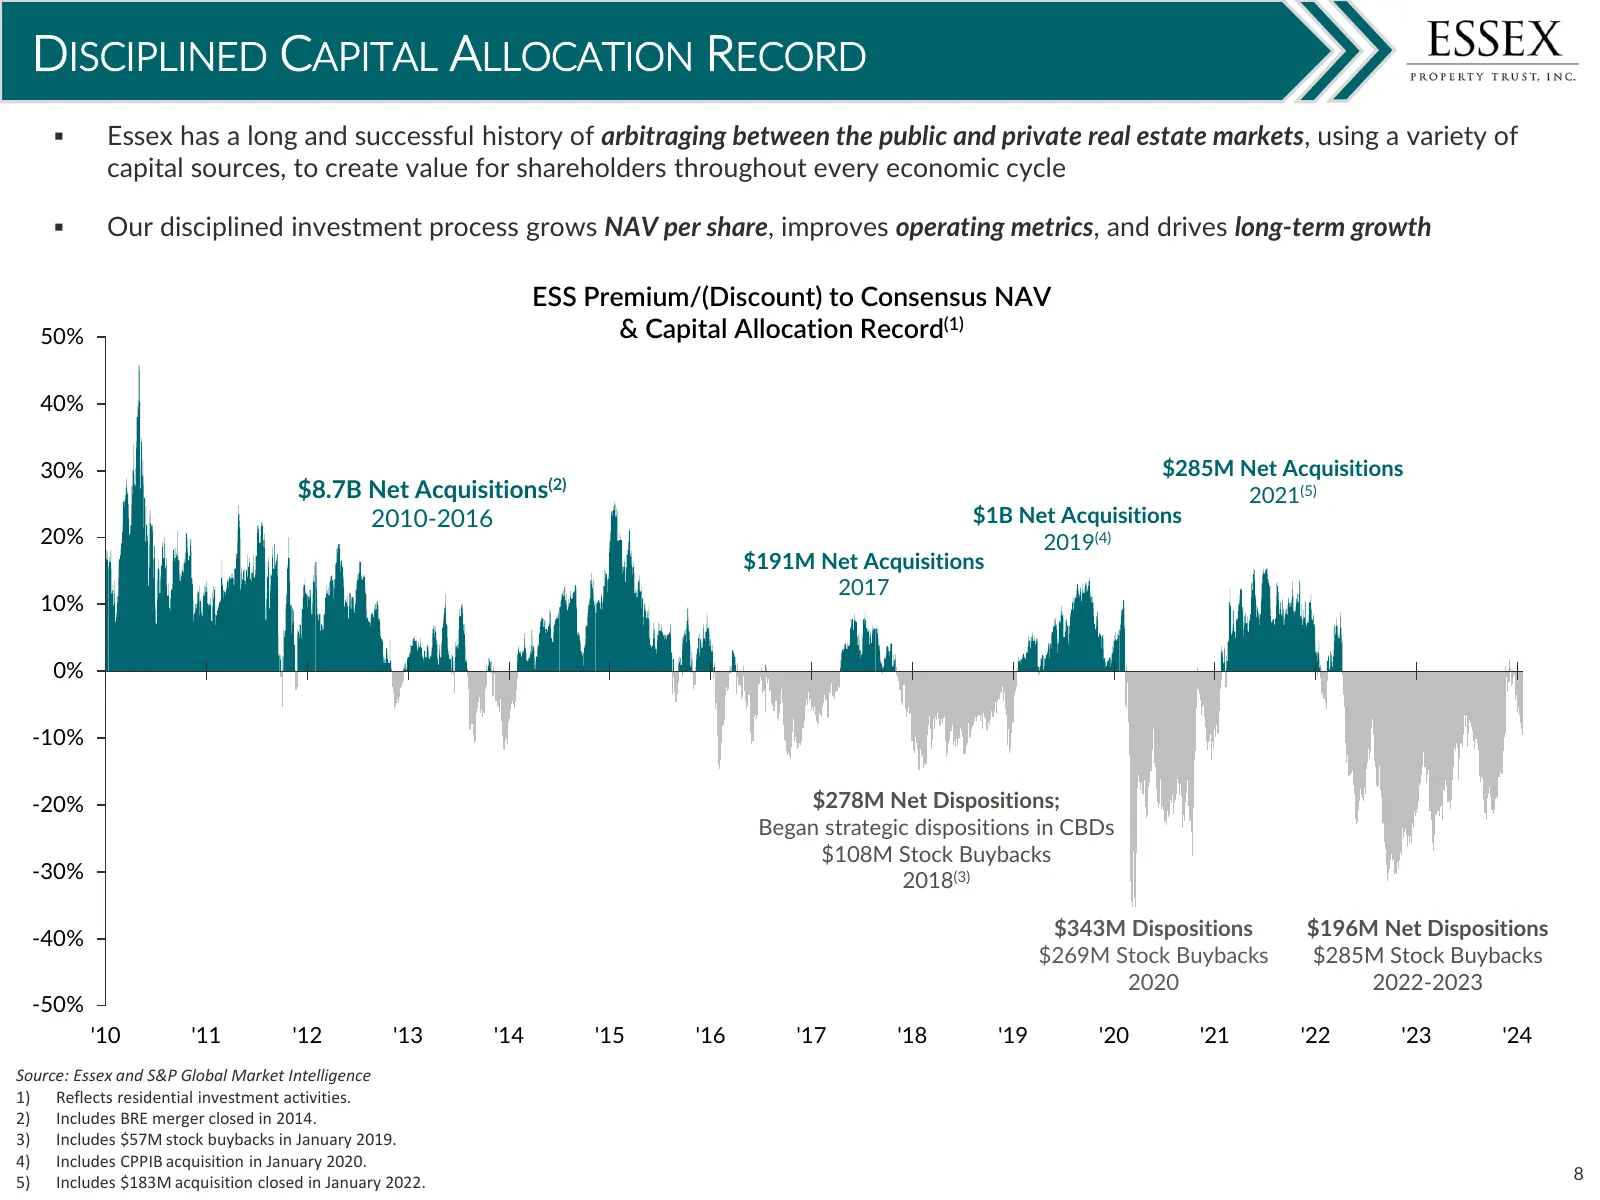
DISCIPLINED CAPITAL ALLOCATION RECORD Essex has a long and successful history of arbitraging between the public and private real estate markets, using a variety of capital sources, to create value for shareholders throughout every economic cycle Our disciplined investment process grows NAV per s
Slide 9: Value Optimization
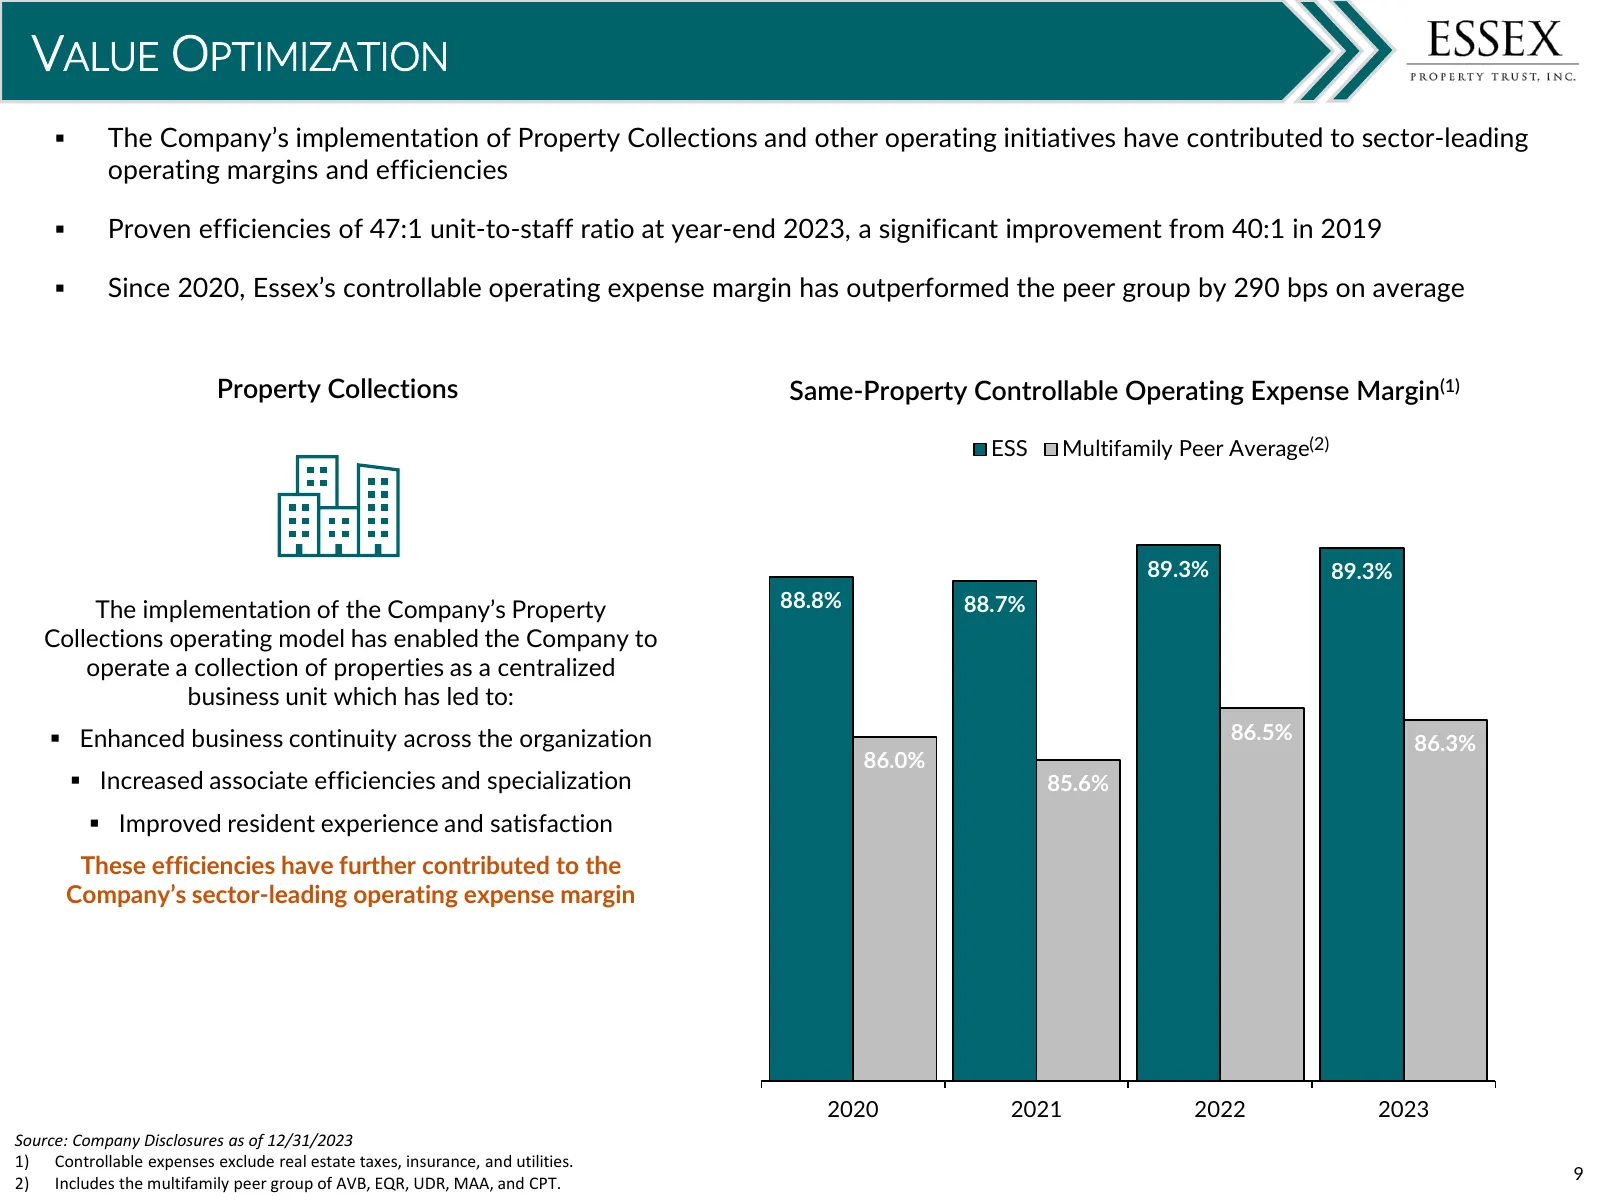
VALUE OPTIMIZATION The Company’s implementation of Property Collections and other operating initiatives have contributed to sector-leading operating margins and efficiencies Proven efficiencies of 47:1 unit-to-staff ratio at year-end 2023, a significant improvement from 40:1 in 2019 Since 2020

Slide 10: Portfolio Overview
PORTFOLIO OVERVIEW Emerald Ridge Bellevue, WA 10
Slide 11: Portfolio Overview
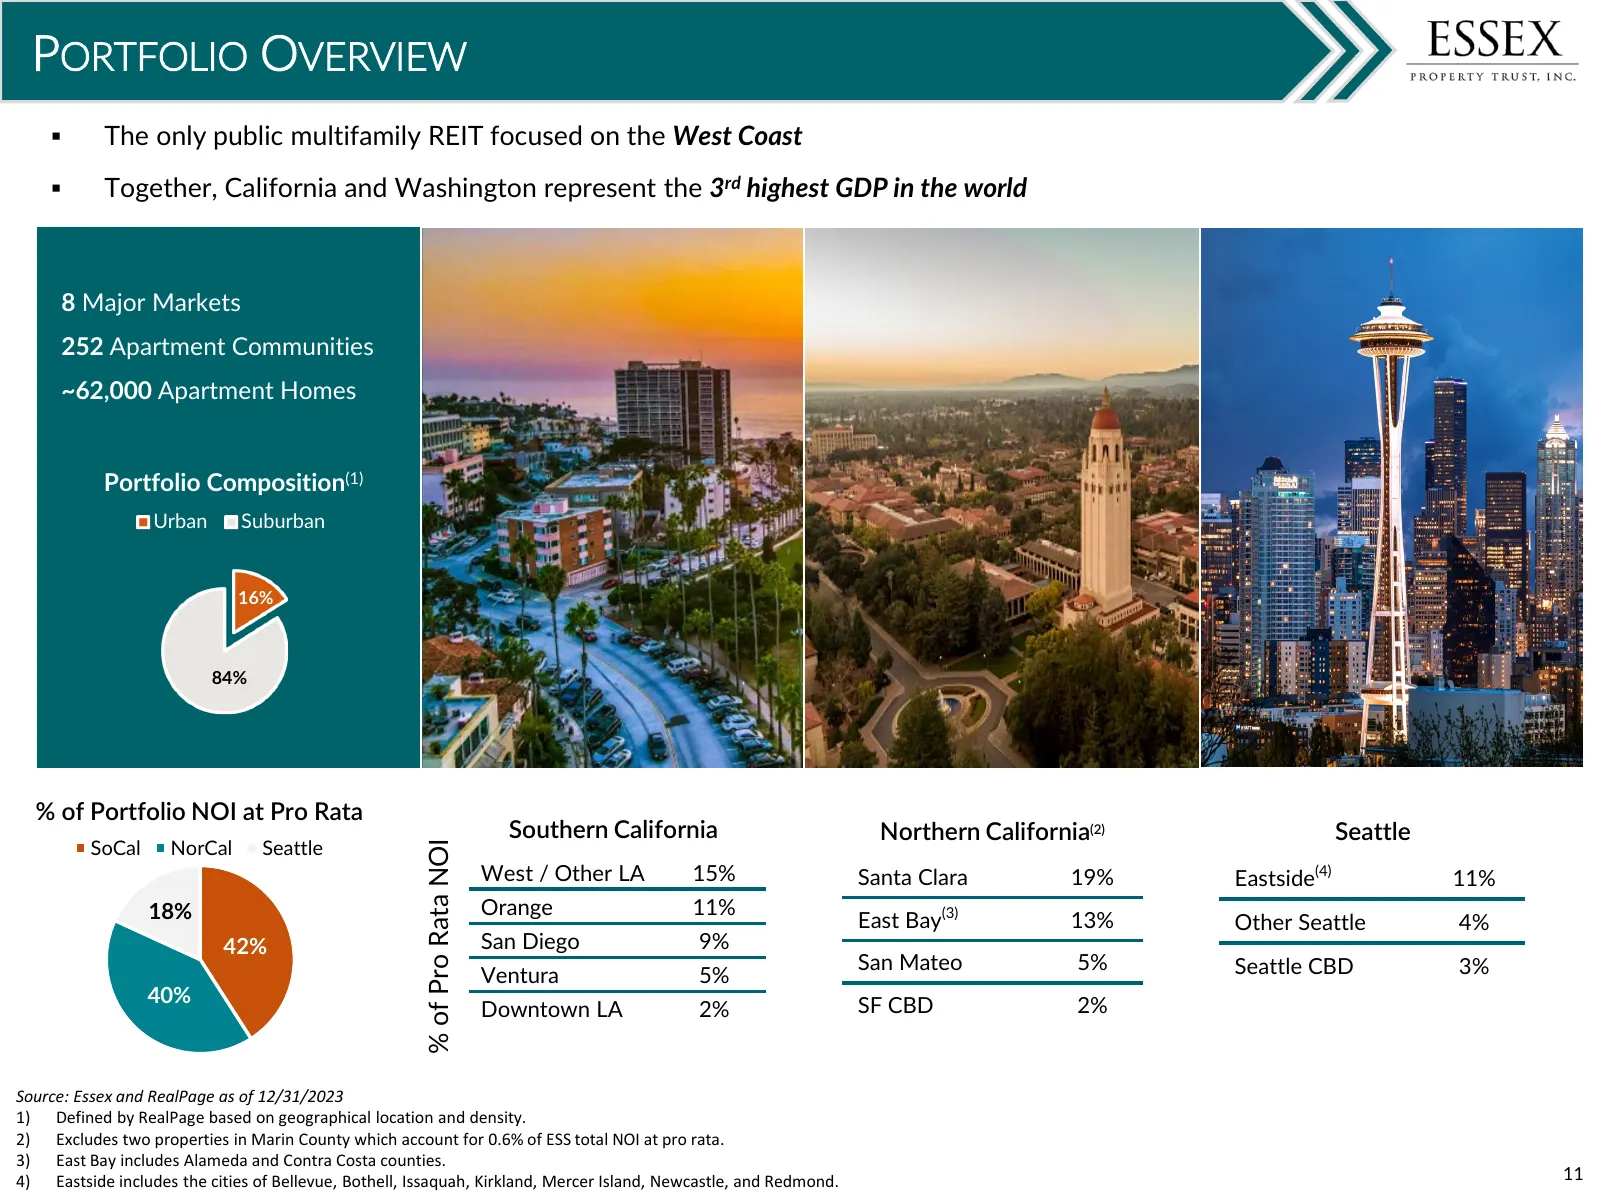
PORTFOLIO OVERVIEW The only public multifamily REIT focused on the West Coast Together, California and Washington represent the 3rd highest GDP in the world 8 Major Markets 252 Apartment Communities ~62,000 Apartment Homes Portfolio Composition(1) Urban Suburban 16% 84% % of Portfolio NOI at Pro
Slide 12: Property Maps and Key Market Statistics
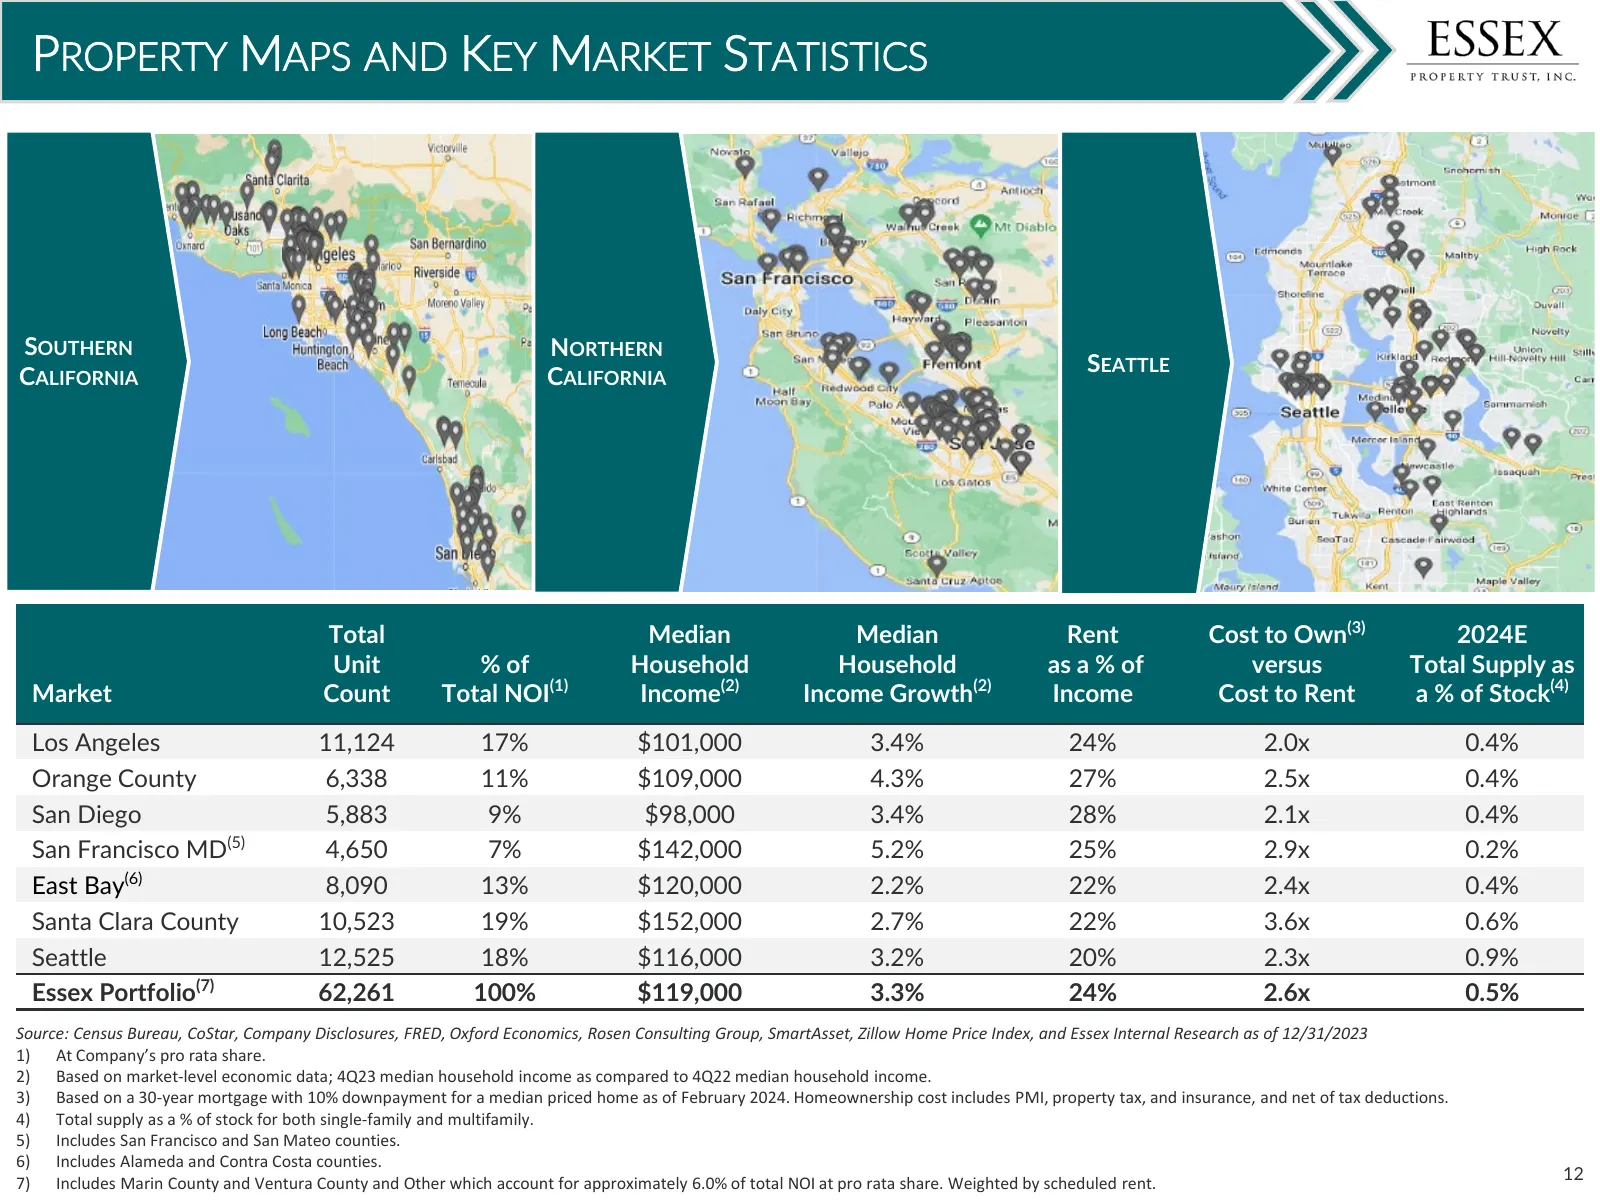
PROPERTY MAPS AND KEY MARKET STATISTICS SOUTHERN NORTHERN SEATTLE CALIFORNIA CALIFORNIA Total Median Median Rent Cost to Own(3) 2024E Unit % of Household Household as a % of versus Total Supply as Market Count Total NOI(1) Income(2) Income Growth(2) Income Cost to Rent a % of Stock(4) Los Angeles 11
Slide 13: West Coast Investment Thesis
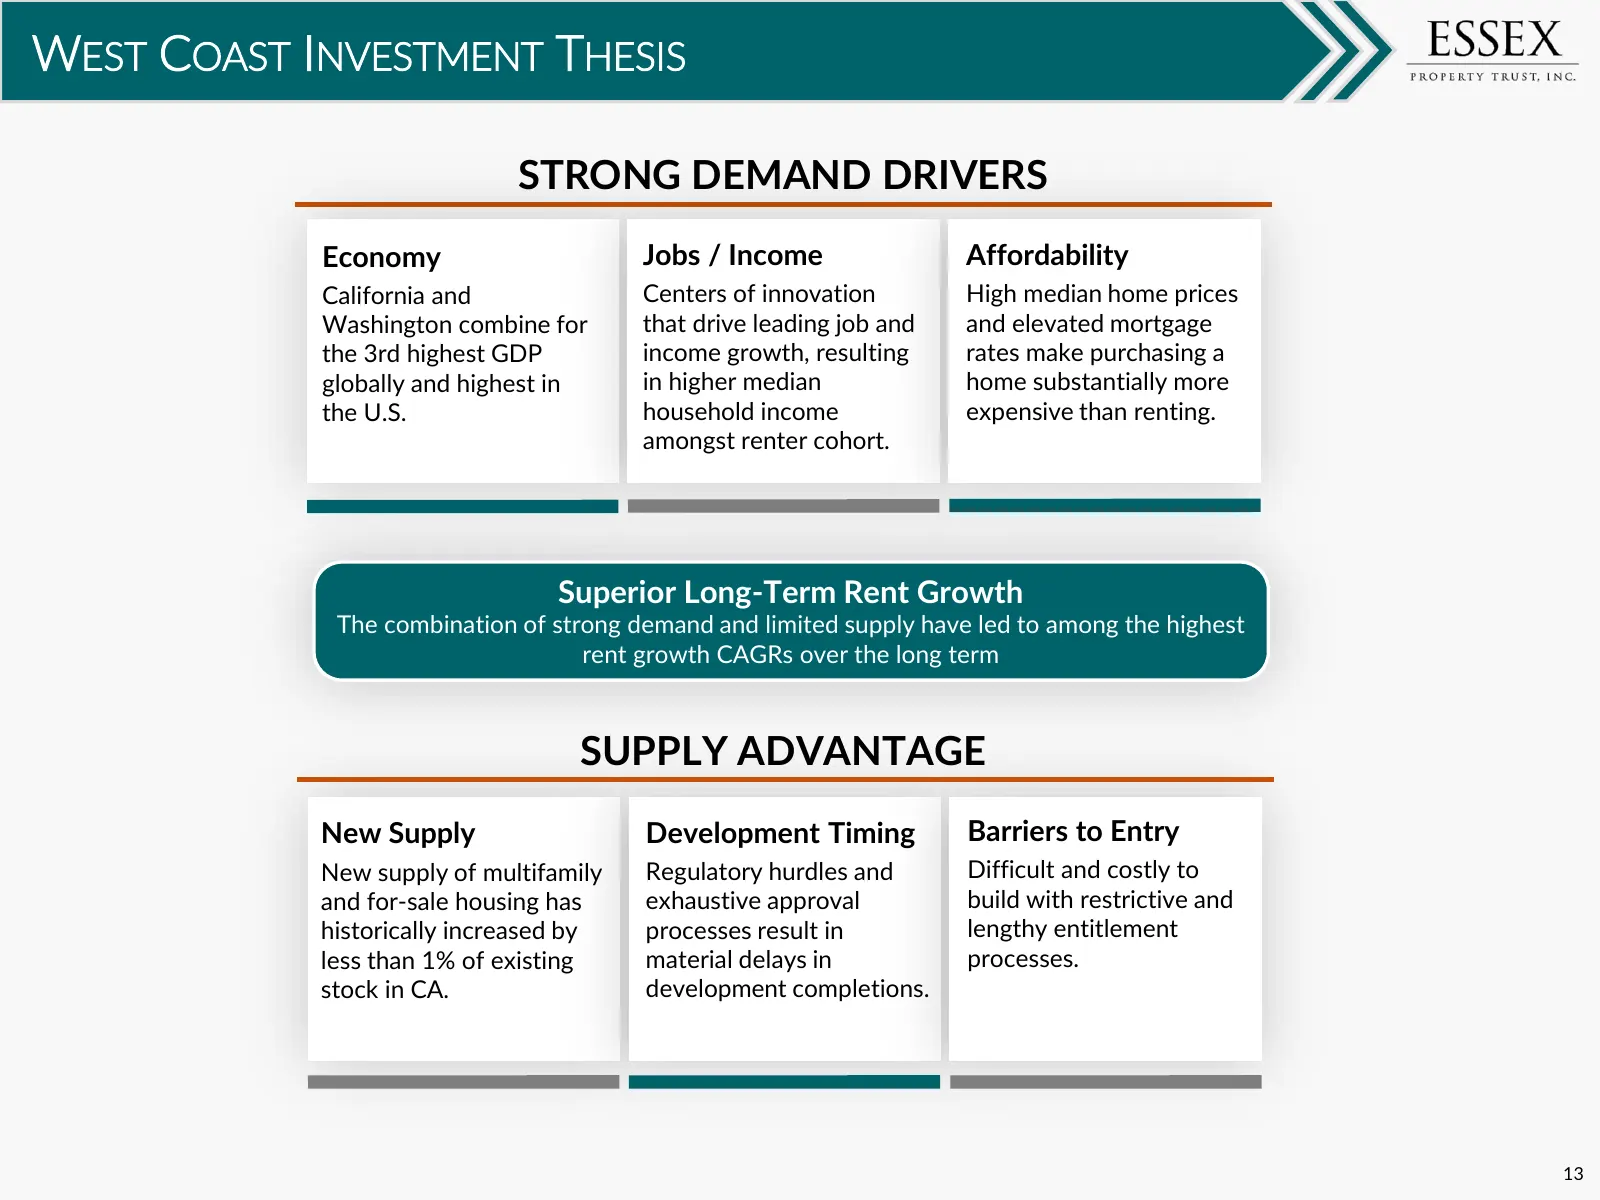
WEST COAST INVESTMENT THESIS STRONG DEMAND DRIVERS Economy Jobs / Income Affordability California and Centers of innovation High median home prices Washington combine for that drive leading job and and elevated mortgage the 3rd highest GDP income growth, resulting rates make purchasing a globally an

Slide 14: Key Company Updates
KEY COMPANY UPDATES 777 Hamilton Menlo Park, CA 14
Slide 15: Operating Update
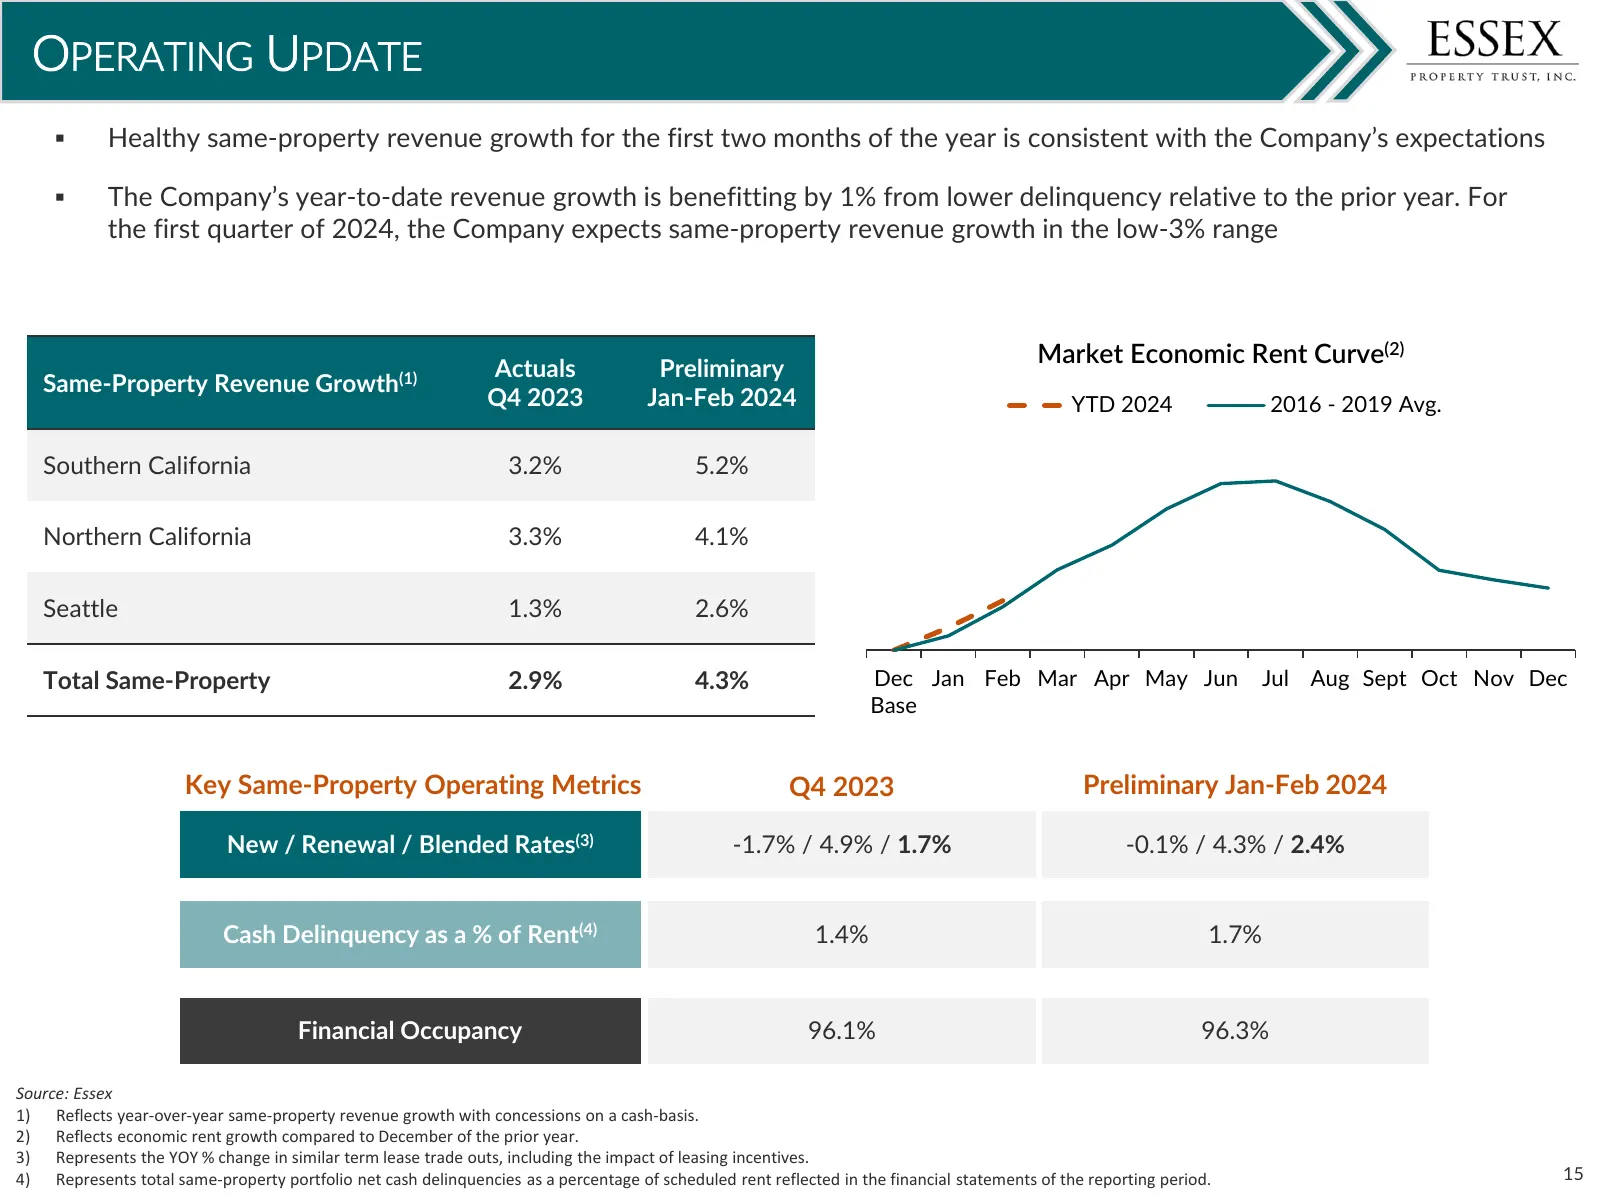
OPERATING UPDATE Healthy same-property revenue growth for the first two months of the year is consistent with the Company’s expectations The Company’s year-to-date revenue growth is benefitting by 1% from lower delinquency relative to the prior year. For the first quarter of 2024, the Company ex
Slide 16: Delinquency Update
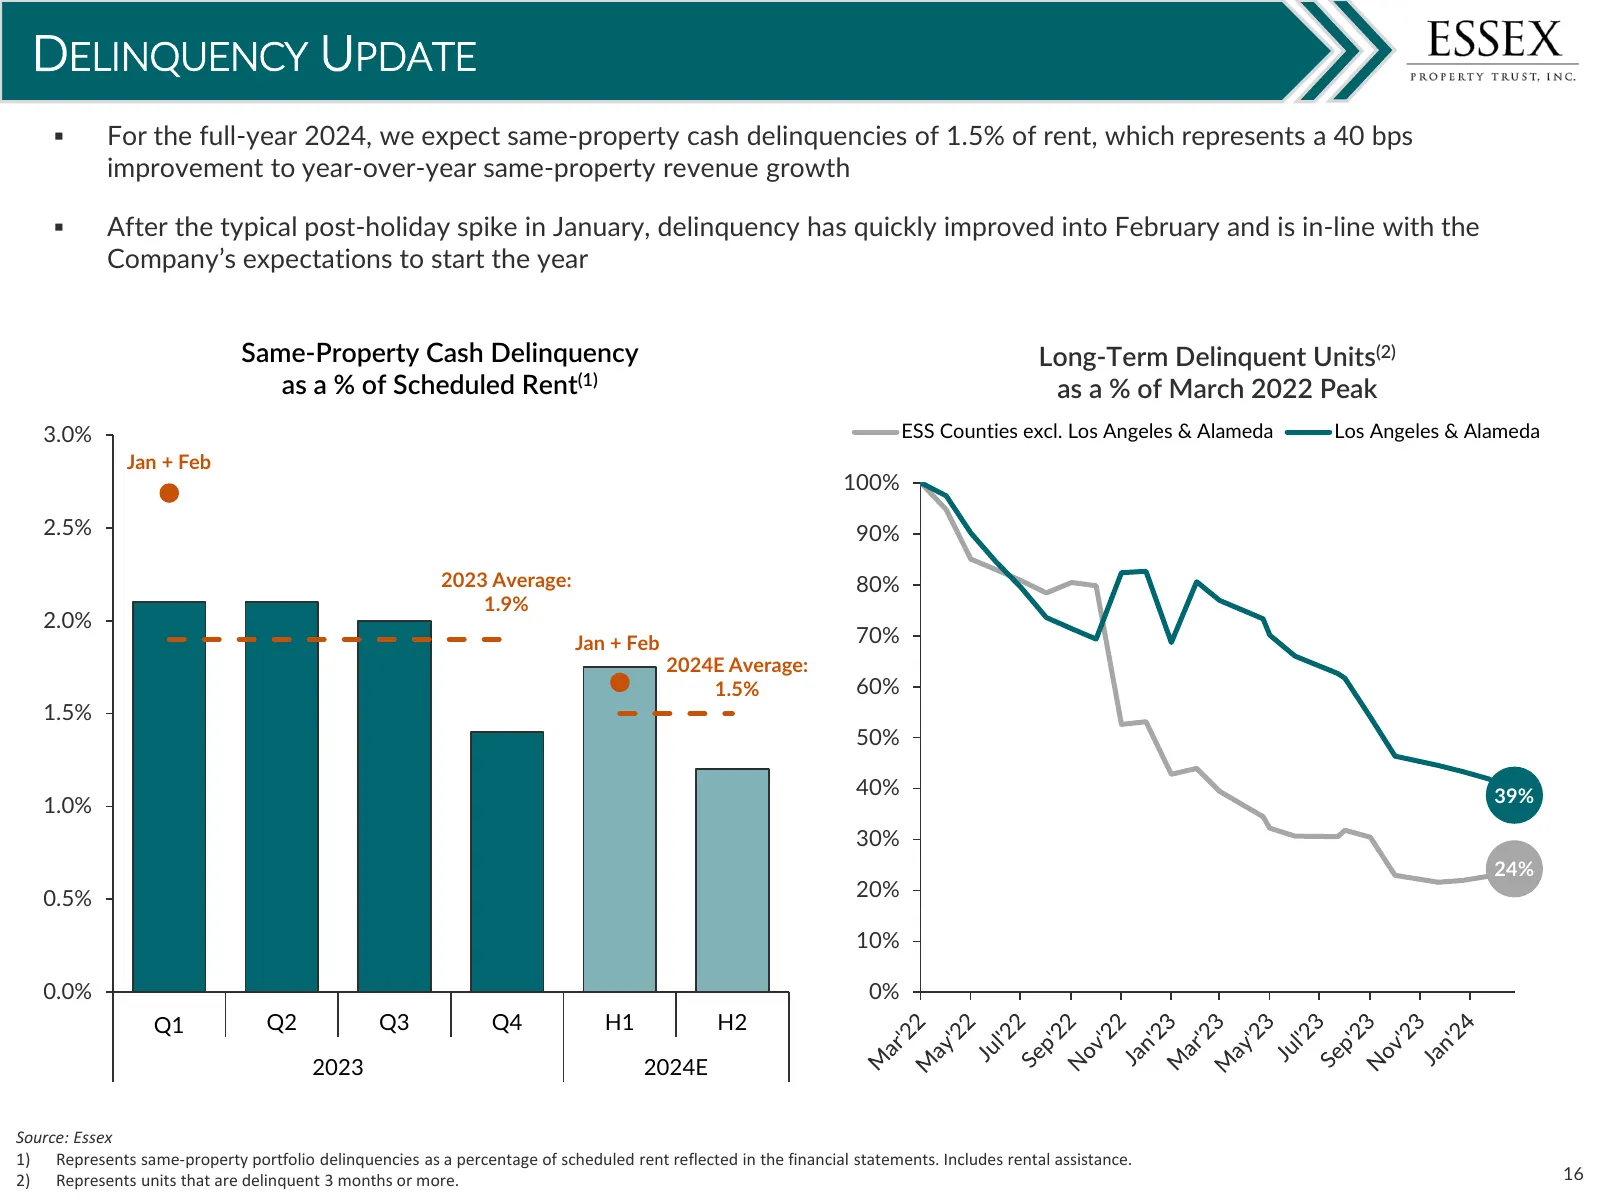
DELINQUENCY UPDATE For the full-year 2024, we expect same-property cash delinquencies of 1.5% of rent, which represents a 40 bps improvement to year-over-year same-property revenue growth After the typical post-holiday spike in January, delinquency has quickly improved into February and is in-li
Slide 17: Structured Finance Portfolio Overview
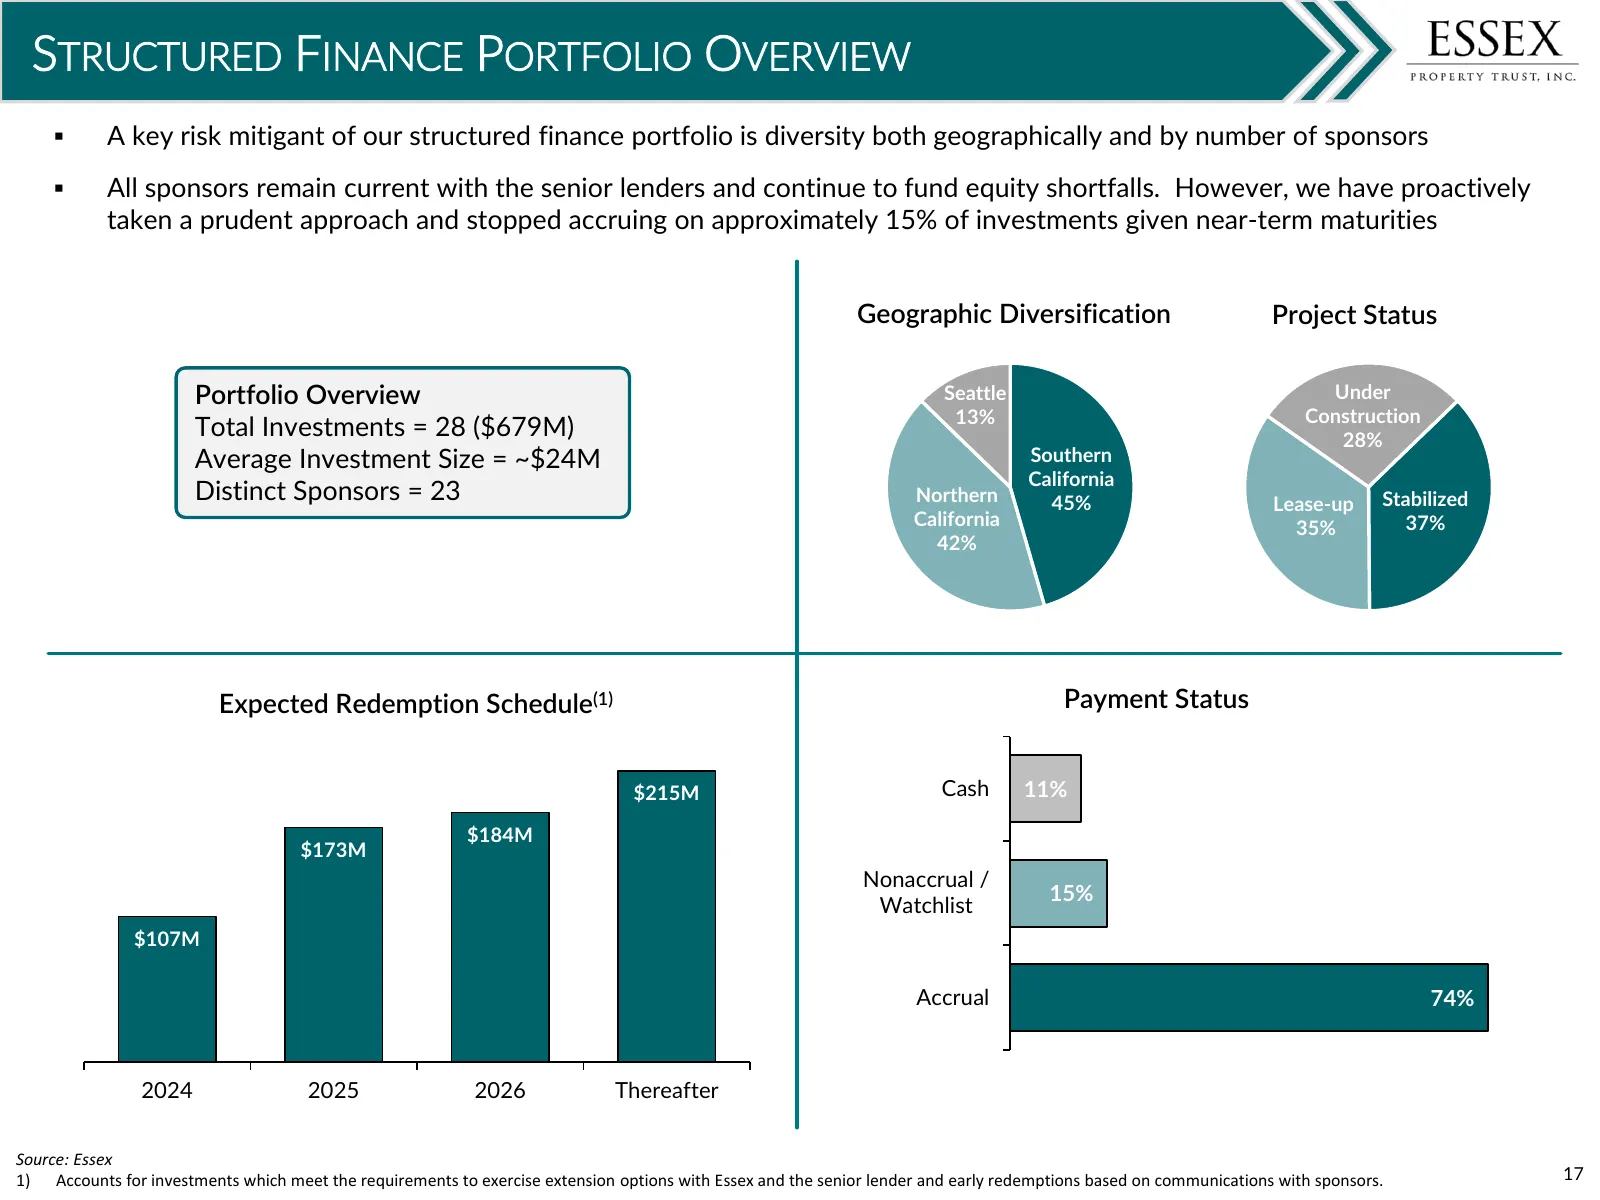
STRUCTURED FINANCE PORTFOLIO OVERVIEW A key risk mitigant of our structured finance portfolio is diversity both geographically and by number of sponsors All sponsors remain current with the senior lenders and continue to fund equity shortfalls. However, we have proactively taken a prudent approa
Slide 18: West Coast Demand Fundamentals
WEST COAST DEMAND FUNDAMENTALS Forestview Apartments Renton, WA 18
Slide 19: Propensity to Rent in Essex Markets
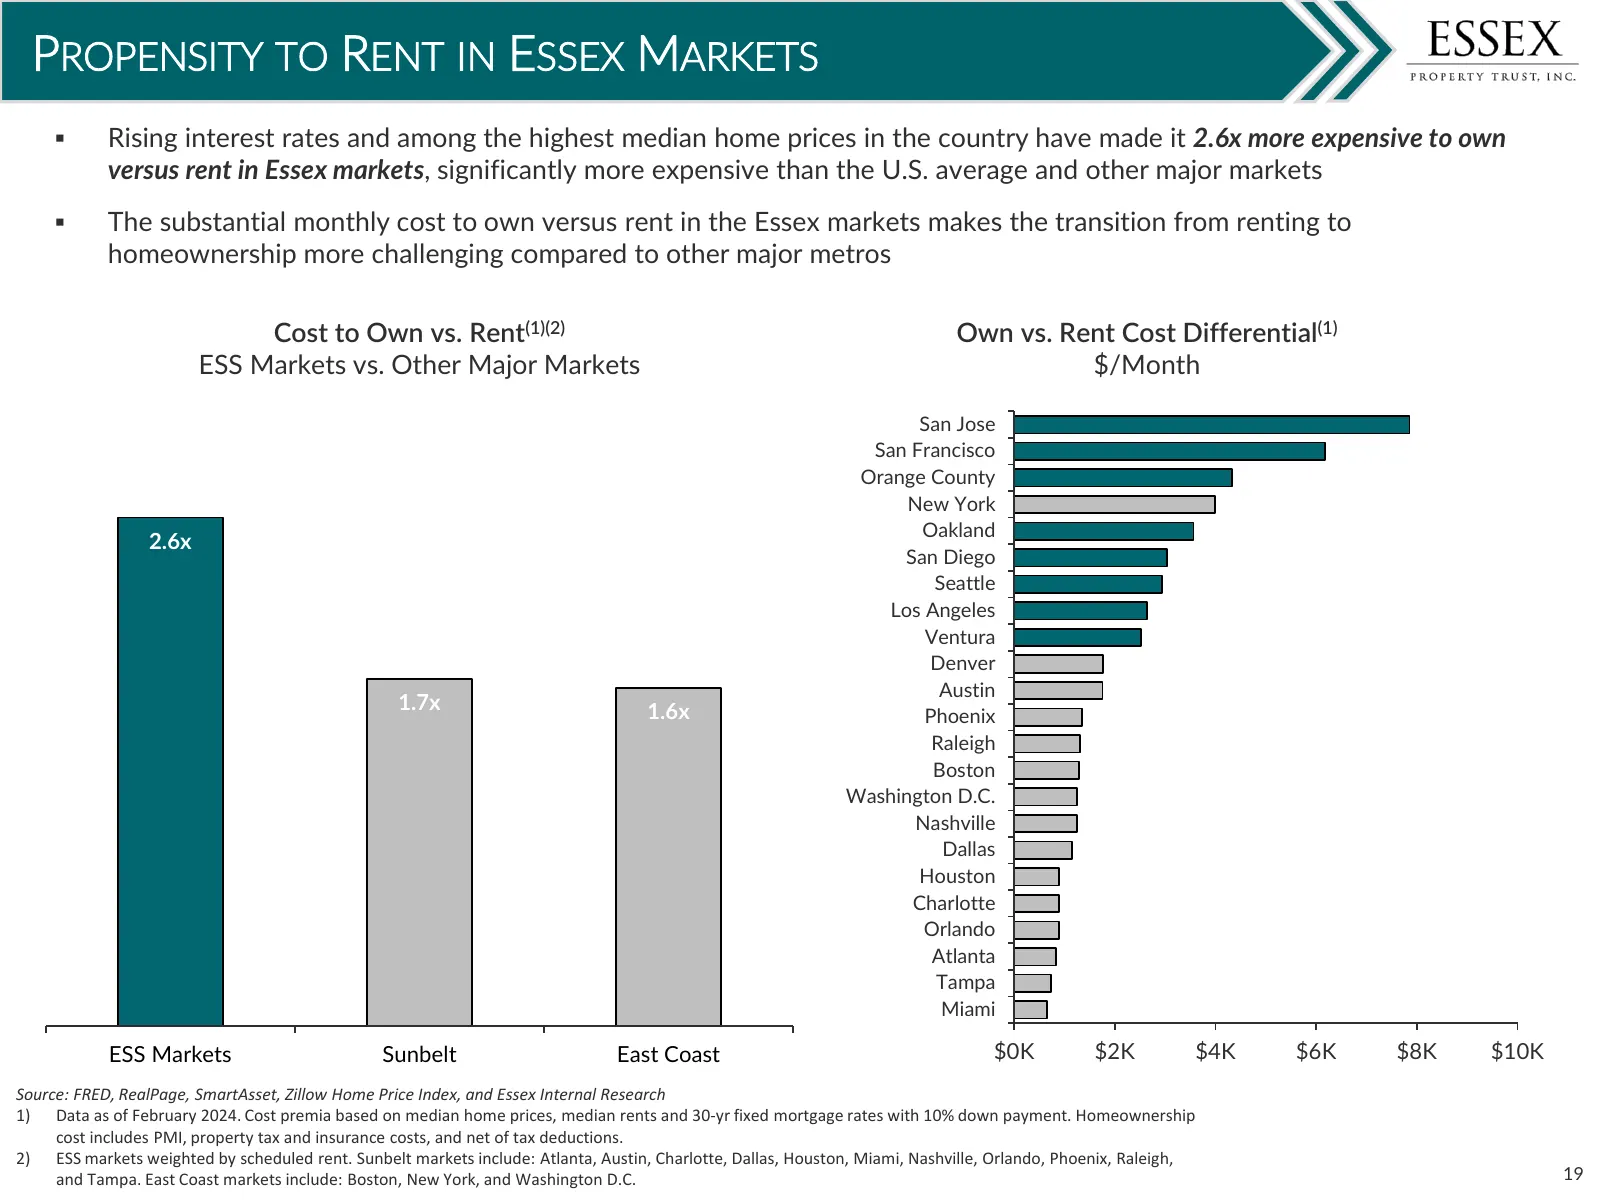
PROPENSITY TO RENT IN ESSEX MARKETS Rising interest rates and among the highest median home prices in the country have made it 2.6x more expensive to own versus rent in Essex markets, significantly more expensive than the U.S. average and other major markets The substantial monthly cost to own v
Slide 20: Venture Capital Remains Concentrated in the Bay Area
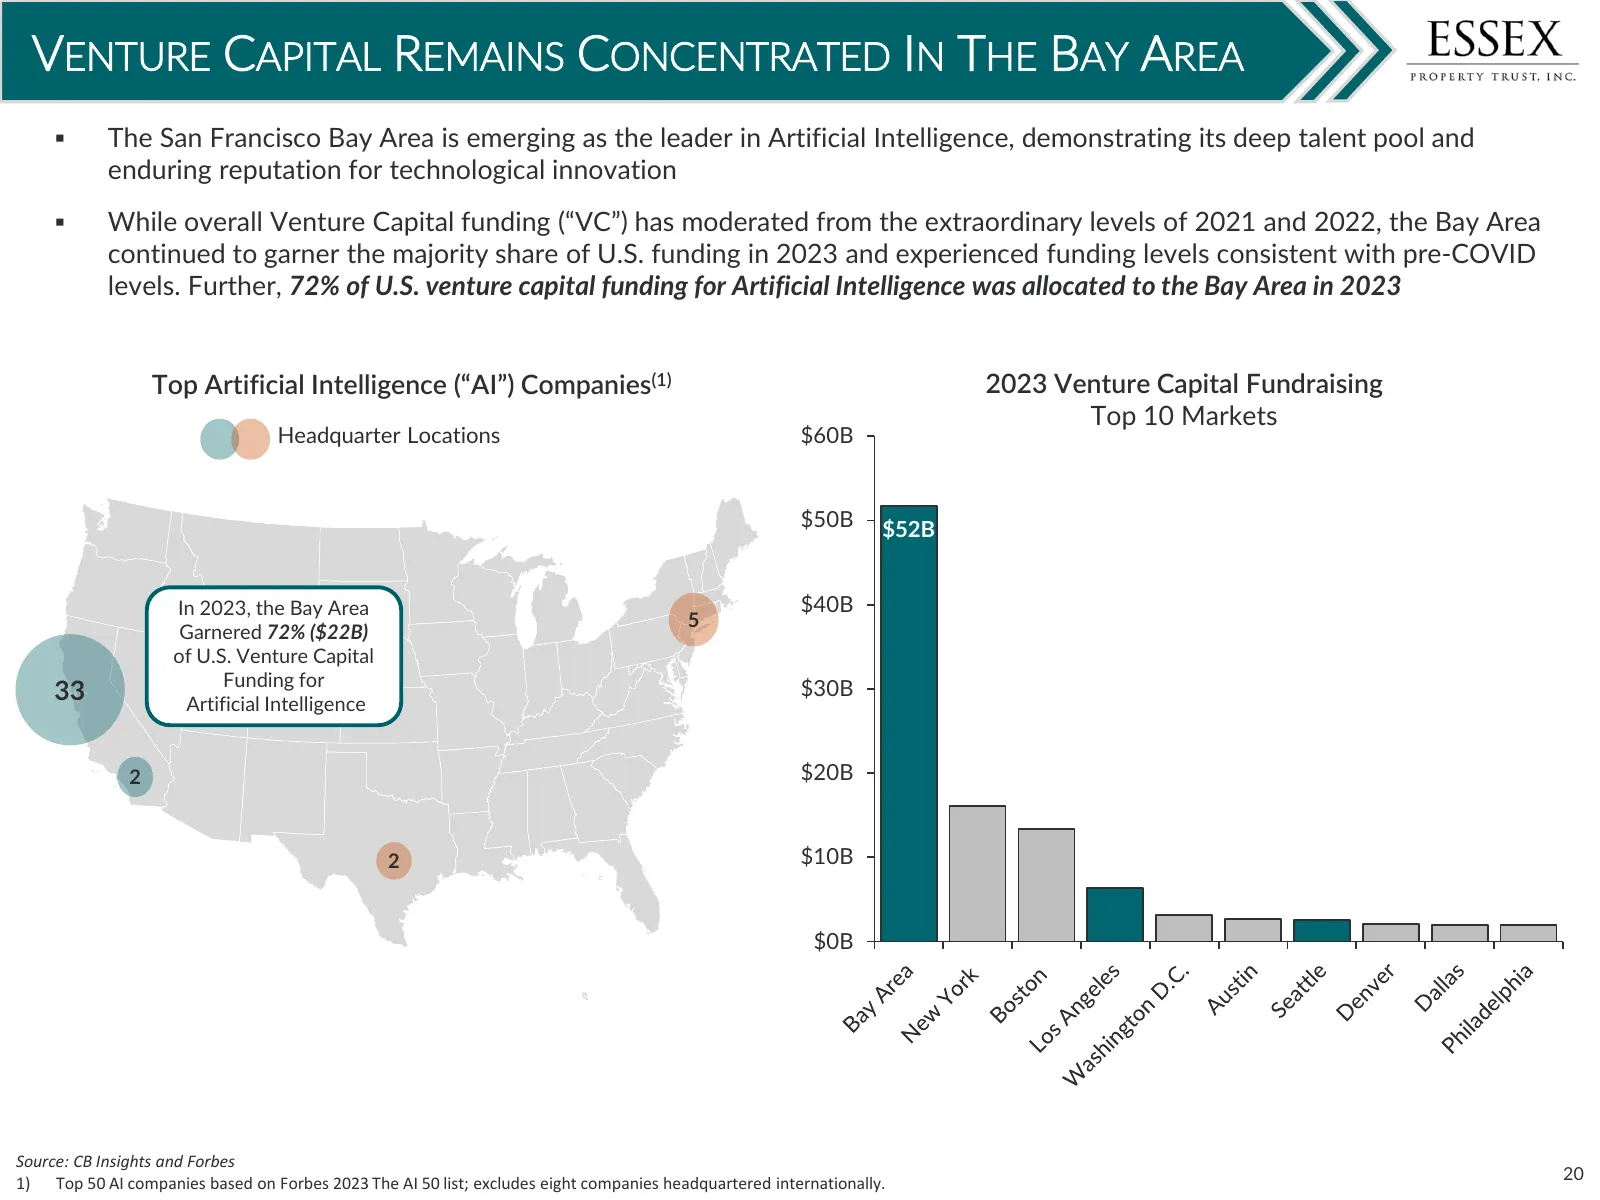
VENTURE CAPITAL REMAINS CONCENTRATED IN THE BAY AREA The San Francisco Bay Area is emerging as the leader in Artificial Intelligence, demonstrating its deep talent pool and enduring reputation for technological innovation While overall Venture Capital funding (“VC”) has moderated from the extrao
Slide 21: Migration Trends – Gradual Improvement
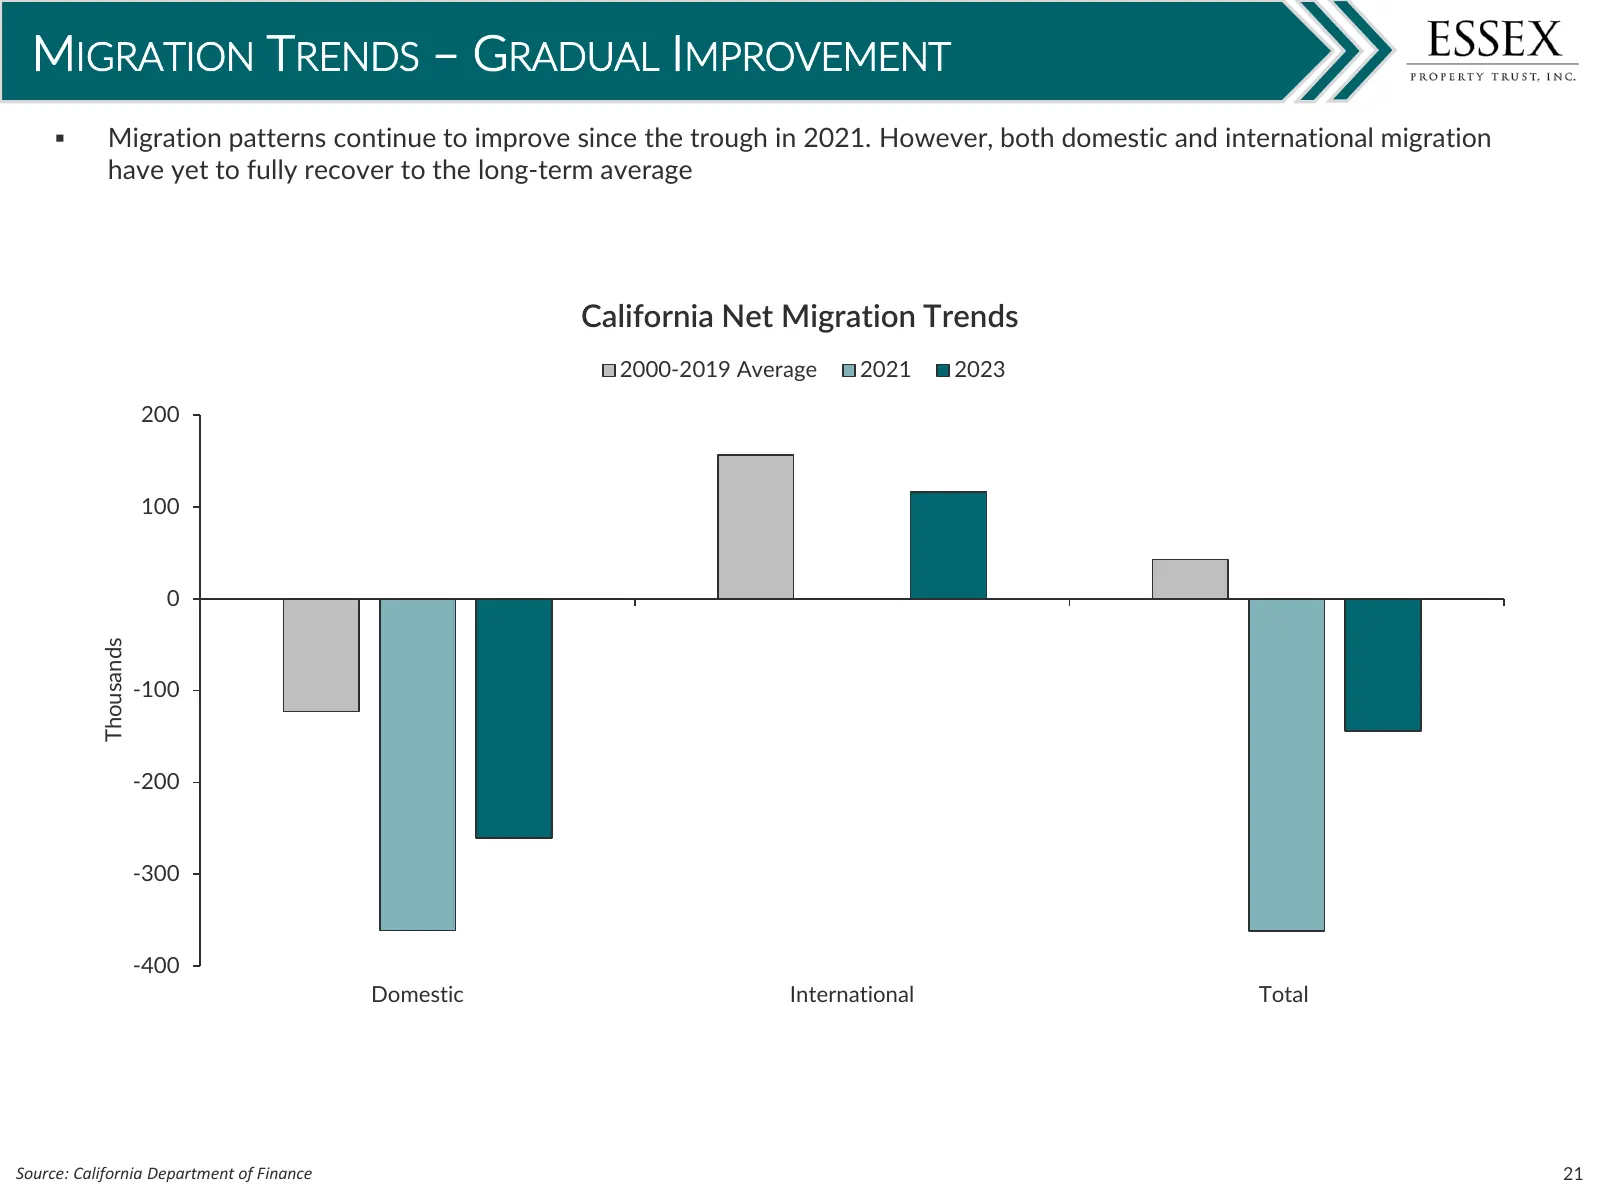
MIGRATION TRENDS – GRADUAL IMPROVEMENT Migration patterns continue to improve since the trough in 2021. However, both domestic and international migration have yet to fully recover to the long-term average California Net Migration Trends 2000-2019 Average 2021 2023 200 100 0 Thousands -100 -200 -3

Slide 22: West Coast Supply Fundamentals
WEST COAST SUPPLY FUNDAMENTALS Renaissance at Uptown Orange Orange, CA 22
Slide 23: 2024E Supply Forecast
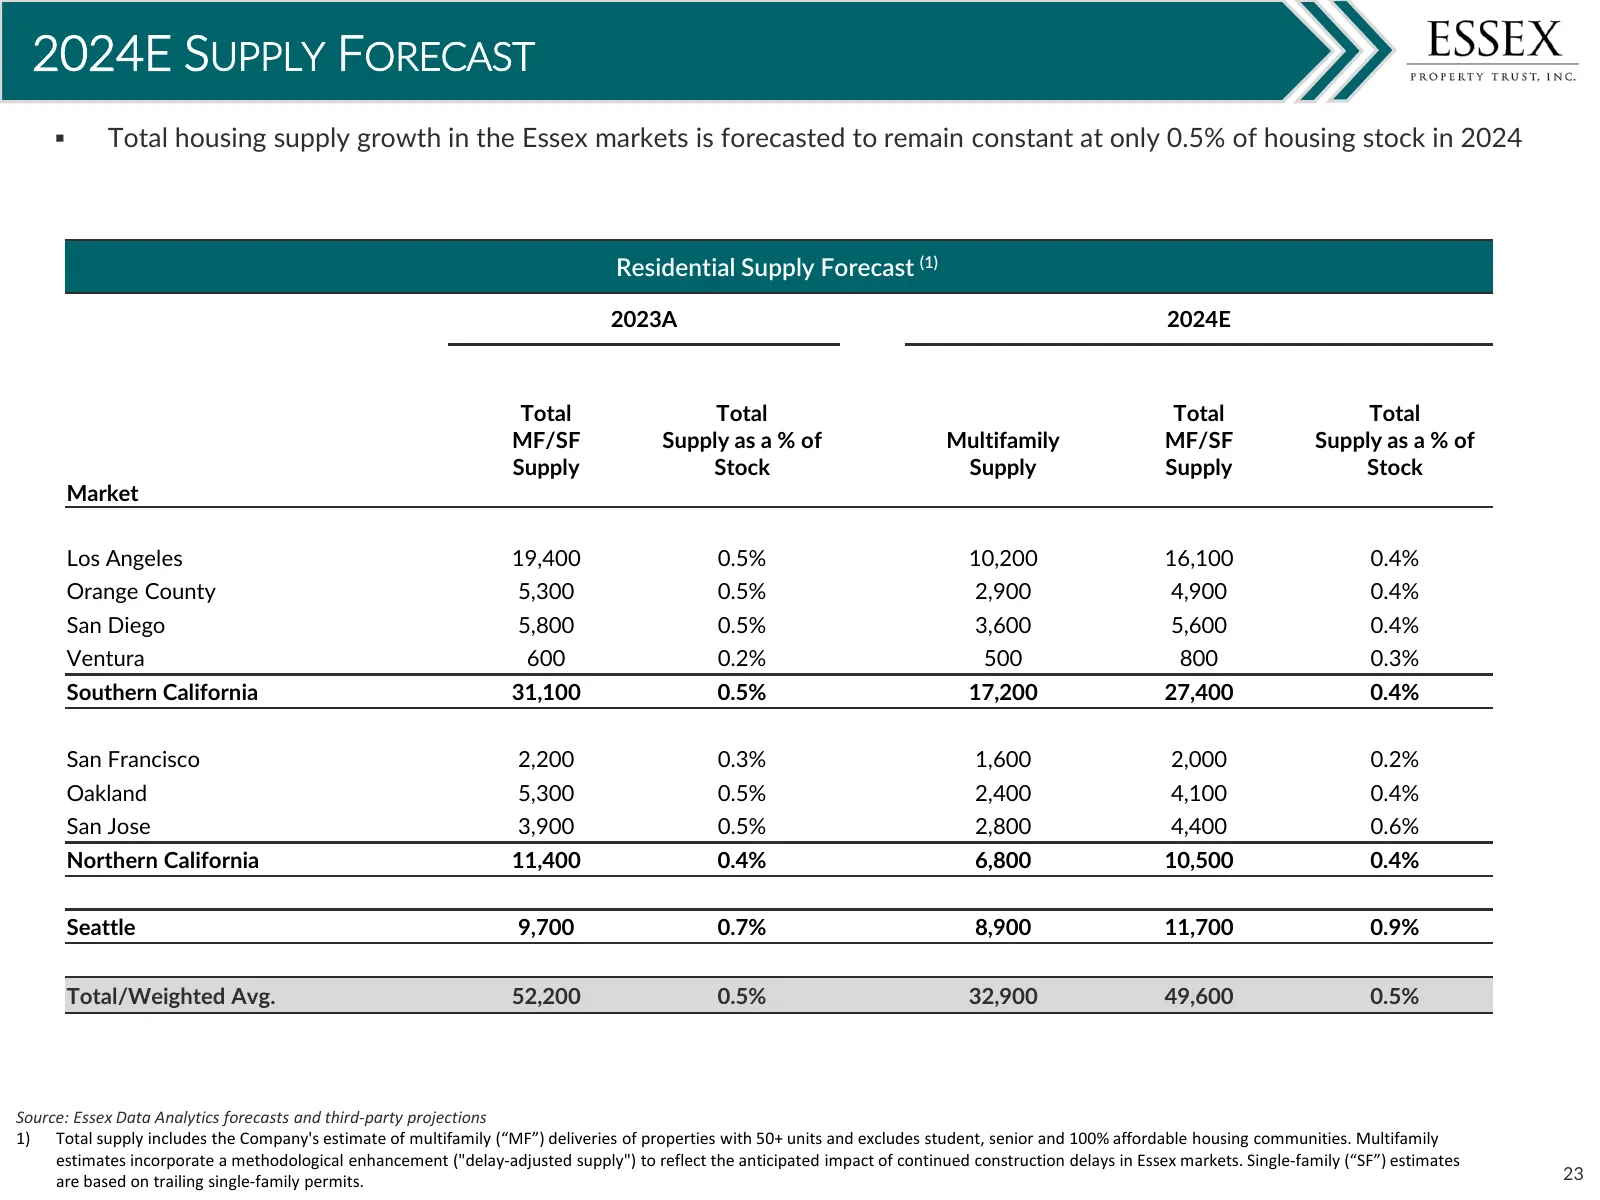
2024E SUPPLY FORECAST Total housing supply growth in the Essex markets is forecasted to remain constant at only 0.5% of housing stock in 2024 Residential Supply Forecast (1) 2023A 2024E Total Total Total Total MF/SF Supply as a % of Multifamily MF/SF Supply as a % of Supply Stock Supply Supply Sto
Slide 24: Supply-Demand Fundamentals
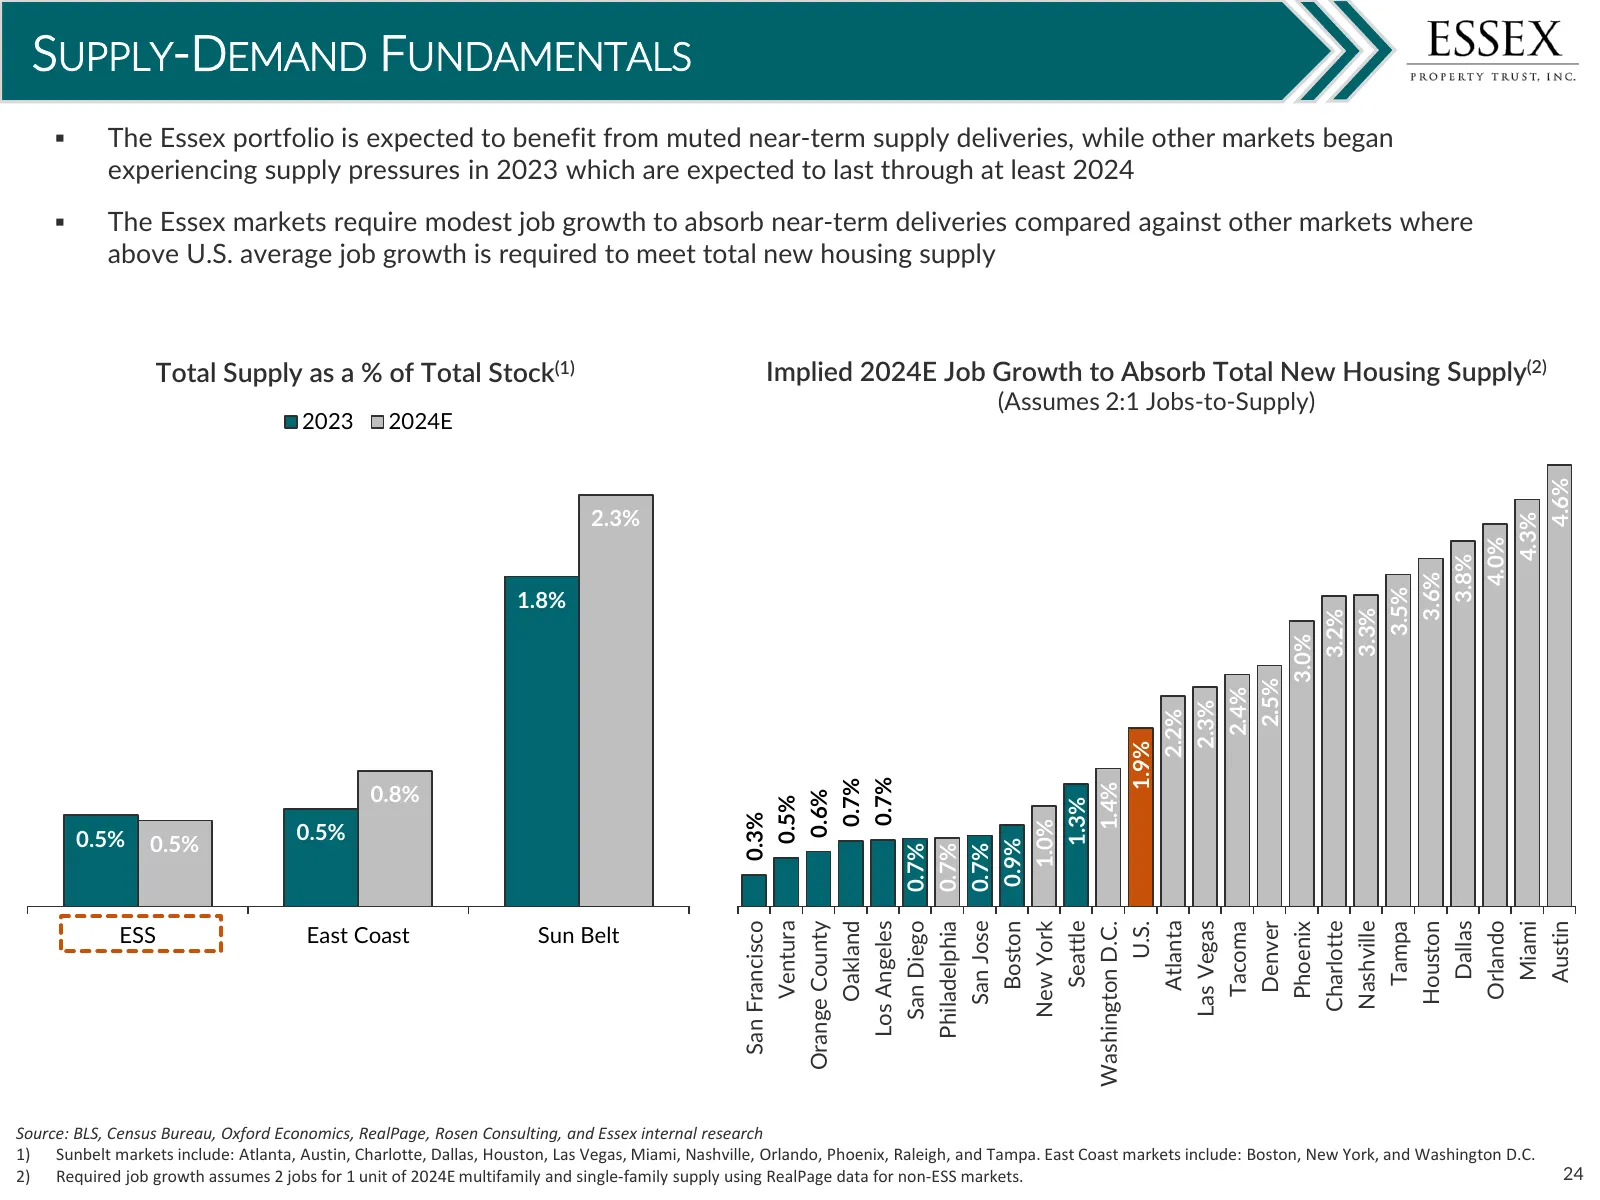
SUPPLY-DEMAND FUNDAMENTALS The Essex portfolio is expected to benefit from muted near-term supply deliveries, while other markets began experiencing supply pressures in 2023 which are expected to last through at least 2024 The Essex markets require modest job growth to absorb near-term deliverie
Slide 25: Favorable Supply Landscape in Essex Markets
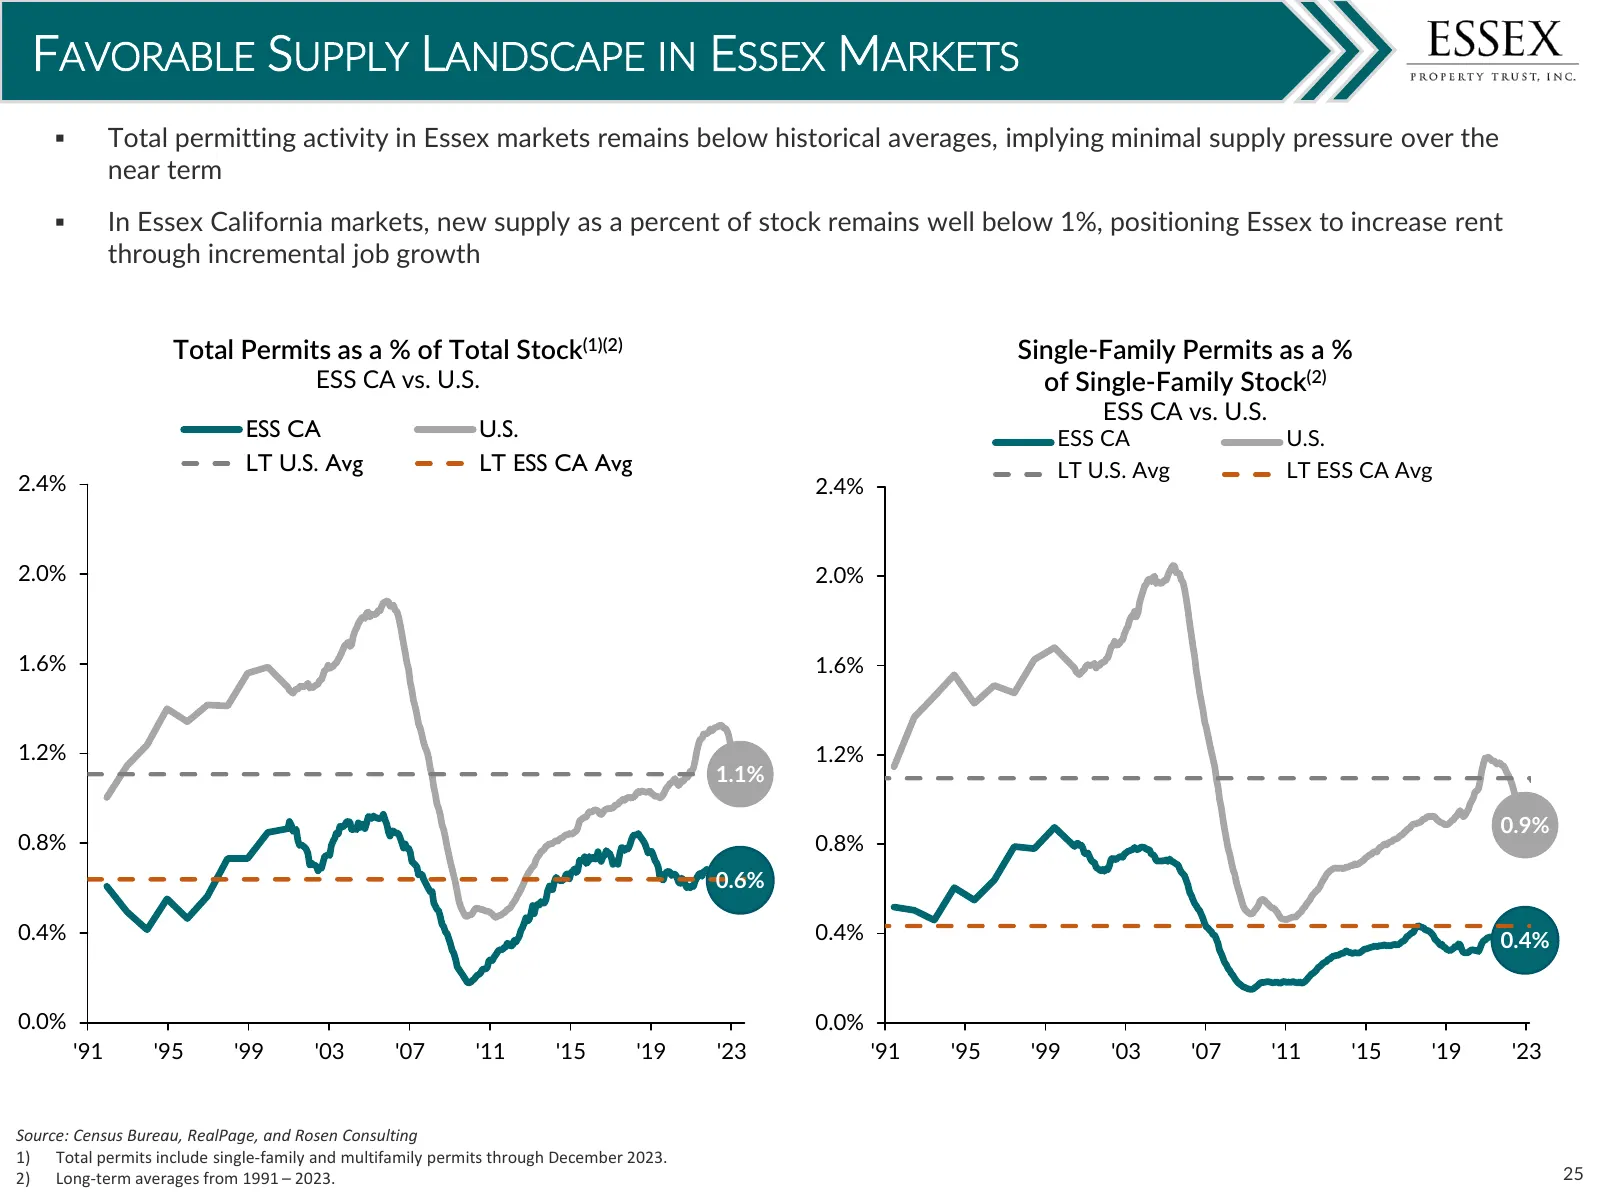
FAVORABLE SUPPLY LANDSCAPE IN ESSEX MARKETS Total permitting activity in Essex markets remains below historical averages, implying minimal supply pressure over the near term In Essex California markets, new supply as a percent of stock remains well below 1%, positioning Essex to increase rent th
Slide 26: Guidance & Balance Sheet
GUIDANCE & BALANCE SHEET Mill Creek at Windemere San Ramon, CA 26
Slide 27: 2024 Same-Property Revenue Guidance
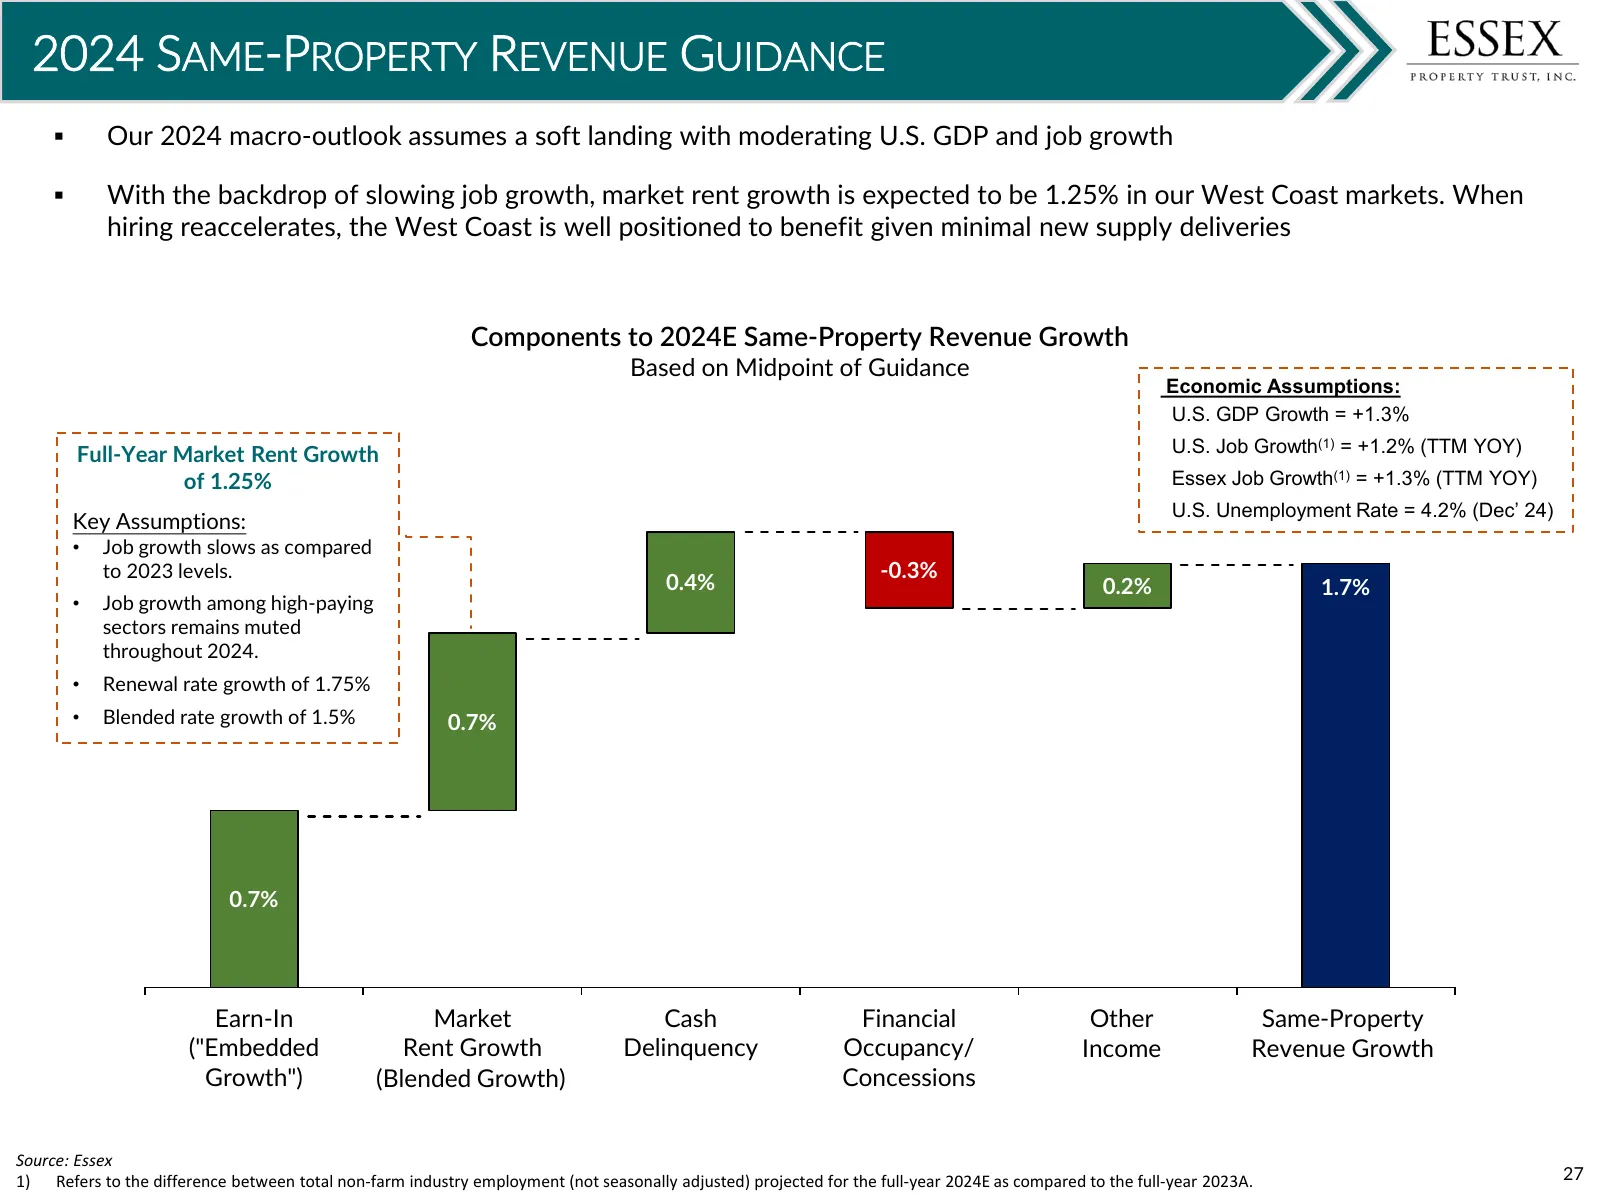
2024 SAME-PROPERTY REVENUE GUIDANCE Our 2024 macro-outlook assumes a soft landing with moderating U.S. GDP and job growth With the backdrop of slowing job growth, market rent growth is expected to be 1.25% in our West Coast markets. When hiring reaccelerates, the West Coast is well positioned to
Slide 28: 2024 Full-Year Guidance (Unchanged from Q4'23 Earnings)
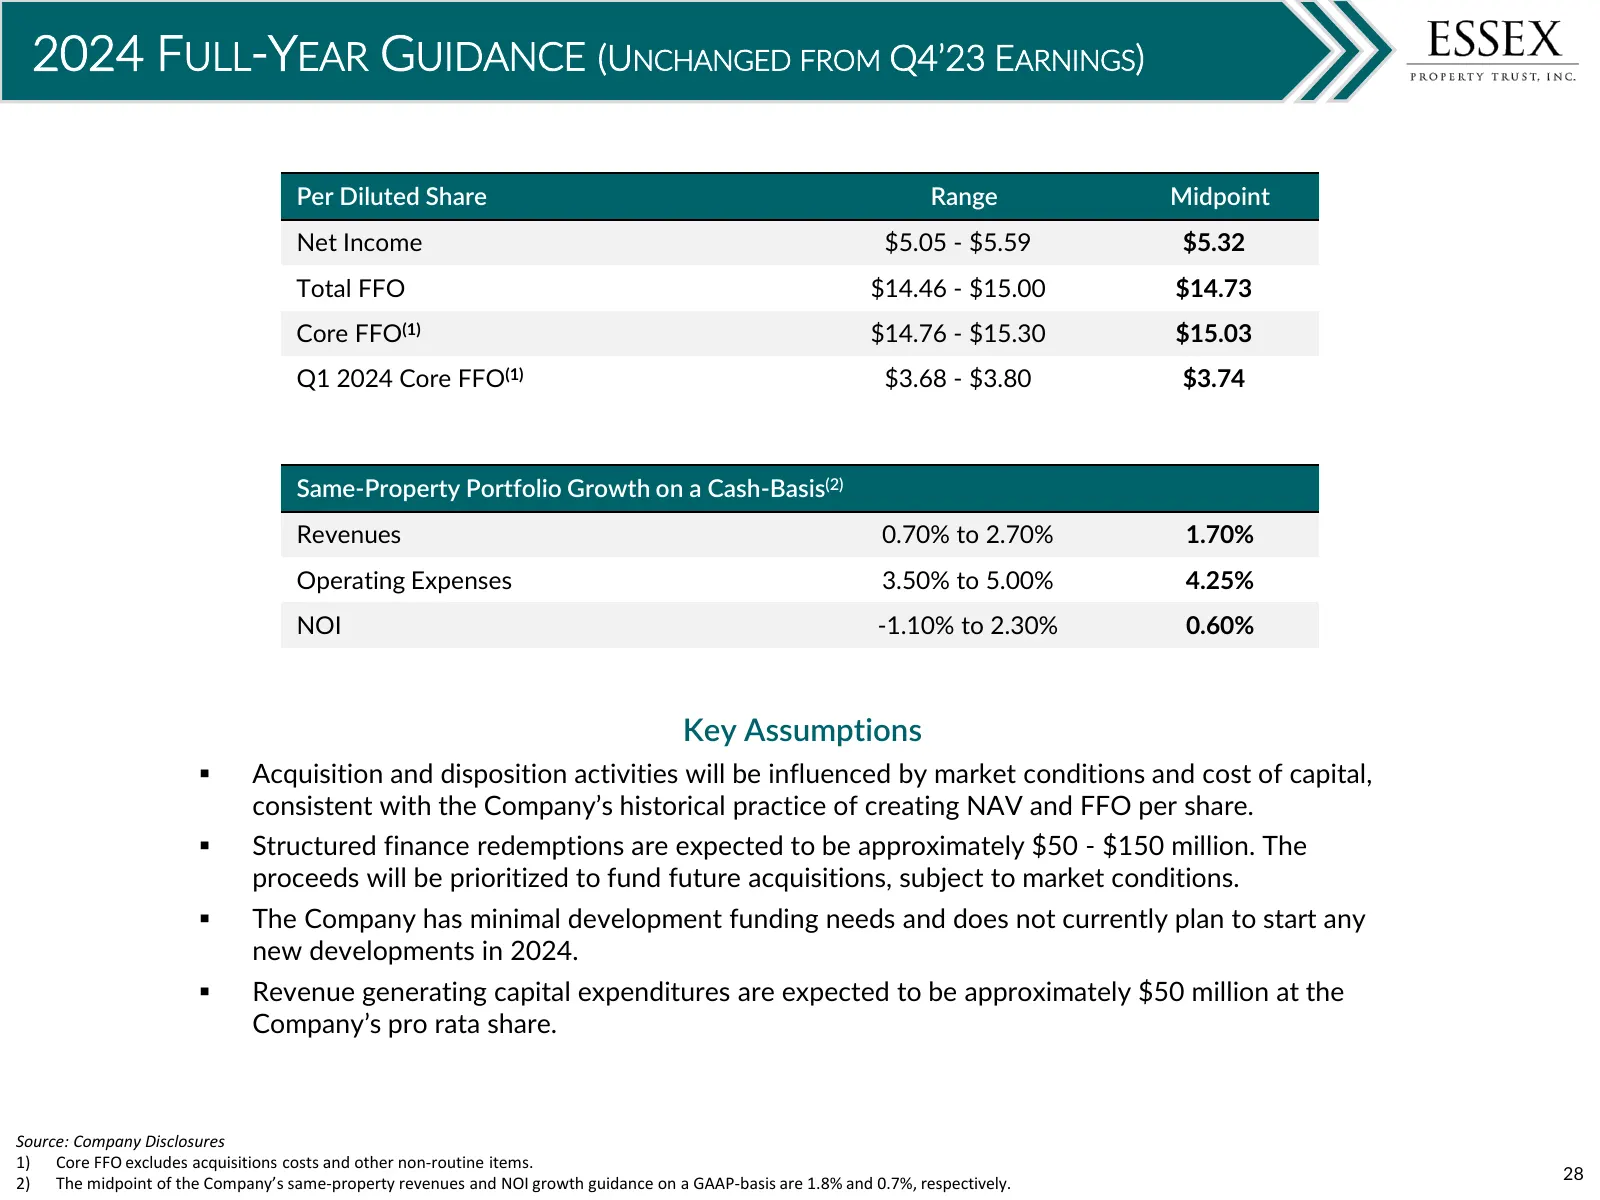
2024 FULL-YEAR GUIDANCE (UNCHANGED FROM Q4’23 EARNINGS) Per Diluted Share Range Midpoint Net Income $5.05 - $5.59 $5.32 Total FFO $14.46 - $15.00 $14.73 Core FFO(1) $14.76 - $15.30 $15.03 Q1 2024 Core FFO(1) $3.68 - $3.80 $3.74 Same-Property Portfolio Growth on a Cash-Basis(2) Revenues 0.70% to 2.70
Slide 29: Investment Grade Balance Sheet & Strong Liquidity
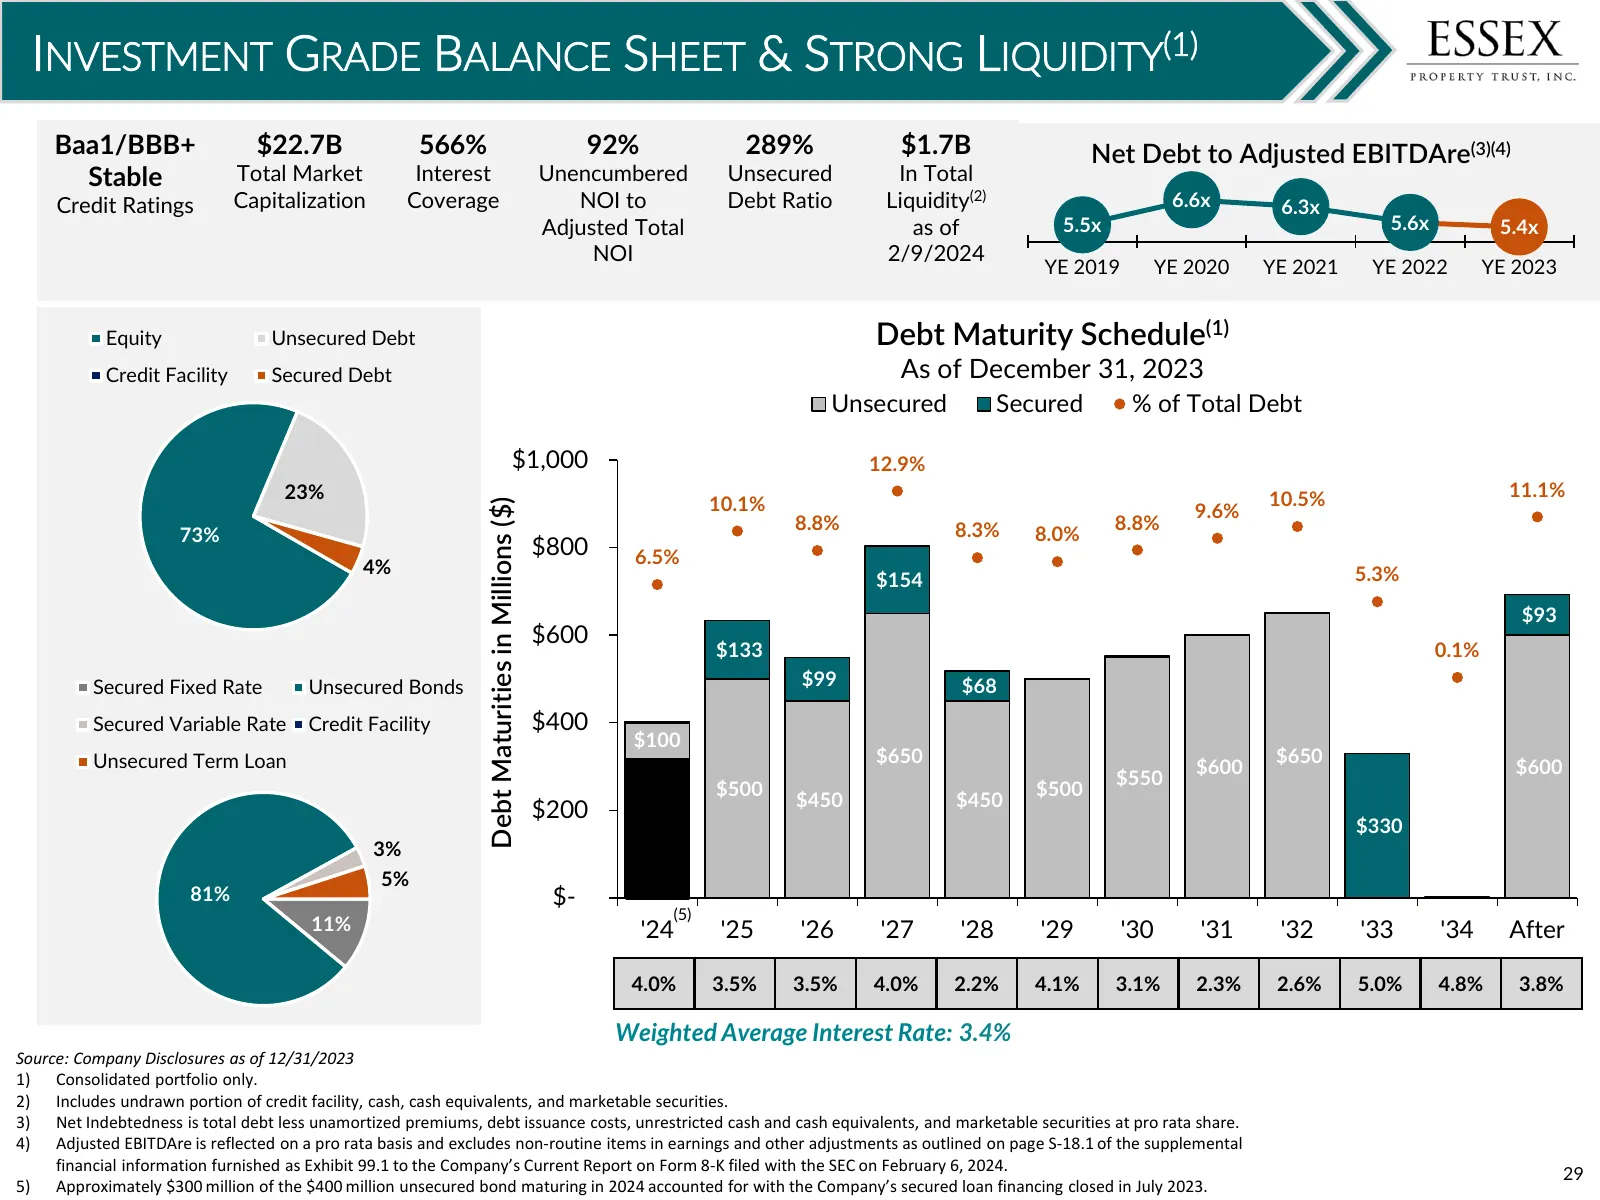
INVESTMENT GRADE BALANCE SHEET & STRONG LIQUIDITY(1) Baa1/BBB+ $22.7B 566% 92% 289% $1.7B Net Debt to Adjusted EBITDAre(3)(4) Stable Total Market Interest Unencumbered Unsecured In Total Credit Ratings Capitalization Coverage NOI to Debt Ratio Liquidity(2) 6.6x 6.3x Adjusted Total as of 5.5x 5.6x 5.

Slide 30: ESG Highlights
ESG HIGHLIGHTS Pinnacle at Talega San Clemente, CA 30
Slide 31: Environmental Overview
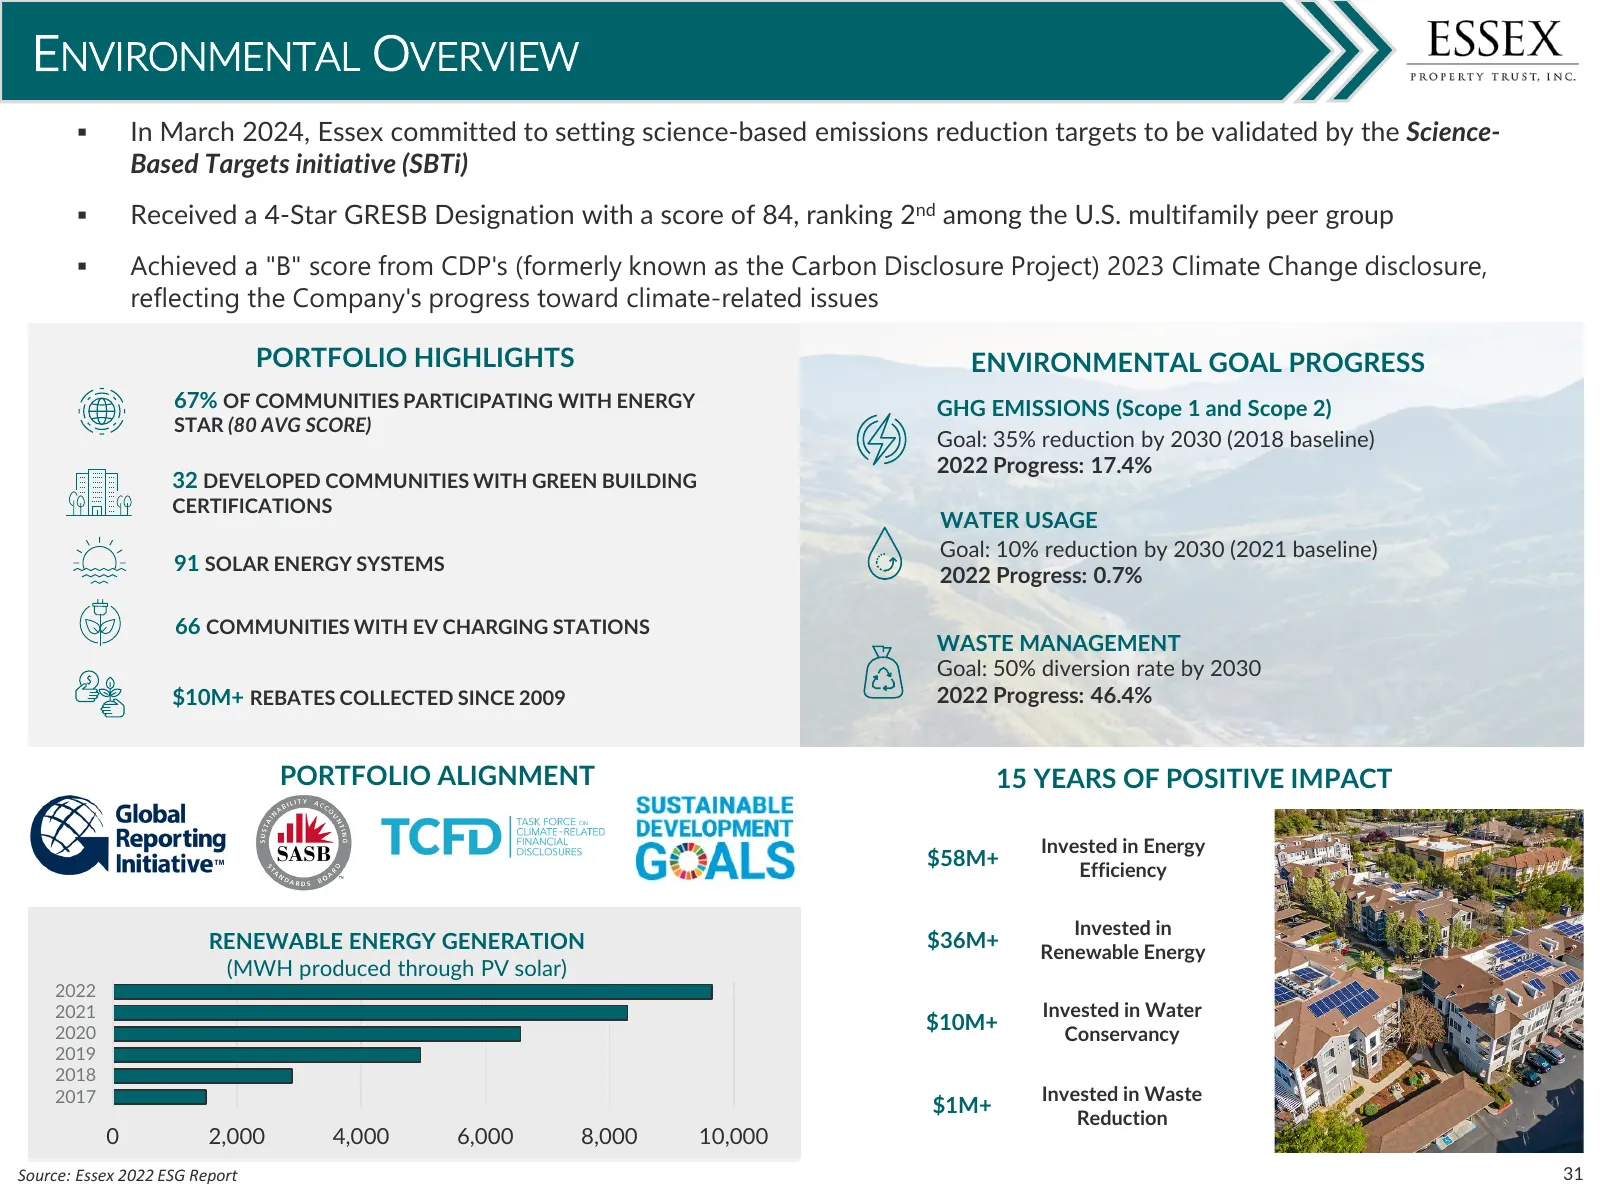
ENVIRONMENTAL OVERVIEW In March 2024, Essex committed to setting science-based emissions reduction targets to be validated by the Science- Based Targets initiative (SBTi) Received a 4-Star GRESB Designation with a score of 84, ranking 2nd among the U.S. multifamily peer group Achieved a "B" sc
Slide 32: Social and Governance Overview
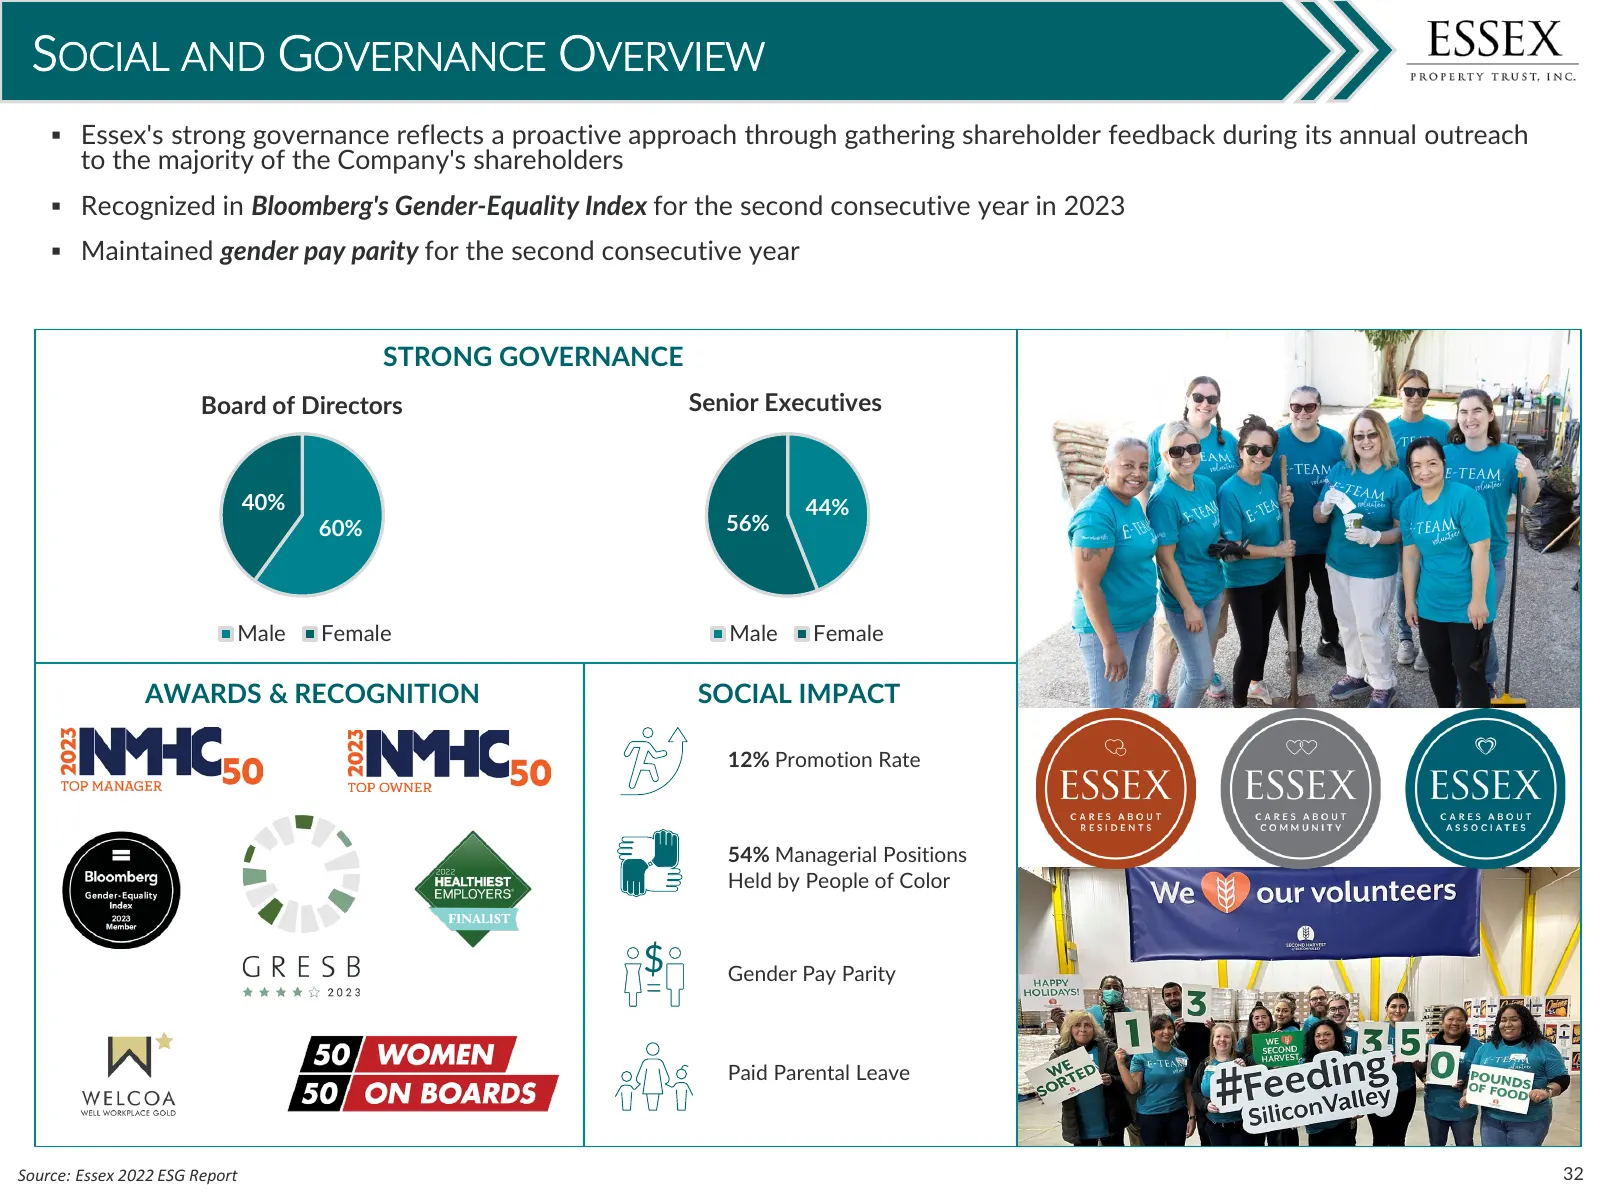
SOCIAL AND GOVERNANCE OVERVIEW Essex's strong governance reflects a proactive approach through gathering shareholder feedback during its annual outreach to the majority of the Company's shareholders Recognized in Bloomberg's Gender-Equality Index for the second consecutive year in 2023 Maintai

Slide 33: Definitions & Reconciliations
DEFINITIONS & RECONCILIATIONS Canyon Pointe Bothell, WA 33
Slide 34: Forward Looking Statements
FORWARD LOOKING STATEMENTS SAFE HARBOR STATEMENT UNDER THE PRIVATE LITIGATION REFORM ACT OF 1995 This presentation includes “forward-looking statements” within the meaning of Section 27A of the Securities Act of 1933, as amended, and Section 21E of the Securities Exchange Act of 1934, as amended. Fo
Slide 35: Definitions & Reconciliations
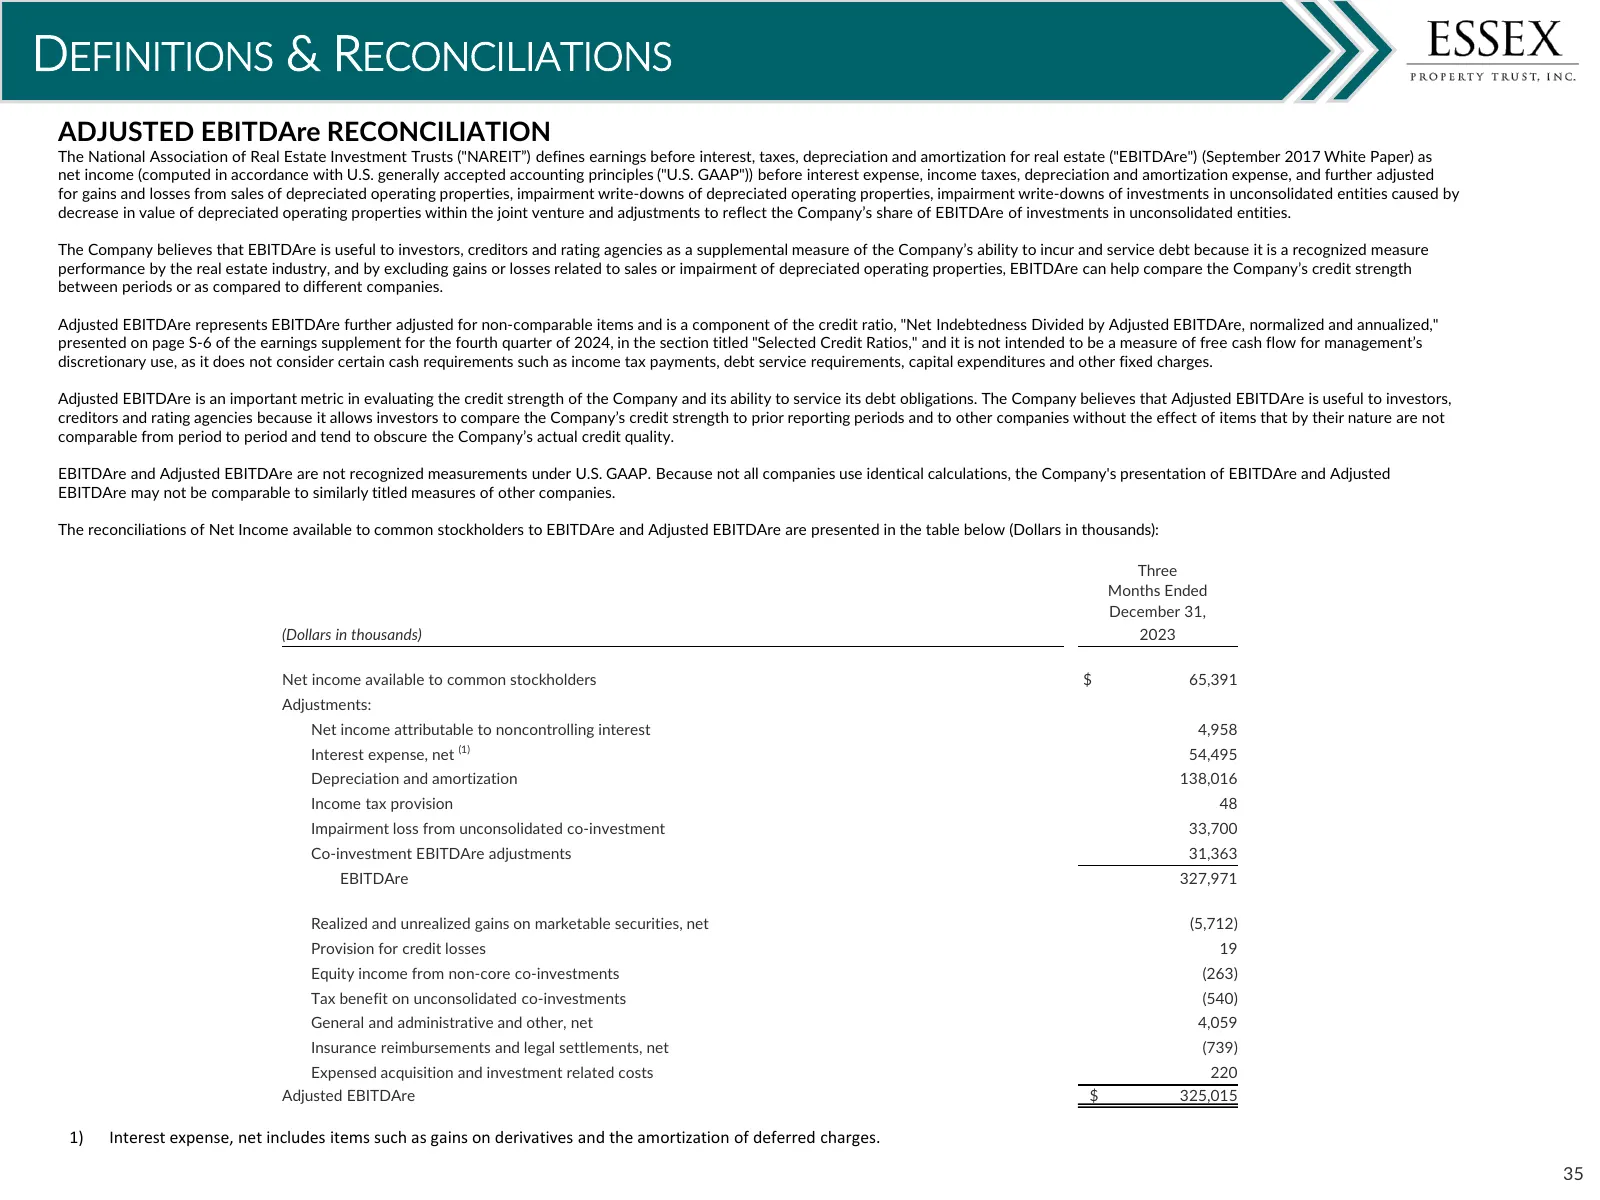
DEFINITIONS & RECONCILIATIONS ADJUSTED EBITDAre RECONCILIATION The National Association of Real Estate Investment Trusts ("NAREIT”) defines earnings before interest, taxes, depreciation and amortization for real estate ("EBITDAre") (September 2017 White Paper) as net income (computed in accordance w
Slide 36: Definitions & Reconciliations
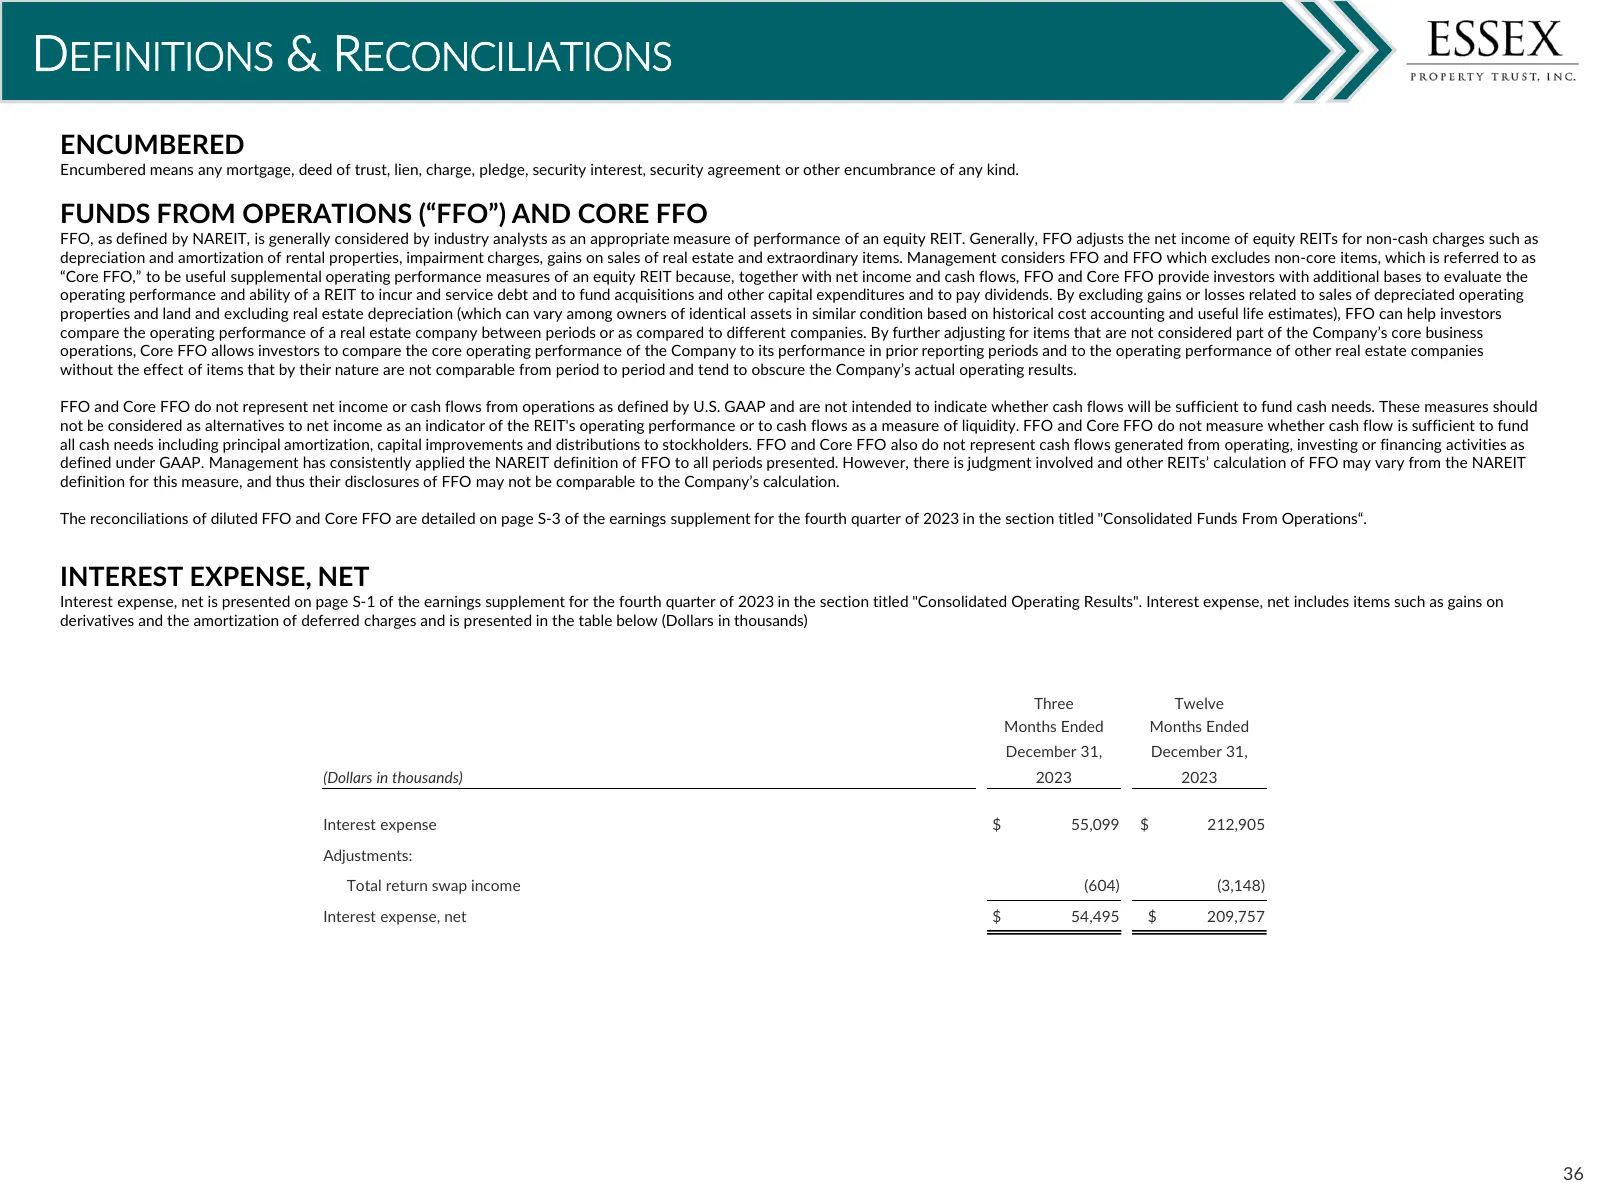
DEFINITIONS & RECONCILIATIONS ENCUMBERED Encumbered means any mortgage, deed of trust, lien, charge, pledge, security interest, security agreement or other encumbrance of any kind. FUNDS FROM OPERATIONS (“FFO”) AND CORE FFO FFO, as defined by NAREIT, is generally considered by industry analysts as a
Slide 37: Definitions & Reconciliations
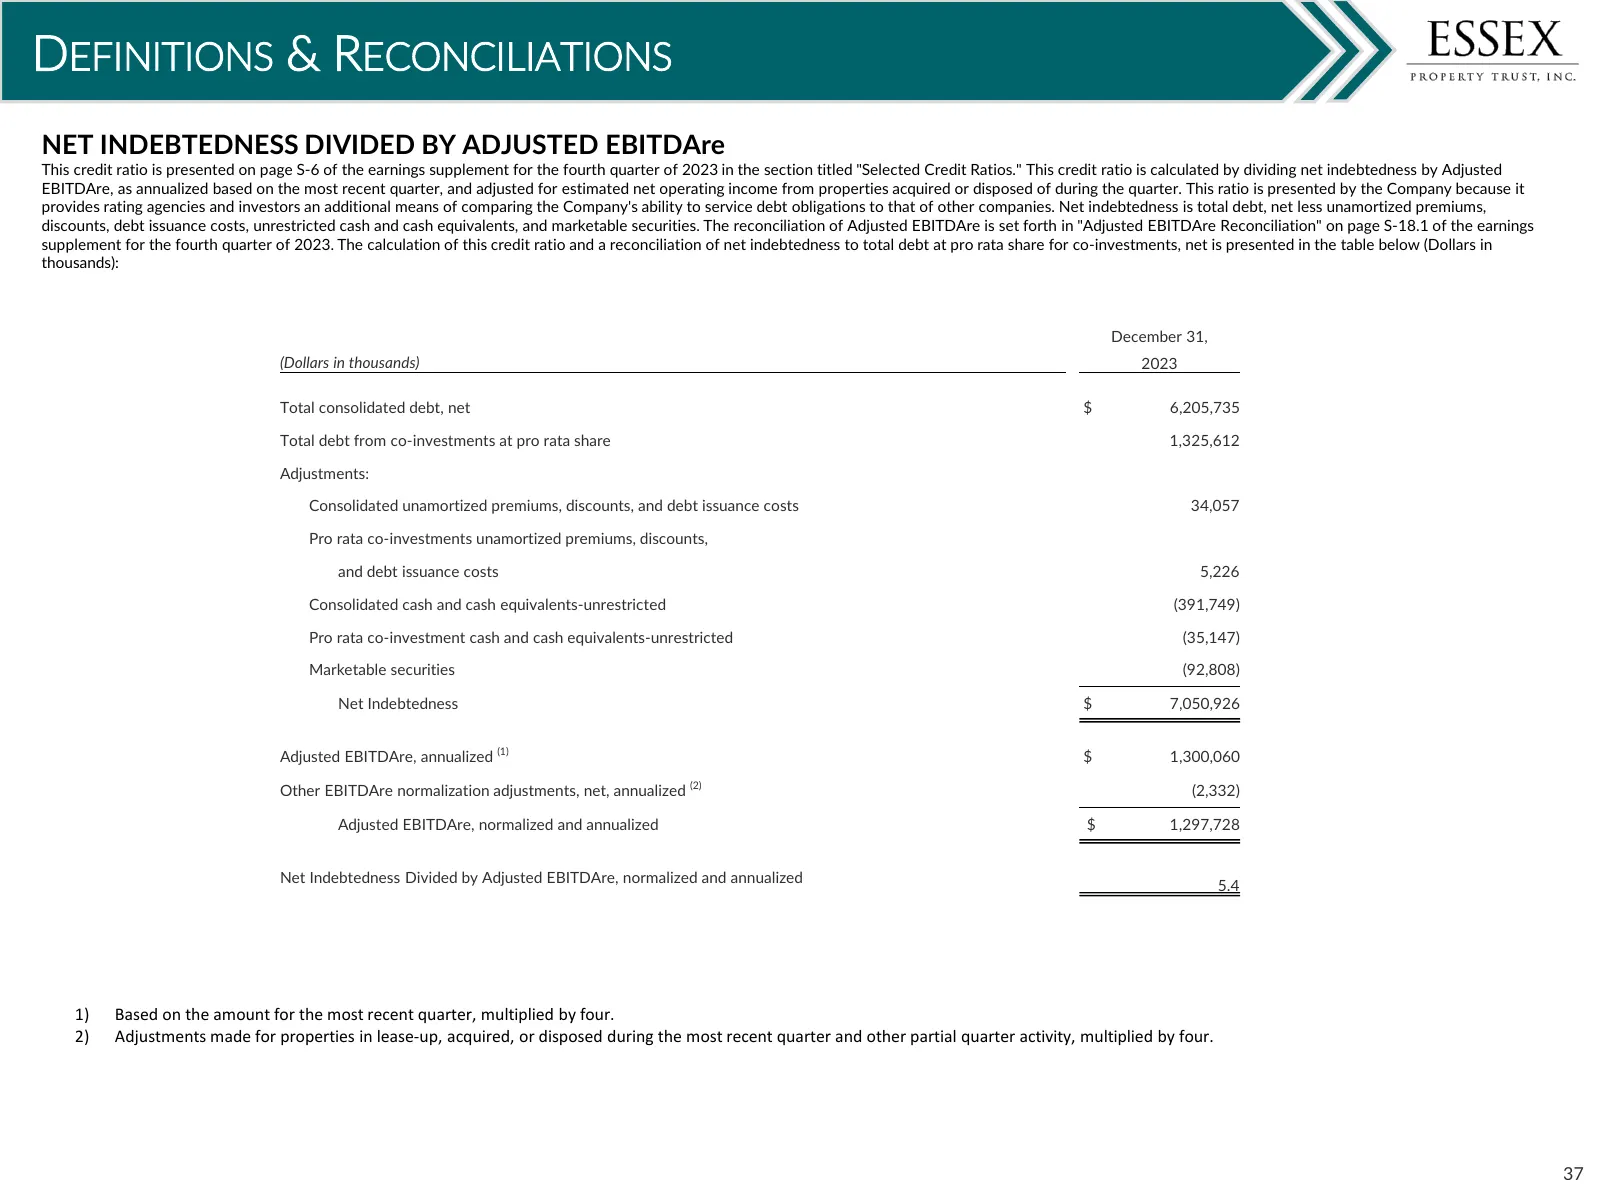
DEFINITIONS & RECONCILIATIONS NET INDEBTEDNESS DIVIDED BY ADJUSTED EBITDAre This credit ratio is presented on page S-6 of the earnings supplement for the fourth quarter of 2023 in the section titled "Selected Credit Ratios." This credit ratio is calculated by dividing net indebtedness by Adjusted EB
Slide 38: Definitions & Reconciliations
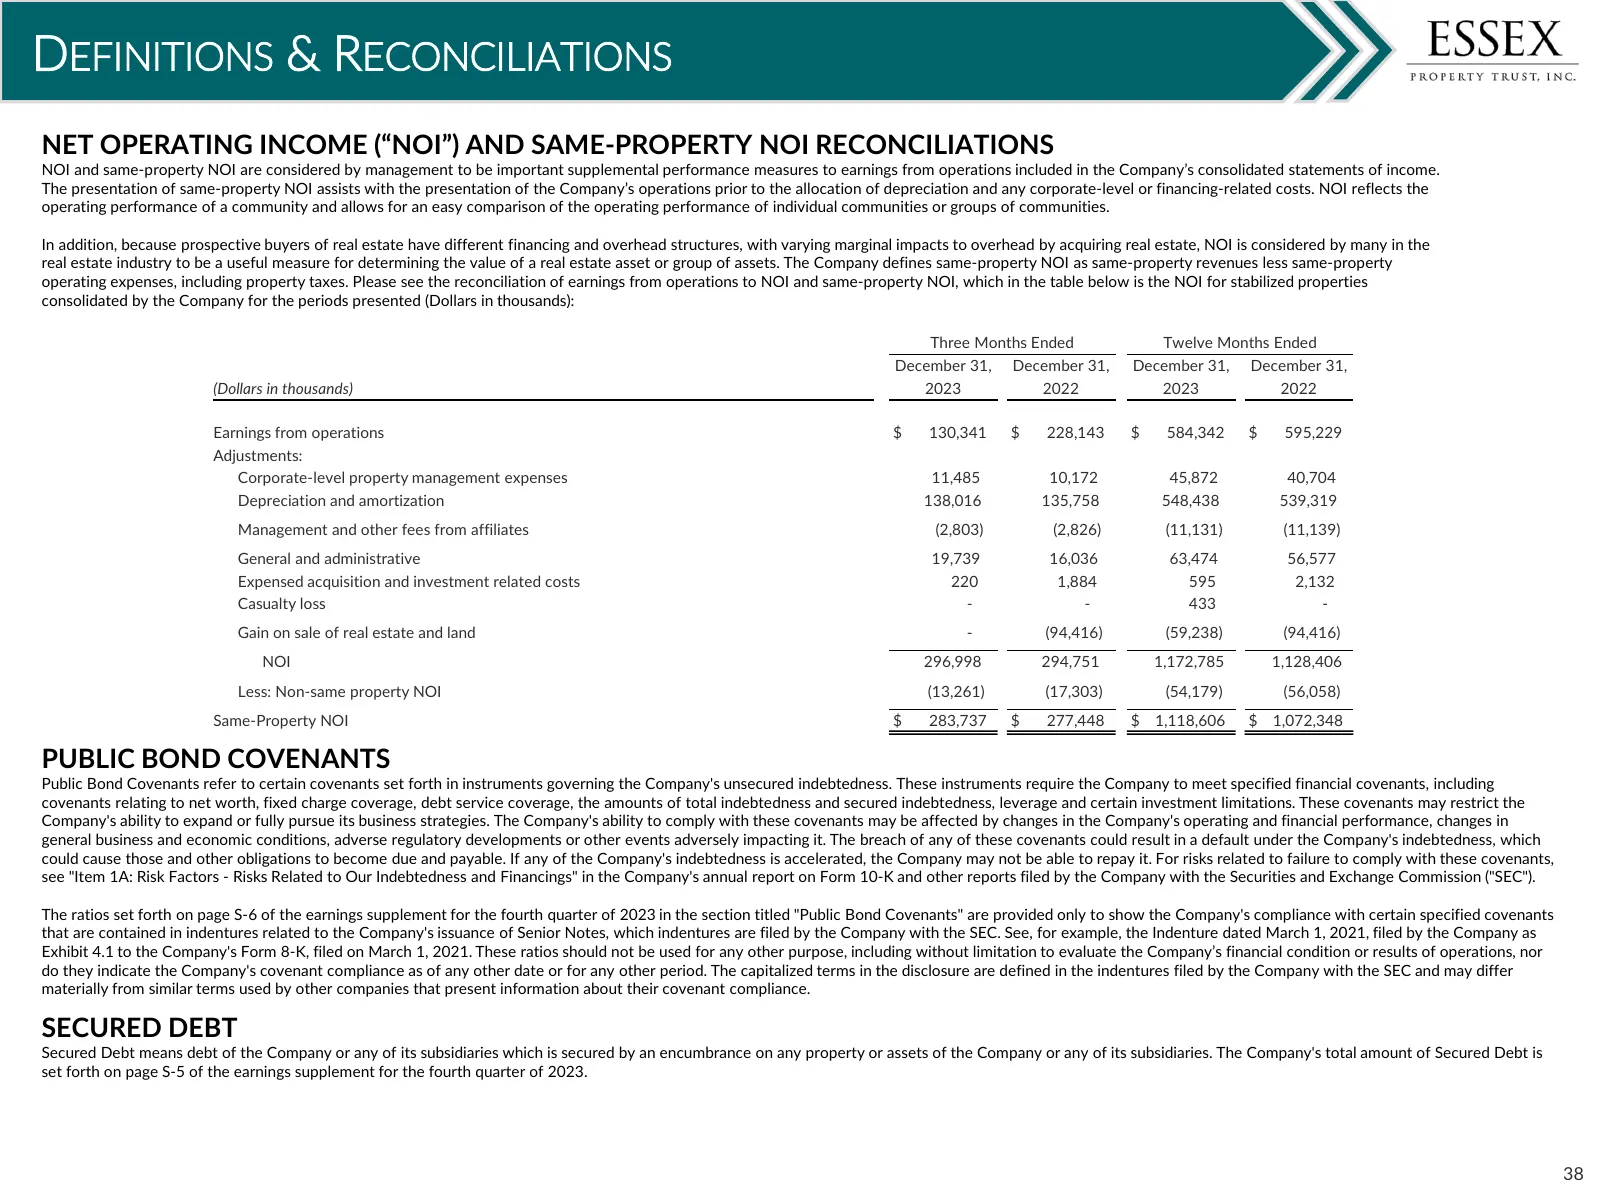
DEFINITIONS & RECONCILIATIONS NET OPERATING INCOME (“NOI”) AND SAME-PROPERTY NOI RECONCILIATIONS NOI and same-property NOI are considered by management to be important supplemental performance measures to earnings from operations included in the Company’s consolidated statements of income. The prese
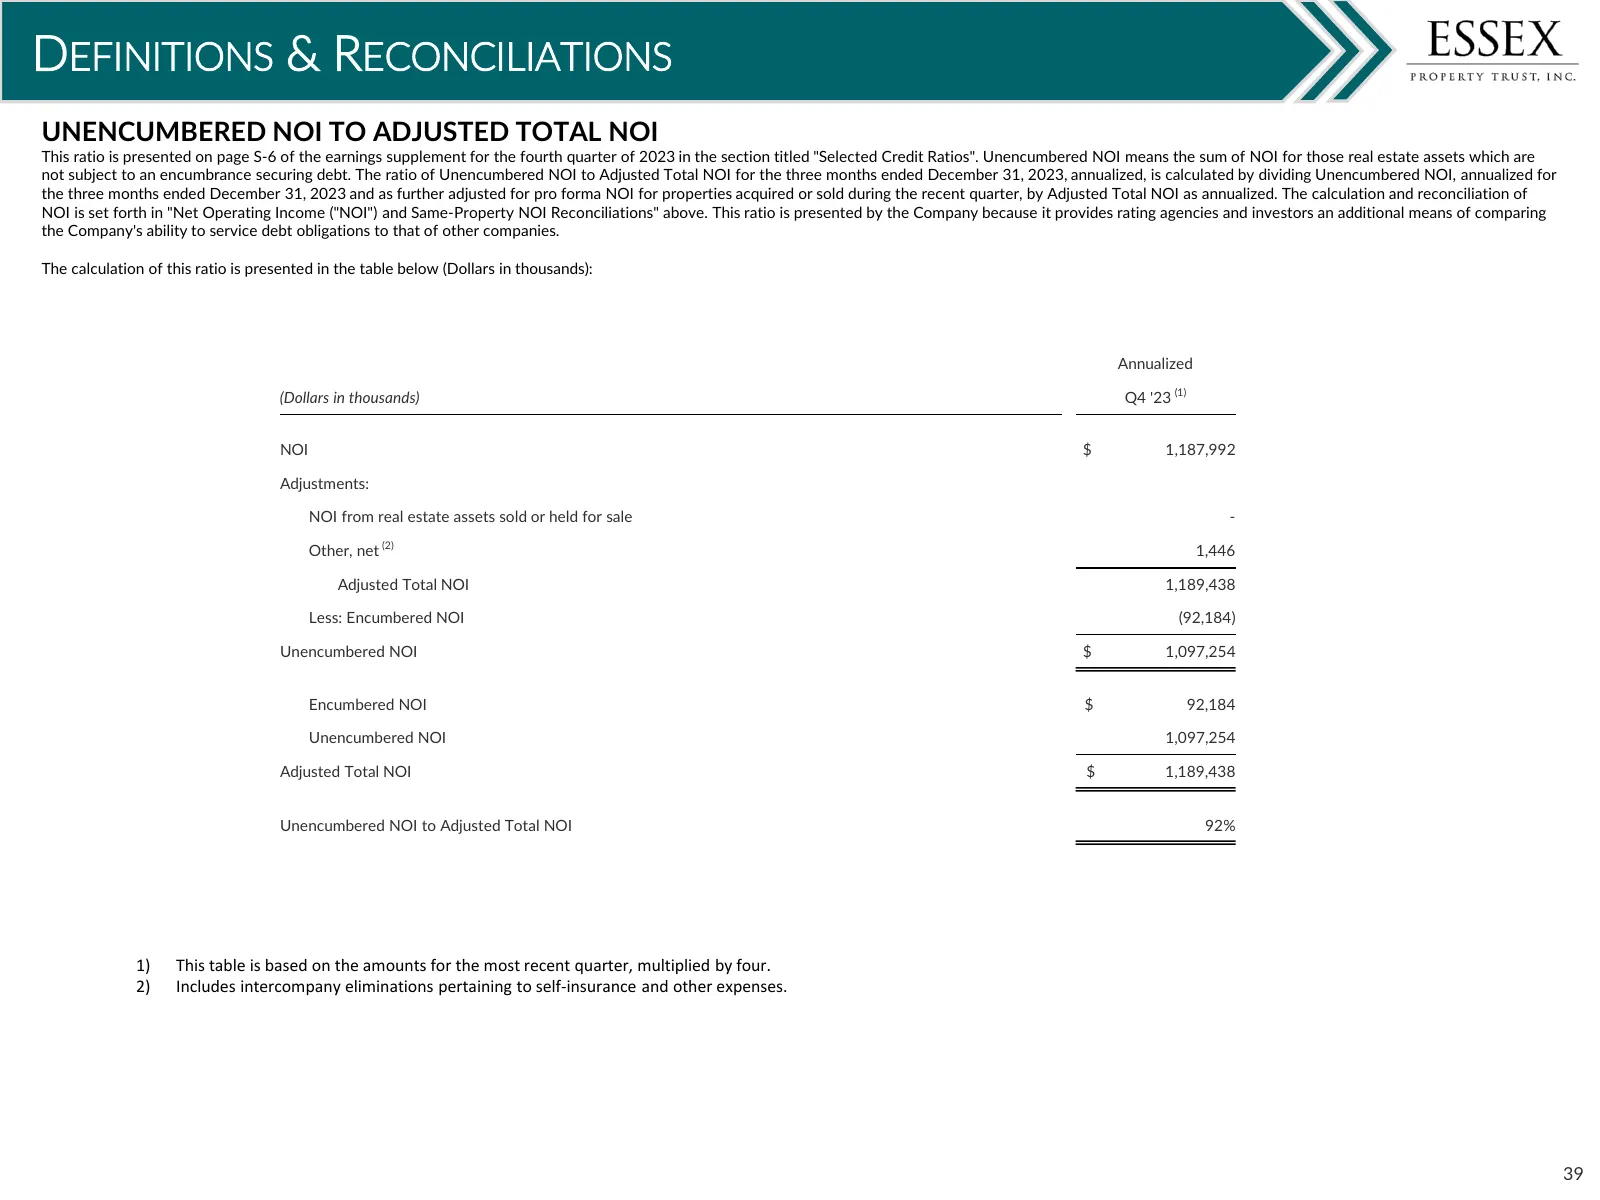
Slide 39: Definitions & Reconciliations
DEFINITIONS & RECONCILIATIONS UNENCUMBERED NOI TO ADJUSTED TOTAL NOI This ratio is presented on page S-6 of the earnings supplement for the fourth quarter of 2023 in the section titled "Selected Credit Ratios". Unencumbered NOI means the sum of NOI for those real estate assets which are not subject
Source: Internet Archive copy of s203.q4cdn.com
More decks from Essex Property Trust, Inc.
 Investor Presentation (September 2026)37 slides · September 2026
 Q2 2026 Earnings Presentation5 slides · July 2026
 Investor Presentation (May 2026)39 slides · May 2026
 Q1 2026 Earnings Presentation31 slides · Apr 29, 2026
 Q1 2026 Earnings Presentation5 slides · April 2026
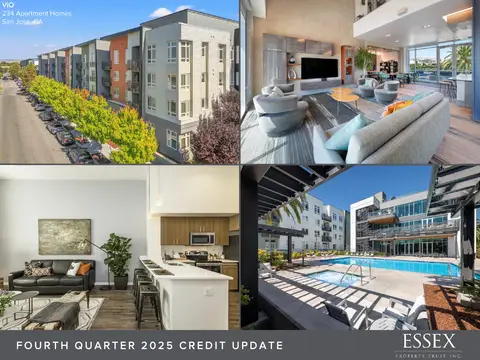 Q4 2025 Earnings Presentation5 slides · Feb 5, 2026