TXCO Resources — Exploration Co of Delaware — Shareholder Meeting (May 2006)
9 slides from TXCO Resources's shareholder meeting presentation, May 15, 2006
Slide 1: Presentation Outline for Annual Shareholders' Meeting Presentations
Exhibit 99.1 Presentation Outline for Annual Shareholders' Meeting Presentations May 12, 2006 Slide 1 - Continuing Growth Annual Meeting of Shareholders Petroleum Club of San Antonio Friday, May 12, 2006 Slide 2 - Corporate Information - Headquarters: The Exploration Company; 500 North Loop 1604 Eas
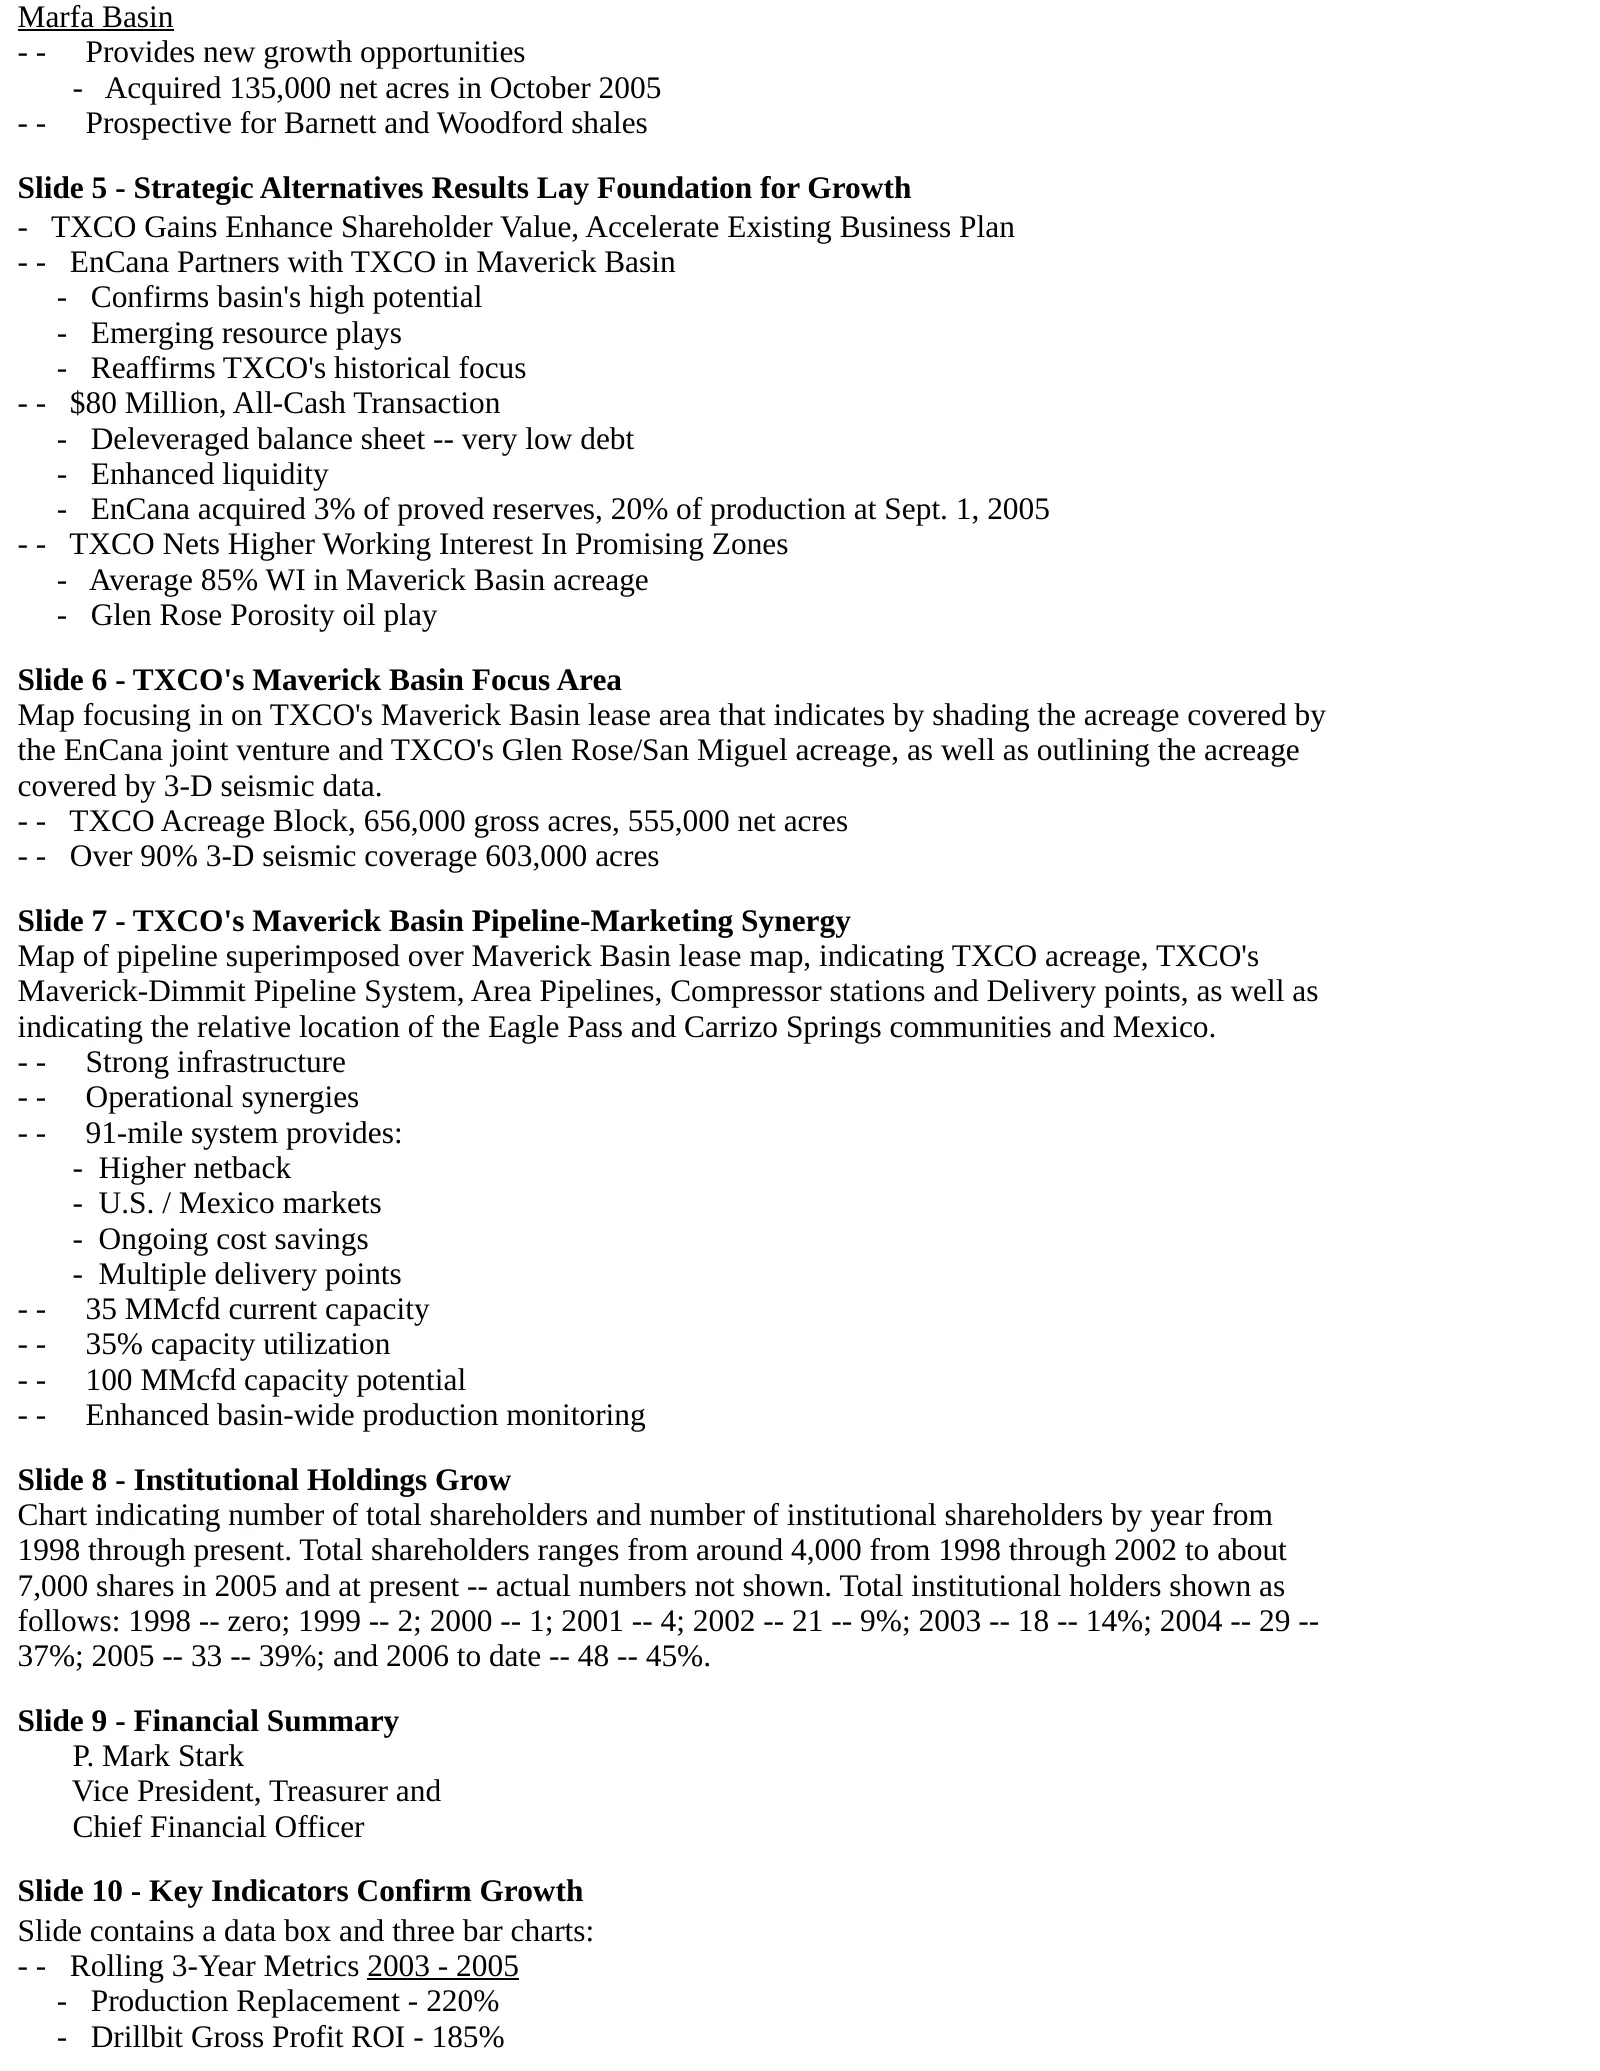
Slide 2: Strategic Alternatives Results Lay Foundation for Growth
Marfa Basin - - Provides new growth opportunities - Acquired 135,000 net acres in October 2005 - - Prospective for Barnett and Woodford shales Slide 5 - Strategic Alternatives Results Lay Foundation for Growth - TXCO Gains Enhance Shareholder Value, Accelerate Existing Business Plan - - EnCana Partn
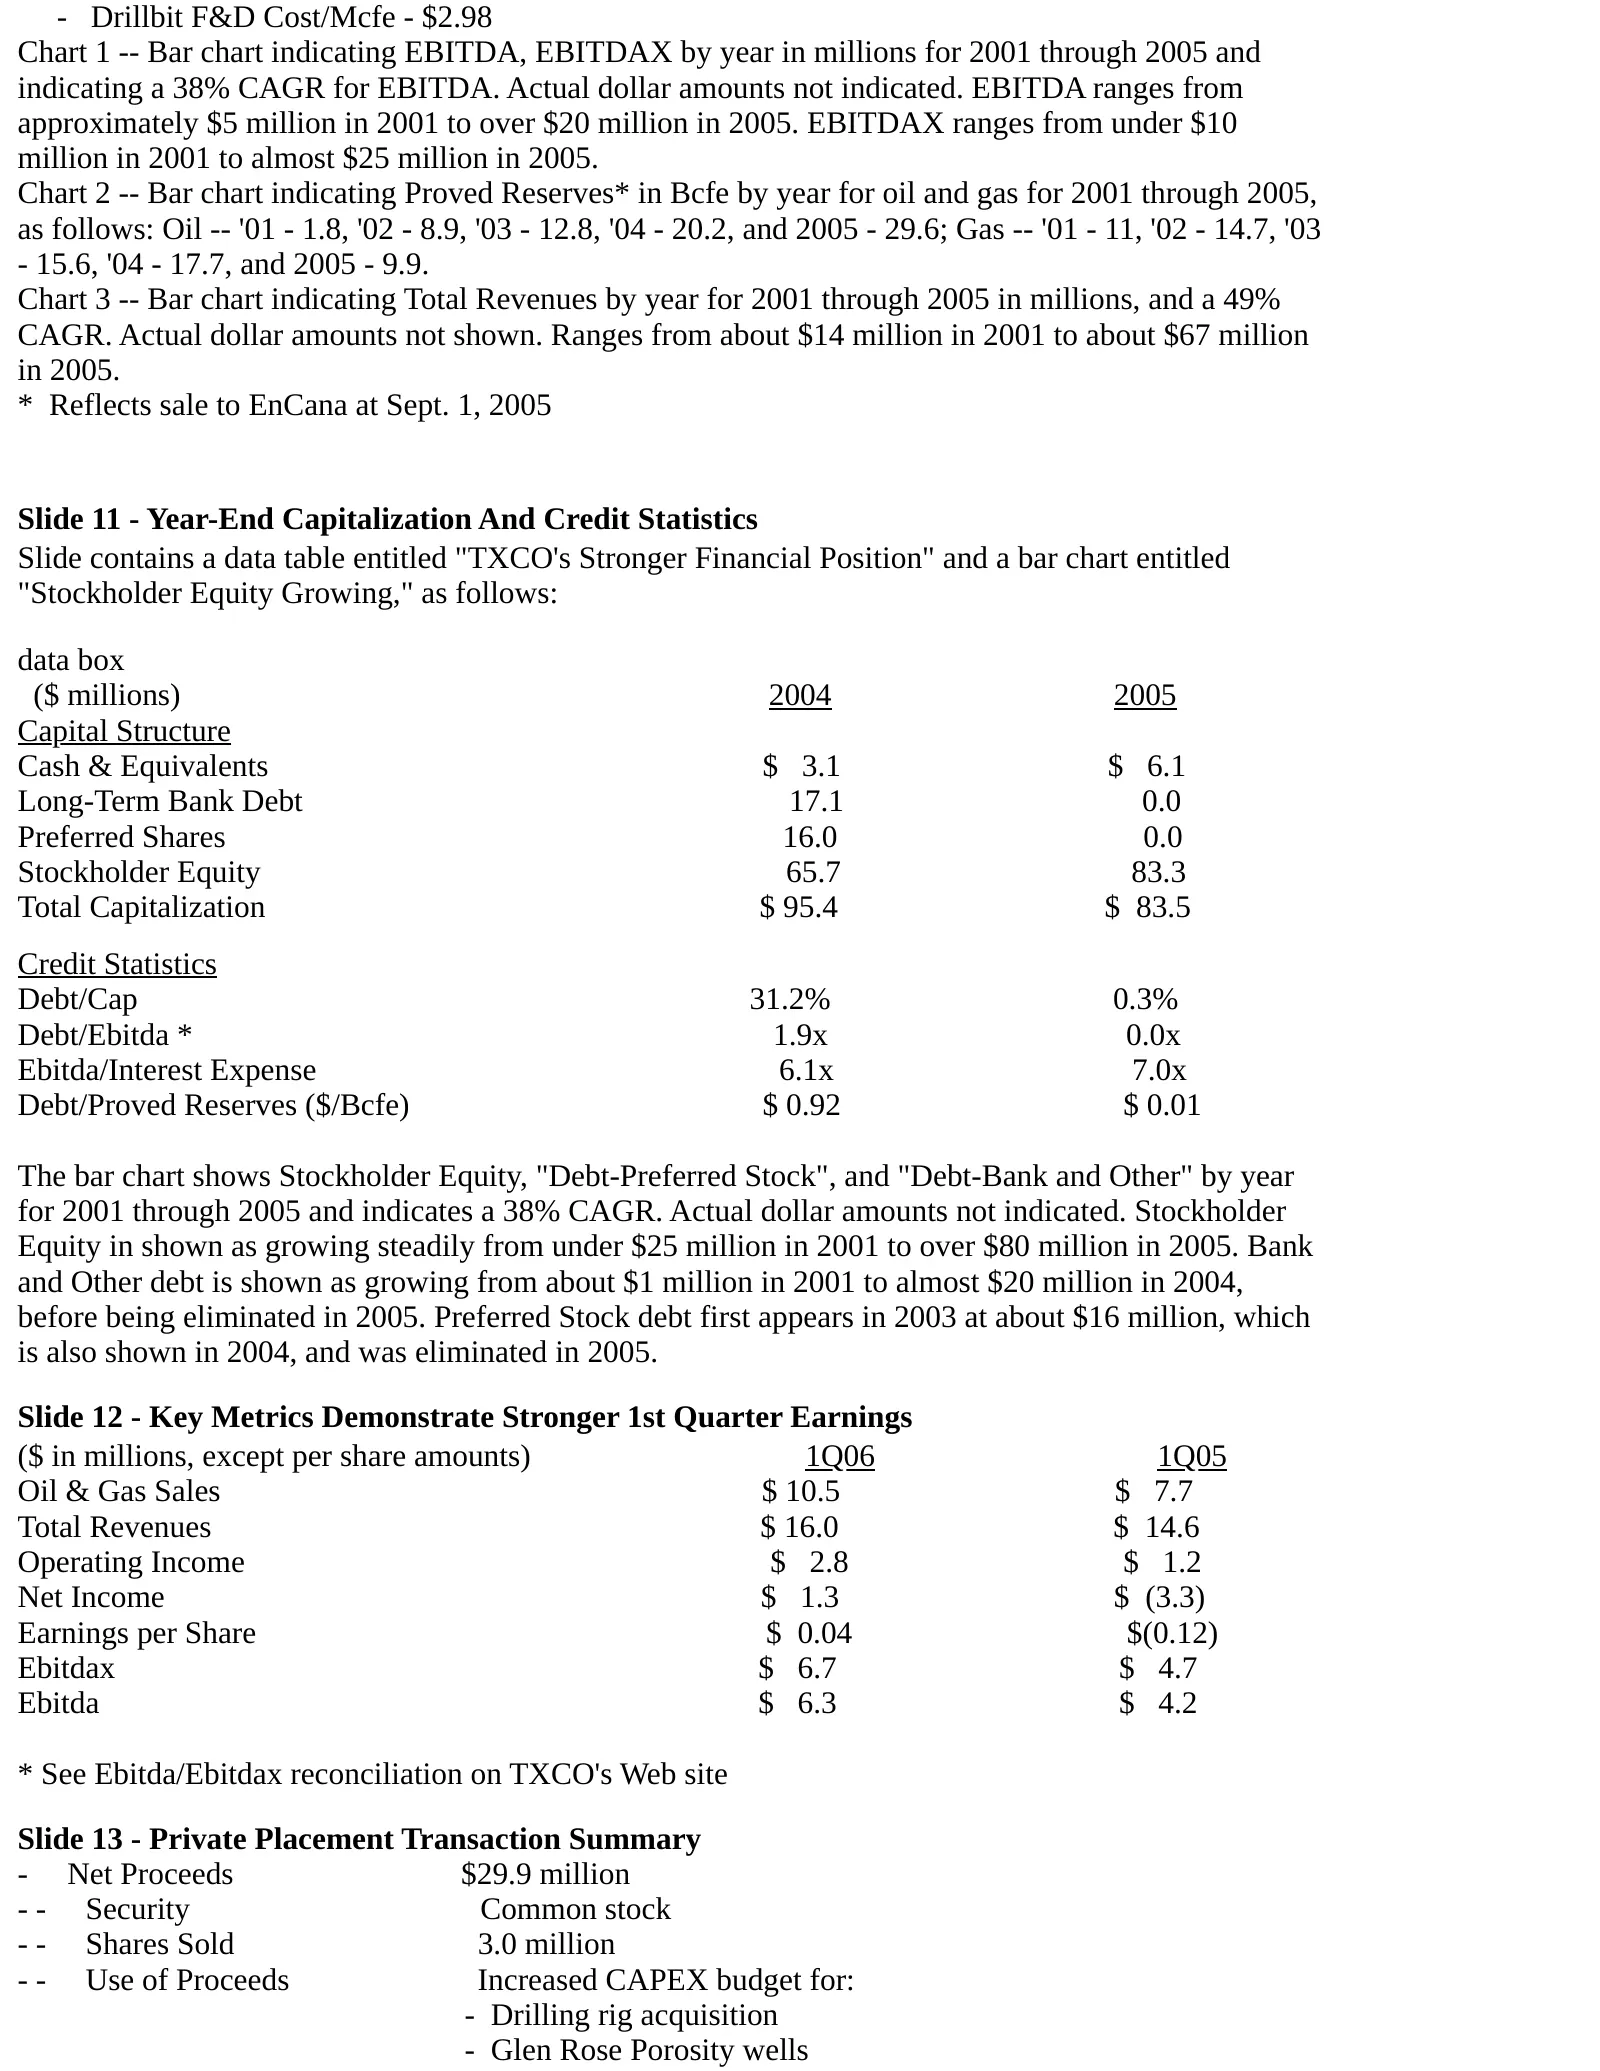
Slide 3: Key Indicators and Year-End Capitalization
- Drillbit F&D Cost/Mcfe - $2.98 Chart 1 -- Bar chart indicating EBITDA, EBITDAX by year in millions for 2001 through 2005 and indicating a 38% CAGR for EBITDA. Actual dollar amounts not indicated. EBITDA ranges from approximately $5 million in 2001 to over $20 million in 2005. EBITDAX ranges from u
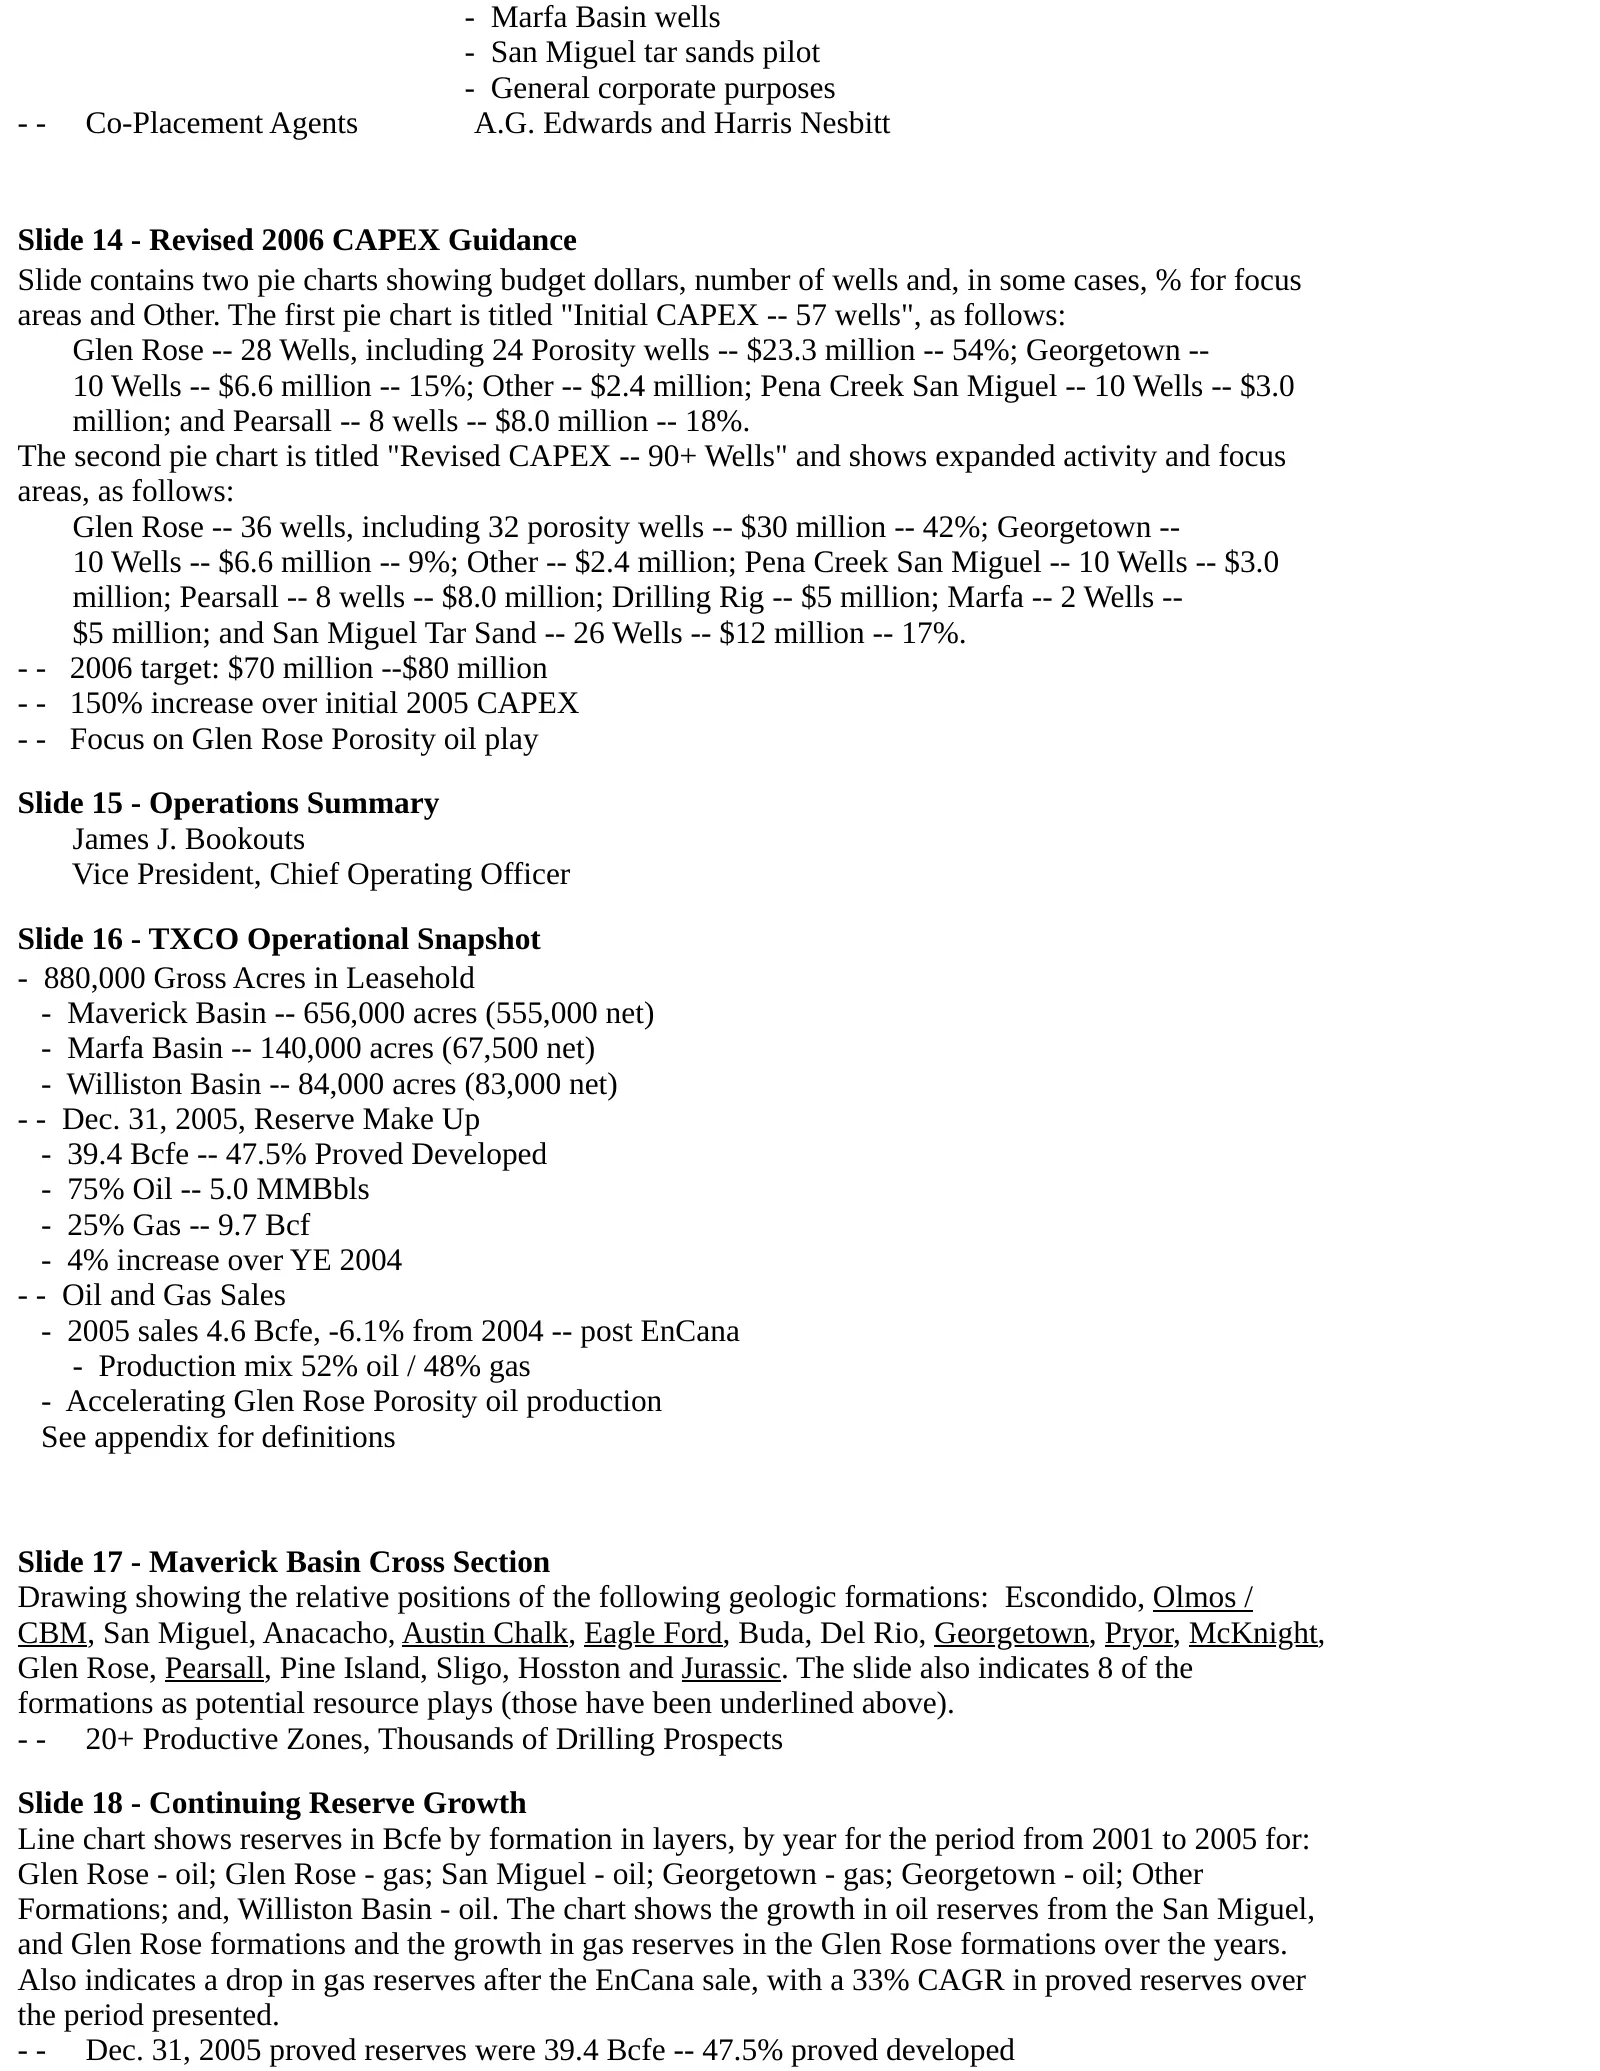
Slide 4: Revised 2006 CAPEX Guidance
- Marfa Basin wells - San Miguel tar sands pilot - General corporate purposes -- Co-Placement Agents A.G. Edwards and Harris Nesbitt Slide 14 - Revised 2006 CAPEX Guidance Slide contains two pie charts showing budget dollars, number of wells and, in some cases, % for focus areas and Other. The first
Slide 5: Maverick Basin Core Focus Glen Rose Porosity Oil Play
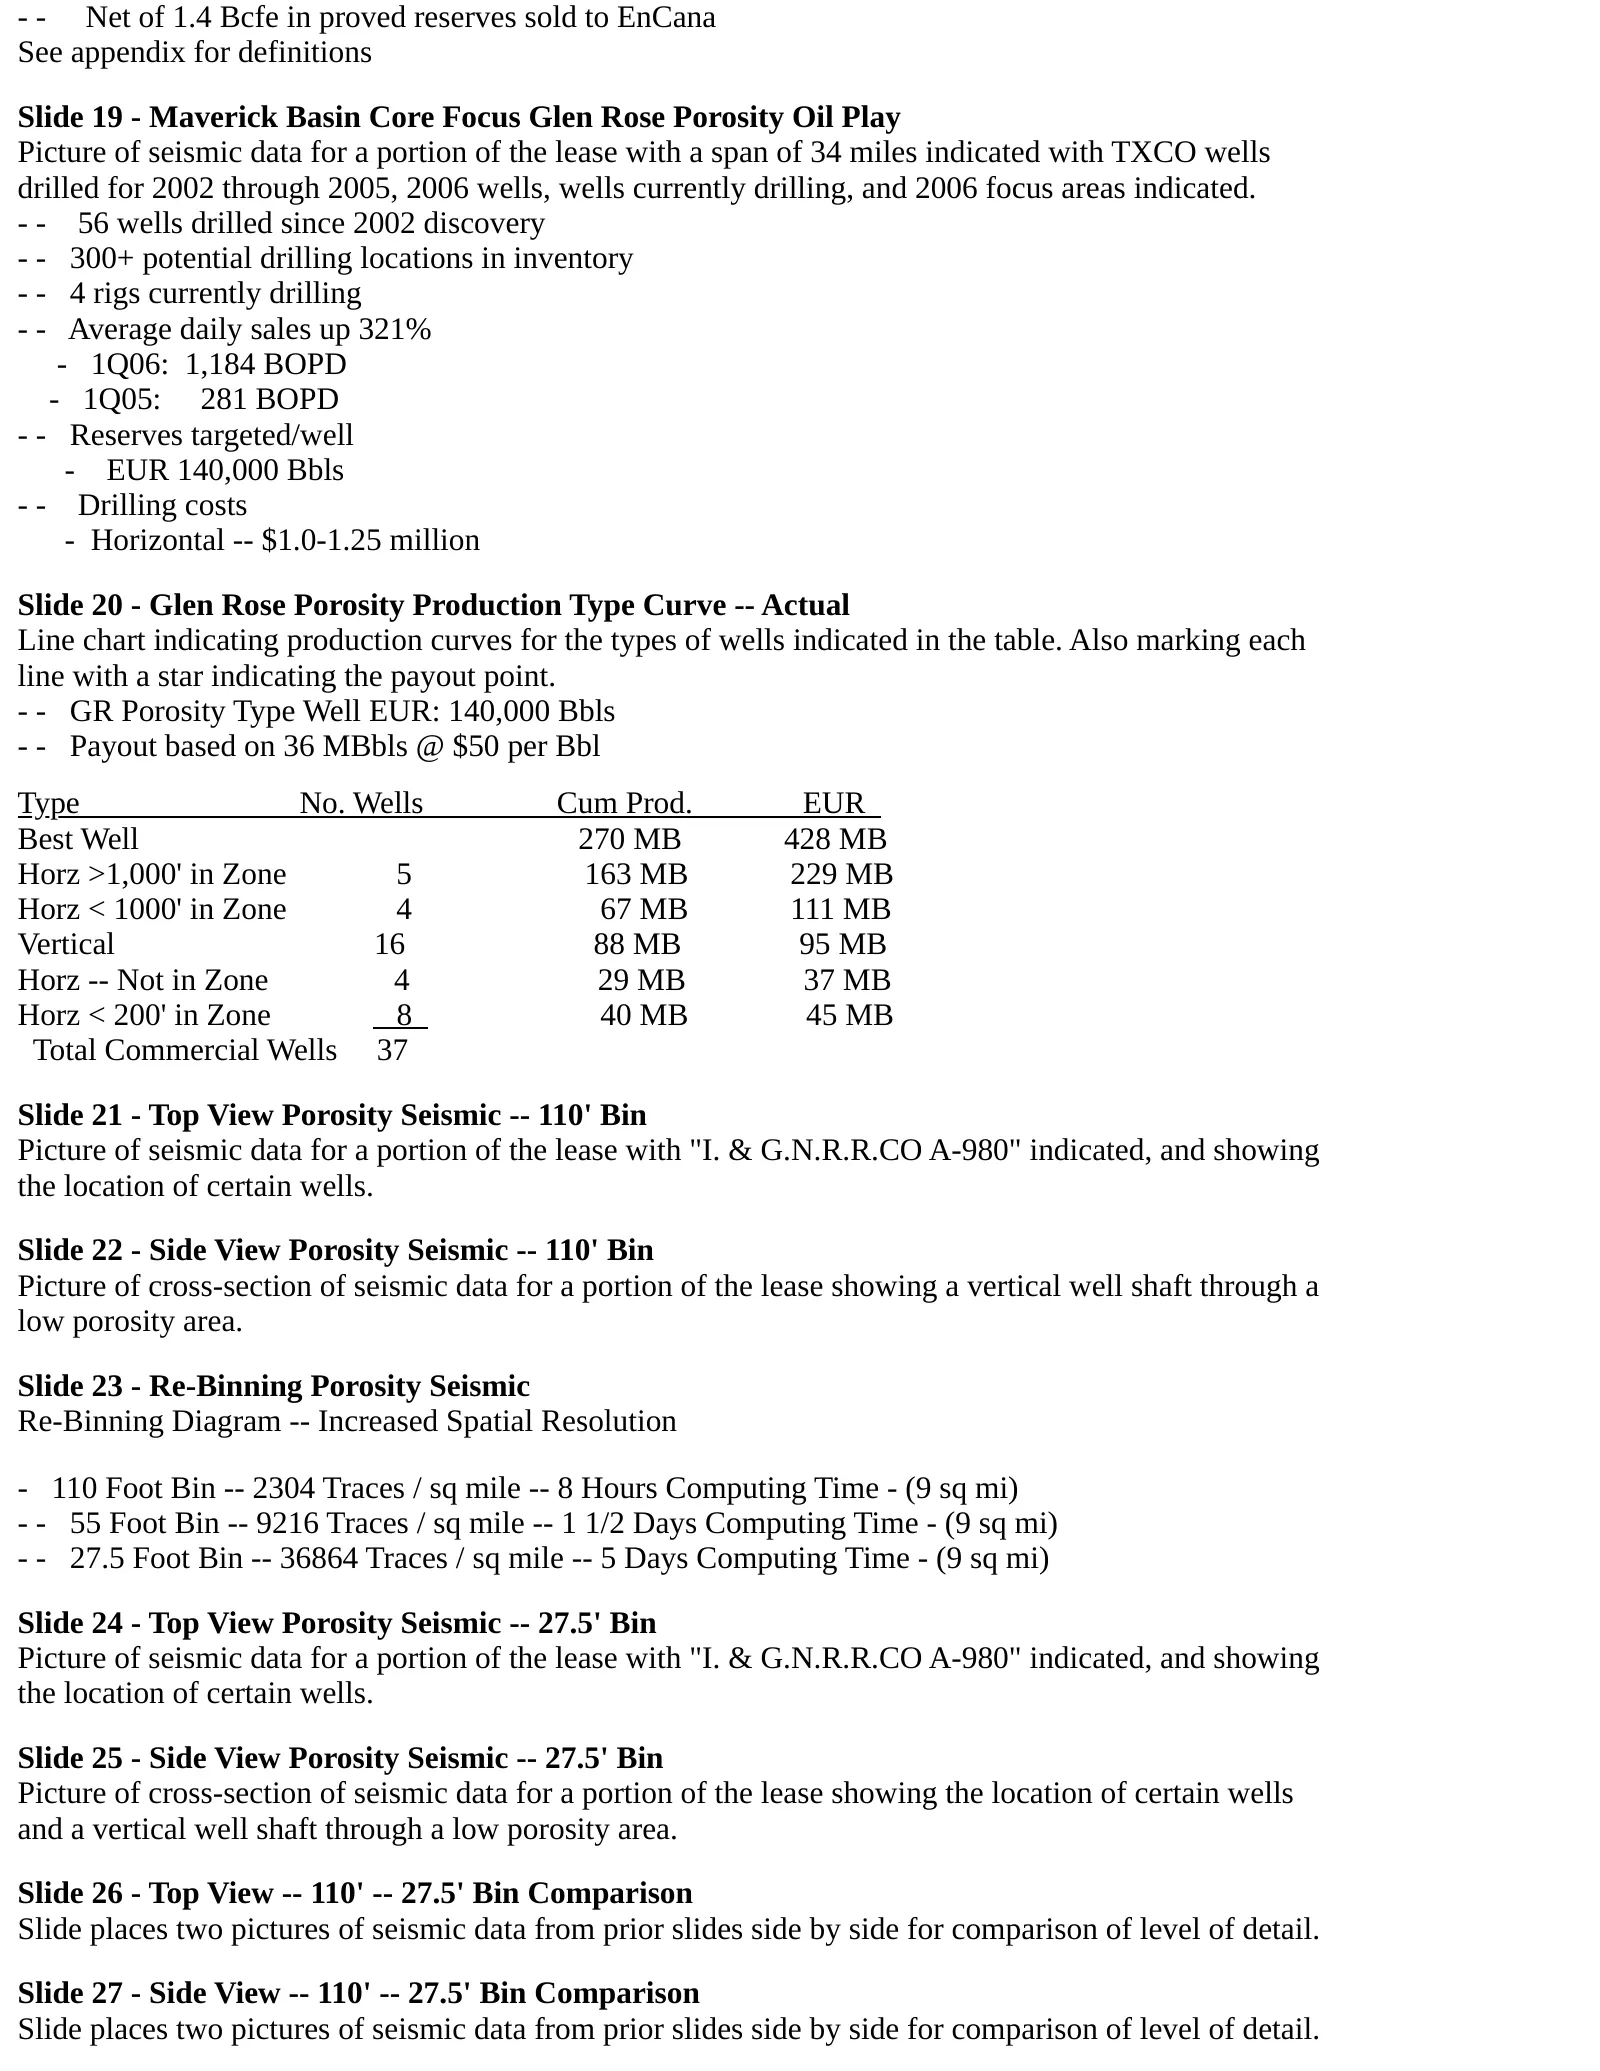
- - Net of 1.4 Bcfe in proved reserves sold to EnCana See appendix for definitions Slide 19 - Maverick Basin Core Focus Glen Rose Porosity Oil Play Picture of seismic data for a portion of the lease with a span of 34 miles indicated with TXCO wells drilled for 2002 through 2005, 2006 wells, wells cu
Slide 6: TXCO's Other 2006 Maverick Basin Plays
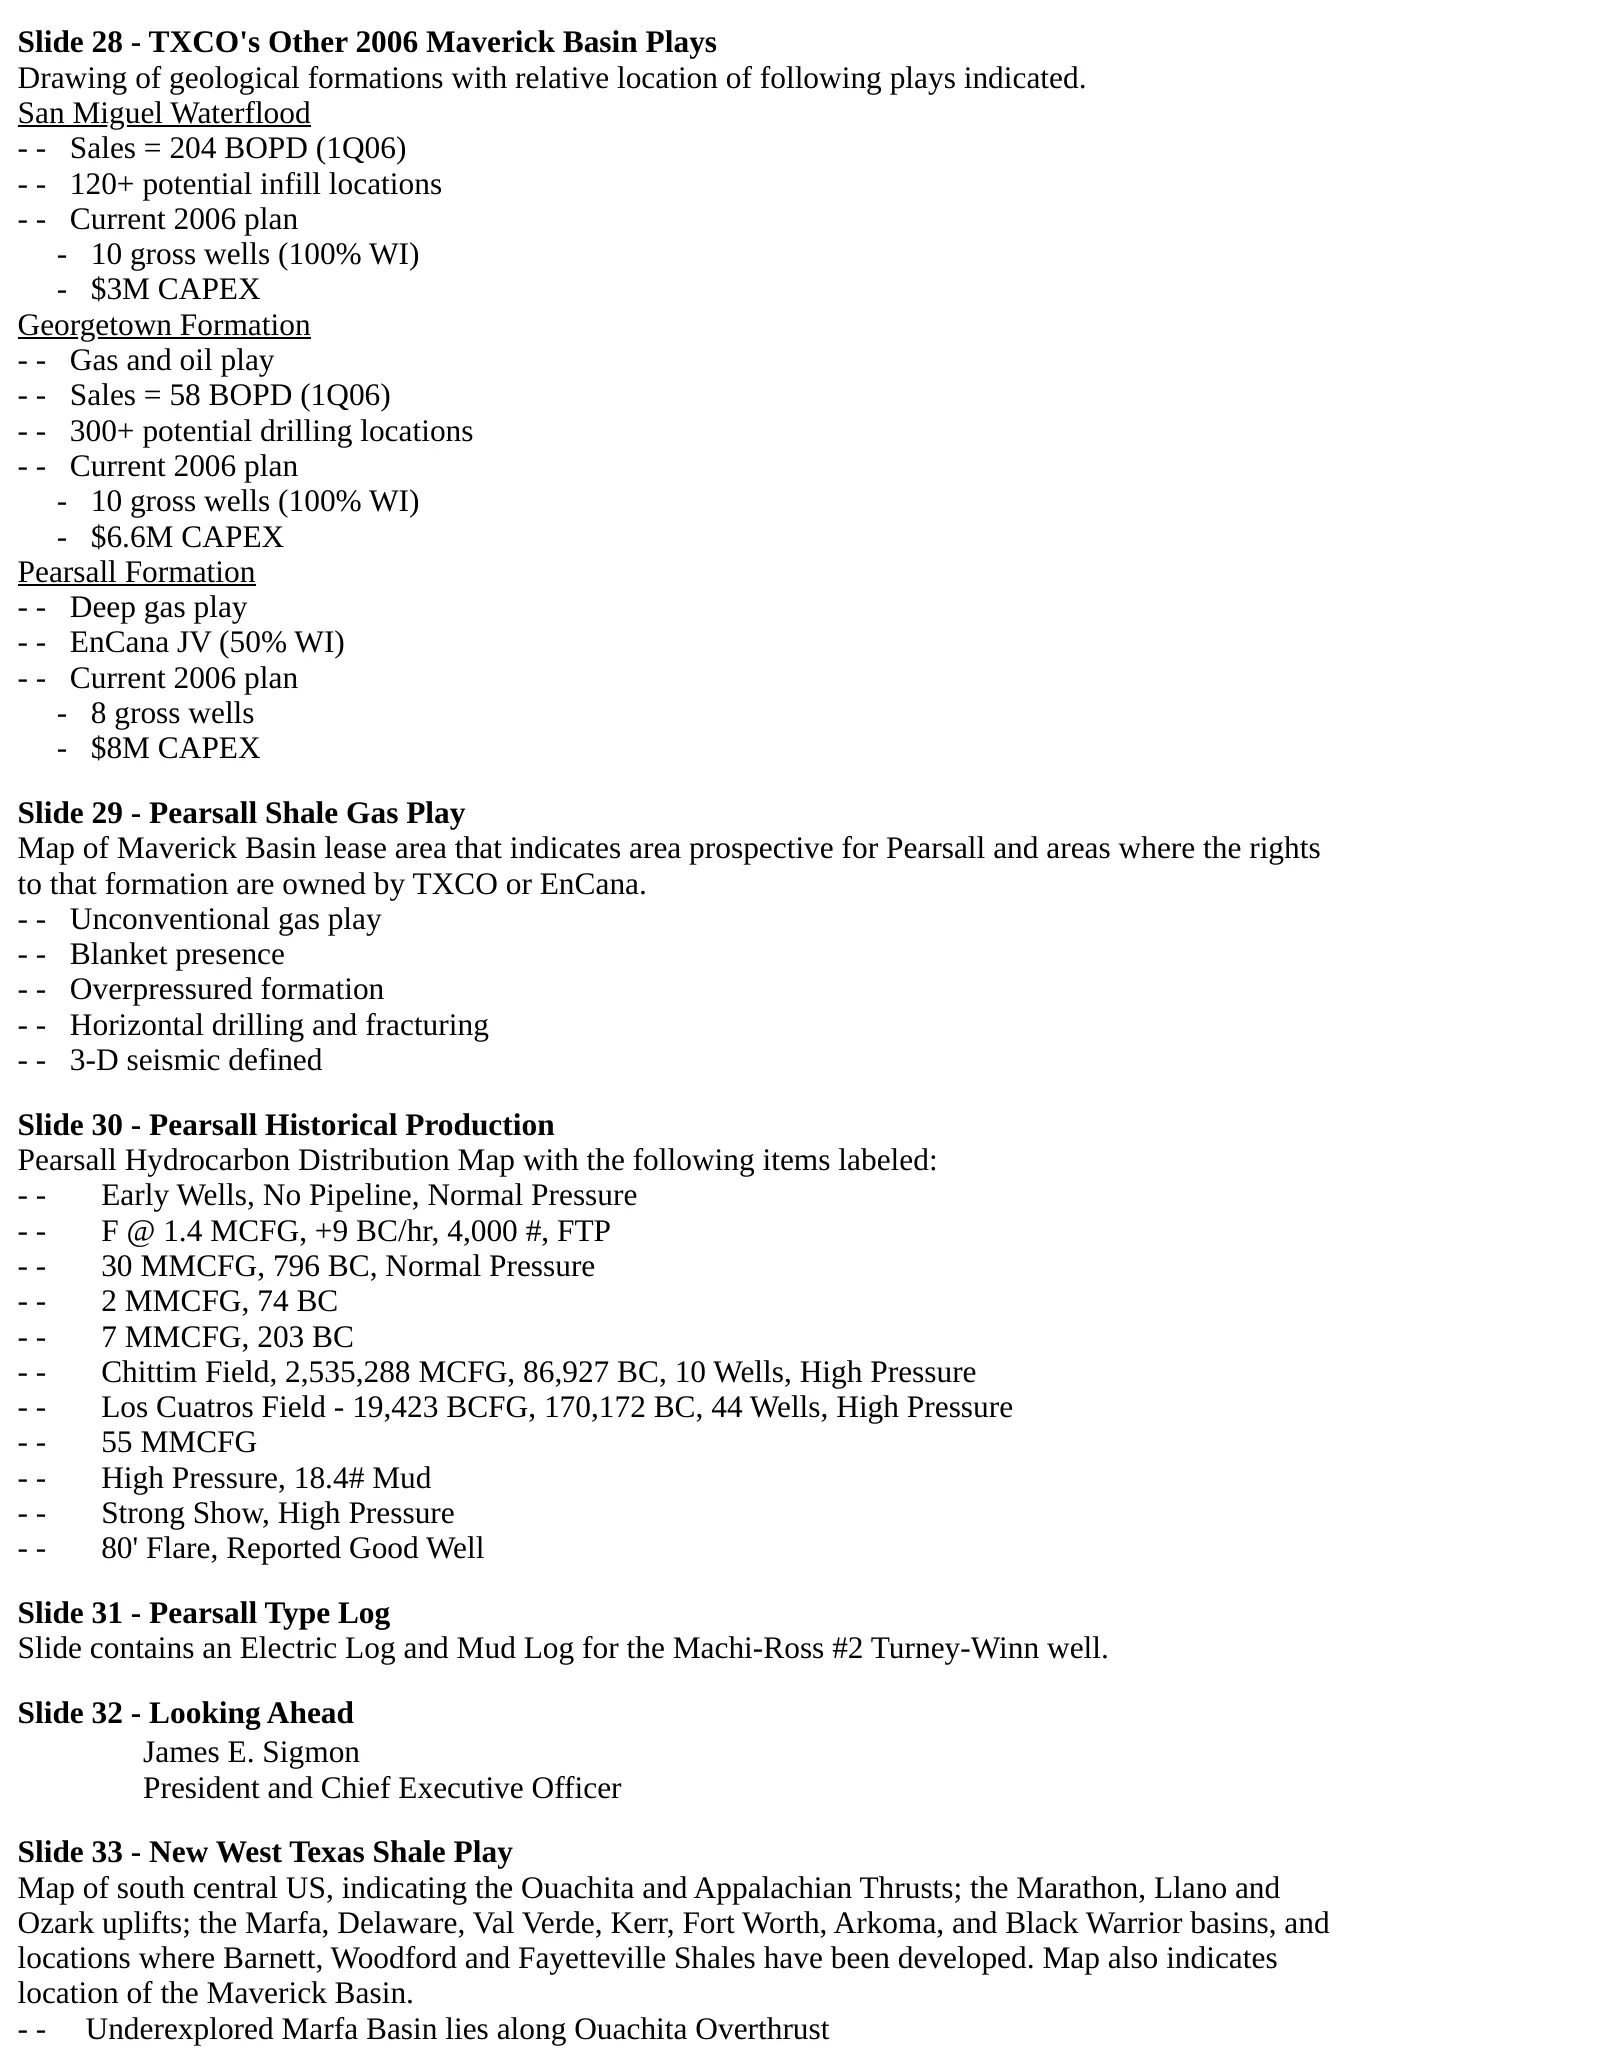
Slide 28 - TXCO's Other 2006 Maverick Basin Plays Drawing of geological formations with relative location of following plays indicated. San Miguel Waterflood - - Sales = 204 BOPD (1Q06) - - 120+ potential infill locations - - Current 2006 plan - 10 gross wells (100% WI) - $3M CAPEX Georgetown Format
Slide 7: Marfa Basin Well Log Cross Section
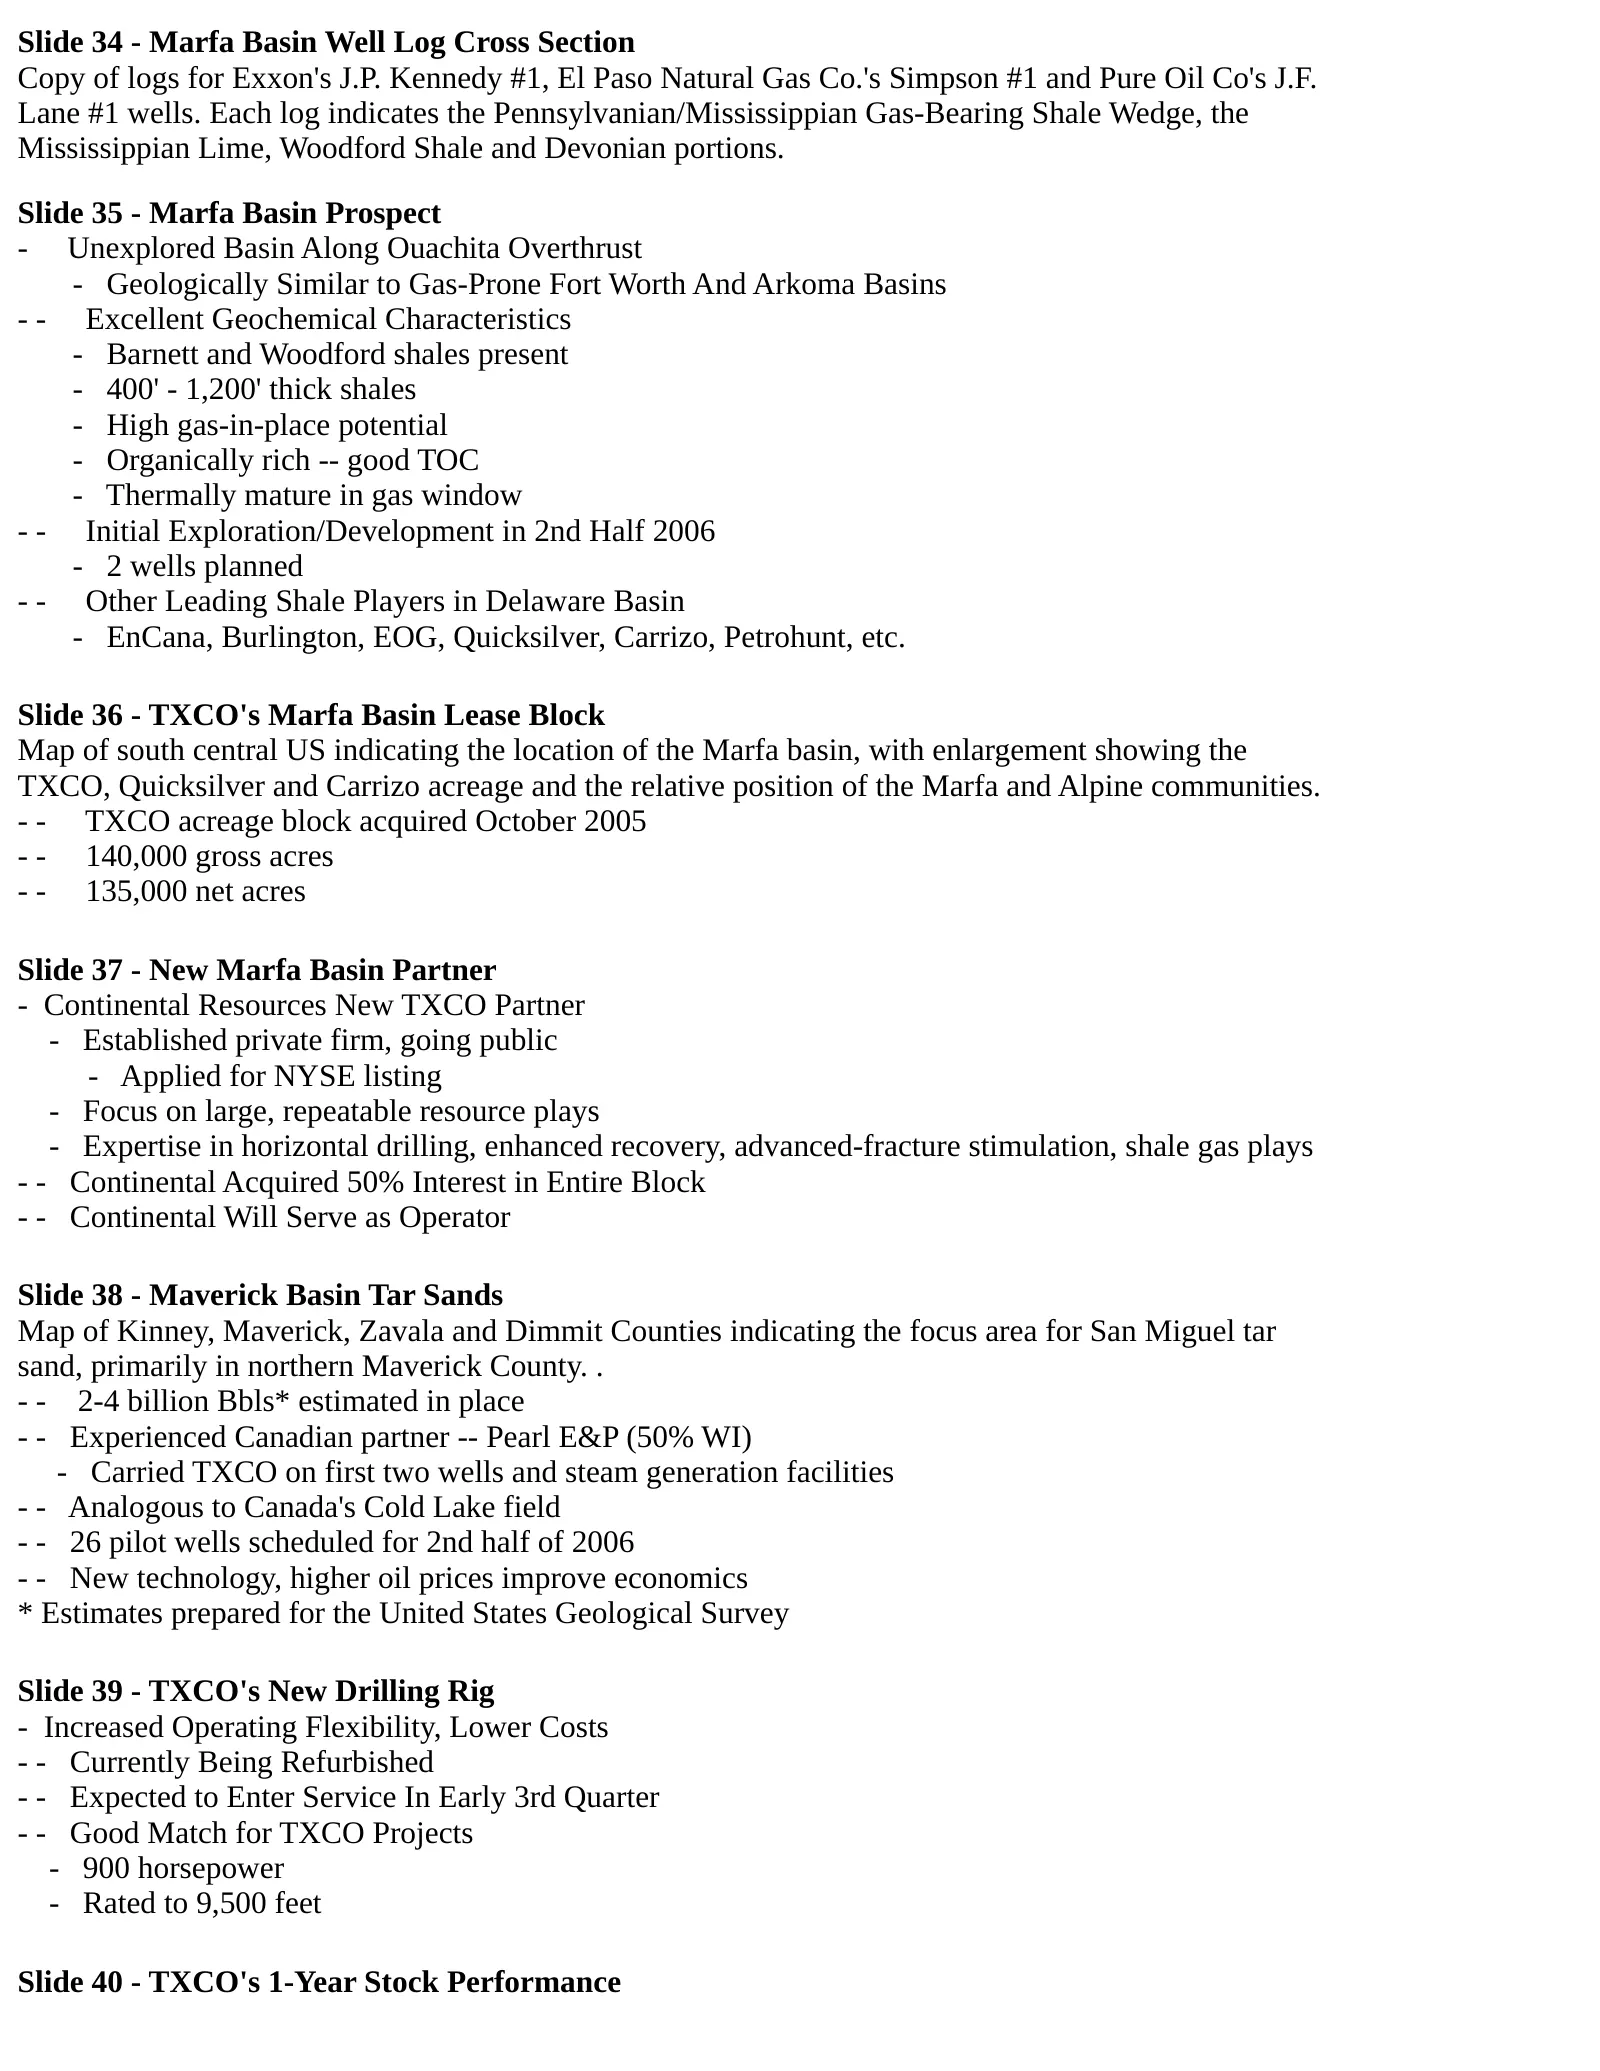
Slide 34 - Marfa Basin Well Log Cross Section Copy of logs for Exxon's J.P. Kennedy #1, El Paso Natural Gas Co.'s Simpson #1 and Pure Oil Co's J.F. Lane #1 wells. Each log indicates the Pennsylvanian/Mississippian Gas-Bearing Shale Wedge, the Mississippian Lime, Woodford Shale and Devonian portions.
Slide 8: Why Own TXCO Now?
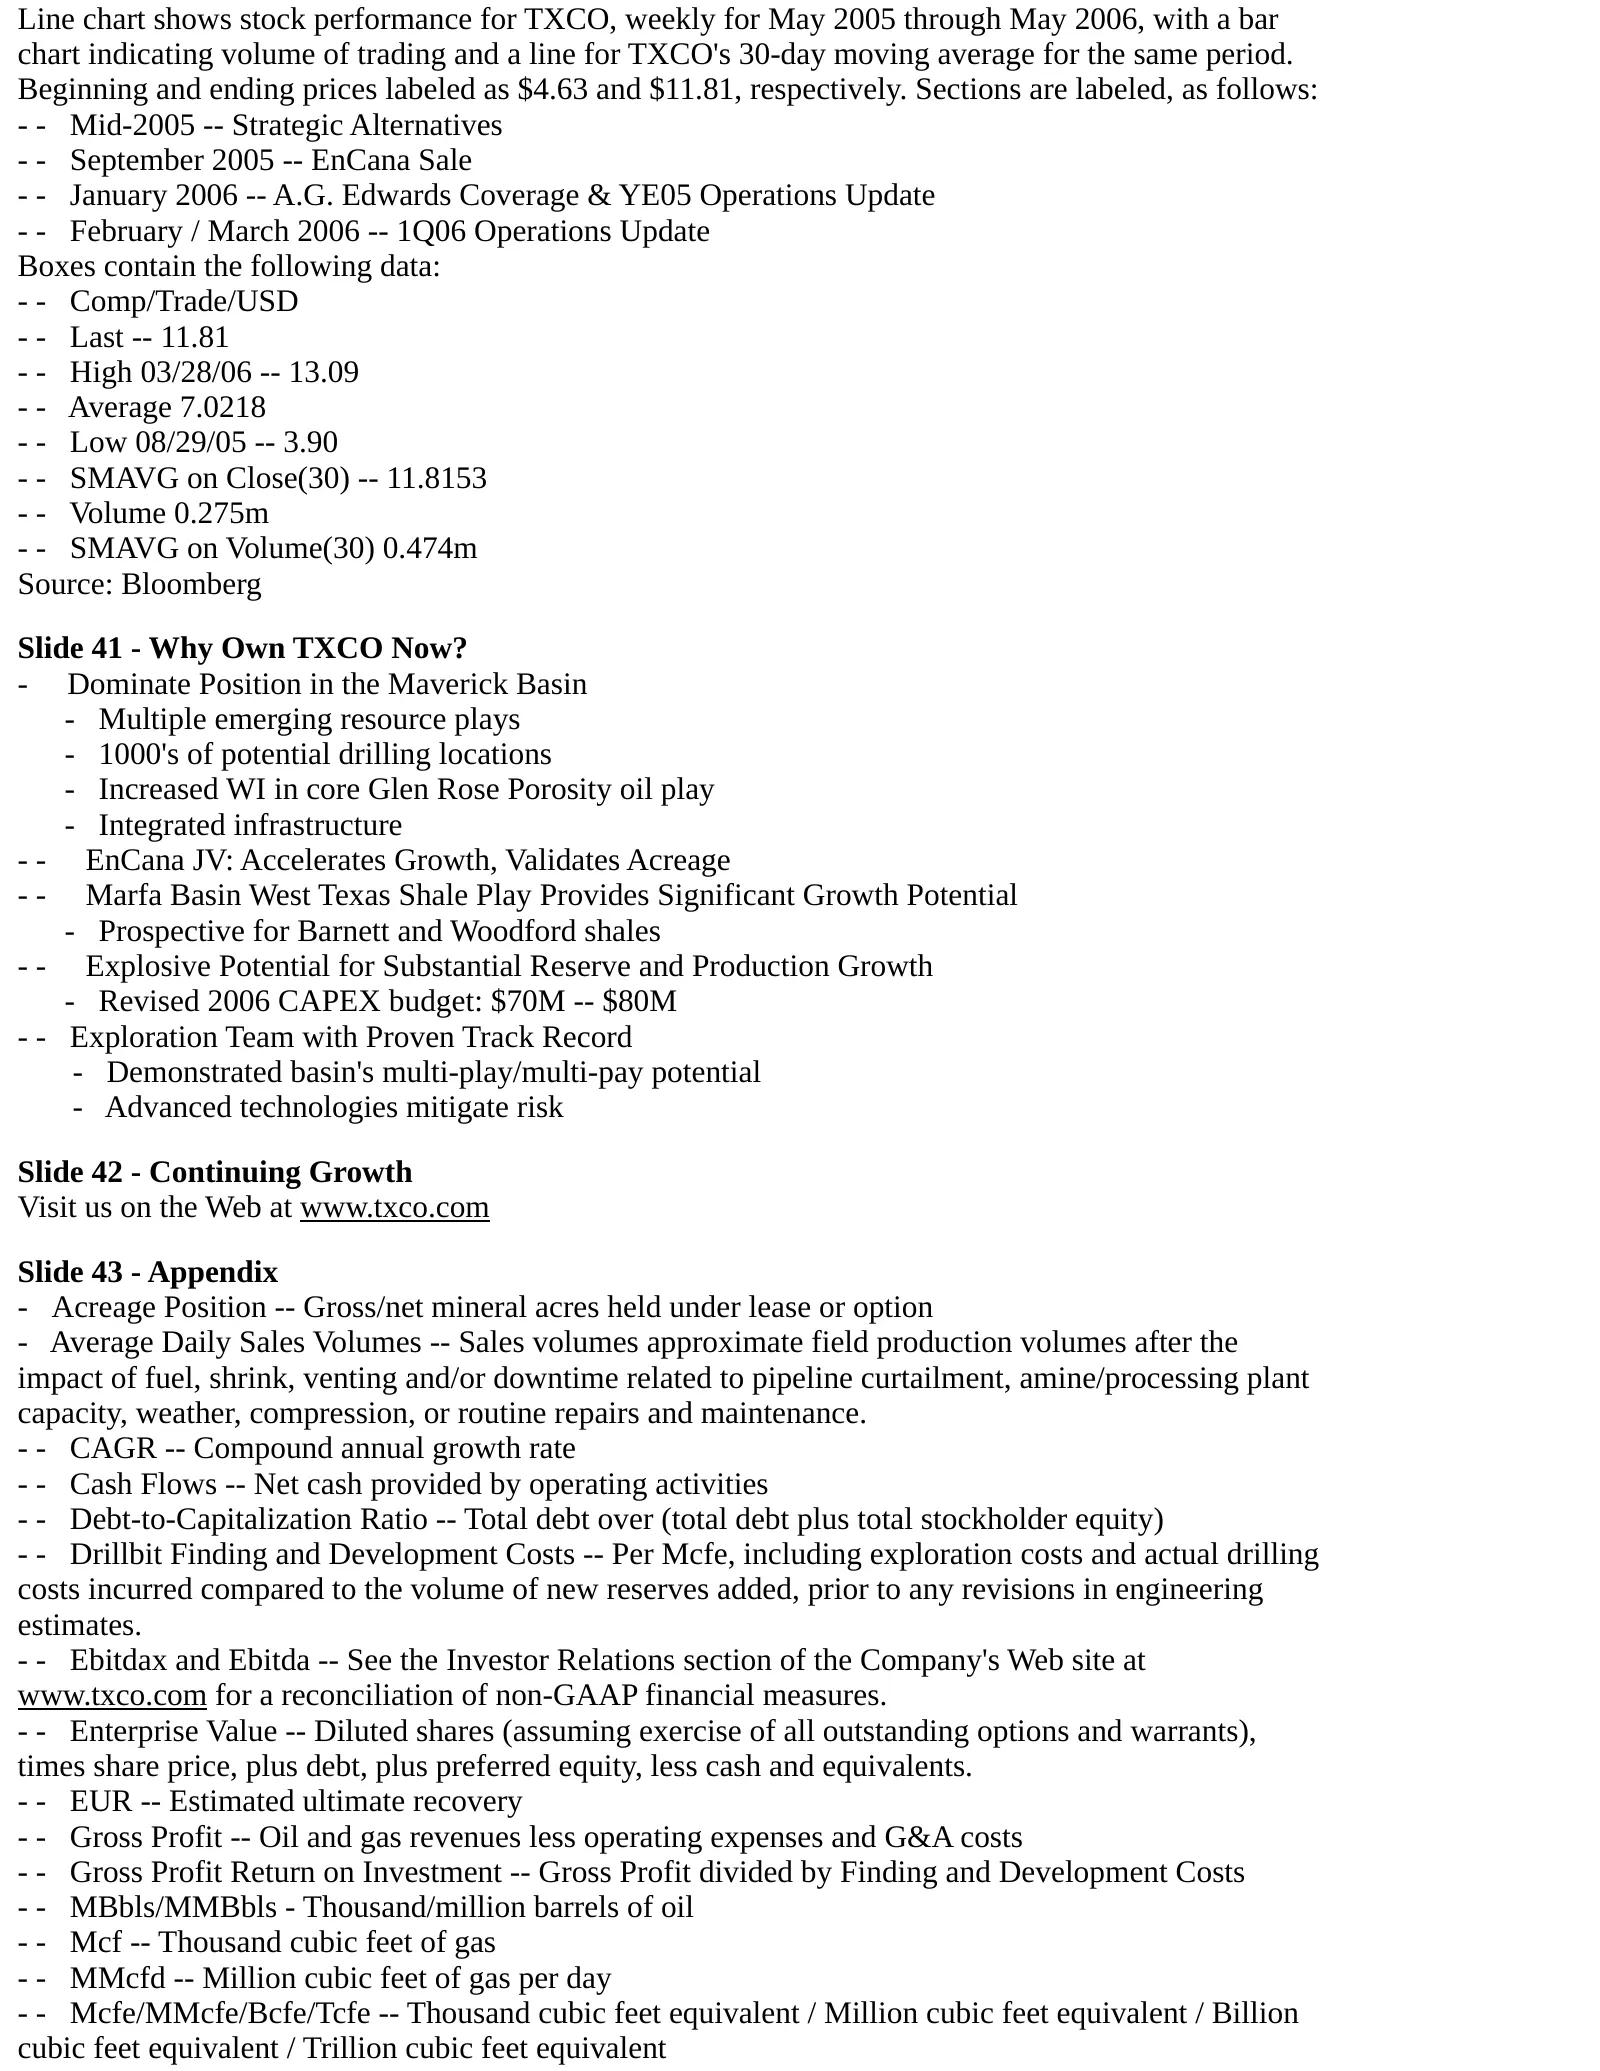
Line chart shows stock performance for TXCO, weekly for May 2005 through May 2006, with a bar chart indicating volume of trading and a line for TXCO's 30-day moving average for the same period. Beginning and ending prices labeled as $4.63 and $11.81, respectively. Sections are labeled, as follows: -
Slide 9: Definitions
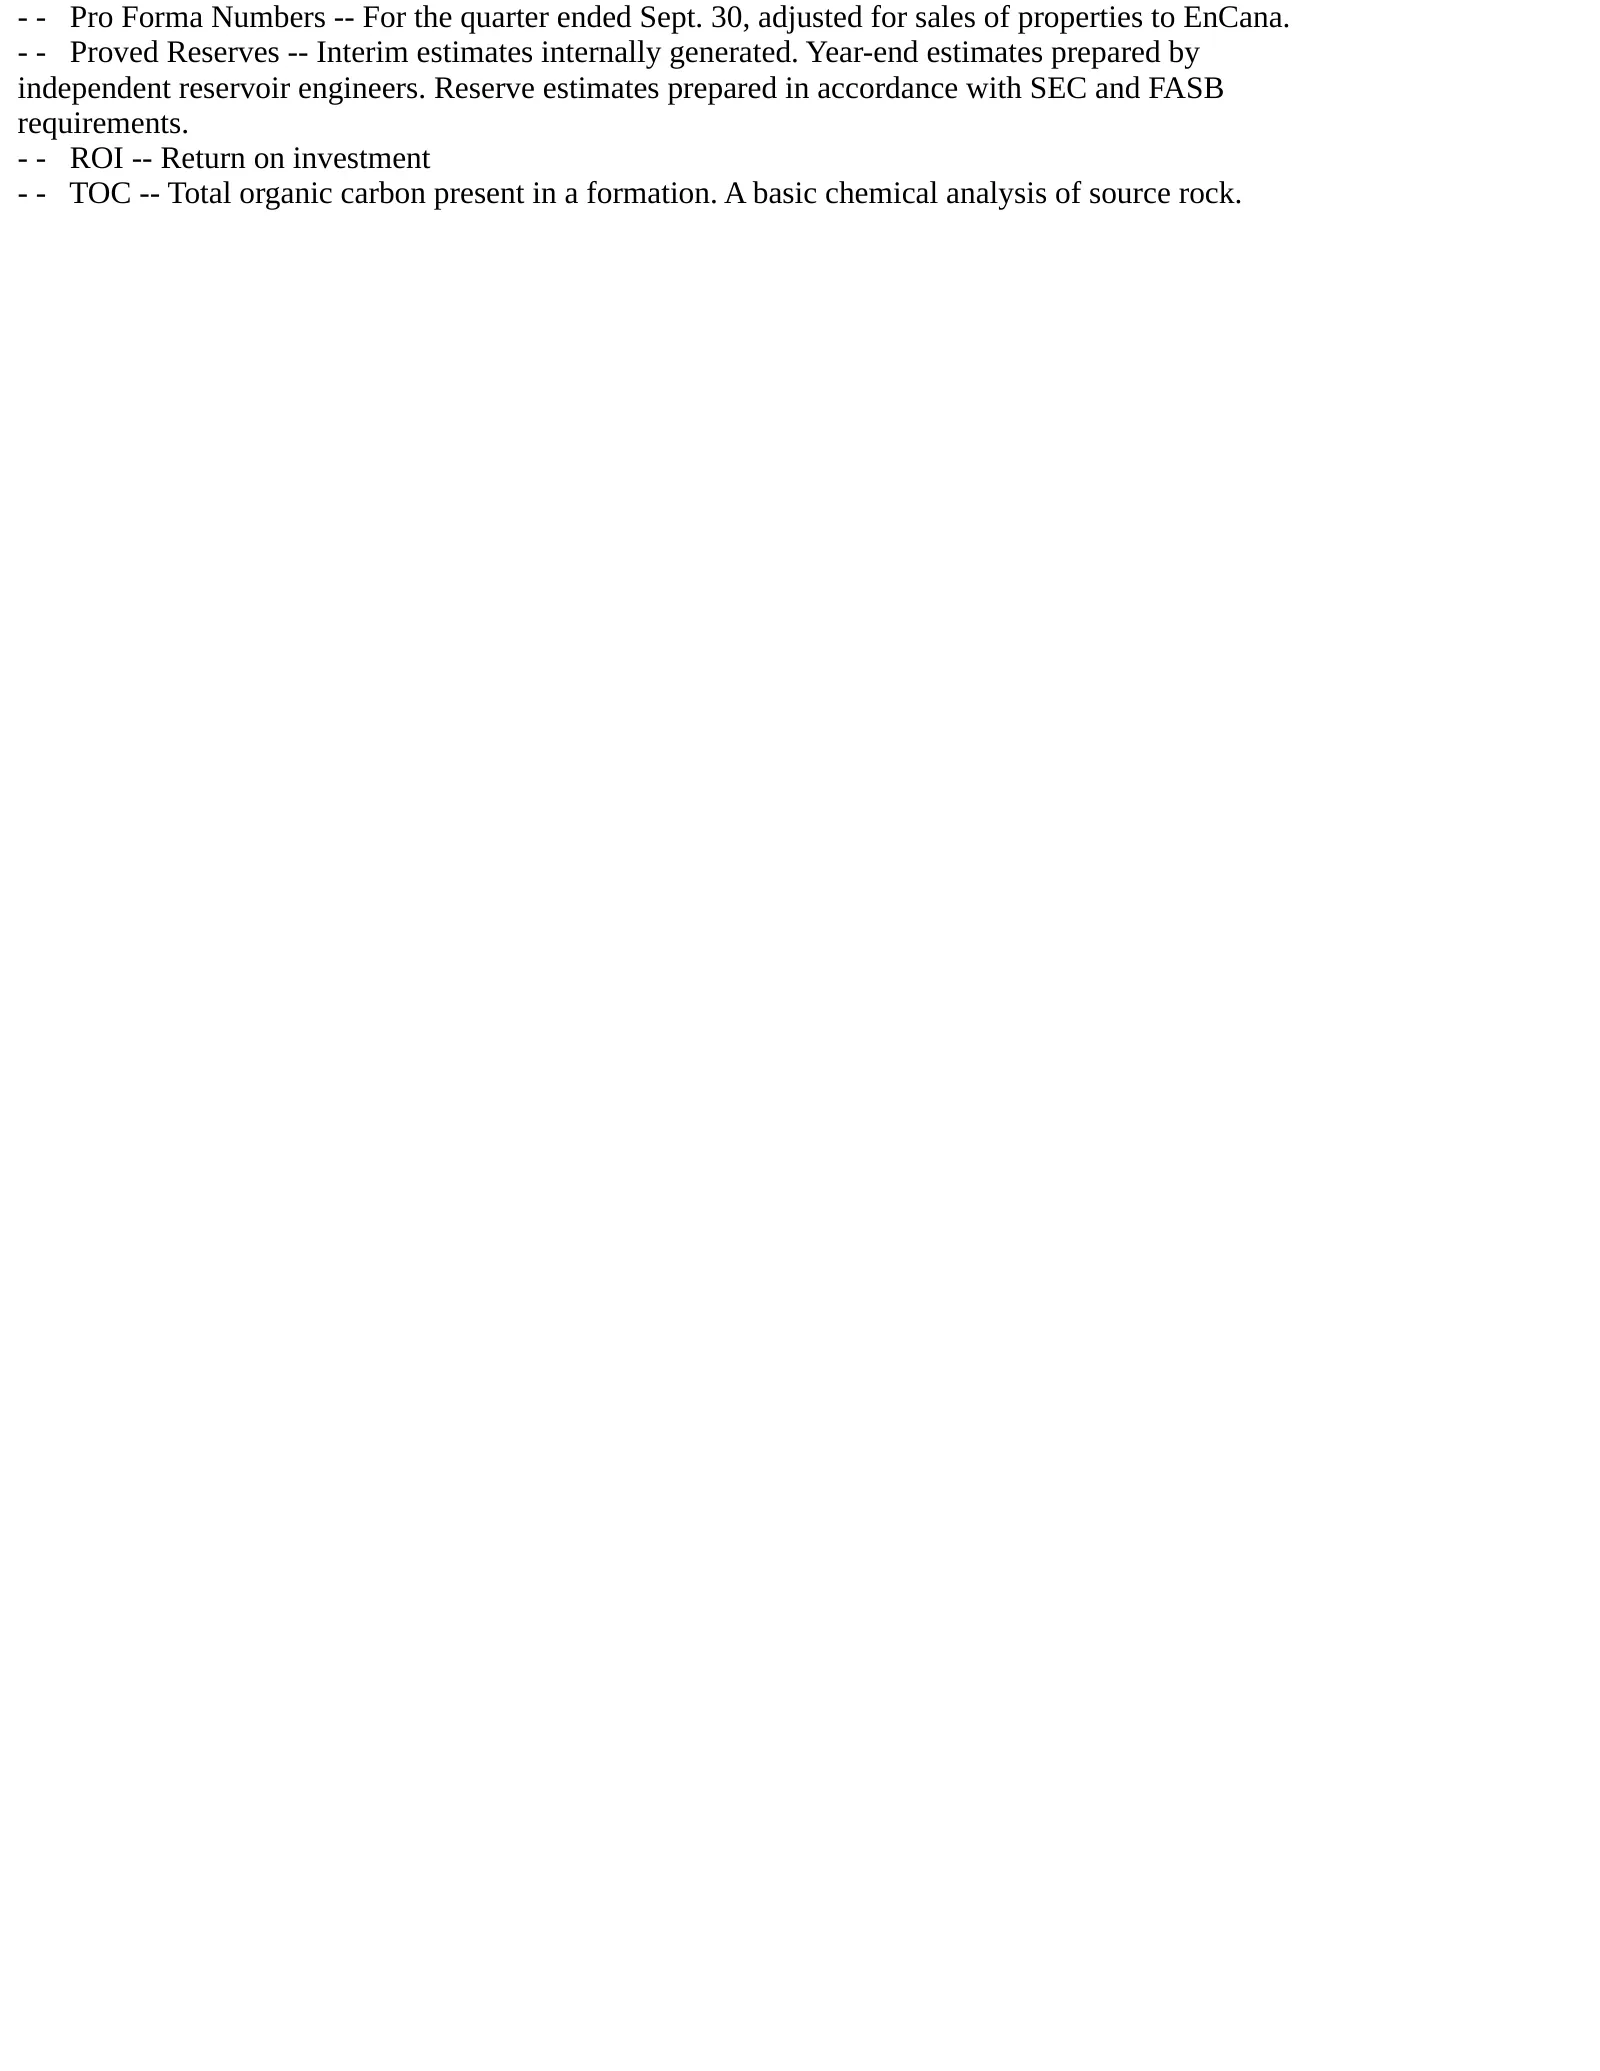
- - Pro Forma Numbers -- For the quarter ended Sept. 30, adjusted for sales of properties to EnCana. - - Proved Reserves -- Interim estimates internally generated. Year-end estimates prepared by independent reservoir engineers. Reserve estimates prepared in accordance with SEC and FASB requirements.
Source: SEC EDGAR · 8-K filed May 15, 2006
More decks from TXCO Resources Inc
 IPAA Oil and Gas Investment Symposium 200710 slides · Oct 1, 2007
 Investor Presentation (June 2007)15 slides · Jun 20, 2007
 Exploration Co of Delaware — Shareholder Meeting (May 2007)11 slides · May 16, 2007
 Exploration Co of Delaware — IPAA Oil and Gas Investment Symposium April 200710 slides · Apr 23, 2007
 Exploration Co of Delaware — Howard Weil 35th Annual Energy Conference 200711 slides · Apr 9, 2007
 Exploration Co of Delaware — A.G. Edwards Energy Conference 200712 slides · Mar 20, 2007