Met-Pro — 2010 Maxim Group Growth Conference
21 slides from Met-Pro's conference presentation, Nov 18, 2010
Slide 1: 2010 Maxim Group Growth Conference
valk CORPORATION 2010 Maxim Group Growth Conference November 18, 2010 Www.met-pro.com

Slide 2: Forward-looking statements
This presentation includes forward-looking statements which reflect the Company’s current views with respect to future events and financial performance, but involve uncertainties that could significantly impact results. The Private Securities Litigation Reform Act of 1995 provides a “safe harbor” fo

Slide 3: Company Profile
Company Profile • Leading niche-oriented global provider of solutions and products for product recovery, pollution control, and fluid handling applications • Diverse, synergistic product offering • Strong global brand recognition • Approximately 40% of sales derived from recurring parts and consumab

Slide 4: Investment Highlights
Investment Highlights • Provider of green technologies for: – Air – Water • Market leader in numerous niche-markets • Strong balance sheet – High cash balance – Low debt • Strong cash flows from operating activities • Flexible manufacturing strategy – Minimizes growth constraints – Increases global

Slide 5: Recent Events
Recent Events • Acquired the assets of Bio-Reaction Industries LLC – Patented biological technology – Complements existing technologies – Strengthens our “total air solutions” value proposition • Global Pump Solutions business unit receives largest pump order in its history, totaling $3.7 million •

Slide 6: Continuous Improvement
Continuous Improvement • Accretive acquisitions, technology licensing and strategic business partnerships • Efficiency improvements and lower costs realized through: – “Lean” enterprise initiative – Global sourcing – More effective logistics – Flexible manufacturing strategy – Value engineering – Di
Slide 7: Businesses
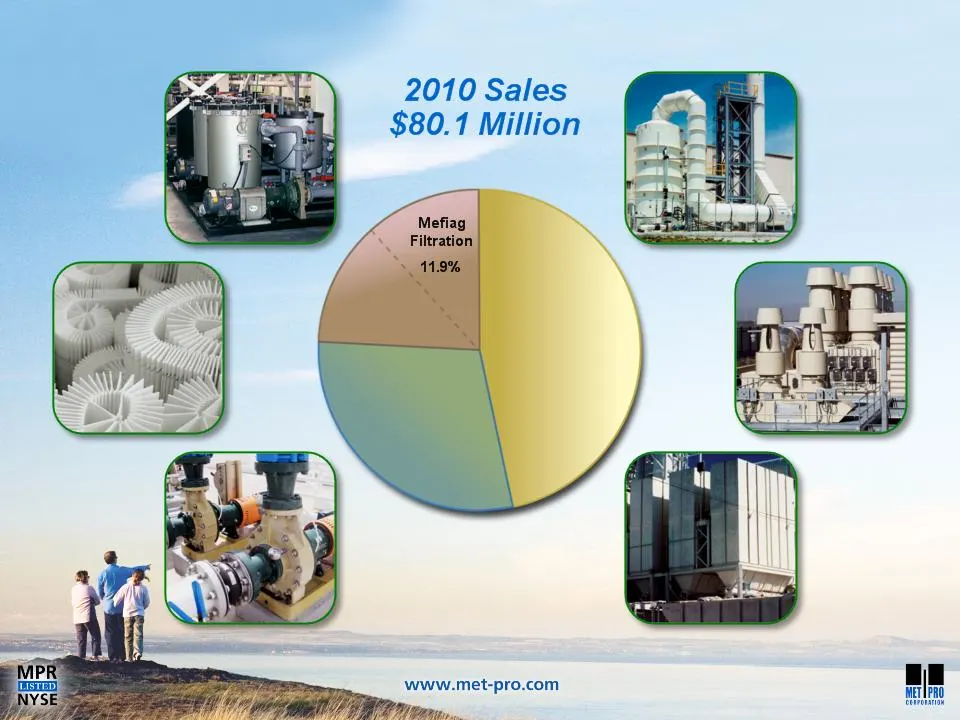
Businesses Product Recovery/ Pollution Control 44.8% Filtration/ Purification 12.7% Fluid Handling 30.6%
Slide 8: International
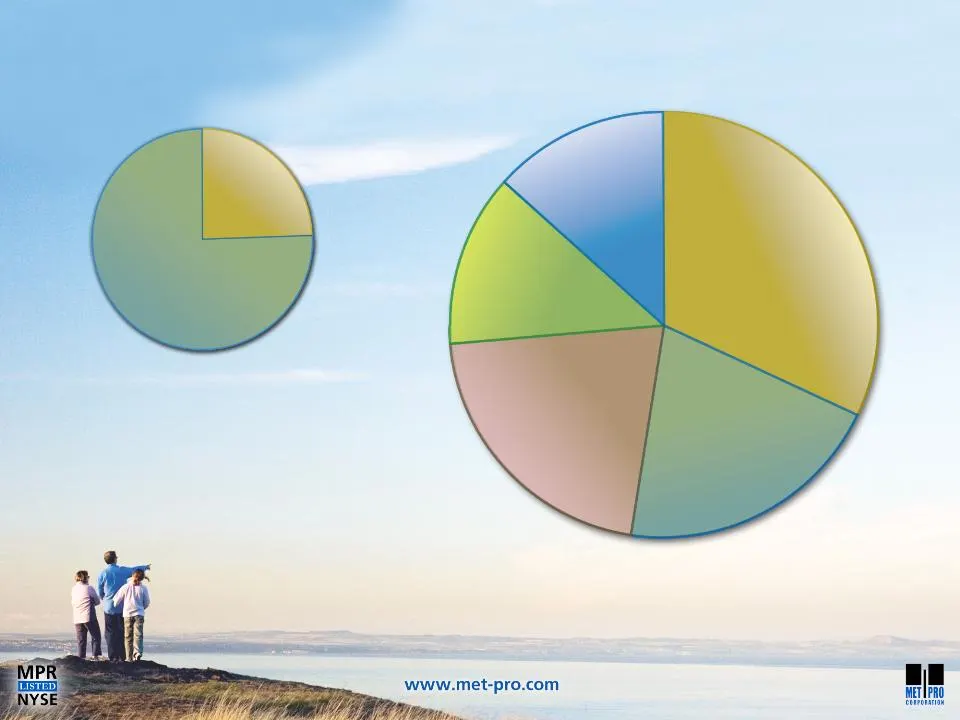
International • Rapid industrialization of international markets represents significant growth opportunity FYE 2010 $19.6 Million 24.5% International Sales 75.5% U.S. Sales Europe 32.0% Asia 20.6% Canada 21.0% Africa & Middle East 13.0% Other 13.4%
Slide 9: Customers & Major Markets
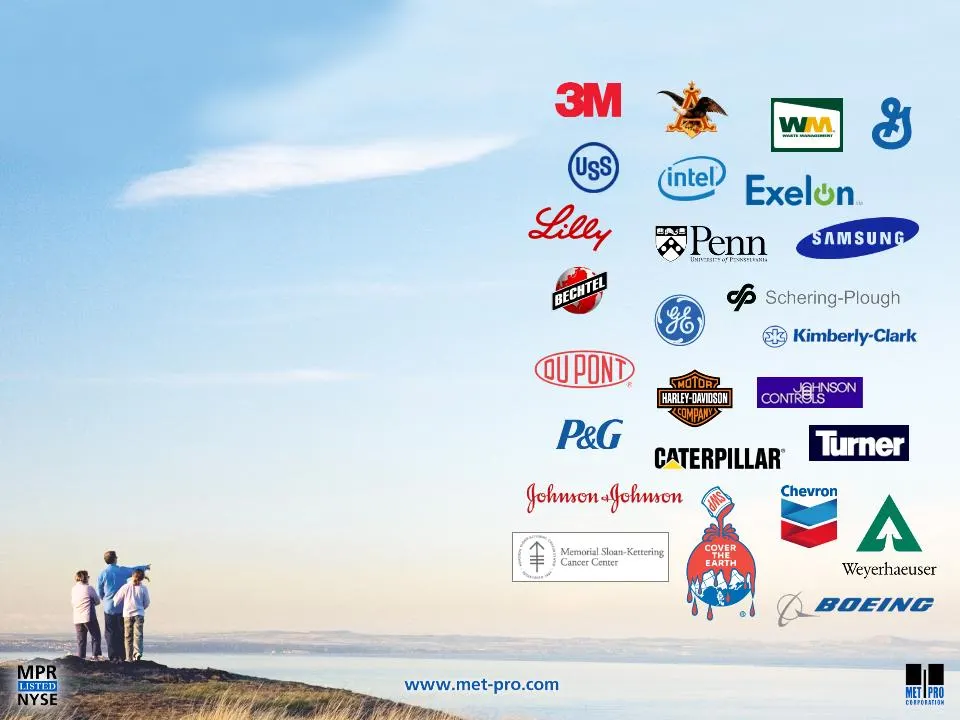
Customers & Major Markets • Over 8,000 active customers – Well-diversified cross-section of industries including Fortune 1000 companies • Major markets include: – Pharmaceutical – Chemical/petrochemical – Food processing – Metal finishing – Saltwater aquariums – Refinery – Wood products – Semiconduc
Slide 10: Products from Single Units…
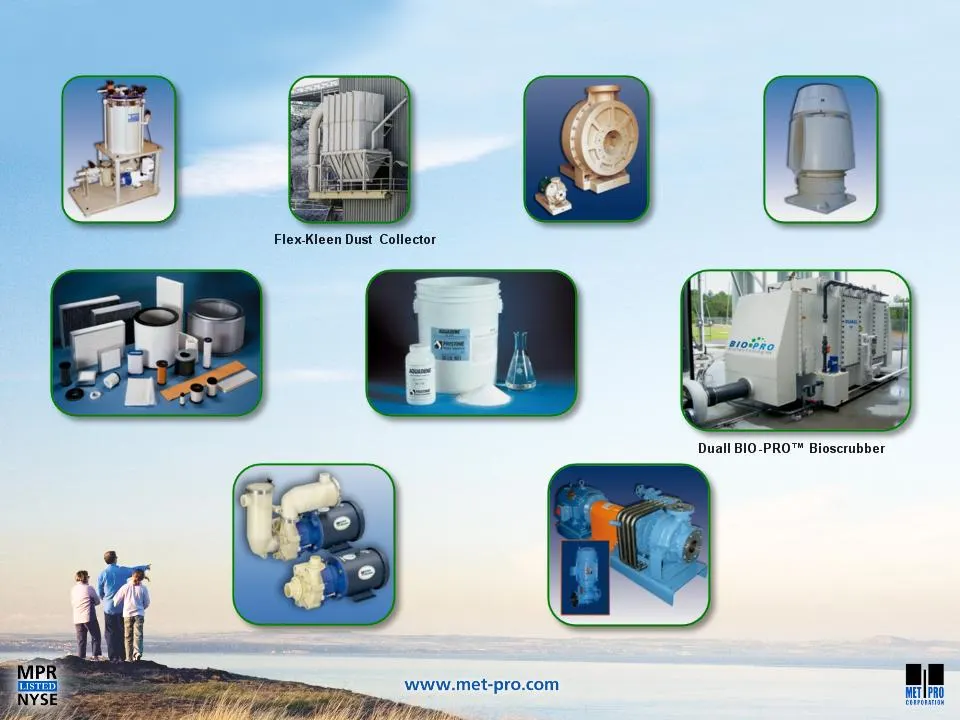
Products from Single Units… Mefiag Filter System Fybroc FRP Pumps Strobic Air Patented Tri-Stack™ Fan Dean Metallic Pumps Sethco Thermoplastic Pumps Keystone Custom Filter Cartridges Pristine Water Treatment Chemicals
Slide 11: …to Large, Complex Systems
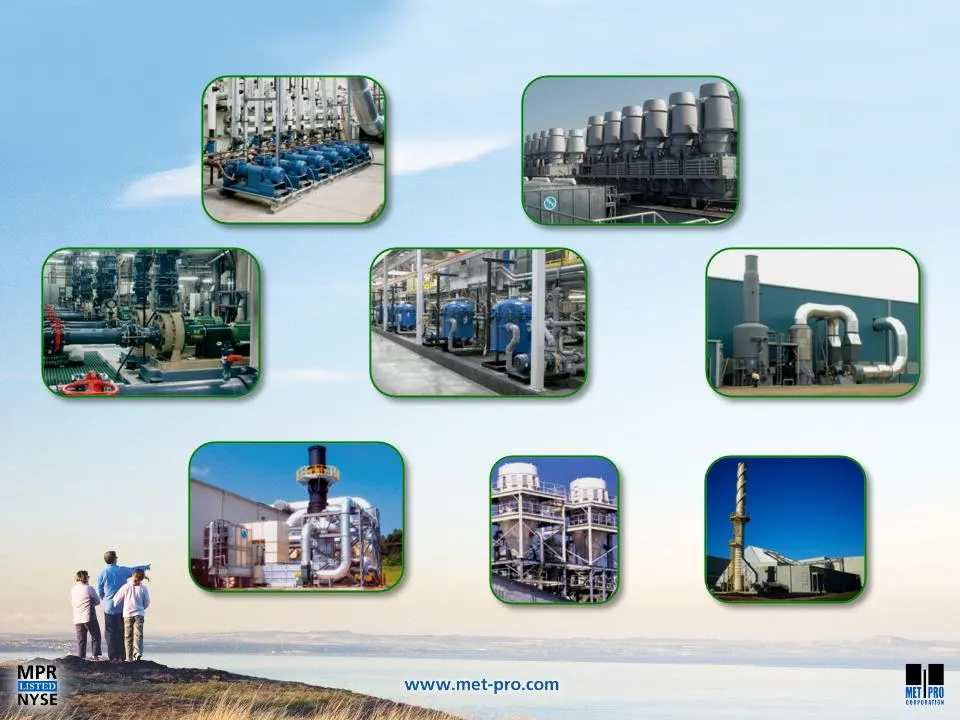
…to Large, Complex Systems Dean High Temperature Pumps Fybroc FRP Pumps Mefiag Filter Systems Duall Multi Component Hot Gas Scrubber System Flex-Kleen Dust Collectors Systems Rotary Concentrator and Recuperative Thermal Oxidizer Strobic Air Patented Tri-Stack™ Fans Bio-Reaction Bio-Oxidation System

Slide 12: Growth Drivers
Growth Drivers • Global growth of “green” manufacturing processes – Reduce costs – Reduce energy – Improve manufacturing performance – Meet increasing regulatory requirements • Focus on niche markets – Limited competition – International brand recognition • MRO, upgrade and retro-fit opportunities f

Slide 13: Strategy
Strategy • Capitalize on global niche-oriented growth opportunities through: – Strong customer focus – Geographic expansion – New product introductions – Accretive acquisitions, technology licensing and strategic business partnerships – Leveraging existing relationships to maximize penetration of Me

Slide 14: Margin Improvement Strategy
Margin Improvement Strategy • Continue to expand margins through: – Pricing power – Single source solutions – Global sourcing – Volume discounts – Consolidation – Leveraged operating expenses – Improved project execution – Lean enterprise/continuous improvement – Disciplined cost management

Slide 15: Financial Results
Financial Results Www.met-pro.com —
Slide 16: Cash Flows from Operating Activities
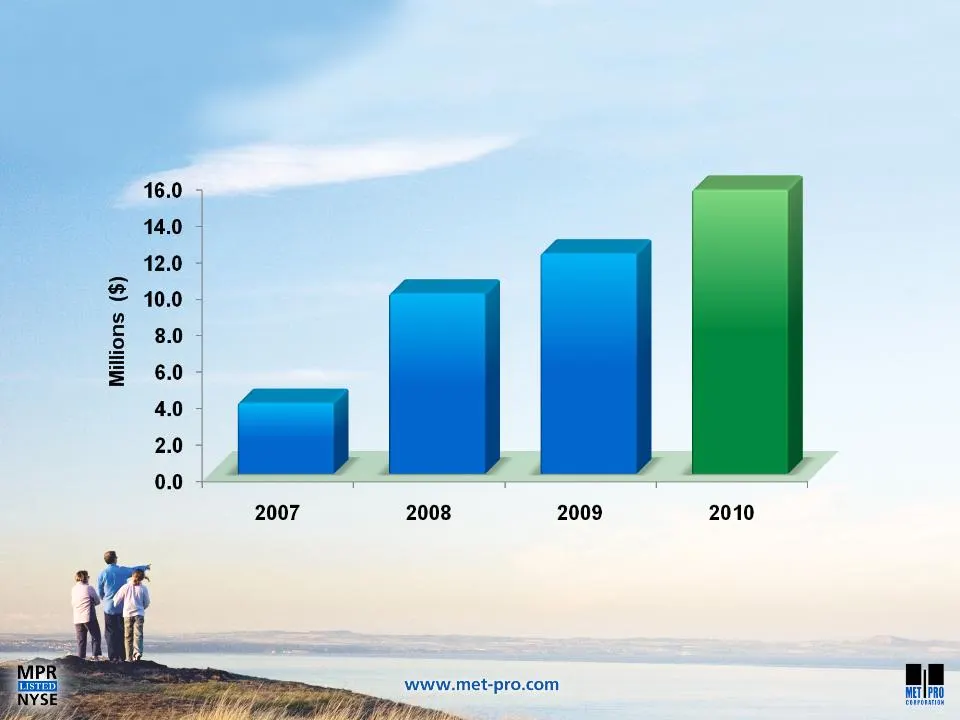
Cash Flows from Operating Activities For FYE 1/31 $3.9 $9.9 $12.1 $15.6

Slide 17: First Half FYE 2011 Results
2010 2009 Change New Order Bookings Net Sales Gross Profit % Operating Income Net Income Diluted EPS Millions ($) First Half - FYE 2011 Ended 7/31 $44.3 3.0 4.4 $ 0.20 15.7% $43.7 36.2% 0.15 33.3% $ $ $38.3 $40.5 3.2 $ 2.1 $ $ 34.8% 7.9% 36.0% 38.8% ¯

Slide 18: Strong Financial Condition
7/31/2010 Cash Total Assets Total Debt Shareholders’ Equity Millions ($) Strong Financial Condition 34.2 $106.2 4.0 82.1 $2.33 per share Debt to Equity Ratio = 4.9% $ $ $
Slide 19: Straight Years of Dividends
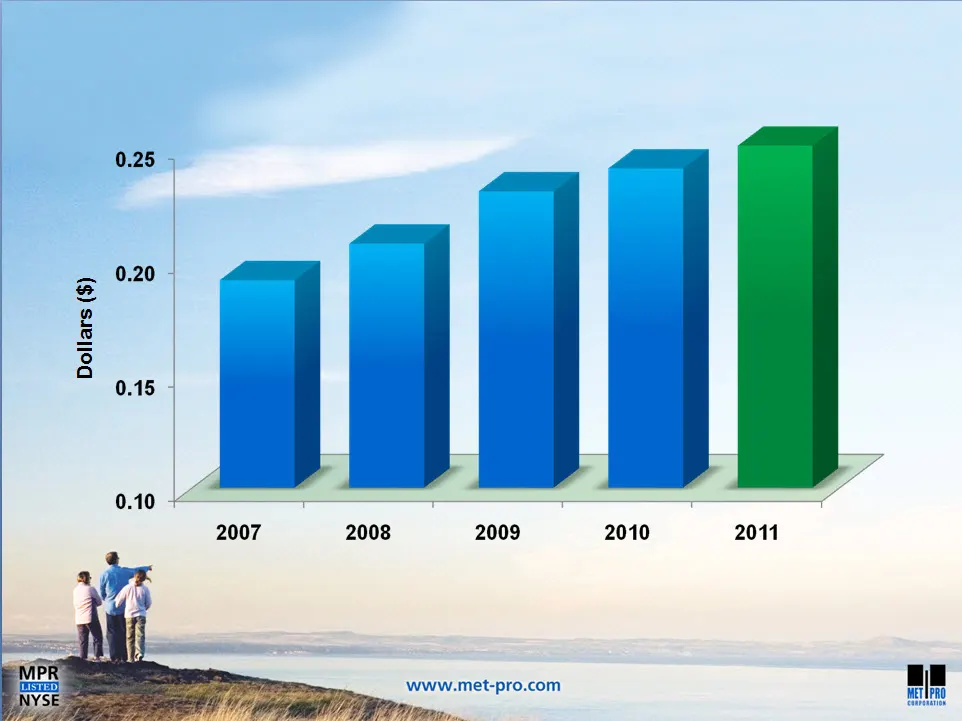
36 Straight Years of Dividends * Reflects 10% Dividend Increase $.191 $.207 $.230 $.240 $.264* For FYE 1/31
Slide 20: Long-term confidence in Met-Pro
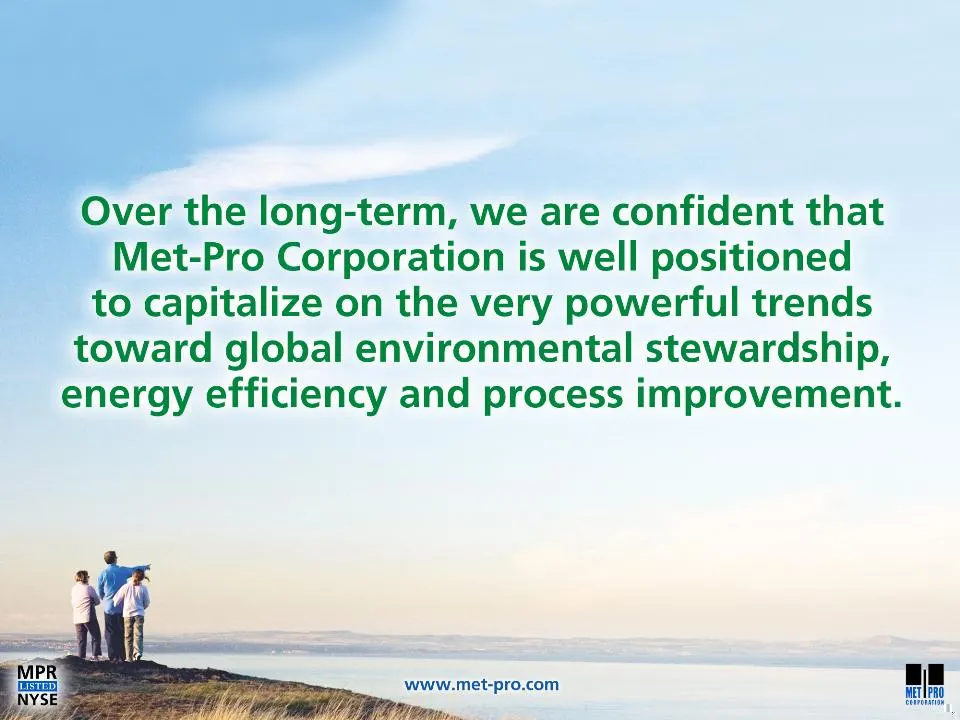
Over the long-term, we are confident that _ Met-Pro Corporation is well positioned to capitalize on the very powerful trends toward global environmental stewardship, energy efficiency and process improvement. Www.met-pro.com ae
Slide 21: Thank You!
Thank You! Additional Questions, Please Contact: Raymond J. De Hont Chairman, CEO and President 215-723-6751 rdehont@met-pro.com Gary J. Morgan Senior Vice President of Finance, CFO 215-723-6751 gmorgan@met-pro.com Www.met-pro.com
Source: SEC EDGAR · 8-K filed Nov 18, 2010
More decks from Met-Pro Corp
 Marcum Microcap Conference 201225 slides · Jun 21, 2012
 Shareholder Meeting (June 2012)14 slides · Jun 8, 2012
 Investor Presentation (April 2012)17 slides · Apr 23, 2012
 2012 Maxim Group Growth Conference13 slides · Mar 26, 2012
 Baird's 2011 Clean Technology Conference14 slides · Nov 29, 2011
 2011 Clean Technology & Industrial Growth Conference14 slides · Sep 16, 2011