SAExploration — Jefferies Global Energy Conference (November 2015)
20 slides from SAExploration's conference presentation, Nov 12, 2015

Slide 1: Jefferies Global Energy Conference
NASDAQ: SAEX HOUSTON, TX JEFFERIES GLOBAL ENERGY CONFERENCE
Slide 2: Safe Harbor
This presentation includes certain forward - looking statements, including statements regarding future financial performance, future growth and future acquisitions . These statements are based on SAE’s current expectations or beliefs and are subject to uncertainty and changes in circumstances . Actu
Slide 3: Corporate Profile
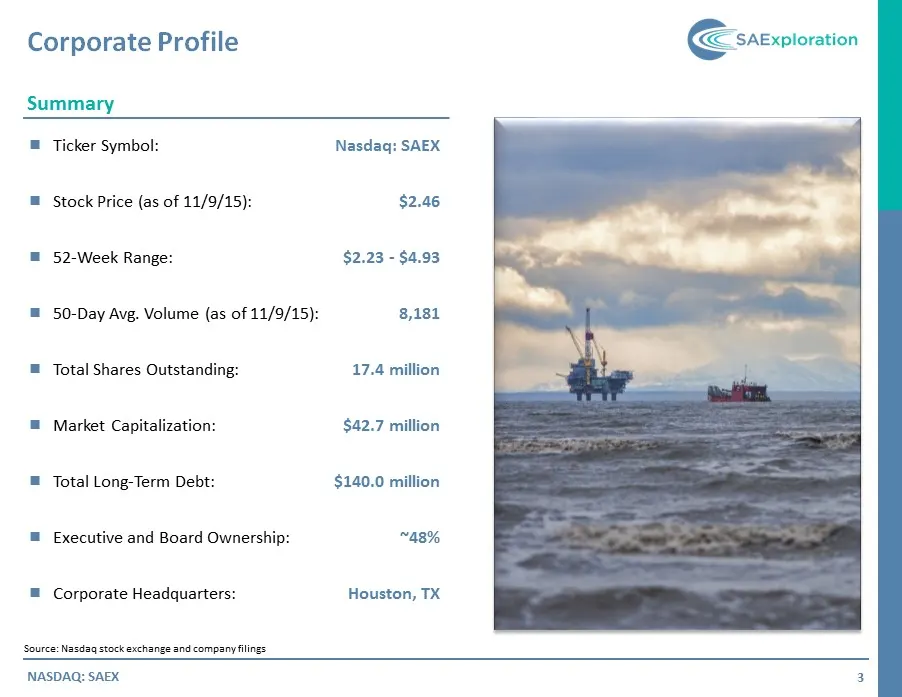
Corporate Profile 3 NASDAQ: SAEX Summary Ticker Symbol : Stock Price (as of 11 / 9 / 15 ) : 52 - Week Range : 5 0 - Day Avg . Volume (as of 11 / 9 / 15 ) : Total Shares Outstanding : Market Capitalization : Total Long - Term Debt : Executive and Board Ownership : Corporate Headquar
Slide 4: Company Overview
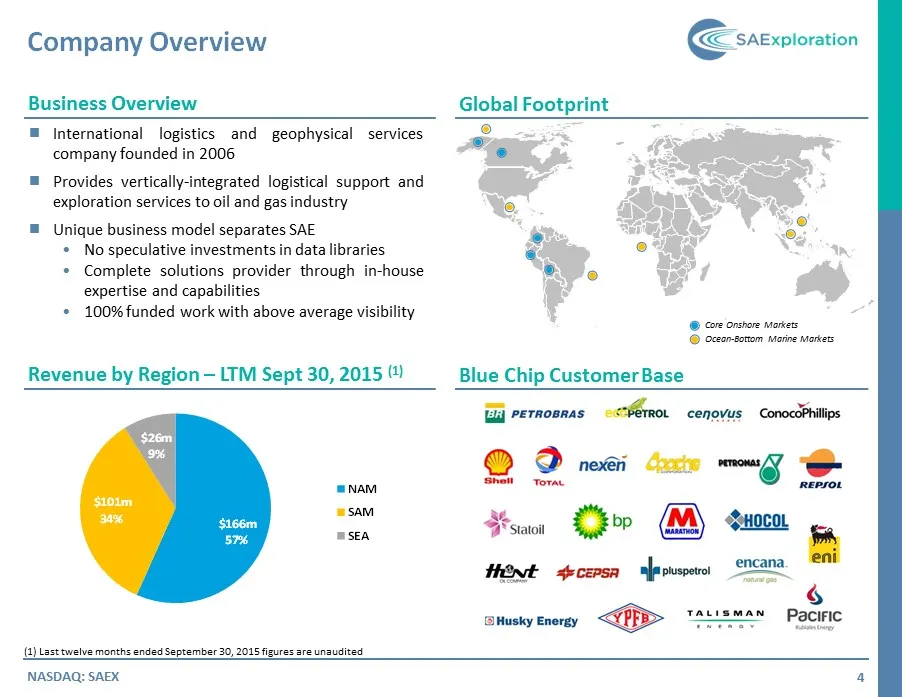
Company Overview 4 Business Overview Global Footprint Blue Chip Customer Base Revenue by Region – LTM Sept 30, 2015 (1) International logistics and geophysical services company founded in 2006 Provides vertically - integrated logistical support and exploration services to oil and gas industry
Slide 5: Full Service Logistics Provider
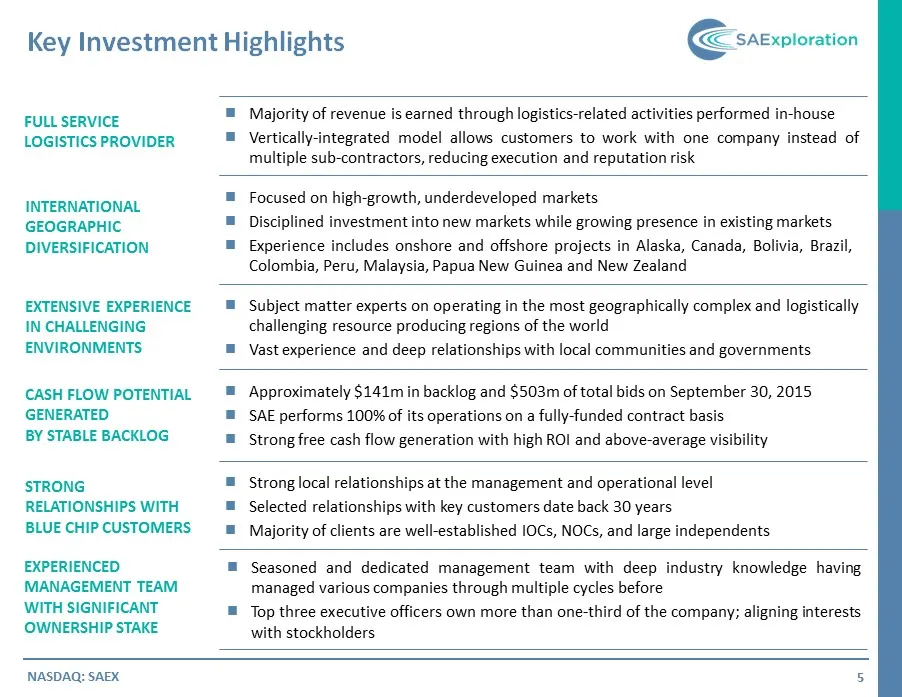
FULL SERVICE LOGISTICS PROVIDER Majority of revenue is earned through logistics - related activities performed in - house Vertically - integrated model allows customers to work with one company instead of multiple sub - contractors, reducing execution and reputation risk CASH FLOW POTENTIAL GENE
Slide 6: Differentiated Business Model
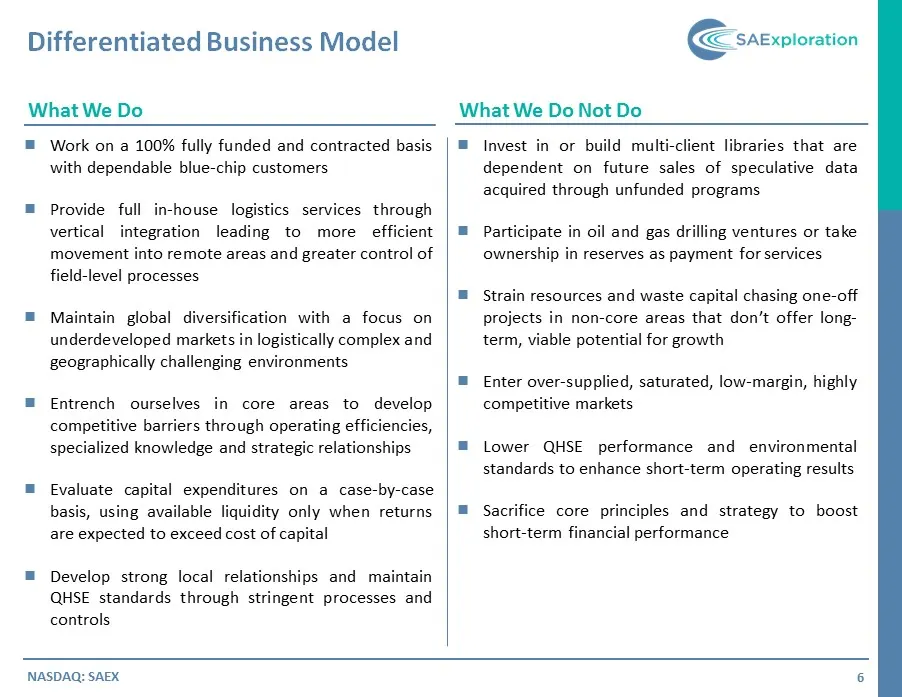
Differentiated Business Model 6 What We Do What We Do Not Do NASDAQ: SAEX Work on a 100 % fully funded and contracted basis with dependable blue - chip customers Provide full in - house logistics services through vertical integration leading to more efficient movement into remote areas and great
Slide 7: Full Service Logistics Provider
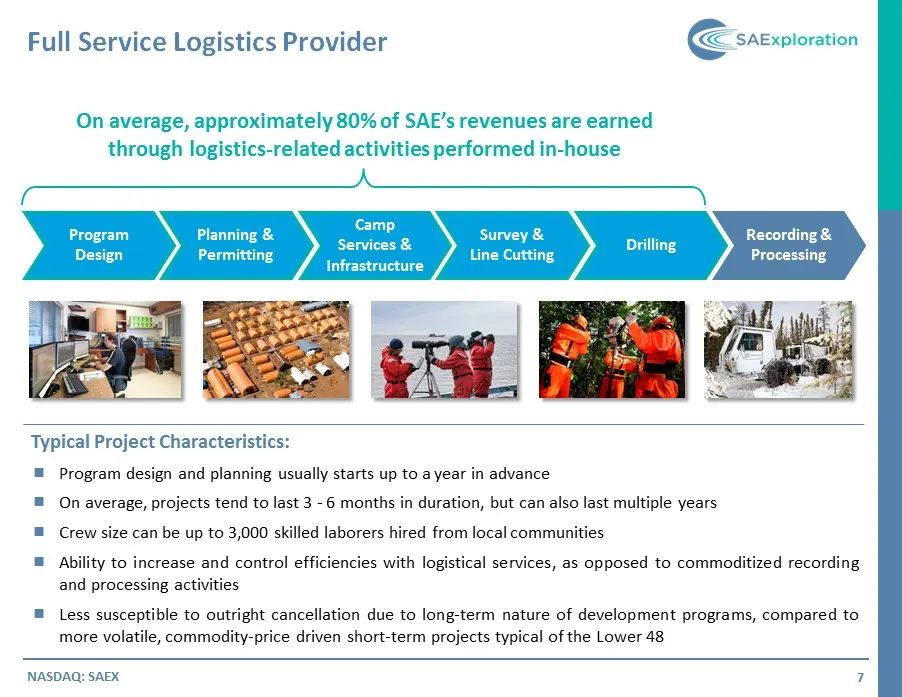
Full Service Logistics Provider 7 NASDAQ: SAEX Program Design Planning & Permitting Camp Services & Infrastructure Survey & Line Cutting Drilling Recording & Processing On average, approximately 80% of SAE’s revenues are earned through logistics - related activities performed in - house Typical Proj
Slide 8: International Focus on Niche Markets
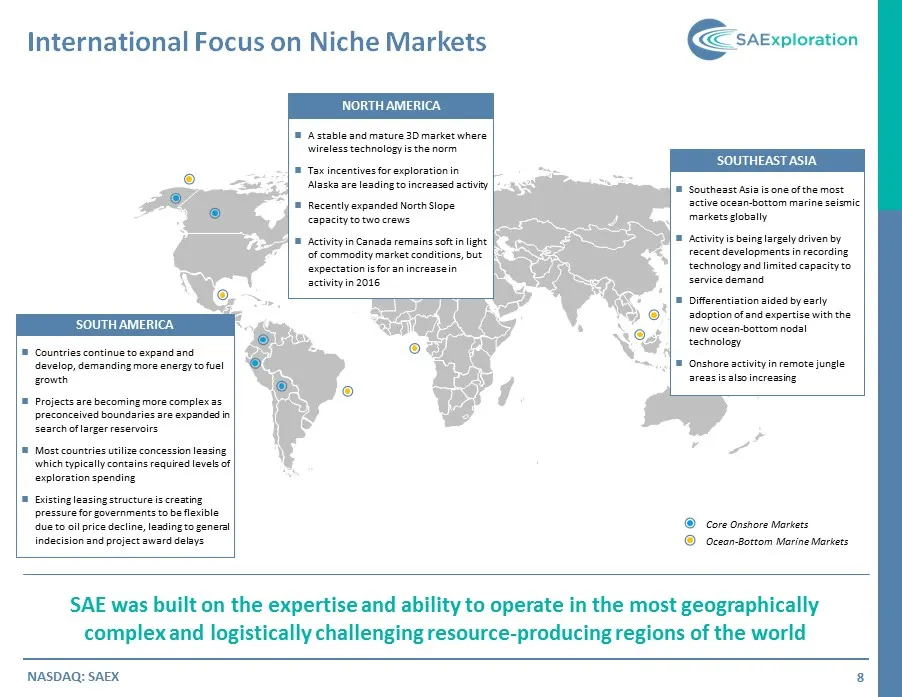
International Focus on Niche Markets 8 NASDAQ: SAEX SAE was built on the expertise and ability to operate in the most geographically complex and logistically challenging resource - producing regions of the world Countries continue to expand and develop, demanding more energy to fuel growth Proje
Slide 9: Locations, Terrain, Key Stats, Recent Services Provided
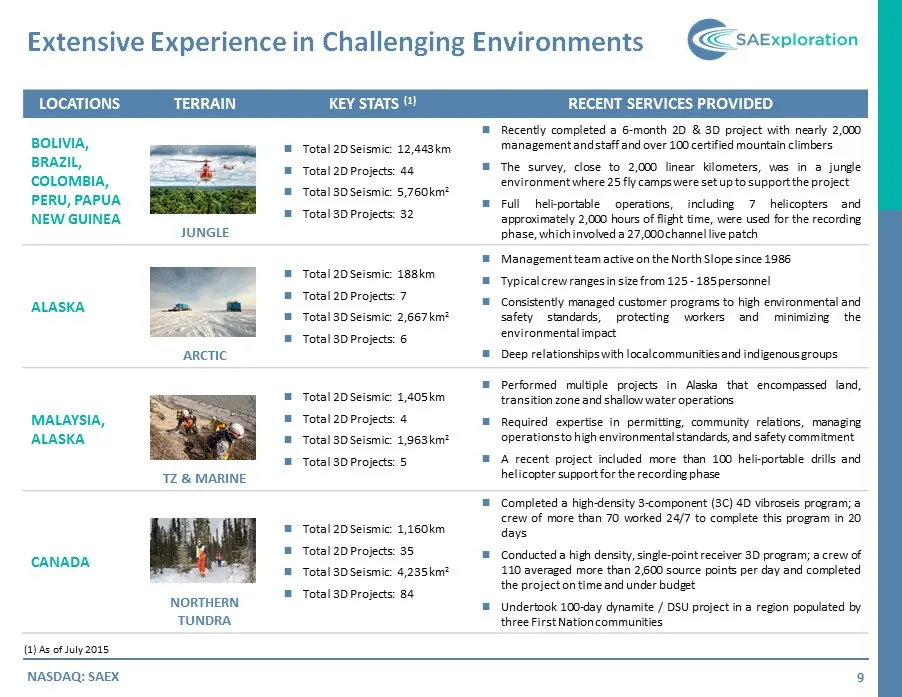
LOCATIONS TERRAIN KEY STATS (1) RECENT SERVICES PROVIDED BOLIVIA, BRAZIL, COLOMBIA, PERU, PAPUA NEW GUINEA JUNGLE Total 2 D Seismic : 12 , 443 km Total 2 D Projects : 44 Total 3 D Seismic : 5 , 760 km 2 Total 3 D Projects : 32 Recently completed a 6 - month 2 D & 3 D project with nearly 2
Slide 10: Quality, Health, Safety & Environment (QHSE)
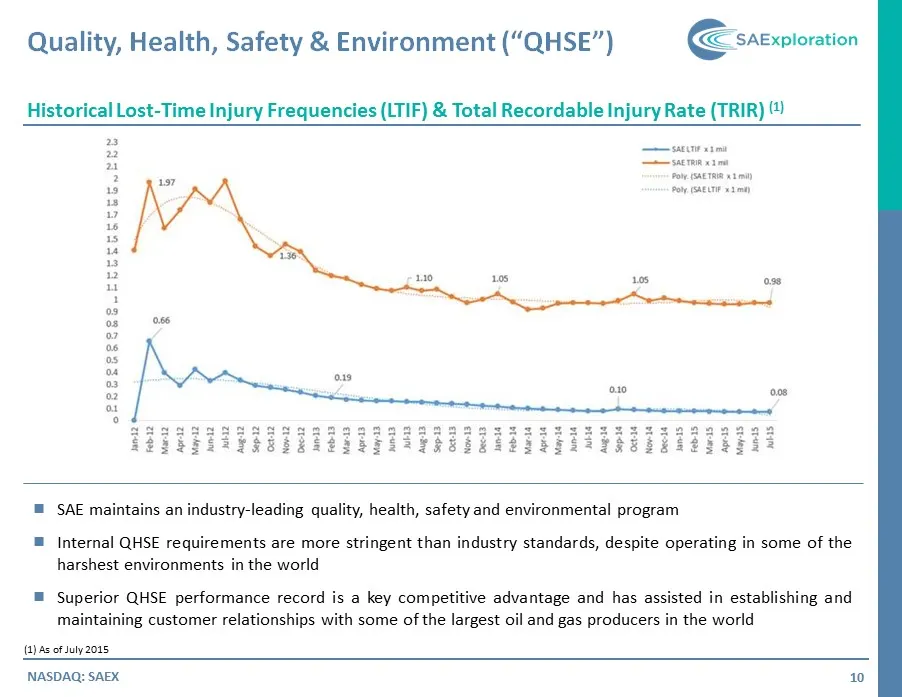
Quality, Health, Safety & Environment (“QHSE”) 10 NASDAQ: SAEX Historical Lost - Time Injury Frequencies (LTIF) & Total Recordable Injury Rate (TRIR) (1) SAE maintains an industry - leading quality, health, safety and environmental program Internal QHSE requirements are more stringent than indus
Slide 11: Strong Relationships with a Diversified Blue Chip Customer Base
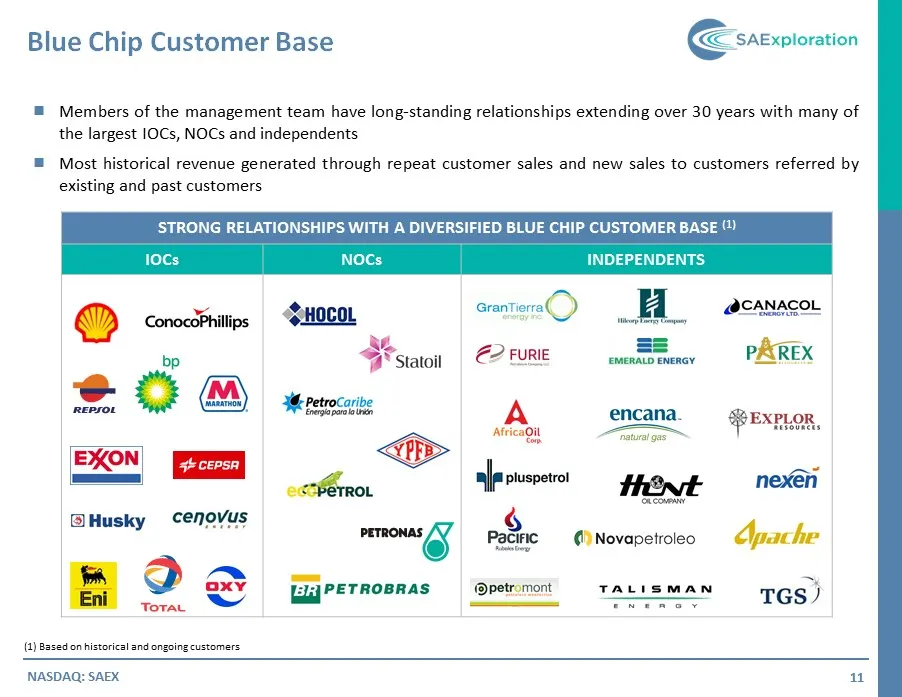
STRONG RELATIONSHIPS WITH A DIVERSIFIED BLUE CHIP CUSTOMER BASE (1) IOCs NOCs INDEPENDENTS Blue Chip Customer Base 11 (1) Based on historical and ongoing customers Members of the management team have long - standing relationships extending over 30 years with many of the largest IOCs, NOCs and inde
Slide 12: Level of Contracted Cash Flow / Backlog
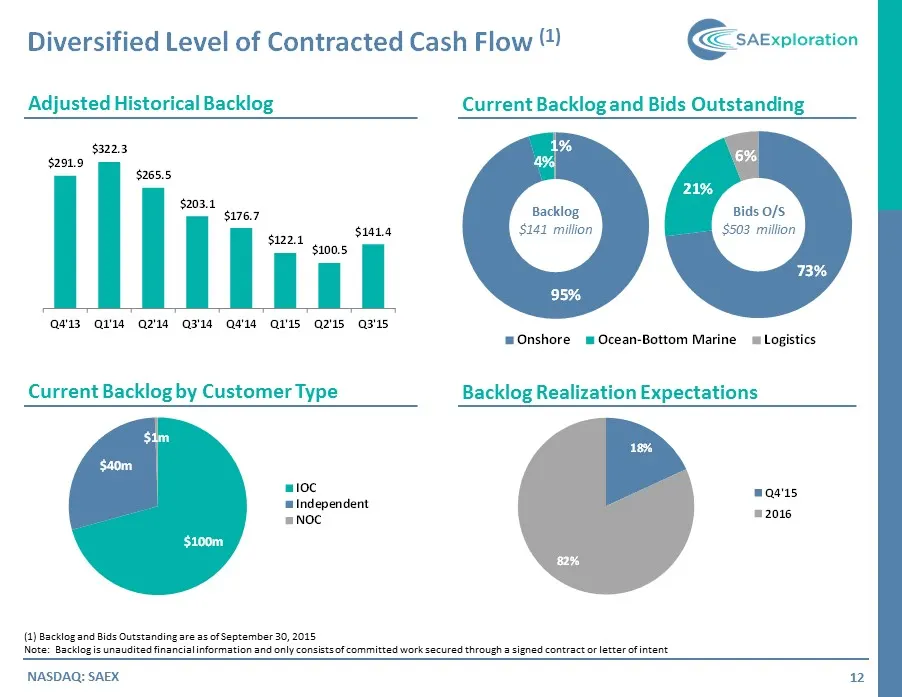
73% 21% 6% Onshore Ocean-Bottom Marine Logistics 95% 4% 1% Onshore Diversified Level of Contracted Cash Flow (1) 12 NASDAQ: SAEX Adjusted Historical Backlog Current Backlog and Bids Outstanding Backlog Realization Expectations Backlog $141 million Bids O/S $503 million (1) Backlog and Bids Outstandi
Slide 13: Financial Profile
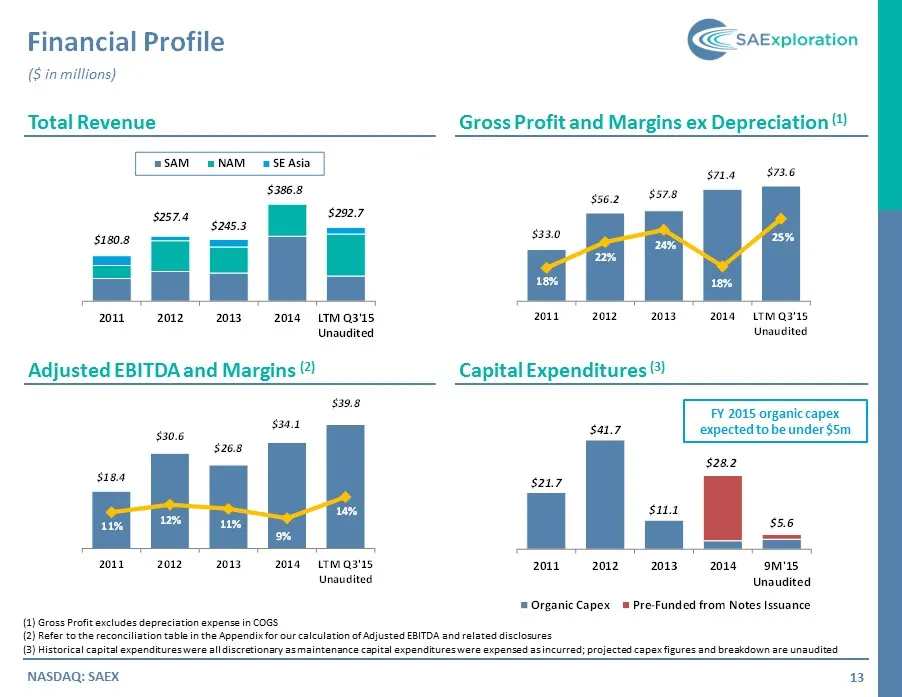
Financial Profile 13 NASDAQ: SAEX Total Revenue Gross Profit and Margins ex Depreciation (1) Capital Expenditures (3) (1) Gross Profit excludes depreciation expense in COGS (2) Refer to the reconciliation table in the Appendix for our calculation of Adjusted EBITDA and related disclosures (3) Histor
Slide 14: Period Performance
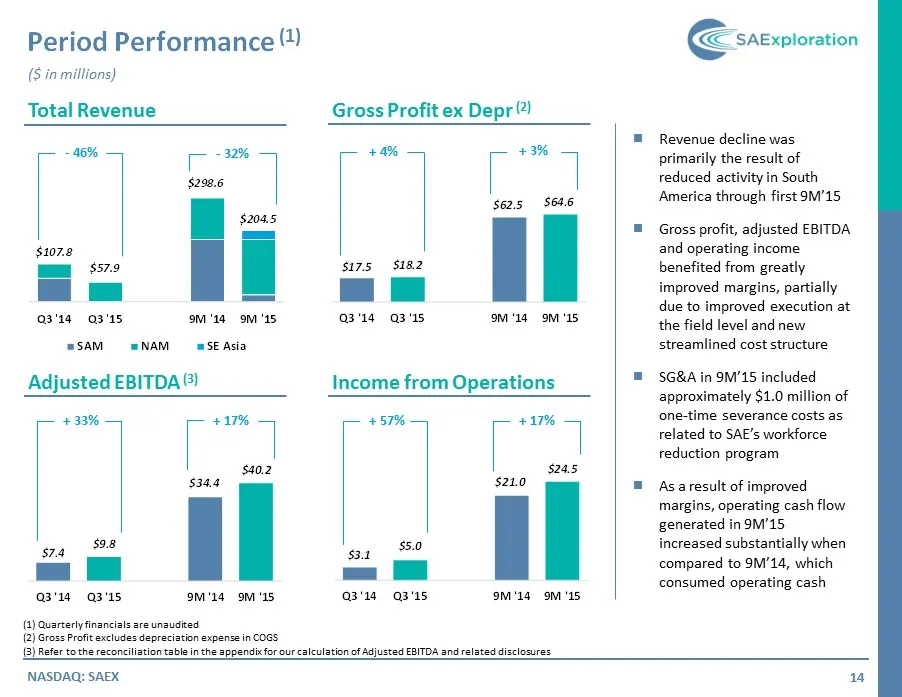
$103.1 $66.9 $190.8 $146.5 Q2 '14 Q2 '15 1H '14 1H '15 SAM NAM SE Asia Period Performance (1) 14 NASDAQ: SAEX Total Revenue Gross Profit ex Depr (2) Income from Operations Adjusted EBITDA (3) (1) Quarterly financials are unaudited (2) Gross Profit excludes depreciation expense in COGS (3) Refer to t
Slide 15: Capital Structure and Liquidity
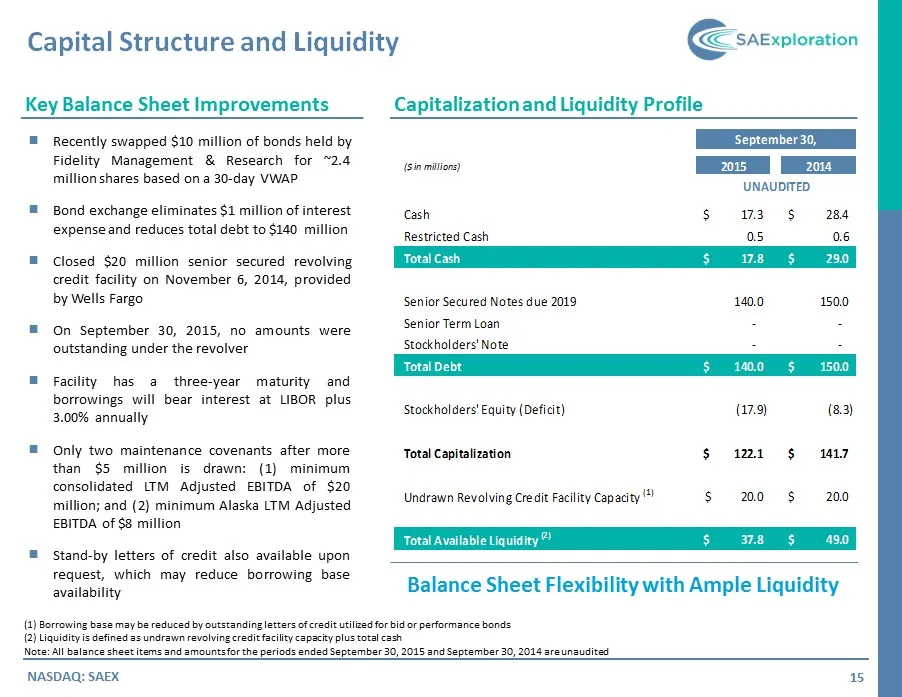
Capital Structure and Liquidity 15 NASDAQ: SAEX Capitalization and Liquidity Profile Key Balance Sheet Improvements Recently swapped $ 10 million of bonds held by Fidelity Management & Research for ~ 2 . 4 million shares based on a 30 - day VWAP Bond exchange eliminates $ 1 million of interest e
Slide 16: Strategic Direction and Catalysts
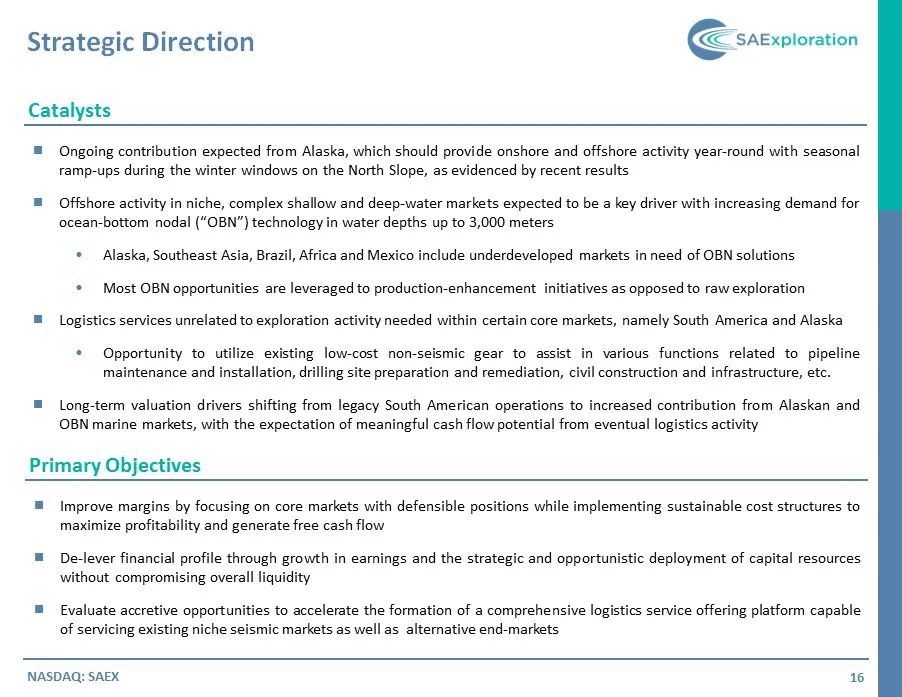
Strategic Direction 16 NASDAQ: SAEX Catalysts O ngoing contribution expected from Alaska, which should provide onshore and offshore activity year - round with seasonal ramp - ups during the winter windows on the North Slope, as evidenced by recent results Offshore activity in niche, complex shal
Slide 17: Investor Contact
Investor Contact Ryan Abney Vice President, Capital Markets and Investor Relations (281) 258 - 4409 rabney@saexploration.com Contacts 17 NASDAQ: SAEX SAE Canada 3333 8th Street SE, 3rd Floor Calgary, AB T2G 3A4 O : (403) 776 - 1950 SAE Alaska 8240 Sandlewood Pl, Suite 102 Anchorage, AK 99507 O : (90

Slide 18: Appendix
Appendix
Slide 19: Executive Management
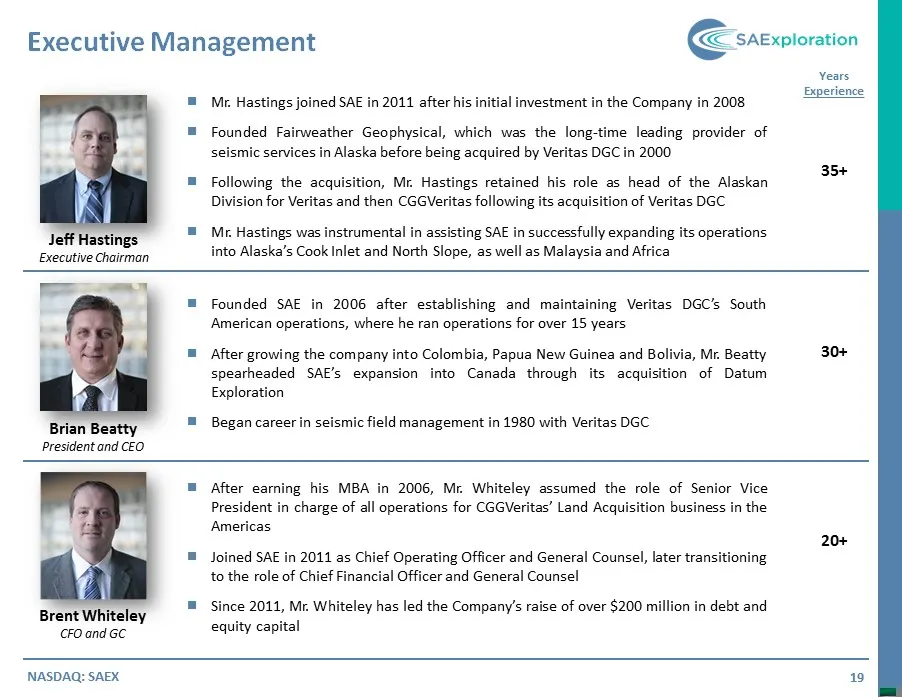
Executive Management 19 NASDAQ: SAEX Jeff Hastings Executive Chairman Brian Beatty President and CEO Brent Whiteley CFO and GC Years Experience 35+ 30+ 20+ After earning his MBA in 2006 , Mr . Whiteley assumed the role of Senior Vice President in charge of all operations for CGGVeritas ’ Land Acqu
Slide 20: Adjusted EBITDA Reconciliation
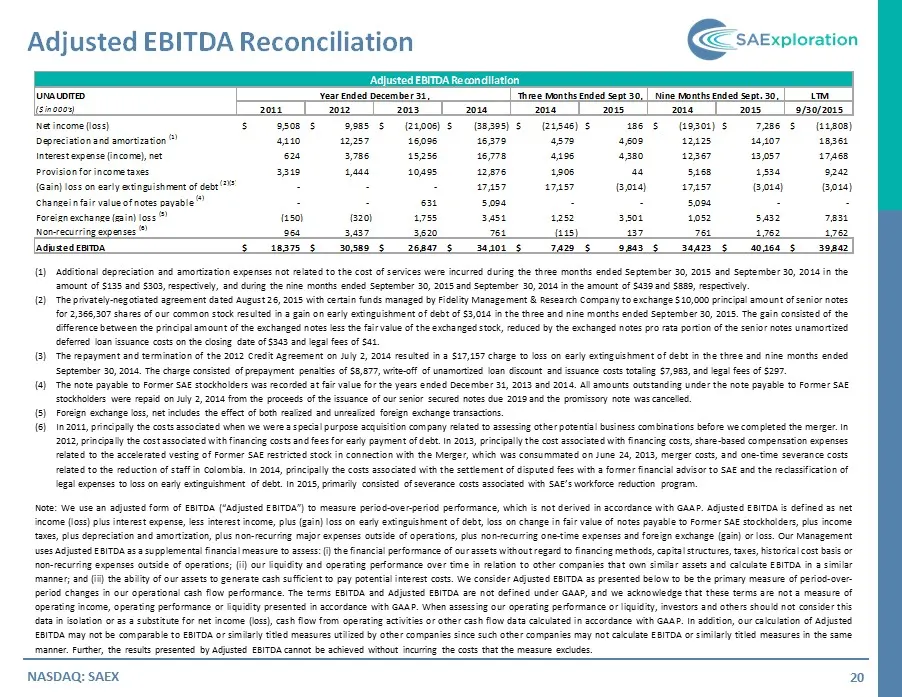
(1) Additional depreciation and amortization expenses not related to the cost of services were incurred during the three months ended September 30 , 2015 and September 30 , 2014 in the amount of $ 135 and $ 303 , respectively, and during the nine months ended September 30 , 2015 and September 30 , 2
Source: SEC EDGAR · 8-K filed Nov 12, 2015
More decks from SAExploration Holdings Inc
 Investor Presentation (August 2018)14 slides · Aug 9, 2018
 Debt Investor Presentation (December 2017)10 slides · Dec 20, 2017
 Jefferies Global Energy Conference (November 2016)23 slides · Nov 29, 2016
 Pareto Securities' Annual Oil & Offshore Conference 201622 slides · Sep 13, 2016
 Pareto Securities Oil & Offshore Conference (September 2015)20 slides · Sep 1, 2015
 Jefferies Global Energy Conference (November 2014)22 slides · Nov 12, 2014