Harvest Natural Resources — EnerCom's The Oil and Gas Conference 2011
28 slides from Harvest Natural Resources's conference presentation, Aug 15, 2011
Slide 1: EnerCom's The Oil and Gas Conference 2011
EnerCom's The Oil and Gas Conference 2011 August 15th, 2011
Slide 2: Forward Looking Statements
Forward Looking Statements NYSE: HNR www.harvestnr.com 2 Cautionary Statements: Certain statements in this presentation are forward-looking and are based upon Harvest's current belief as to the outcome and timing of future events. All statements other than statements of historical facts including pl
Slide 3: About Harvest
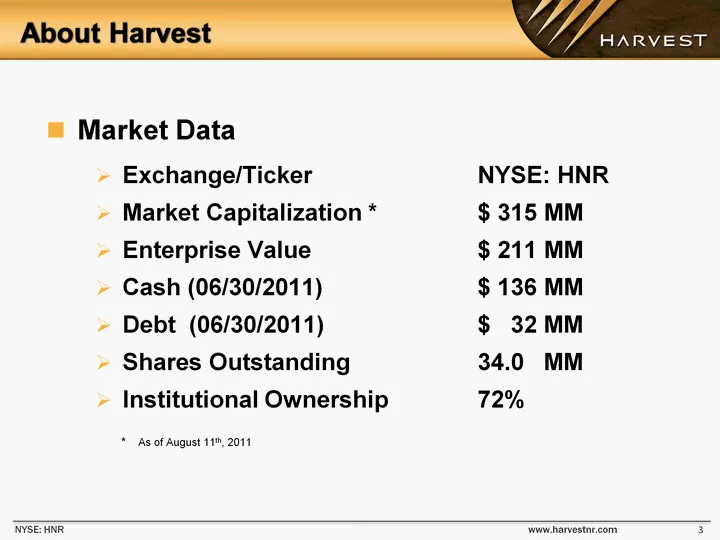
About Harvest NYSE: HNR www.harvestnr.com 3 Market Data Exchange/Ticker NYSE: HNR Market Capitalization * $ 315 MM Enterprise Value $ 211 MM Cash (06/30/2011) $ 136 MM Debt (06/30/2011) $ 32 MM Shares Outstanding 34.0 MM Institutional Ownership 72% * As of August 11th, 2011
Slide 4: 2011 Outlook
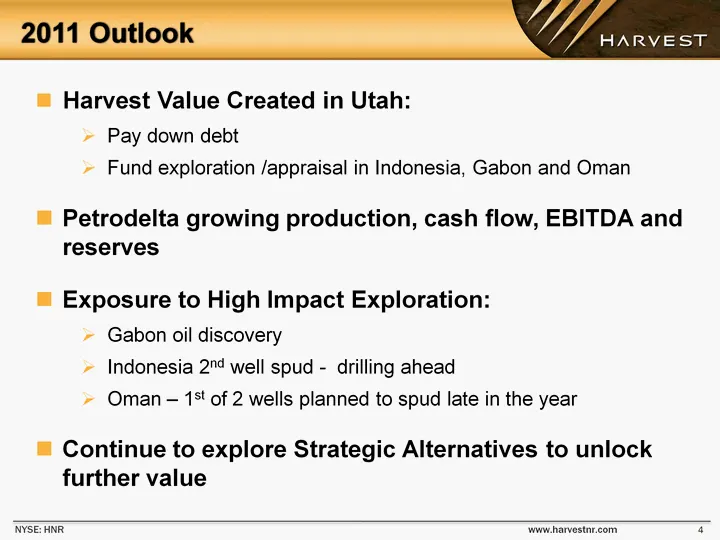
2011 Outlook NYSE: HNR www.harvestnr.com 4 Harvest Value Created in Utah: Pay down debt Fund exploration /appraisal in Indonesia, Gabon and Oman Petrodelta growing production, cash flow, EBITDA and reserves Exposure to High Impact Exploration: Gabon oil discovery Indonesia 2nd well spud - drilling a
Slide 5: Venezuela - Petrodelta
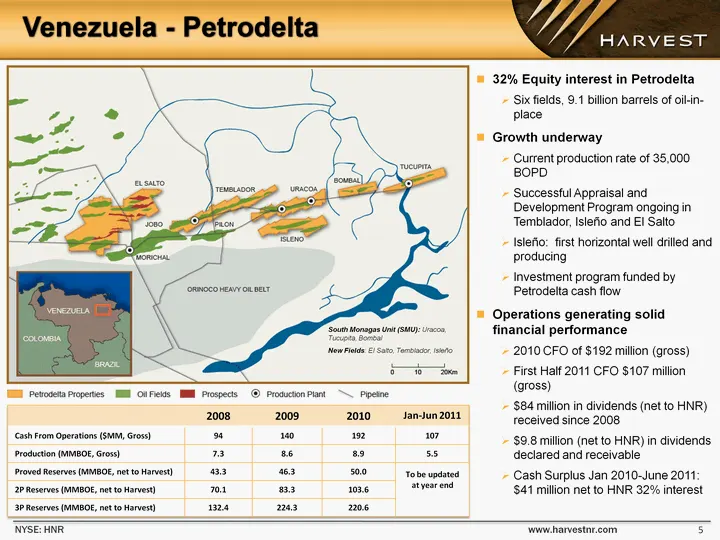
Venezuela - Petrodelta NYSE: HNR www.harvestnr.com 5 32% Equity interest in Petrodelta Six fields, 9.1 billion barrels of oil-in- place Growth underway Current production rate of 35,000 BOPD Successful Appraisal and Development Program ongoing in Temblador, Isleno and El Salto Isleno: first horizont
Slide 6: Petrodelta Production
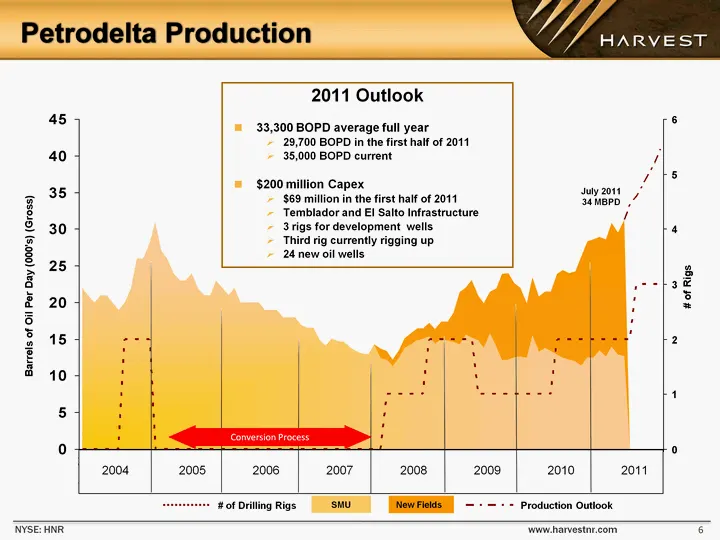
Petrodelta Production NYSE: HNR www.harvestnr.com 6 1/1/2004 2/1/2004 3/1/2004 4/1/2004 5/1/2004 6/1/2004 7/1/2004 8/1/2004 9/1/2004 10/1/2004 11/1/2004 12/1/2004 1/1/2005 2/1/2005 3/1/2005 4/1/2005 5/1/2005 6/1/2005 7/1/2005 8/1/2005 9/1/2005 10/1/2005 11/1/2005 12/1/2005 1/1/2006 2/1/2006 3/1/2006
Slide 7: Petrodelta Well Economics
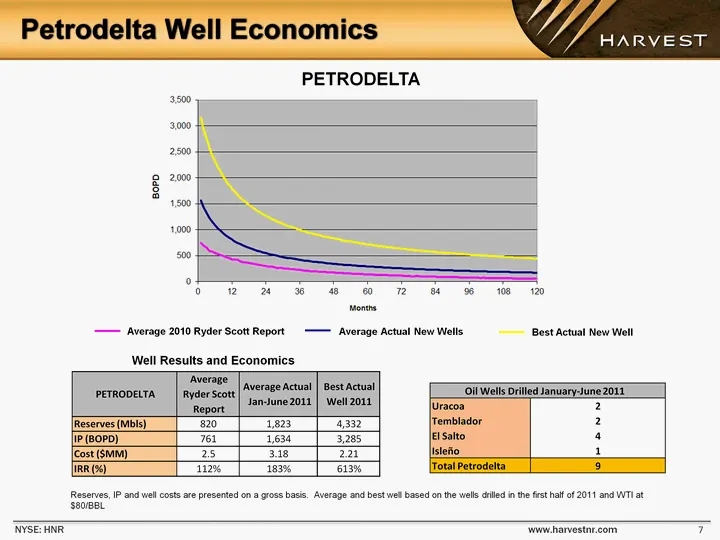
Petrodelta Well Economics NYSE: HNR www.harvestnr.com 7 Isleno South Reserves, IP and well costs are presented on a gross basis. Average and best well based on the wells drilled in the first half of 2011 and WTI at $80/BBL Average 2010 Ryder Scott Report Average Actual New Wells Best Actual New Well
Slide 8: Petrodelta Reserves Valuation
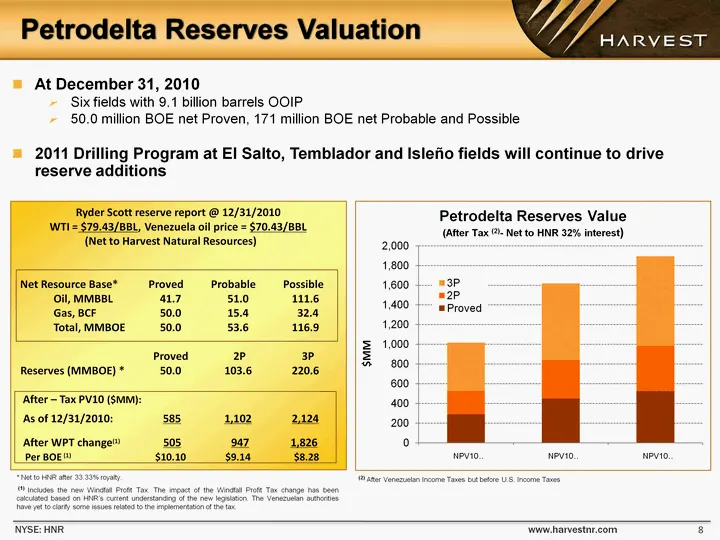
Petrodelta Reserves Valuation NYSE: HNR www.harvestnr.com 8 Ryder Scott reserve report @ 12/31/2010 WTI = $79.43/BBL, Venezuela oil price = $70.43/BBL (Net to Harvest Natural Resources) Net Resource Base* Proved Probable Possible Oil, MMBBL 41.7 51.0 111.6 Gas, BCF 50.0 15.4 32.4 Total, MMBOE 50.0 5
Slide 9: Indonesia - Budong-Budong
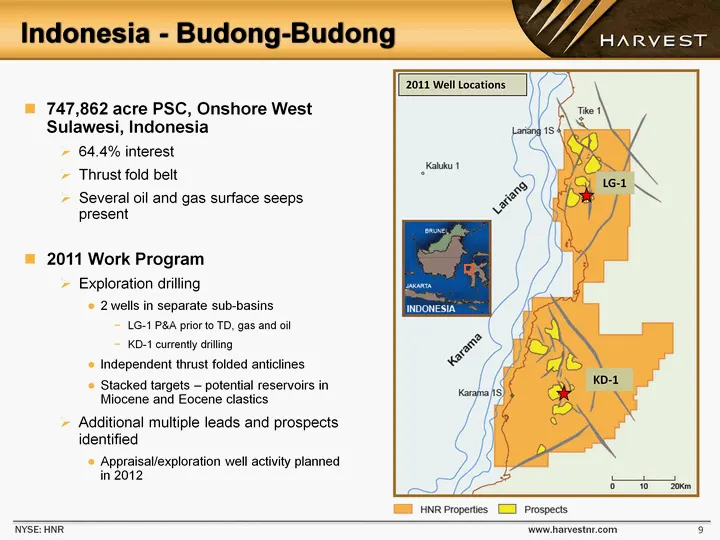
Indonesia - Budong-Budong NYSE: HNR www.harvestnr.com 747,862 acre PSC, Onshore West Sulawesi, Indonesia 64.4% interest Thrust fold belt Several oil and gas surface seeps present 2011 Work Program Exploration drilling 2 wells in separate sub-basins LG-1 P&A prior to TD, gas and oil KD-1 currently dr
Slide 10: Lariang - LG Follow-up Prospects
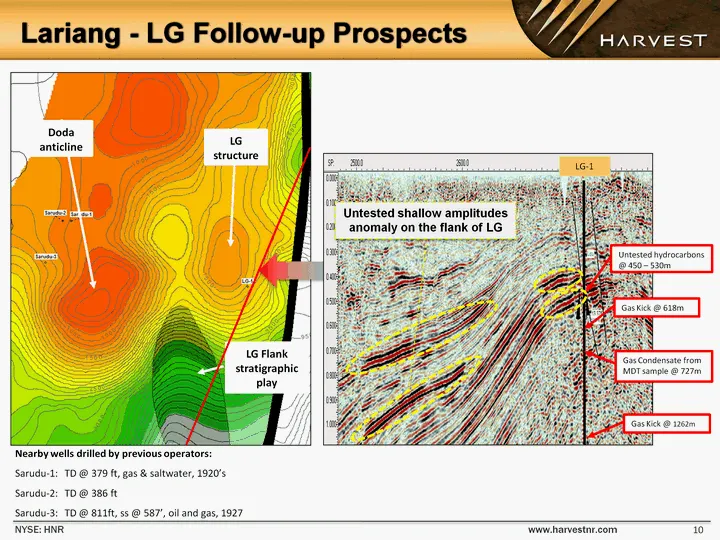
Lariang - LG Follow-up Prospects NYSE: HNR www.harvestnr.com 10 Nearby wells drilled by previous operators: Sarudu-1: TD @ 379 ft, gas & saltwater, 1920's Sarudu-2: TD @ 386 ft Sarudu-3: TD @ 811ft, ss @ 587', oil and gas, 1927 LG-1
Slide 11: KD-1 Exploration Well
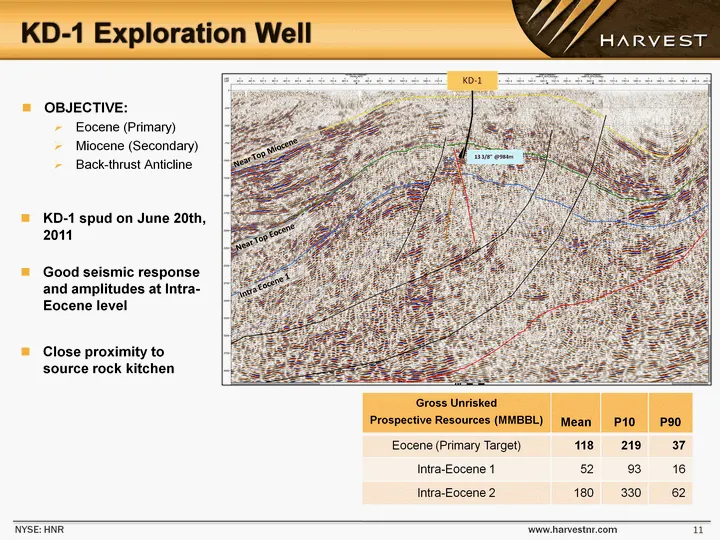
KD-1 Exploration Well NYSE: HNR www.harvestnr.com 11 KD-1 spud on June 20th, 2011 Good seismic response and amplitudes at Intra- Eocene level Close proximity to source rock kitchen Near Top Miocene Near Top Eocene Intra Eocene 1 KD-1 13 3/8" @984m OBJECTIVE: Eocene (Primary) Miocene (Secondary) Back
Slide 12: Why are we here?
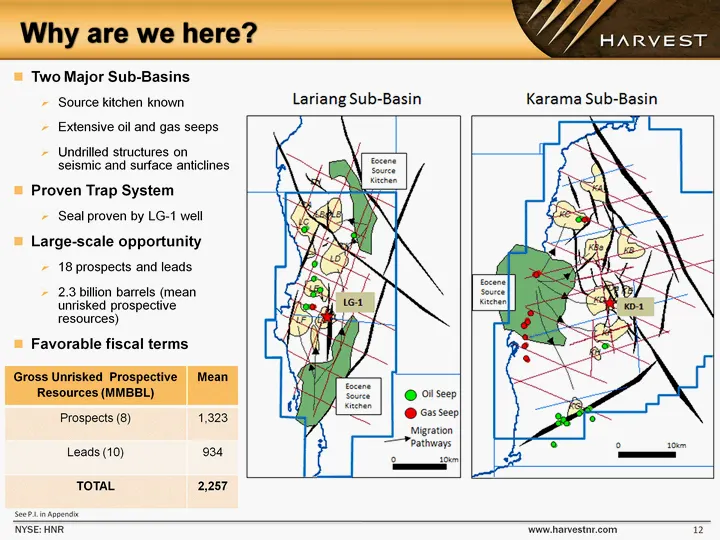
Why are we here? NYSE: HNR www.harvestnr.com 12 Gross Unrisked Prospective Resources (MMBBL) Mean Prospects (8) 1,323 Leads (10) 934 TOTAL 2,257 Two Major Sub-Basins Source kitchen known Extensive oil and gas seeps Undrilled structures on seismic and surface anticlines Proven Trap System Seal proven
Slide 13: Gabon - Dussafu
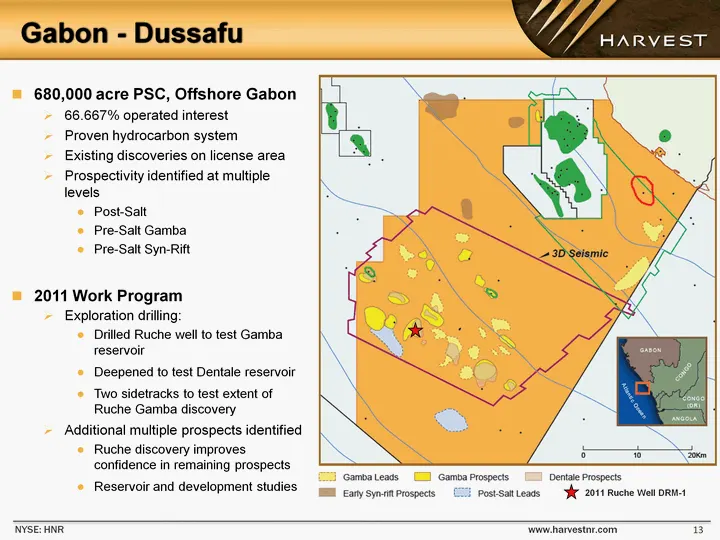
Gabon - Dussafu NYSE: HNR www.harvestnr.com 13 680,000 acre PSC, Offshore Gabon 66.667% operated interest Proven hydrocarbon system Existing discoveries on license area Prospectivity identified at multiple levels Post-Salt Pre-Salt Gamba Pre-Salt Syn-Rift 2011 Work Program Exploration drilling: Dril
Slide 14: Dussafu - Ruche Marine-1
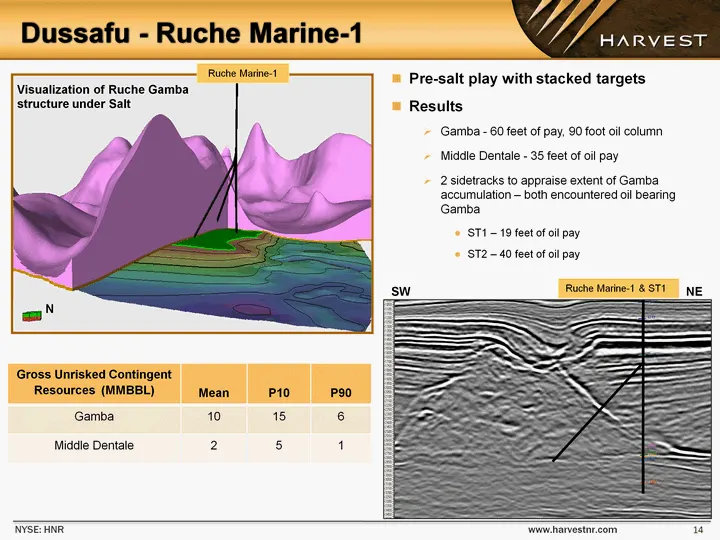
Dussafu - Ruche Marine-1 NYSE: HNR www.harvestnr.com 14 Pre-salt play with stacked targets Results Gamba - 60 feet of pay, 90 foot oil column Middle Dentale - 35 feet of oil pay 2 sidetracks to appraise extent of Gamba accumulation - both encountered oil bearing Gamba ST1 - 19 feet of oil pay ST2 -
Slide 15: Walt Whitman & NW Satellite
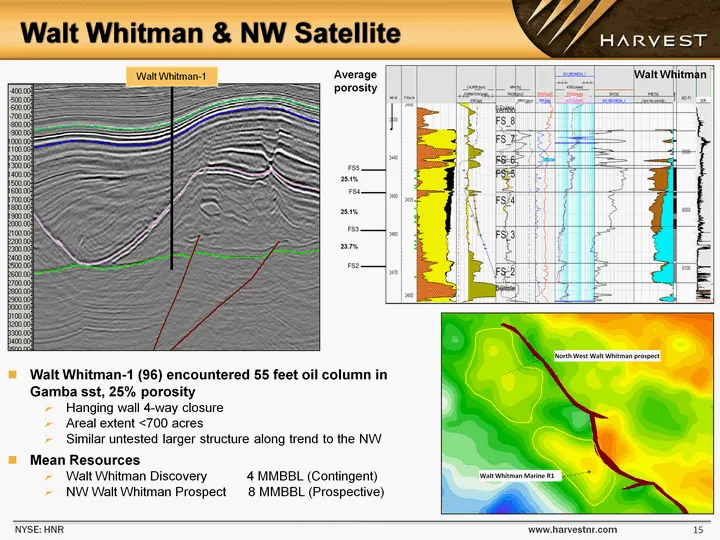
NYSE: HNR www.harvestnr.com 15 Walt Whitman-1 (96) encountered 55 feet oil column in Gamba sst, 25% porosity Hanging wall 4-way closure Areal extent <700 acres Similar untested larger structure along trend to the NW Mean Resources Walt Whitman Discovery 4 MMBBL (Contingent) NW Walt Whitman Prospect
Slide 16: Ruche - Path Forward
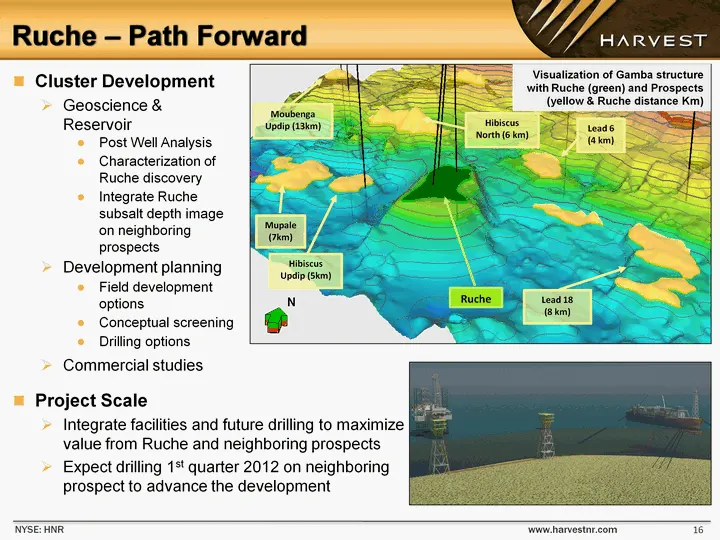
NYSE: HNR www.harvestnr.com 16 Ruche - Path Forward Visualization of Gamba structure with Ruche (green) and Prospects (yellow & Ruche distance Km) N Cluster Development Geoscience & Reservoir Post Well Analysis Characterization of Ruche discovery Integrate Ruche subsalt depth image on neighboring pr
Slide 17: Why are we here?
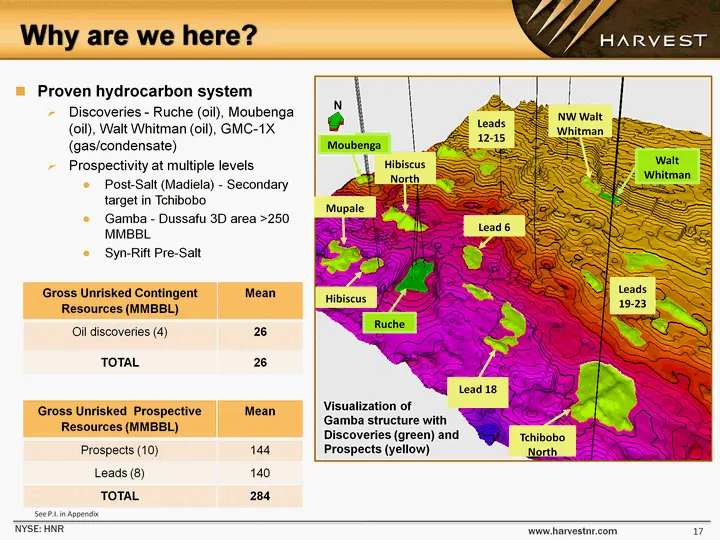
Why are we here? NYSE: HNR www.harvestnr.com 17 Proven hydrocarbon system Discoveries - Ruche (oil), Moubenga (oil), Walt Whitman (oil), GMC-1X (gas/condensate) Prospectivity at multiple levels Post-Salt (Madiela) - Secondary target in Tchibobo Gamba - Dussafu 3D area >250 MMBBL Syn-Rift Pre-Salt Gr
Slide 18: Oman - Al Ghubar/Qarn Alam
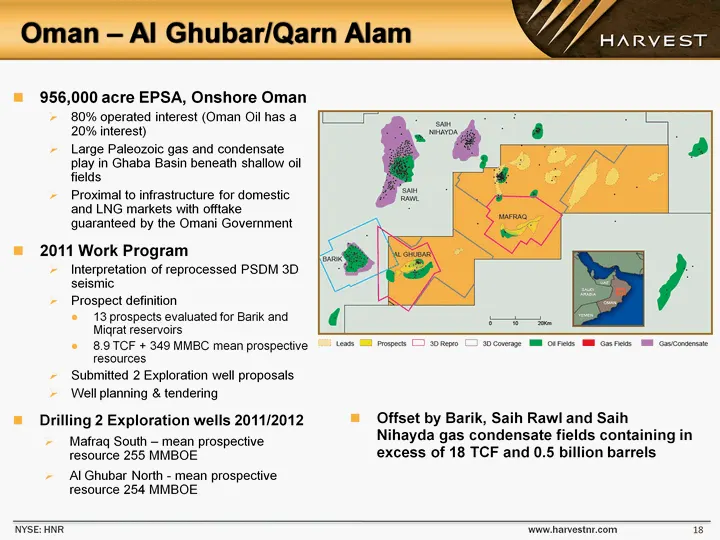
Oman - Al Ghubar/Qarn Alam NYSE: HNR www.harvestnr.com 18 956,000 acre EPSA, Onshore Oman 80% operated interest (Oman Oil has a 20% interest) Large Paleozoic gas and condensate play in Ghaba Basin beneath shallow oil fields Proximal to infrastructure for domestic and LNG markets with offtake guarant
Slide 19: Mafraq South Resource Exposure
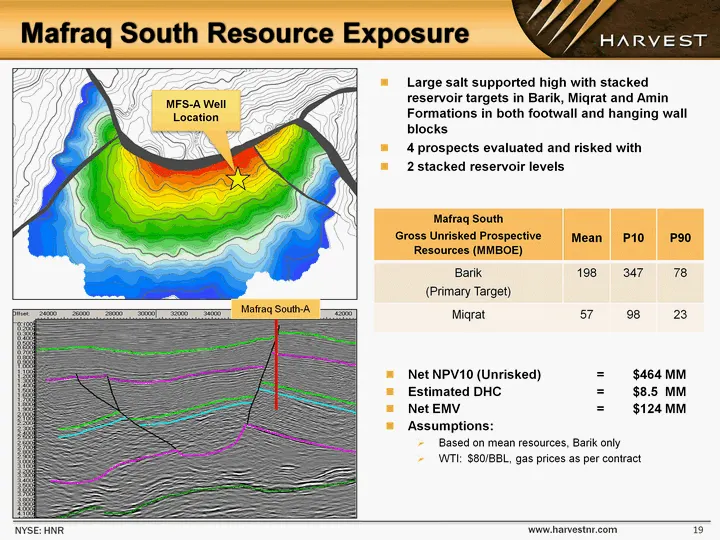
Mafraq South Resource Exposure www.harvestnr.com 19 NYSE: HNR Mafraq South-A MFS-A Well Location Large salt supported high with stacked reservoir targets in Barik, Miqrat and Amin Formations in both footwall and hanging wall blocks 4 prospects evaluated and risked with 2 stacked reservoir levels Net
Slide 20: Al Ghubar Resource Exposure
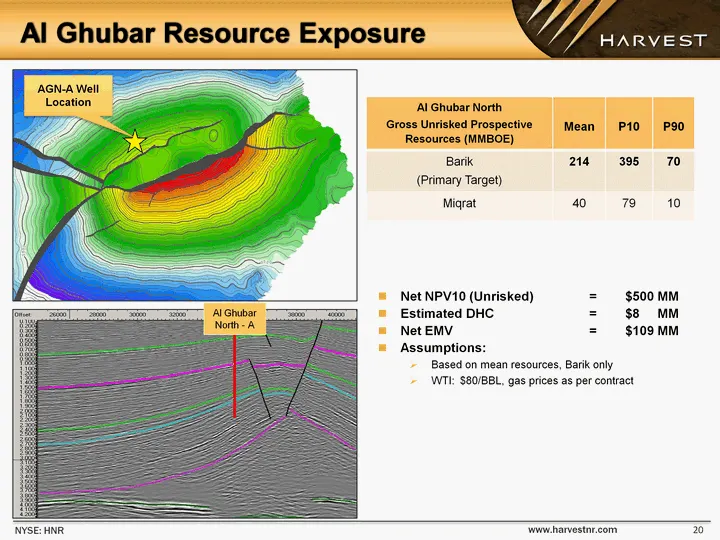
Al Ghubar Resource Exposure www.harvestnr.com 20 NYSE: HNR Al Ghubar North - A AGN-A Well Location Net NPV10 (Unrisked) = $500 MM Estimated DHC = $8 MM Net EMV = $109 MM Assumptions: Based on mean resources, Barik only WTI: $80/BBL, gas prices as per contract Al Ghubar NorthGross Unrisked Prospectiv
Slide 21: Why are we here?
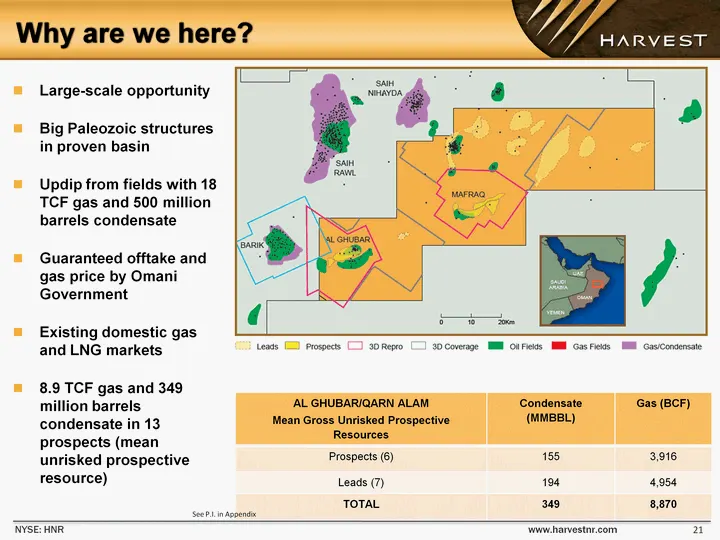
Why are we here? NYSE: HNR www.harvestnr.com 21 AL GHUBAR/QARN ALAMMean Gross Unrisked Prospective Resources Condensate (MMBBL) Gas (BCF) Prospects (6) 155 3,916 Leads (7) 194 4,954 TOTAL 349 8,870 See P.I. in Appendix Large-scale opportunity Big Paleozoic structures in proven basin Updip from field
Slide 22: Value Exposure of HNR Portfolio
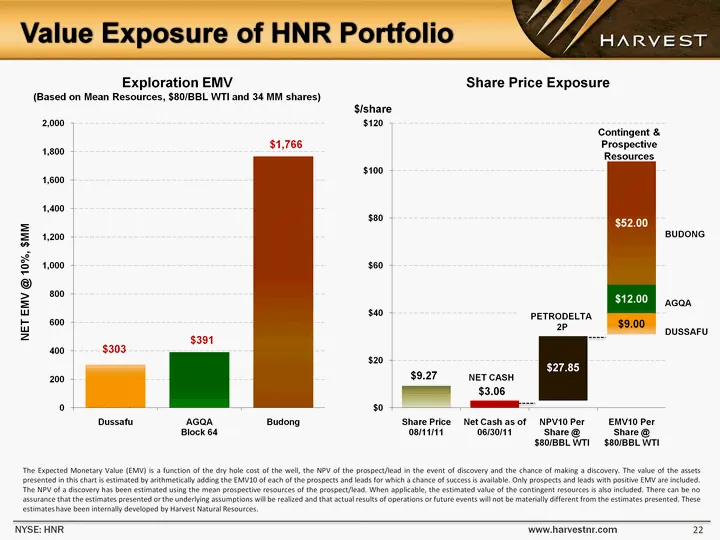
Value Exposure of HNR Portfolio NYSE: HNR www.harvestnr.com 22 The Expected Monetary Value (EMV) is a function of the dry hole cost of the well, the NPV of the prospect/lead in the event of discovery and the chance of making a discovery. The value of the assets presented in this chart is estimated b
Slide 23: 2011 Program
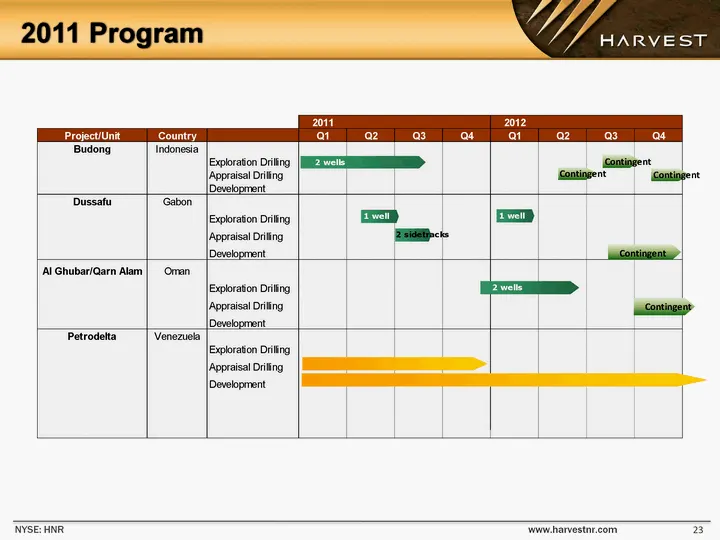
2011 Program NYSE: HNR www.harvestnr.com 23
Slide 24: Why Invest in Harvest?
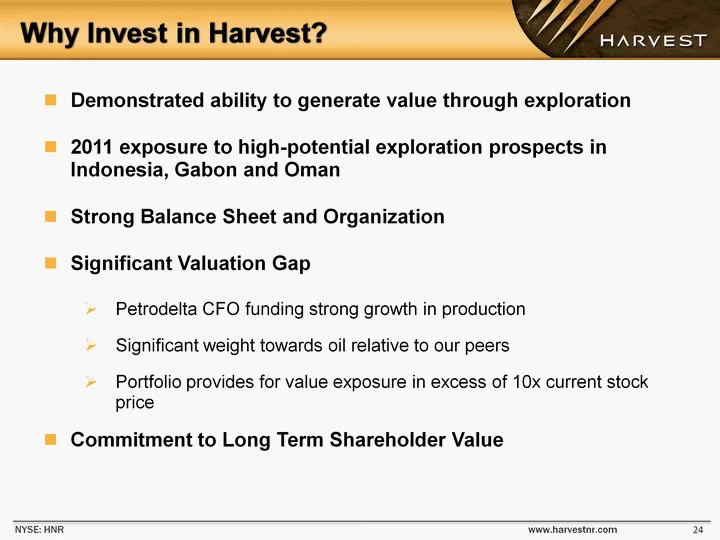
Why Invest in Harvest? NYSE: HNR www.harvestnr.com 24 Demonstrated ability to generate value through exploration 2011 exposure to high-potential exploration prospects in Indonesia, Gabon and Oman Strong Balance Sheet and Organization Significant Valuation Gap Petrodelta CFO funding strong growth in
Slide 25: Appendix
Appendix NYSE: HNR www.harvestnr.com 25
Slide 26: Budong Prospect Inventory
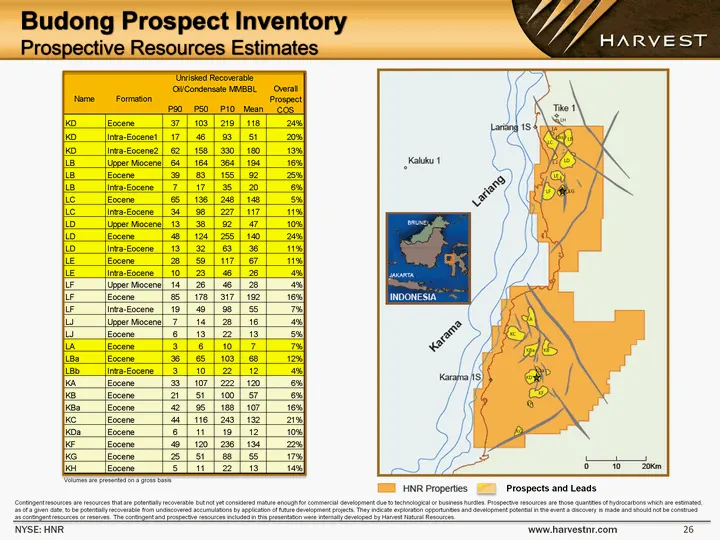
NYSE: HNR www.harvestnr.com 26 Budong Prospect Inventory Prospective Resources Estimates KD KB KDa KF KG KH LB LC LD LE LG L J LA LBa LH LF KA KC KBa Prospects and Leads Volumes are presented on a gross basis Contingent resources are resources that are potentially recoverable but not yet considered
Slide 27: Dussafu Prospect Inventory
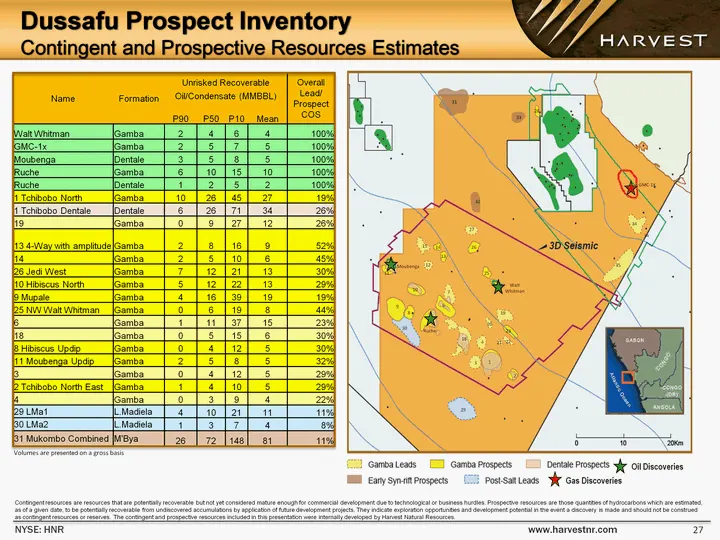
Dussafu Prospect Inventory Contingent and Prospective Resources Estimates NYSE: HNR www.harvestnr.com 27 Name Formation Unrisked Recoverable Unrisked Recoverable Unrisked Recoverable Unrisked Recoverable Overall Lead/ Prospect COS Name Formation Oil/Condensate (MMBBL) Oil/Condensate (MMBBL) Oil/Cond
Slide 28: AGQA Prospect Inventory
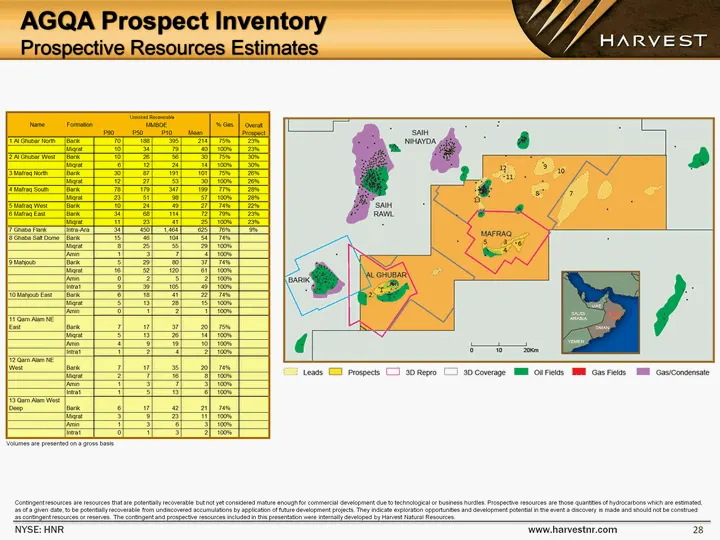
AGQA Prospect Inventory Prospective Resources Estimates NYSE: HNR www.harvestnr.com 28 Contingent resources are resources that are potentially recoverable but not yet considered mature enough for commercial development due to technological or business hurdles. Prospective resources are those quantit
Source: SEC EDGAR · 8-K filed Aug 15, 2011
More decks from Harvest Natural Resources Inc
 Enercom Oil and Gas Conference 201517 slides · Aug 17, 2015
 Enercom Oil and Gas Conference 201417 slides · Aug 18, 2014
 Global Hunter Energy Conference (June 2014)18 slides · Jun 25, 2014
 EnerCom's The Oil & Gas Conference 18 (August 2013)20 slides · Aug 12, 2013
 Global Hunter Securities 100 Energy Conference 201316 slides · Jun 25, 2013
 EnerCom's The Oil and Gas Conference 201220 slides · Aug 13, 2012