Durr AG · XETR:DUE
Durr — Investor Presentation (June 2017)
50 slides from Durr's investor presentation, June 2017
Slide 1: Investor Relations Presentation
INVESTOR RELATIONS PRESENTATION Corporate Communications & Investor Relations Dürr AG Bietigheim-Bissingen, June 2017 www.durr.com
Slide 2: Disclaimer
DISCLAIMER This presentation has been prepared independently by Dürr AG (“Dürr”). The presentation contains statements which address such key issues as Dürr’s strategy, future financial results, market positions and product development. Such statements should be carefully considered, and it should b
Slide 3: Agenda
AGENDA 1. Executive Summary 2. Our five divisions 3. Group strategy 4. Group financials, markets and outlook © Dürr AG, CCI, Investor Relations Presentation, Bietigheim-Bissingen, June 2017 3
Slide 4: Executive Summary
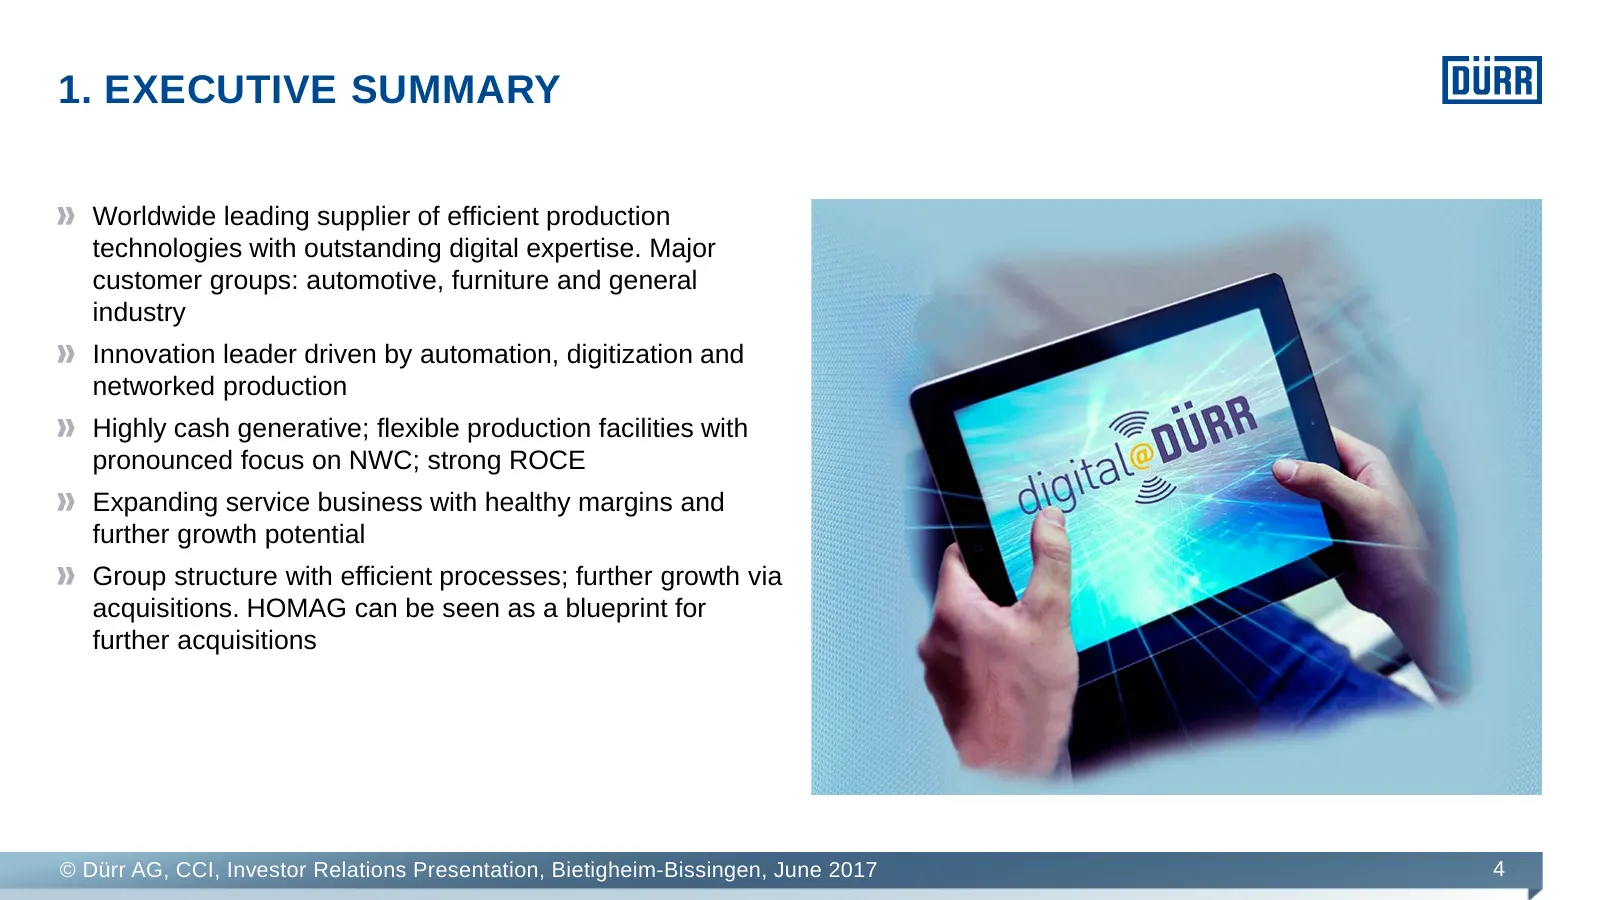
1. EXECUTIVE SUMMARY Worldwide leading supplier of efficient production technologies with outstanding digital expertise. Major customer groups: automotive, furniture and general industry Innovation leader driven by automation, digitization and networked production Highly cash generative; flexible pr
Slide 5: Dürr: global leader in strong competitive position
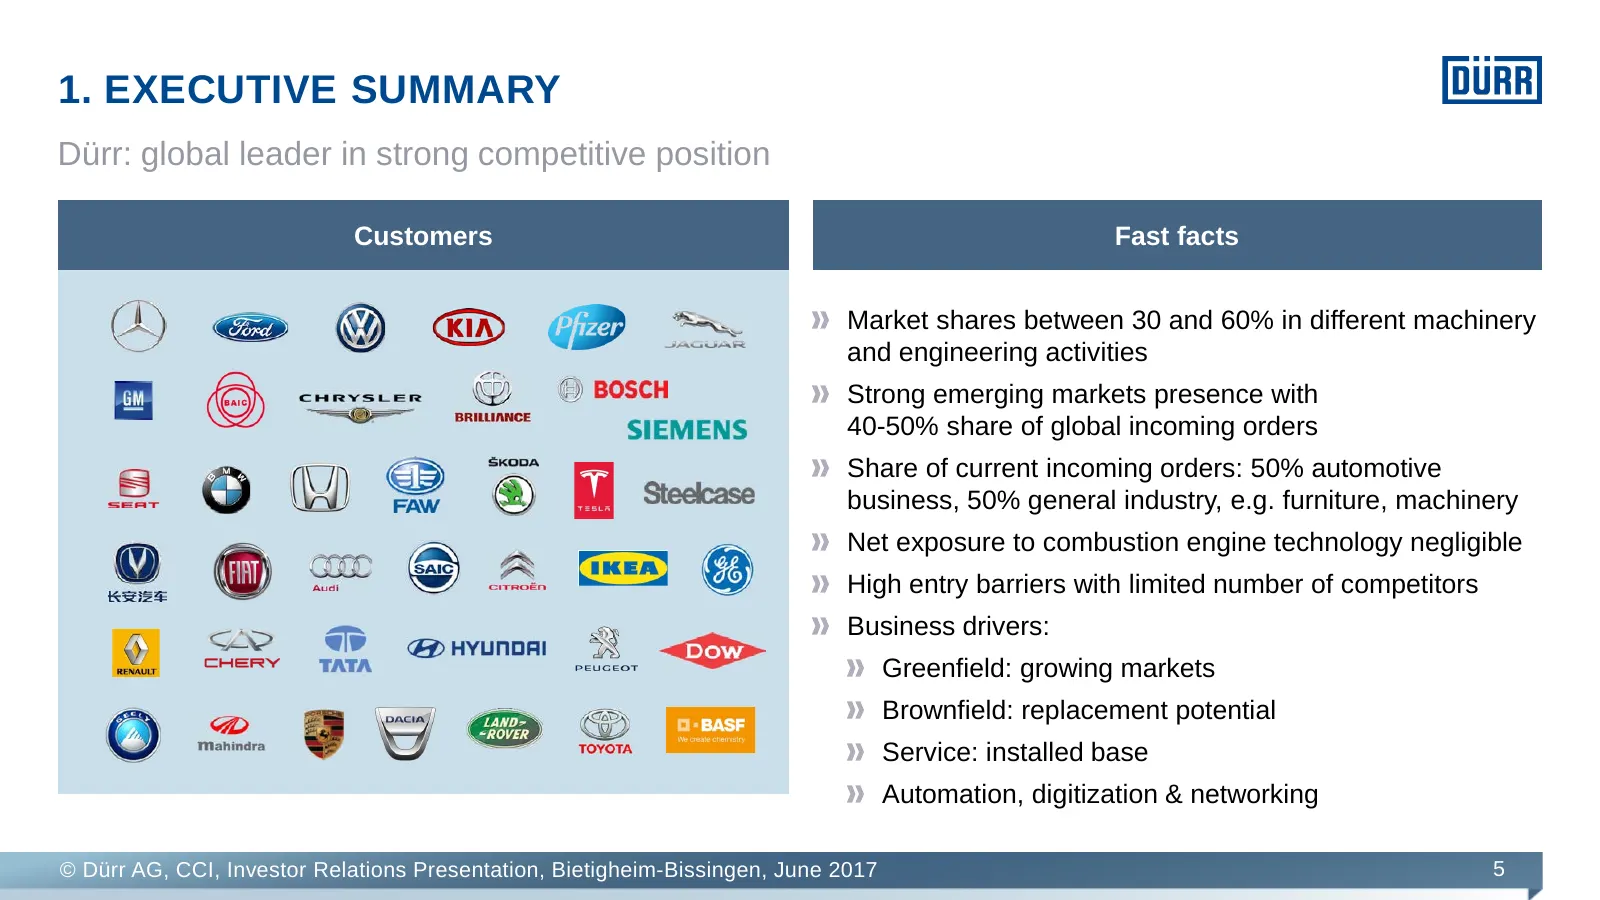
1. EXECUTIVE SUMMARY Dürr: global leader in strong competitive position Customers Fast facts Market shares between 30 and 60% in different machinery and engineering activities Strong emerging markets presence with 40-50% share of global incoming orders Share of current incoming orders: 50% automotiv
Slide 6: Agenda
AGENDA 1. Executive Summary 2. Our five divisions 3. Group strategy 4. Group financials, markets and outlook © Dürr AG, CCI, Investor Relations Presentation, Bietigheim-Bissingen, June 2017 6
Slide 7: Our Five Divisions
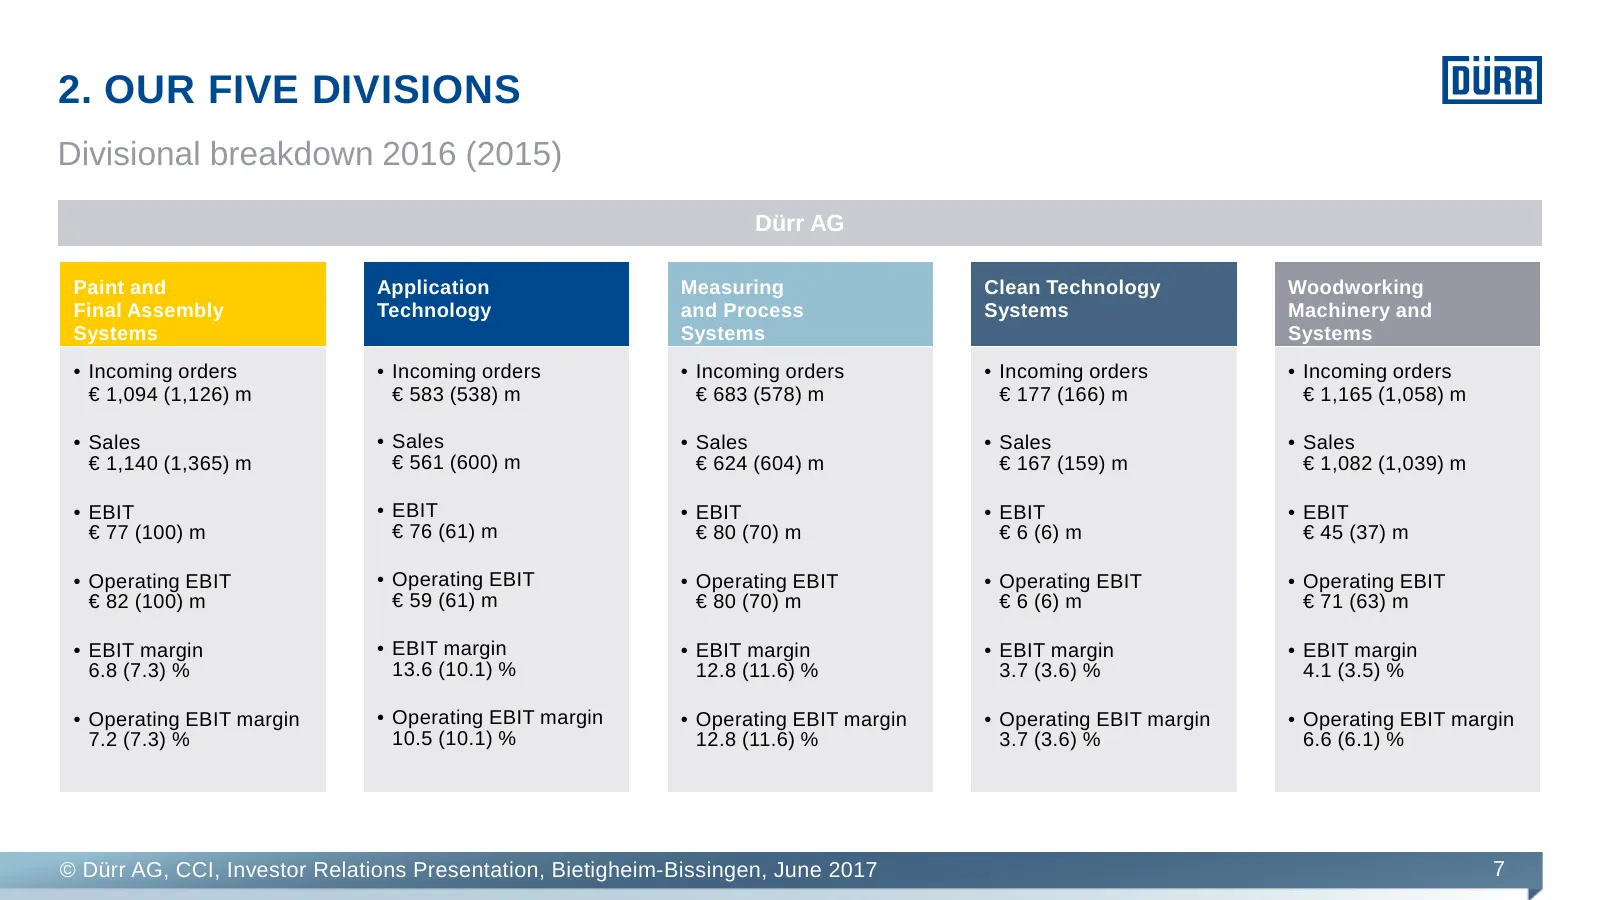
2. OUR FIVE DIVISIONS Divisional breakdown 2016 (2015) Dürr AG Paint and Application Measuring Clean Technology Woodworking Final Assembly Technology and Process Systems Machinery and Systems Systems Systems • Incoming orders • Incoming orders • Incoming orders • Incoming orders • Incoming orders €
Slide 8: Market share Dürr/competitors
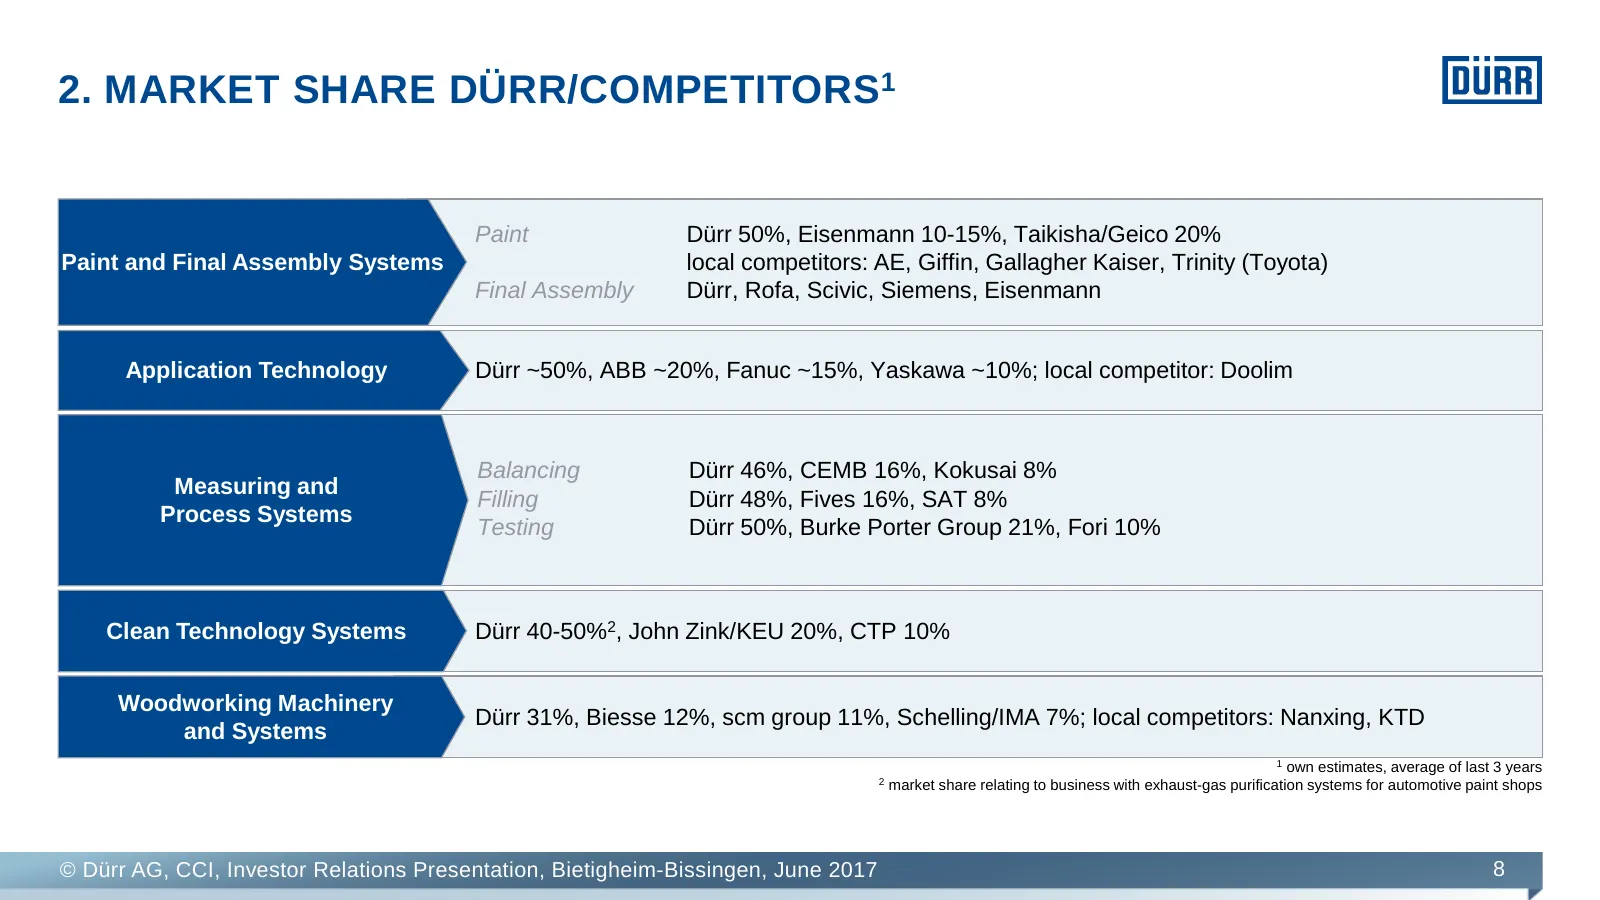
2. MARKET SHARE DÜRR/COMPETITORS1 Paint Dürr 50%, Eisenmann 10-15%, Taikisha/Geico 20% Paint and Final Assembly Systems local competitors: AE, Giffin, Gallagher Kaiser, Trinity (Toyota) Final Assembly Dürr, Rofa, Scivic, Siemens, Eisenmann Application Technology Dürr ~50%, ABB ~20%, Fanuc ~15%, Yask
Slide 9: Paint and Final Assembly Systems
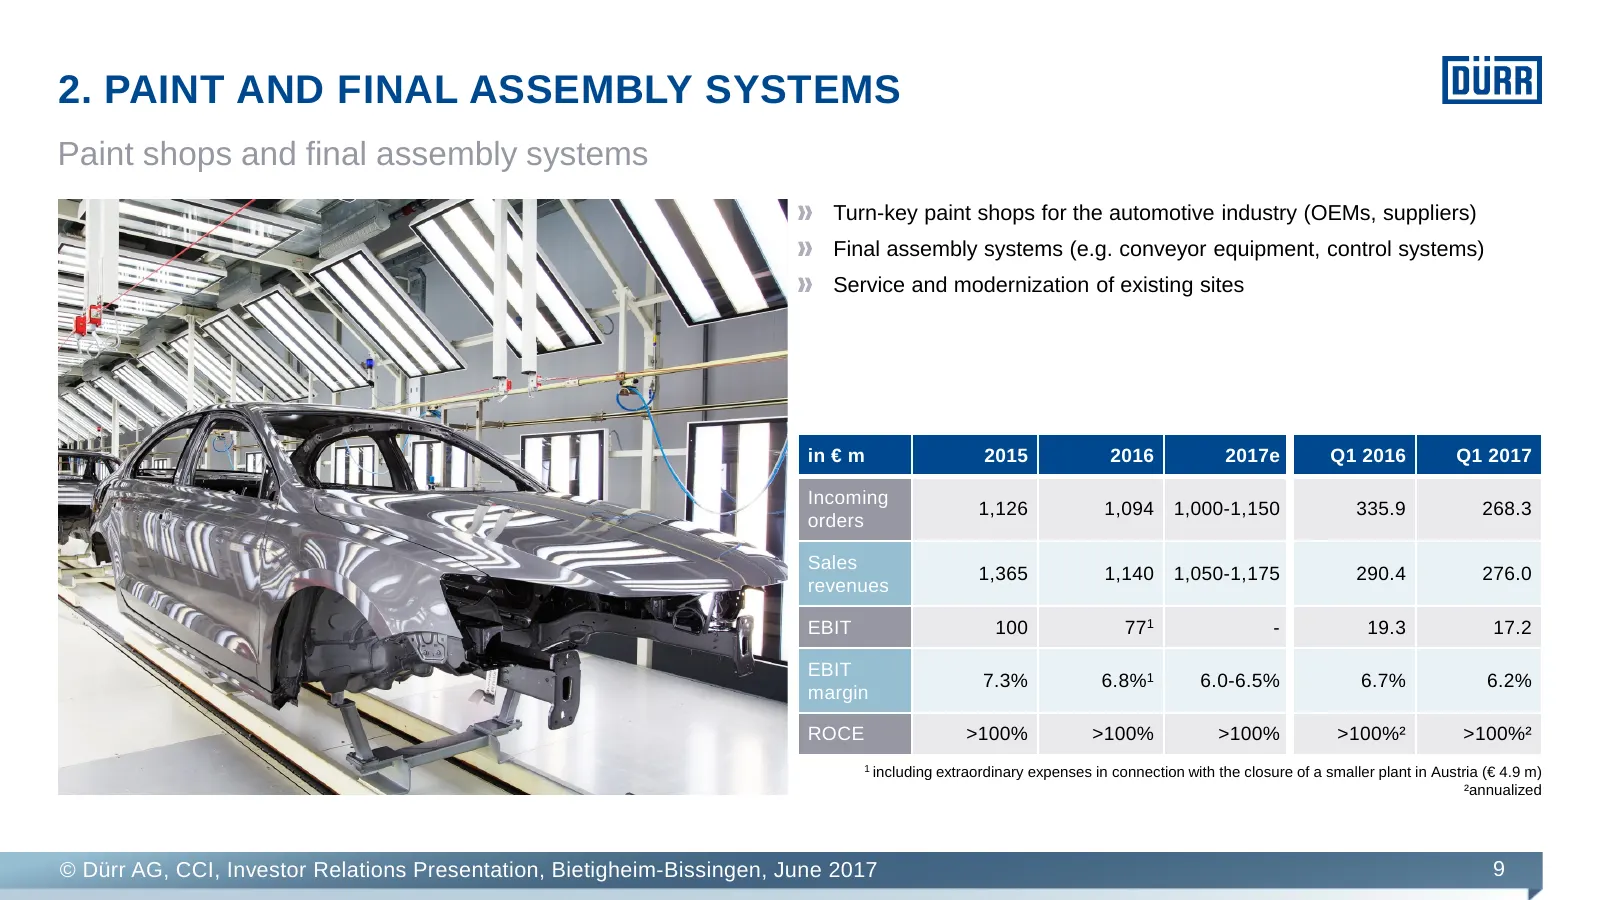
2. PAINT AND FINAL ASSEMBLY SYSTEMS Paint shops and final assembly systems Turn-key paint shops for the automotive industry (OEMs, suppliers) Final assembly systems (e.g. conveyor equipment, control systems) Service and modernization of existing sites in € m 2015 2016 2017e Q1 2016 Q1 2017 Incoming
Slide 10: Application Technology
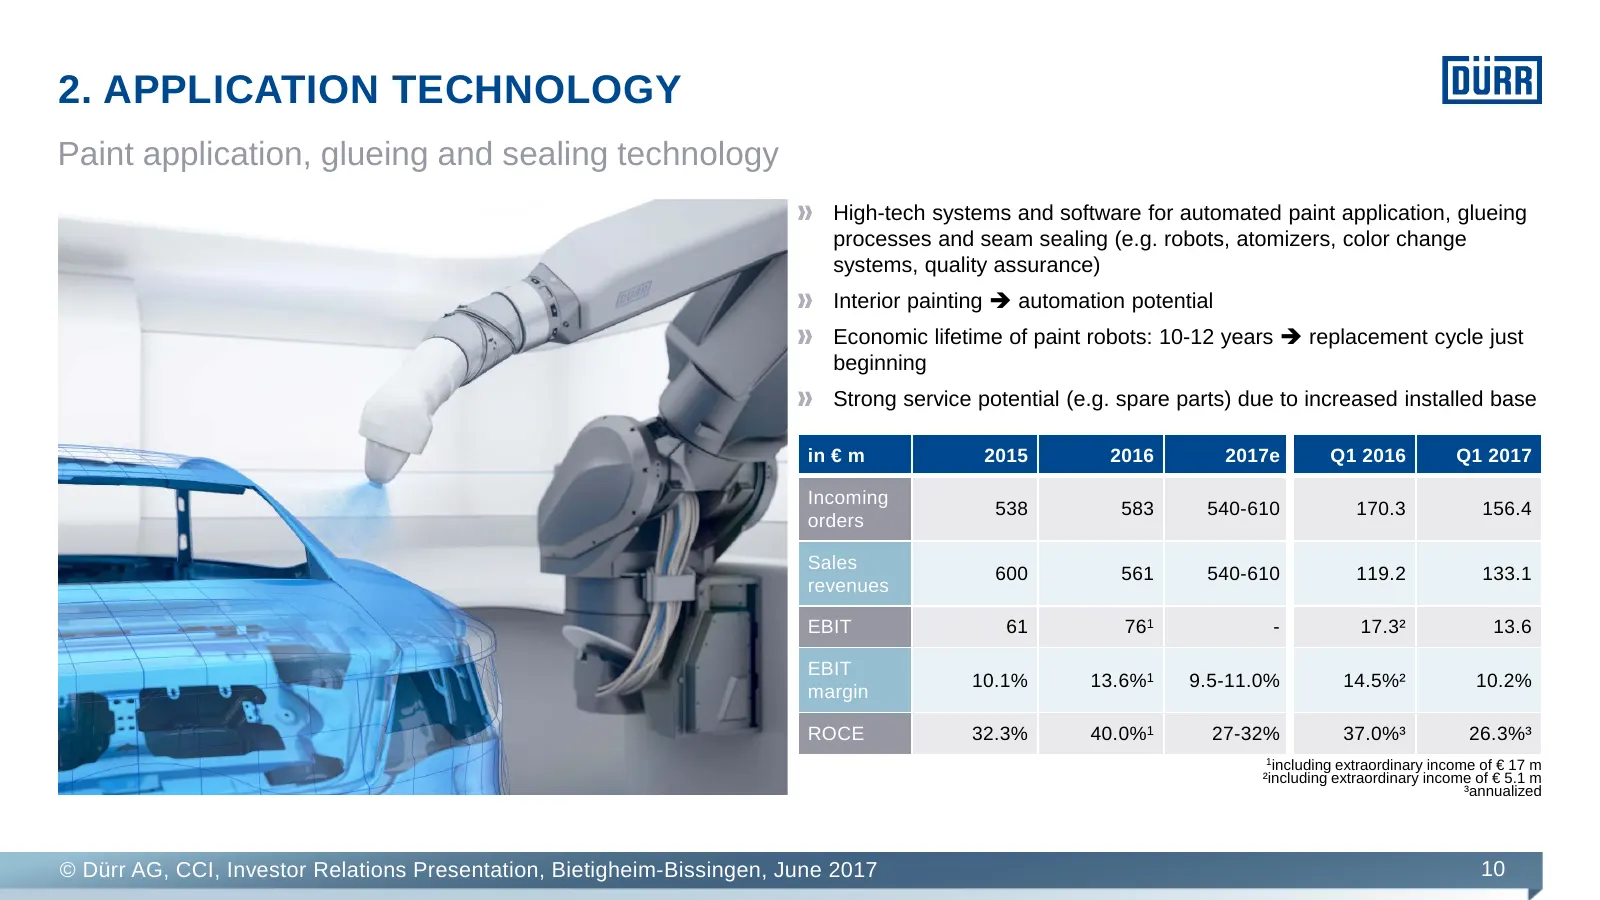
2. APPLICATION TECHNOLOGY Paint application, glueing and sealing technology High-tech systems and software for automated paint application, glueing processes and seam sealing (e.g. robots, atomizers, color change systems, quality assurance) Interior painting automation potential Economic lifetime
Slide 11: Application Technology: addressing general industry
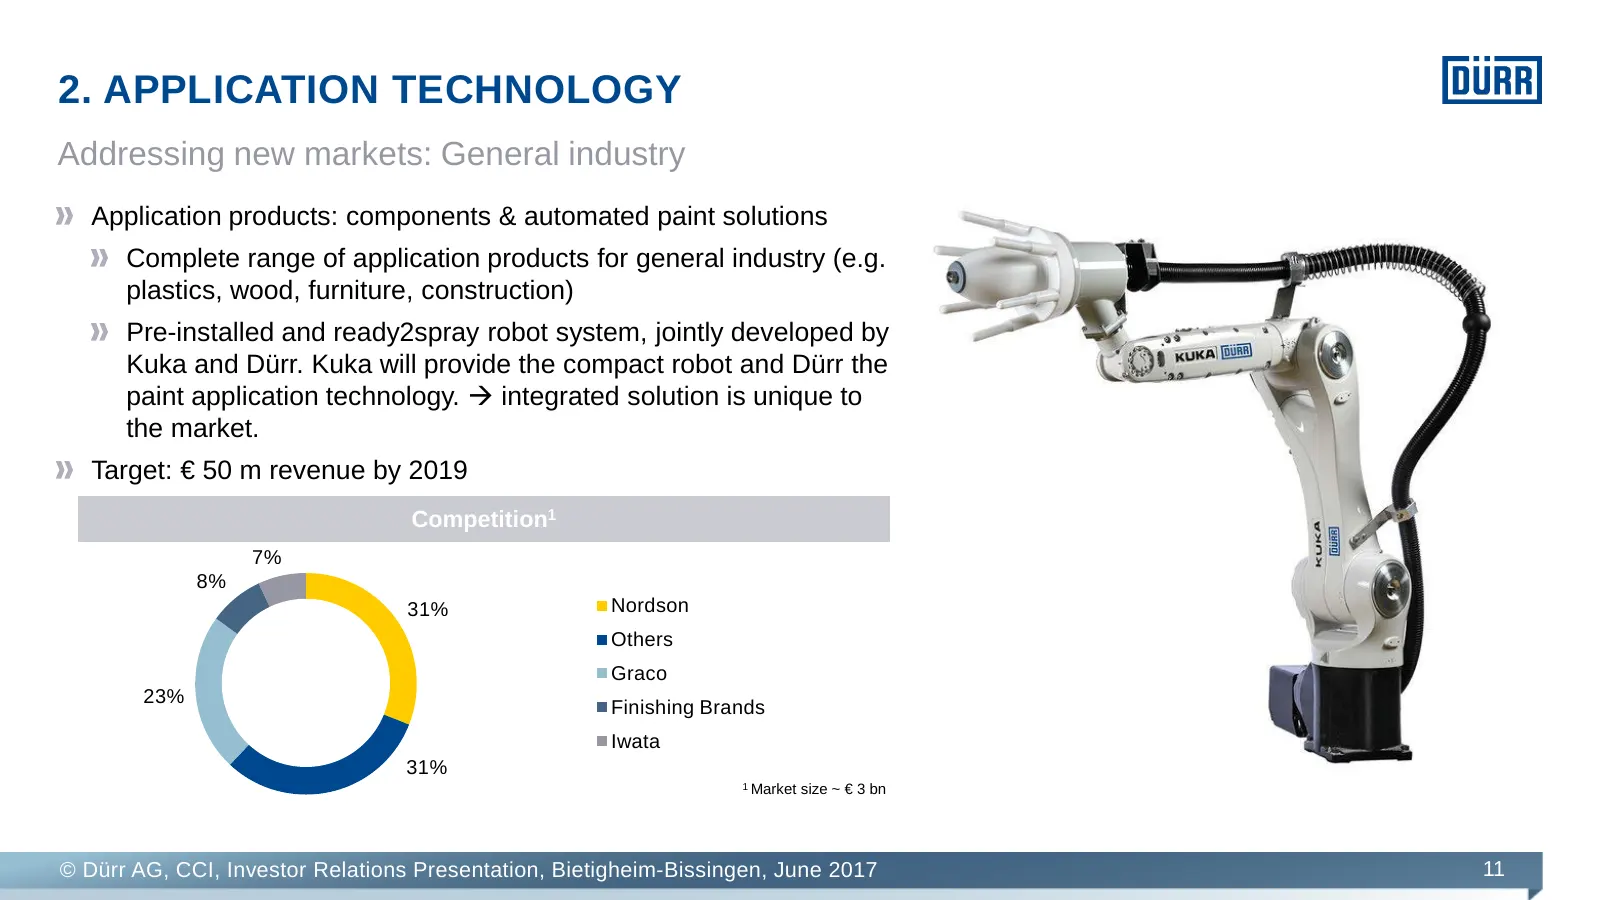
2. APPLICATION TECHNOLOGY Addressing new markets: General industry Application products: components & automated paint solutions Complete range of application products for general industry (e.g. plastics, wood, furniture, construction) Pre-installed and ready2spray robot system, jointly developed by
Slide 12: Paint Business: business drivers
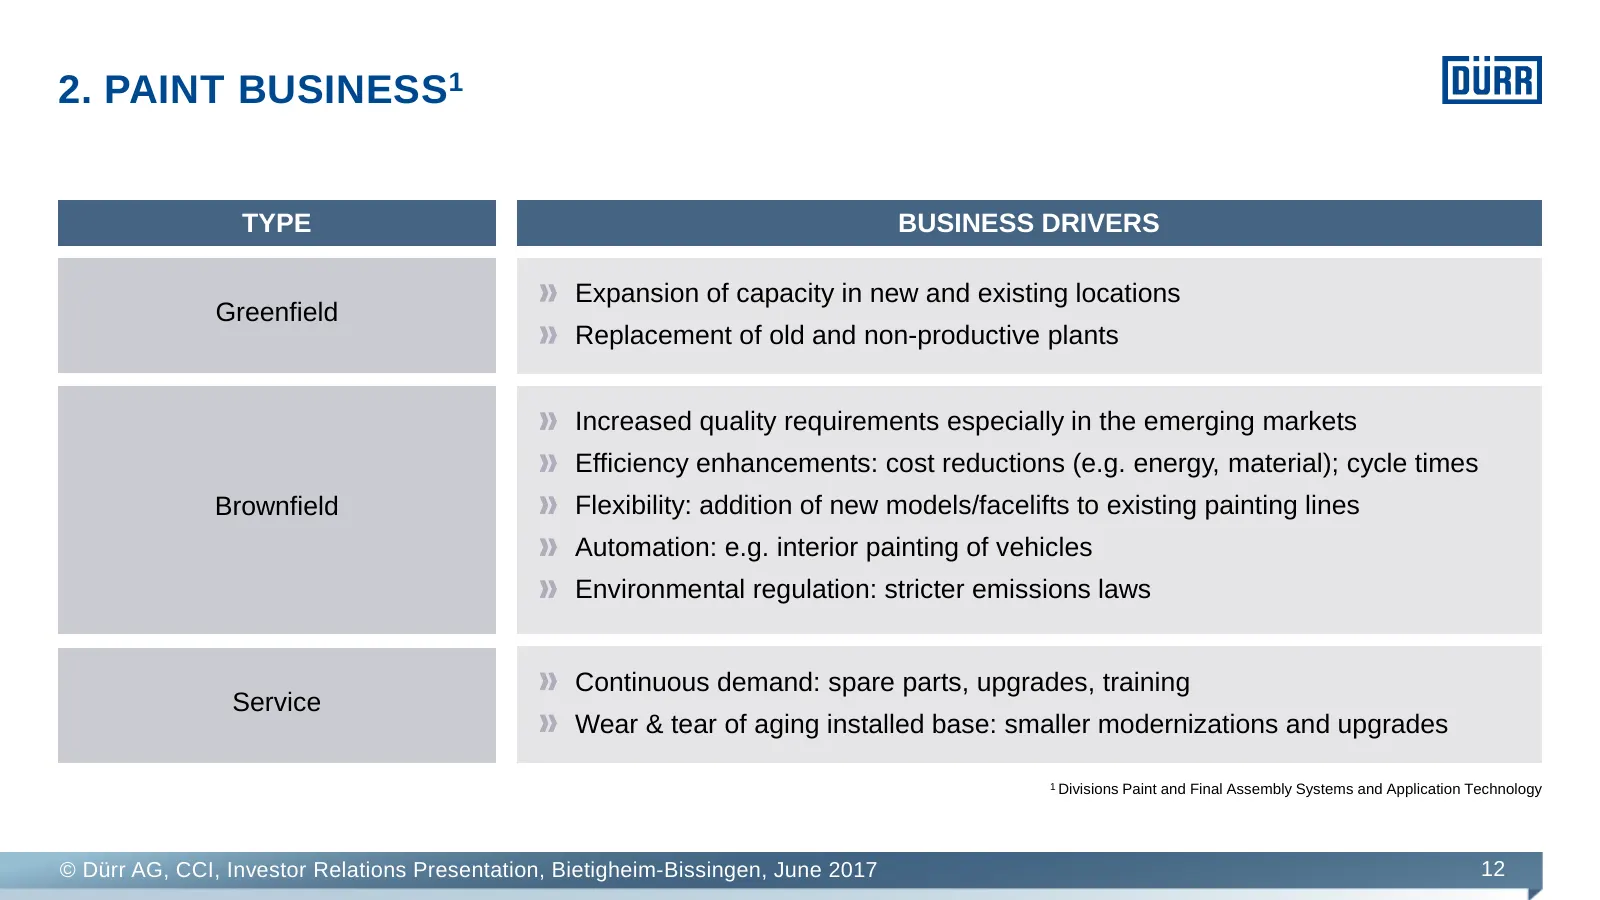
2. PAINT BUSINESS1 TYPE BUSINESS DRIVERS Expansion of capacity in new and existing locations Greenfield Replacement of old and non-productive plants Increased quality requirements especially in the emerging markets Efficiency enhancements: cost reductions (e.g. energy, material); cycle times Brownfi
Slide 13: Paint Business: brownfield with growing importance
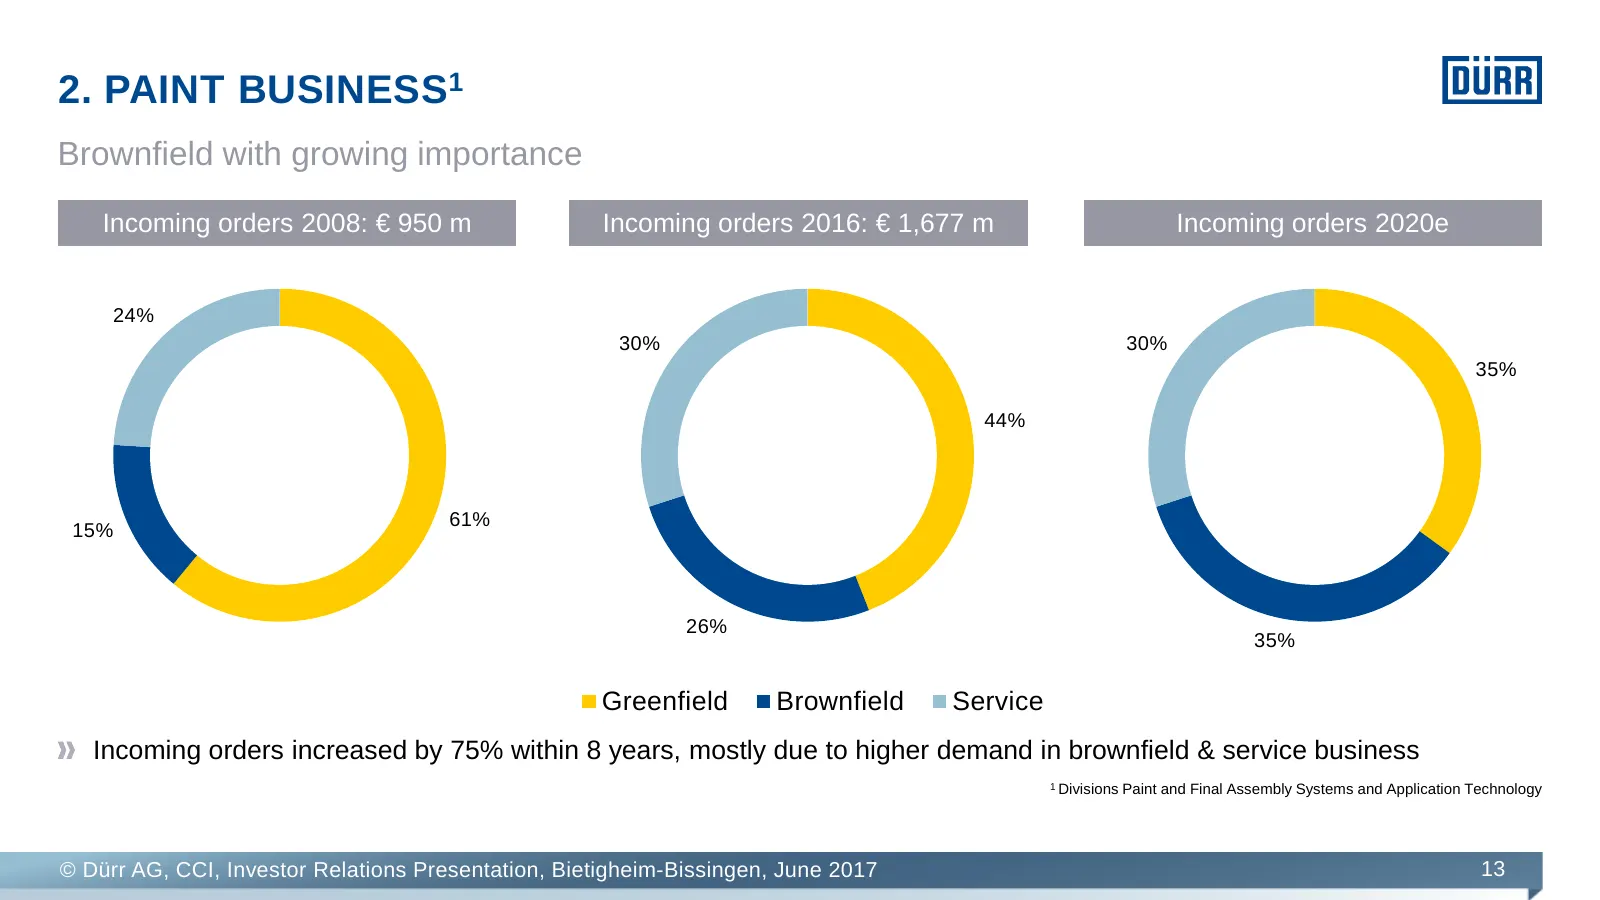
2. PAINT BUSINESS1 Brownfield with growing importance Incoming orders 2008: € 950 m Incoming orders 2016: € 1,677 m Incoming orders 2020e 24% 30% 30% 35% 44% 61% 15% 26% 35% Greenfield Brownfield Service Incoming orders increased by 75% within 8 years, mostly due to higher demand in brownfield & ser
Slide 14: Measuring and Process Systems
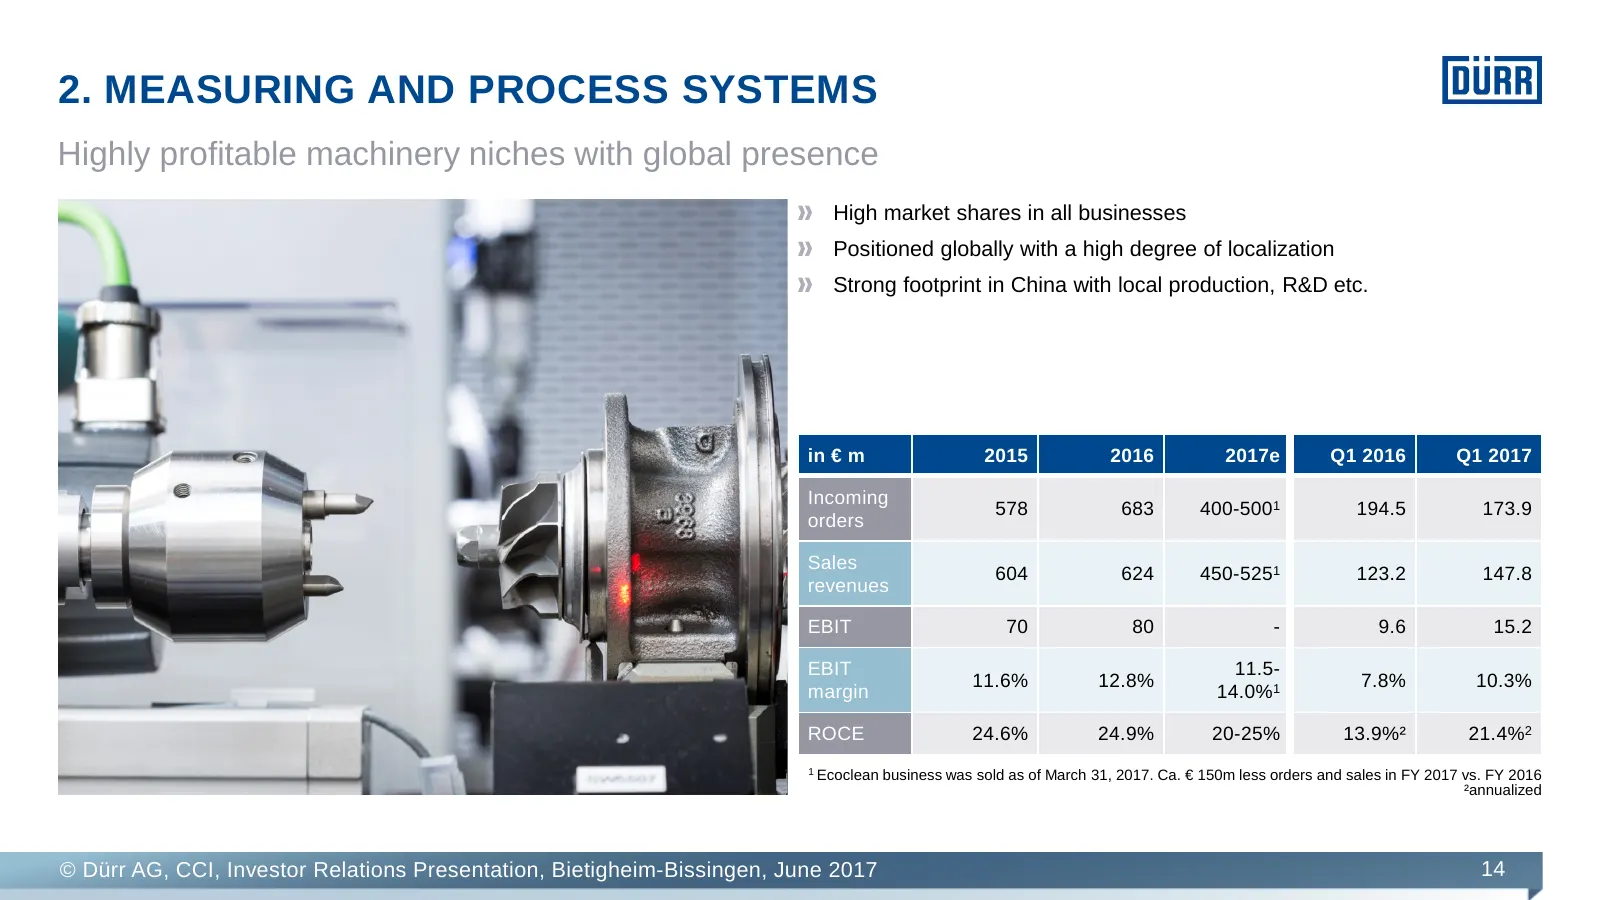
2. MEASURING AND PROCESS SYSTEMS Highly profitable machinery niches with global presence High market shares in all businesses Positioned globally with a high degree of localization Strong footprint in China with local production, R&D etc. in € m 2015 2016 2017e Q1 2016 Q1 2017 Incoming 578 683 400-5
Slide 15: Three strongly performing machinery niche players
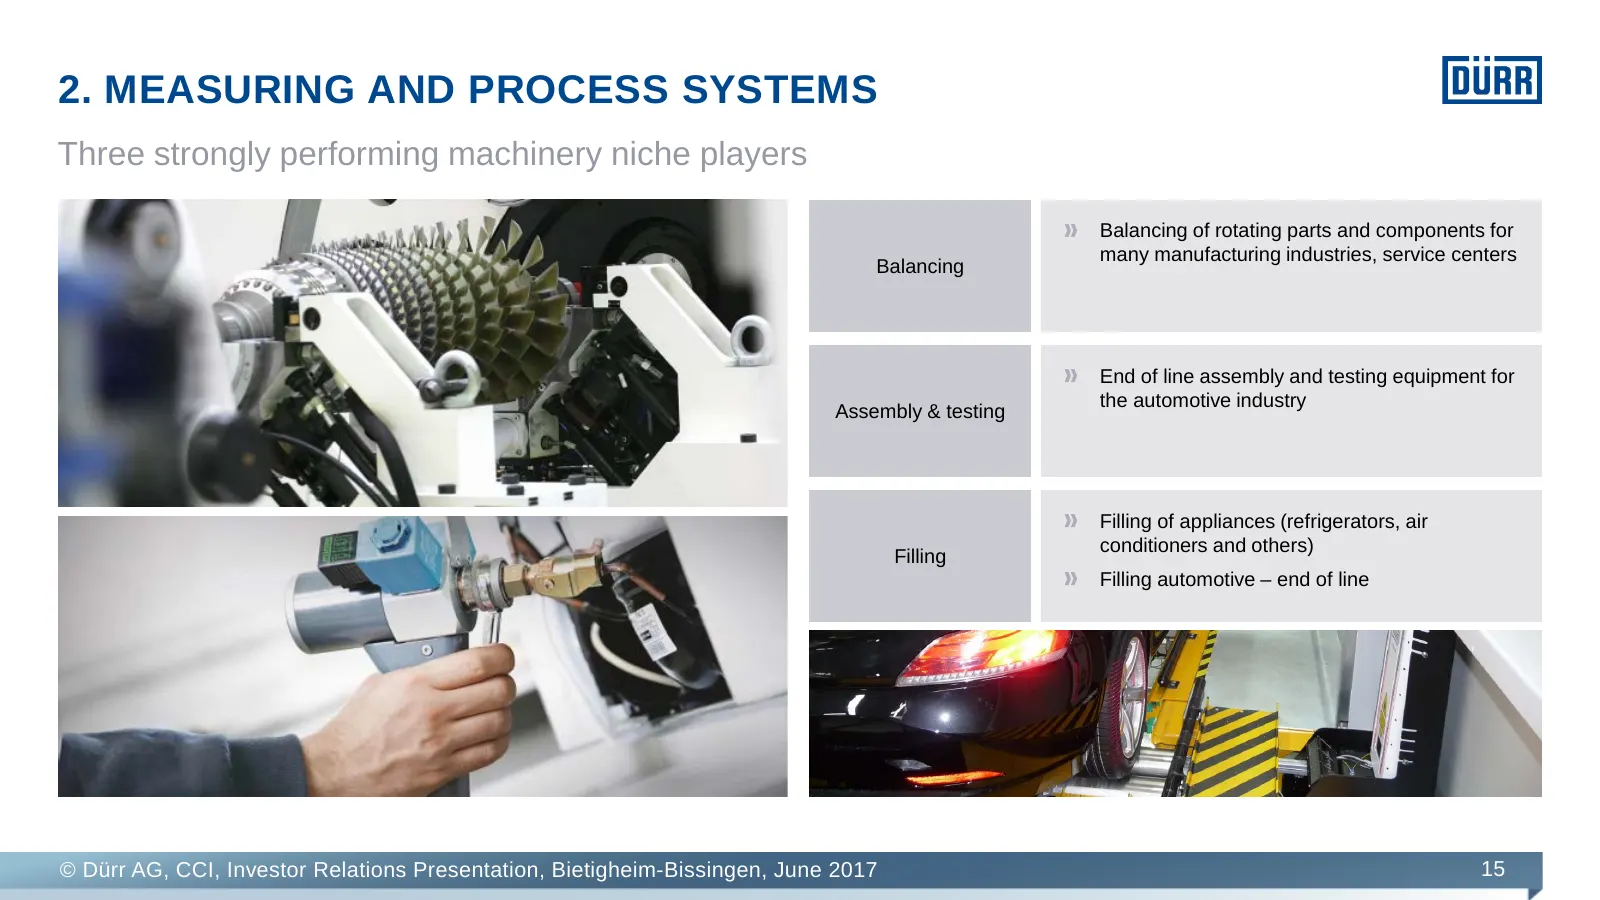
2. MEASURING AND PROCESS SYSTEMS Three strongly performing machinery niche players Balancing of rotating parts and components for many manufacturing industries, service centers Balancing End of line assembly and testing equipment for the automotive industry Assembly & testing Filling of appliances (
Slide 16: Clean Technology Systems
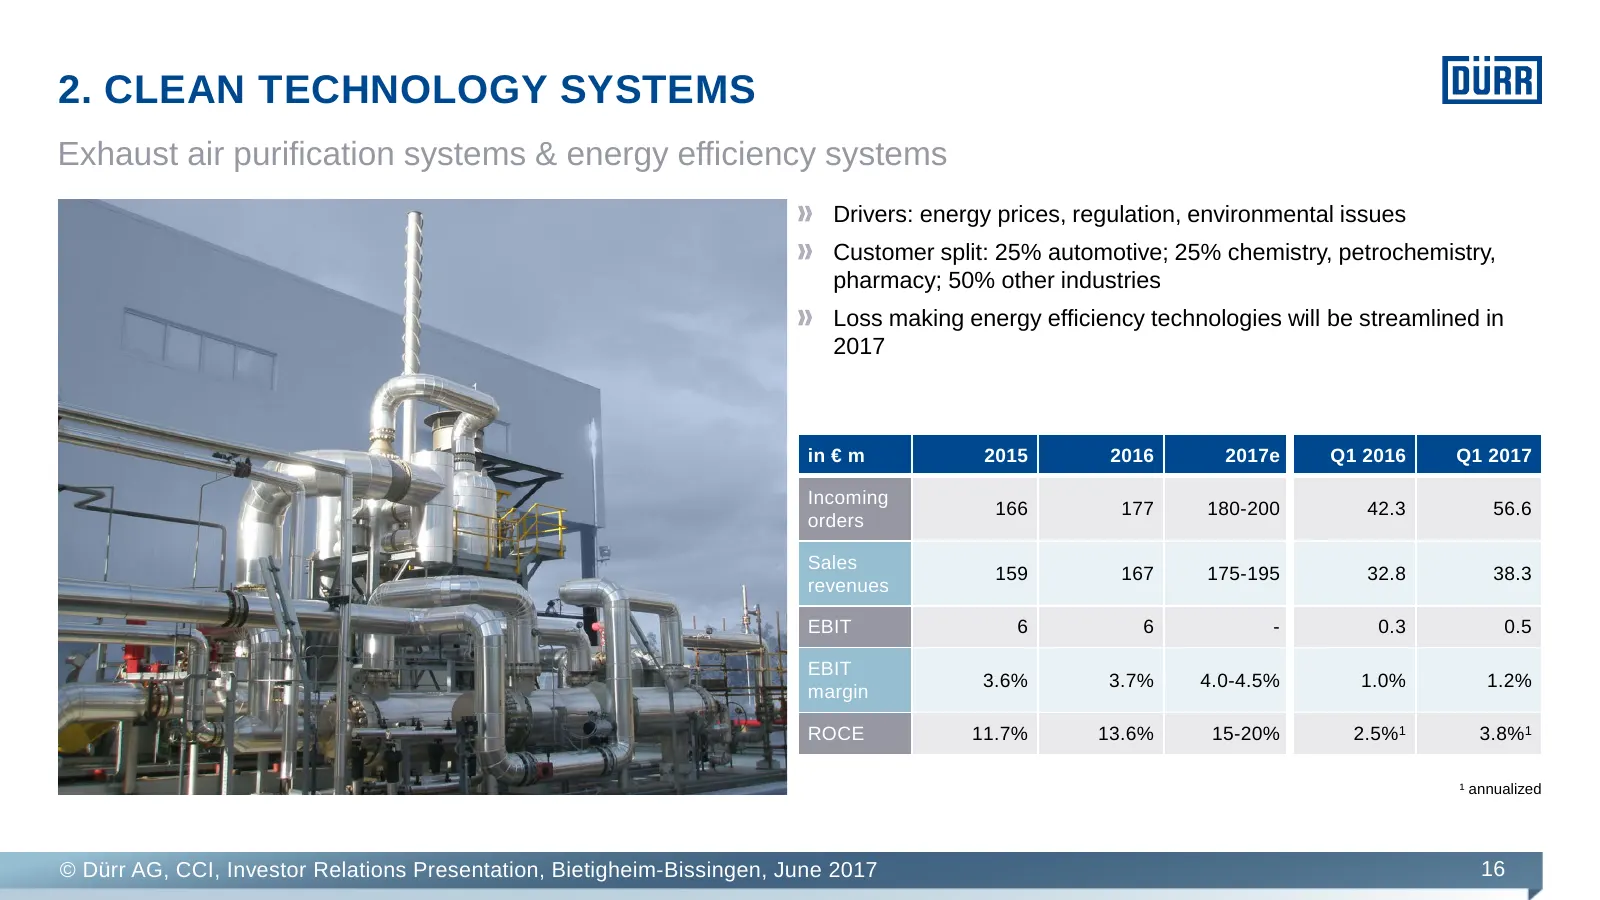
2. CLEAN TECHNOLOGY SYSTEMS Exhaust air purification systems & energy efficiency systems Drivers: energy prices, regulation, environmental issues Customer split: 25% automotive; 25% chemistry, petrochemistry, pharmacy; 50% other industries Loss making energy efficiency technologies will be streamlin
Slide 17: Woodworking Machinery and Systems
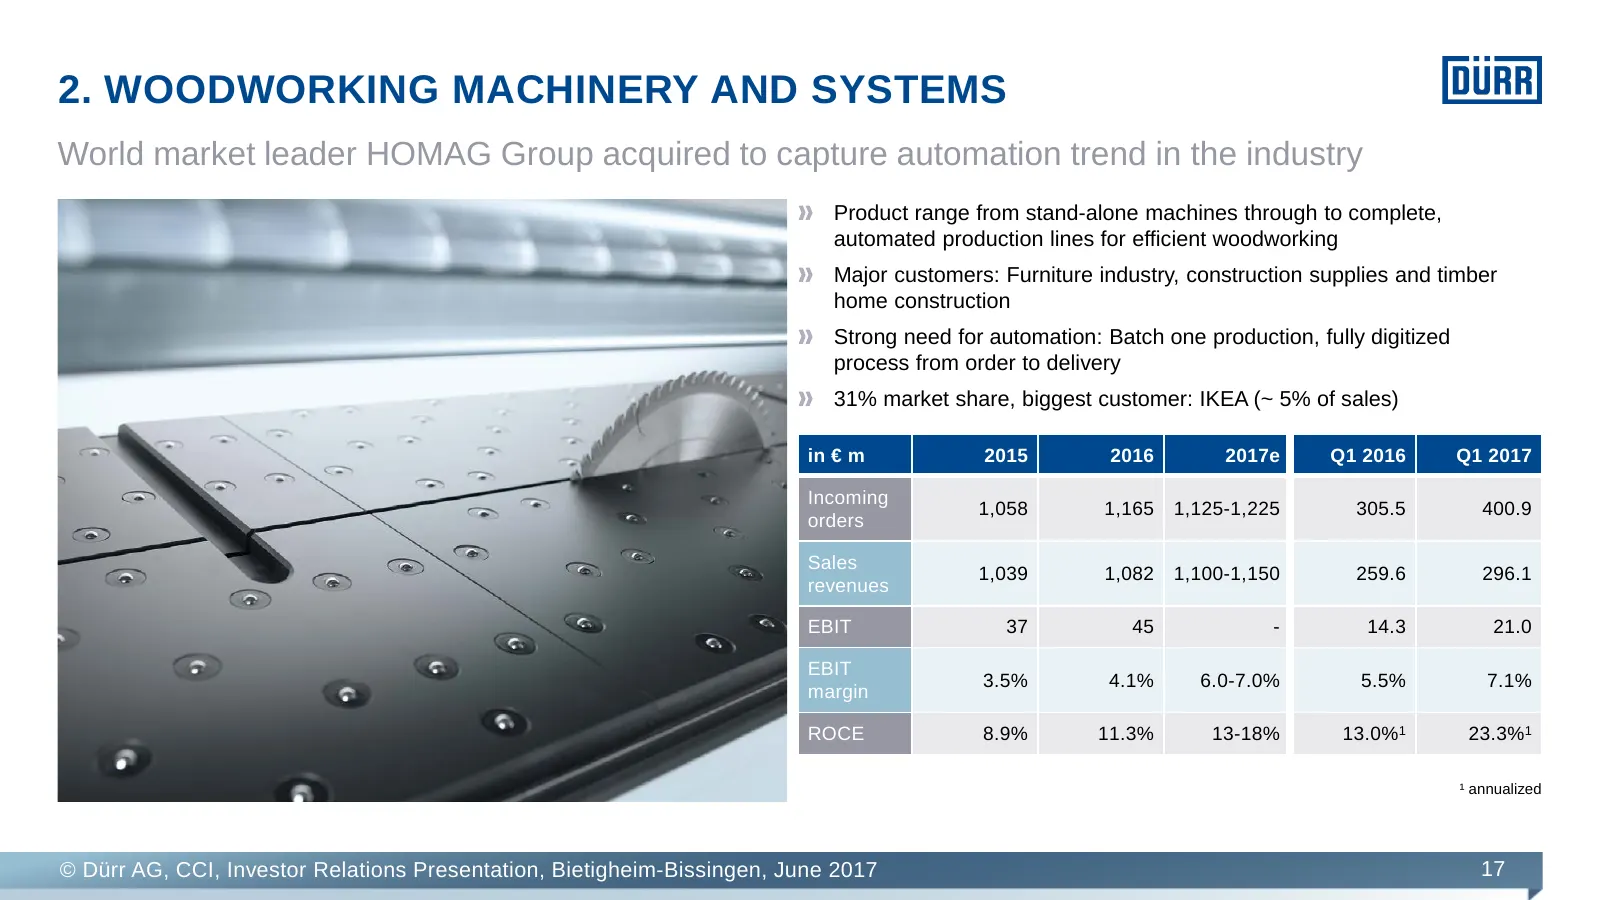
2. WOODWORKING MACHINERY AND SYSTEMS World market leader HOMAG Group acquired to capture automation trend in the industry Product range from stand-alone machines through to complete, automated production lines for efficient woodworking Major customers: Furniture industry, construction supplies and t
Slide 18: FOCUS program progressing well, targets conservative
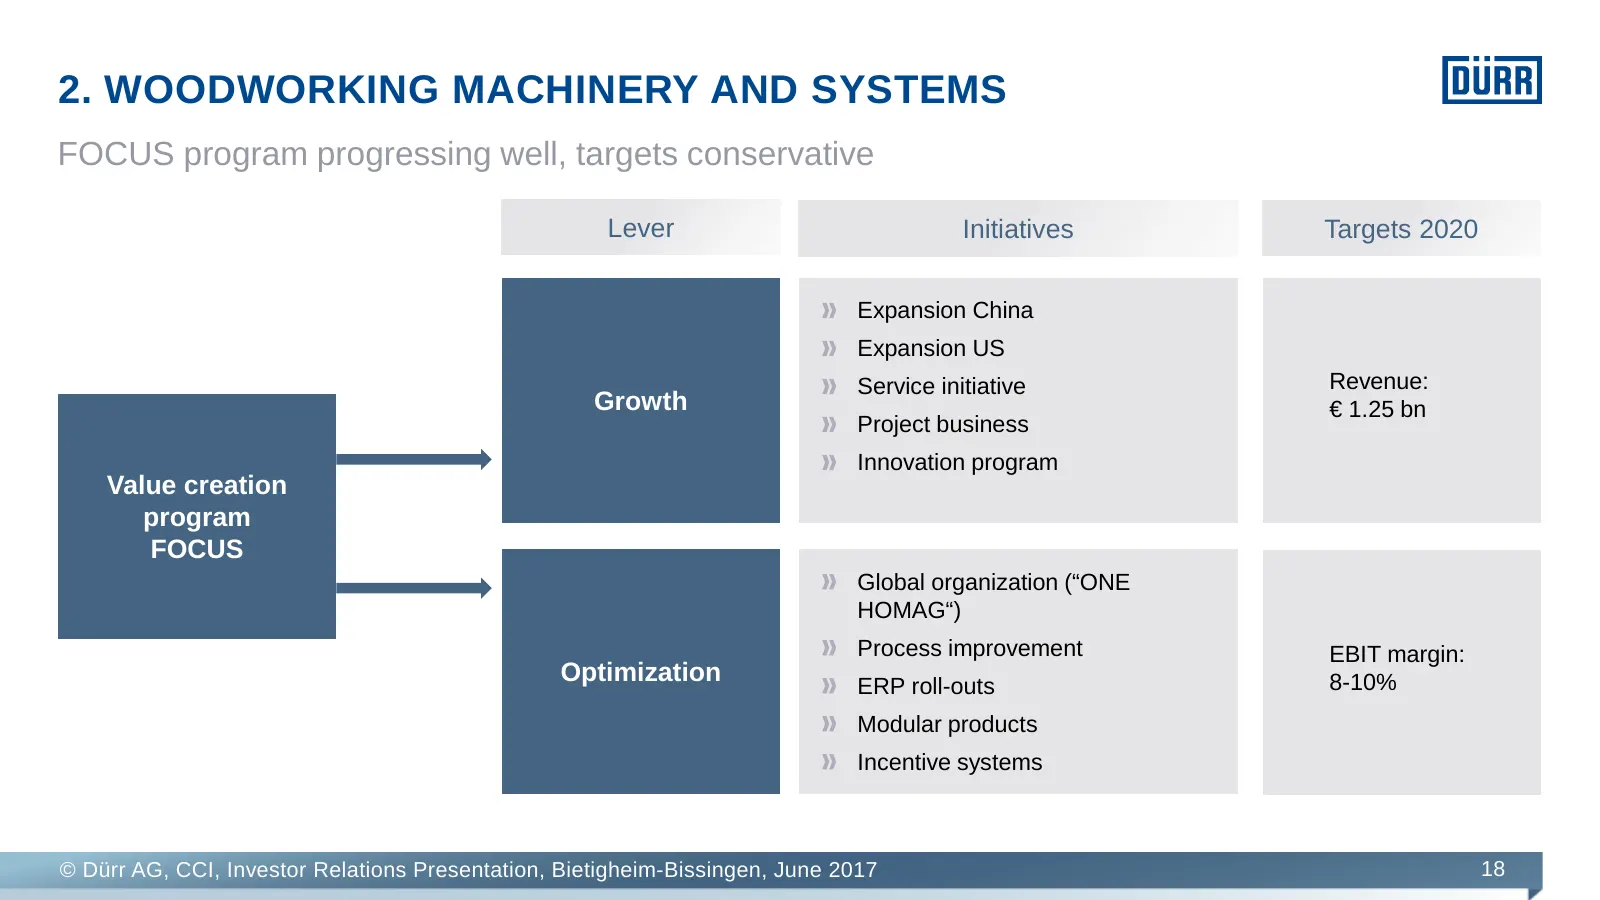
2. WOODWORKING MACHINERY AND SYSTEMS FOCUS program progressing well, targets conservative Lever Initiatives Targets 2020 Expansion China Expansion US Service initiative Revenue: Growth € 1.25 bn Project business Innovation program Value creation program FOCUS Global organization (“ONE HOMAG“) Proces
Slide 19: FOCUS 2017: Shifting gears to innovation
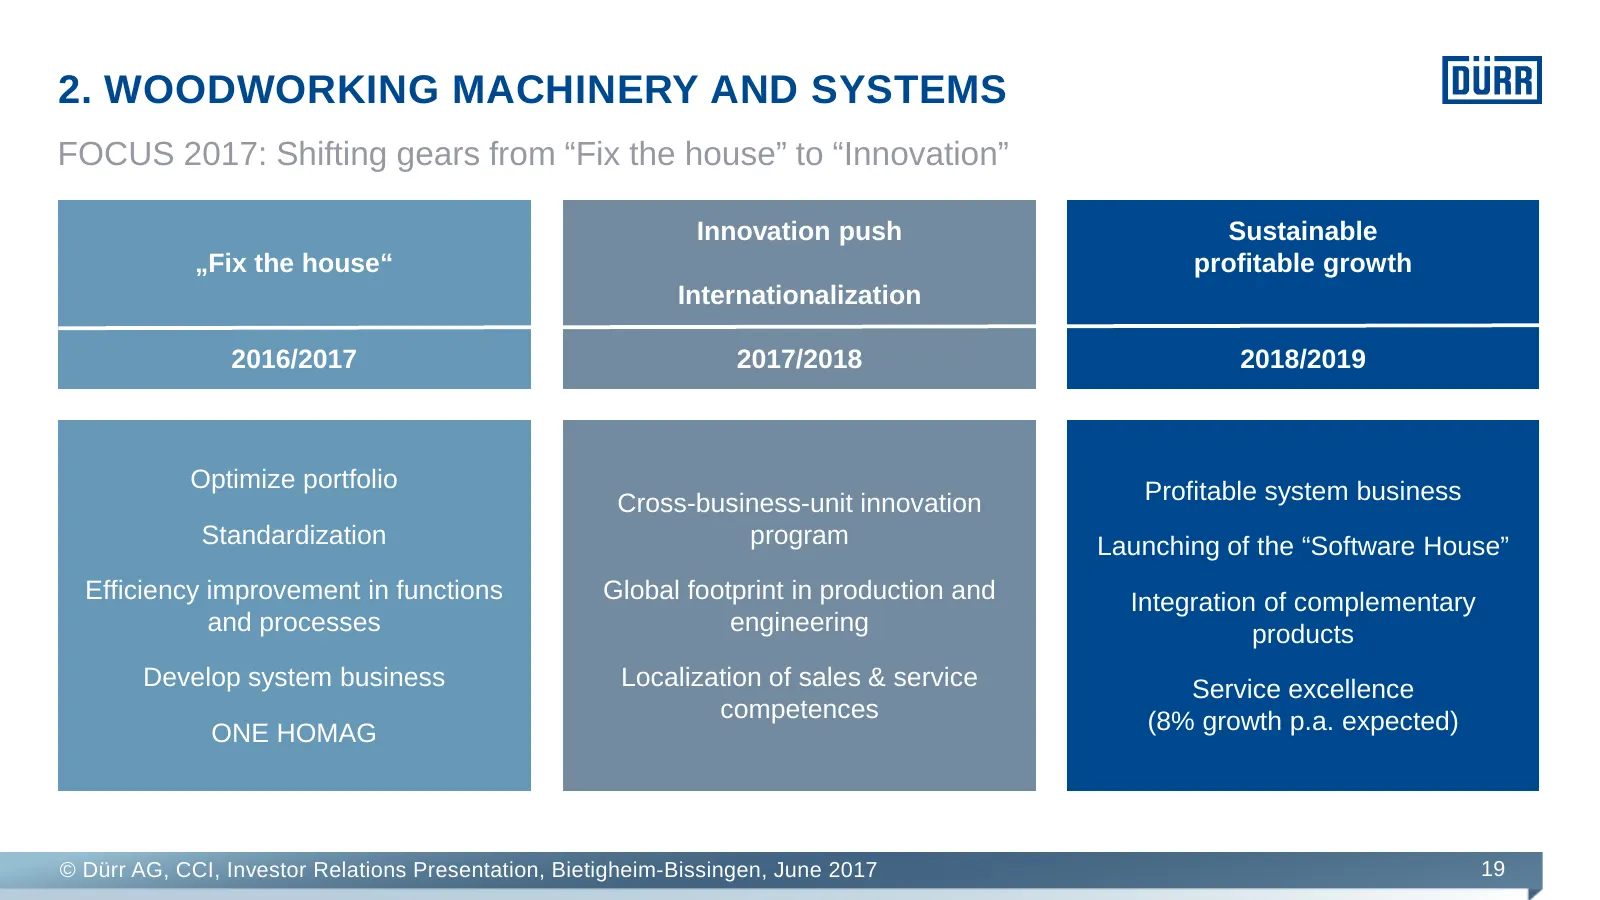
2. WOODWORKING MACHINERY AND SYSTEMS FOCUS 2017: Shifting gears from “Fix the house” to “Innovation” Innovation push Sustainable „Fix the house“ profitable growth Internationalization 2016/2017 2017/2018 2018/2019 Optimize portfolio Profitable system business Cross-business-unit innovation Standardi
Slide 20: Agenda
AGENDA 1. Executive Summary 2. Our five divisions 3. Group strategy 4. Group financials, markets and outlook © Dürr AG, CCI, Investor Relations Presentation, Bietigheim-Bissingen, June 2017 20
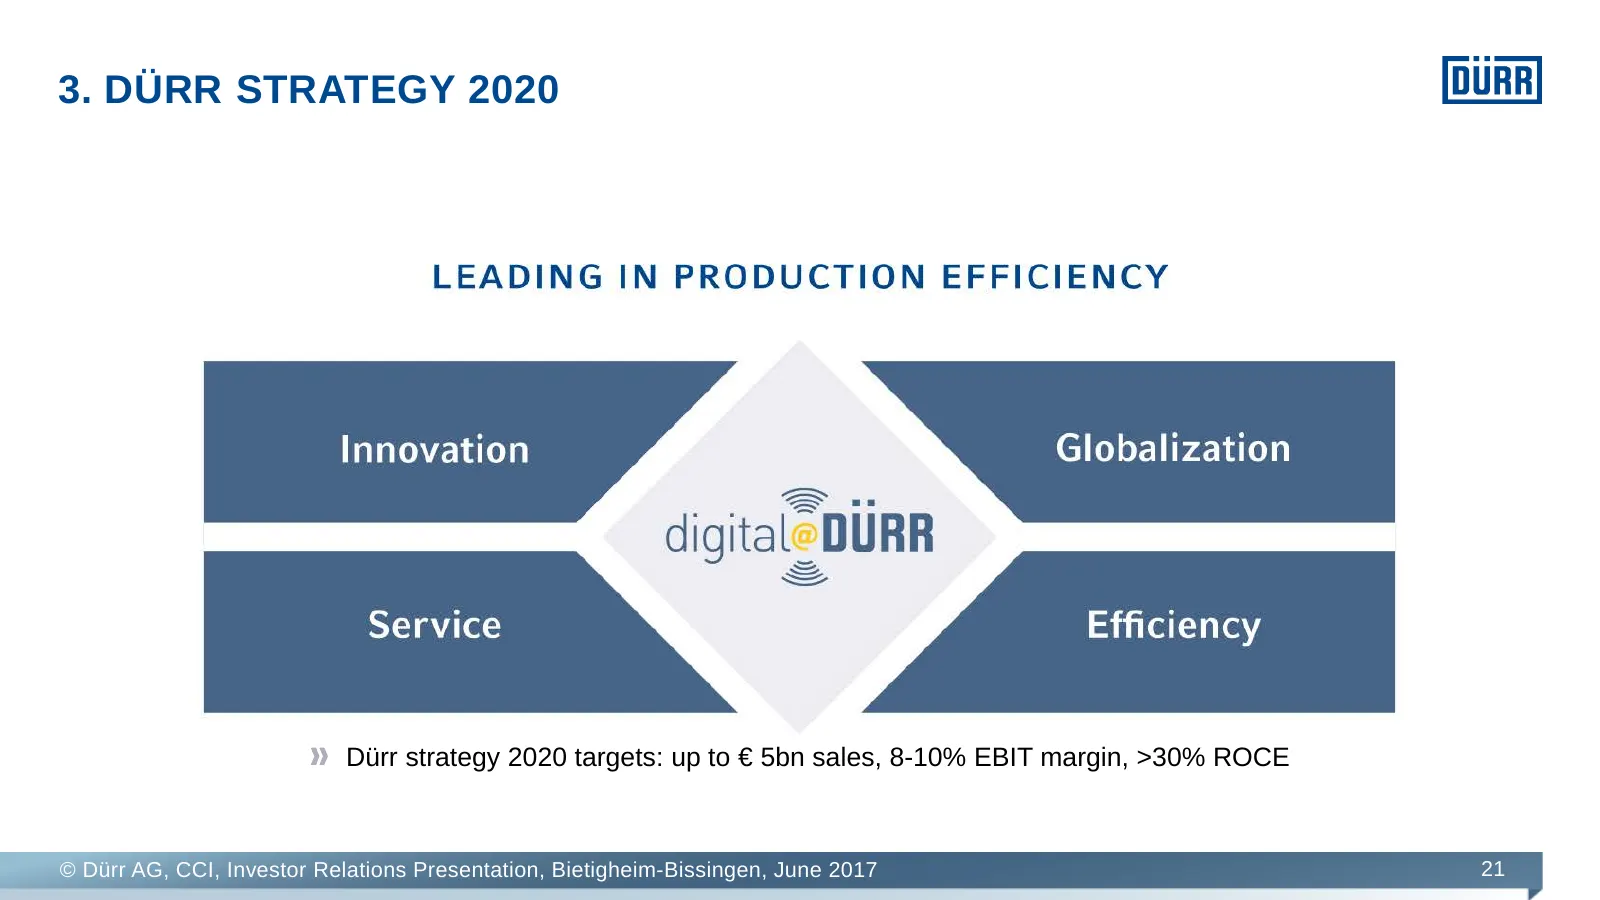
Slide 21: Dürr Strategy 2020
3. DÜRR STRATEGY 2020 Dürr strategy 2020 targets: up to € 5bn sales, 8-10% EBIT margin, >30% ROCE © Dürr AG, CCI, Investor Relations Presentation, Bietigheim-Bissingen, June 2017 21
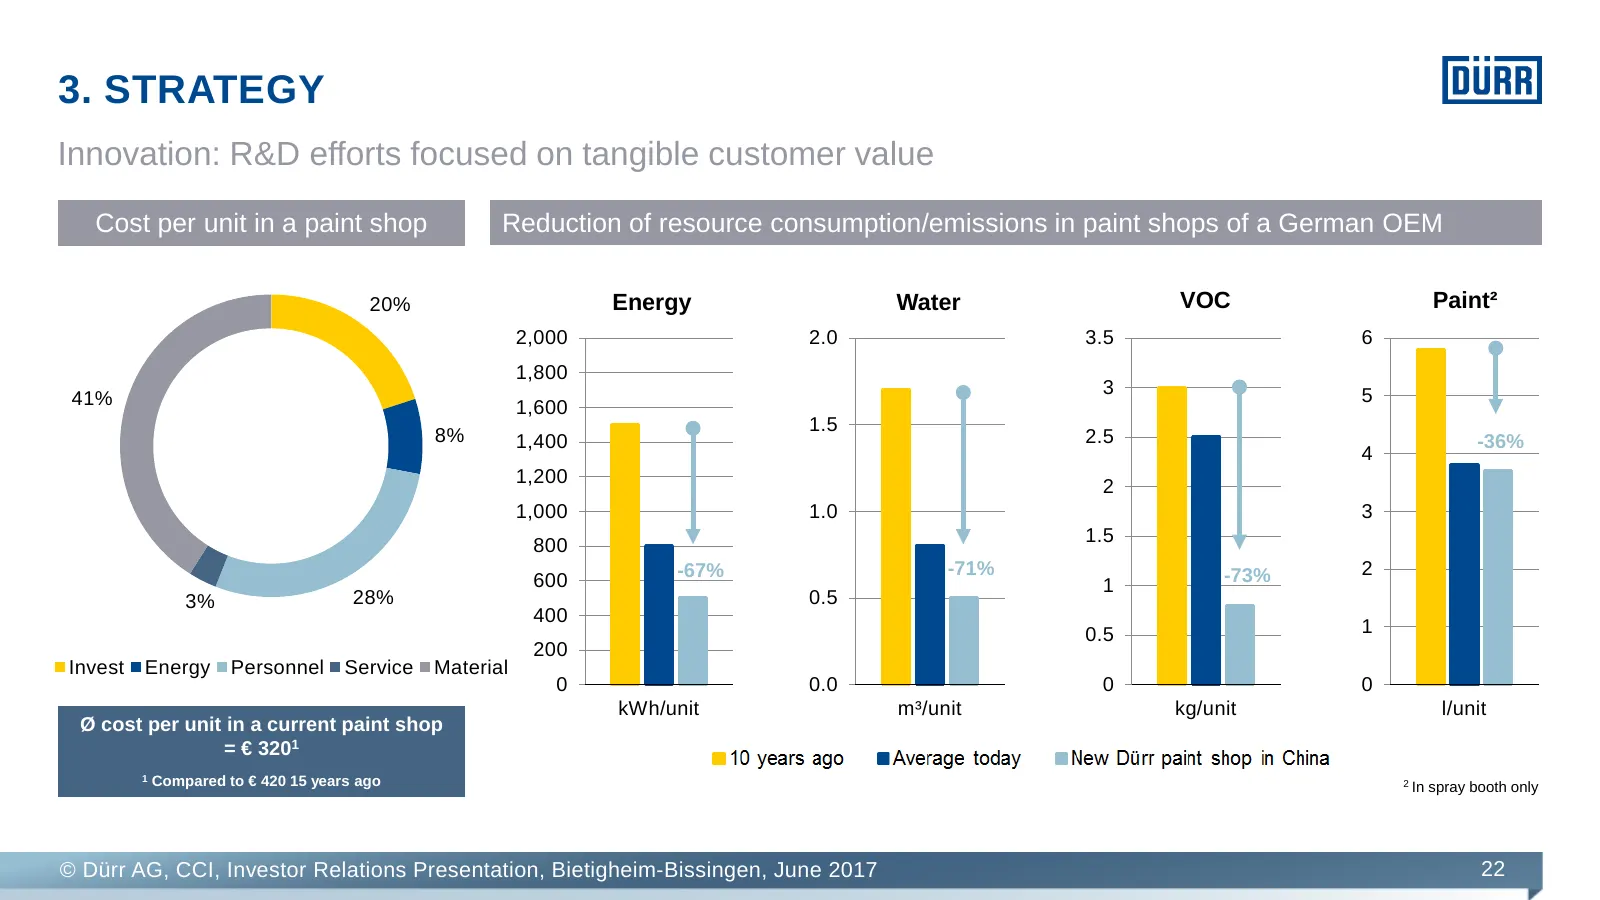
Slide 22: Innovation: R&D focused on customer value
3. STRATEGY Innovation: R&D efforts focused on tangible customer value Cost per unit in a paint shop Reduction of resource consumption/emissions in paint shops of a German OEM 20% Energy Water VOC Paint² 2,000 2.0 3.5 6 1,800 3 5 41% 1,600 1.5 8% 1,400 2.5 -36% 4 1,200 2 1,000 1.0 3 800 1.5 -67% -71
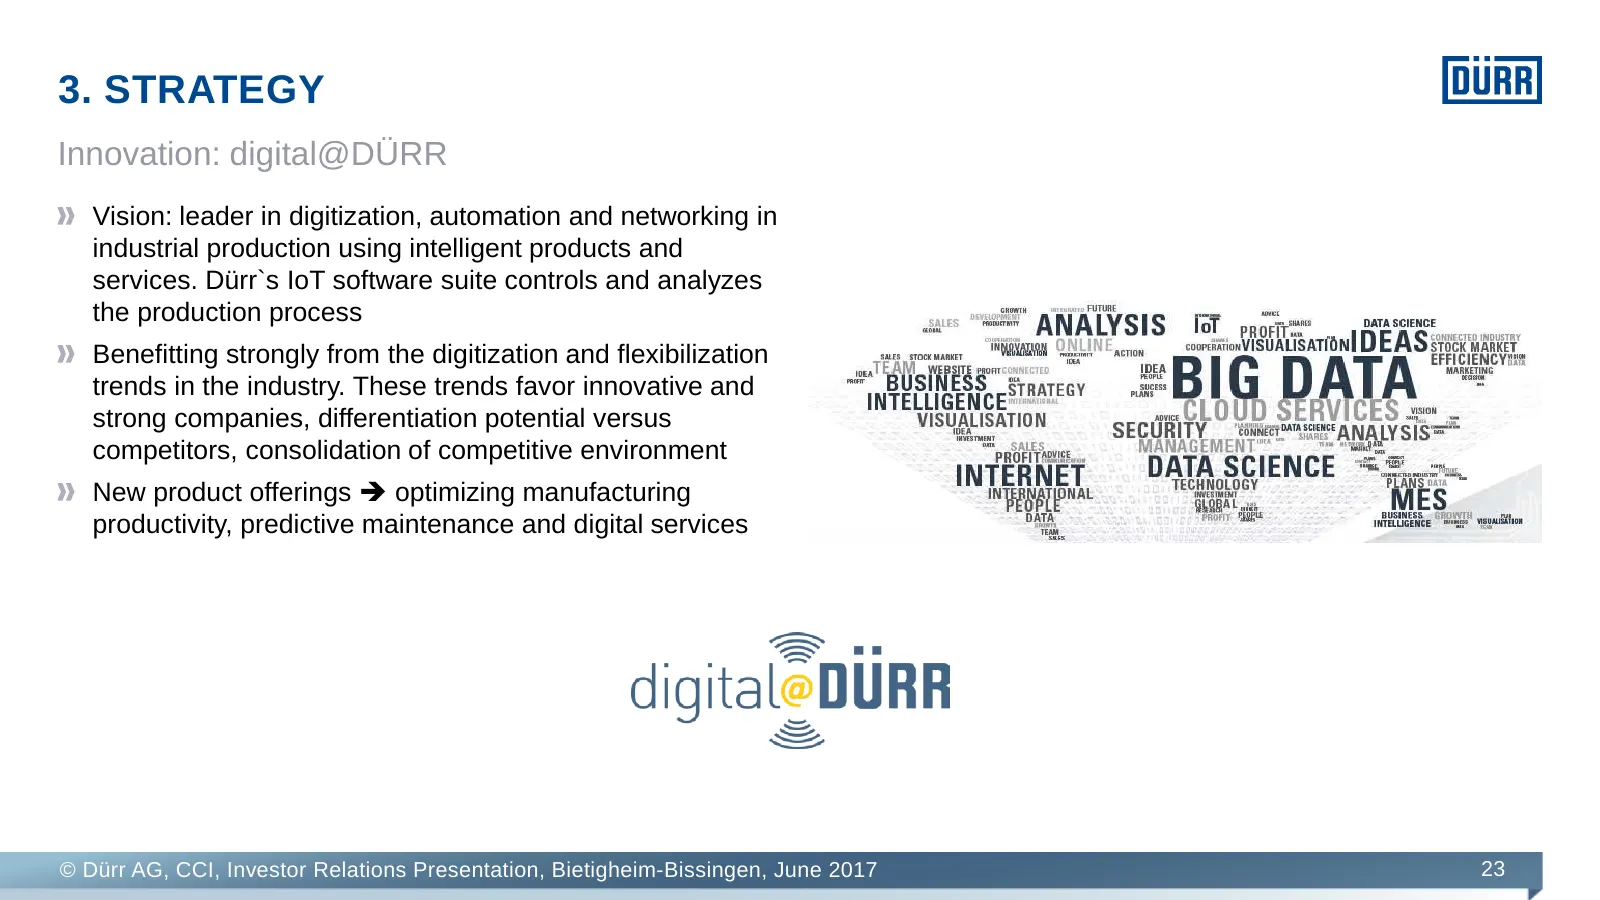
Slide 23: Innovation: digital@DÜRR
3. STRATEGY Innovation: digital@DÜRR Vision: leader in digitization, automation and networking in industrial production using intelligent products and services. Dürr`s IoT software suite controls and analyzes the production process Benefitting strongly from the digitization and flexibilization trend
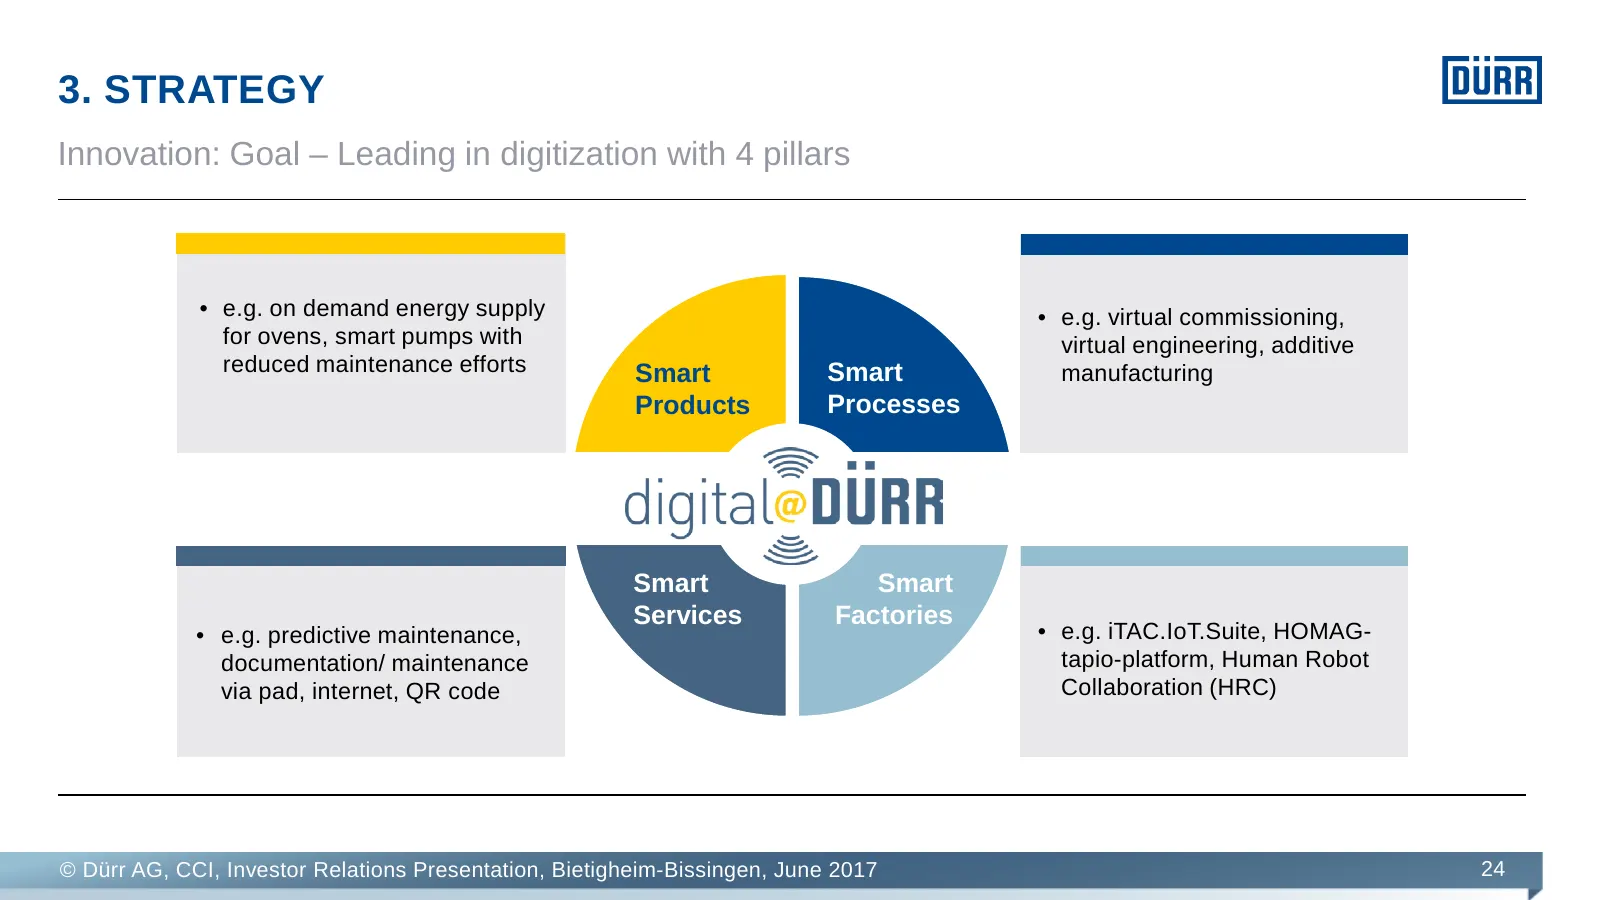
Slide 24: Innovation: leading in digitization with 4 pillars
3. STRATEGY Innovation: Goal – Leading in digitization with 4 pillars • e.g. on demand energy supply • e.g. virtual commissioning, for ovens, smart pumps with virtual engineering, additive reduced maintenance efforts Smart Smart manufacturing Products Processes Smart Smart Services Factories • e.g.
Slide 25: iTAC.IoT.Suite: Industry 4.0 platform
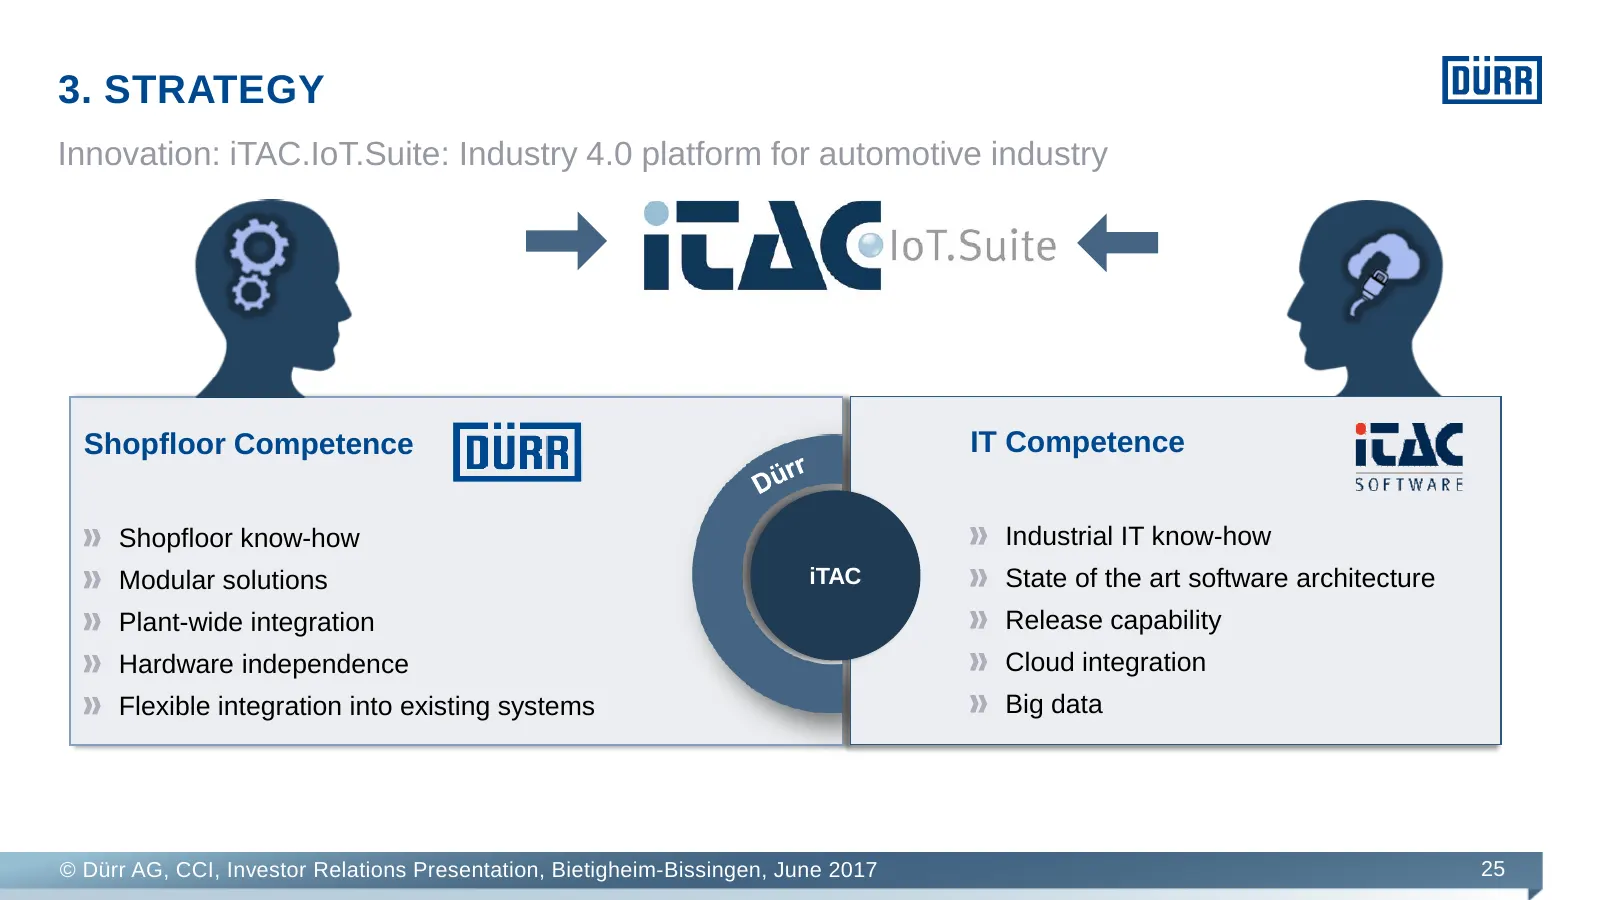
3. STRATEGY Innovation: iTAC.IoT.Suite: Industry 4.0 platform for automotive industry Shopfloor Competence IT Competence Shopfloor know-how Industrial IT know-how Modular solutions iTAC State of the art software architecture Plant-wide integration Release capability Hardware independence Cloud integ
Slide 26: New IoT platform for woodworking industry
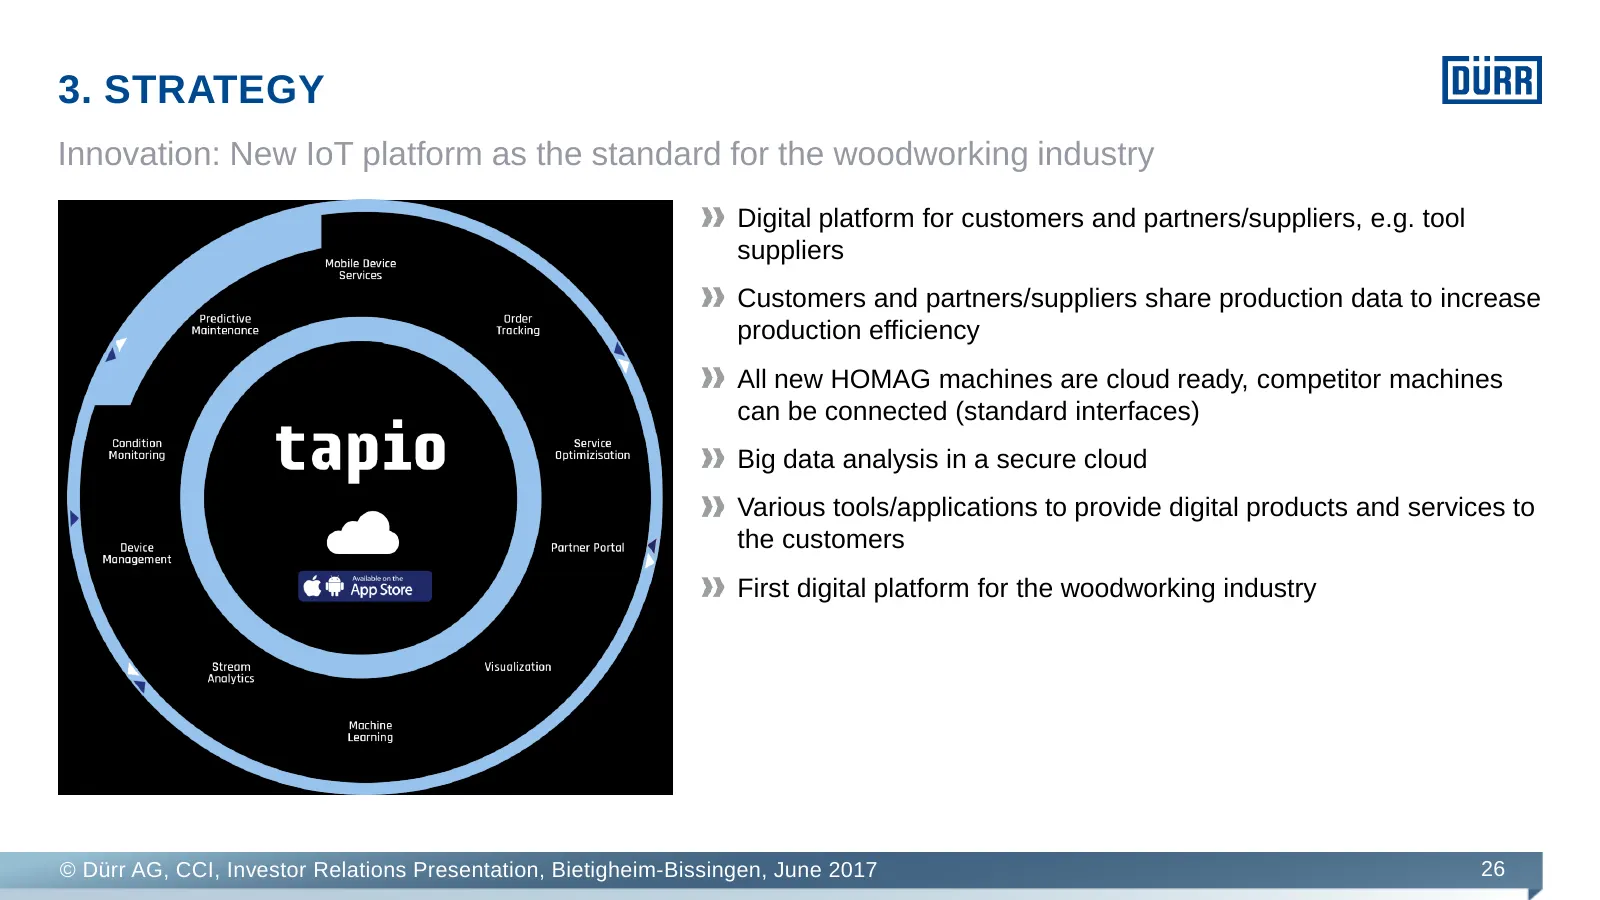
3. STRATEGY Innovation: New IoT platform as the standard for the woodworking industry Digital platform for customers and partners/suppliers, e.g. tool suppliers Customers and partners/suppliers share production data to increase production efficiency All new HOMAG machines are cloud ready, competitor
Slide 27: Globalization: investments in network of locations
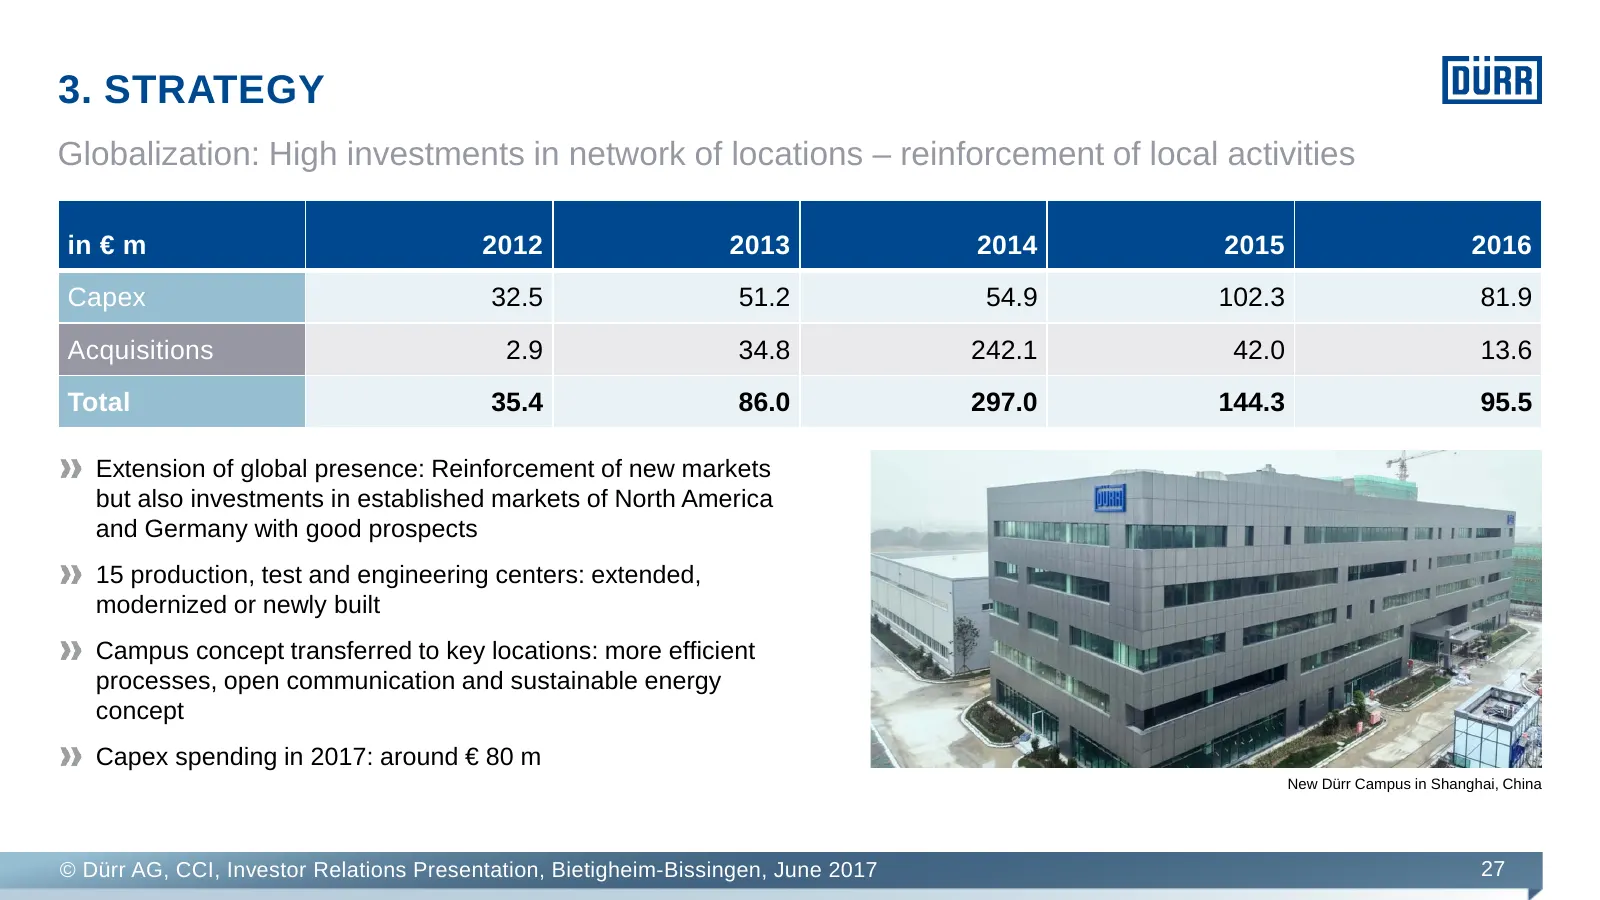
3. STRATEGY Globalization: High investments in network of locations – reinforcement of local activities in € m 2012 2013 2014 2015 2016 Capex 32.5 51.2 54.9 102.3 81.9 Acquisitions 2.9 34.8 242.1 42.0 13.6 Total 35.4 86.0 297.0 144.3 95.5 Extension of global presence: Reinforcement of new markets bu
Slide 28: HOMAG takeover as blueprint for acquisitions
3. STRATEGY HOMAG takeover as a blueprint for larger acquisitions Criteria for major acquisitions: Target areas: mechanical and plant engineering, automation technology, measuring systems, environmental World market leadership, innovation leadership Market niches without major players & no major Chi
Slide 29: Service: long-term target 30% of sales
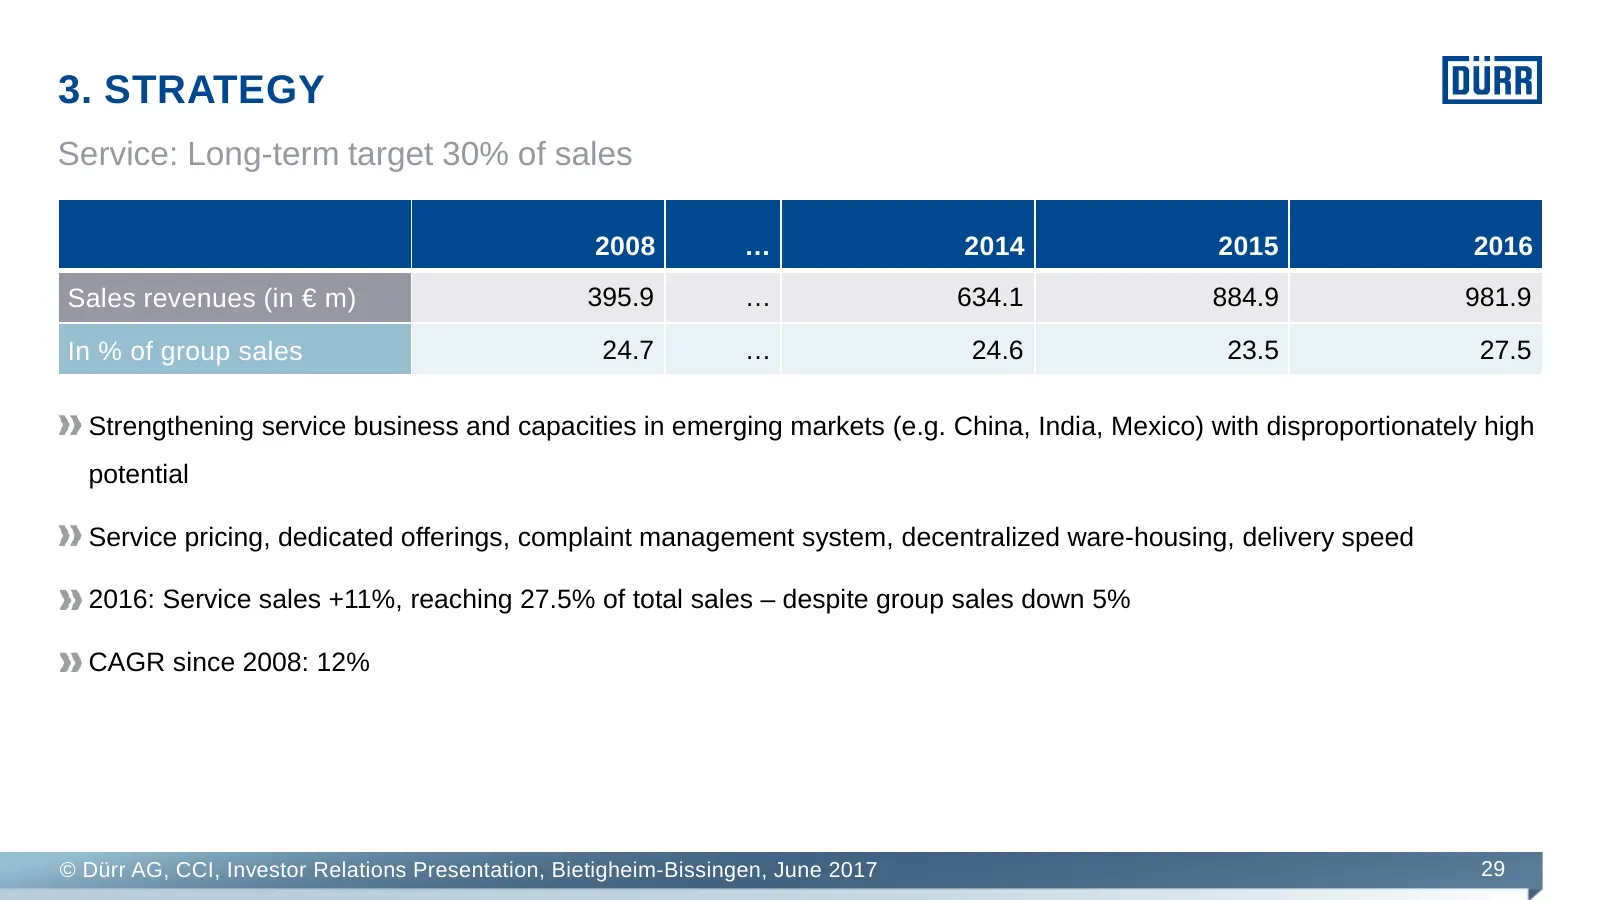
3. STRATEGY Service: Long-term target 30% of sales 2008 … 2014 2015 2016 Sales revenues (in € m) 395.9 … 634.1 884.9 981.9 In % of group sales 24.7 … 24.6 23.5 27.5 Strengthening service business and capacities in emerging markets (e.g. China, India, Mexico) with disproportionately high potential Se
Slide 30: Service
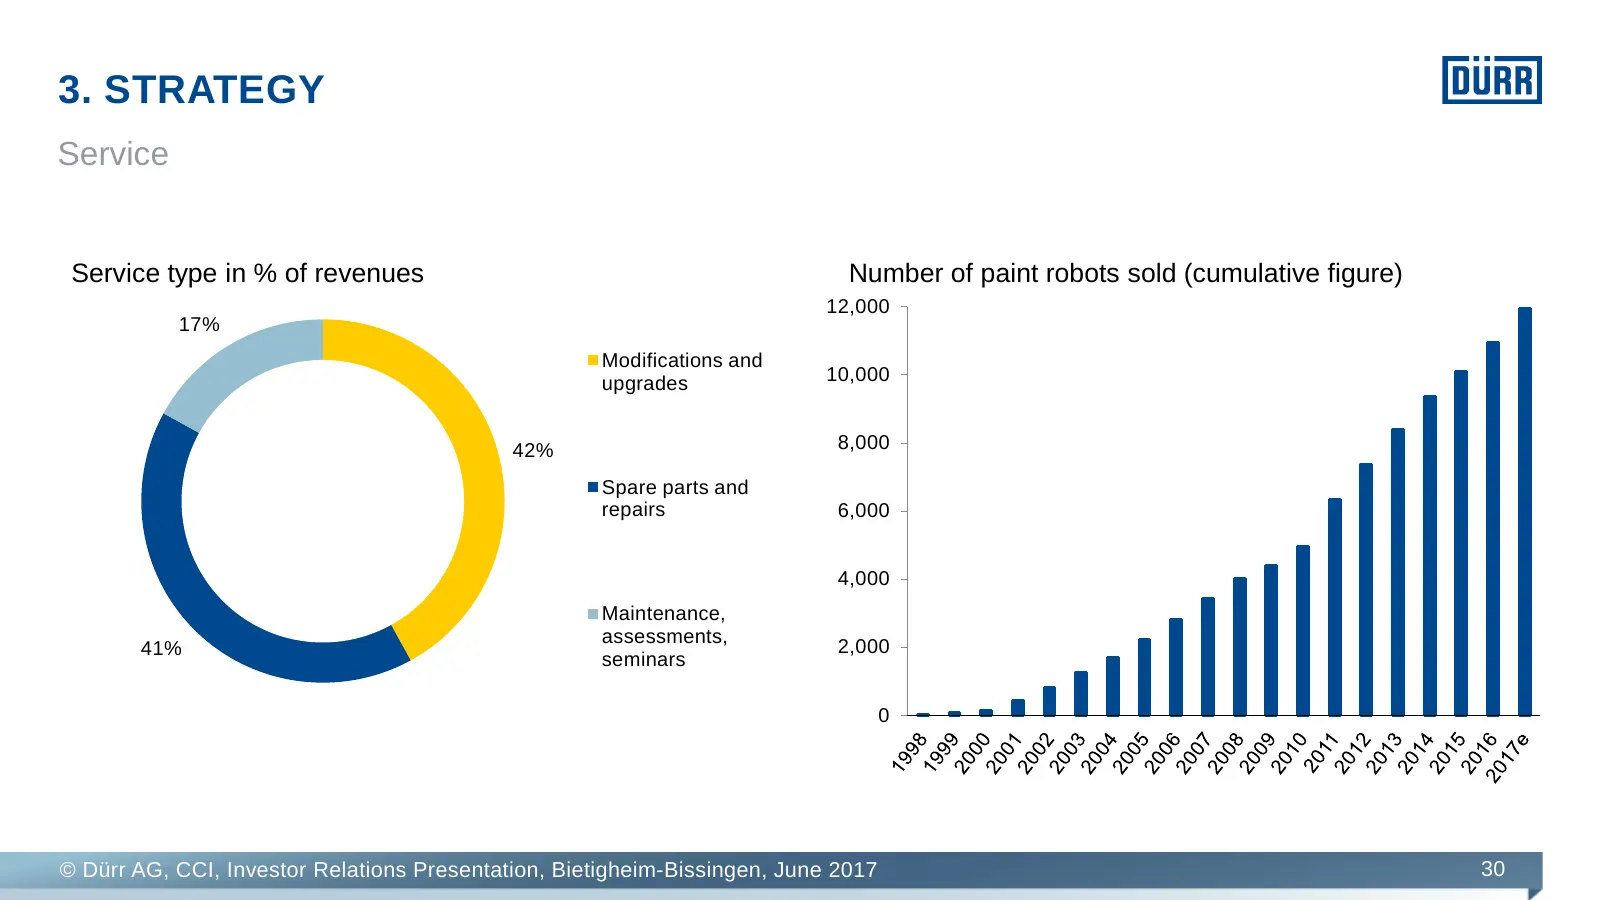
3. STRATEGY Service Service type in % of revenues Number of paint robots sold (cumulative figure) 12,000 17% Modifications and upgrades 10,000 42% 8,000 Spare parts and repairs 6,000 4,000 Maintenance, assessments, 41% 2,000 seminars 0 © Dürr AG, CCI, Investor Relations Presentation, Bietigheim-Biss
Slide 31: Efficiency: global processes, localization, portfolio optimization
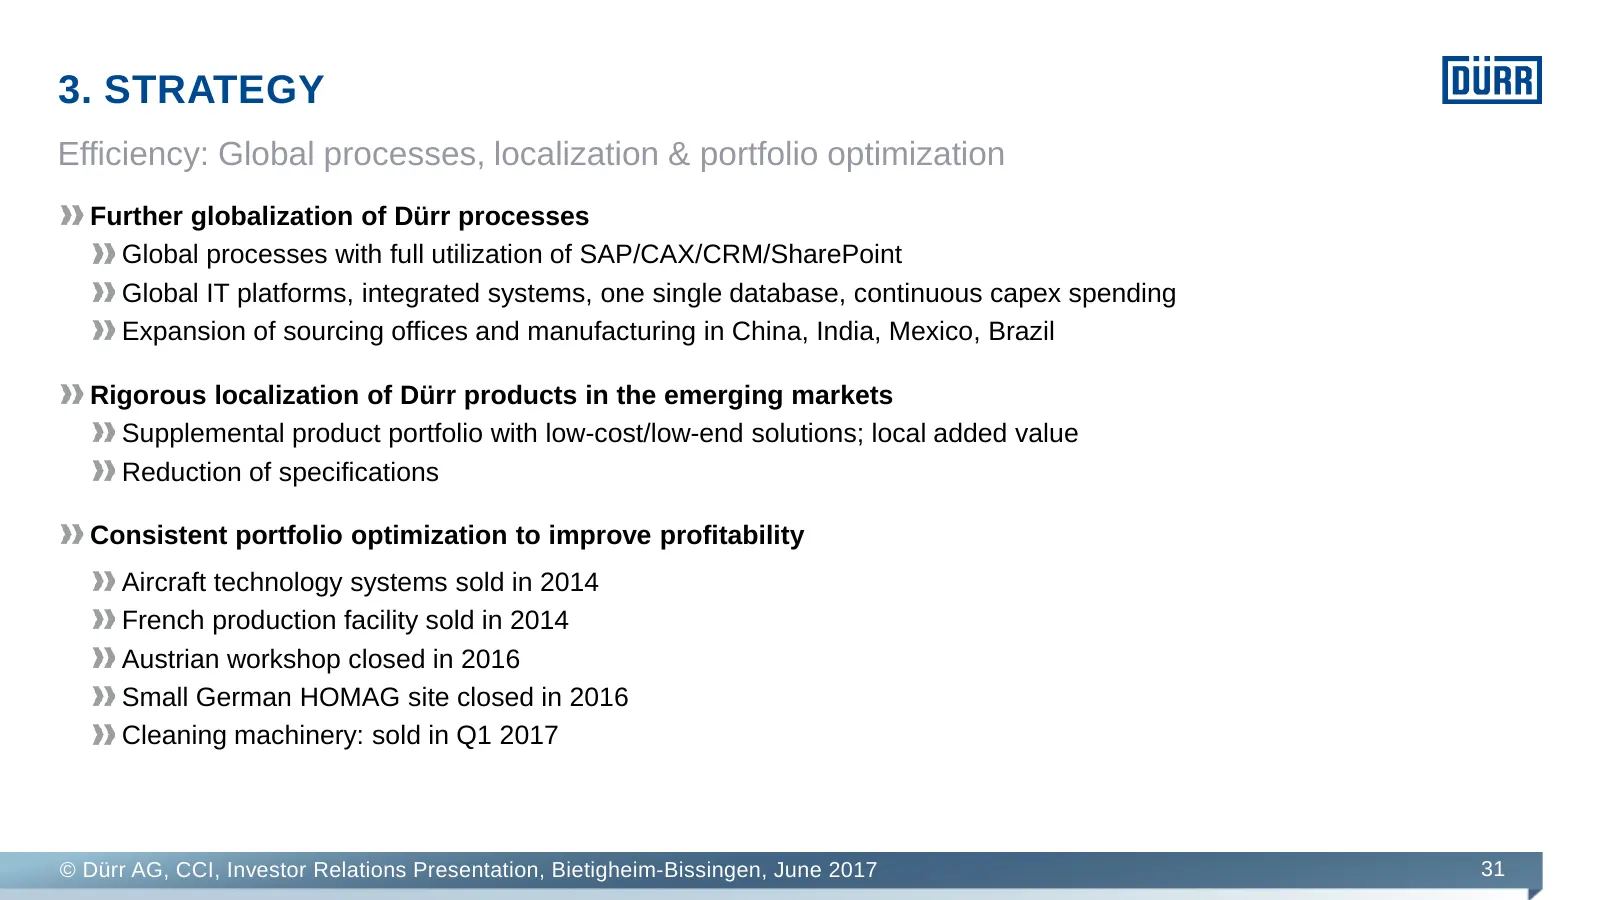
3. STRATEGY Efficiency: Global processes, localization & portfolio optimization Further globalization of Dürr processes Global processes with full utilization of SAP/CAX/CRM/SharePoint Global IT platforms, integrated systems, one single database, continuous capex spending Expansion of sourcing offic
Slide 32: Agenda
AGENDA 1. Executive Summary 2. Our five divisions 3. Group strategy 4. Group financials, markets and outlook © Dürr AG, CCI, Investor Relations Presentation, Bietigheim-Bissingen, June 2017 32
Slide 33: Earnings on the rise
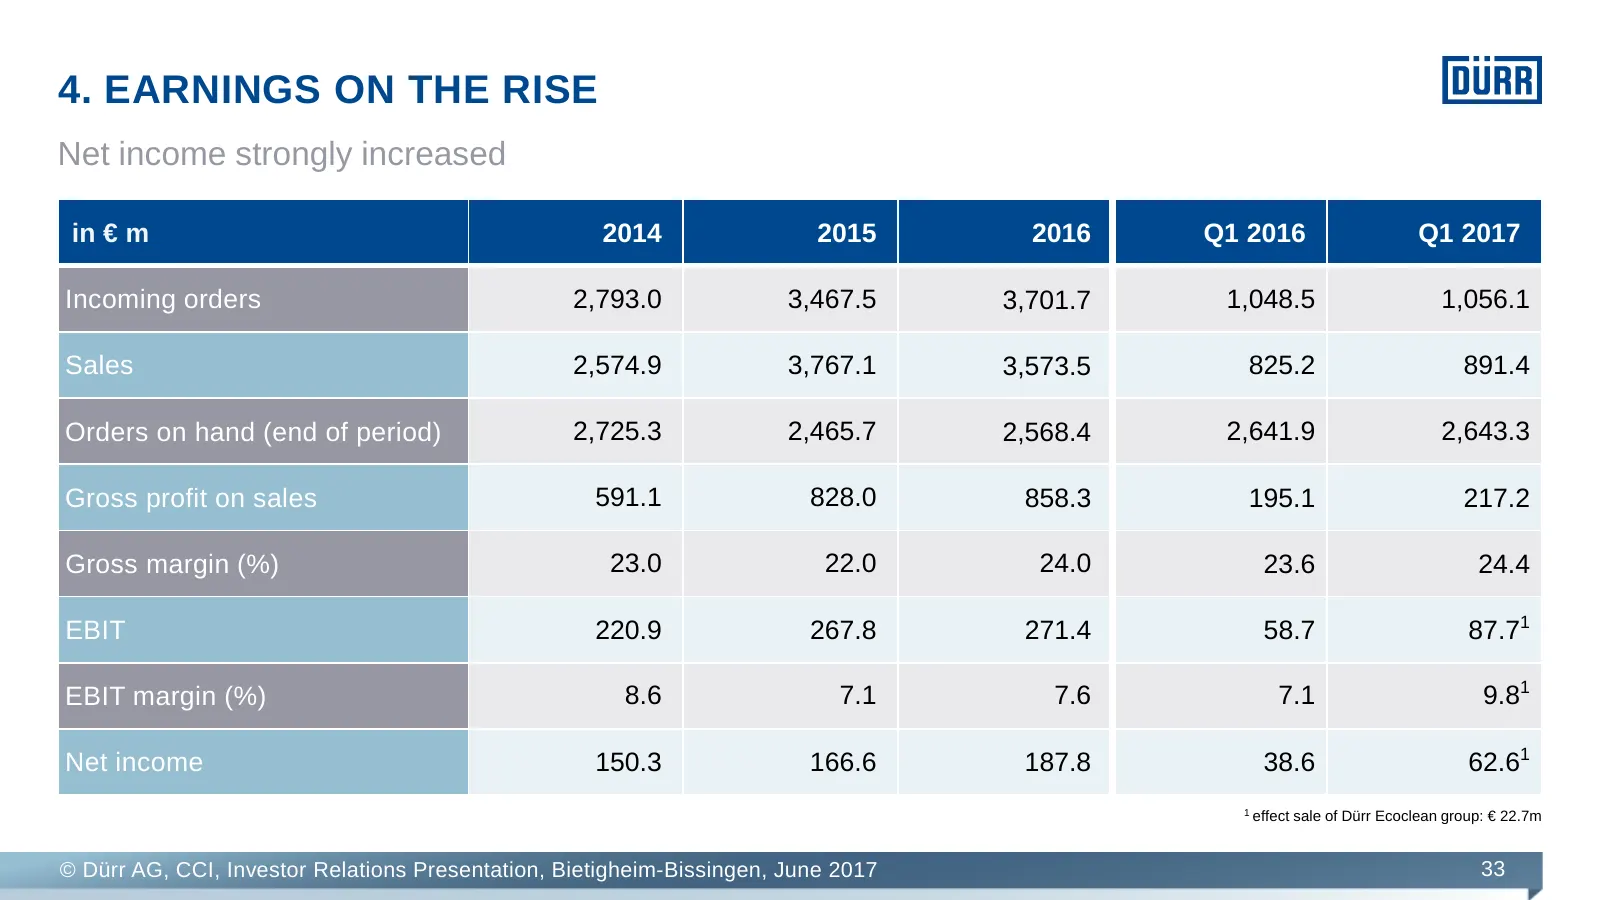
4. EARNINGS ON THE RISE Net income strongly increased in € m 2014 2015 2016 Q1 2016 Q1 2017 Incoming orders 2,793.0 3,467.5 3,701.7 1,048.5 1,056.1 Sales 2,574.9 3,767.1 3,573.5 825.2 891.4 Orders on hand (end of period) 2,725.3 2,465.7 2,568.4 2,641.9 2,643.3 Gross profit on sales 591.1 828.0 858.3
Slide 34: Strong cash flow to be expected
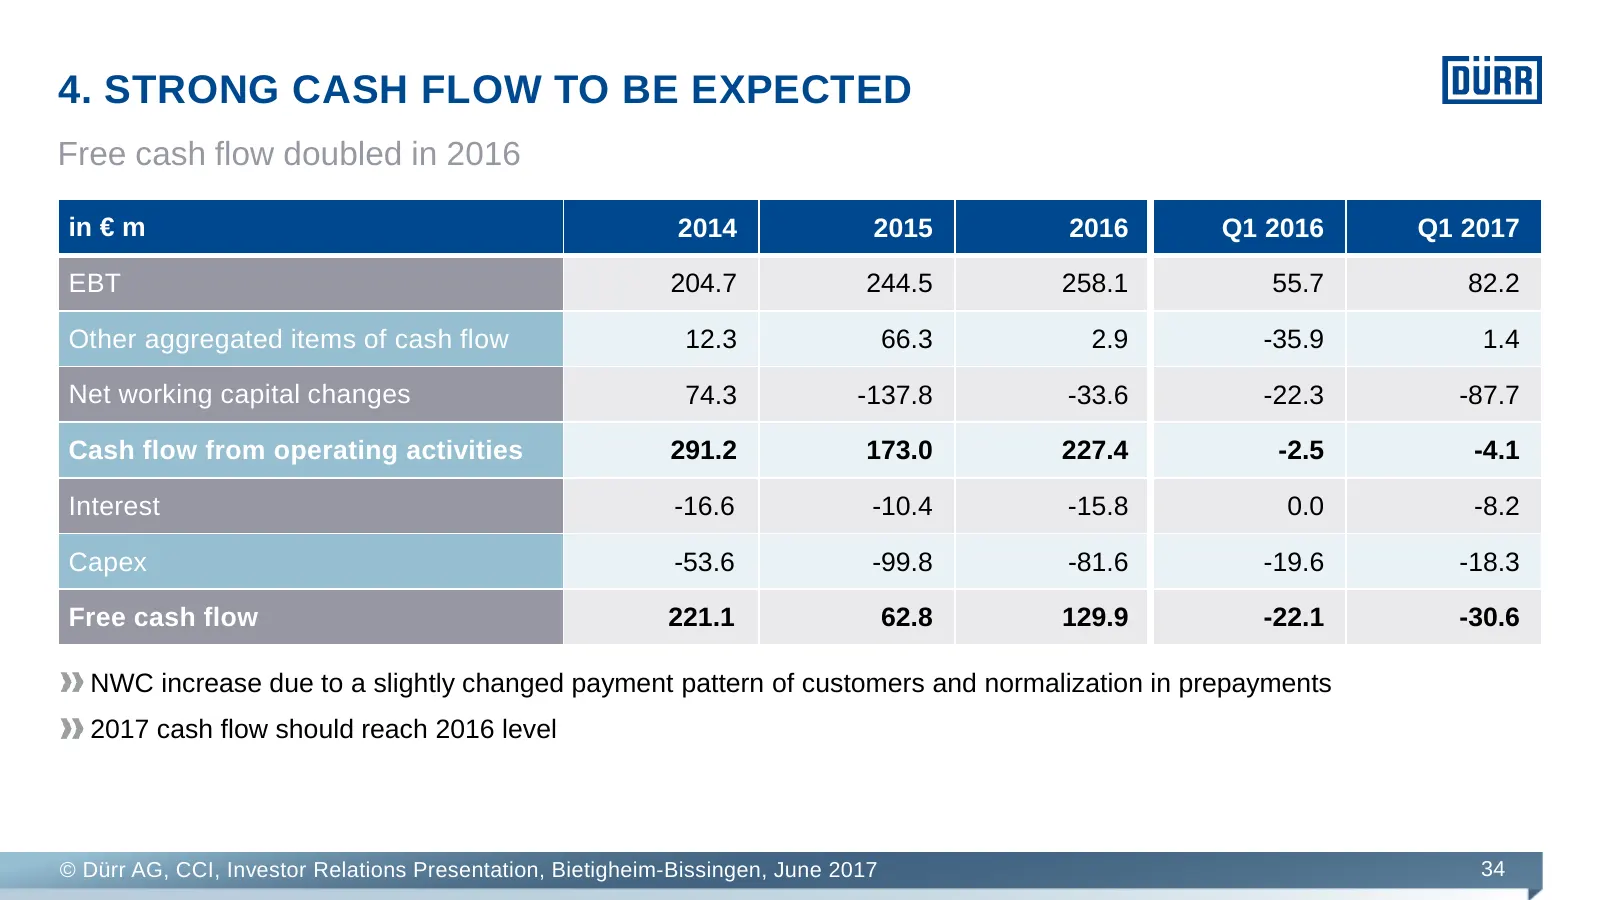
4. STRONG CASH FLOW TO BE EXPECTED Free cash flow doubled in 2016 in € m 2014 2015 2016 Q1 2016 Q1 2017 EBT 204.7 244.5 258.1 55.7 82.2 Other aggregated items of cash flow 12.3 66.3 2.9 -35.9 1.4 Net working capital changes 74.3 -137.8 -33.6 -22.3 -87.7 Cash flow from operating activities 291.2 173.
Slide 35: Solid financial ratios
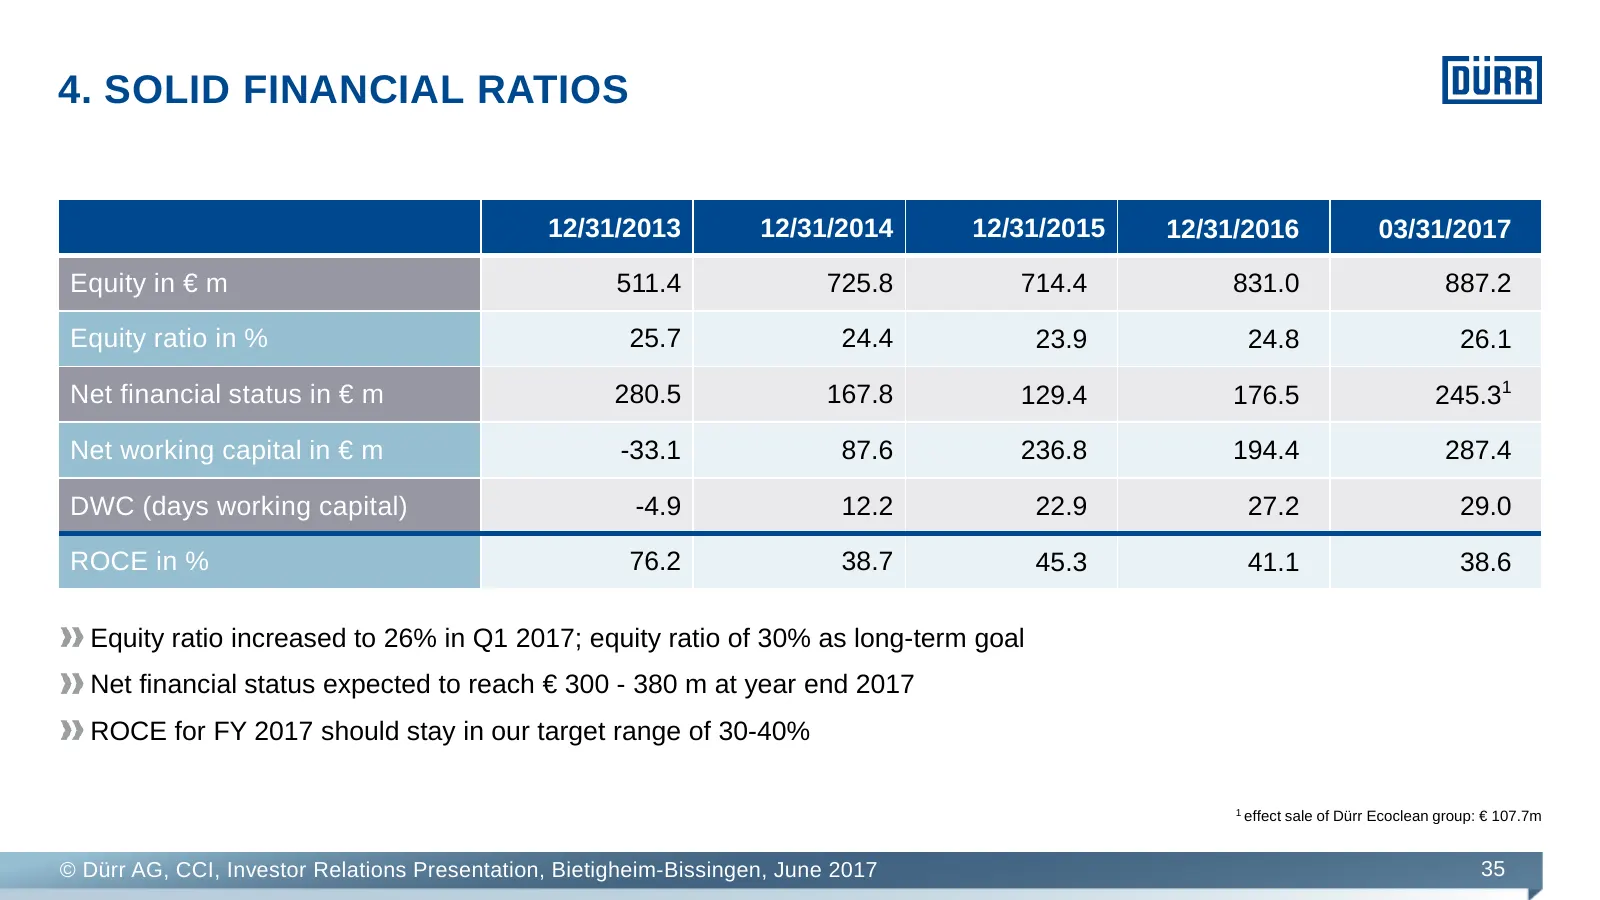
4. SOLID FINANCIAL RATIOS 12/31/2013 12/31/2014 12/31/2015 12/31/2016 03/31/2017 Equity in € m 511.4 725.8 714.4 831.0 887.2 Equity ratio in % 25.7 24.4 23.9 24.8 26.1 Net financial status in € m 280.5 167.8 129.4 176.5 245.31 Net working capital in € m -33.1 87.6 236.8 194.4 287.4 DWC (days working
Slide 36: Further growth in the car market
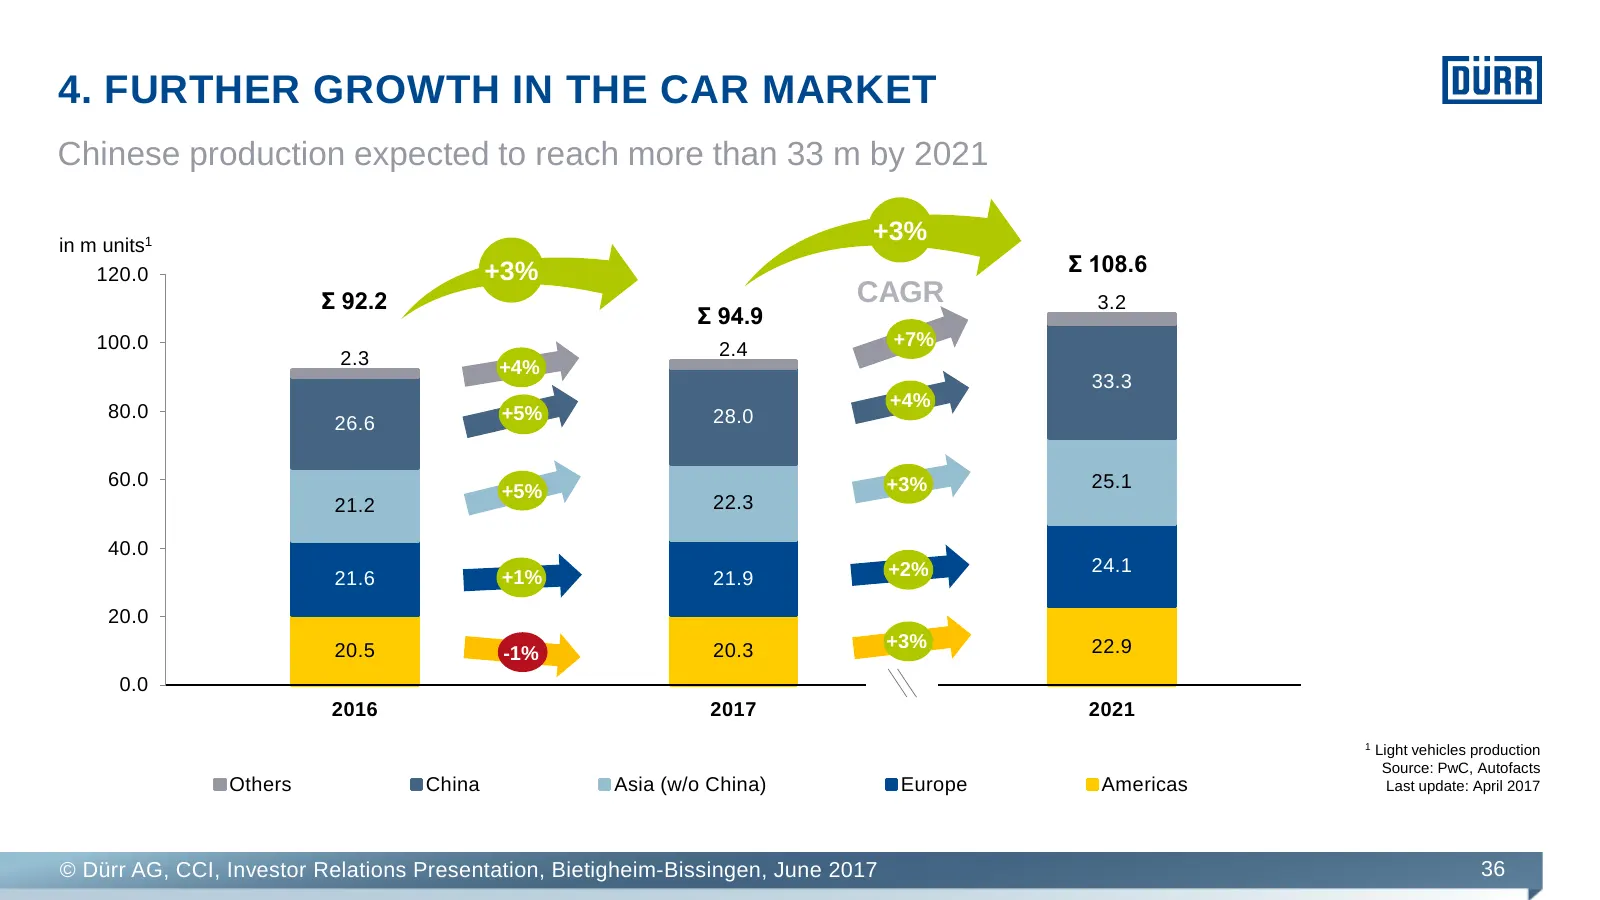
4. FURTHER GROWTH IN THE CAR MARKET Chinese production expected to reach more than 33 m by 2021 in m units1 +3% 120.0 +3% Ʃ 108.6 Ʃ 92.2 CAGR 3.2 Ʃ 94.9 100.0 +7% 2.3 2.4 +4% 33.3 +4% 80.0 +5% 28.0 26.6 60.0 +3% 25.1 +5% 21.2 22.3 40.0 +2% 24.1 21.6 +1% 21.9 20.0 20.5 20.3 +3% 22.9 -1% 0.0 2016 2017
Slide 37: Traditional OEMs with high investments in 2017 and 2018
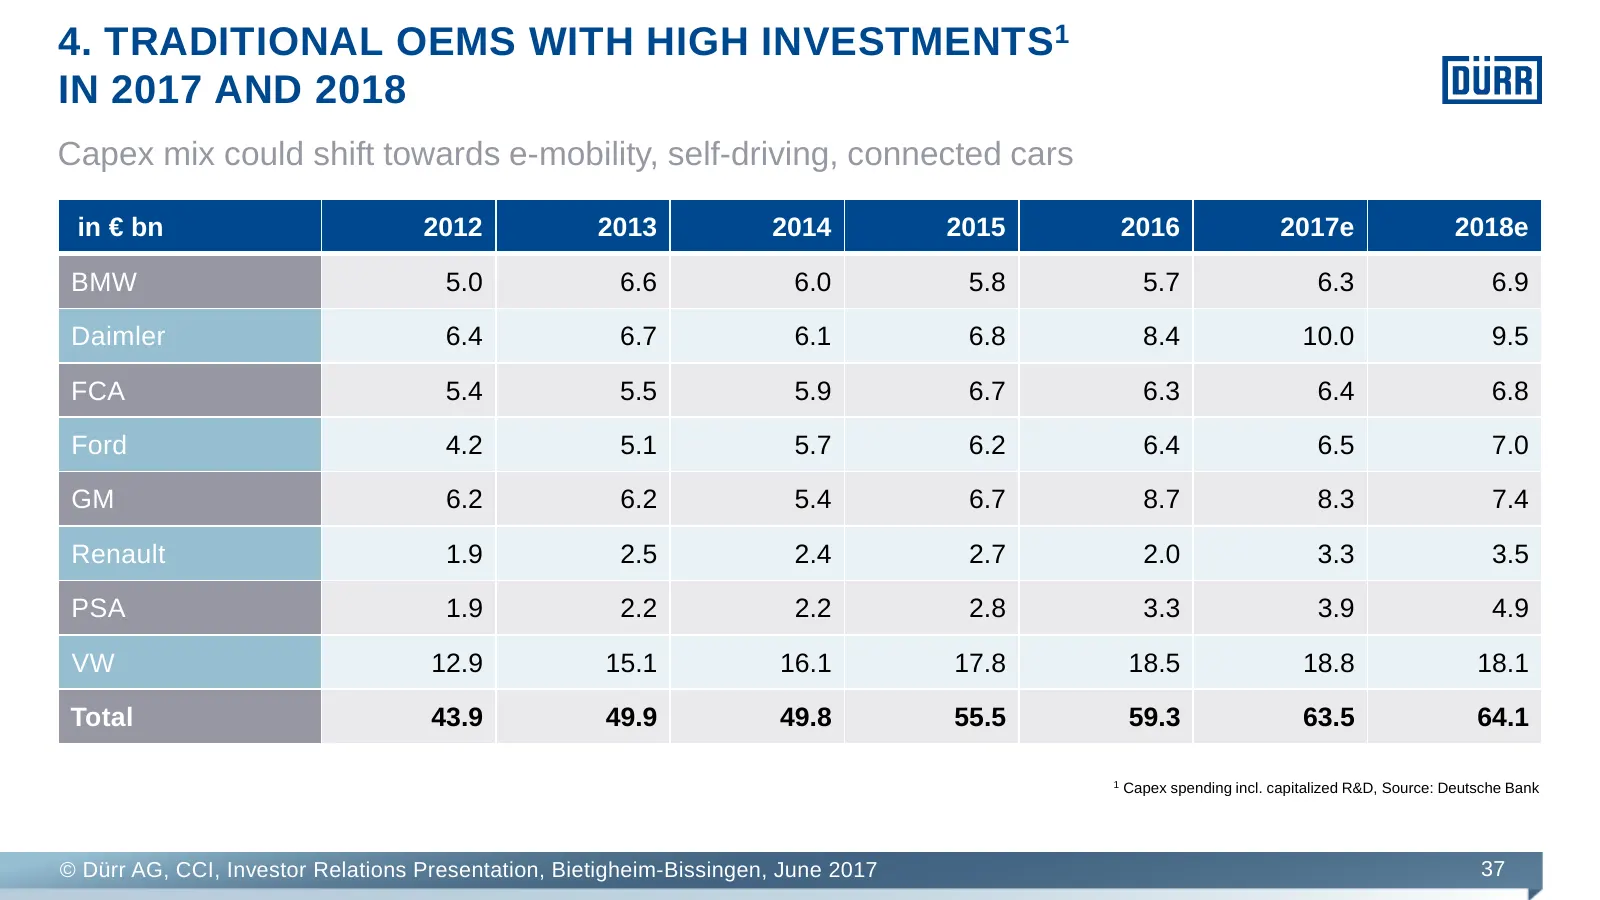
4. TRADITIONAL OEMS WITH HIGH INVESTMENTS1 IN 2017 AND 2018 Capex mix could shift towards e-mobility, self-driving, connected cars in € bn 2012 2013 2014 2015 2016 2017e 2018e BMW 5.0 6.6 6.0 5.8 5.7 6.3 6.9 Daimler 6.4 6.7 6.1 6.8 8.4 10.0 9.5 FCA 5.4 5.5 5.9 6.7 6.3 6.4 6.8 Ford 4.2 5.1 5.7 6.2 6.
Slide 38: Woodworking machinery markets
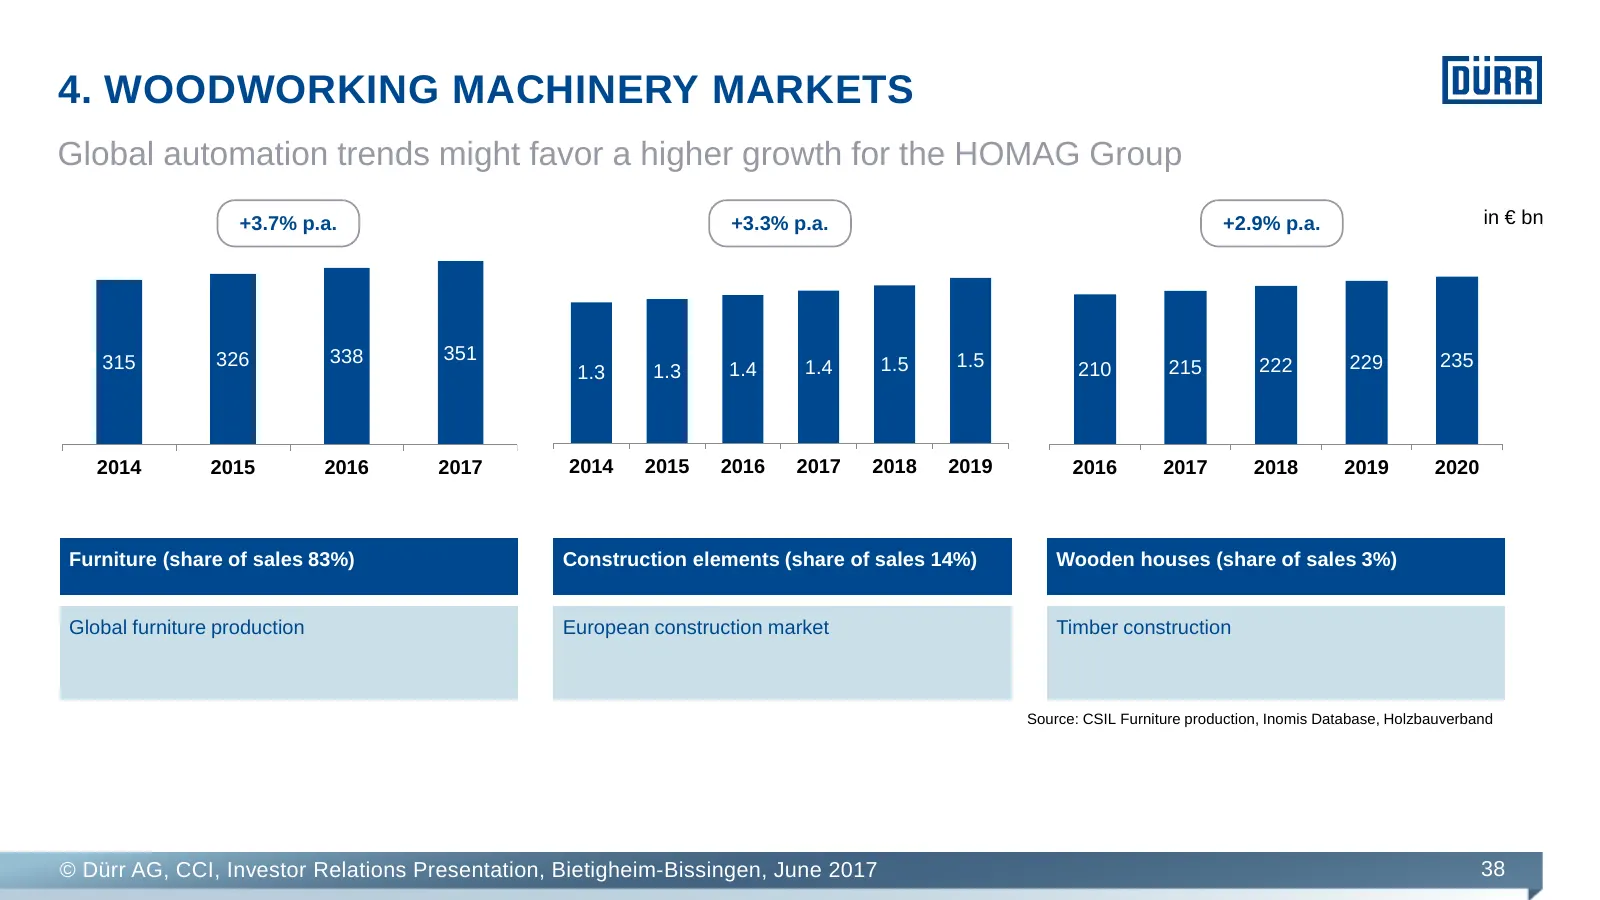
4. WOODWORKING MACHINERY MARKETS Global automation trends might favor a higher growth for the HOMAG Group +3.7% p.a. +3.3% p.a. +2.9% p.a. in € bn 315 326 338 351 1.5 229 235 1.3 1.3 1.4 1.4 1.5 210 215 222 2014 2015 2016 2017 2014 2015 2016 2017 2018 2019 2016 2017 2018 2019 2020 Furniture (share o
Slide 39: Dürr Group Outlook 2017
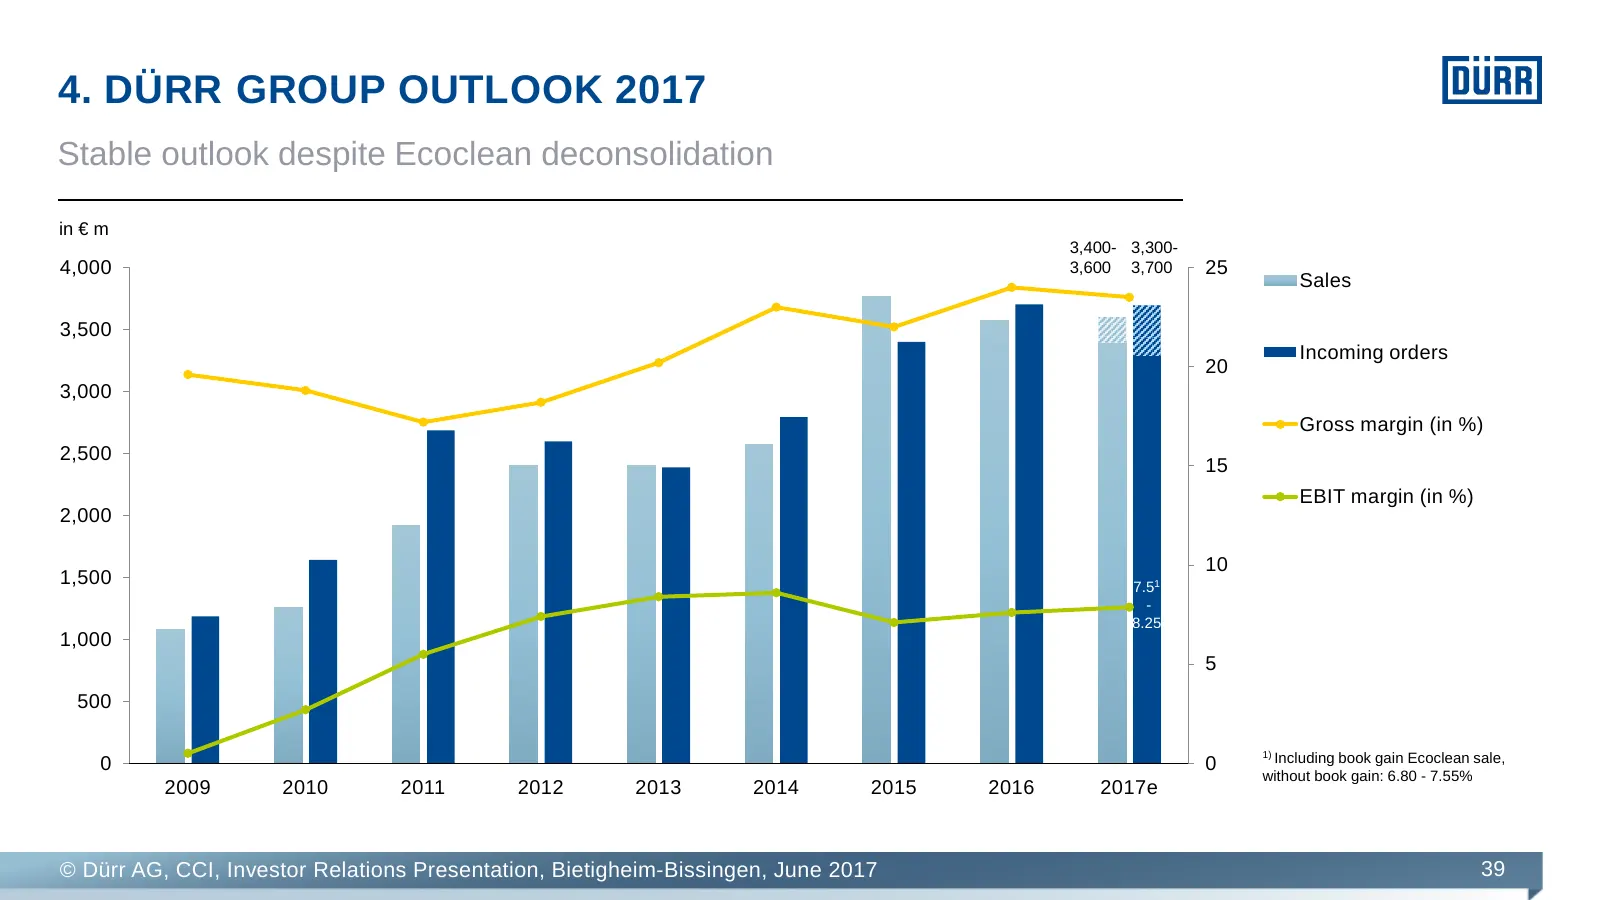
4. DÜRR GROUP OUTLOOK 2017 Stable outlook despite Ecoclean deconsolidation in € m 3,400- 3,300- 4,000 3,600 3,700 25 Sales 3,500 Incoming orders 20 3,000 Gross margin (in %) 2,500 15 EBIT margin (in %) 2,000 10 1,500 7.51 - 8.25 1,000 5 500 1) Including book gain Ecoclean sale, 0 0 without book gain
Slide 40: Financial calendar
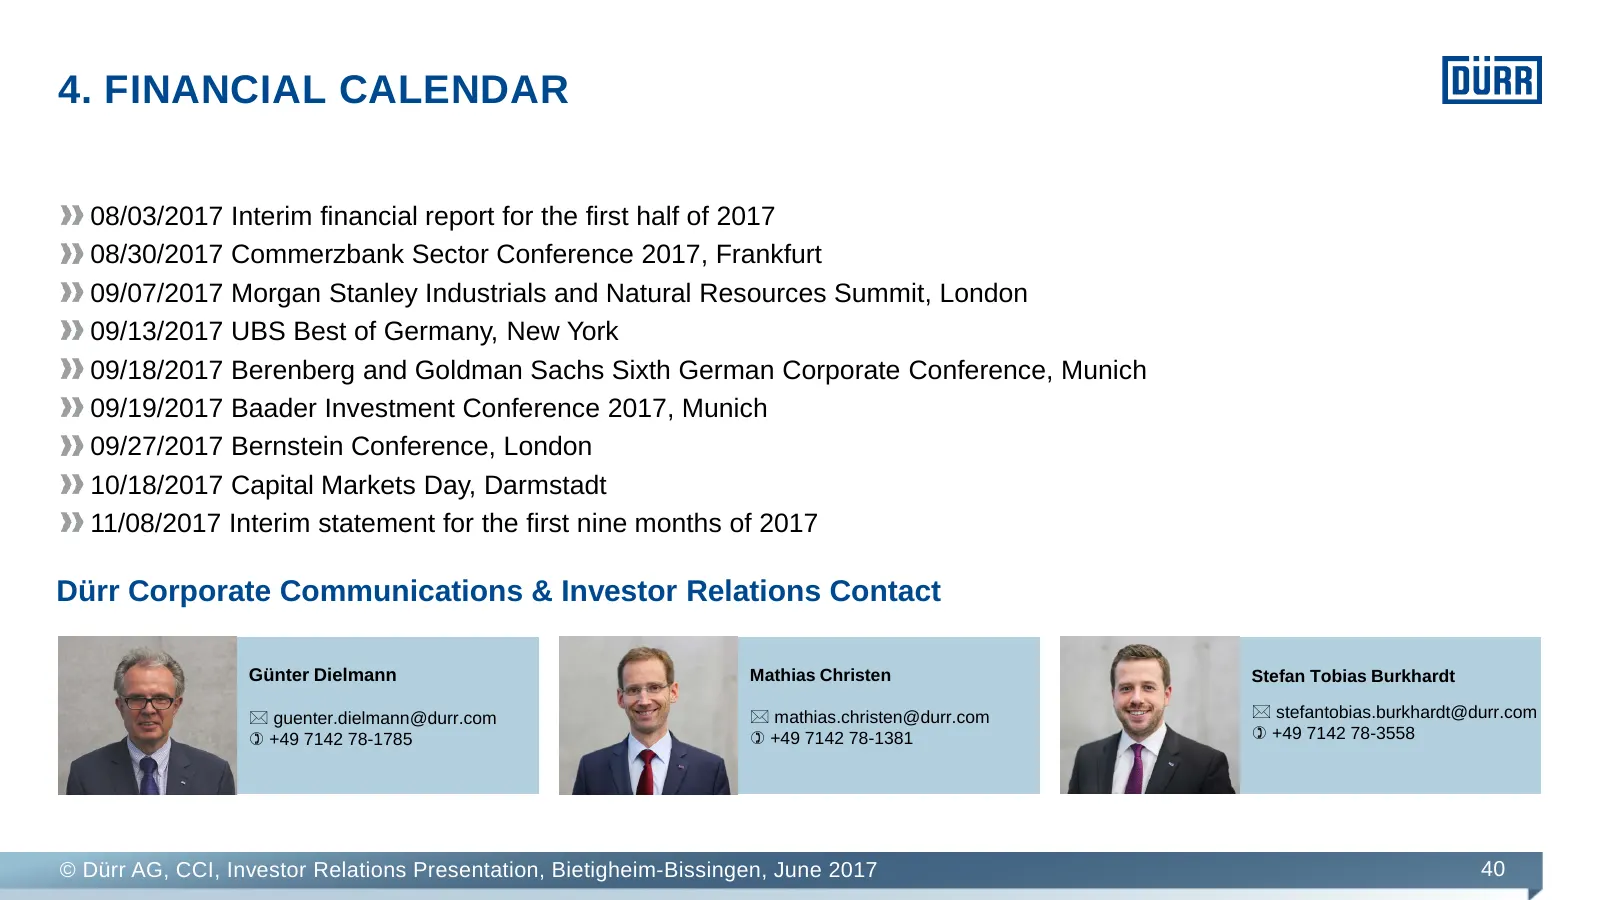
4. FINANCIAL CALENDAR 08/03/2017 Interim financial report for the first half of 2017 08/30/2017 Commerzbank Sector Conference 2017, Frankfurt 09/07/2017 Morgan Stanley Industrials and Natural Resources Summit, London 09/13/2017 UBS Best of Germany, New York 09/18/2017 Berenberg and Goldman Sachs Six
Slide 41: Appendix
Appendix © Dürr AG, CCI, Investor Relations Presentation, Bietigheim-Bissingen, June 2017 41
Slide 42: New Management Board Structure
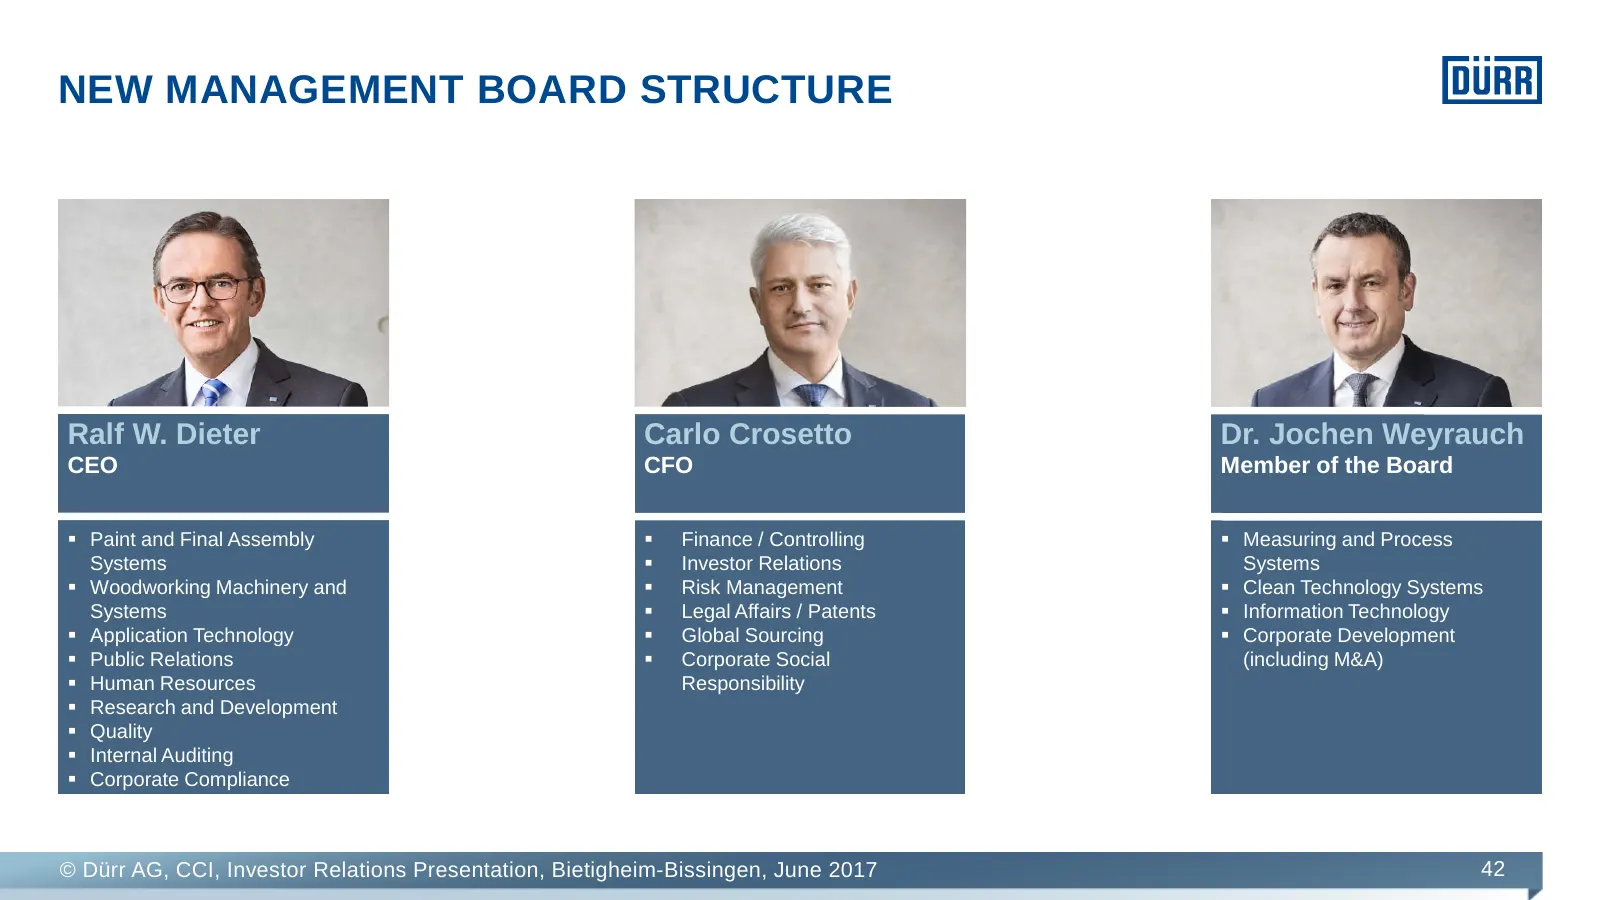
NEW MANAGEMENT BOARD STRUCTURE Ralf W. Dieter Carlo Crosetto Dr. Jochen Weyrauch CEO CFO Member of the Board Paint and Final Assembly Finance / Controlling Measuring and Process Systems Investor Relations Systems Woodworking Machinery and Risk Management Clean Technology Systems System
Slide 43: Key data of the share
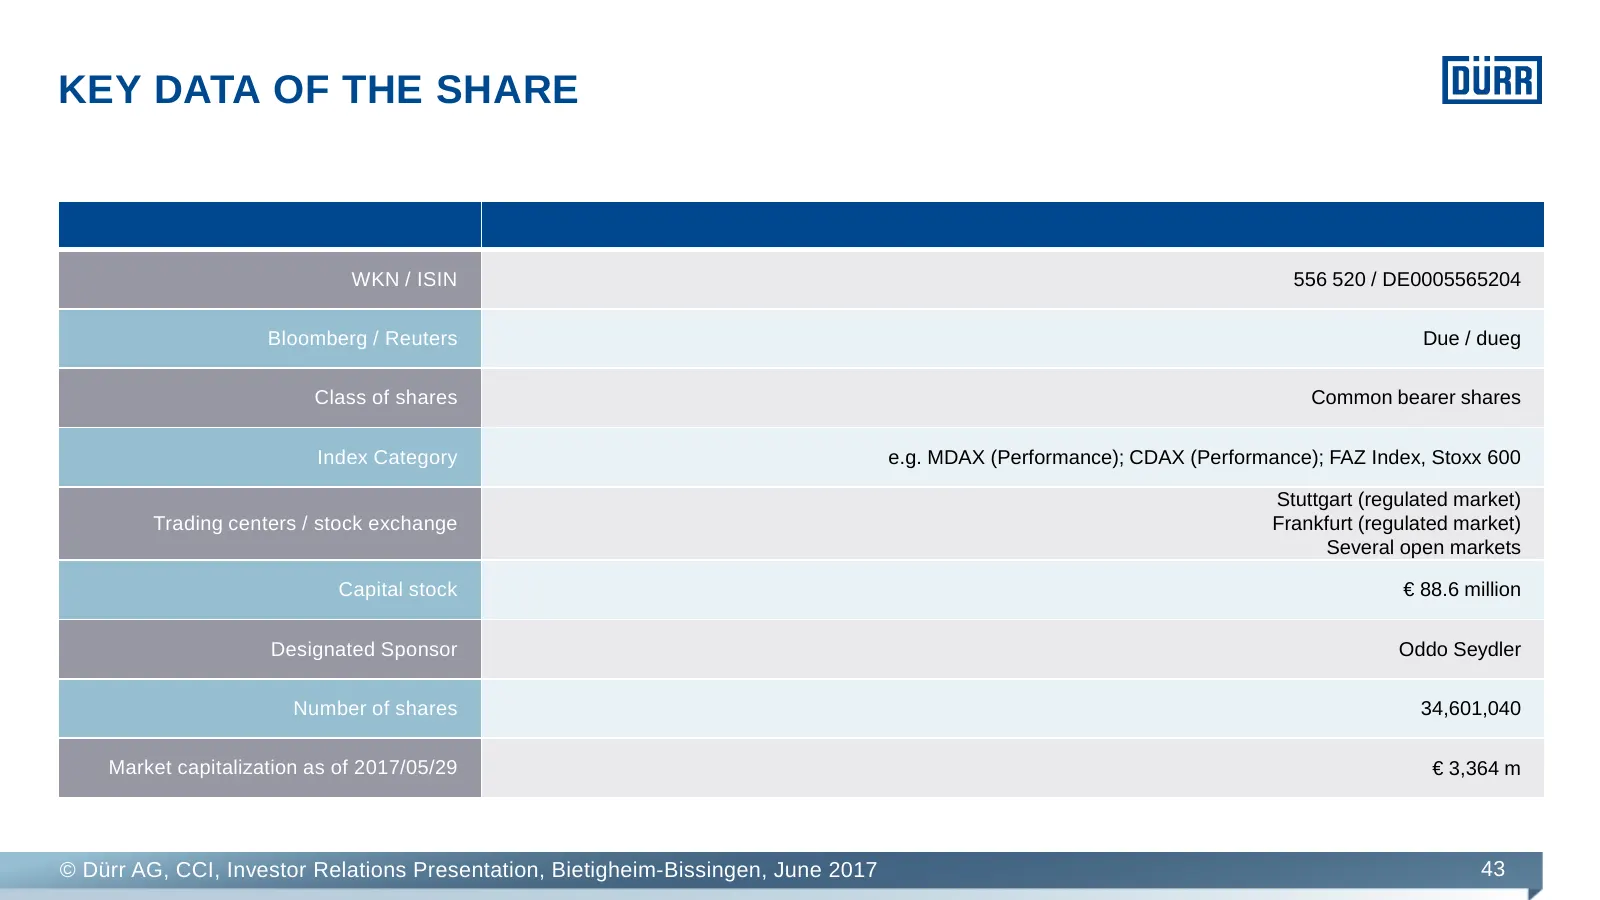
KEY DATA OF THE SHARE WKN / ISIN 556 520 / DE0005565204 Bloomberg / Reuters Due / dueg Class of shares Common bearer shares Index Category e.g. MDAX (Performance); CDAX (Performance); FAZ Index, Stoxx 600 Stuttgart (regulated market) Trading centers / stock exchange Frankfurt (regulated market) Seve
Slide 44: Shareholder structure/dividend policy
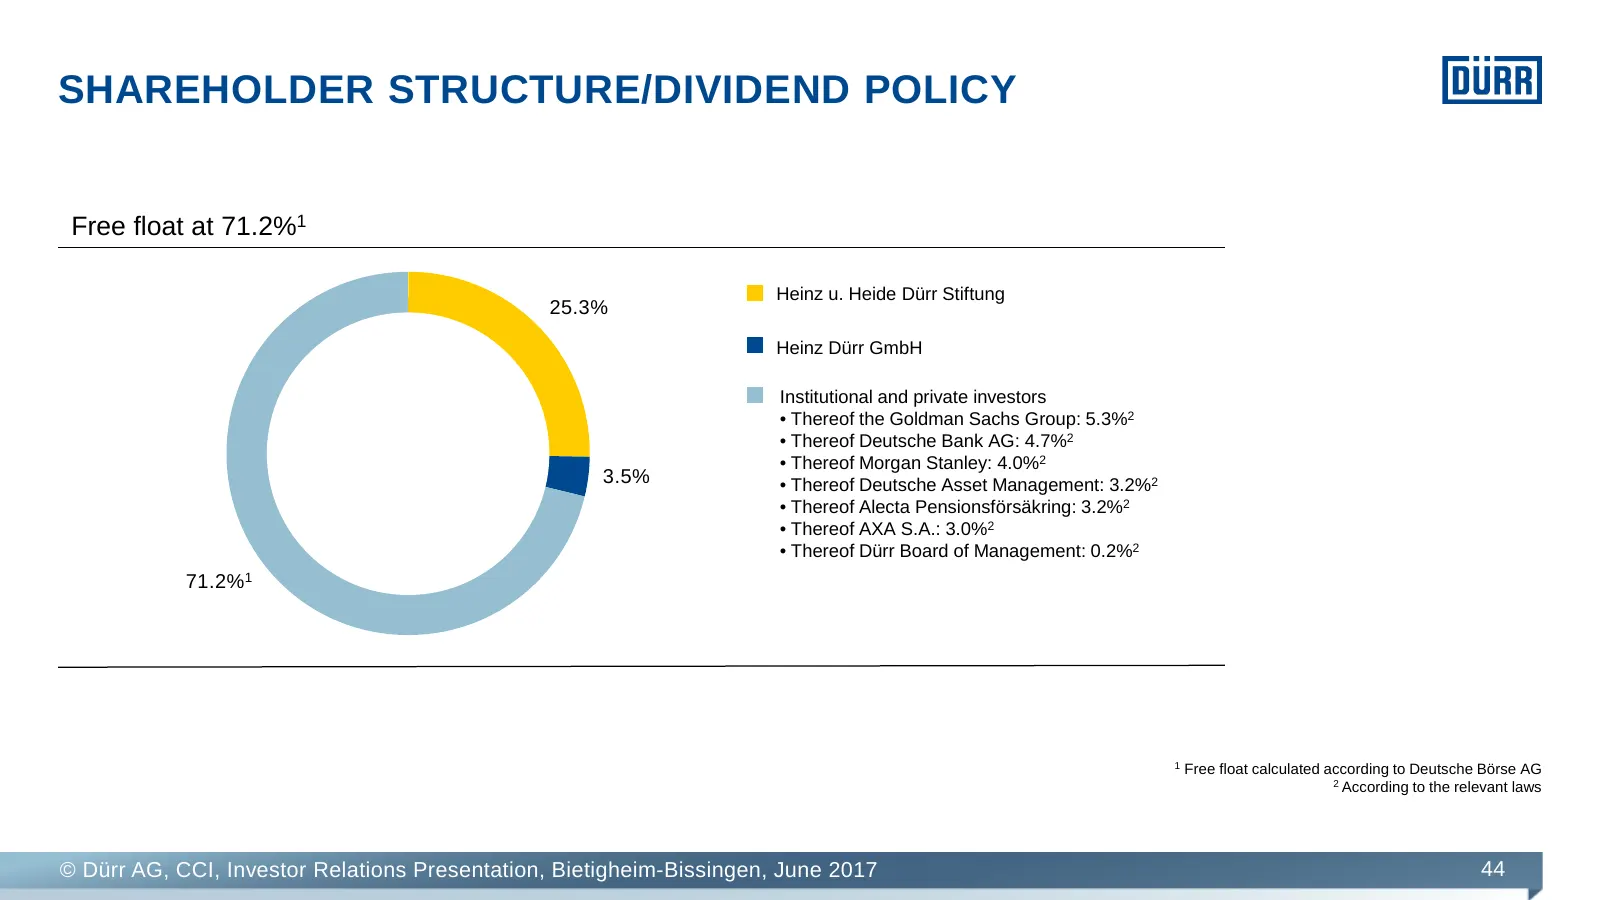
SHAREHOLDER STRUCTURE/DIVIDEND POLICY Free float at 71.2%1 Heinz u. Heide Dürr Stiftung 25.3% Heinz Dürr GmbH Institutional and private investors • Thereof the Goldman Sachs Group: 5.3%2 • Thereof Deutsche Bank AG: 4.7%2 • Thereof Morgan Stanley: 4.0%2 3.5% • Thereof Deutsche Asset Management: 3.2%2
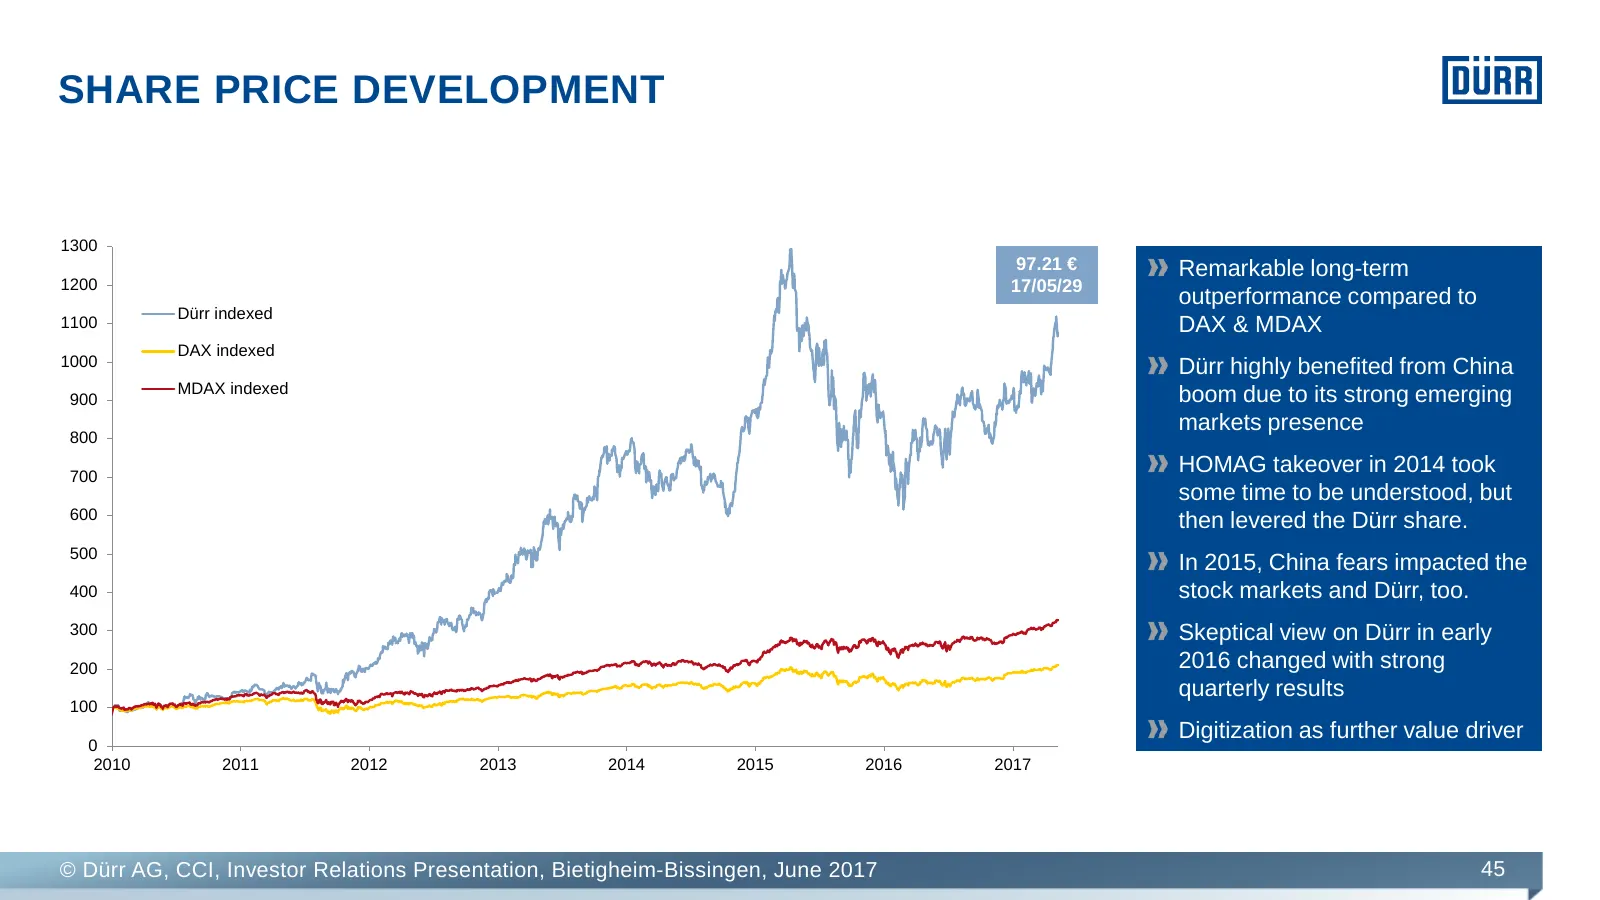
Slide 45: Share price development
SHARE PRICE DEVELOPMENT 1300 97.21 € Remarkable long-term 1200 17/05/29 outperformance compared to Dürr indexed 1100 DAX & MDAX DAX indexed 1000 Dürr highly benefited from China MDAX indexed 900 boom due to its strong emerging markets presence 800 700 HOMAG takeover in 2014 took some time to be unde
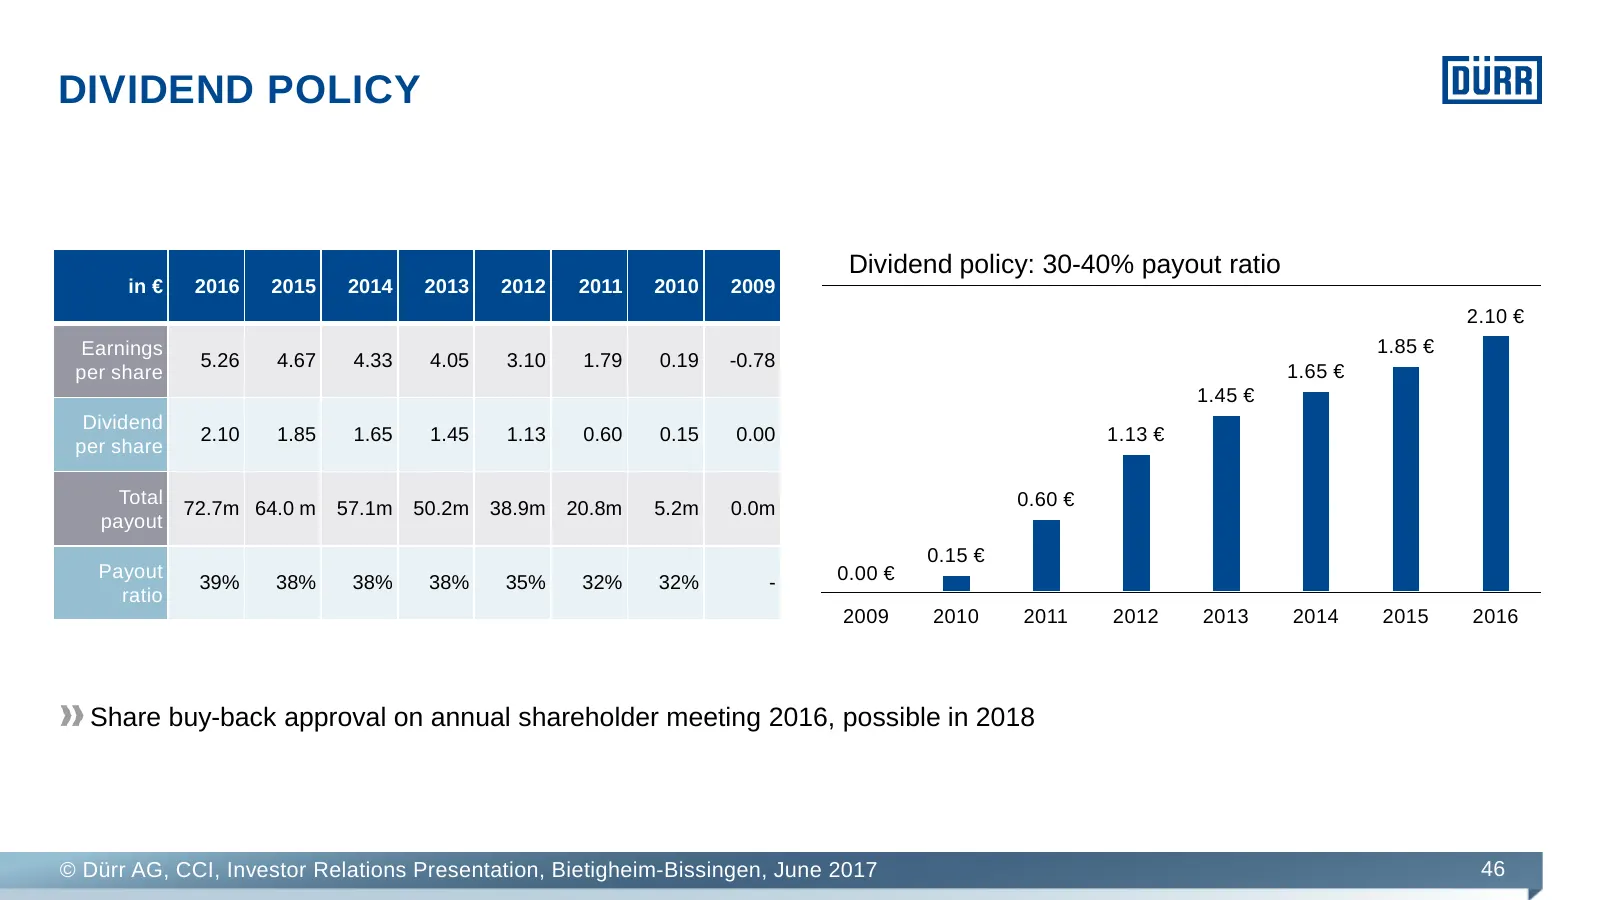
Slide 46: Dividend policy
DIVIDEND POLICY Dividend policy: 30-40% payout ratio in € 2016 2015 2014 2013 2012 2011 2010 2009 2.10 € Earnings 1.85 € 5.26 4.67 4.33 4.05 3.10 1.79 0.19 -0.78 per share 1.65 € 1.45 € Dividend 2.10 1.85 1.65 1.45 1.13 0.60 0.15 0.00 1.13 € per share Total 0.60 € 72.7m 64.0 m 57.1m 50.2m 38.9m 20.8
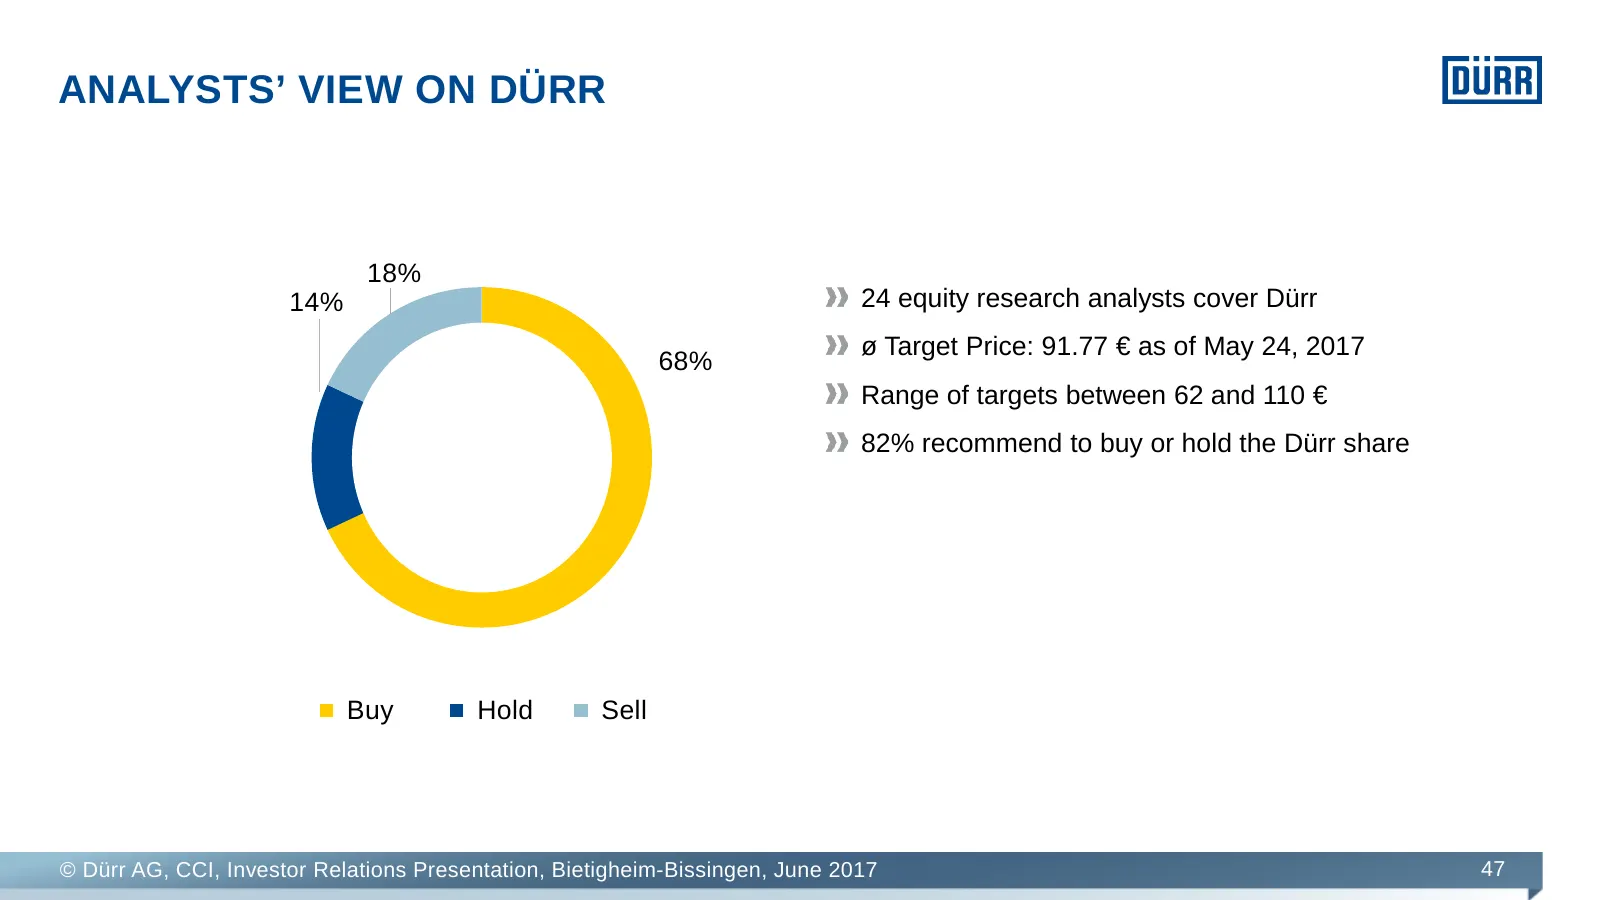
Slide 47: Analysts' view on Dürr
ANALYSTS’ VIEW ON DÜRR 18% 14% 24 equity research analysts cover Dürr ø Target Price: 91.77 € as of May 24, 2017 68% Range of targets between 62 and 110 € 82% recommend to buy or hold the Dürr share Buy Hold Sell © Dürr AG, CCI, Investor Relations Presentation, Bietigheim-Bissingen, June 2017 47
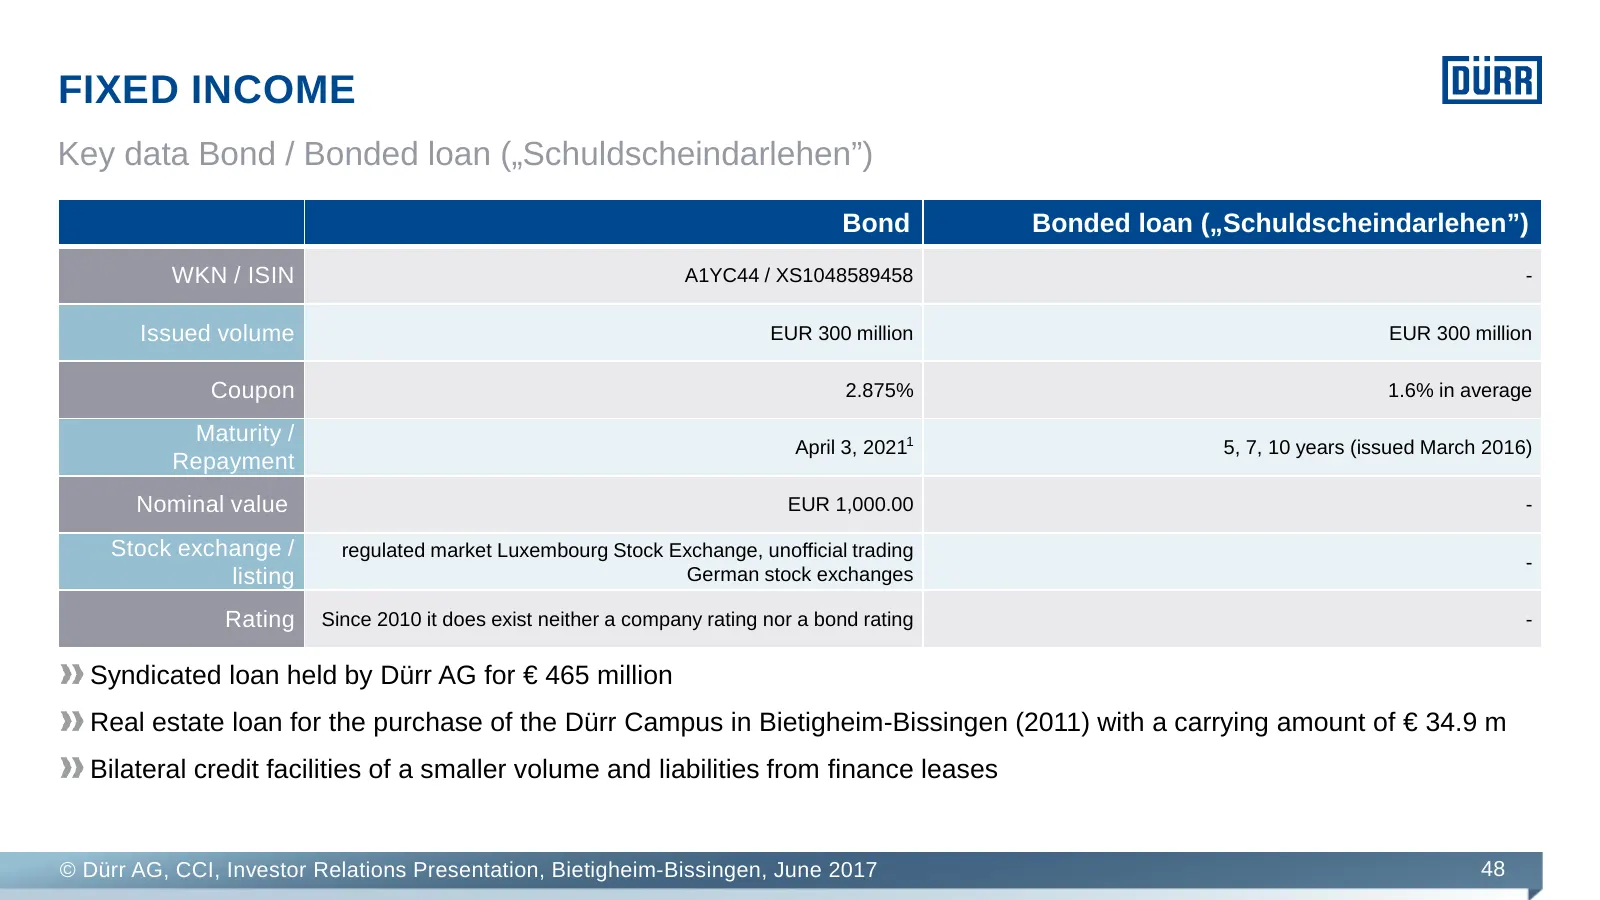
Slide 48: Fixed income
FIXED INCOME Key data Bond / Bonded loan („Schuldscheindarlehen”) Bond Bonded loan („Schuldscheindarlehen”) WKN / ISIN A1YC44 / XS1048589458 - Issued volume EUR 300 million EUR 300 million Coupon 2.875% 1.6% in average Maturity / April 3, 20211 5, 7, 10 years (issued March 2016) Repayment Nominal va
Slide 49: Equity story
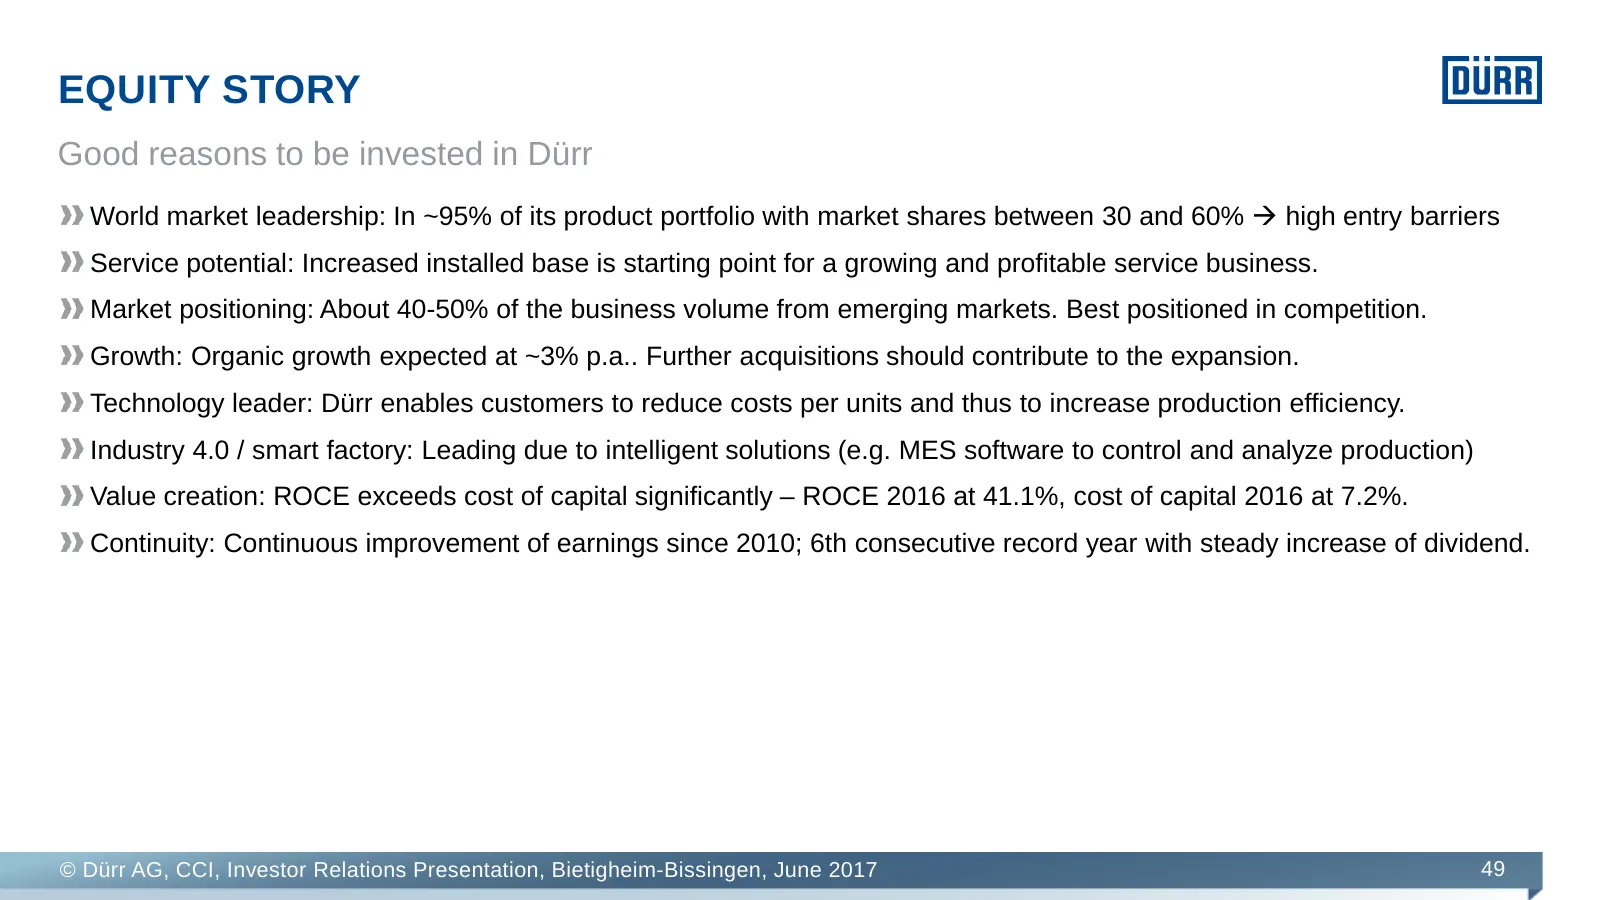
EQUITY STORY Good reasons to be invested in Dürr World market leadership: In ~95% of its product portfolio with market shares between 30 and 60% high entry barriers Service potential: Increased installed base is starting point for a growing and profitable service business. Market positioning: Abou
Slide 50: Value management
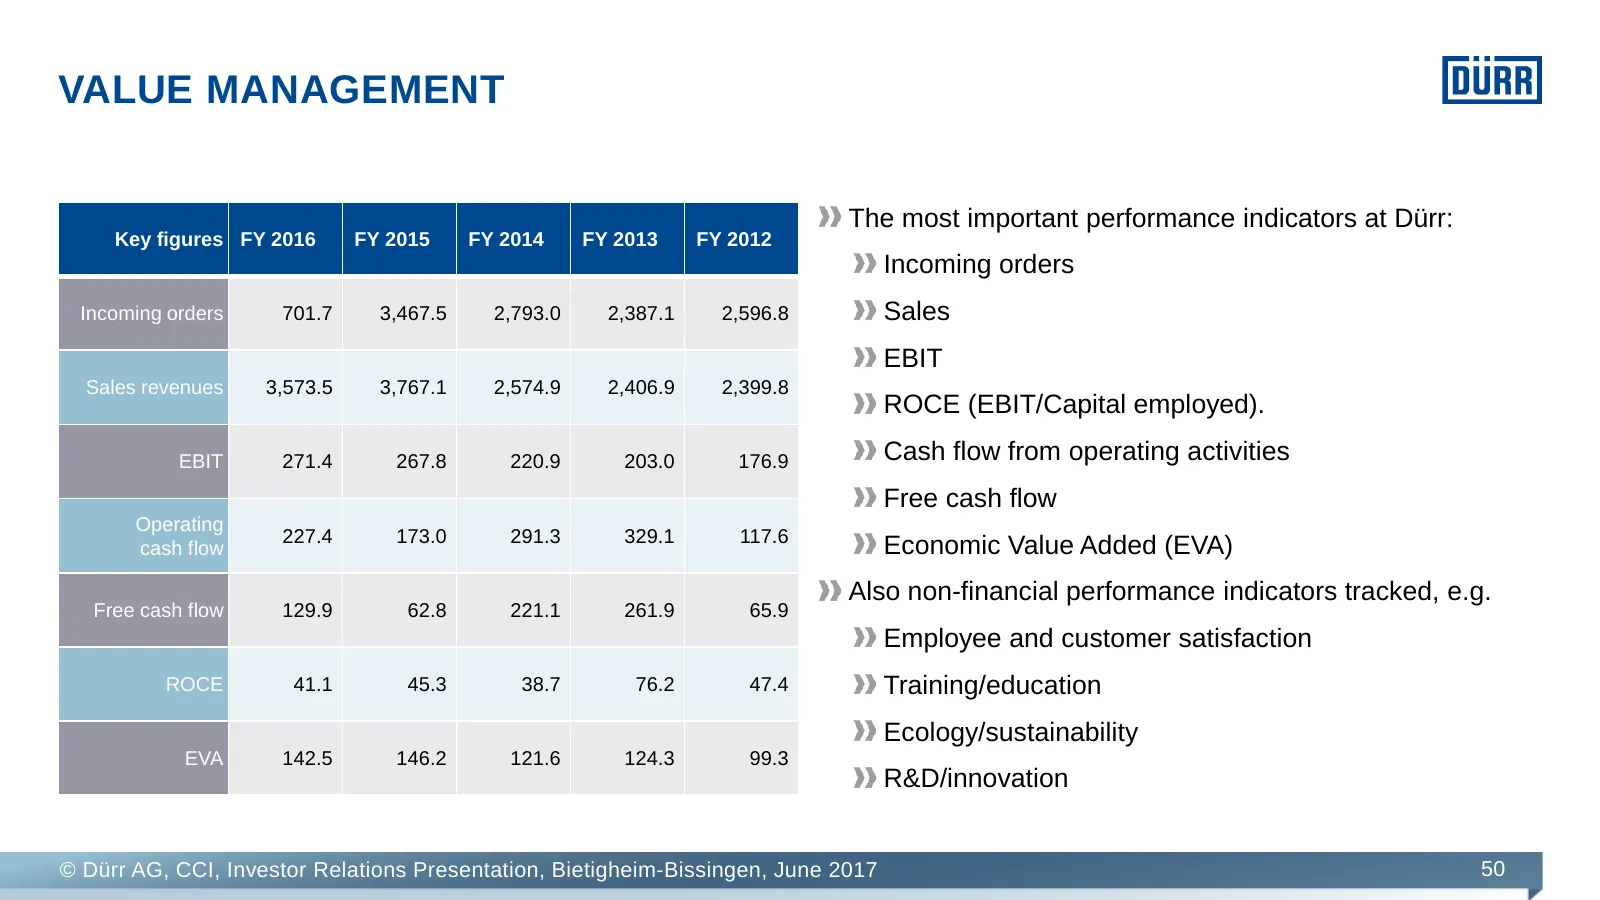
VALUE MANAGEMENT The most important performance indicators at Dürr: Key figures FY 2016 FY 2015 FY 2014 FY 2013 FY 2012 Incoming orders Incoming orders 701.7 3,467.5 2,793.0 2,387.1 2,596.8 Sales EBIT Sales revenues 3,573.5 3,767.1 2,574.9 2,406.9 2,399.8 ROCE (EBIT/Capital employed). EBIT 271.4 267
Source: Internet Archive copy of durr.com
More decks from Durr AG
 Q3 2026 Earnings Presentation33 slides · Nov 12, 2026
 Q2 2026 Earnings Presentation39 slides · Aug 6, 2026
 Q1 2026 Earnings Presentation35 slides · May 12, 2026
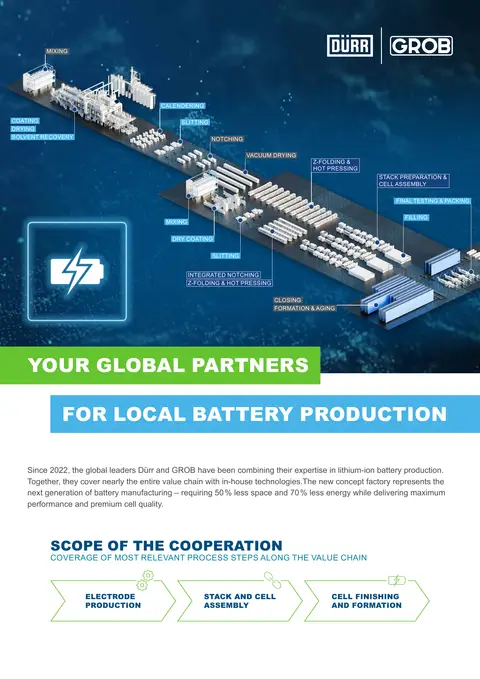 Fact Sheet (2025)2 slides · Dec 2, 2025
 Q3 2025 Earnings Presentation46 slides · Nov 13, 2025
 Q2 2025 Earnings Presentation31 slides · Jul 24, 2025