IEC Electronics — WNY Investor Conference Sept. 2010
27 slides from IEC Electronics's conference presentation, Sep 23, 2010
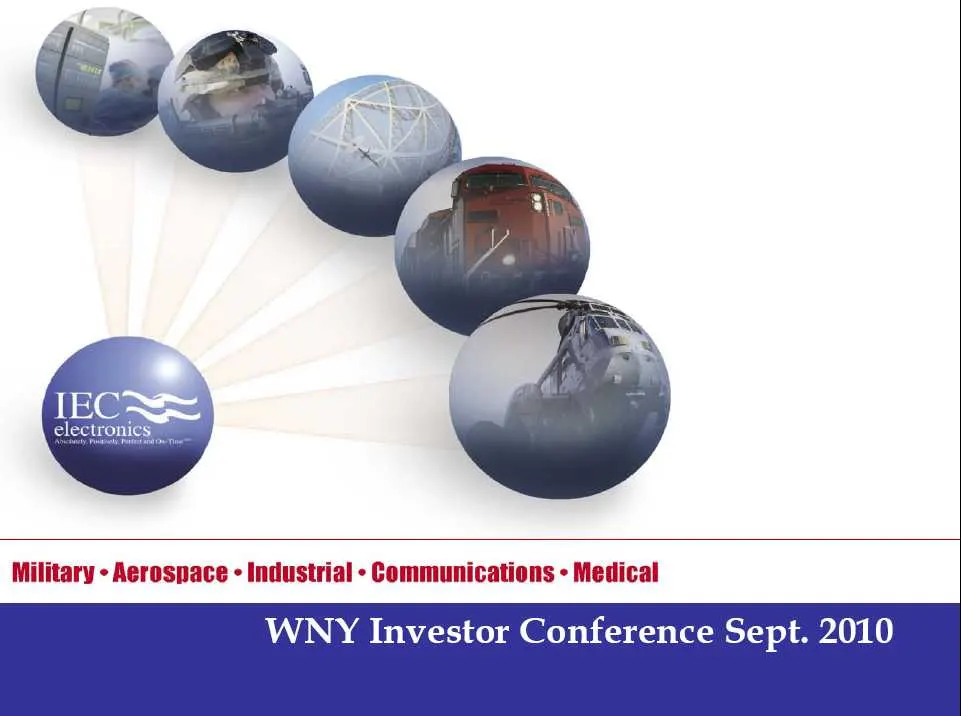
Slide 1: WNY Investor Conference Sept. 2010
WNY Investor Conference Sept. 2010
Slide 2: Safe Harbor Statement
Safe Harbor Statement The foregoing, including any discussion regarding _ the Company's future prospects, contains certain forward-looking statements that involve risks and uncertainties, including uncertainties associated with economic conditions in the electronics industry, particularly in the pri
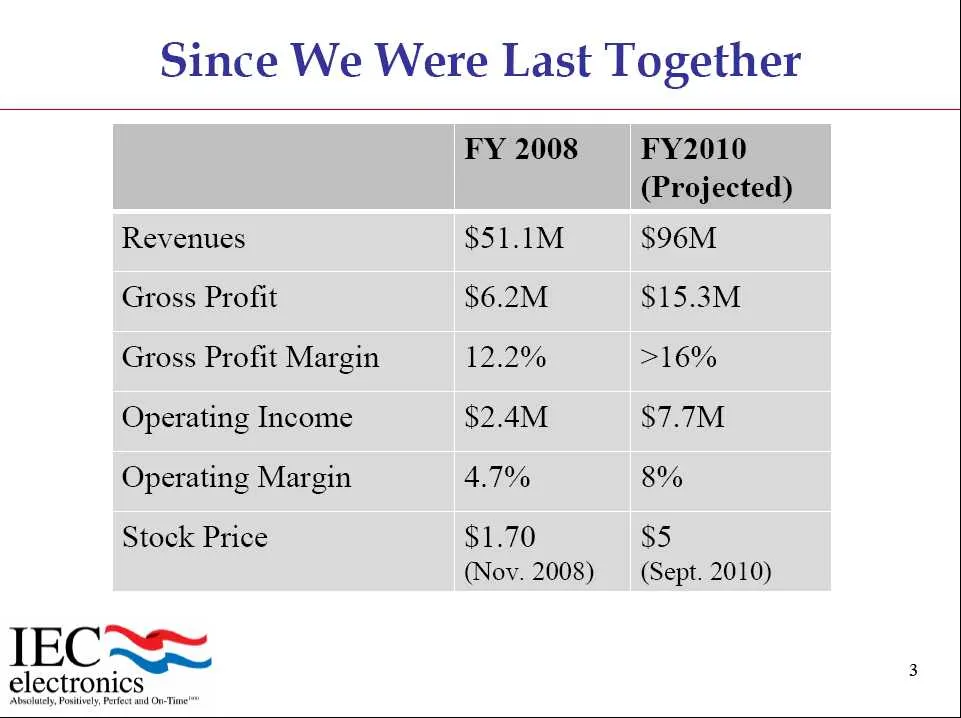
Slide 3: Since We Were Last Together
Since We Were Last Together FY 2008 FY2010 (Projected) Revenues $51.1M $96M Gross Profit $6.2M $15.3M Gross Profit Margin 12.2% >16% Operating Income $2.4M $7.7M Operating Margin 4.7% 8% Stock Price $1.70 $5 (Nov. 2008) (Sept. 2010) IECNS= electronics
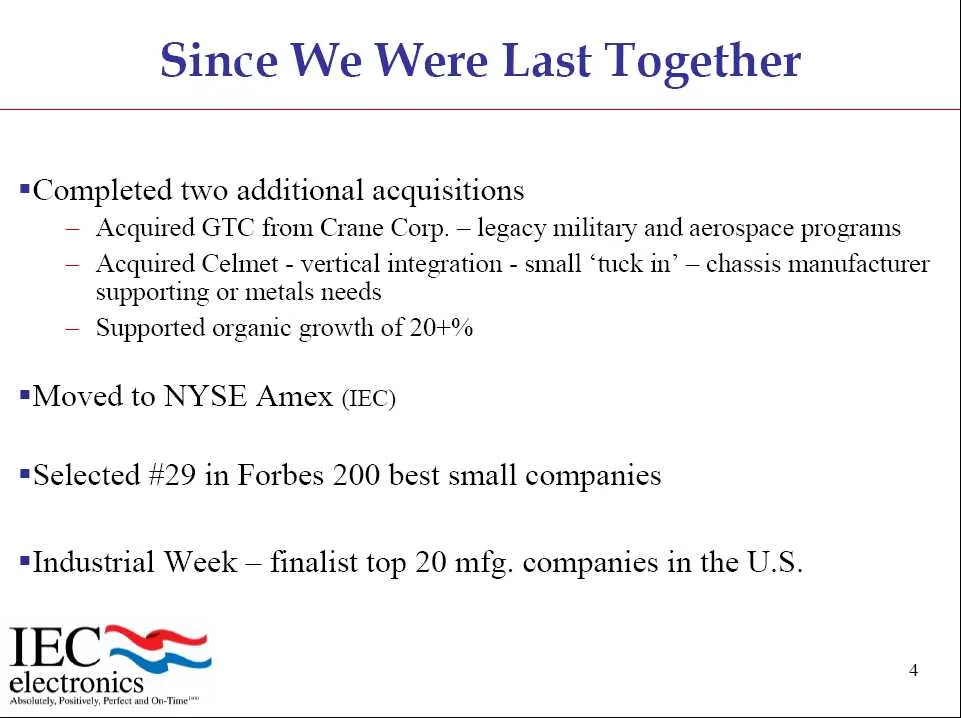
Slide 4: Since We Were Last Together
Since We Were Last Together =Completed two additional acquisitions — Acquired GTC from Crane Corp. — legacy military and aerospace programs — Acquired Celmet - vertical integration - small ‘tuck in’ — chassis manufacturer supporting or metals needs — Supported organic growth of 20+% =Moved to NYSE A
Slide 5: We Are Growing Rapidly - Let's Discuss Why
We Are Growing Rapidly - Let’s Discuss Why First an overview of the Company
Slide 6: Overview
Overview Domestic Niche: Newark, NY (near Rochester) based contract electronics manufacturer = Customer mix is 100% U.S. based — Complexity Growth: 4-year CAGR of 25+% Margins: Industry leading operating margins at 7.5+% 9.6 million shares outstanding — Insiders control ~ 20% IECNS= electronics 14 O
Slide 7: Our Industry
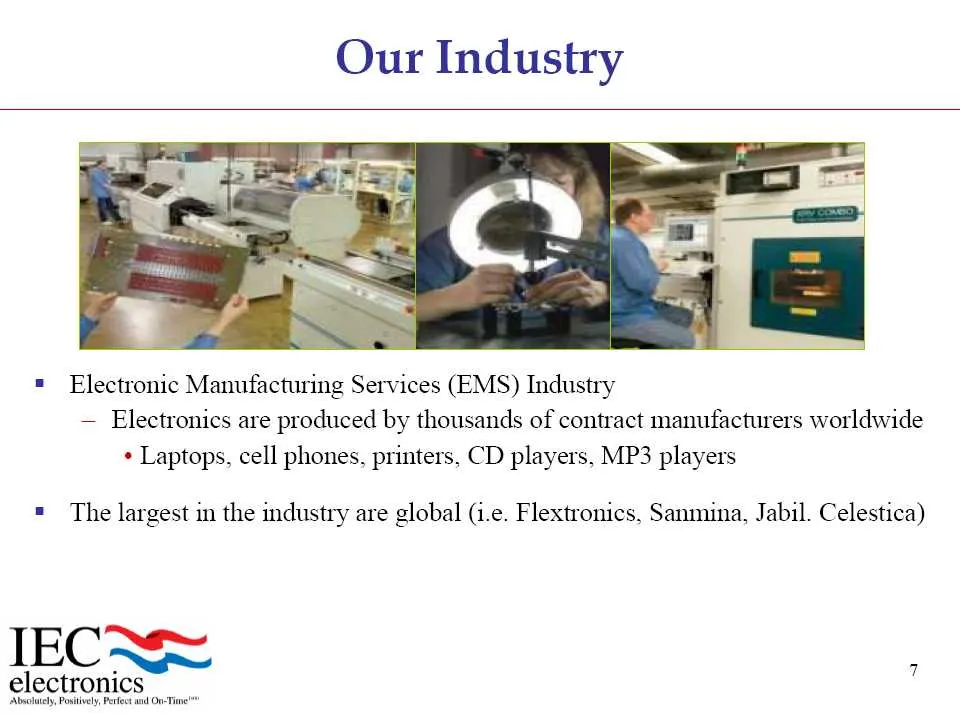
Our Industry = Electronic Manufacturing Services (EMS) Industry — Electronics are produced by thousands of contract manufacturers worldwide + Laptops, cell phones, printers, CD players, MP3 players = The largest in the industry are global (i.e. Flextronics, Sanmina, Jabil. Celestica) IECNS= eicuonia
Slide 8: Industry Perception
Industry Perception " Intensely competitive and work is easily exported — For 80% of a $300B* industry — yes — For ~ 20% NO ($60 B) — We view this as a lack of information Our growth has not happened by accident Key Question: What is our competitive advantage and is it sustainable? * various industr
Slide 9: What Makes Us Different:
What Makes Us Different:
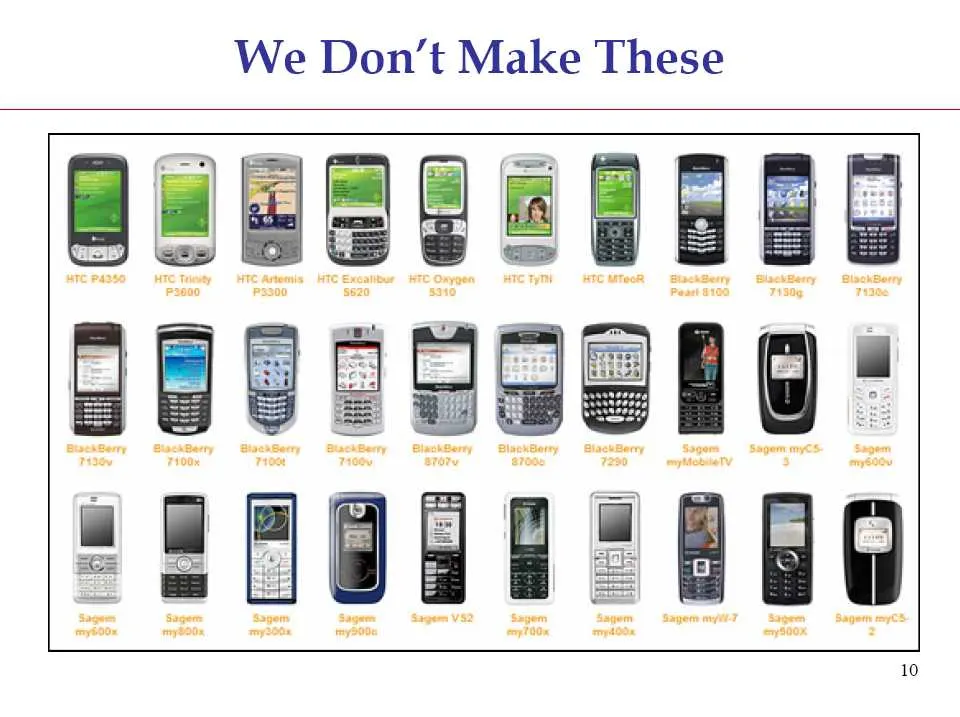
Slide 10: We Don't Make These
We Don’t Make These HTC Artemis HTC Excalibur HTC Oxygen P2000 P3300 5620 3310 ; oy HH]
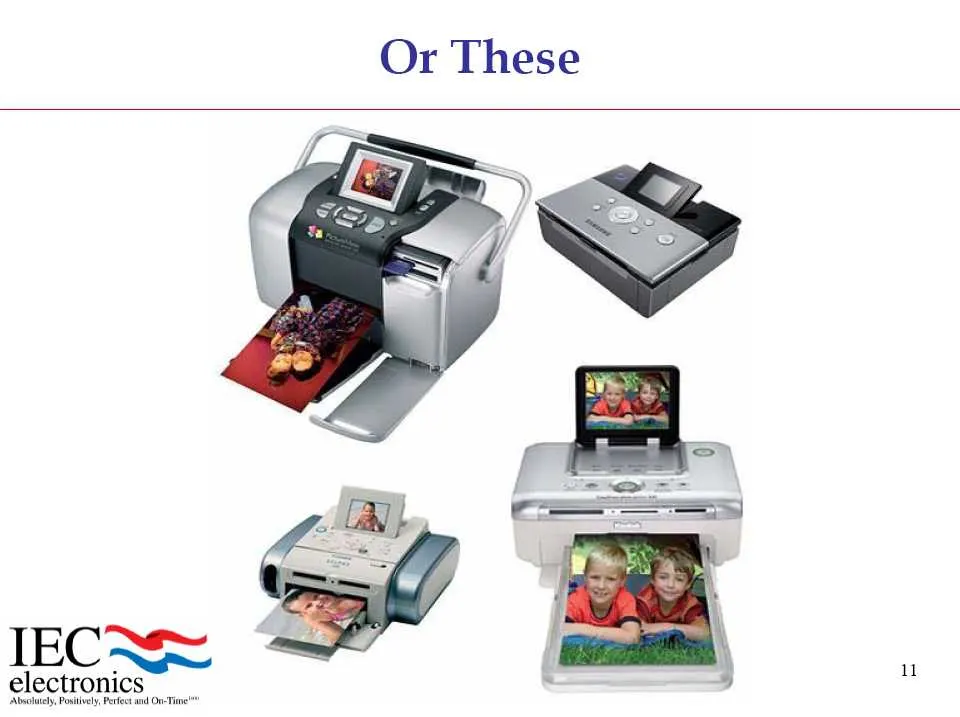
Slide 11: Or These
Or These 11
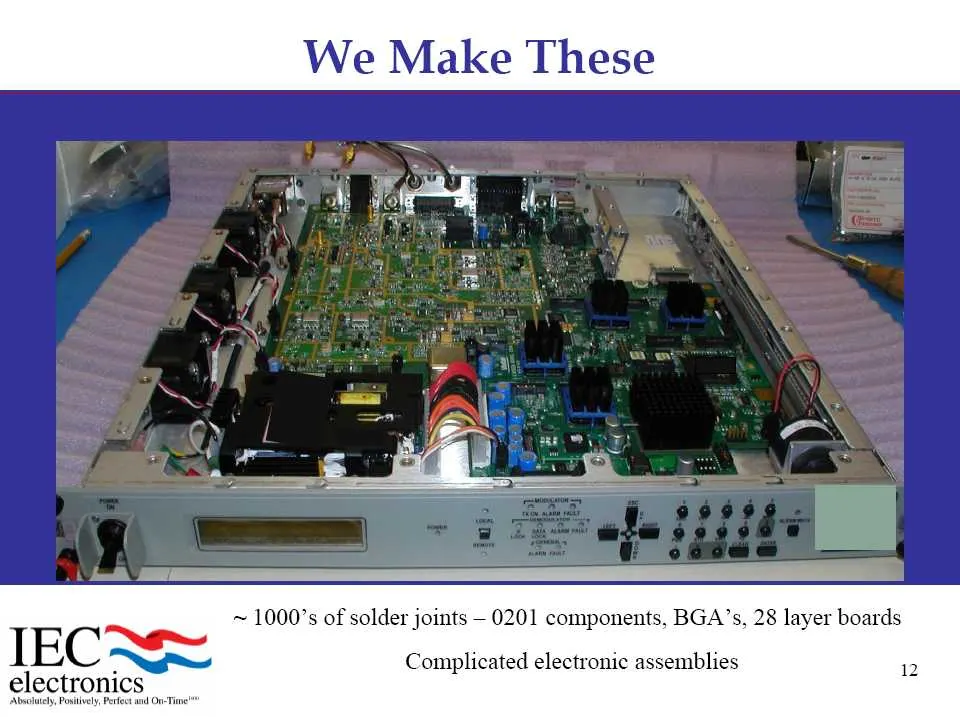
Slide 12: We Make These
We Make These ~ 1000’s of solder joints — 0201 components, BGA’s, 28 layer boards Rg Complicated electronic assemblies electronics Abscletely, Postel, Perfect and On
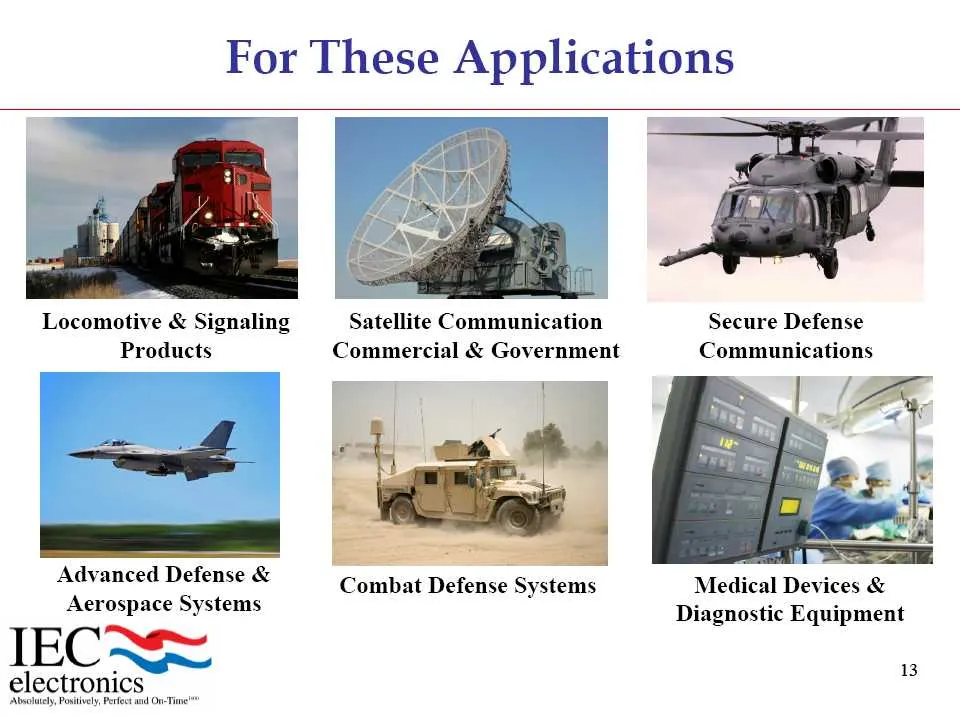
Slide 13: For These Applications
For These Applications Locomotive & Signaling Satellite Communication Secure Defense Products Commercial & Government Communications om = i r Combat Defense Systems Medical Devices & Diagnostic Equipment Advanced Defense & Aerospace Systems IECNS= electronics Absolutely, Posey, Perfect and Ov-Tine'™
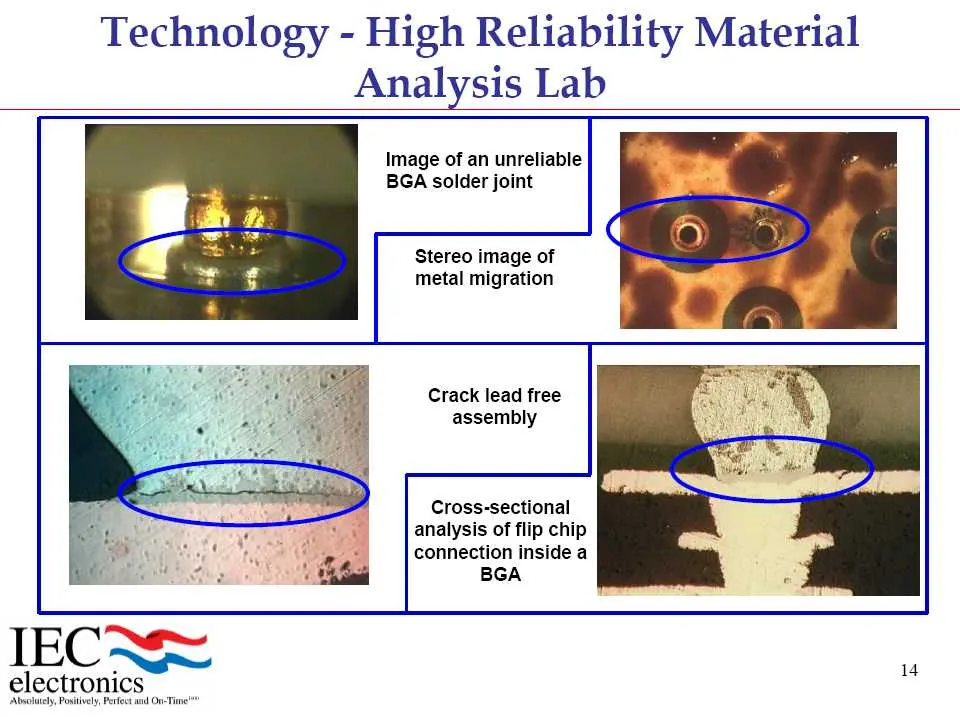
Slide 14: Technology - High Reliability Material
Technology - High Reliability Material Analysis Lab Image of an unreliable BGA solder joint Stereo image of metal migration Crack lead free assembly Cross-sectional analysis of flip chi connection inside a BGA IEC\S= 1 electronics
Slide 15: Technology - Communications
Technology - Communications = Real-time online monitoring system — 24 hrs. a day —7 days a week = Our customers know when: — Kits are full — Products are on the line — The number of units in test, rework, pack out — Statistical “drill down”: = Component failure, frequency — Reason = Component tracea
Slide 16: Business Model
Business Model " High reliability — Low volume, high value manufacturing model = Customers who have complicated electronics — Customers resistant to transferring work outside the U:S. = Proprietary technology = Government restrictions = Erratic demand — Customers that value high technological capabi
Slide 17: Markets Served
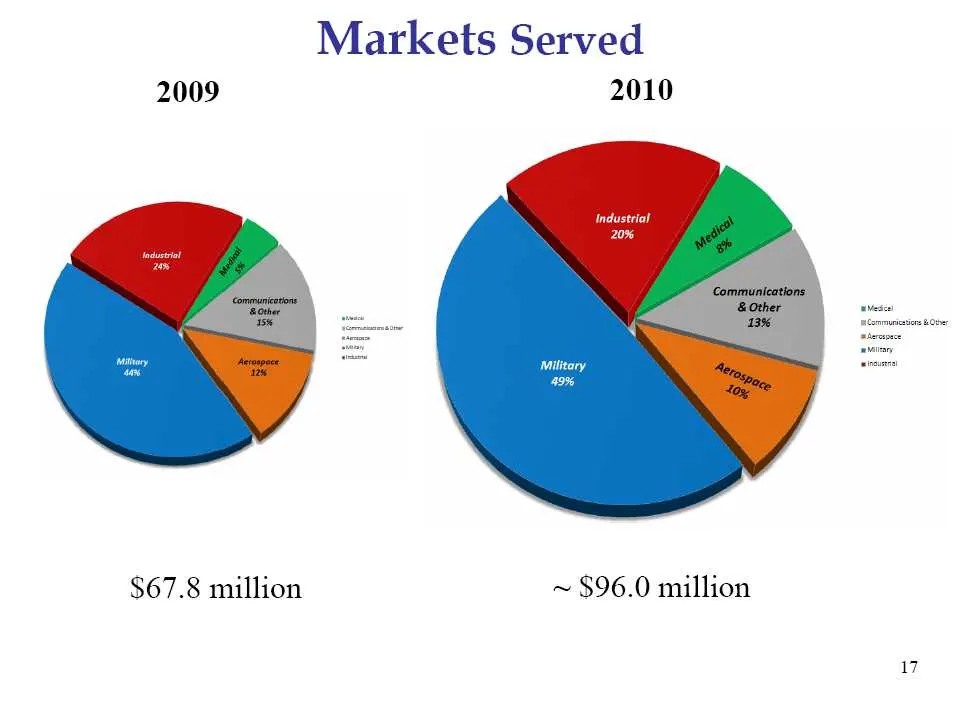
Markets Served 2009 2010 Communications & Other $67.8 million ~ $96.0 million 17
Slide 18: Some of Our Customers
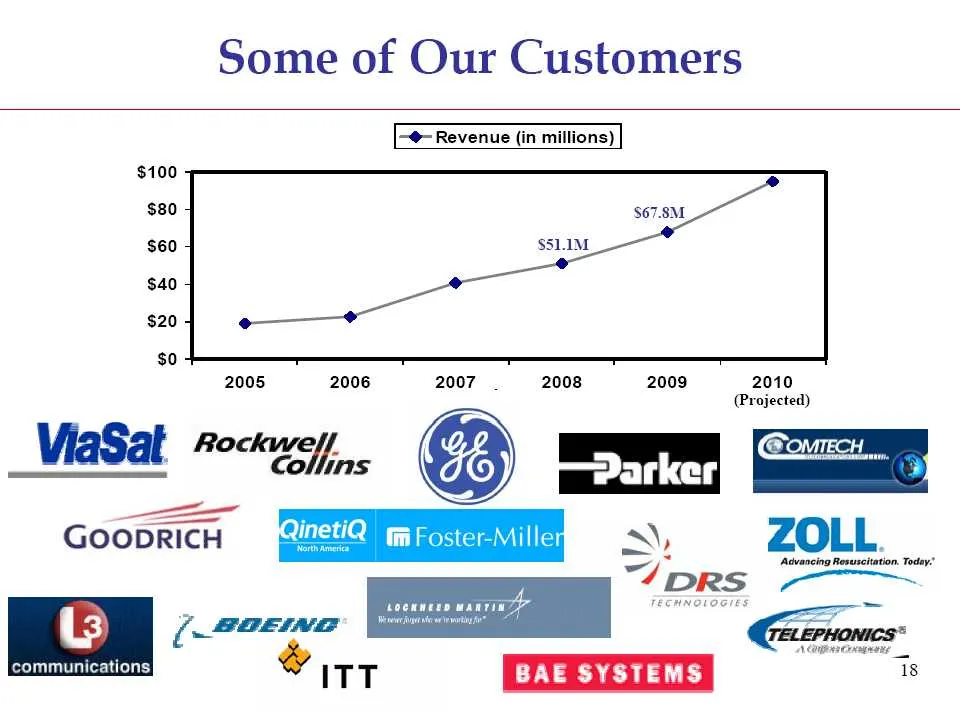
Some of Our Customers 2005 Rockwefj/ 2006 [—@- Revenue (in millions) 2007 | 2008 $67.8M 2009 2010 (Projected)
Slide 19: National Presence
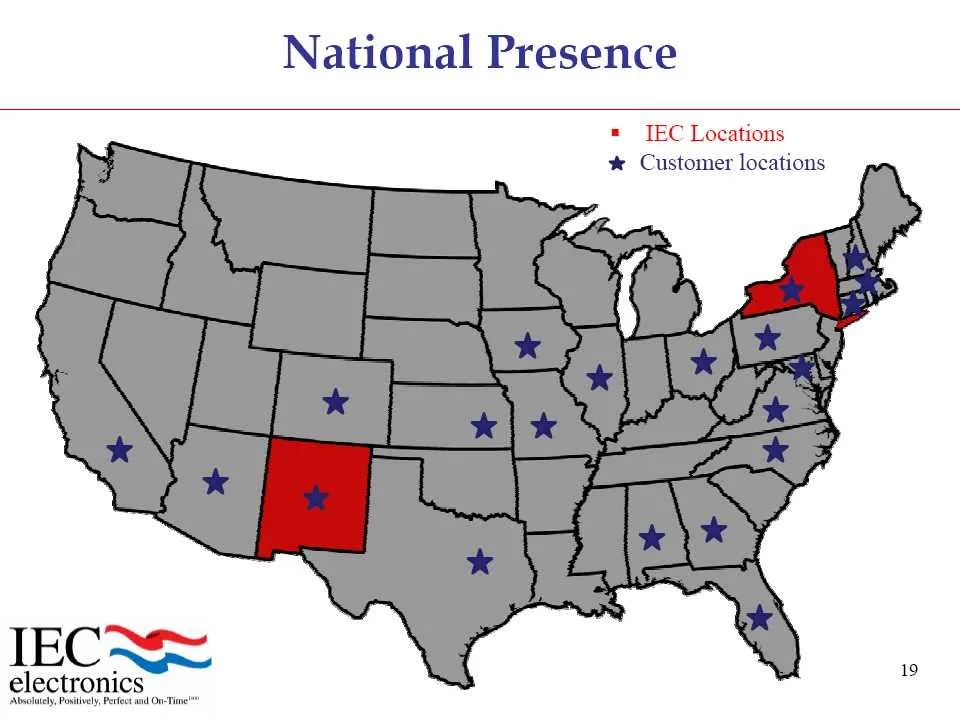
National Presence = TEC Locations * Customer locations IECNS= electronics Absolutely
Slide 20: Why are We Growing?
Why are We Growing? = Outsourcing continues to grow — All of our markets; Military and Defense, Medical, Aerospace and Industrial are experiencing solid growth — Customers are increasing their outsourcing — Winning market share 20 IECNS= electronics
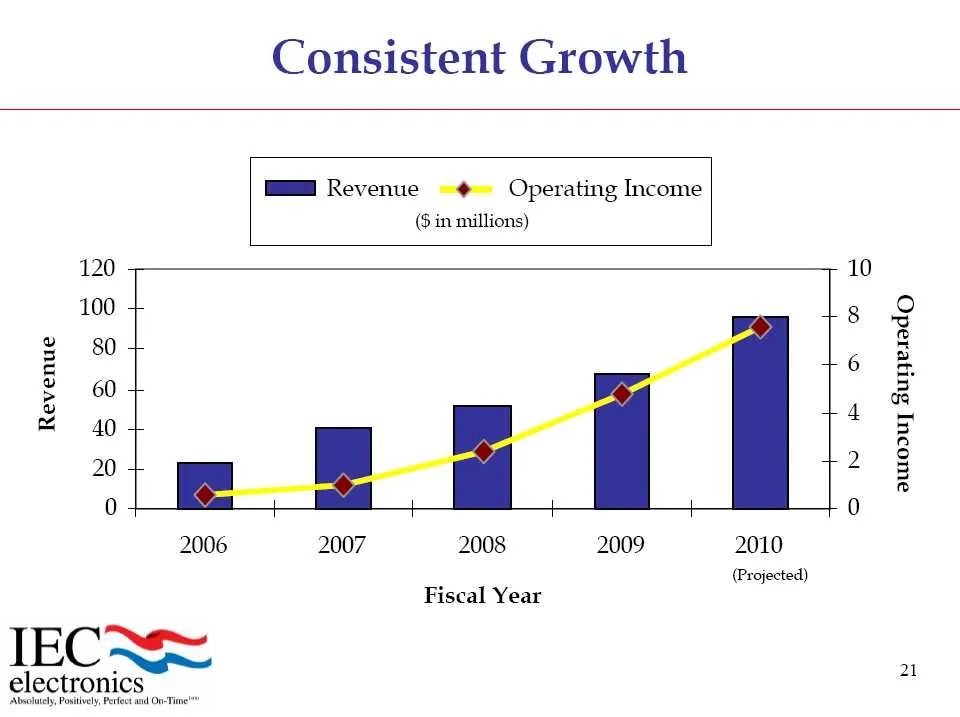
Slide 21: Consistent Growth
Consistent Growth MM Revenue ~~ Operating Income (3 in millions) 120 10 100 + ls 9 3g 2» got g 60 + g +a = 40 + 3 20 4 +72 § nm 0 + t + t 0 2006 2007 2008 2009 2010 (Projected) Fiscal Year mn IEC ~~ 21 electronics Absolutely, Postve
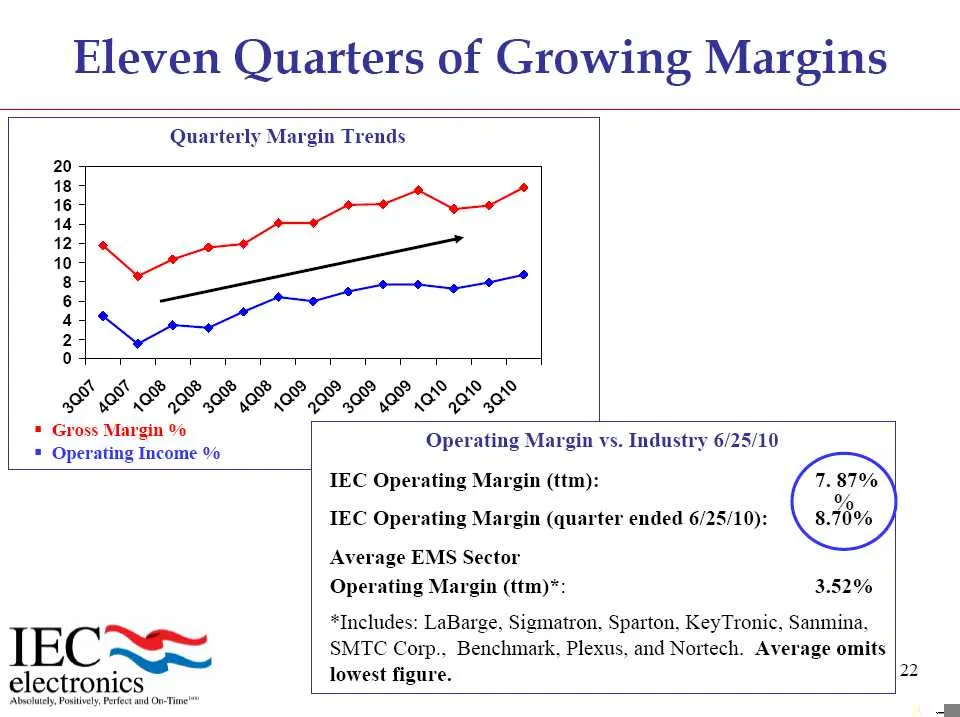
Slide 22: Eleven Quarters of Growing Margins
Eleven Quarters of Growing Margins Quarterly Margin Trends 20 18 5 165 145 125 104 3-| 6+ 44 2-4 0 a a sg FFL SPL S a& g& of SSIS IE FI SSS SO = Gross Margin % = Opersting Income’ Operating Margin vs. Industry 6/25/10 IEC Operating Margin (ttm): IEC Operating Margin (quarter ended 6/25/10): Average
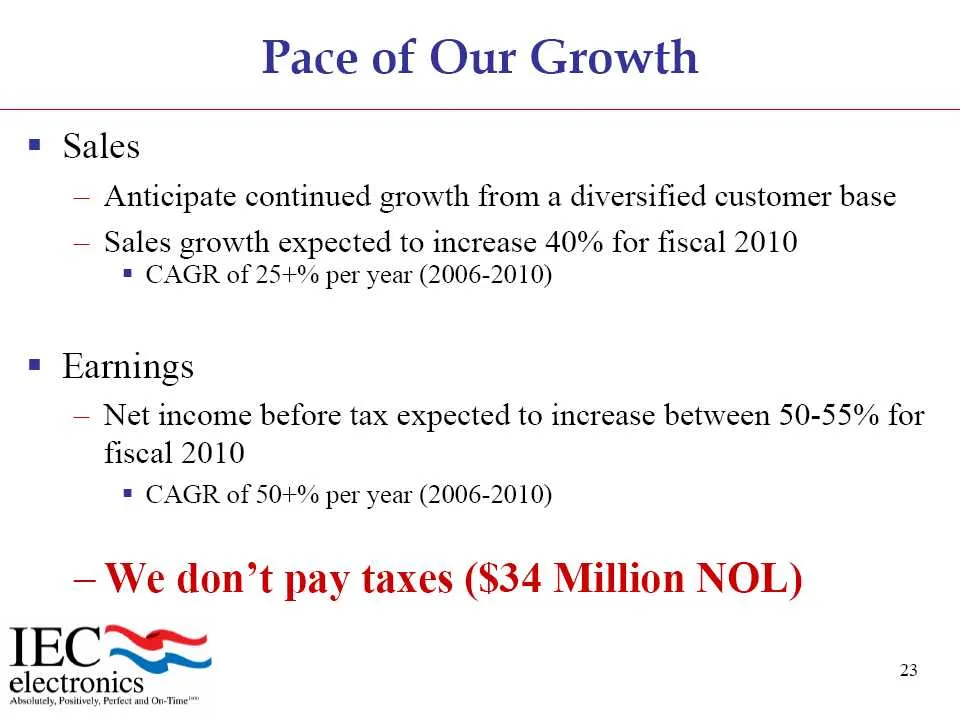
Slide 23: Pace of Our Growth
Pace of Our Growth = Sales — Anticipate continued growth from a diversified customer base — Sales growth expected to increase 40% for fiscal 2010 = CAGR of 25+% per year (2006-2010) = Earnings — Net income before tax expected to increase between 50-55% for fiscal 2010 = CAGR of 50+% per year (2006-2
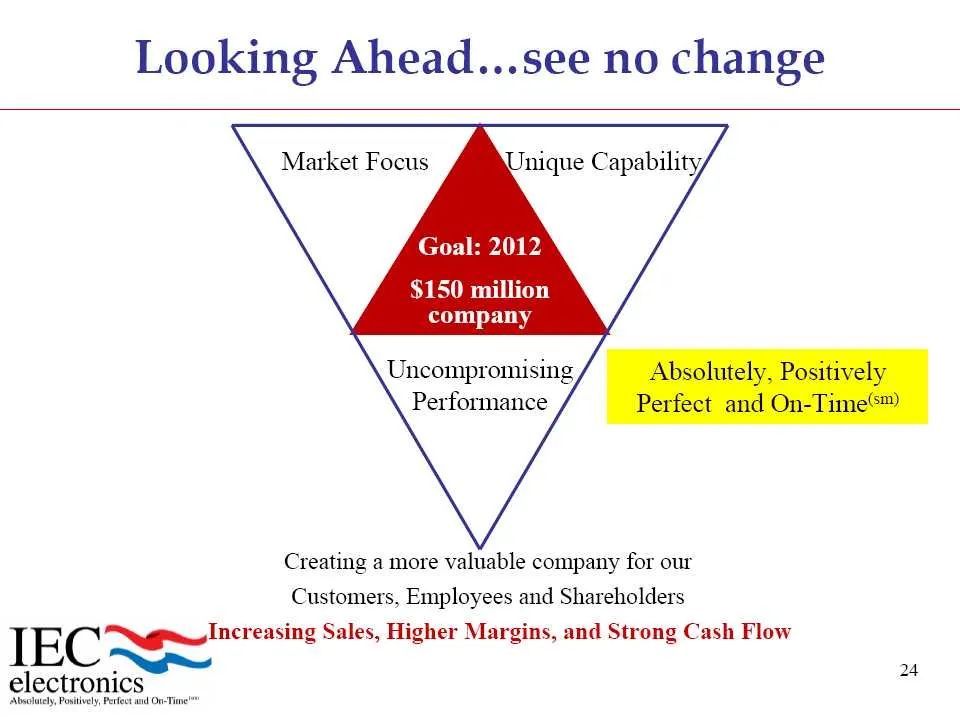
Slide 24: Looking Ahead...see no change
Looking Ahead...see no change Goal: 2012 $150 million company Uncompromising Performance Creating a more valuable company for our Customers, Employees and Shareholders IEC “pgp increasing Sales, Higher Margins, and Strong Cash Flow eg electronics Absolutely, Posey, Perfect and Ov-Tine'™
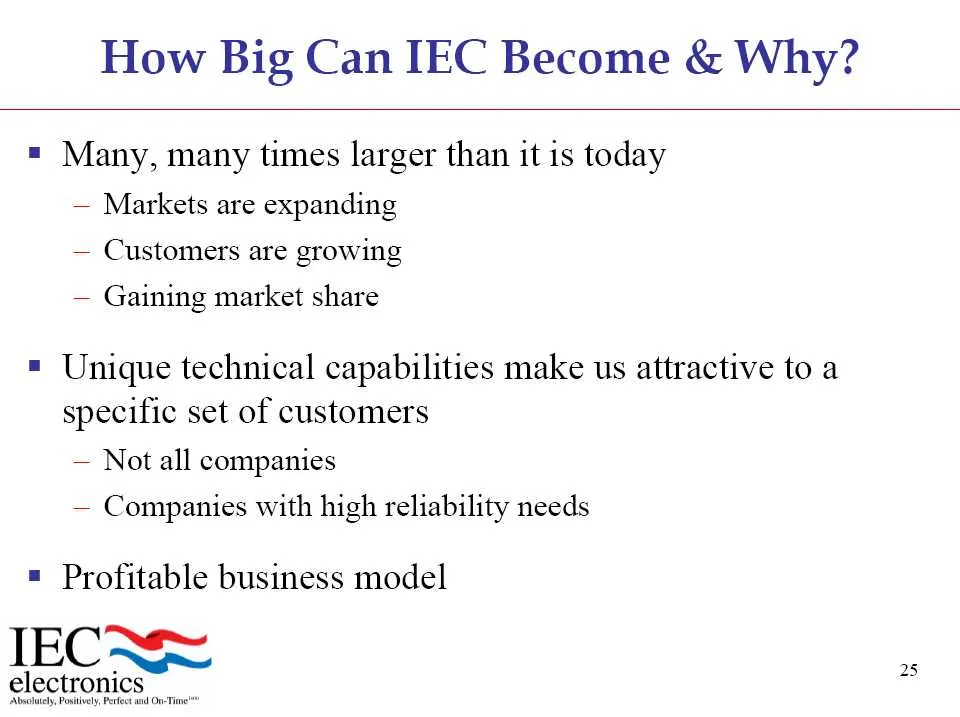
Slide 25: How Big Can IEC Become & Why?
How Big Can IEC Become & Why? = Many, many times larger than it is today — Markets are expanding — Customers are growing — Gaining market share = Unique technical capabilities make us attractive to a specific set of customers — Not all companies — Companies with high reliability needs = Profitable b
Slide 26: You have been kind enough to listen to me
You have been kind enough to listen to me IECNS= slectonion Absolutely, Positively, Perfect and On-Time* Now it is my turn to listen to you NYSE Amex: IEC
Slide 27: Contact Information
Contact Information IECTS= electronics W. Barry Gilbert IEC Electronics Corp. 105 Norton Street P.O. Box 271 Newark, N.Y. 14513 Direct - 315-332-4528 WBGilbert@iec-electronics.com a
Source: SEC EDGAR · 8-K filed Sep 23, 2010
More decks from IEC Electronics Corp
 Shareholder Meeting (March 2021)21 slides · Mar 10, 2021
 Shareholder Meeting (March 2020)25 slides · Mar 11, 2020
 Investor Presentation (December 2019)20 slides · Dec 10, 2019
 Investor Presentation (June 2019)19 slides · Jun 4, 2019
 Shareholder Meeting (March 2019)23 slides · Mar 13, 2019
 Investor Presentation (June 2018)26 slides · Jun 4, 2018