TIME dotCom Bhd. · MYX:TIMECOM
TIME dotCom Bhd — Q2 2014 Earnings Presentation
12 slides from TIME dotCom Bhd's earnings presentation, August 2014
Slide 1: 2Q and HY 2014 Performance Guide
TIME. 2Q and HY 2014 Performance Guide August 2014
Slide 2: Disclaimer
Disclaimer This presentation and the discussion following may contain forward looking statements by TIME dotCom Berhad (“TIME”) related to financial, market or industry trends for future period. These forward looking statements involve known and unknown risks and uncertainties which may cause the ac
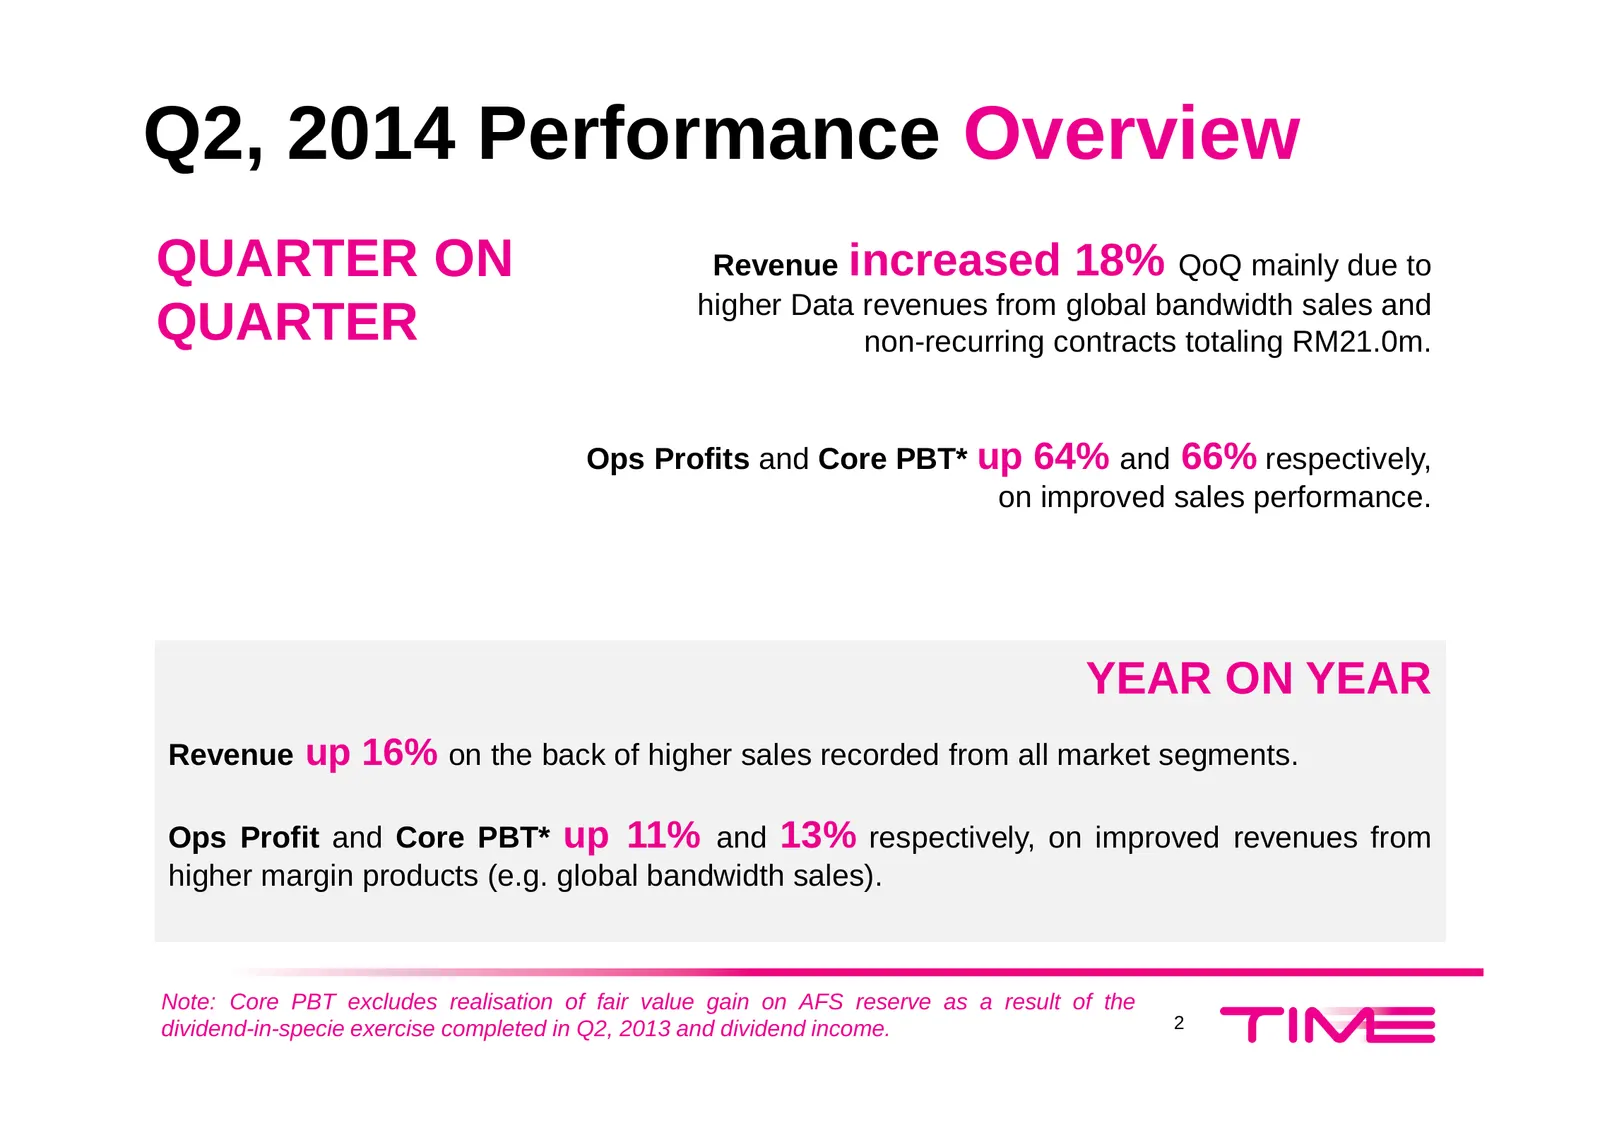
Slide 3: Q2, 2014 Performance Overview
Q2, 2014 Performance Overview QUARTER ON Revenue increased 18% QoQ mainly due to higher Data revenues from global bandwidth sales and QUARTER non-recurring contracts totaling RM21.0m. Ops Profits and Core PBT* up 64% and 66% respectively, on improved sales performance. YEAR ON YEAR Revenue up 16% on
Slide 4: YTD Jun, 2014 Performance Overview
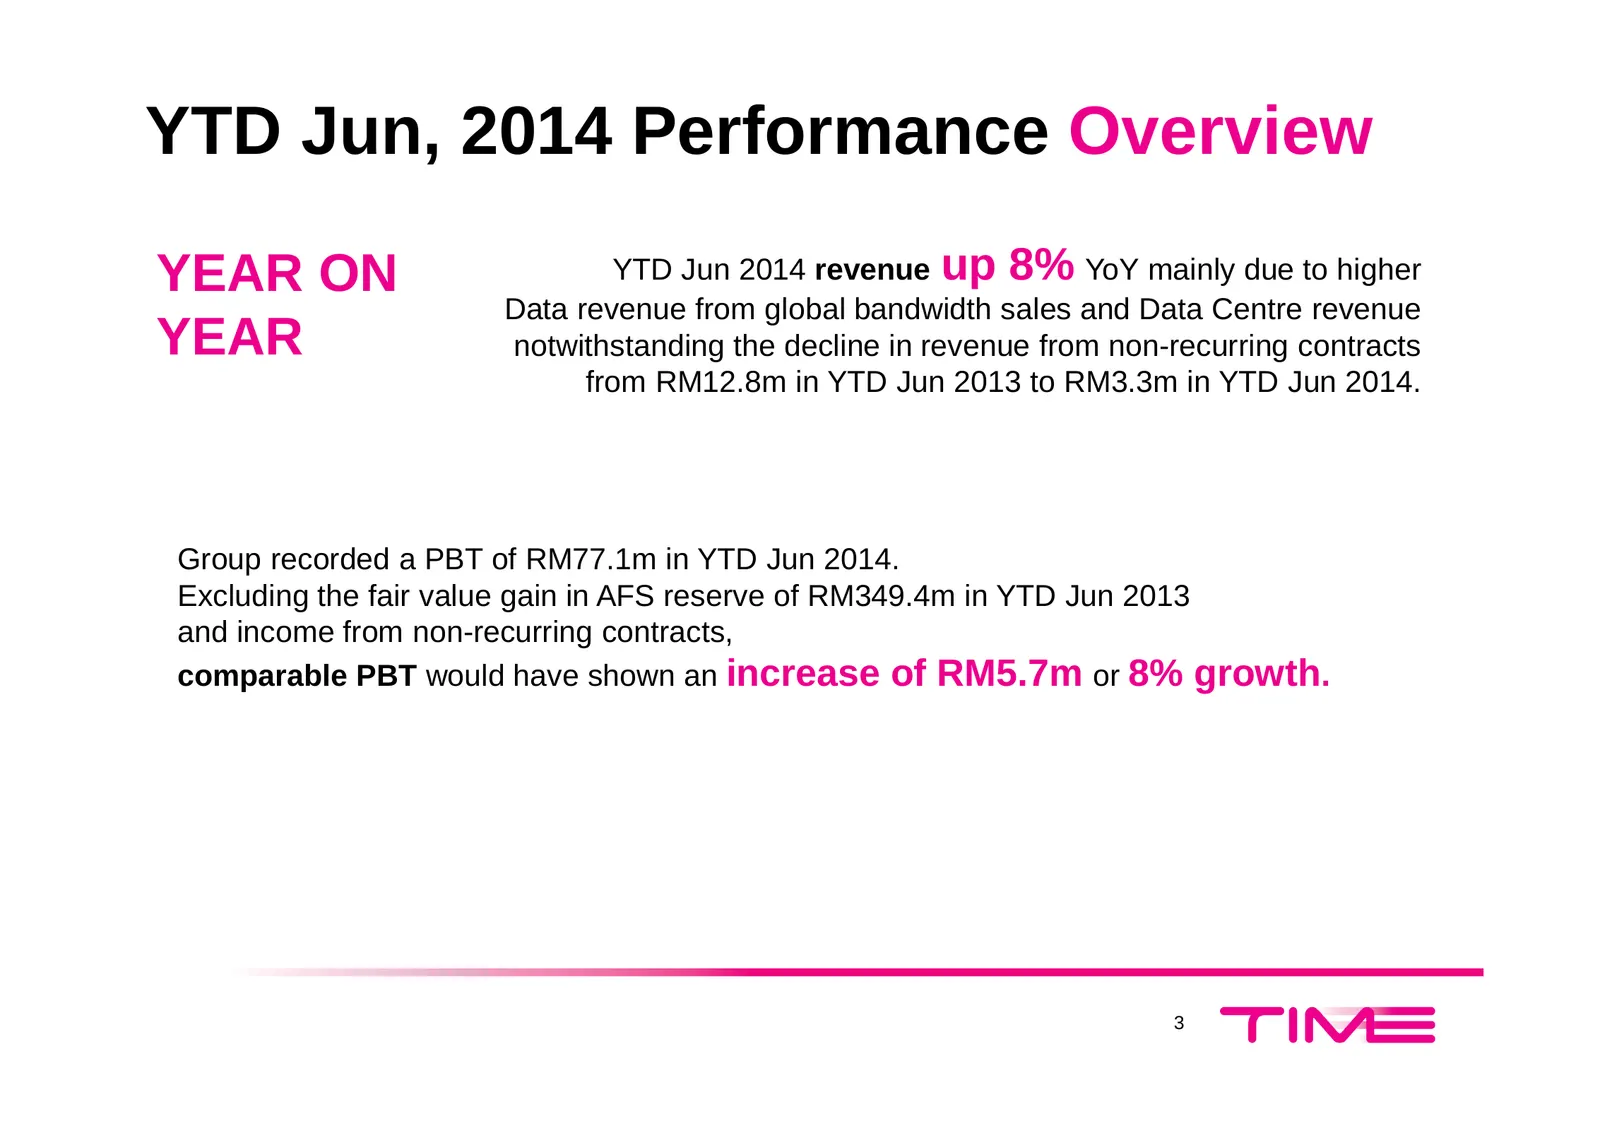
YTD Jun, 2014 Performance Overview YEAR ON YTD Jun 2014 revenue up 8% YoY mainly due to higher Data revenue from global bandwidth sales and Data Centre revenue YEAR notwithstanding the decline in revenue from non-recurring contracts from RM12.8m in YTD Jun 2013 to RM3.3m in YTD Jun 2014. Group recor
Slide 5: Q2, 2014 Performance
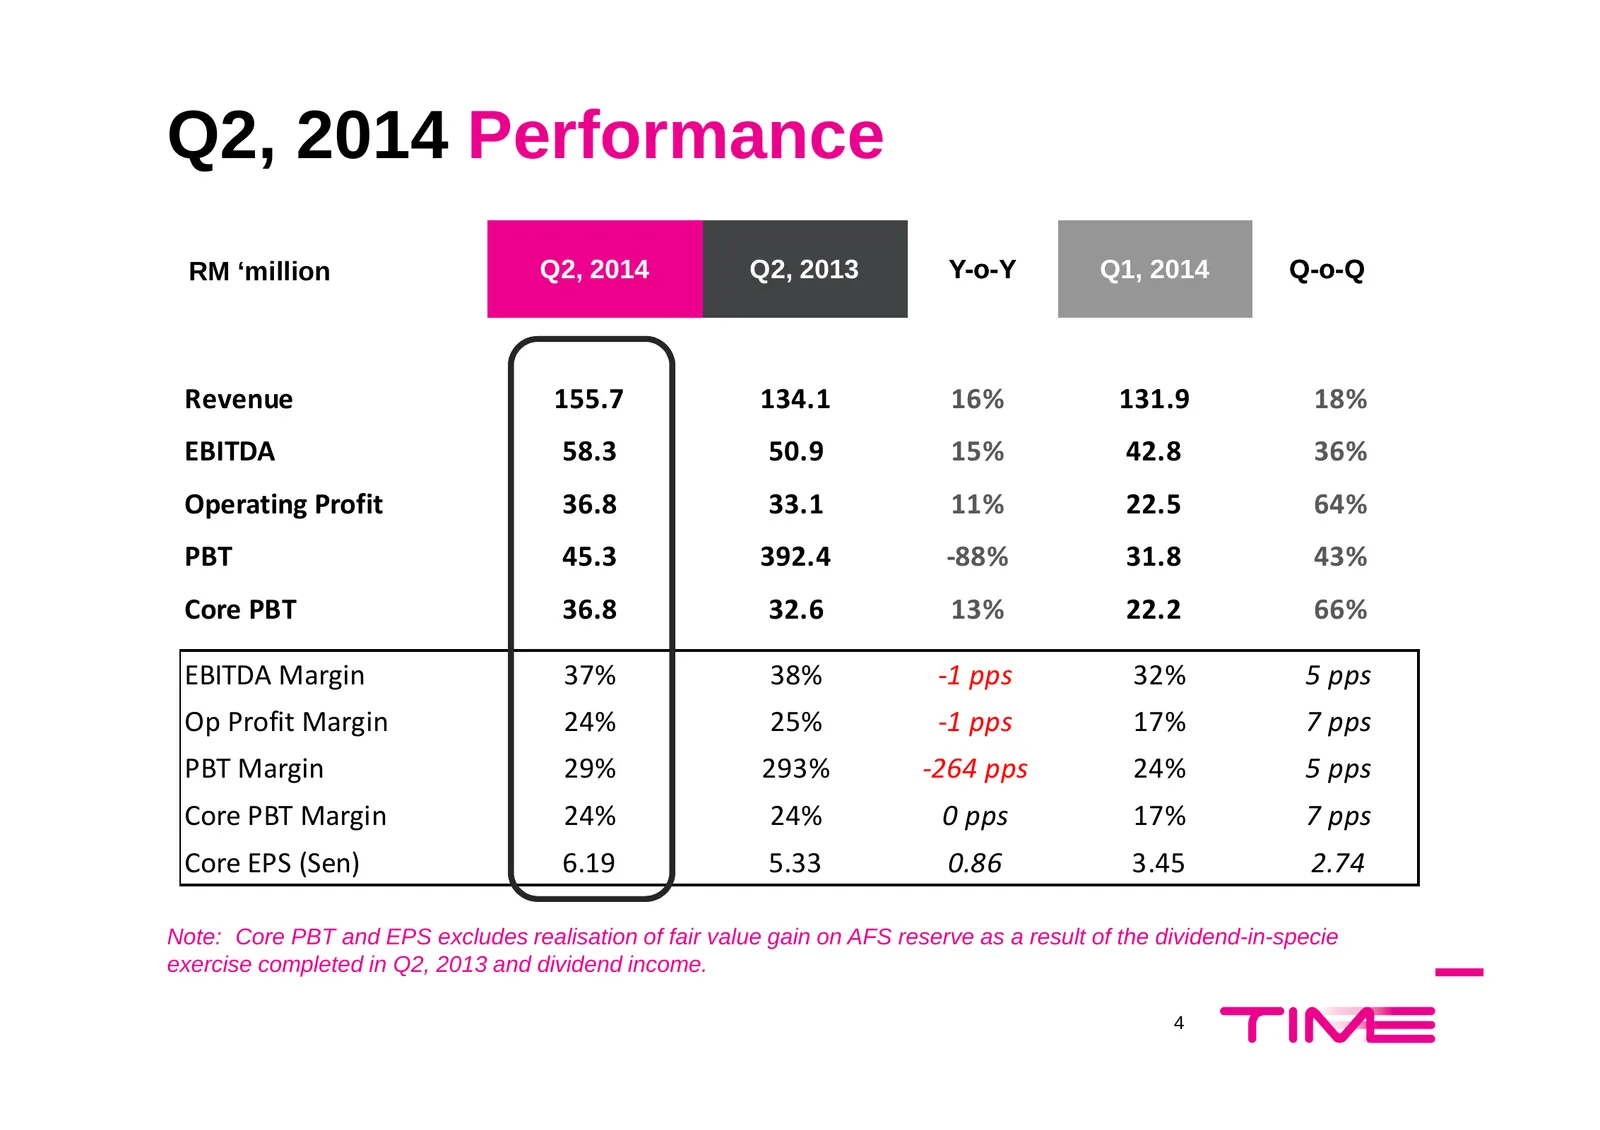
Q2, 2014 Performance RM ‘million Q2, 2014 Q2, 2013 Y-o-Y Q1, 2014 Q-o-Q Revenue 155.7 134.1 16% 131.9 18% EBITDA 58.3 50.9 15% 42.8 36% Operating Profit 36.8 33.1 11% 22.5 64% PBT 45.3 392.4 -88% 31.8 43% Core PBT 36.8 32.6 13% 22.2 66% EBITDA Margin 37% 38% -1 pps 32% 5 pps Op Profit Margin 24% 25%
Slide 6: YTD Jun, 2014 Performance
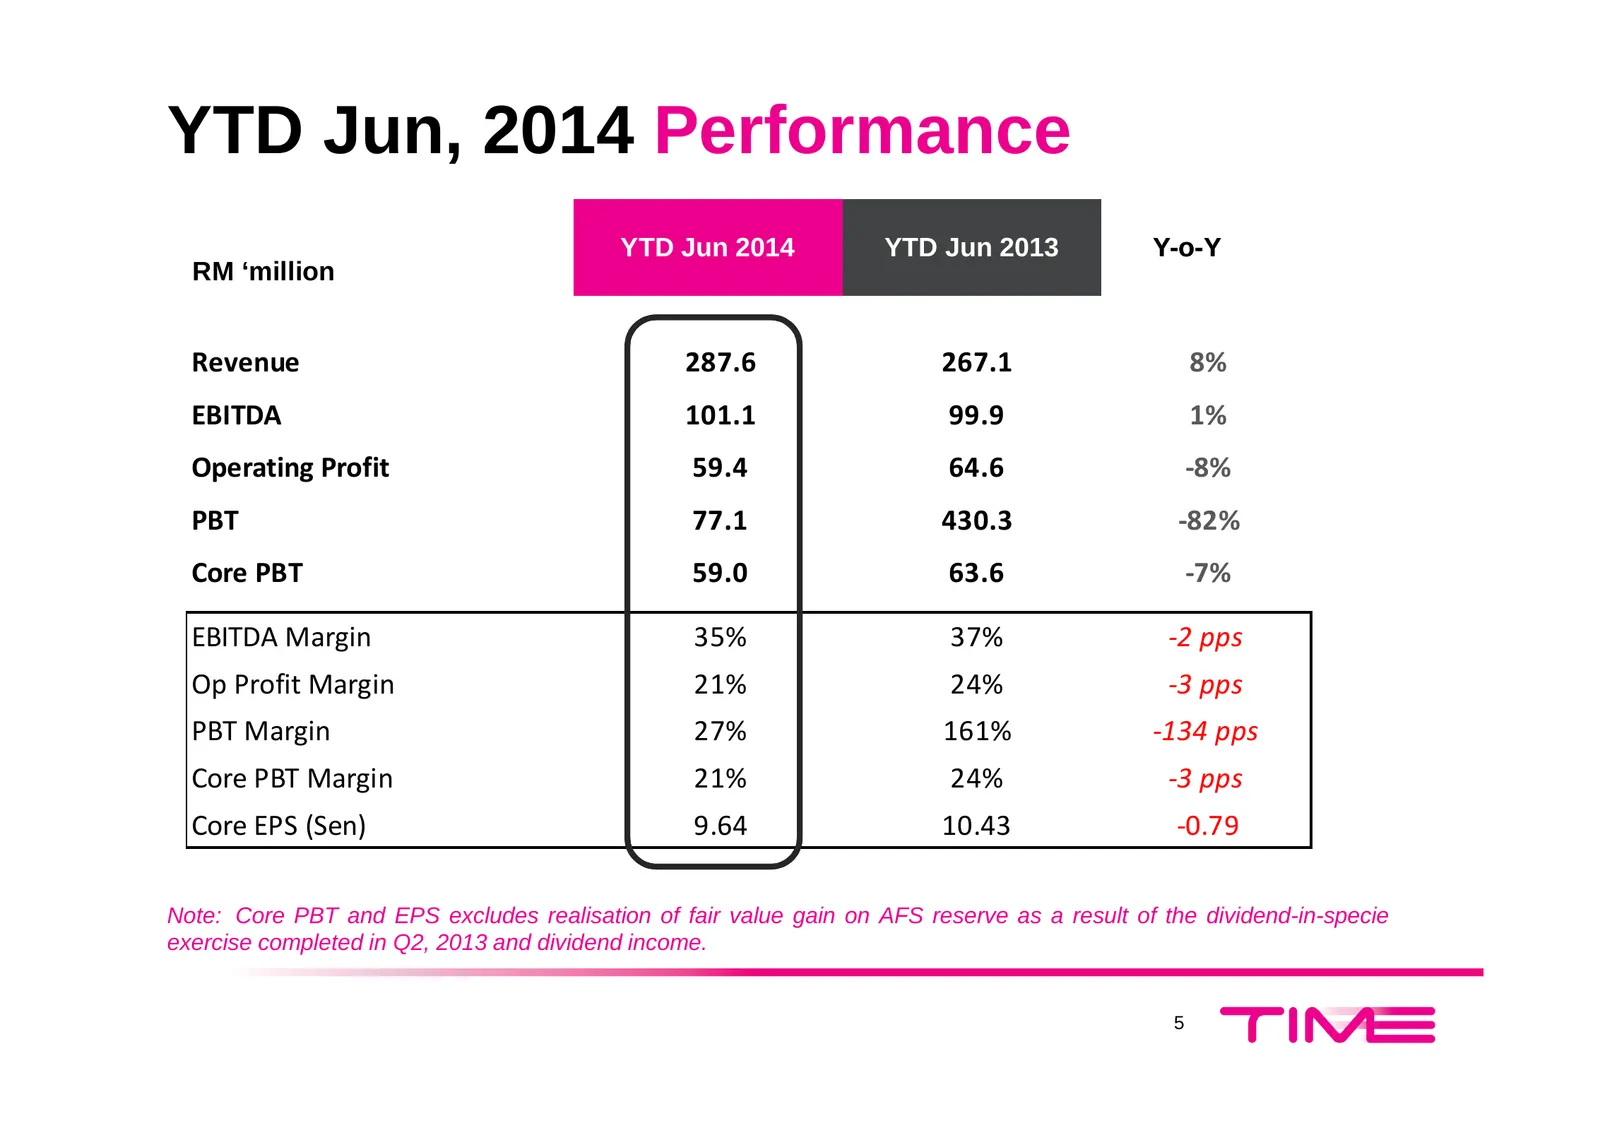
YTD Jun, 2014 Performance YTD Jun 2014 YTD Jun 2013 Y-o-Y RM ‘million Revenue 287.6 267.1 8% EBITDA 101.1 99.9 1% Operating Profit 59.4 64.6 -8% PBT 77.1 430.3 -82% Core PBT 59.0 63.6 -7% EBITDA Margin 35% 37% -2 pps Op Profit Margin 21% 24% -3 pps PBT Margin 27% 161% -134 pps Core PBT Margin 21% 24
Slide 7: Consolidated Revenue by Segment
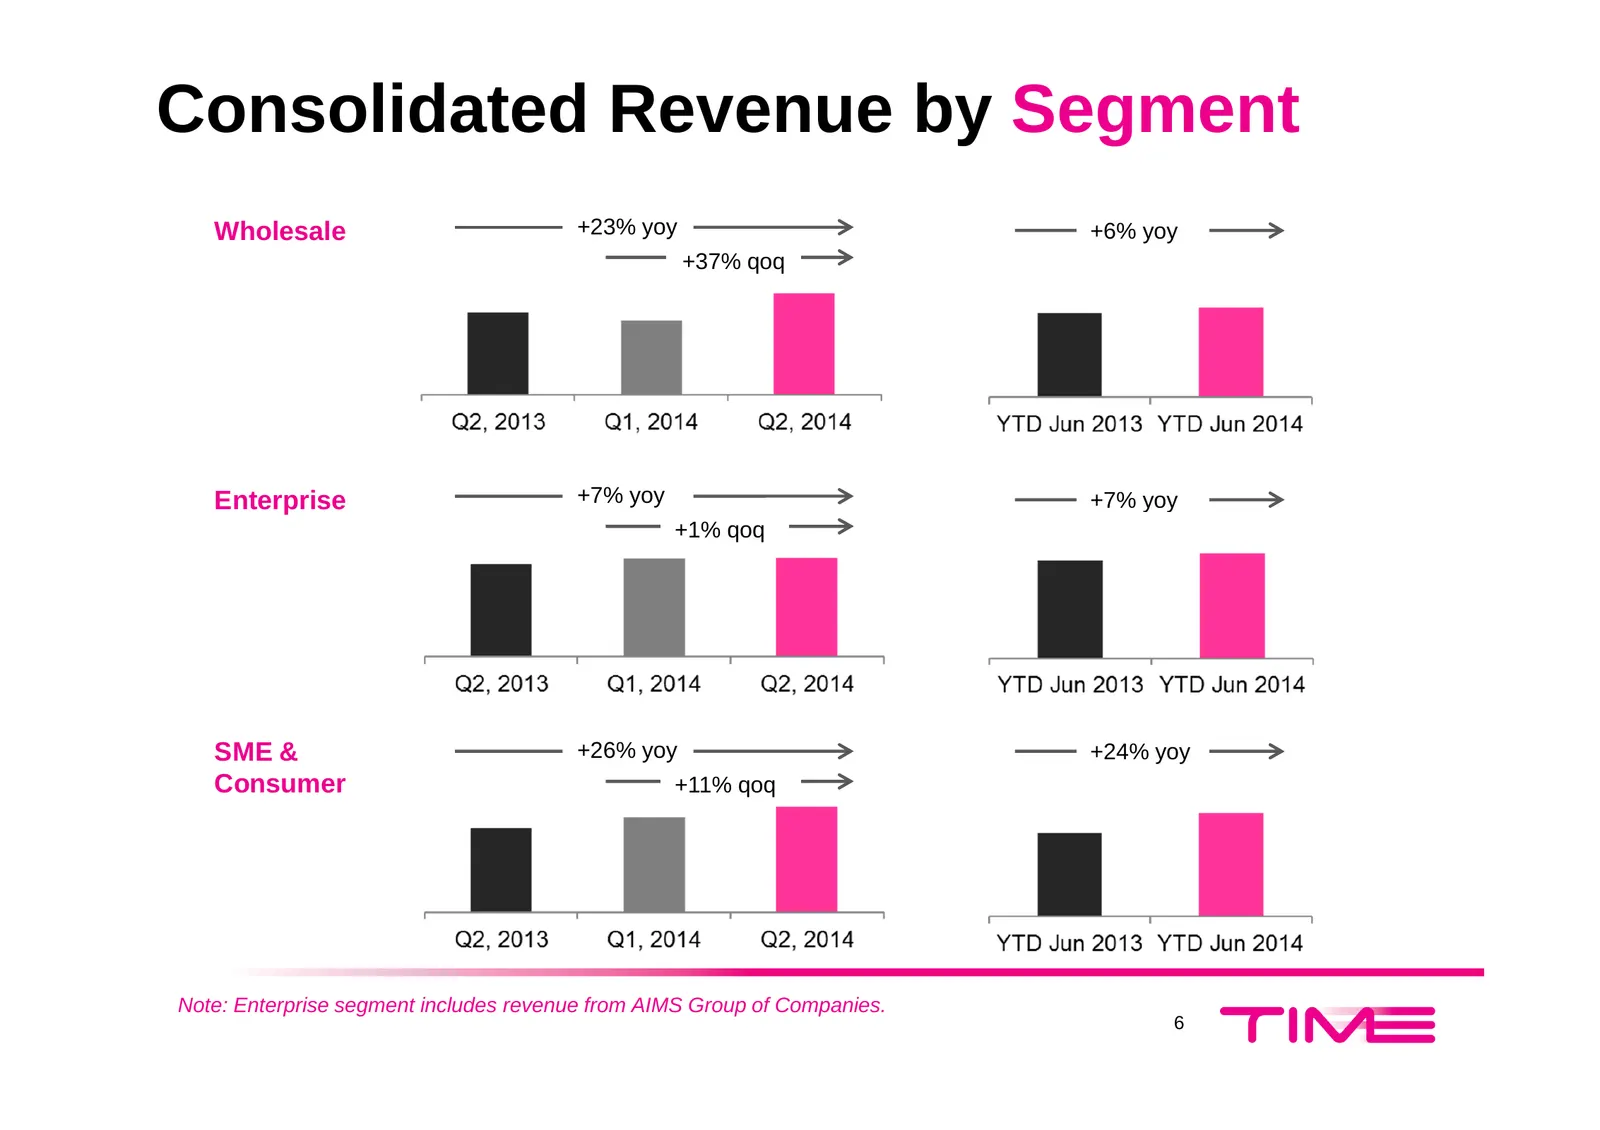
Consolidated Revenue by Segment Wholesale +23% yoy +6% yoy +37% qoq Enterprise +7% yoy +7% yoy +1% qoq SME & +26% yoy +24% yoy Consumer +11% qoq Note: Enterprise segment includes revenue from AIMS Group of Companies. 6
Slide 8: Consolidated Revenue by Product
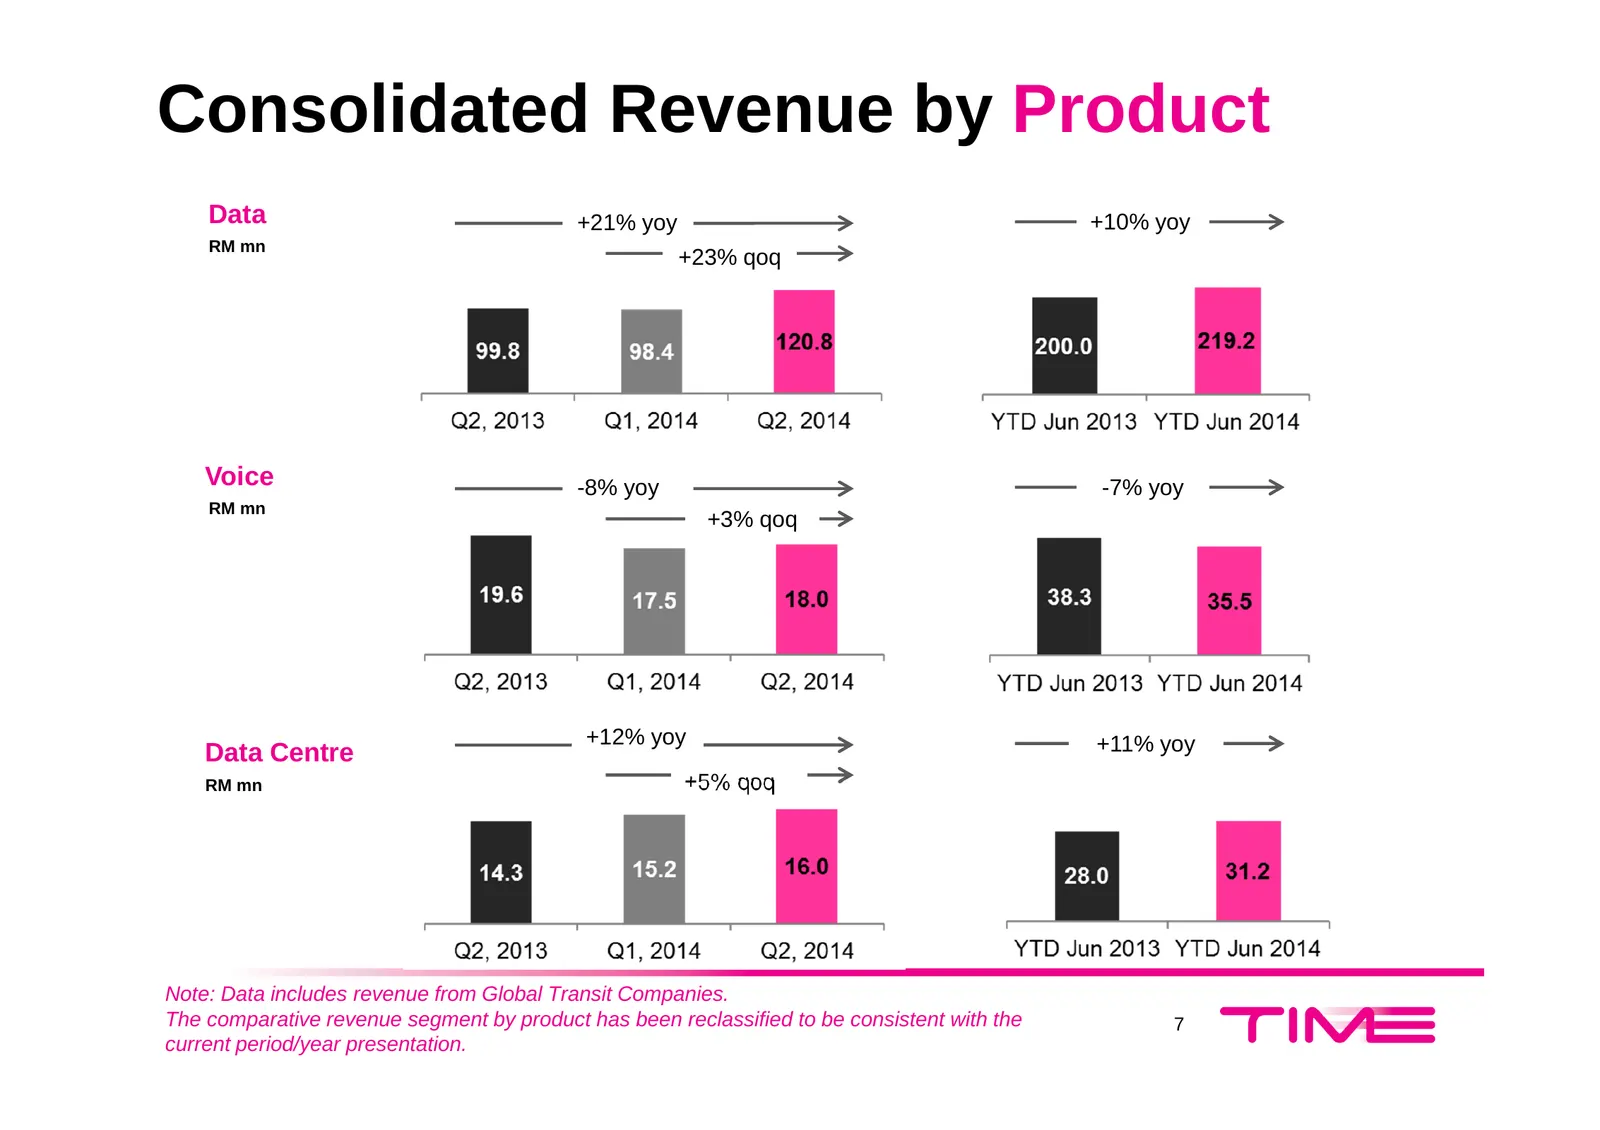
Consolidated Revenue by Product Data +21% yoy +10% yoy RM mn +23% qoq Voice -8% yoy -7% yoy RM mn +3% qoq +12% yoy +11% yoy Data Centre RM mn +5% qoq Note: Data includes revenue from Global Transit Companies. The comparative revenue segment by product has been reclassified to be consistent with the
Slide 9: Consolidated Cost % of Revenue
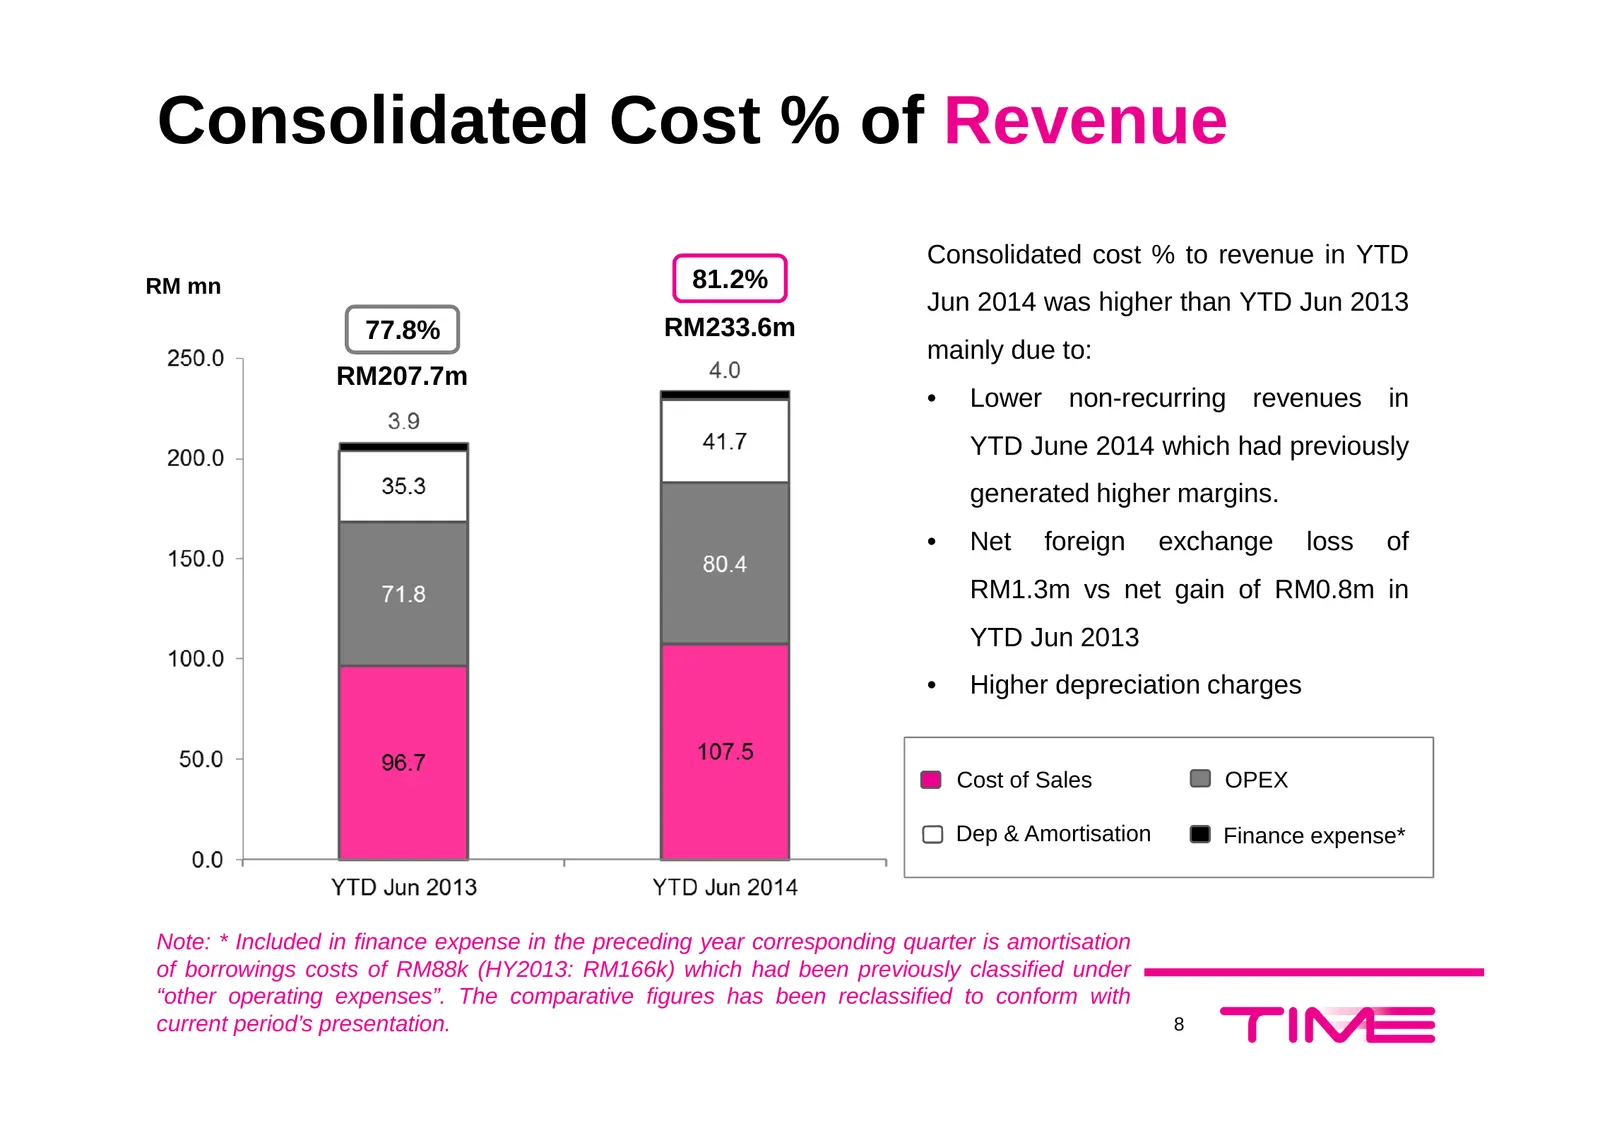
Consolidated Cost % of Revenue Consolidated cost % to revenue in YTD RM mn 81.2% Jun 2014 was higher than YTD Jun 2013 77.8% RM233.6m mainly due to: RM207.7m • Lower non-recurring revenues in YTD June 2014 which had previously generated higher margins. • Net foreign exchange loss of RM1.3m vs net ga
Slide 10: Group Capital Expenditure
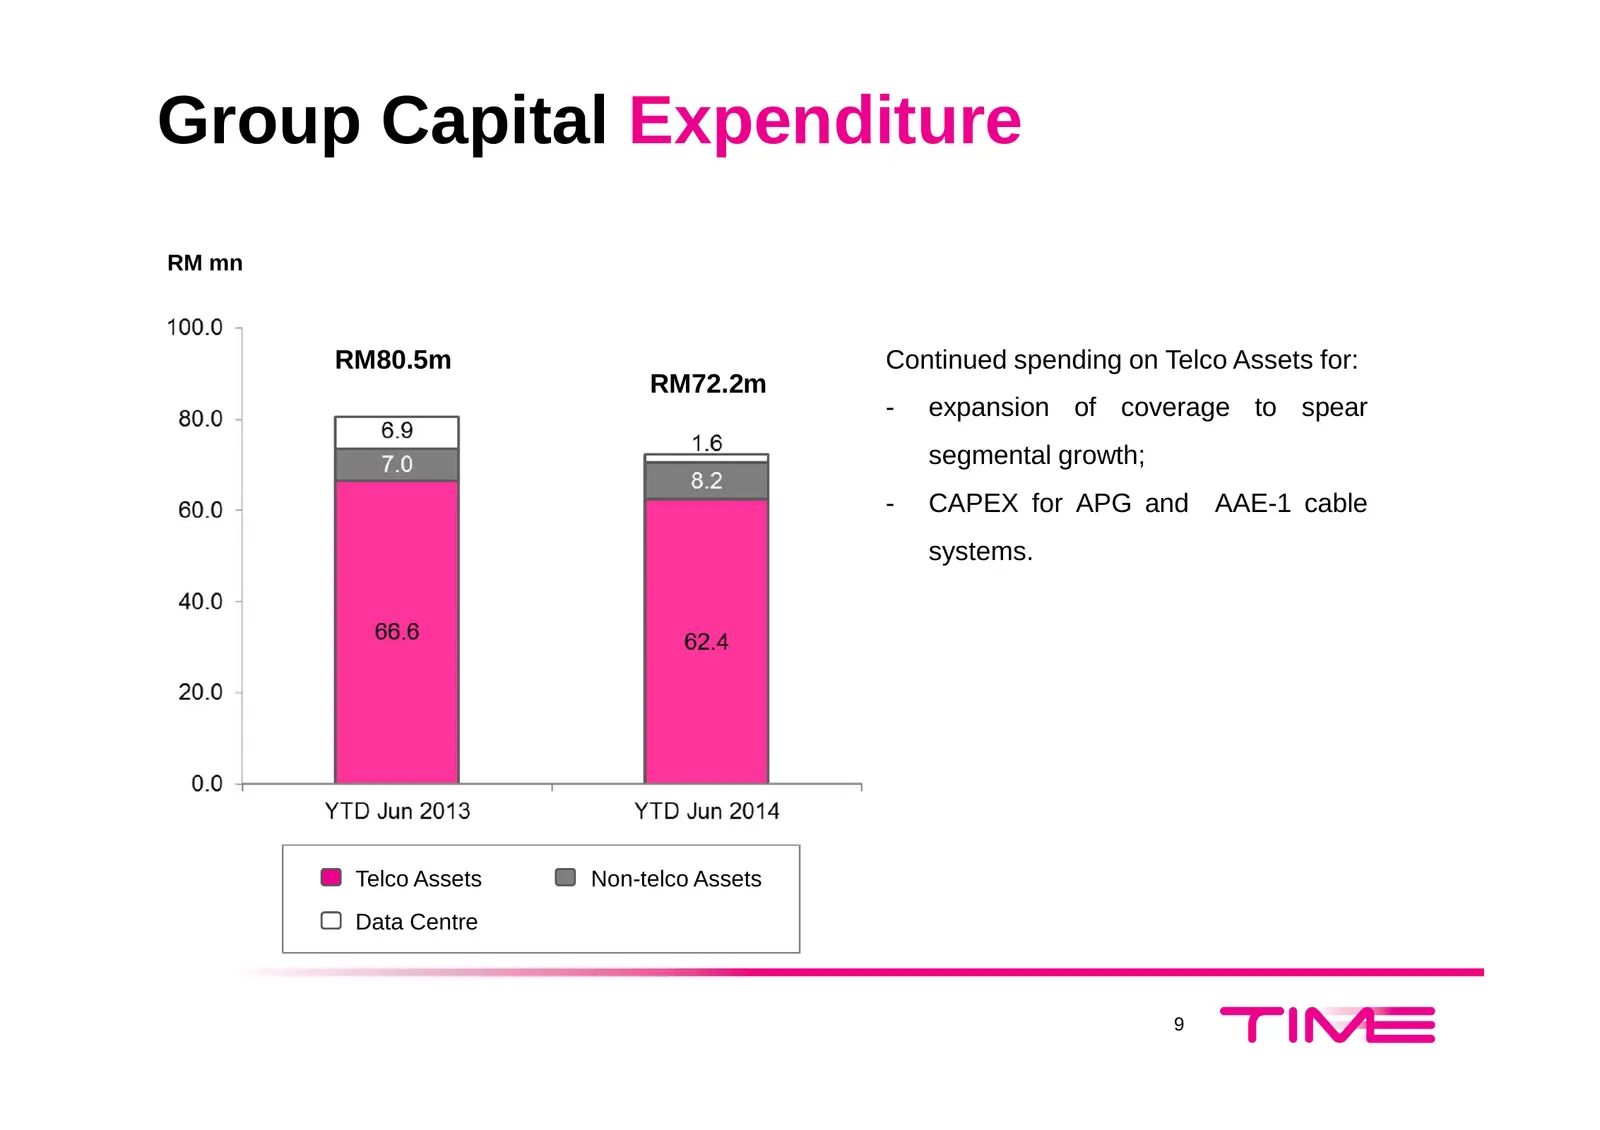
Group Capital Expenditure RM mn RM80.5m Continued spending on Telco Assets for: RM72.2m - expansion of coverage to spear segmental growth; - CAPEX for APG and AAE-1 cable systems. Telco Assets Non-telco Assets Data Centre 9
Slide 11: Corporate updates and remaining year expectations
Corporate updates • TIME dotCom Berhad announced its participation in FASTER cable system (“FASTER”) on 11 August 2014, via the signing of the Joint Build Agreement with the FASTER’s consortium members. It’s the Group’s second Trans-Pacific submarine cable system that will connect Asia and North Ame
Slide 12: Thank You
Thank You Should you have any queries, please contact:: investor.relations@time.com.my TIME dotCom Berhad No.14, Jalan Majistret U1/26, Hicom Glenmarie Industrial Park, 40150 Shah Alam, Selangor, MALAYSIA Tel: +603-5032 6000 I Fax: +603-5032 6100 I www.time.com.my 11
Source: Internet Archive copy of time.com.my