Ares Commercial Real Estate Corporation · NYSE:ACRE
Ares Commercial Real Estate — Q2 2024 Earnings Presentation
23 slides from Ares Commercial Real Estate's earnings presentation, Aug 6, 2024
Slide 1: Second Quarter 2024 Earnings Presentation
Exhibit 99.2 Second Quarter 2024 Earnings Presentation Confidential – Not for Publication or Distribution
Slide 2: Disclaimer
Disclaimer Statements included herein may constitute “forward-looking statements” within the meaning of the Private Securities Litigation Reform Act of 1995 and Section 21E of the Securities Exchange Act of 1934, as amended, which may relate to future events or the future performance or financial co
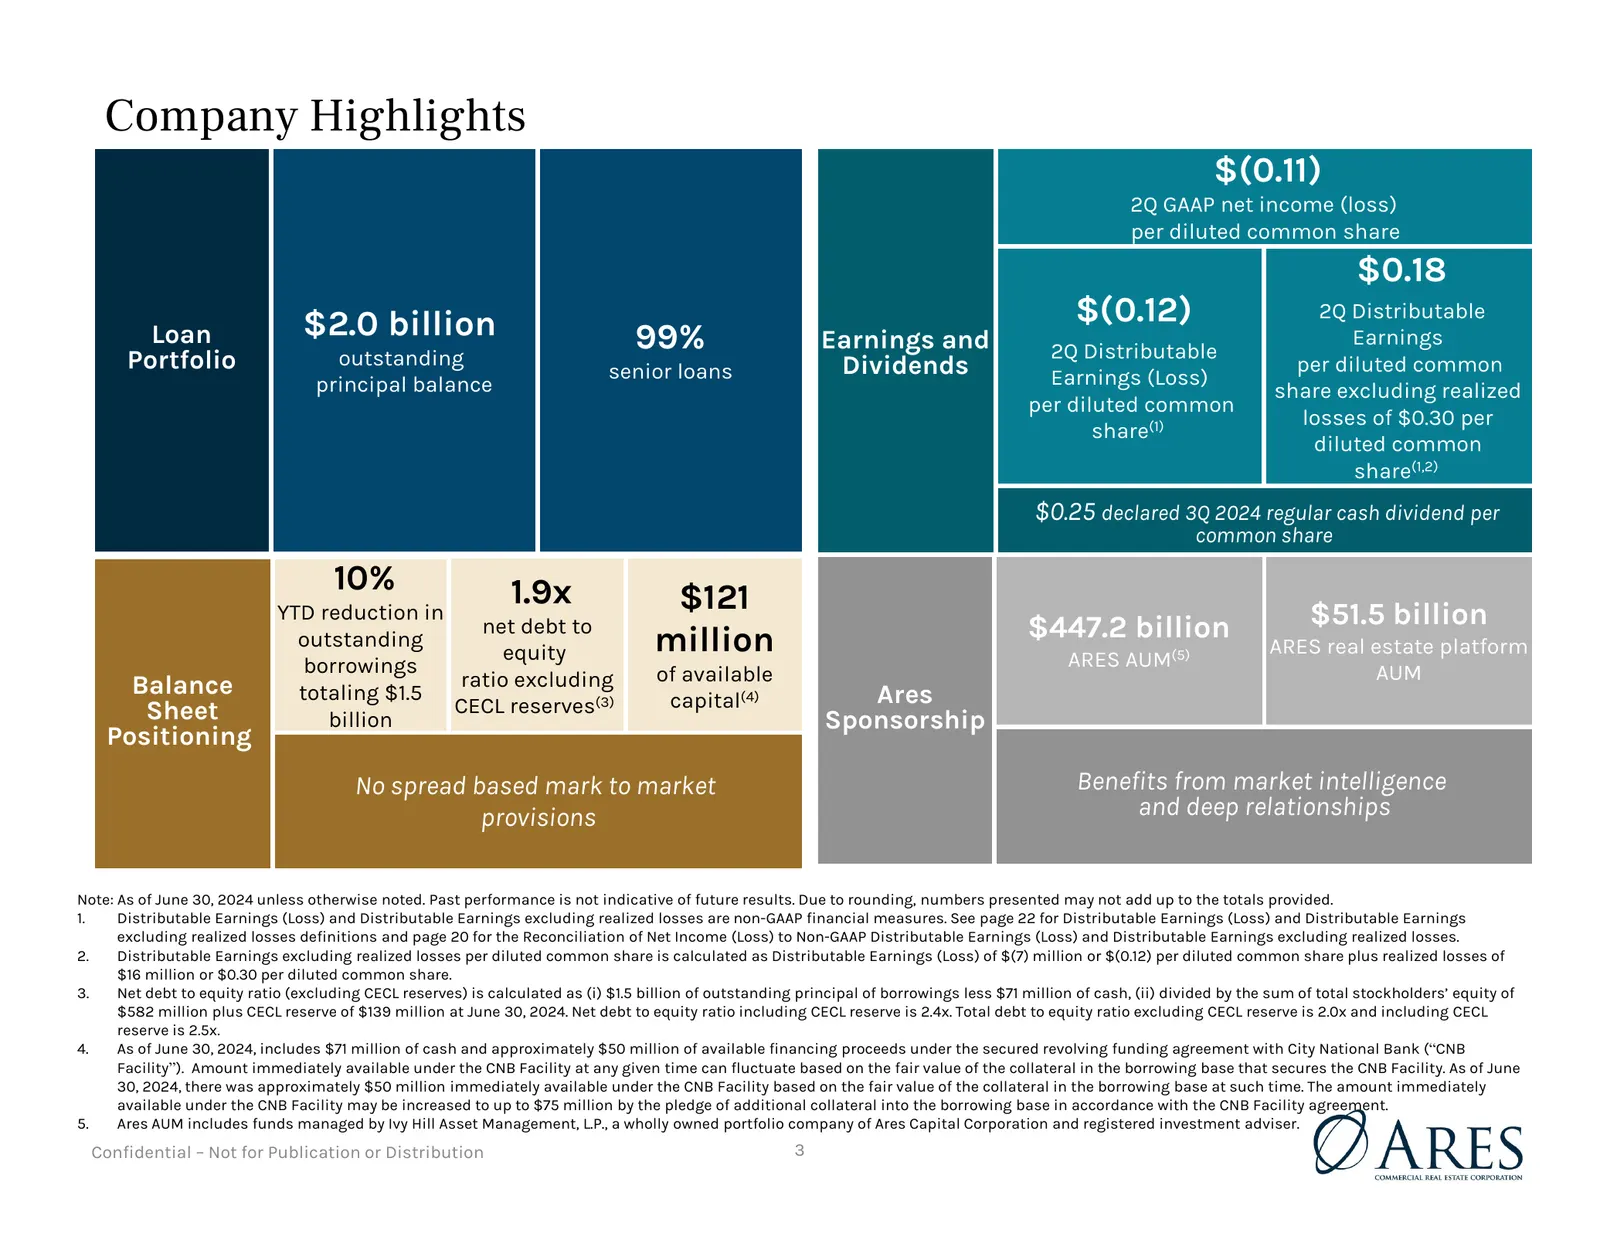
Slide 3: Company Highlights
Company Highlights $(0.11) 2Q GAAP net income (loss) per diluted common share $0.18 $2.0 billion $(0.12) 2Q Distributable Loan 99% Earnings and 2Q Distributable Earnings Portfolio outstanding senior loans Dividends per diluted common principal balance Earnings (Loss) share excluding realized per dil
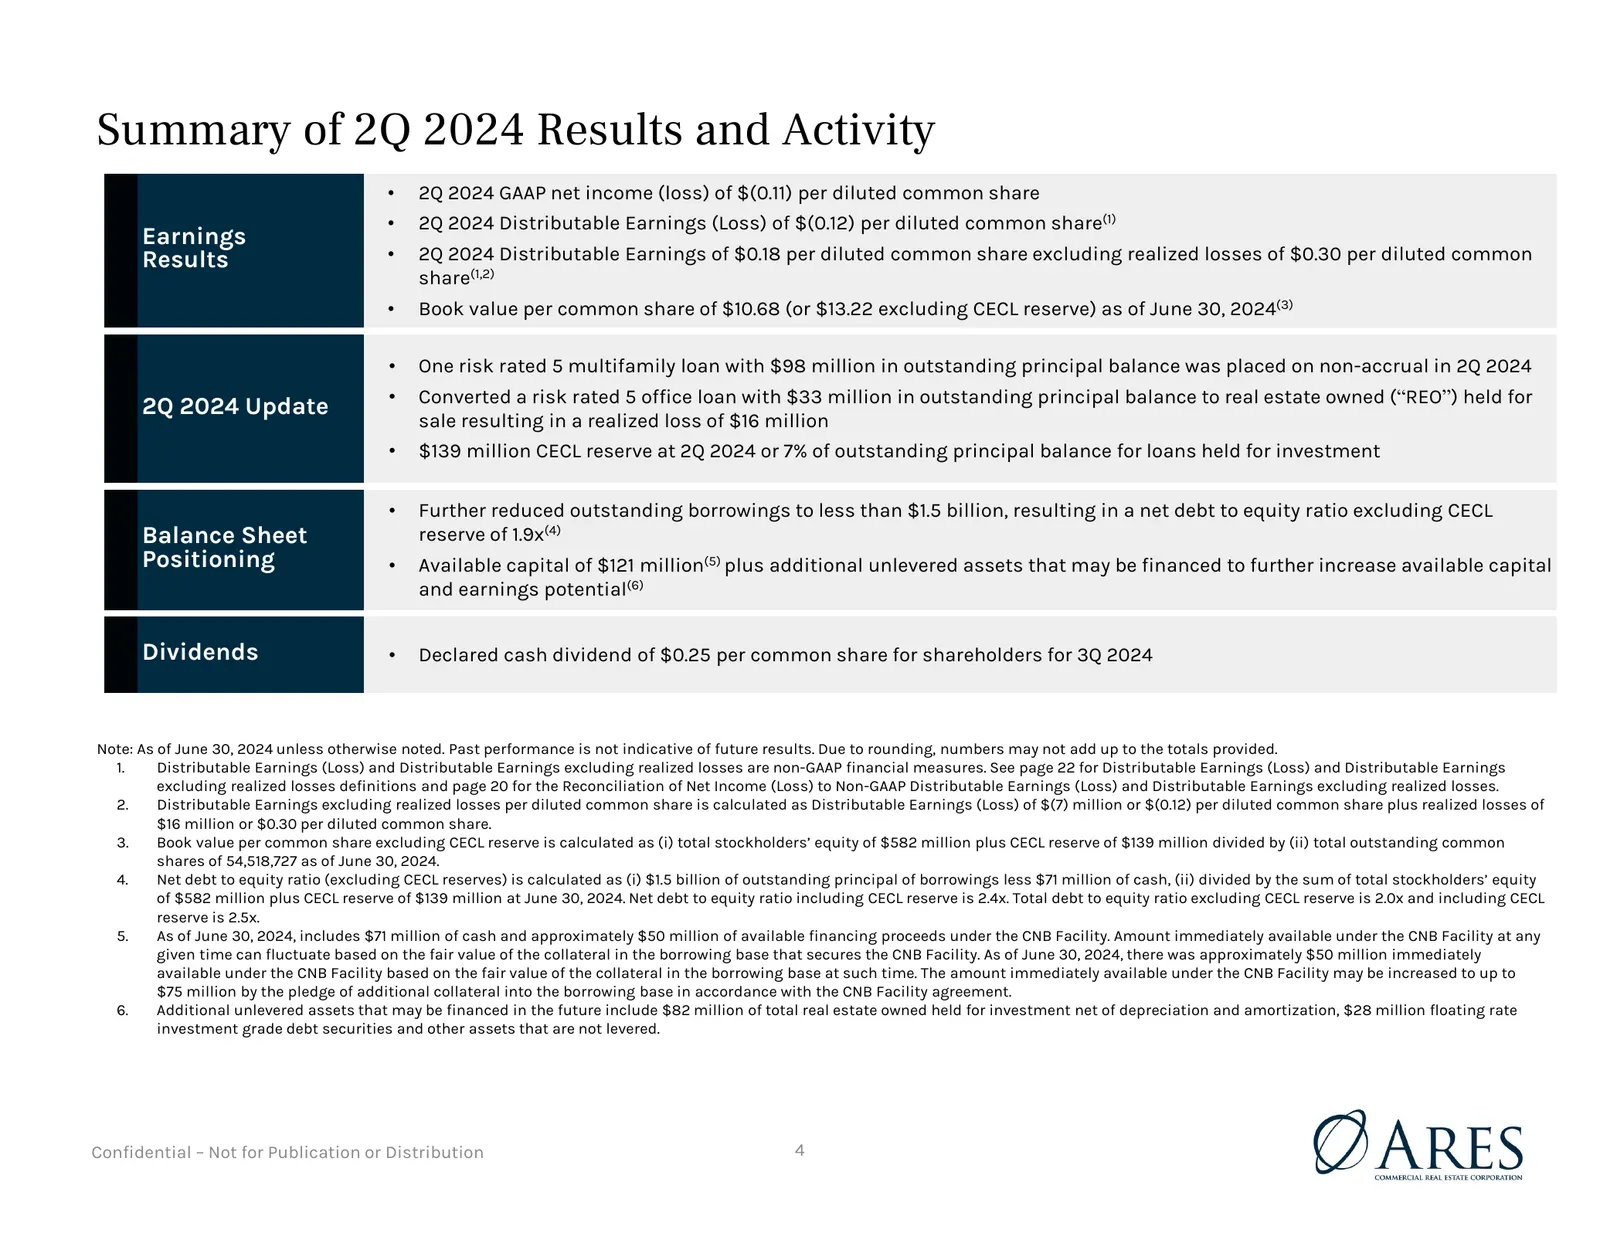
Slide 4: Summary of 2Q 2024 Results and Activity
Summary of 2Q 2024 Results and Activity • 2Q 2024 GAAP net income (loss) of $(0.11) per diluted common share • 2Q 2024 Distributable Earnings (Loss) of $(0.12) per diluted common share(1) Earnings Results • 2Q 2024 Distributable Earnings of $0.18 per diluted common share excluding realized losses of
Slide 5: Portfolio Overview
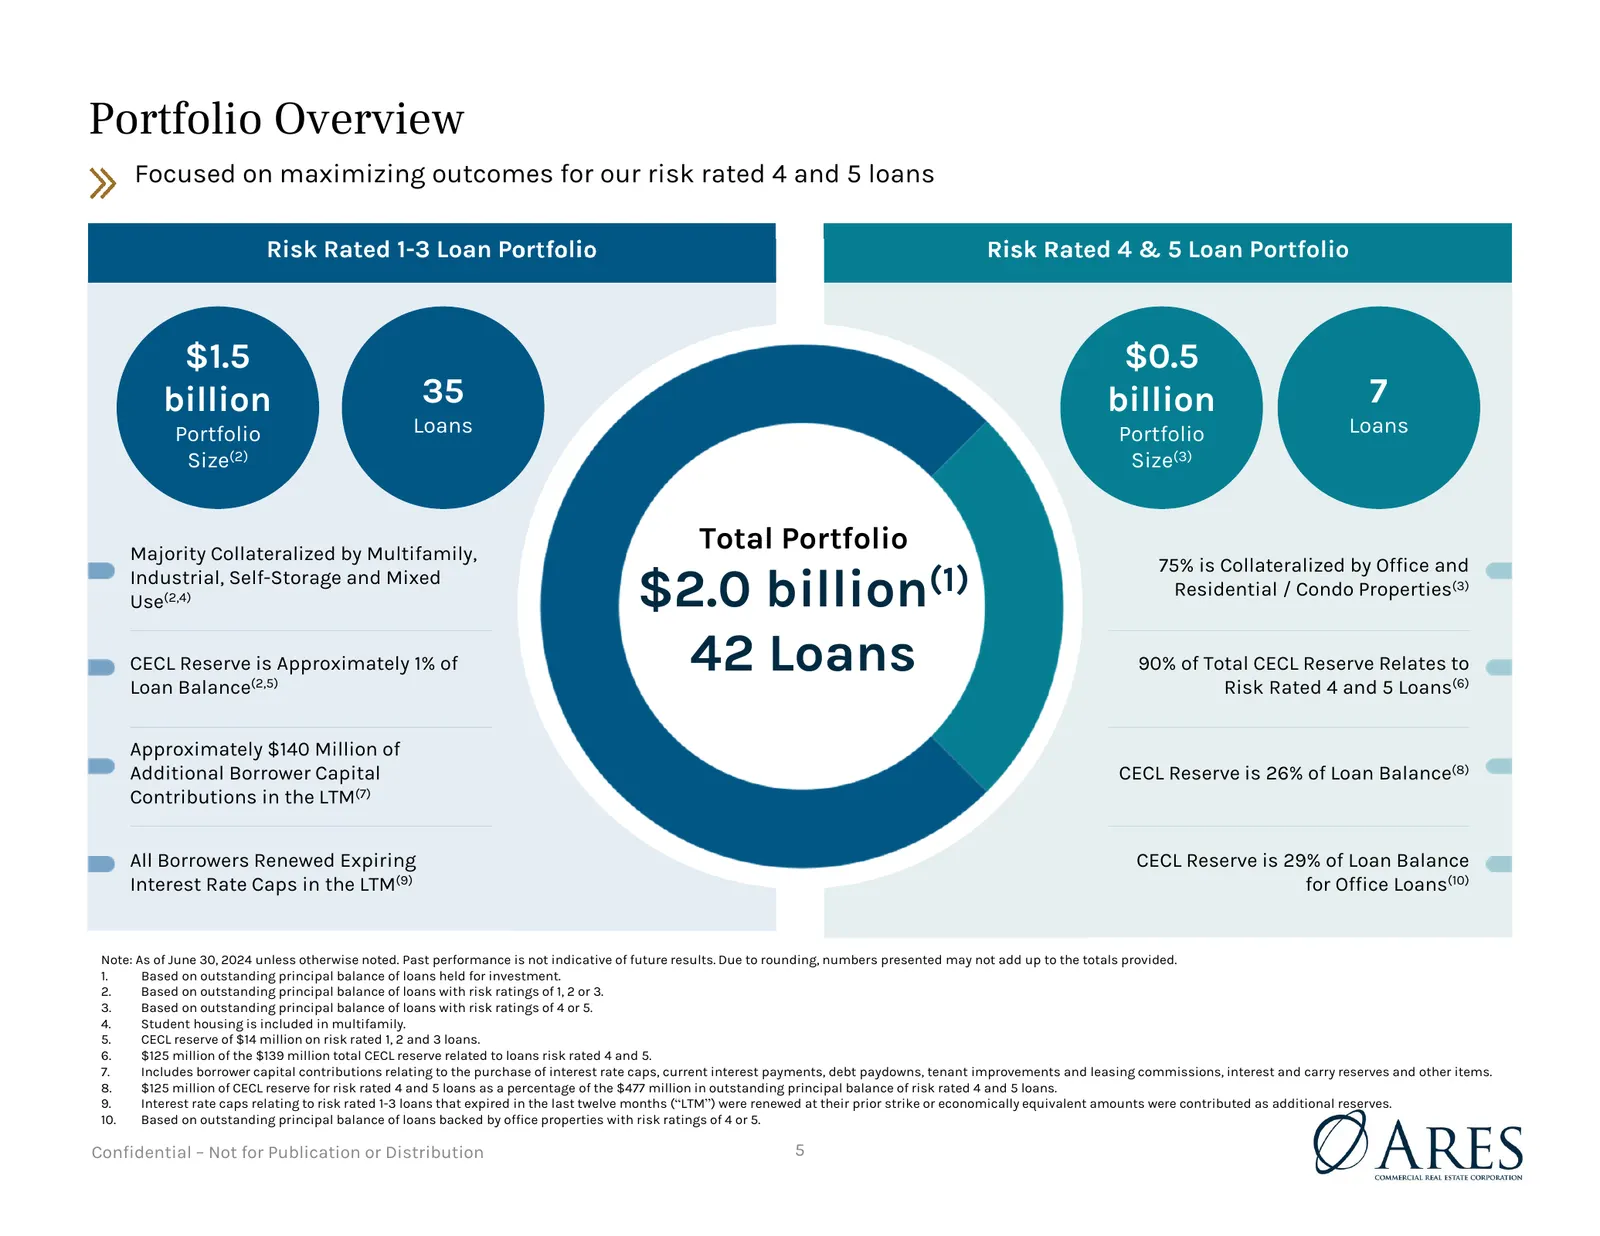
Portfolio Overview Focused on maximizing outcomes for our risk rated 4 and 5 loans Risk Rated 1-3 Loan Portfolio Risk Rated 4 & 5 Loan Portfolio $1.5 $0.5 billion 35 billion 7 Portfolio Loans Portfolio Loans Size(2) Size(3) Majority Collateralized by Multifamily, Total Portfolio 75% is Collateralize
Slide 6: Ares Management
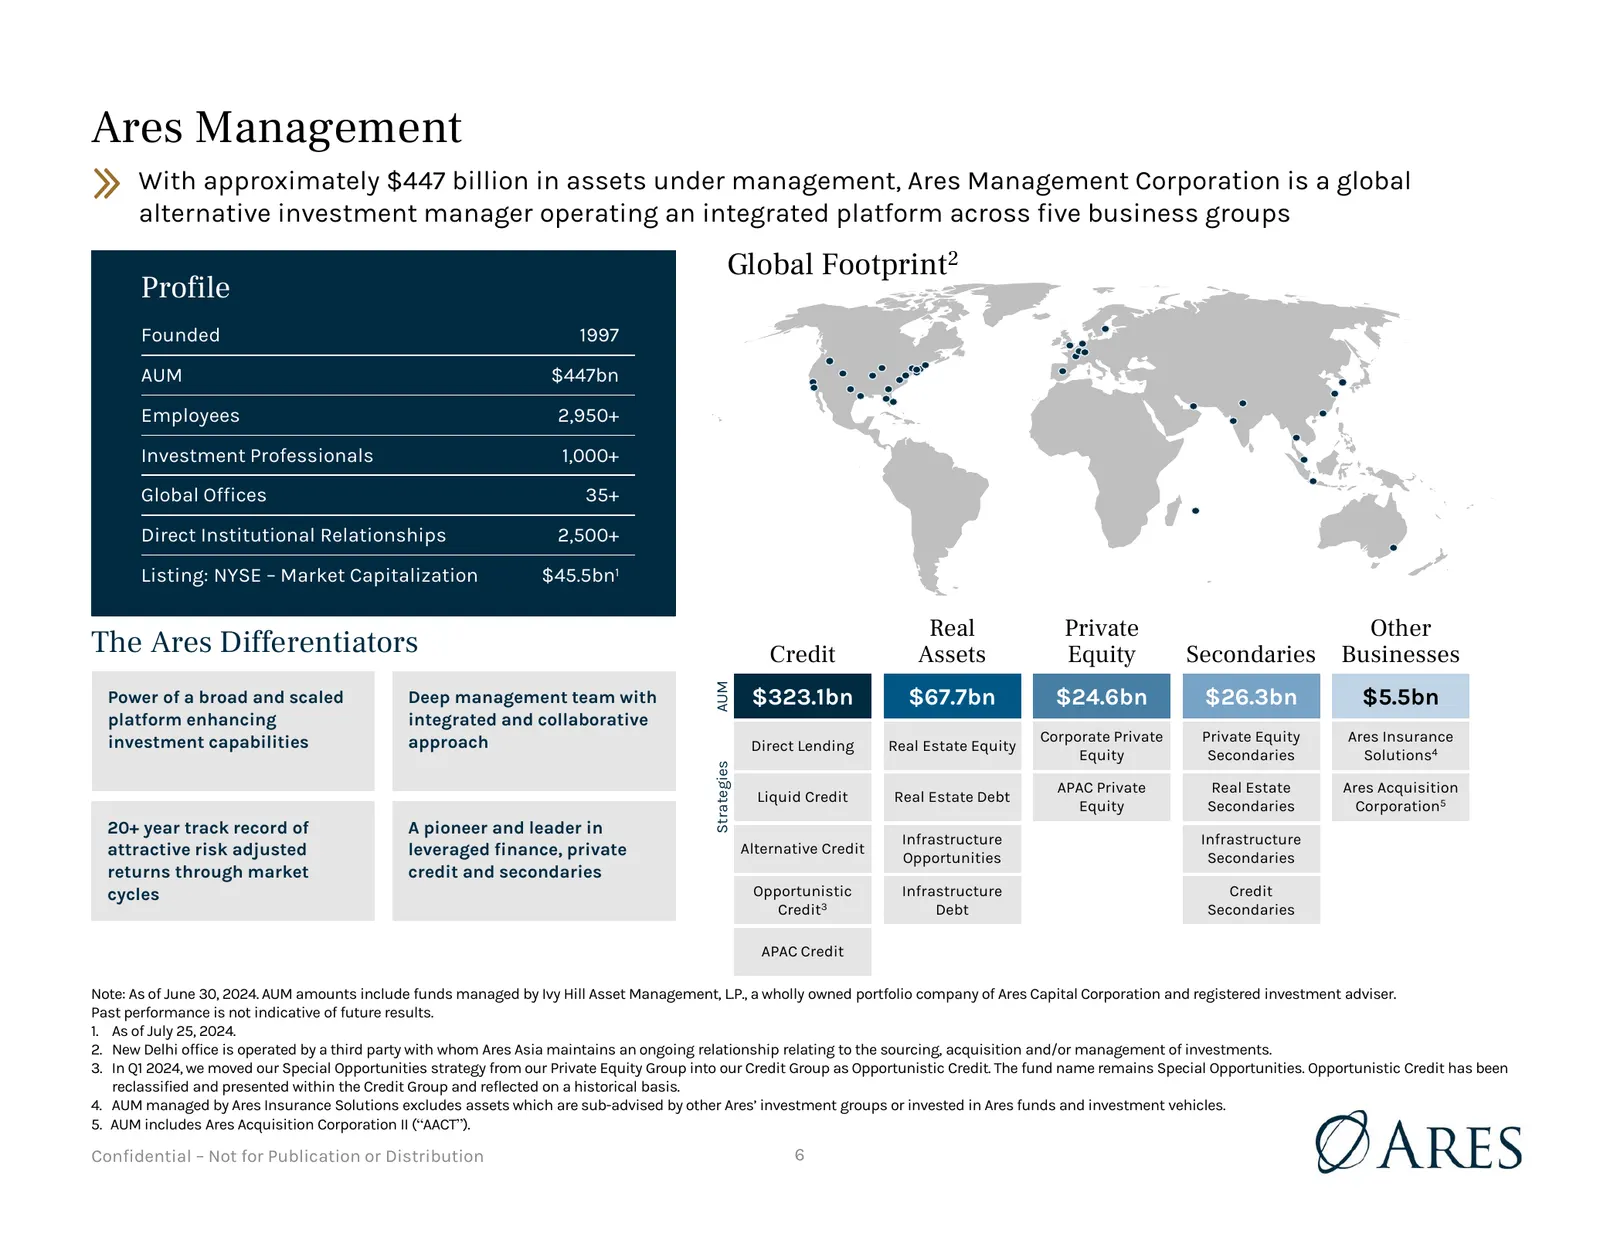
Ares Management With approximately $447 billion in assets under management, Ares Management Corporation is a global alternative investment manager operating an integrated platform across five business groups Global Footprint2 Profile Founded 1997 AUM $447bn Employees 2,950+ Investment Professionals
Slide 7: Ares Real Estate Group Capabilities
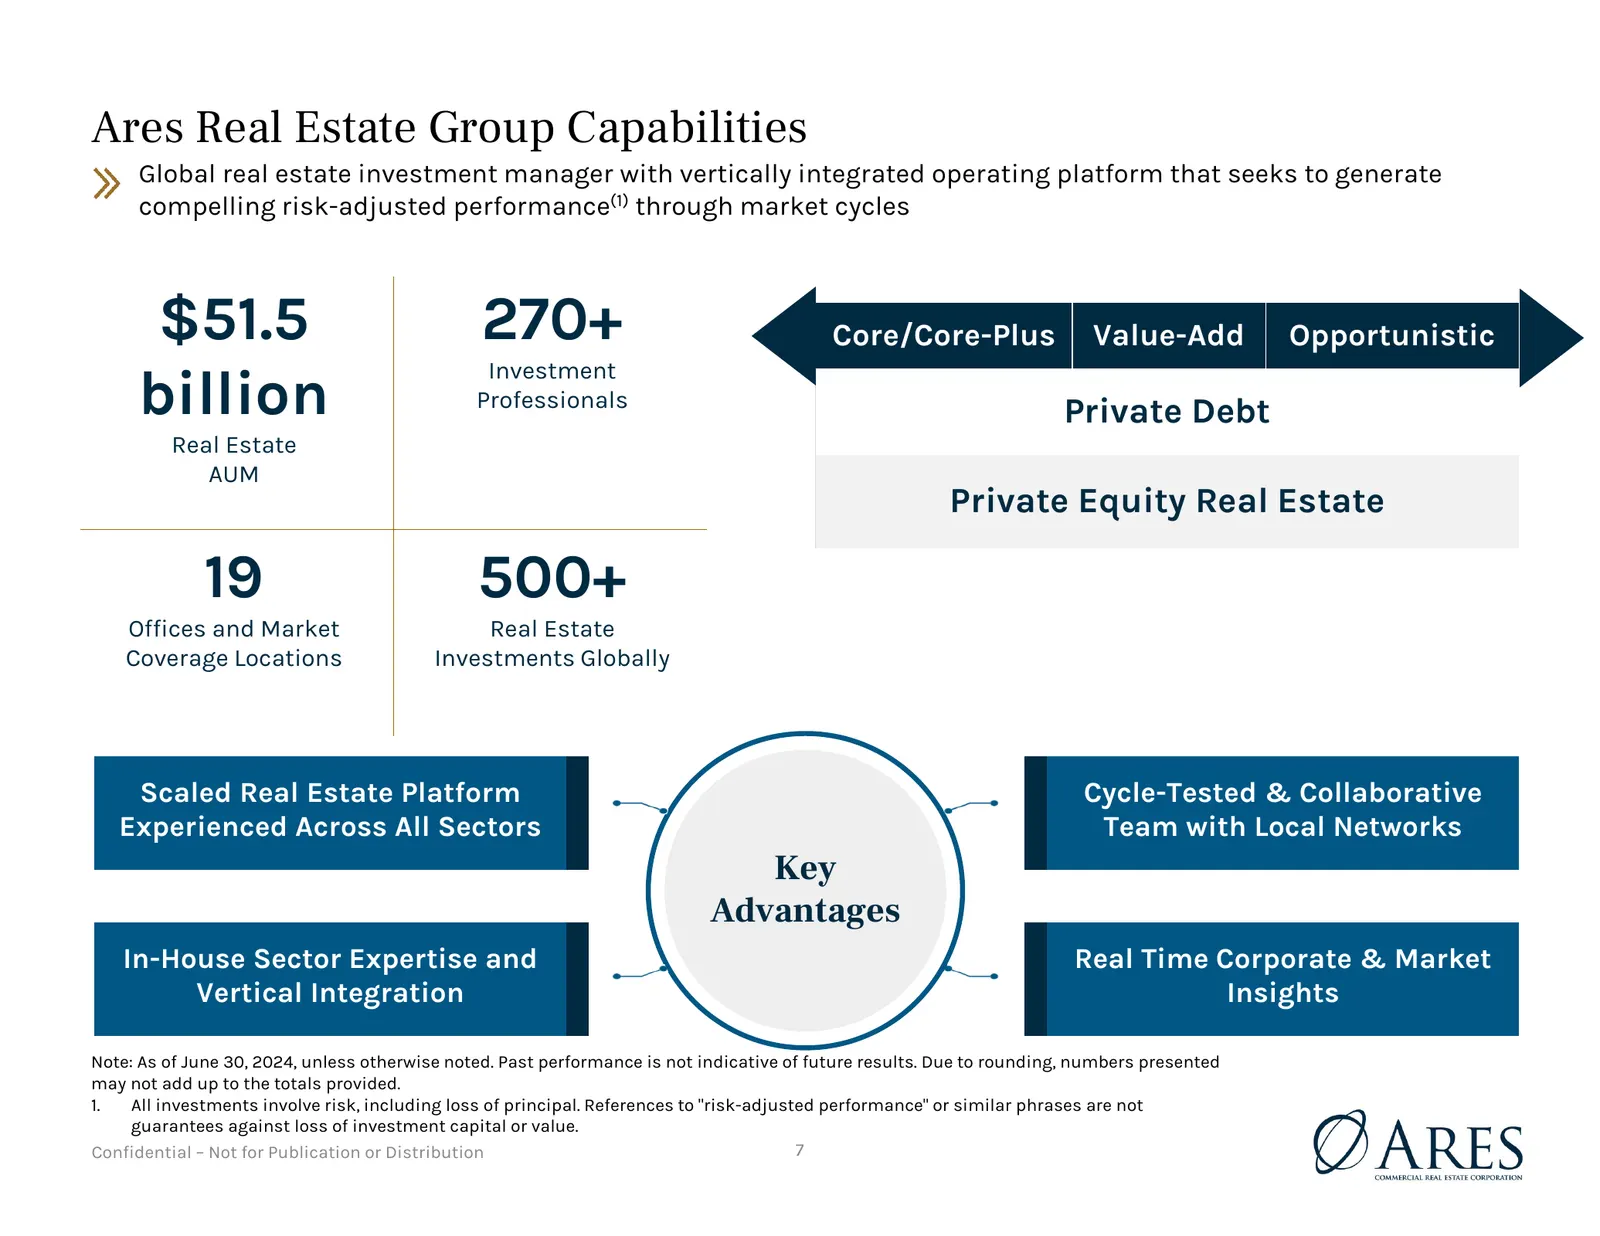
Ares Real Estate Group Capabilities Global real estate investment manager with vertically integrated operating platform that seeks to generate compelling risk-adjusted performance(1) through market cycles $51.5 270+ Core/Core-Plus Value-Add Opportunistic Investment billion Professionals Private Debt
Slide 8: Balance Sheet and Capital Position Provides Flexibility
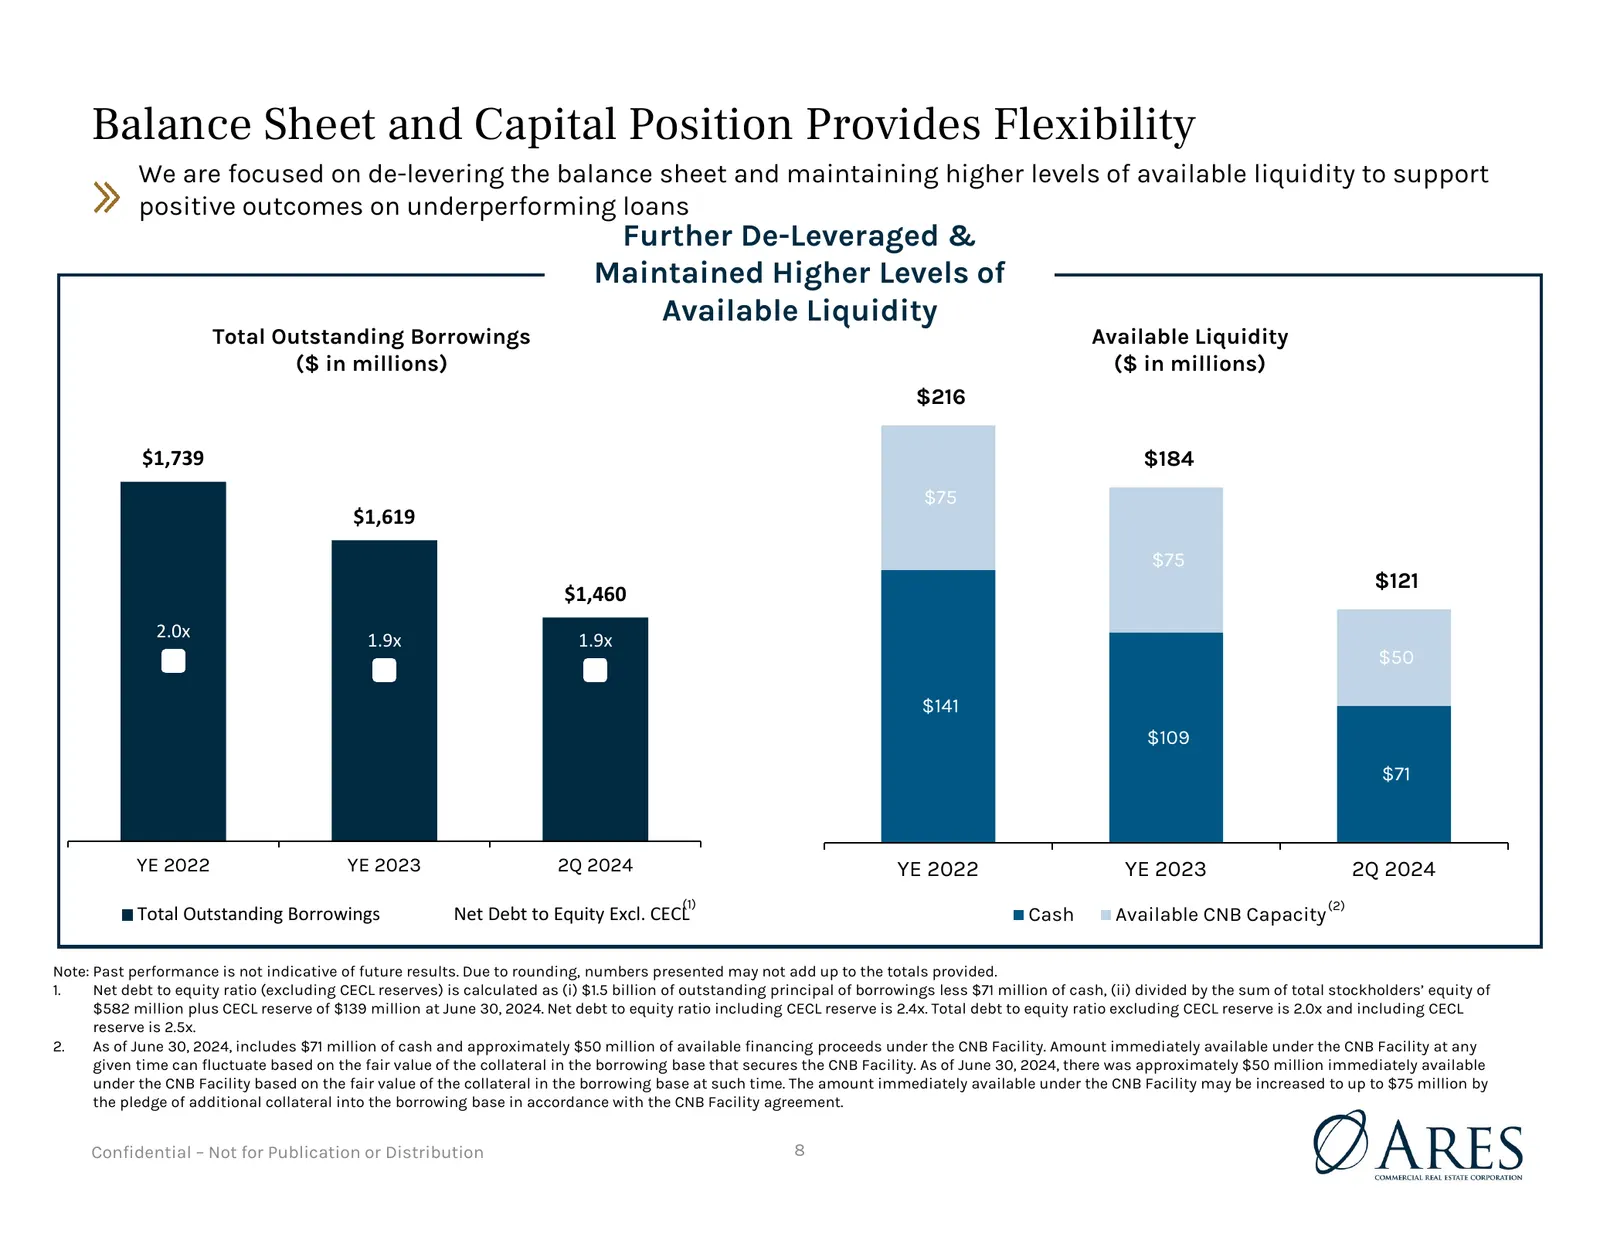
Balance Sheet and Capital Position Provides Flexibility We are focused on de-levering the balance sheet and maintaining higher levels of available liquidity to support positive outcomes on underperforming loans Further De-Leveraged & Maintained Higher Levels of Available Liquidity 1 Total Outstandin
Slide 9: Trends in CECL Reserves
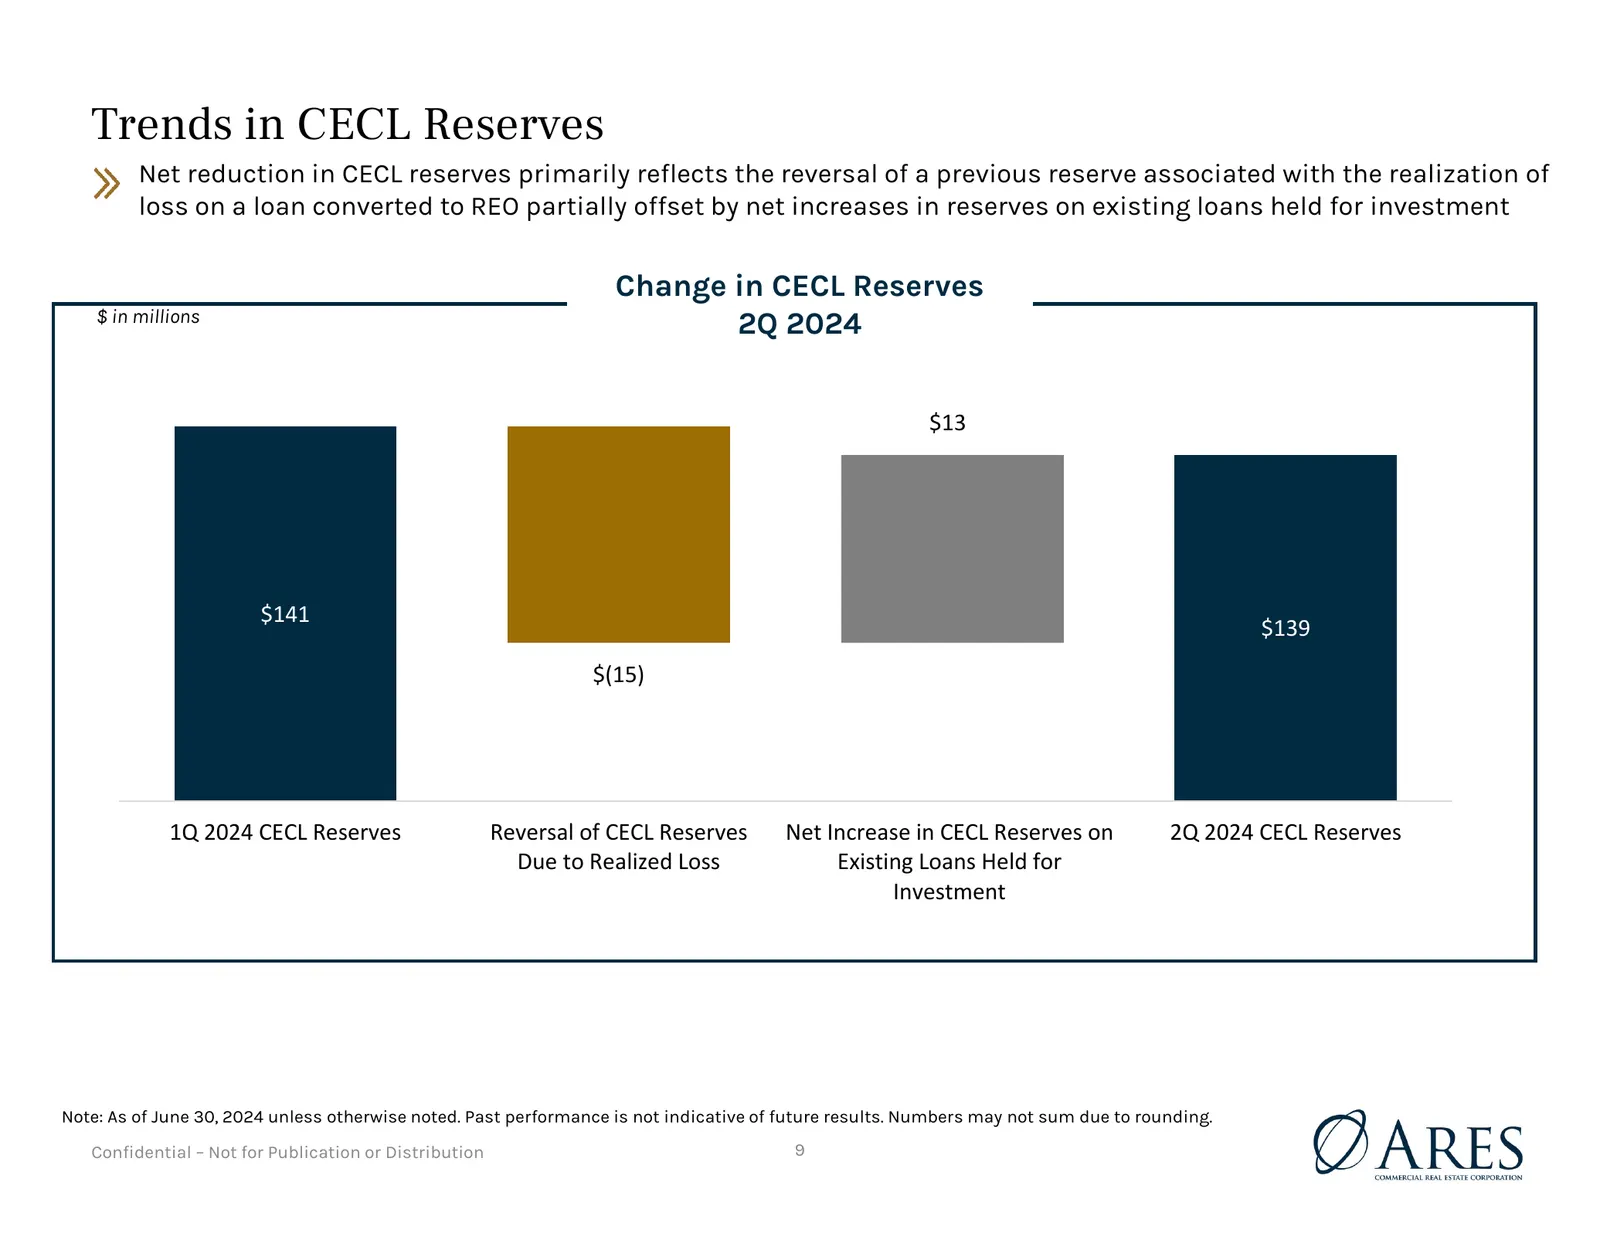
Trends in CECL Reserves Net reduction in CECL reserves primarily reflects the reversal of a previous reserve associated with the realization of loss on a loan converted to REO partially offset by net increases in reserves on existing loans held for investment Change in CECL Reserves $ in millions 2Q
Slide 10: Current Expected Credit Loss Reserves
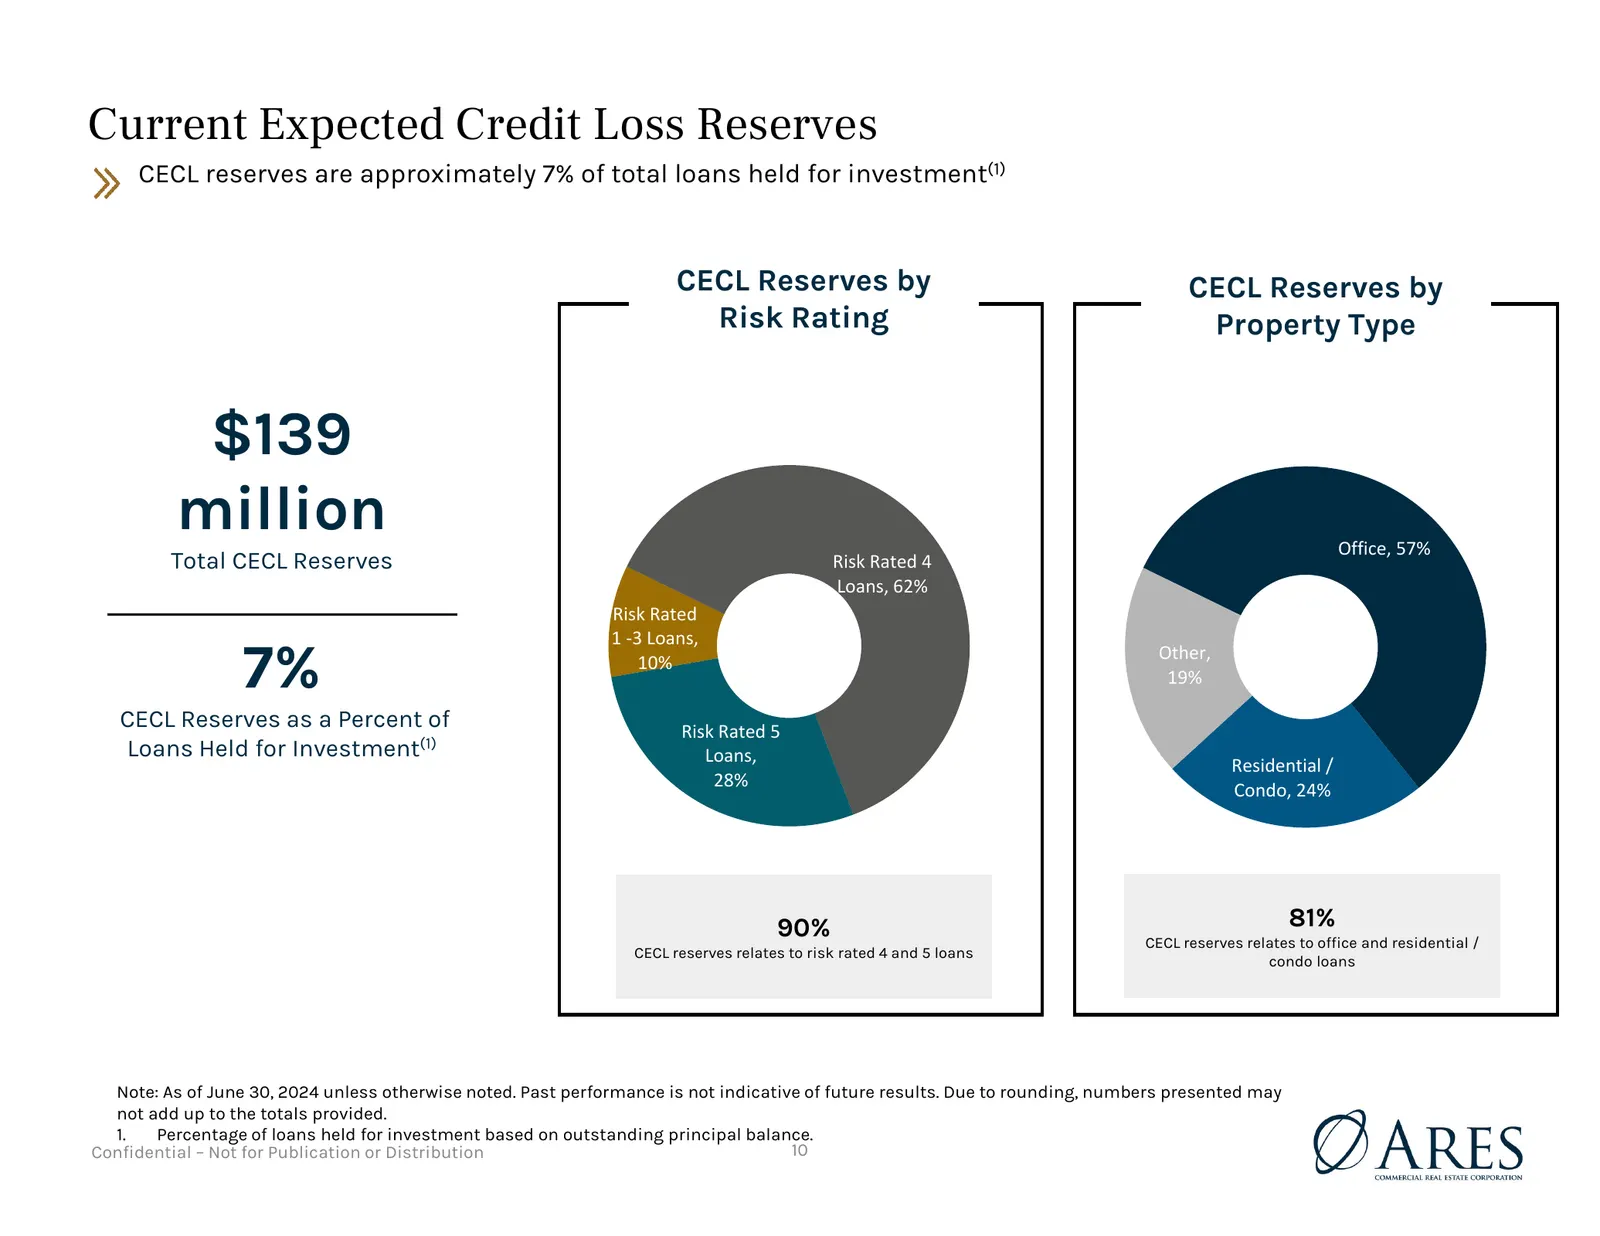
Current Expected Credit Loss Reserves CECL reserves are approximately 7% of total loans held for investment(1) CECL Reserves by CECL Reserves by Risk Rating Property Type $139 million Office, 57% Total CECL Reserves Risk Rated 4 Loans, 62% Risk Rated 1 ‐3 Loans, 7% 10% Other, 19% CECL Reserves as a
Slide 11: CECL Reserves for Risk Rated 4 and 5 Loans
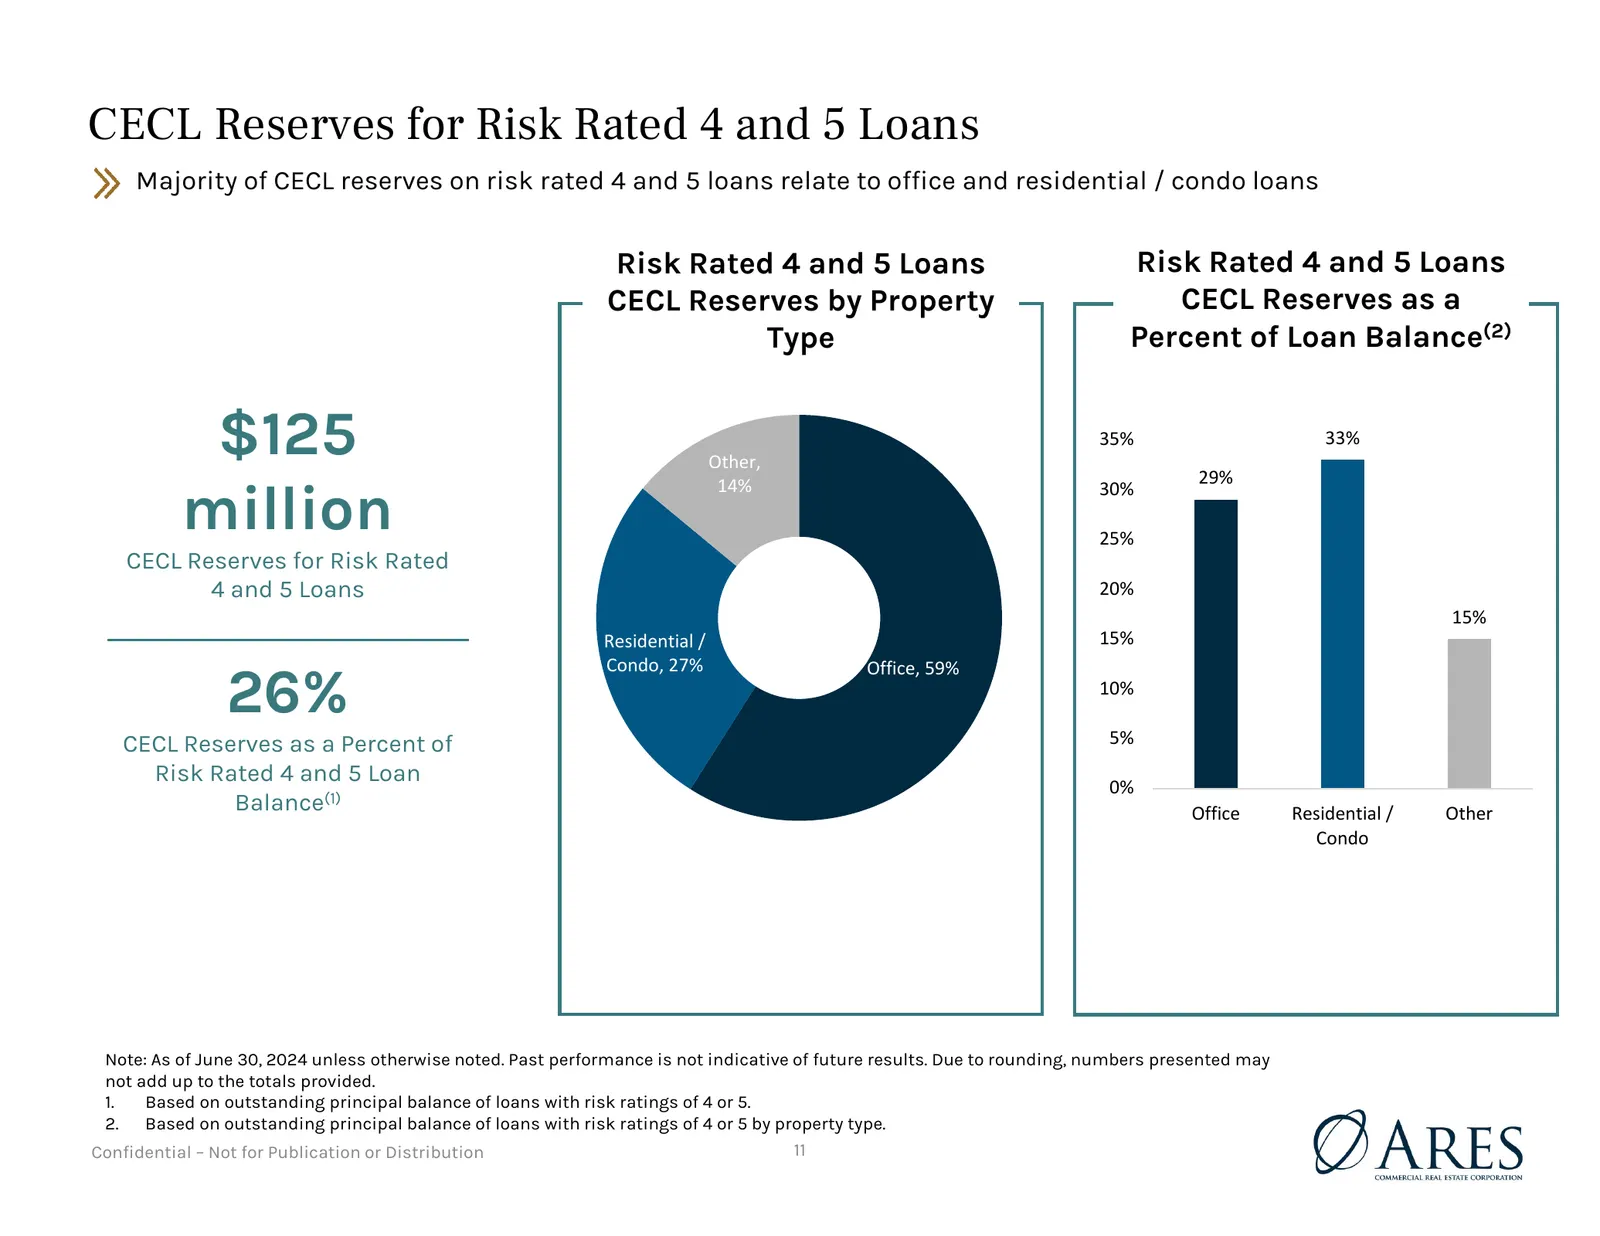
CECL Reserves for Risk Rated 4 and 5 Loans Majority of CECL reserves on risk rated 4 and 5 loans relate to office and residential / condo loans Risk Rated 4 and 5 Loans Risk Rated 4 and 5 Loans CECL Reserves by Property CECL Reserves as a Type Percent of Loan Balance(2) $125 Other, 35% 29% 33% milli
Slide 12: Summary of Real Estate Owned
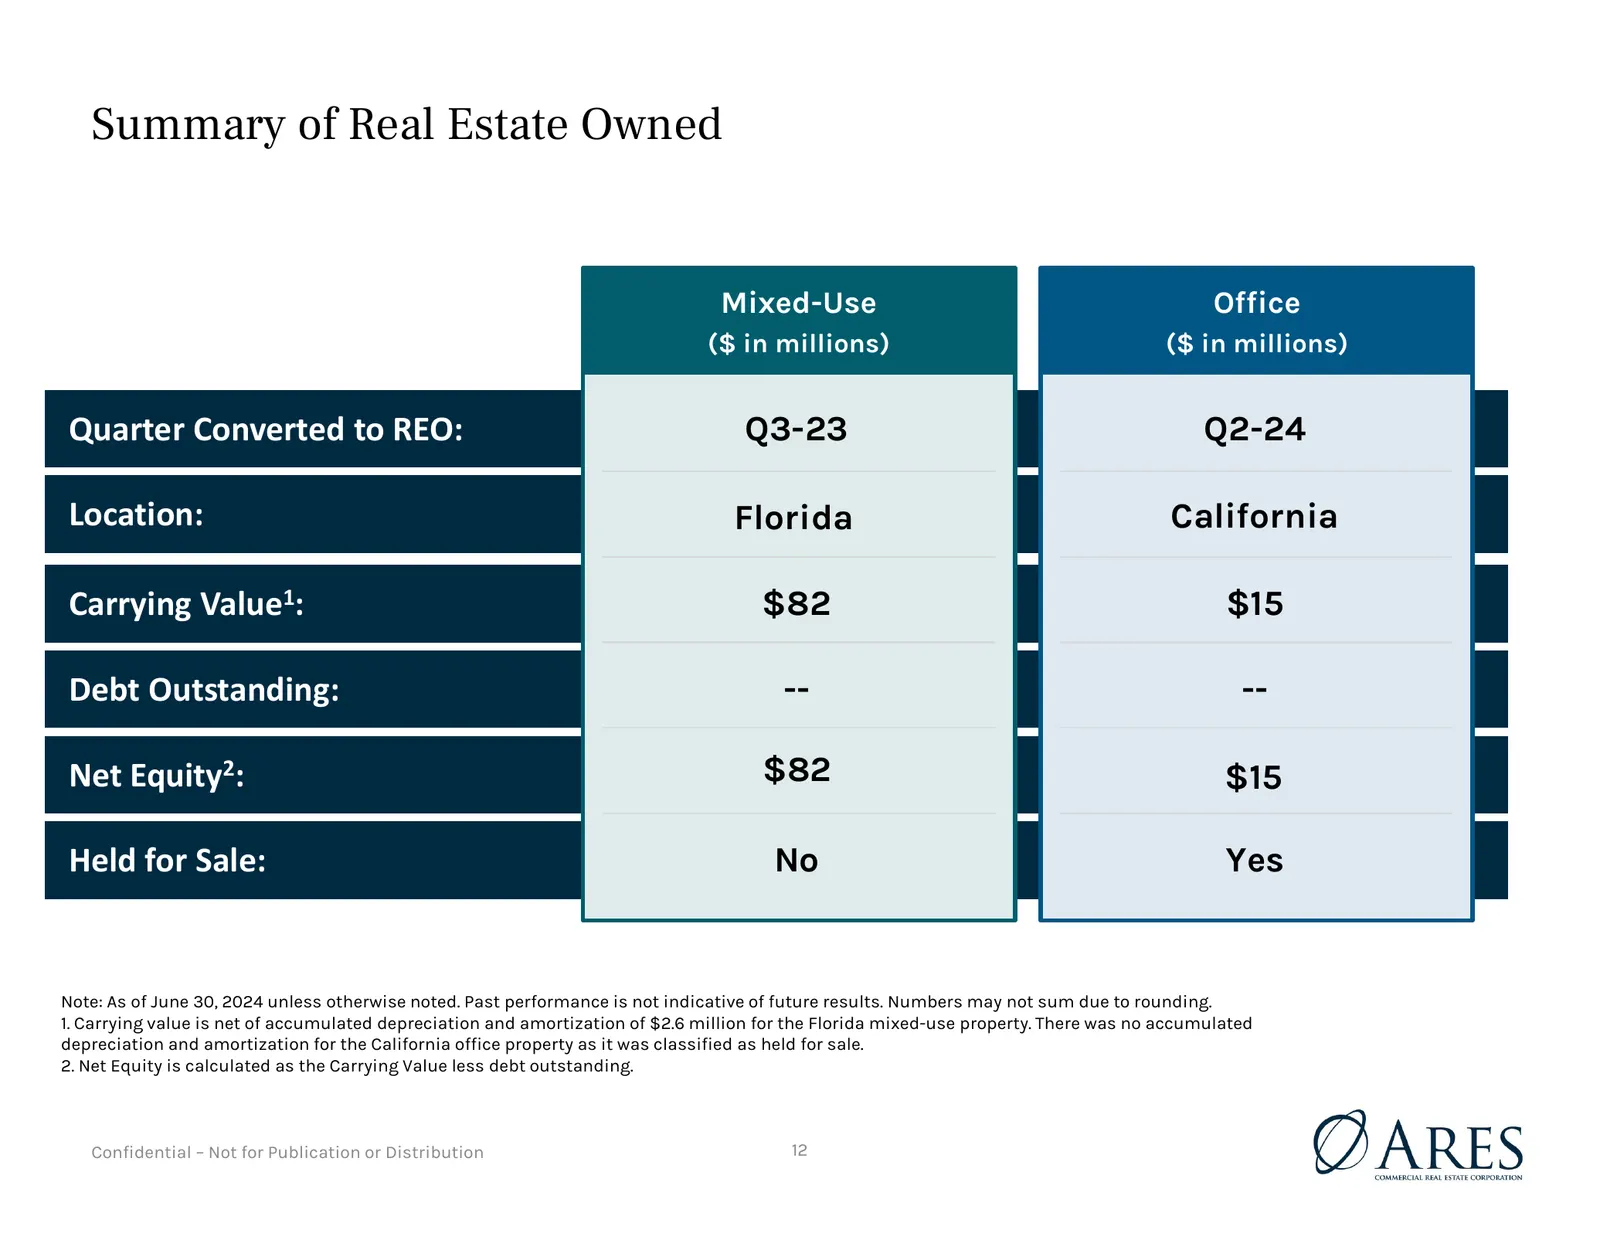
Summary of Real Estate Owned Mixed-Use Office ($ in millions) ($ in millions) Quarter Converted to REO: Q3-23 Q2-24 Location: Florida California Carrying Value1: $82 $15 Debt Outstanding: -- -- Net Equity2: $82 $15 Held for Sale: No Yes Note: As of June 30, 2024 unless otherwise noted. Past performa
Slide 13: Appendix
Appendix Confidential – Not for Publication or Distribution
Slide 14: Loans Held for Investment Portfolio Details
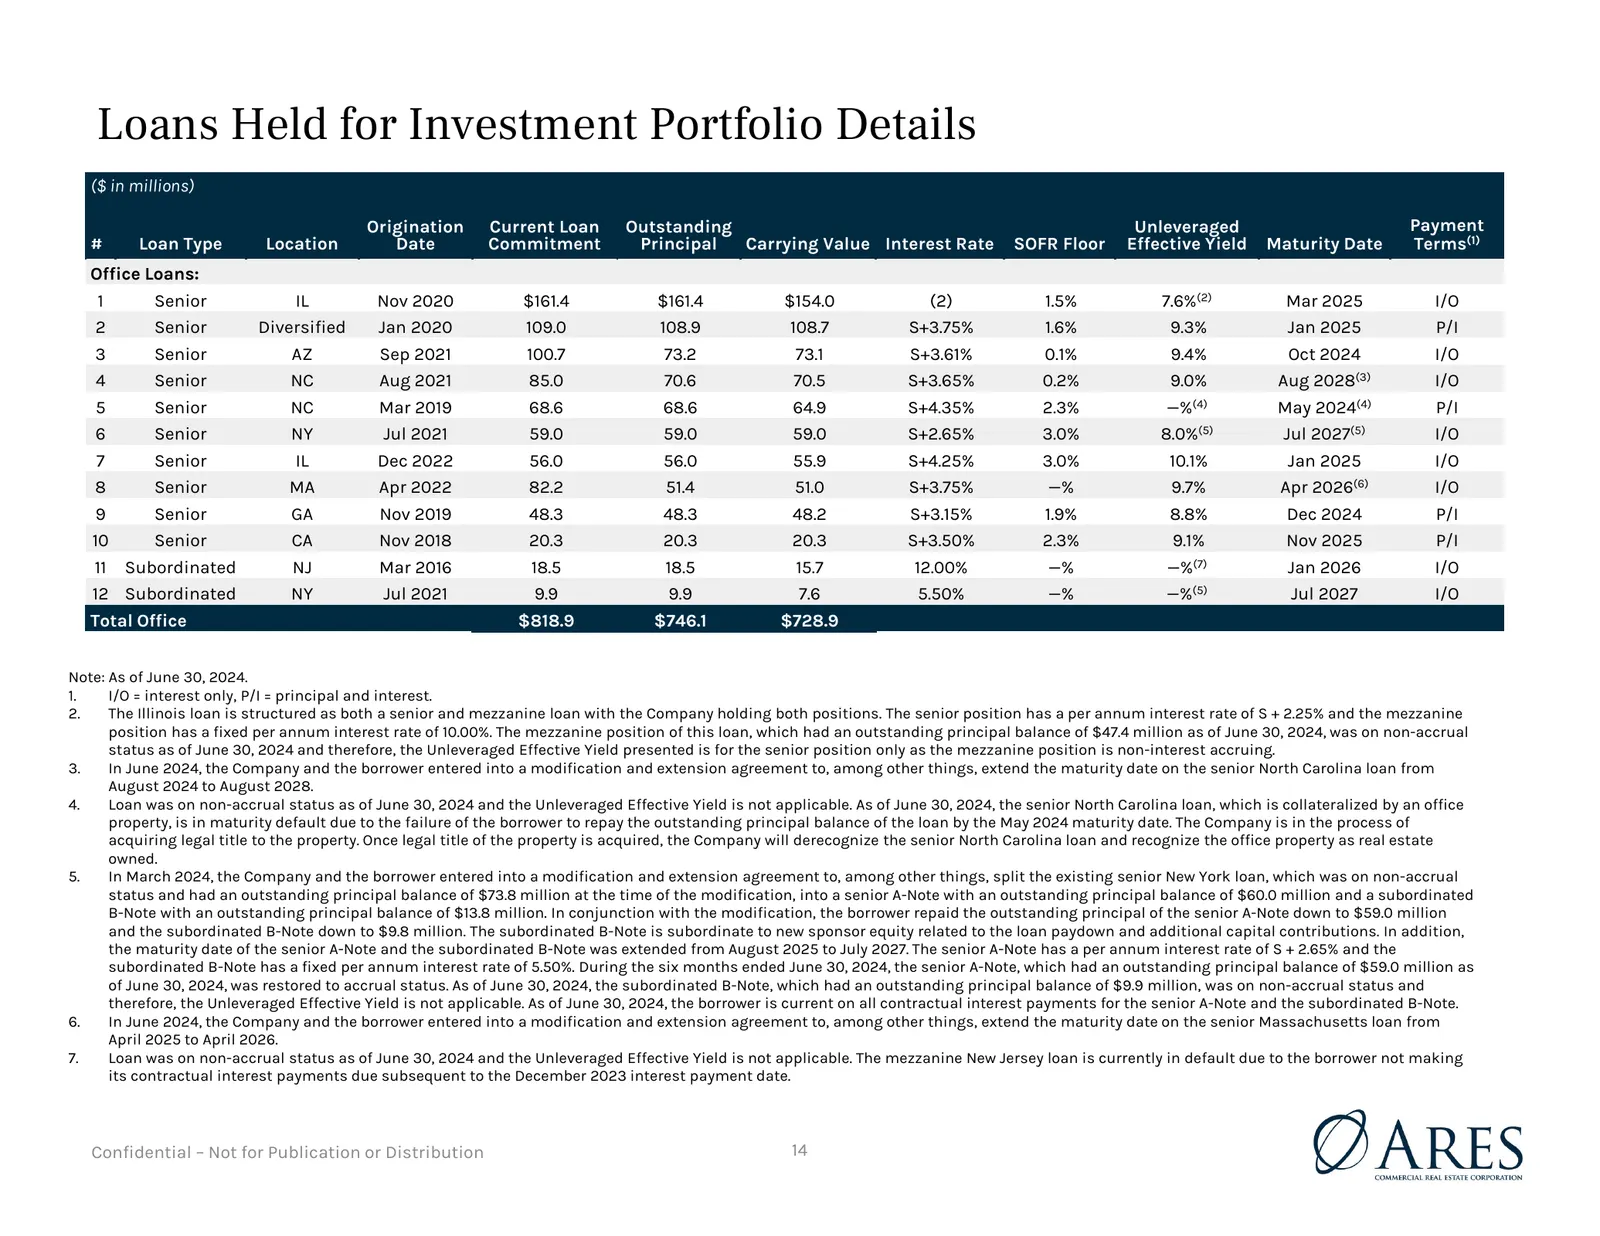
Loans Held for Investment Portfolio Details ($ in millions) Origination Current Loan Outstanding Unleveraged Payment # Loan Type Location Date Commitment Principal Carrying Value Interest Rate SOFR Floor Effective Yield Maturity Date Terms(1) Office Loans: 1 Senior IL Nov 2020 $161.4 $161.4 $154.0 (
Slide 15: Loans Held for Investment Portfolio Details
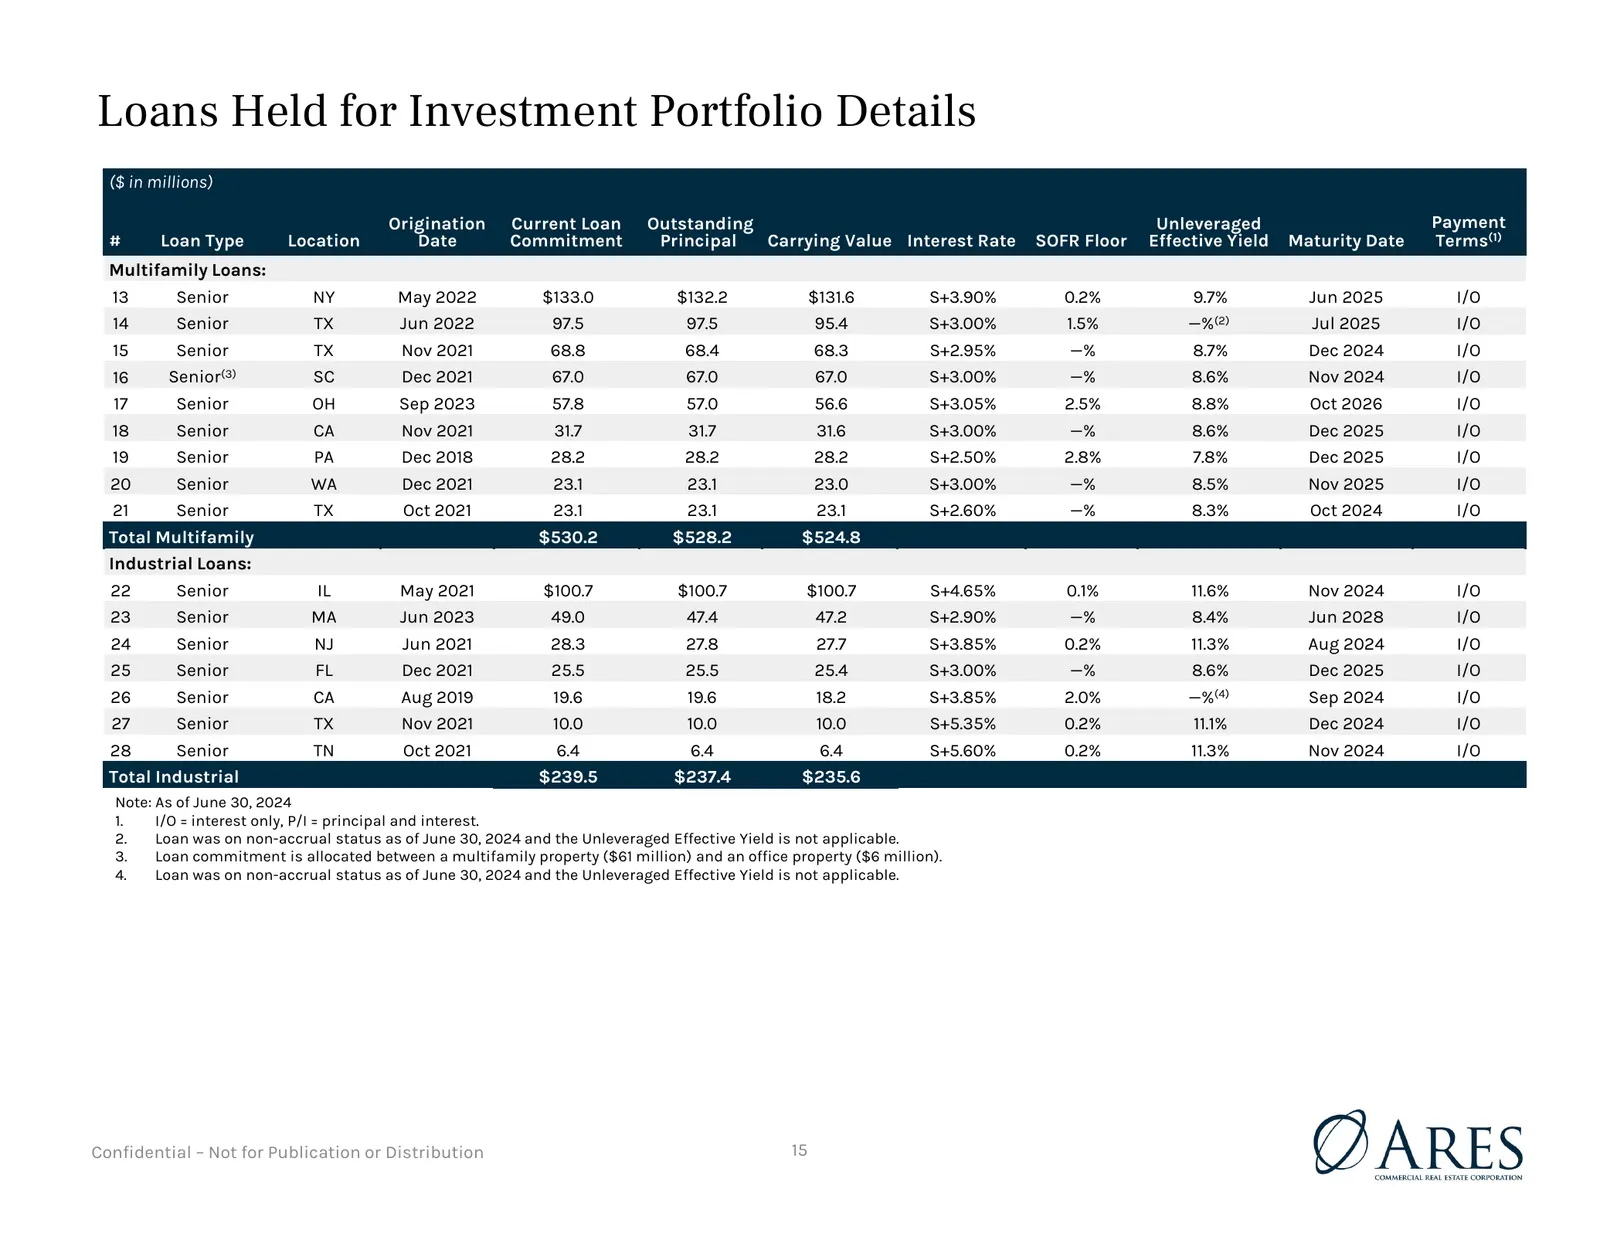
Loans Held for Investment Portfolio Details ($ in millions) Origination Current Loan Outstanding Unleveraged Payment # Loan Type Location Date Commitment Principal Carrying Value Interest Rate SOFR Floor Effective Yield Maturity Date Terms(1) Multifamily Loans: 13 Senior NY May 2022 $133.0 $132.2 $1
Slide 16: Loans Held for Investment Portfolio Details
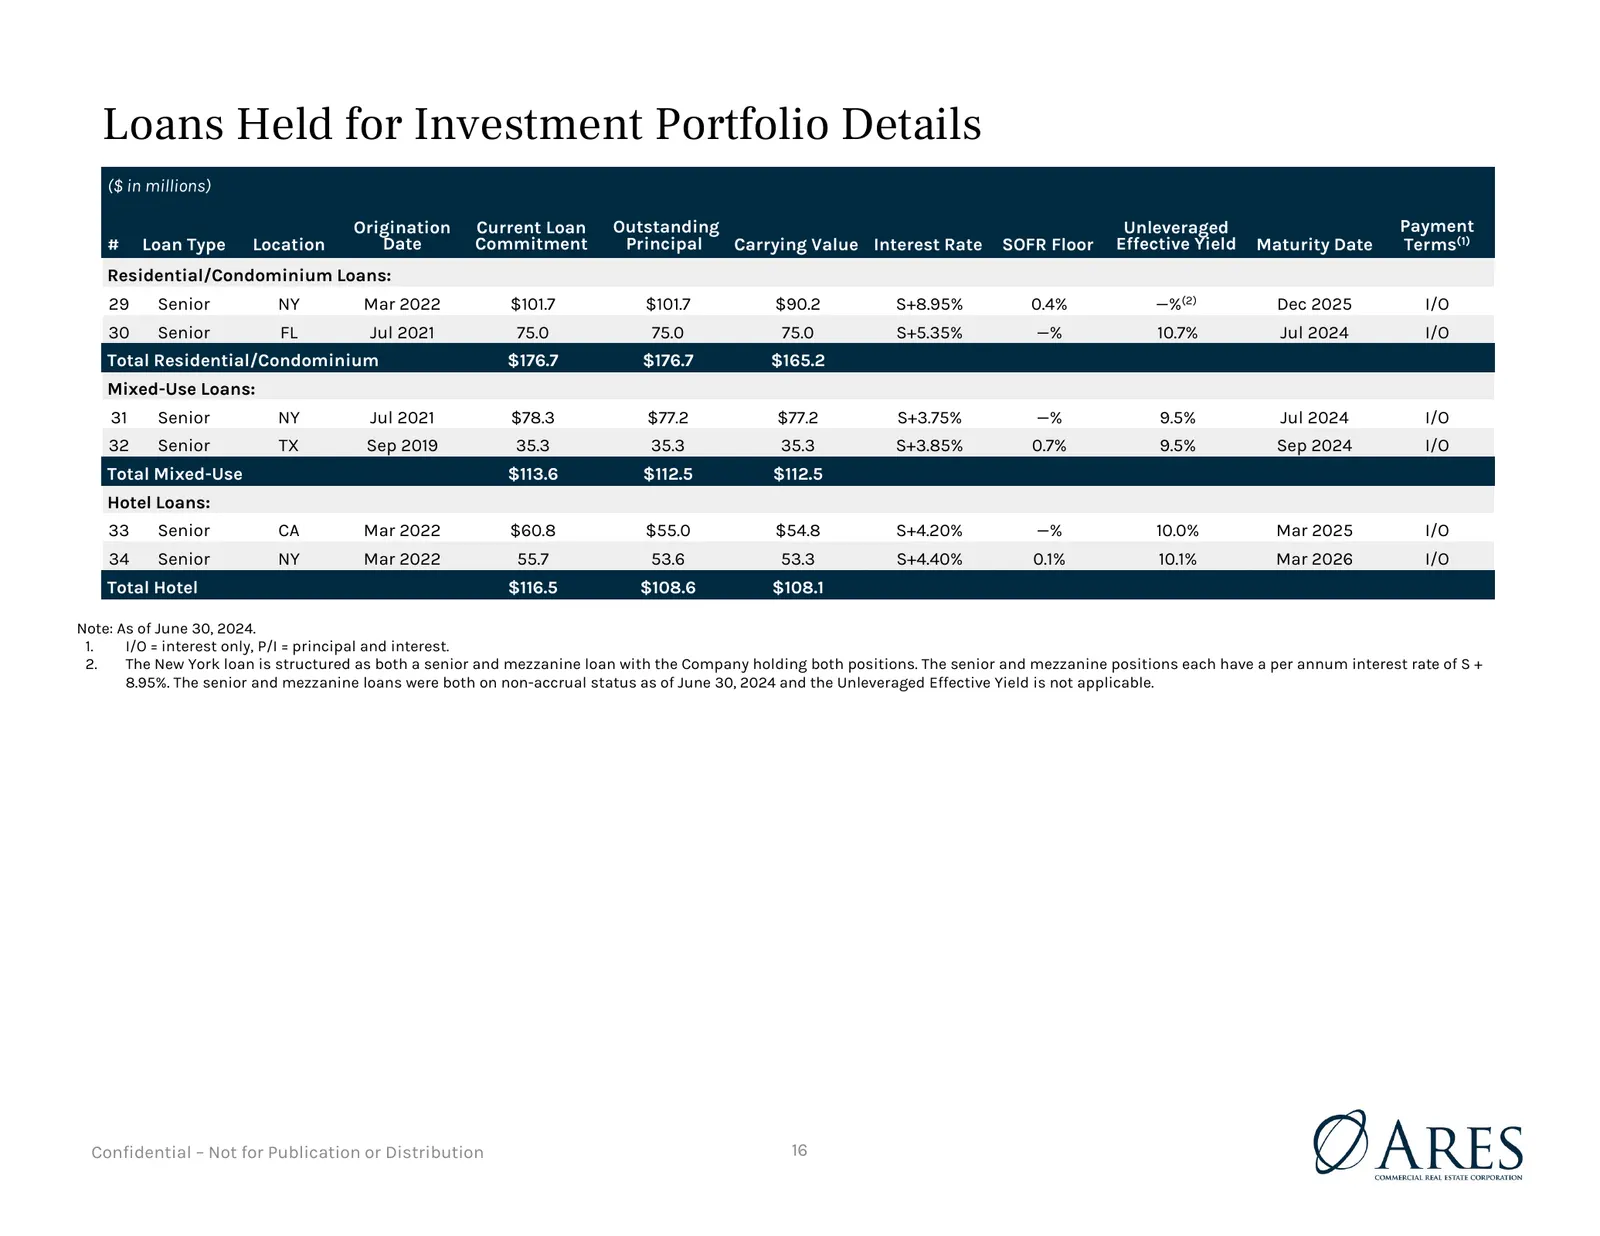
Loans Held for Investment Portfolio Details ($ in millions) Origination Current Loan Outstanding Unleveraged Payment # Loan Type Location Date Commitment Principal Carrying Value Interest Rate SOFR Floor Effective Yield Maturity Date Terms(1) Residential/Condominium Loans: 29 Senior NY Mar 2022 $101
Slide 17: Loans Held for Investment Portfolio Details
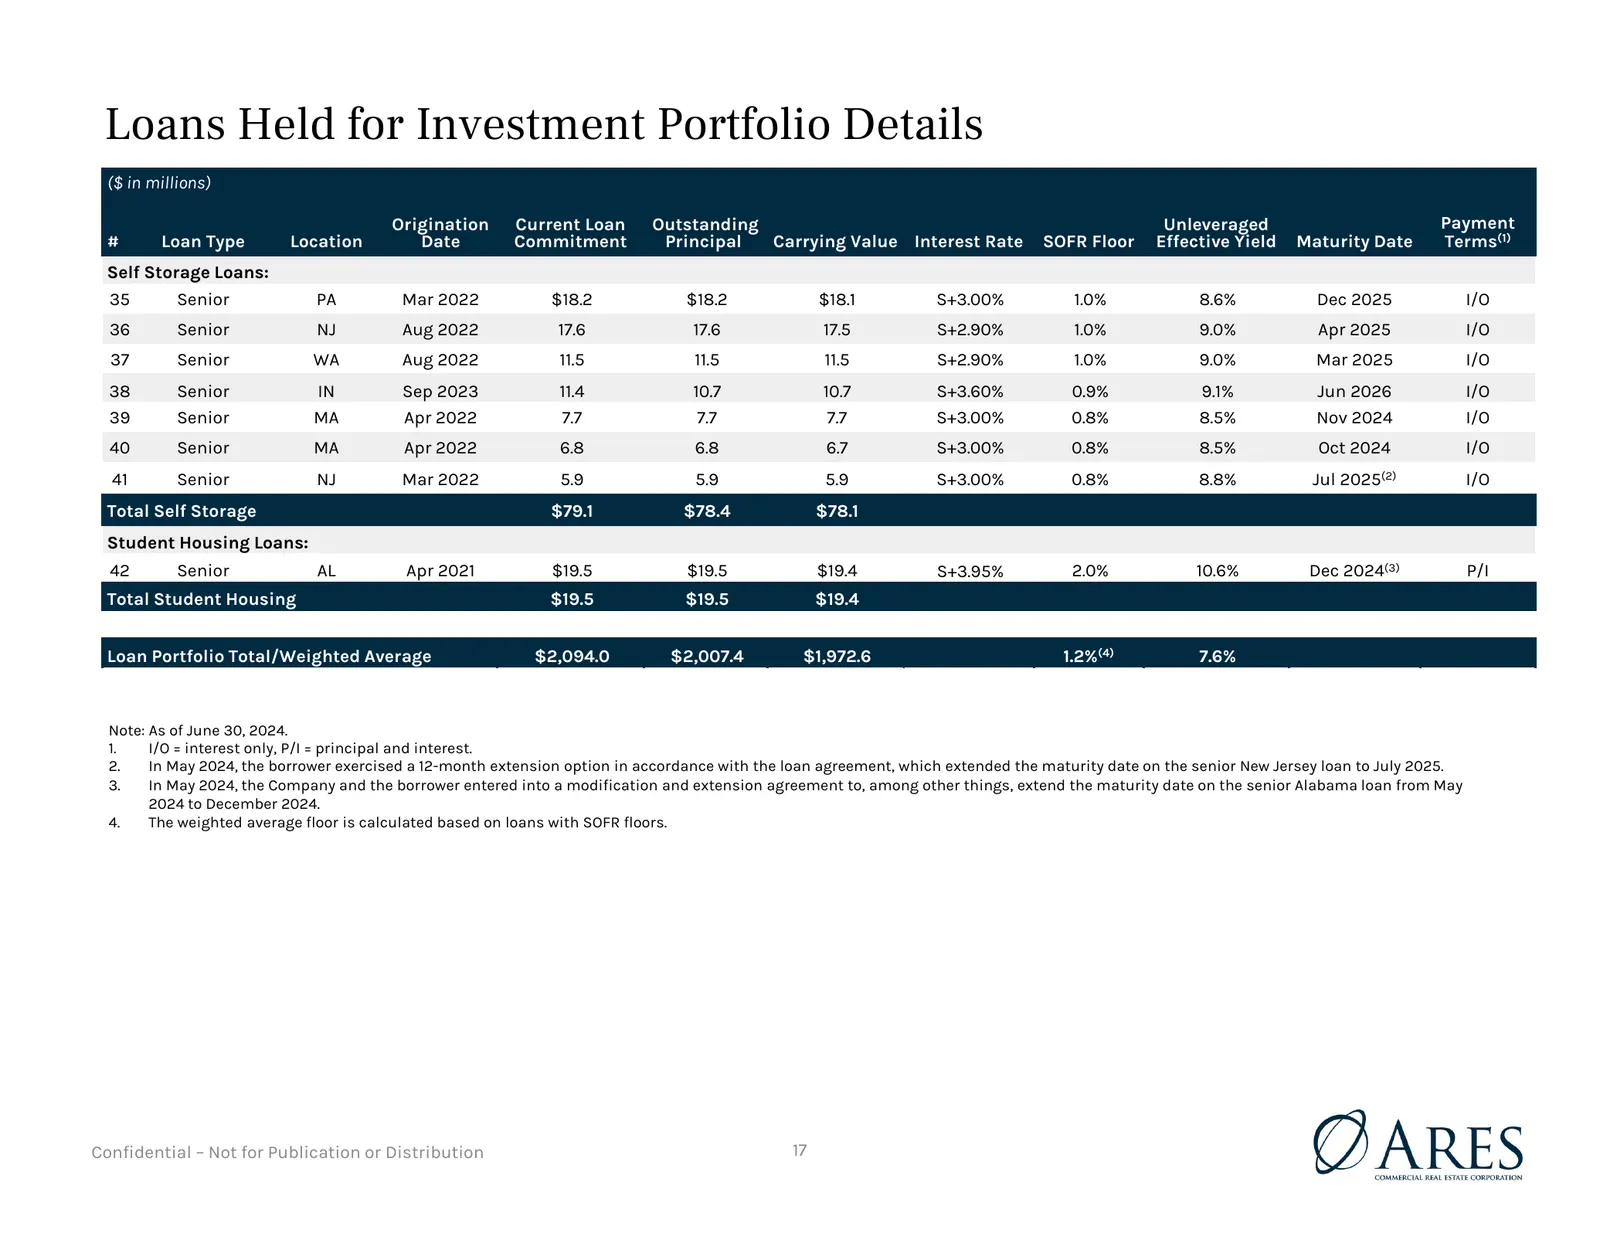
Loans Held for Investment Portfolio Details ($ in millions) Origination Current Loan Outstanding Unleveraged Payment # Loan Type Location Date Commitment Principal Carrying Value Interest Rate SOFR Floor Effective Yield Maturity Date Terms(1) Self Storage Loans: 35 Senior PA Mar 2022 $18.2 $18.2 $18
Slide 18: Consolidated Balance Sheets
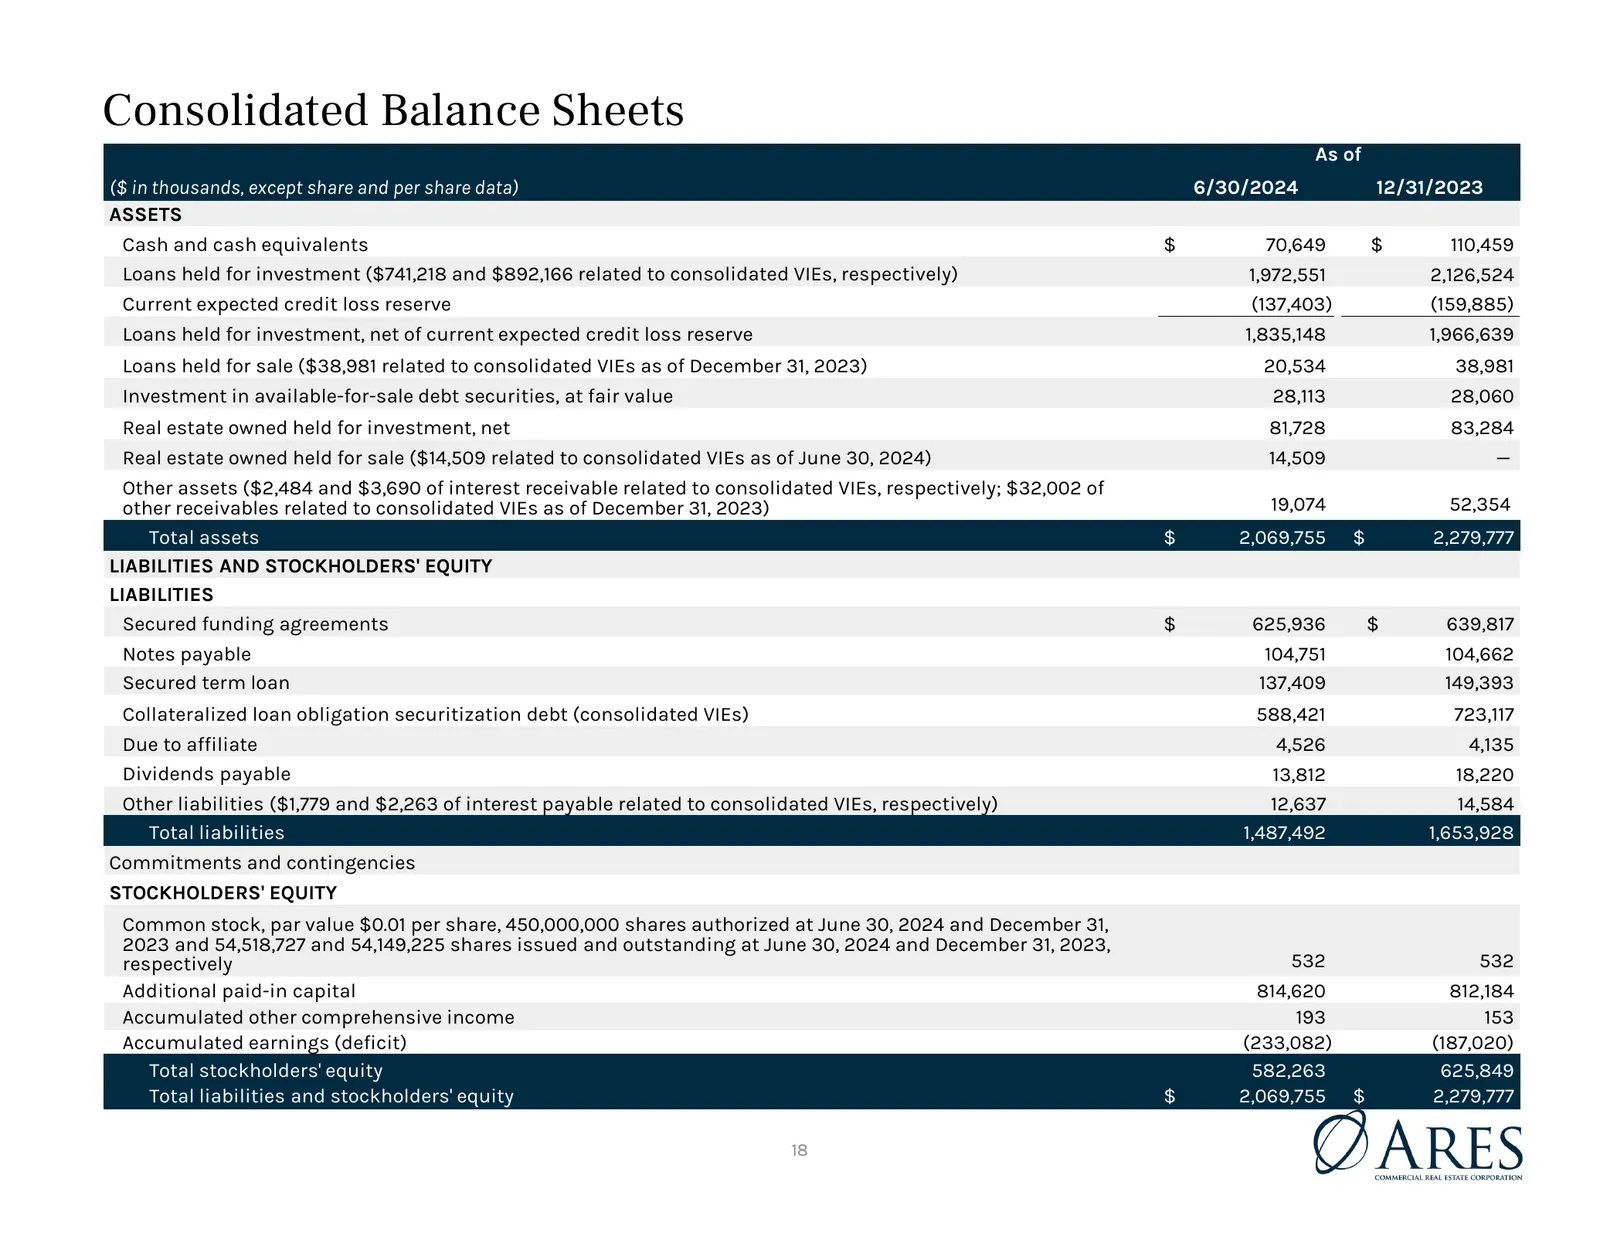
Consolidated Balance Sheets As of ($ in thousands, except share and per share data) 6/30/2024 12/31/2023 ASSETS Cash and cash equivalents $ 70,649 $ 110,459 Loans held for investment ($741,218 and $892,166 related to consolidated VIEs, respectively) 1,972,551 2,126,524 Current expected credit loss r
Slide 19: Consolidated Statements of Operations
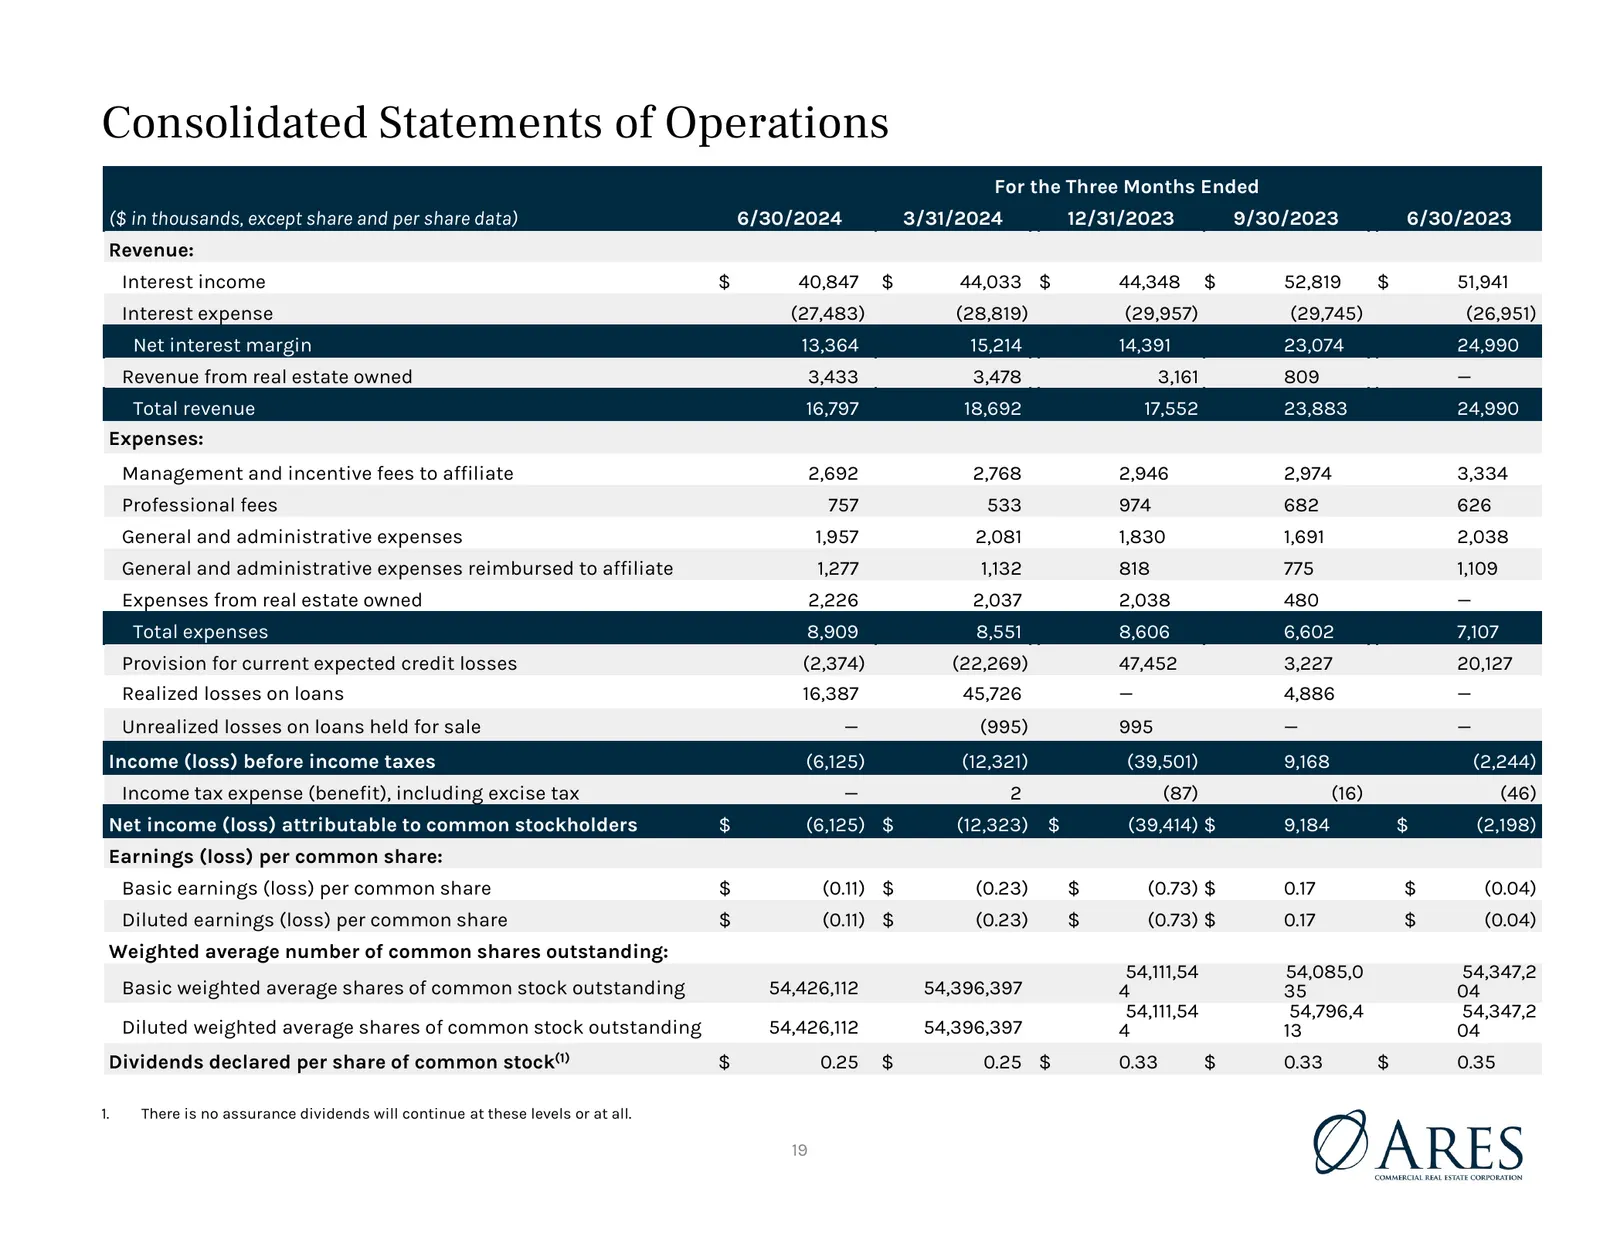
Consolidated Statements of Operations For the Three Months Ended ($ in thousands, except share and per share data) 6/30/2024 3/31/2024 12/31/2023 9/30/2023 6/30/2023 Revenue: Interest income $ 40,847 $ 44,033 $ 44,348 $ 52,819 $ 51,941 Interest expense (27,483) (28,819) (29,957) (29,745) (26,951) Ne
Slide 20: Reconciliation of Net Income (Loss) to Non-GAAP Distributable Earnings (Loss)
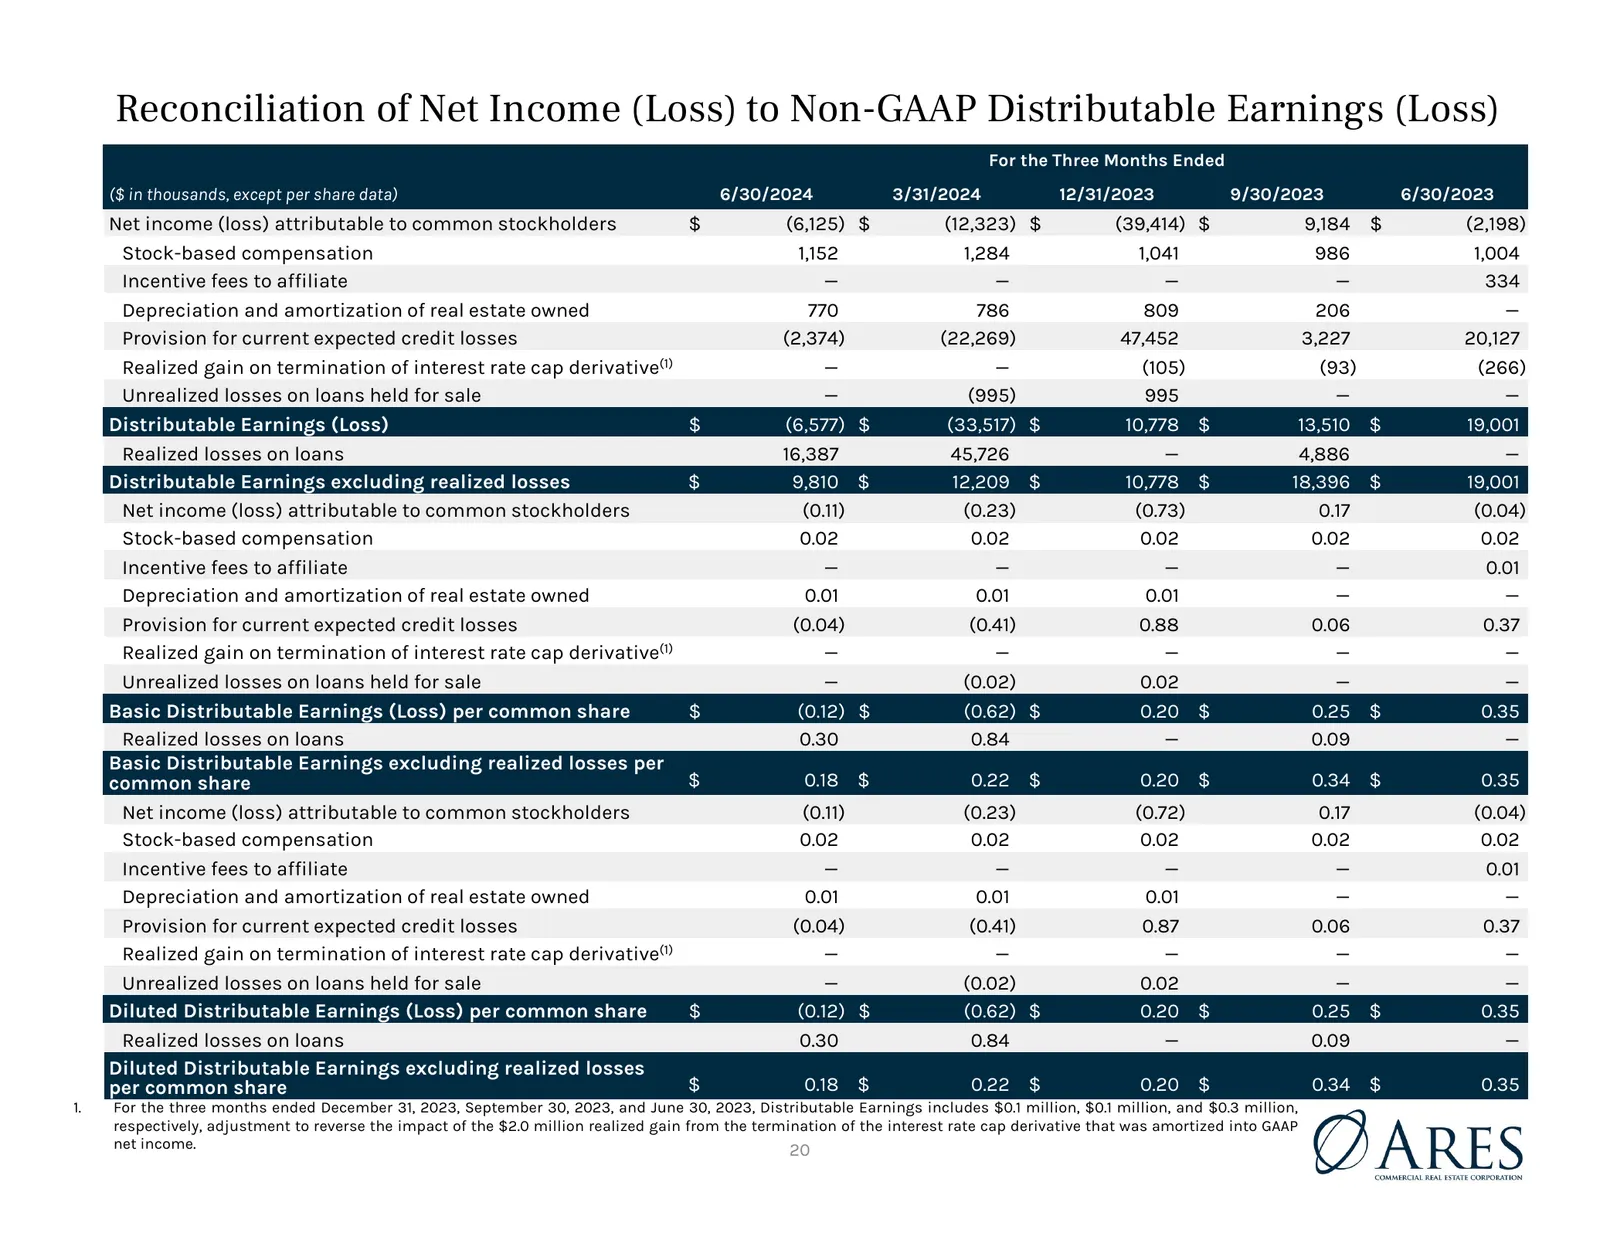
Reconciliation of Net Income (Loss) to Non-GAAP Distributable Earnings (Loss) For the Three Months Ended ($ in thousands, except per share data) 6/30/2024 3/31/2024 12/31/2023 9/30/2023 6/30/2023 Net income (loss) attributable to common stockholders $ (6,125) $ (12,323) $ (39,414) $ 9,184 $ (2,198)
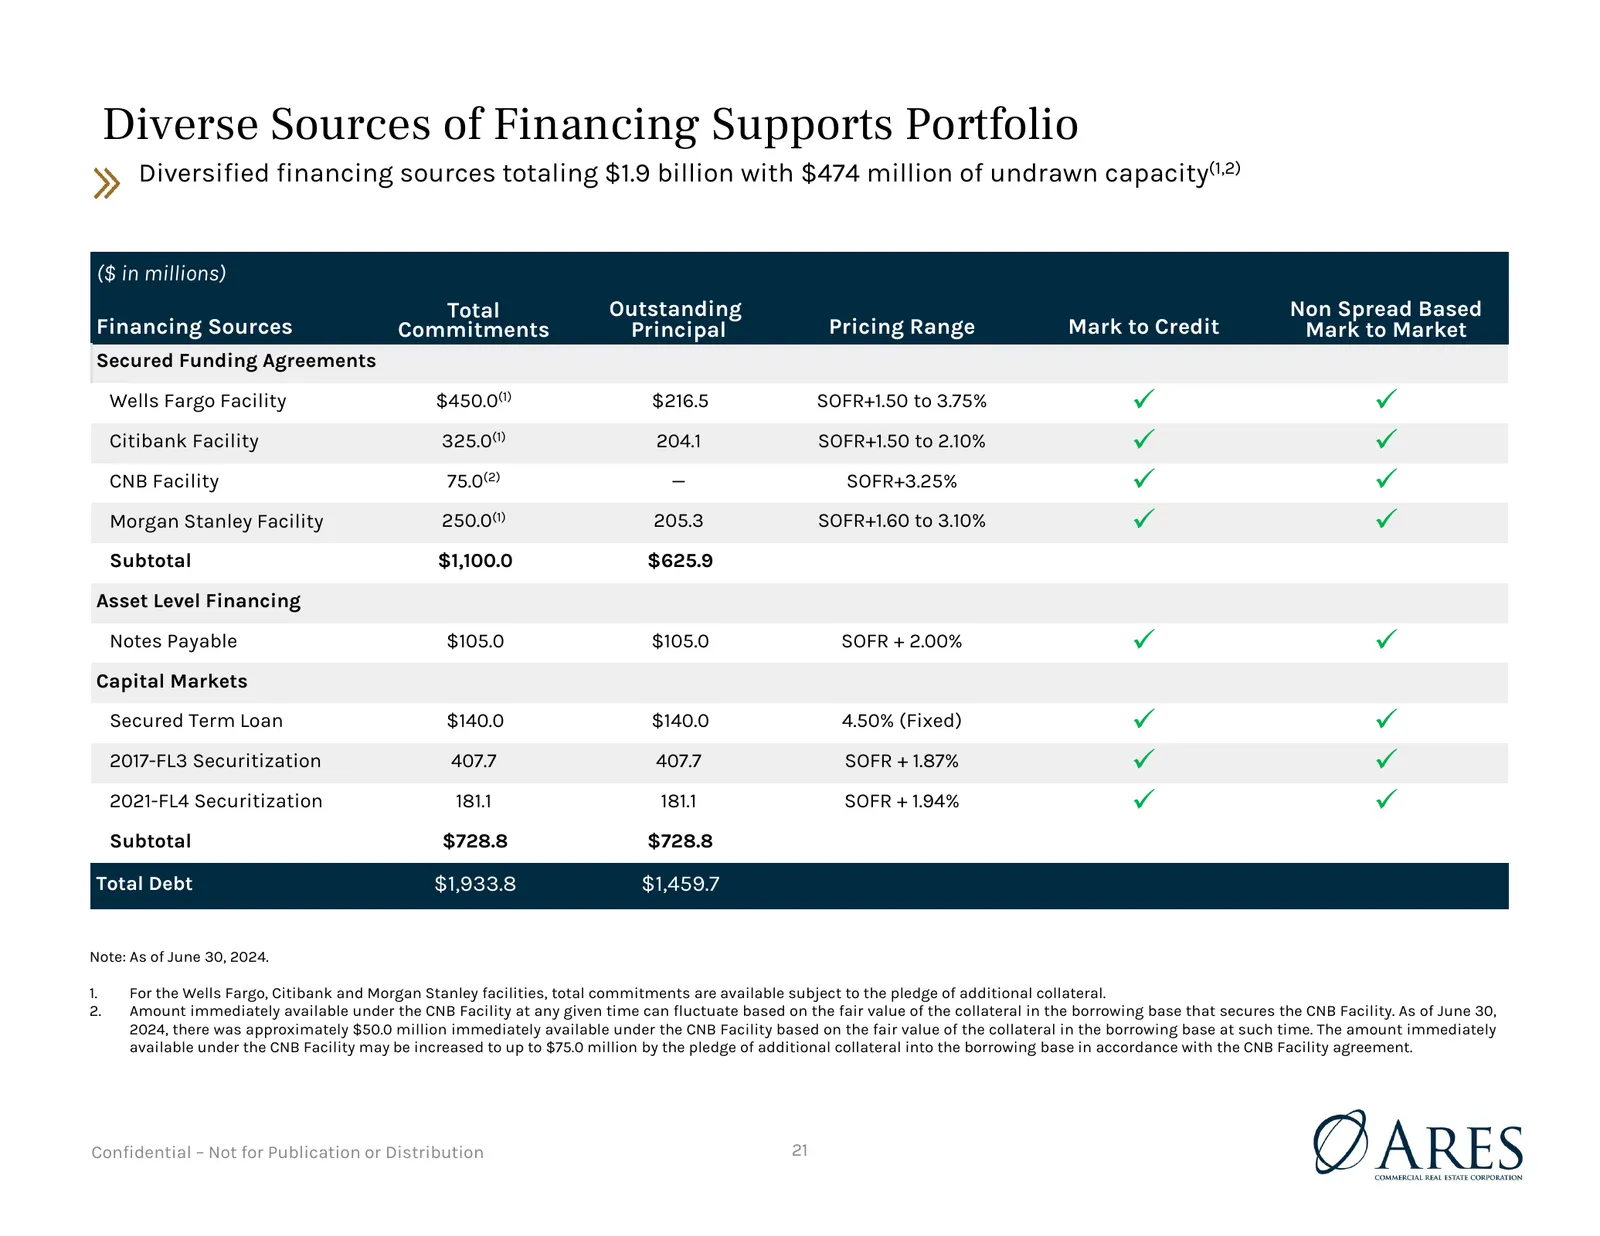
Slide 21: Diverse Sources of Financing Supports Portfolio
Diverse Sources of Financing Supports Portfolio Diversified financing sources totaling $1.9 billion with $474 million of undrawn capacity(1,2) ($ in millions) Total Outstanding Non Spread Based Financing Sources Commitments Principal Pricing Range Mark to Credit Mark to Market Secured Funding Agreem
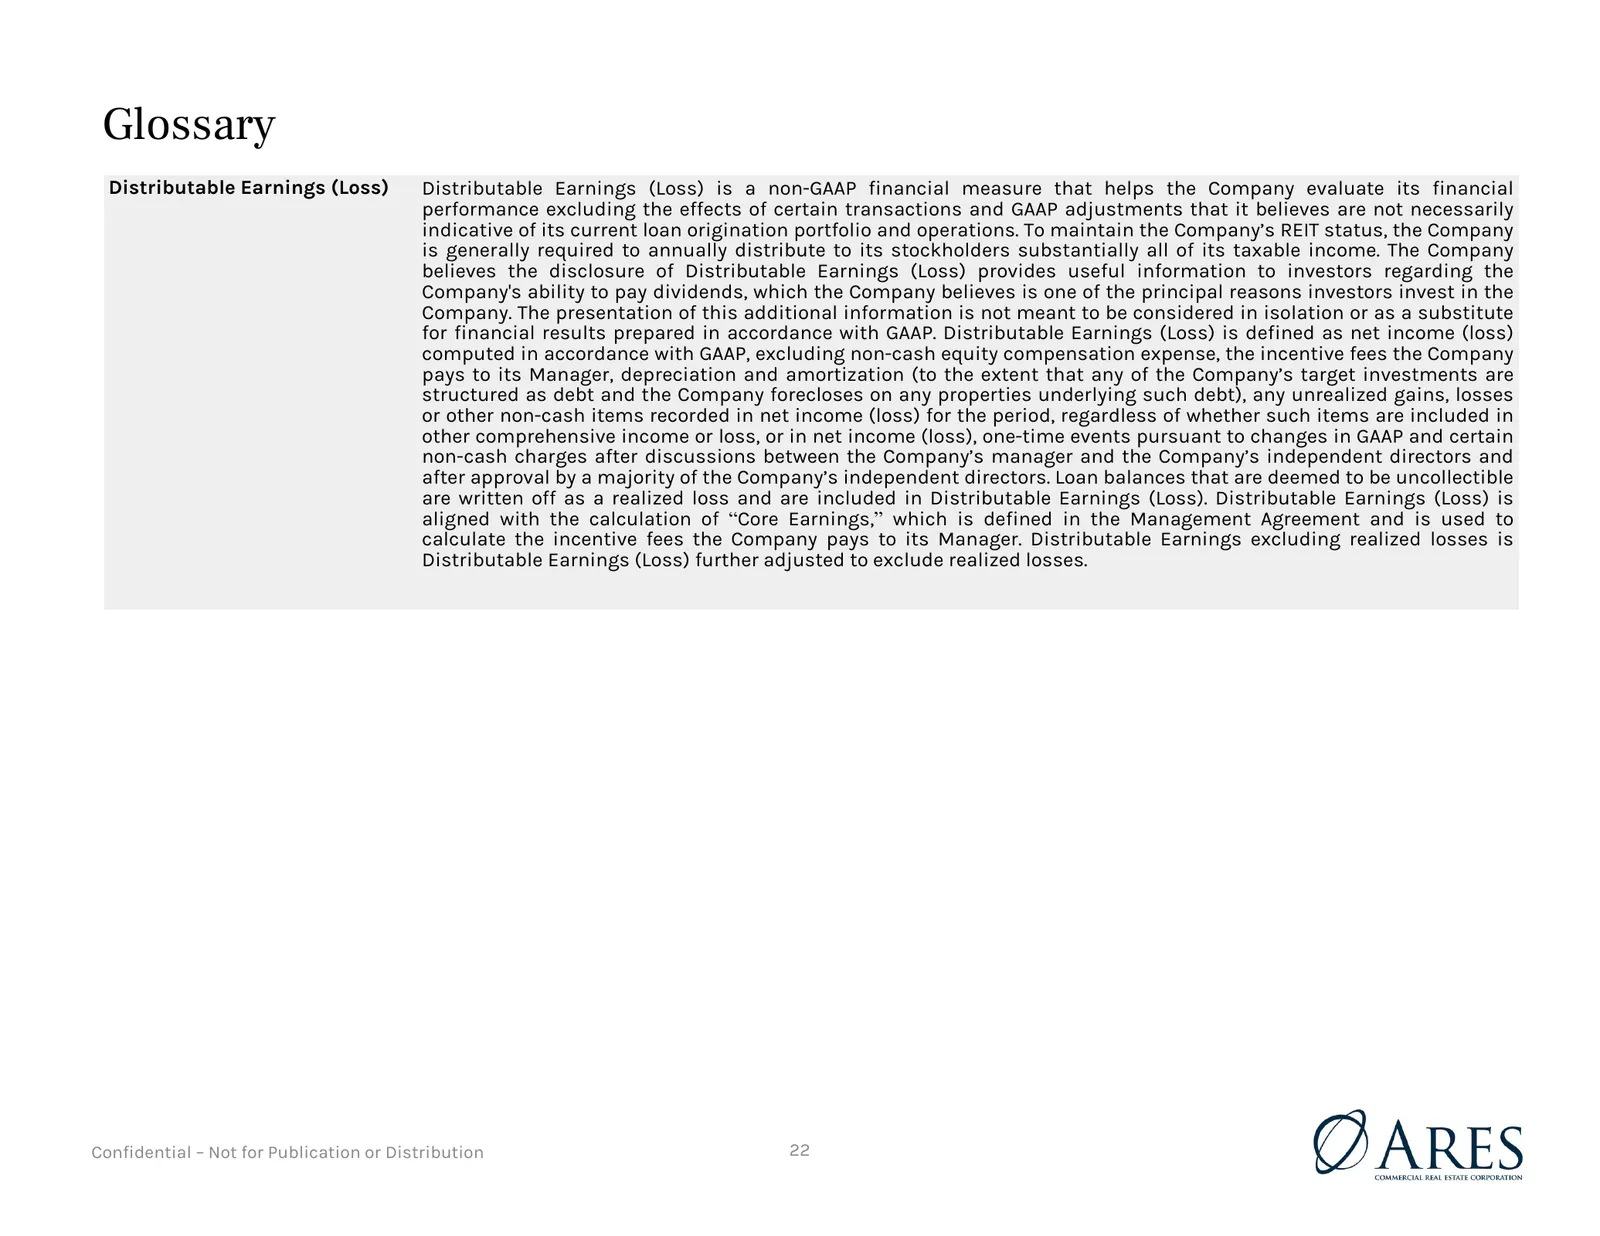
Slide 22: Glossary
Glossary Distributable Earnings (Loss) Distributable Earnings (Loss) is a non-GAAP financial measure that helps the Company evaluate its financial performance excluding the effects of certain transactions and GAAP adjustments that it believes are not necessarily indicative of its current loan origin

Slide 23: Confidential – Not for Publication or Distribution
Confidential – Not for Publication or Distribution
Source: 6ix earnings call
More decks from Ares Commercial Real Estate Corporation
 Q3 2026 Earnings Presentation25 slides · Nov 6, 2026
 Q2 2026 Earnings Presentation24 slides · Aug 4, 2026
 Q1 2026 Earnings Presentation24 slides · May 7, 2026
 Q4 2025 Earnings Presentation23 slides · Feb 10, 2026
 Q4 2025 Earnings Presentation23 slides · Feb 10, 2026
 Q3 2025 Earnings Presentation23 slides · Nov 7, 2025