Euroseas Ltd. · NASDAQ:ESEA
Euroseas — Q3 2026 Earnings Presentation
23 slides from Euroseas's earnings presentation, Nov 17, 2026
Slide 1: Earnings Presentation Quarter Ended September 30, 2026
Earnings Presentation Quarter Ended September 30, 2026 November 17, 20261
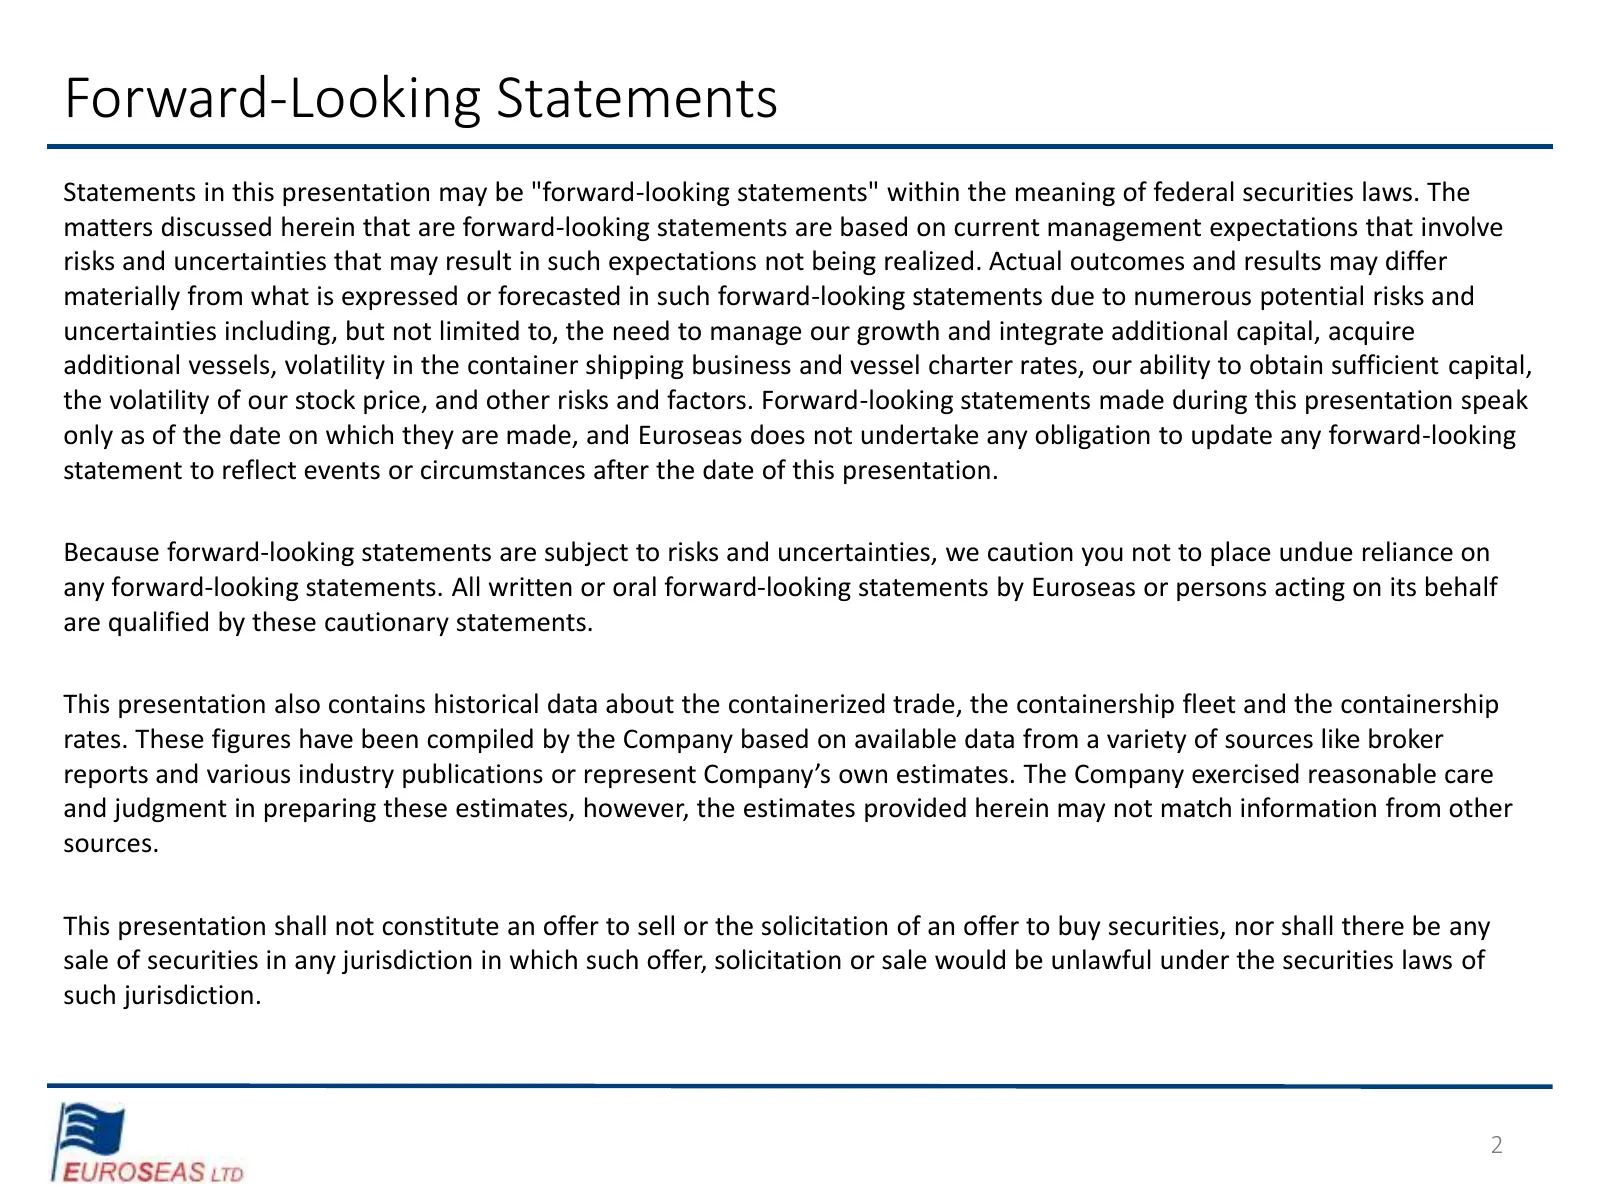
Slide 2: Forward-Looking Statements
Forward-Looking Statements Statements in this presentation may be "forward-looking statements" within the meaning of federal securities laws. The matters discussed herein that are forward-looking statements are based on current management expectations that involve risks and uncertainties that may re
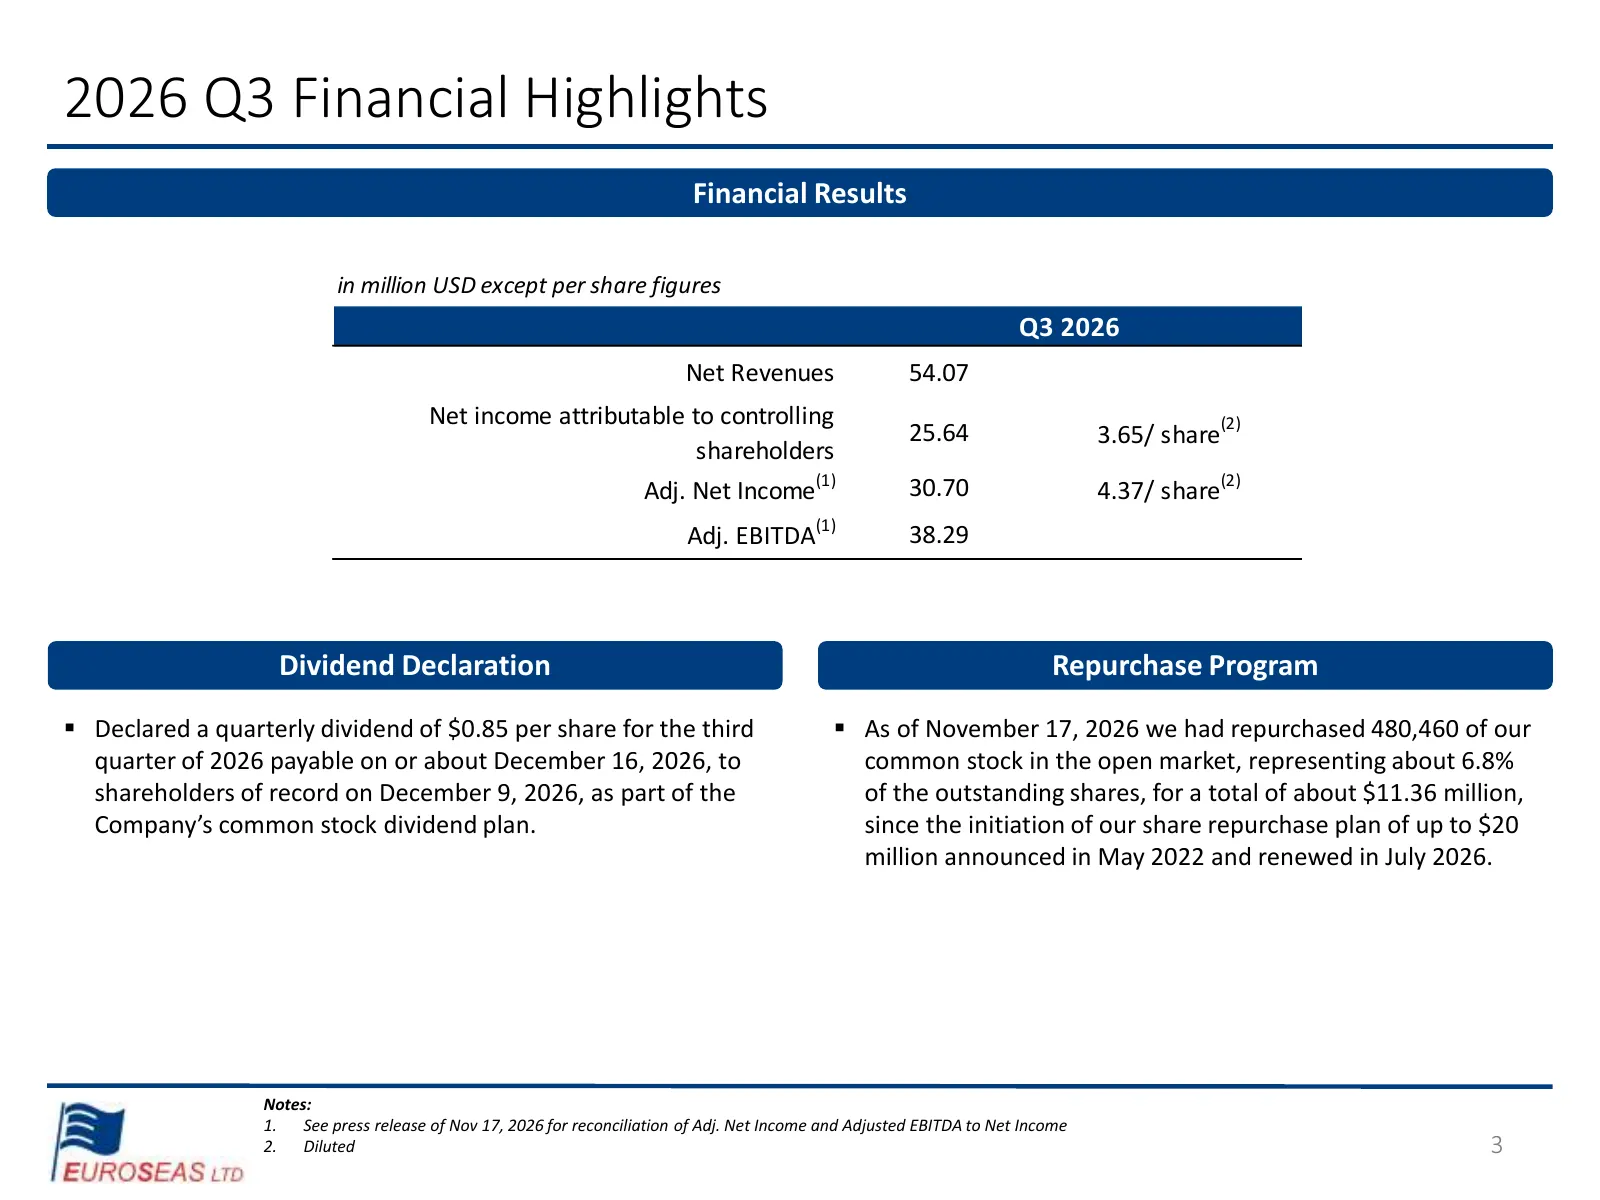
Slide 3: 2026 Q3 Financial Highlights
2026 Q3 Financial Highlights Financial Results in million USD except per share figures Q3 2026 Net Revenues 54.07 Net income attributable to controlling 25.64 3.65/ share(2) shareholders (1) (2) Adj. Net Income 30.70 4.37/ share Adj. EBITDA(1) 38.29 Dividend Declaration Repurchase Program ▪ Declared
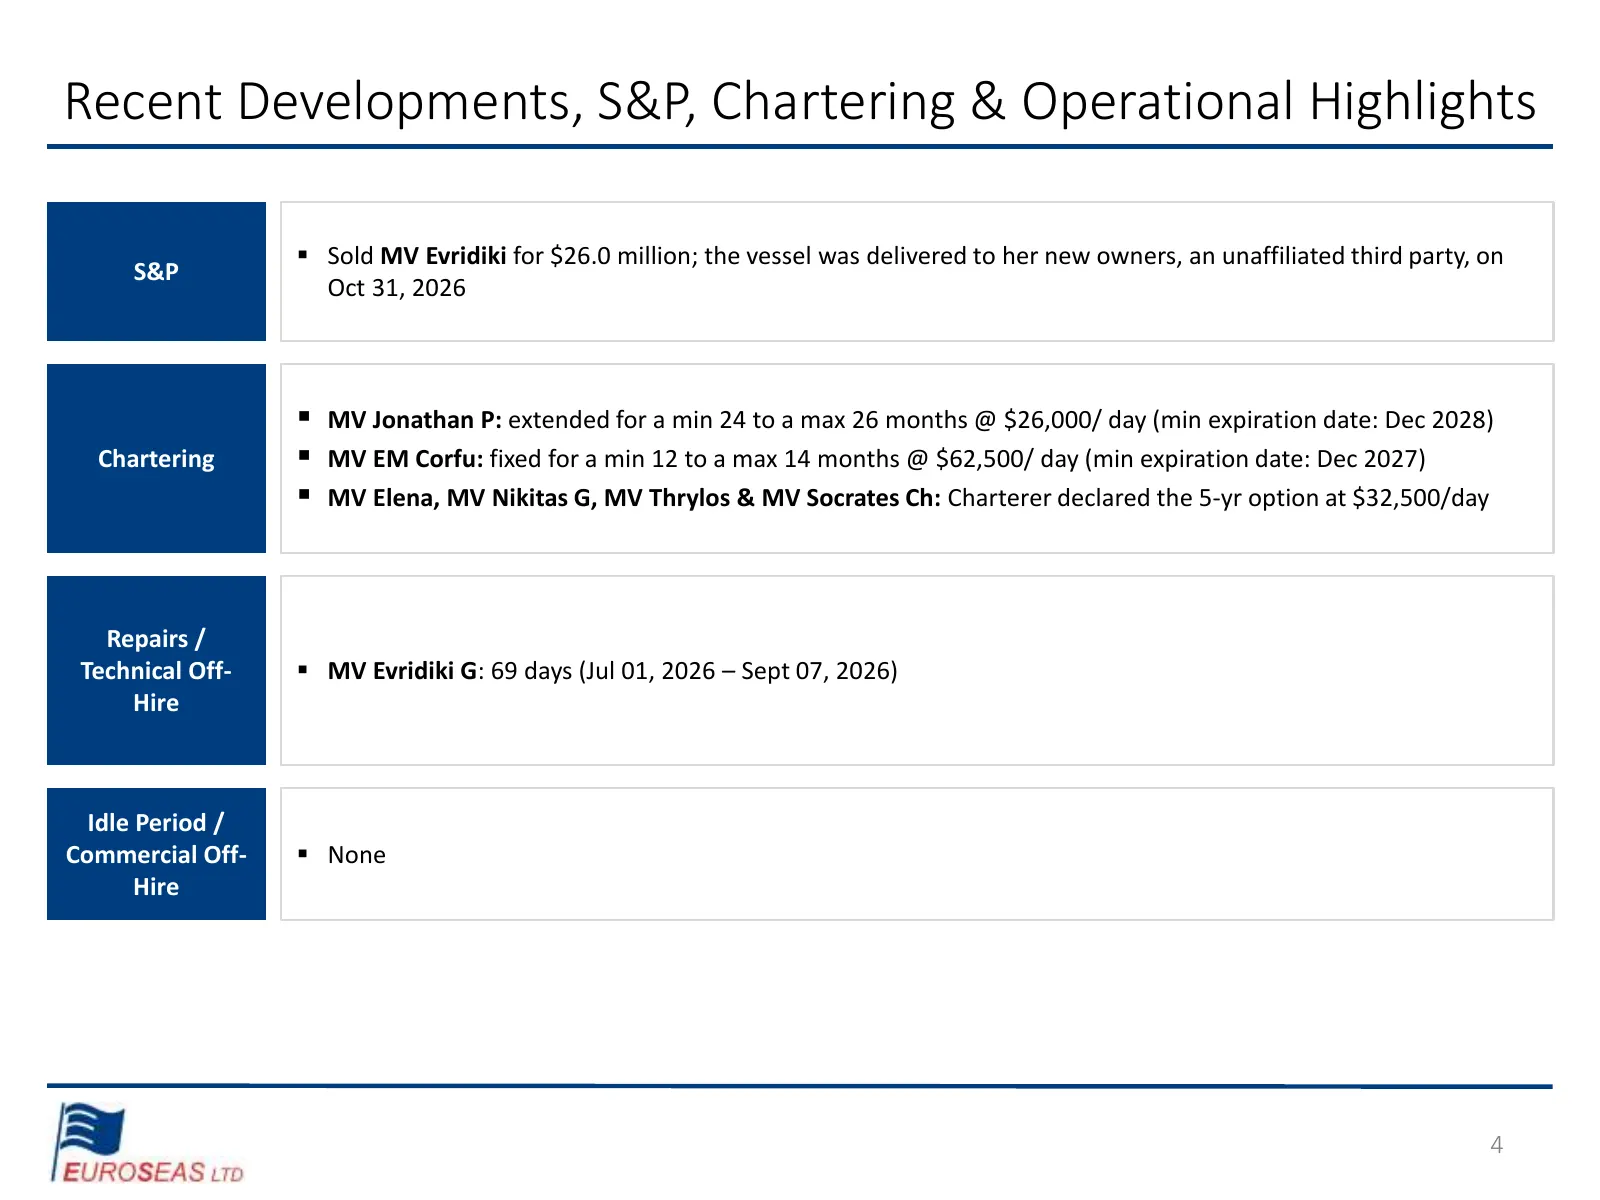
Slide 4: Recent Developments, S&P, Chartering & Operational Highlights
Recent Developments, S&P, Chartering & Operational Highlights ▪ Sold MV Evridiki for $26.0 million; the vessel was delivered to her new owners, an unaffiliated third party, on S&P Oct 31, 2026 ▪ MV Jonathan P: extended for a min 24 to a max 26 months @ $26,000/ day (min expiration date: Dec 2028) Ch
Slide 5: Current Fleet Profile
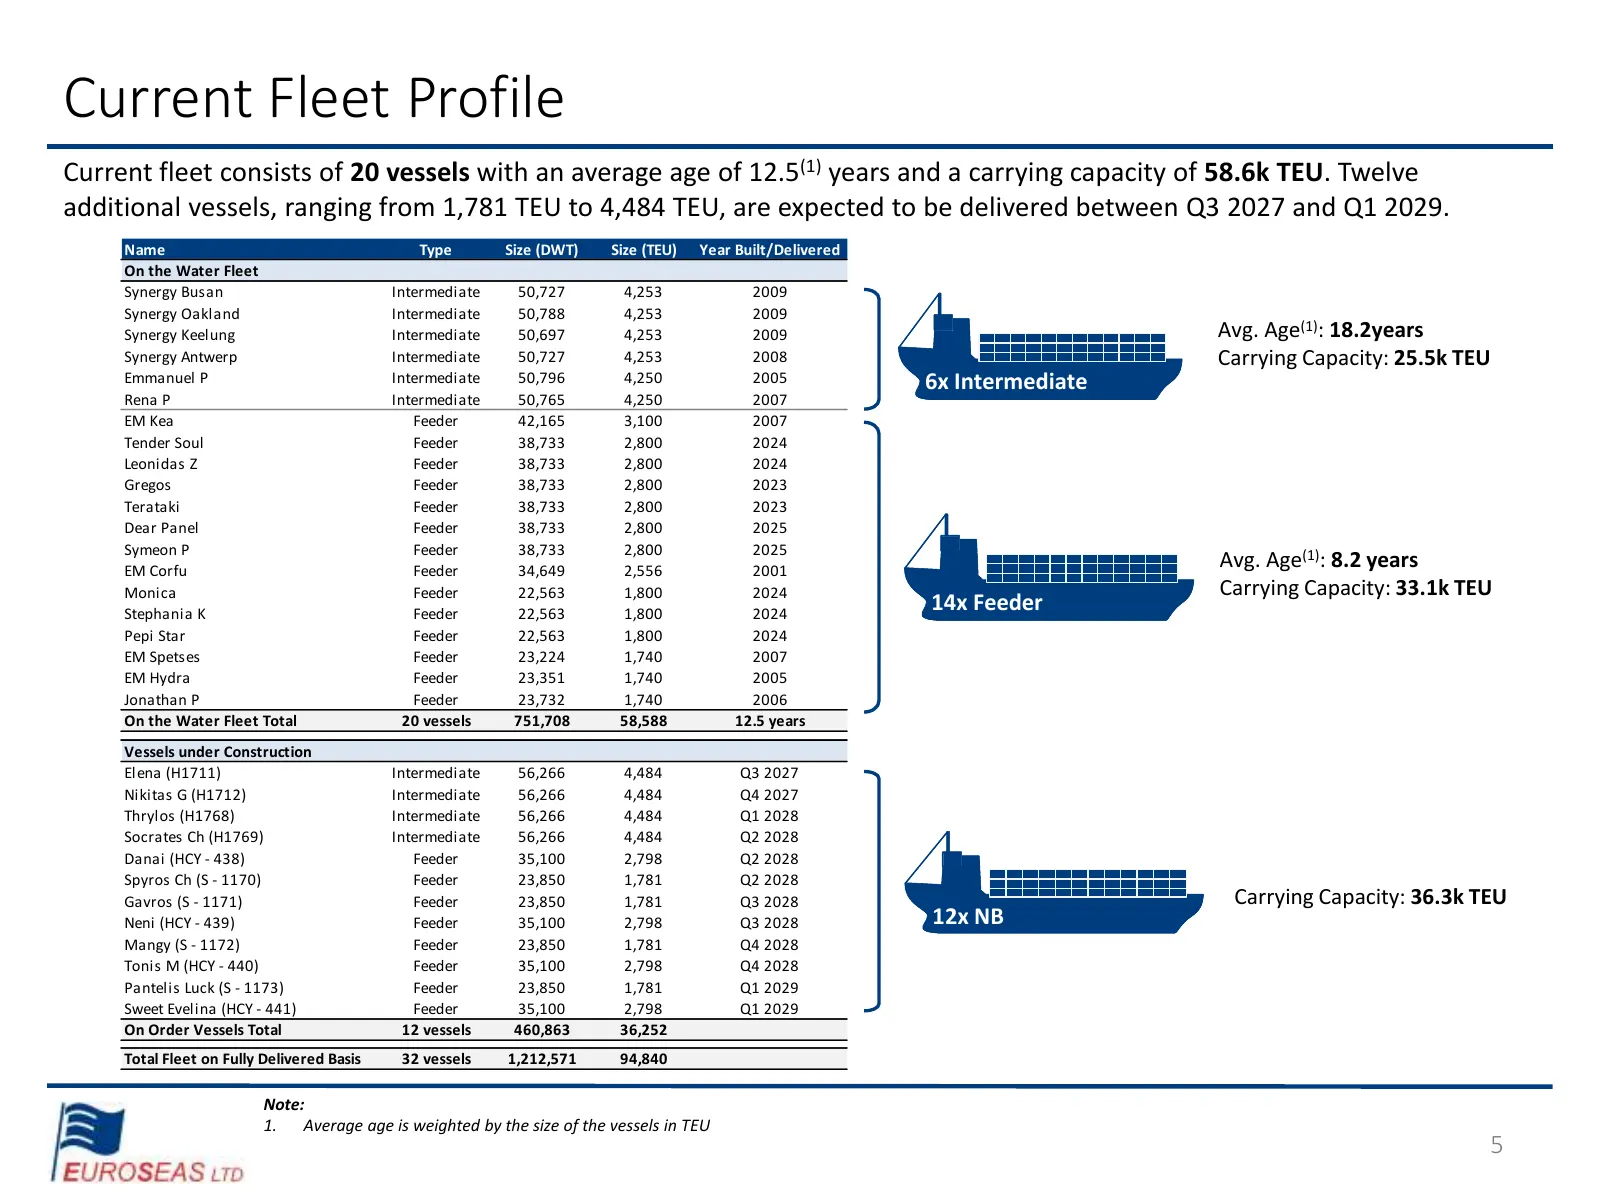
Current Fleet Profile Current fleet consists of 20 vessels with an average age of 12.5(1) years and a carrying capacity of 58.6k TEU. Twelve additional vessels, ranging from 1,781 TEU to 4,484 TEU, are expected to be delivered between Q3 2027 and Q1 2029. Name Type Size (DWT) Size (TEU) Year Built/D
Slide 6: Vessel Employment
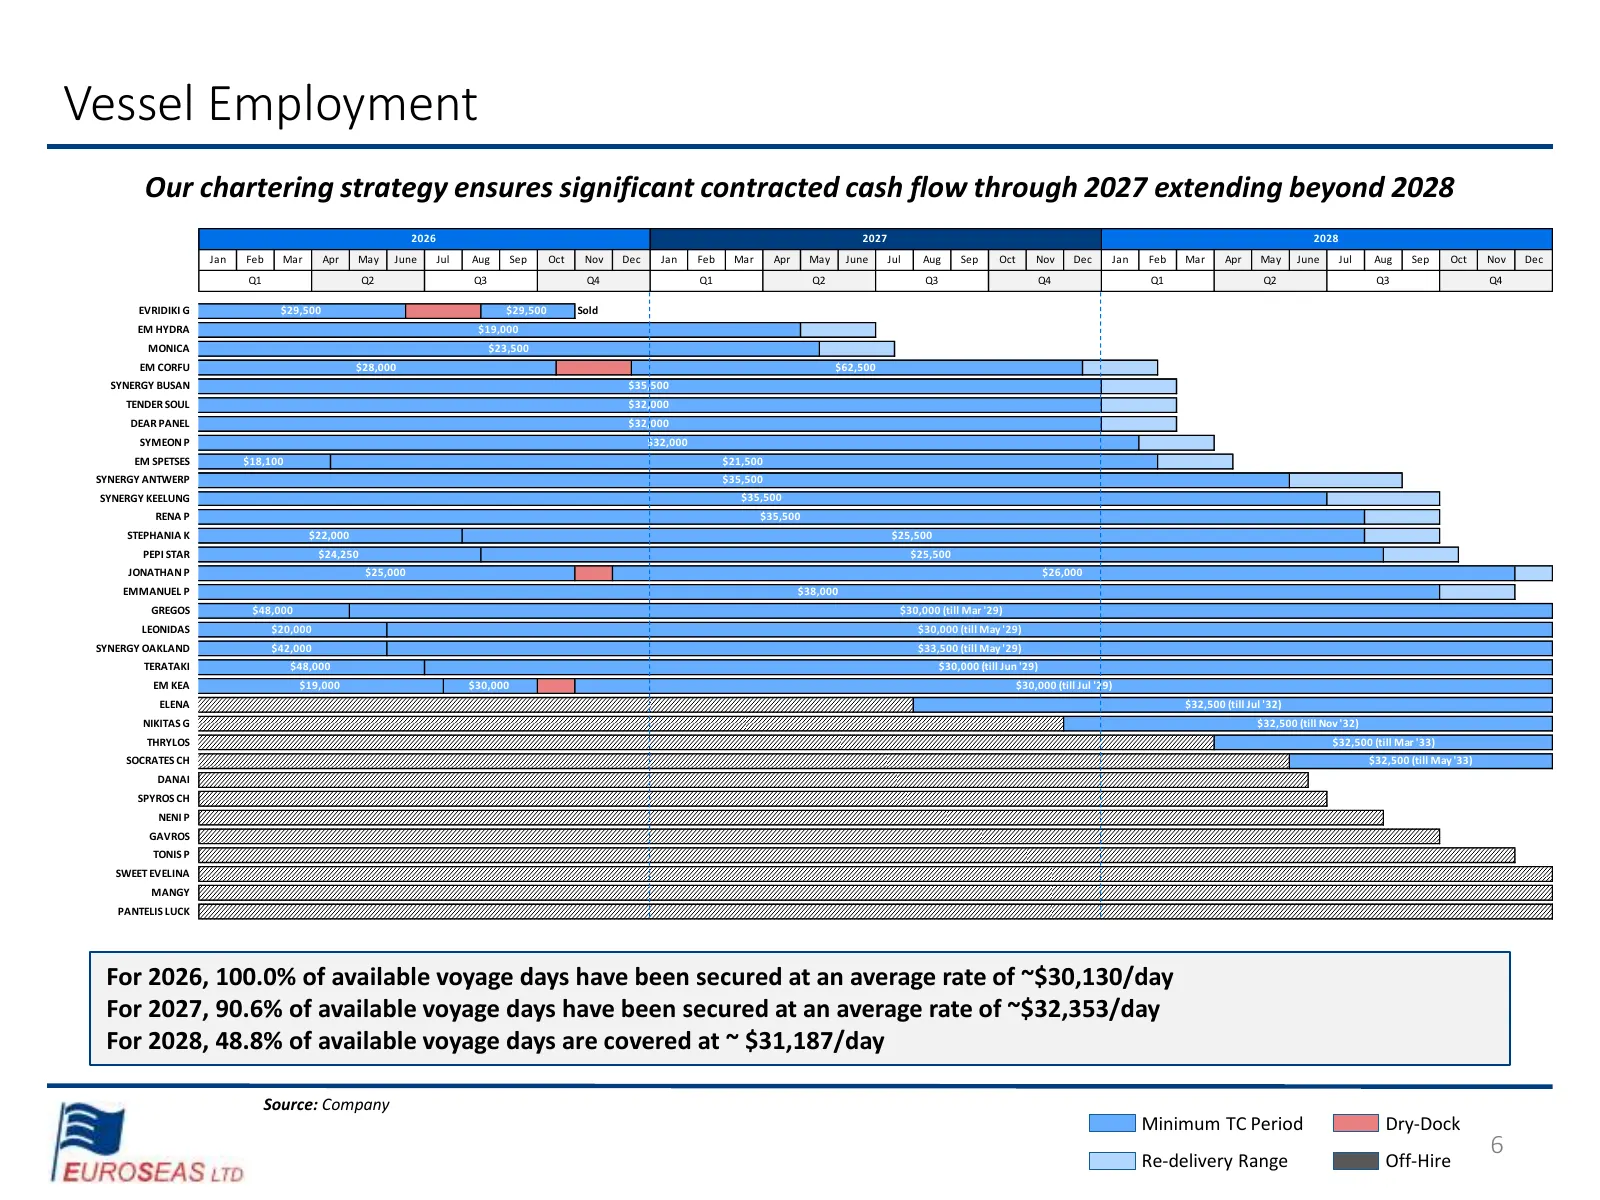
Vessel Employment Our chartering strategy ensures significant contracted cash flow through 2027 extending beyond 2028 2026 2027 2028 Jan Feb Mar Apr May June Jul Aug Sep Oct Nov Dec Jan Feb Mar Apr May June Jul Aug Sep Oct Nov Dec Jan Feb Mar Apr May June Jul Aug Sep Oct Nov Dec Q1 Q2 Q3 Q4 Q1 Q2 Q3

Slide 7: Market Overview
Market Overview 4 EUROSEAS 1p
Slide 8: Containership Market Highlights – Q3 2026
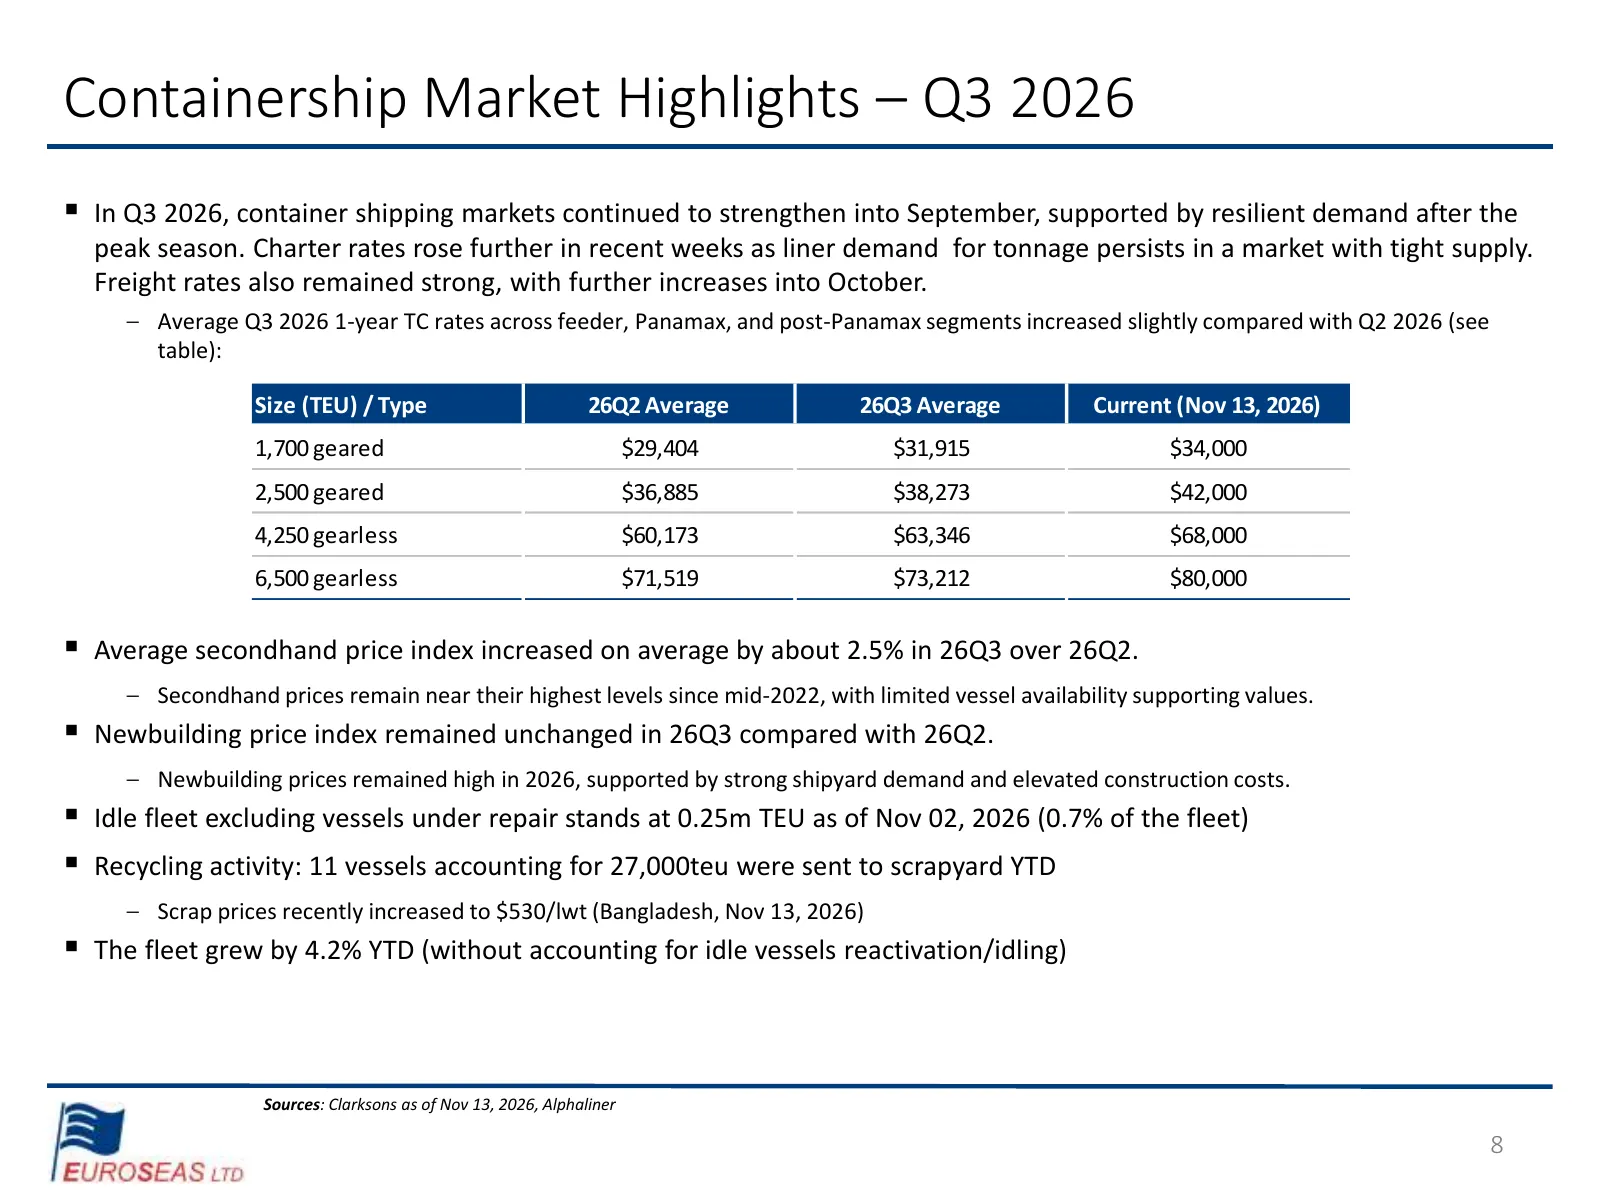
Containership Market Highlights – Q3 2026 ▪ In Q3 2026, container shipping markets continued to strengthen into September, supported by resilient demand after the peak season. Charter rates rose further in recent weeks as liner demand for tonnage persists in a market with tight supply. Freight rates
Slide 9: Last 10 Year 6-12 Month TC Rates ($/day)
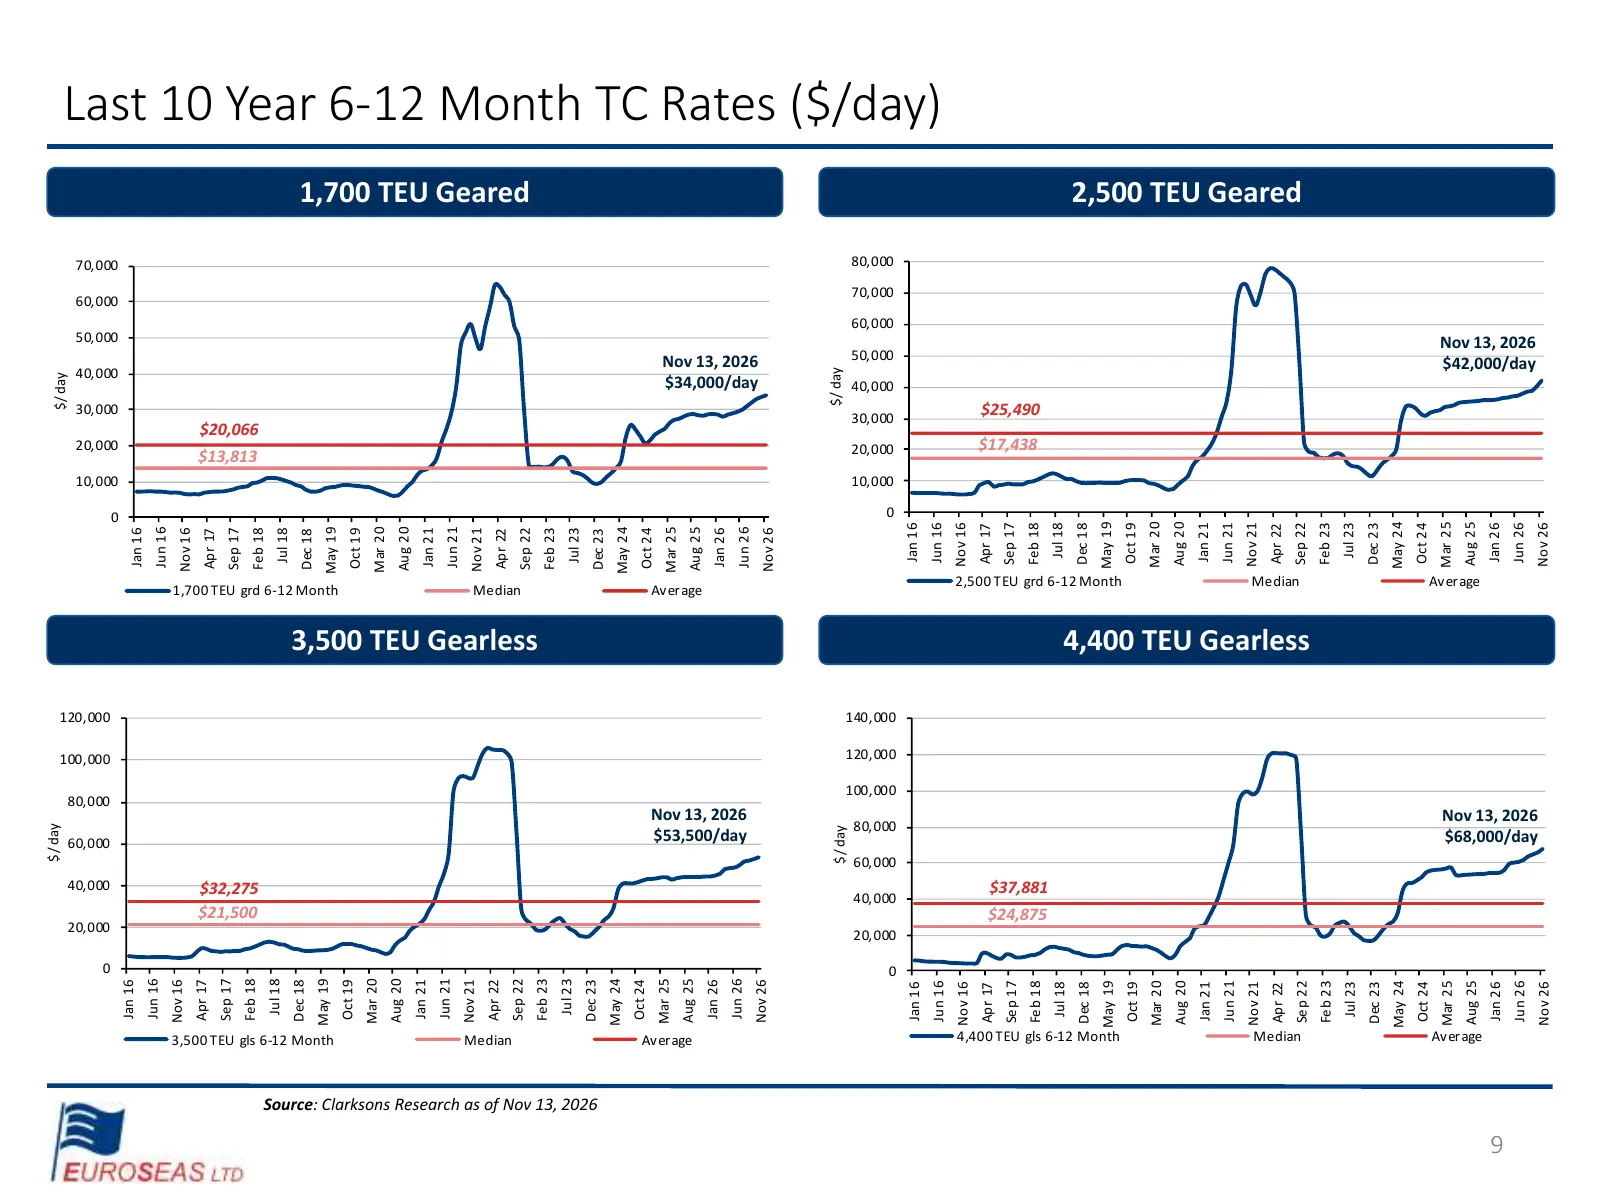
$/ day $/ day 20,000 40,000 60,000 80,000 0 100,000 120,000 10,000 20,000 30,000 40,000 50,000 60,000 70,000 0 Jan 16 Jan 16 Jun 16 Jun 16 Nov 16 Nov 16 Apr 17 Apr 17 Sep 17 Sep 17 $21,500 $13,813 Feb 18 $32,275 $20,066 Feb 18 Jul 18 Jul 18 Dec 18 Dec 18 May 19 3,500 TEU gls 6-12 Month 1,700 TEU grd
Slide 10: World GDP & Shipping Demand Growth
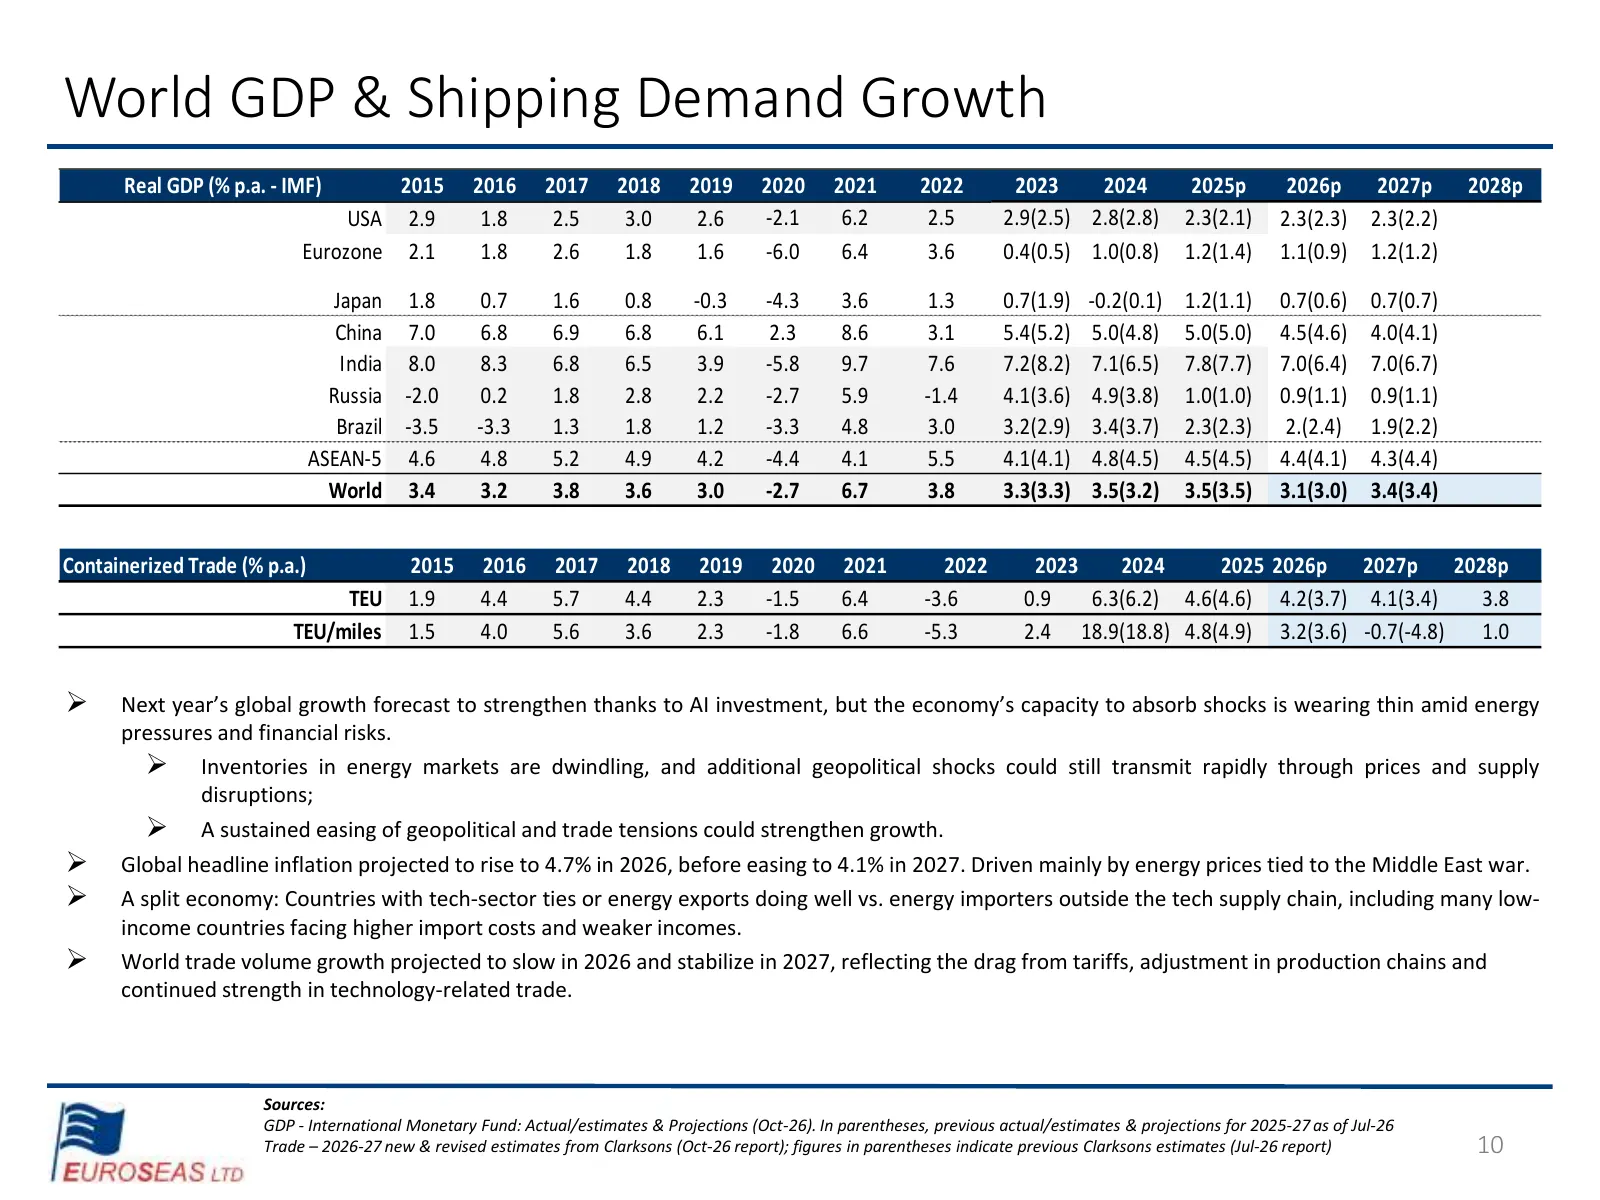
World GDP & Shipping Demand Growth Real GDP (% p.a. - IMF) 2015 2016 2017 2018 2019 2020 2021 2022 2023 2024 2025p 2026p 2027p 2028p USA 2.9 1.8 2.5 3.0 2.6 -2.1 6.2 2.5 2.9(2.5) 2.8(2.8) 2.3(2.1) 2.3(2.3) 2.3(2.2) Eurozone 2.1 1.8 2.6 1.8 1.6 -6.0 6.4 3.6 0.4(0.5) 1.0(0.8) 1.2(1.4) 1.1(0.9) 1.2(1.2
Slide 11: Age Profile and Orderbook
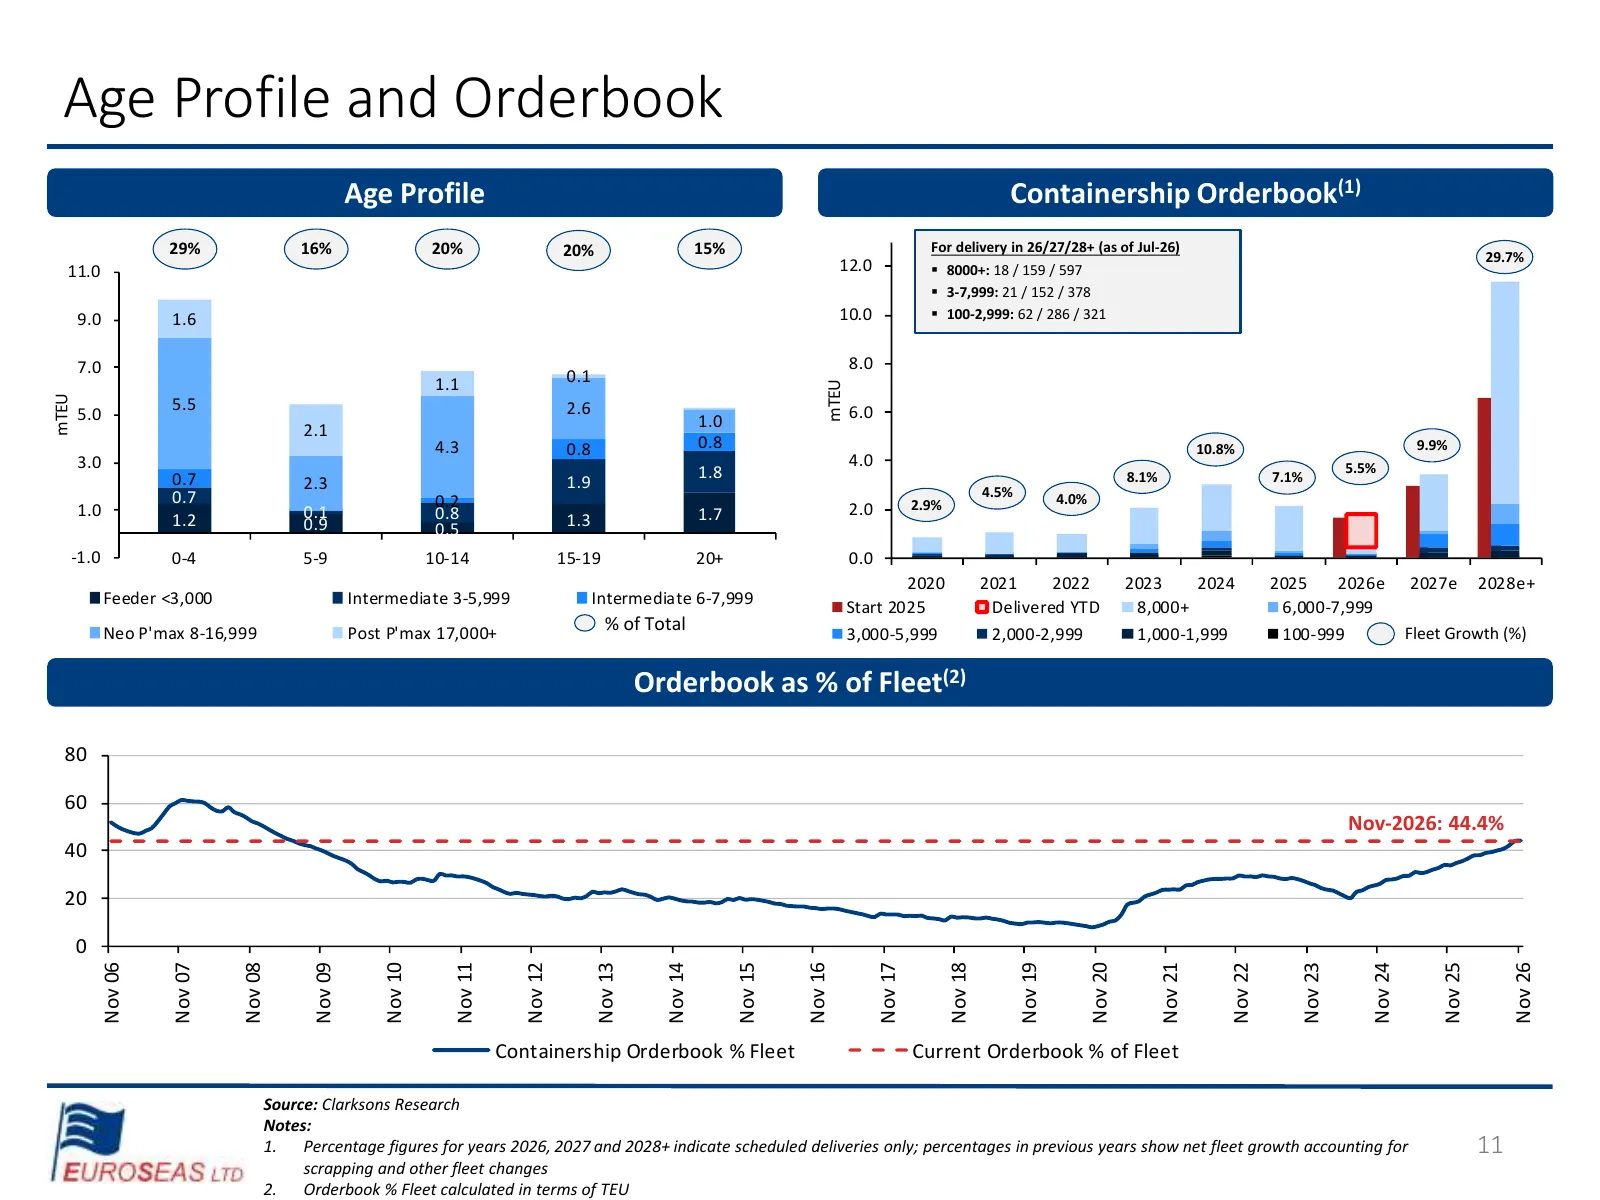
Age Profile and Orderbook Age Profile Containership Orderbook(1) 29% 16% 20% 20% 15% For delivery in 26/27/28+ (as of Jul-26) 29.7% 11.0 12.0 ▪ 8000+: 18 / 159 / 597 ▪ 3-7,999: 21 / 152 / 378 9.0 1.6 10.0 ▪ 100-2,999: 62 / 286 / 321 7.0 8.0 1.1 0.1 mTEU mTEU 5.5 2.6 6.0 5.0 1.0 2.1 4.3 0.8 0.8 10.8%
Slide 12: Fleet Age Profile and Orderbook, 1,000-3,000 TEU
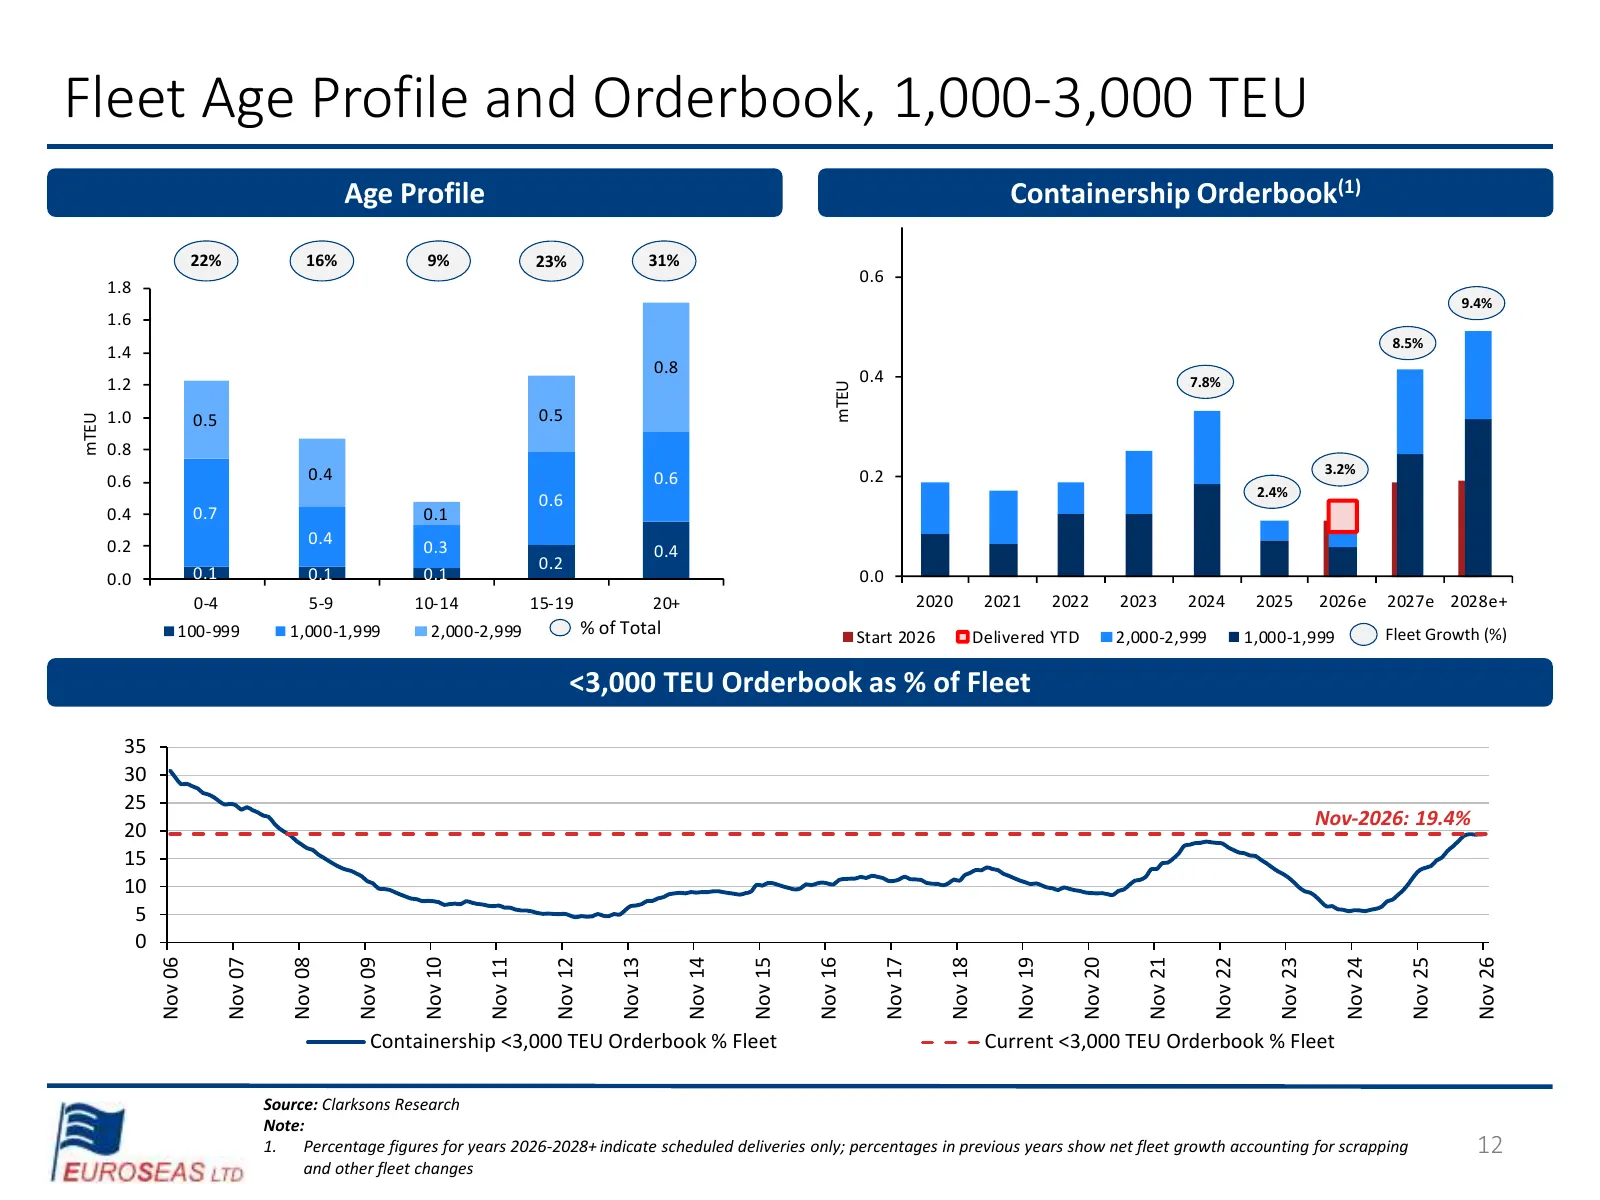
Fleet Age Profile and Orderbook, 1,000-3,000 TEU Age Profile Containership Orderbook(1) 22% 16% 9% 23% 31% 0.6 1.8 9.4% 1.6 8.5% 1.4 0.8 0.4 1.2 7.8% mTEU 1.0 0.5 0.5 mTEU 0.8 0.4 0.2 3.2% 0.6 0.6 2.4% 0.6 0.4 0.7 0.1 0.2 0.4 0.3 0.4 0.2 0.0 0.1 0.1 0.1 0.0 0-4 5-9 10-14 15-19 20+ 2020 2021 2022 202
Slide 13: Fleet Age Profile and Orderbook, 3,000-7,999 TEU
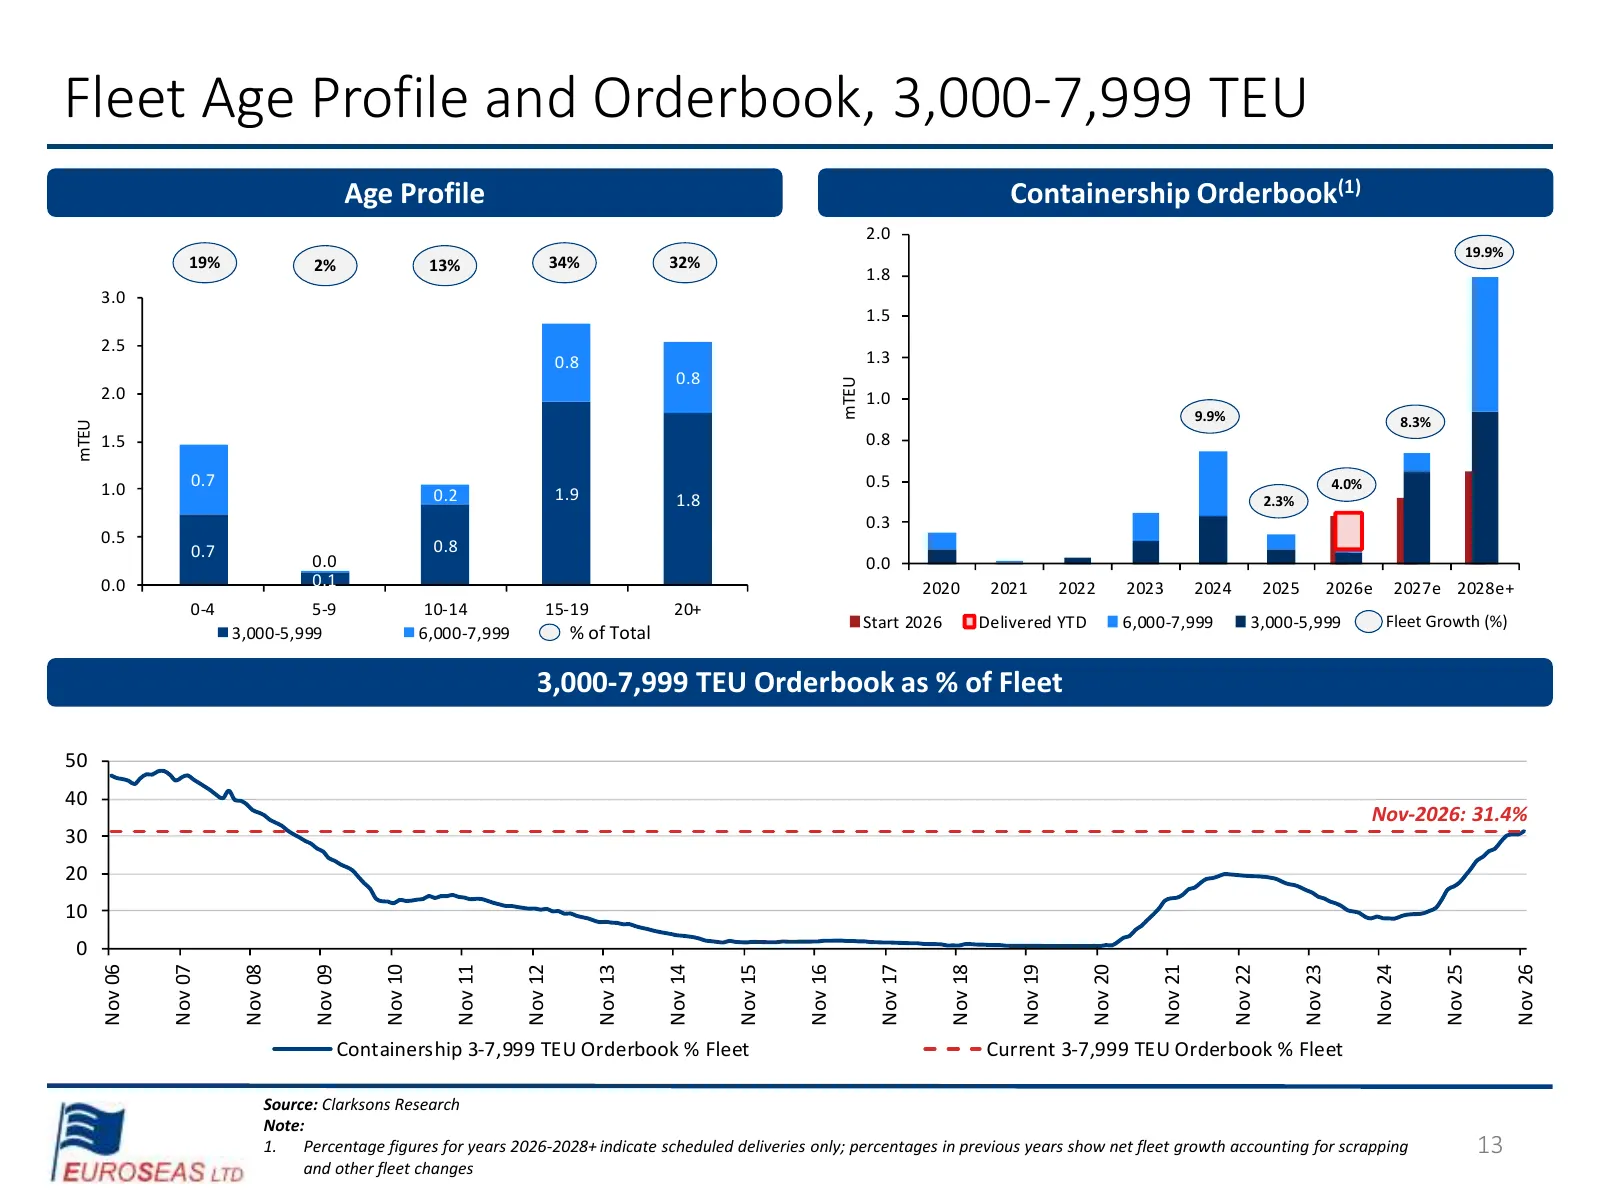
Fleet Age Profile and Orderbook, 3,000-7,999 TEU Age Profile Containership Orderbook(1) 2.0 19.9% 19% 2% 13% 34% 32% 1.8 3.0 1.5 2.5 0.8 1.3 0.8 mTEU 2.0 1.0 9.9% 8.3% mTEU 1.5 0.8 1.0 0.7 0.5 4.0% 0.2 1.9 1.8 2.3% 0.3 0.5 0.8 0.7 0.0 0.0 0.0 0.1 2020 2021 2022 2023 2024 2025 2026e 2027e 2028e+ 0-4
Slide 14: Different Supply Outlook for Feeders & Intermediate Containerships
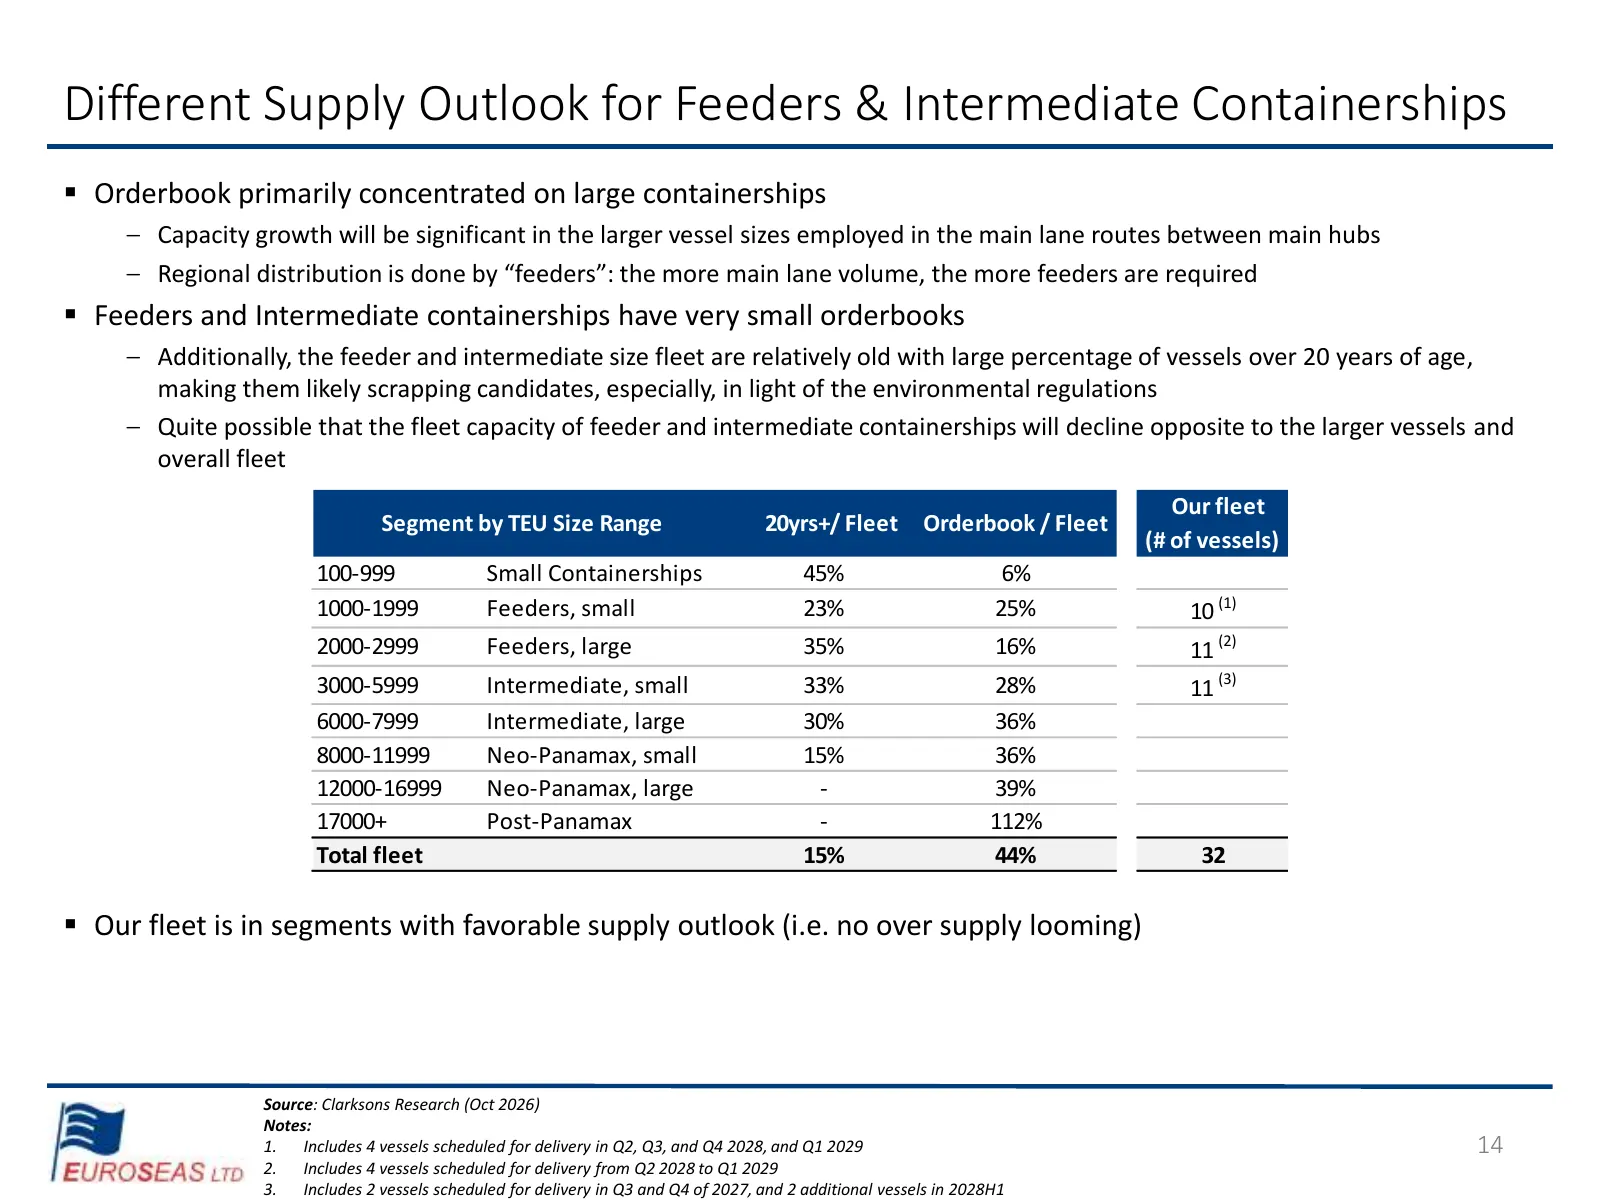
Different Supply Outlook for Feeders & Intermediate Containerships ▪ Orderbook primarily concentrated on large containerships ‒ Capacity growth will be significant in the larger vessel sizes employed in the main lane routes between main hubs ‒ Regional distribution is done by “feeders”: the more mai
Slide 15: Outlook Summary
Outlook Summary ▪ Container shipping markets remained strong throughout Q3, supported by strong demand and weather-related disruptions in Asia. Charter rates have continued to rise amid strong liner demand and tight vessel supply, while freight rates remain exceptionally high. Overall, 2026 has been
Slide 16: Market Evolution
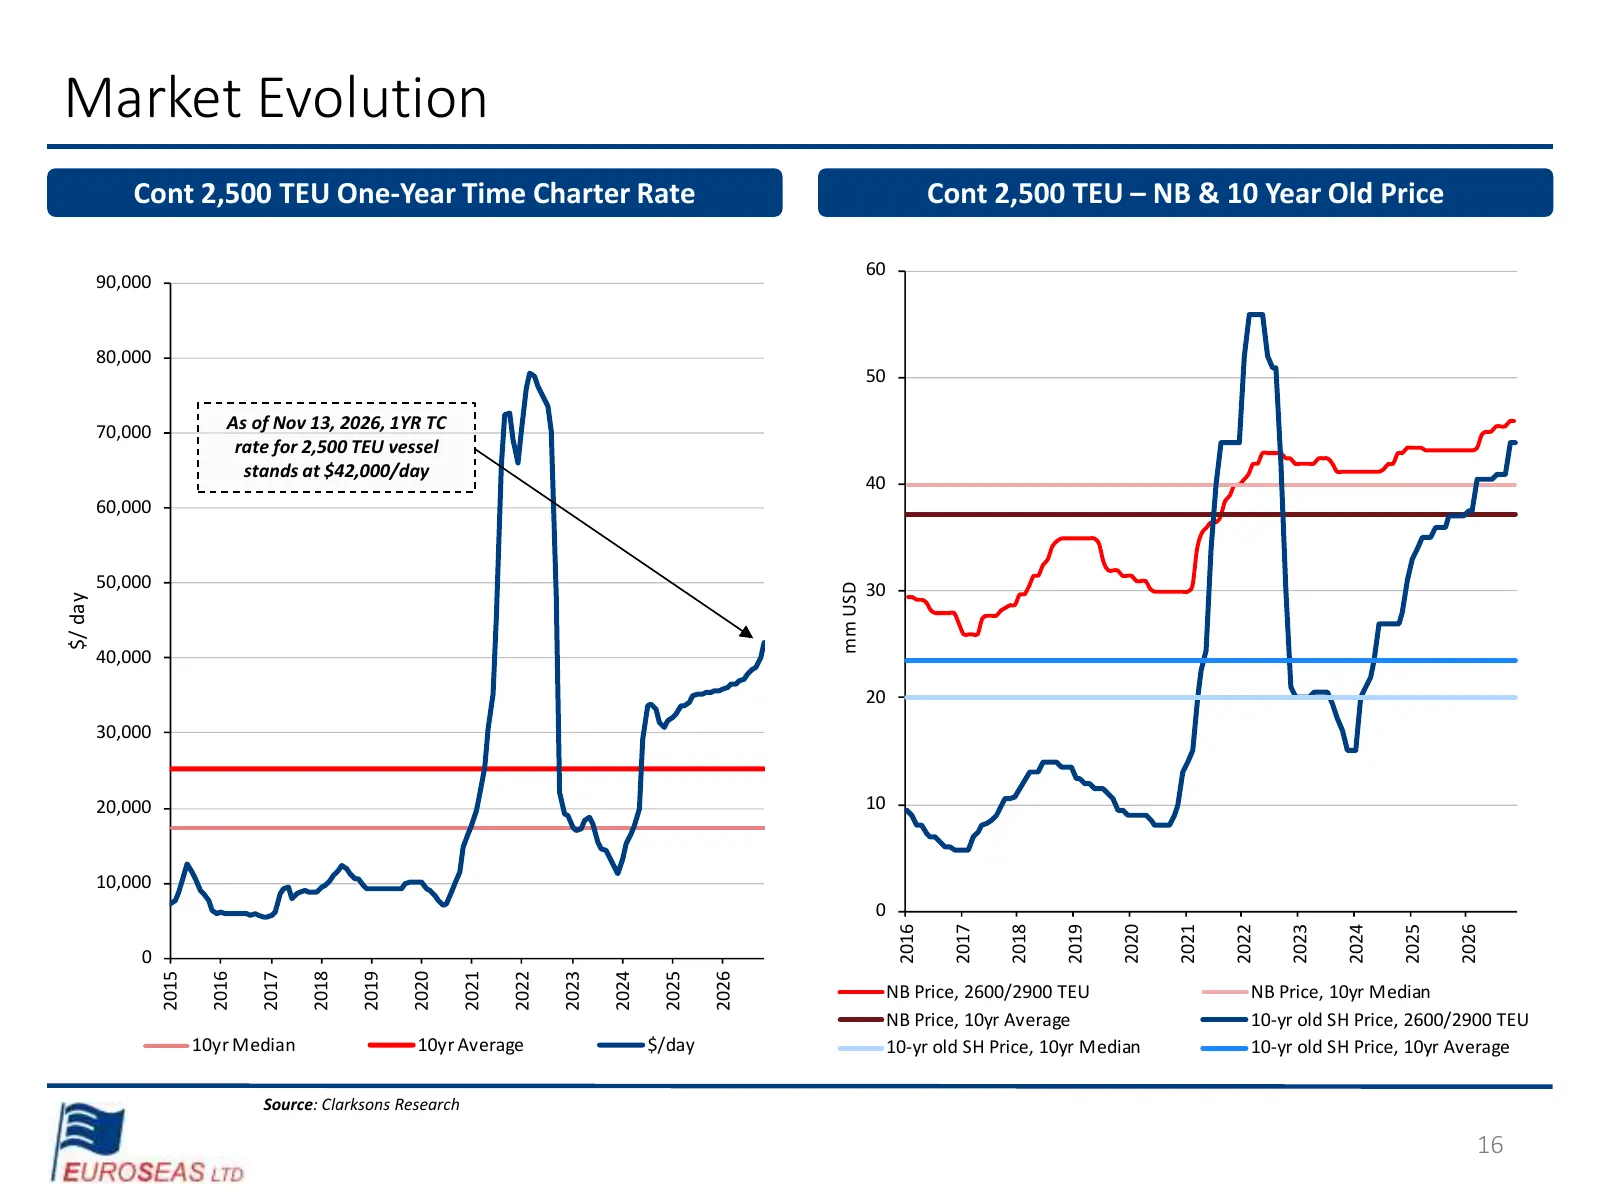
Market Evolution Cont 2,500 TEU One-Year Time Charter Rate Cont 2,500 TEU – NB & 10 Year Old Price 60 90,000 80,000 50 70,000 As of Nov 13, 2026, 1YR TC rate for 2,500 TEU vessel stands at $42,000/day 40 60,000 50,000 30 mm USD $/ day 40,000 20 30,000 20,000 10 10,000 0 2018 2019 2020 2021 2022 2023

Slide 17: Financial Overview
Financial Overview 4 EUROSEAS 1p
Slide 18: Financial Highlights: Q3 and 9M of 2025 and 2026
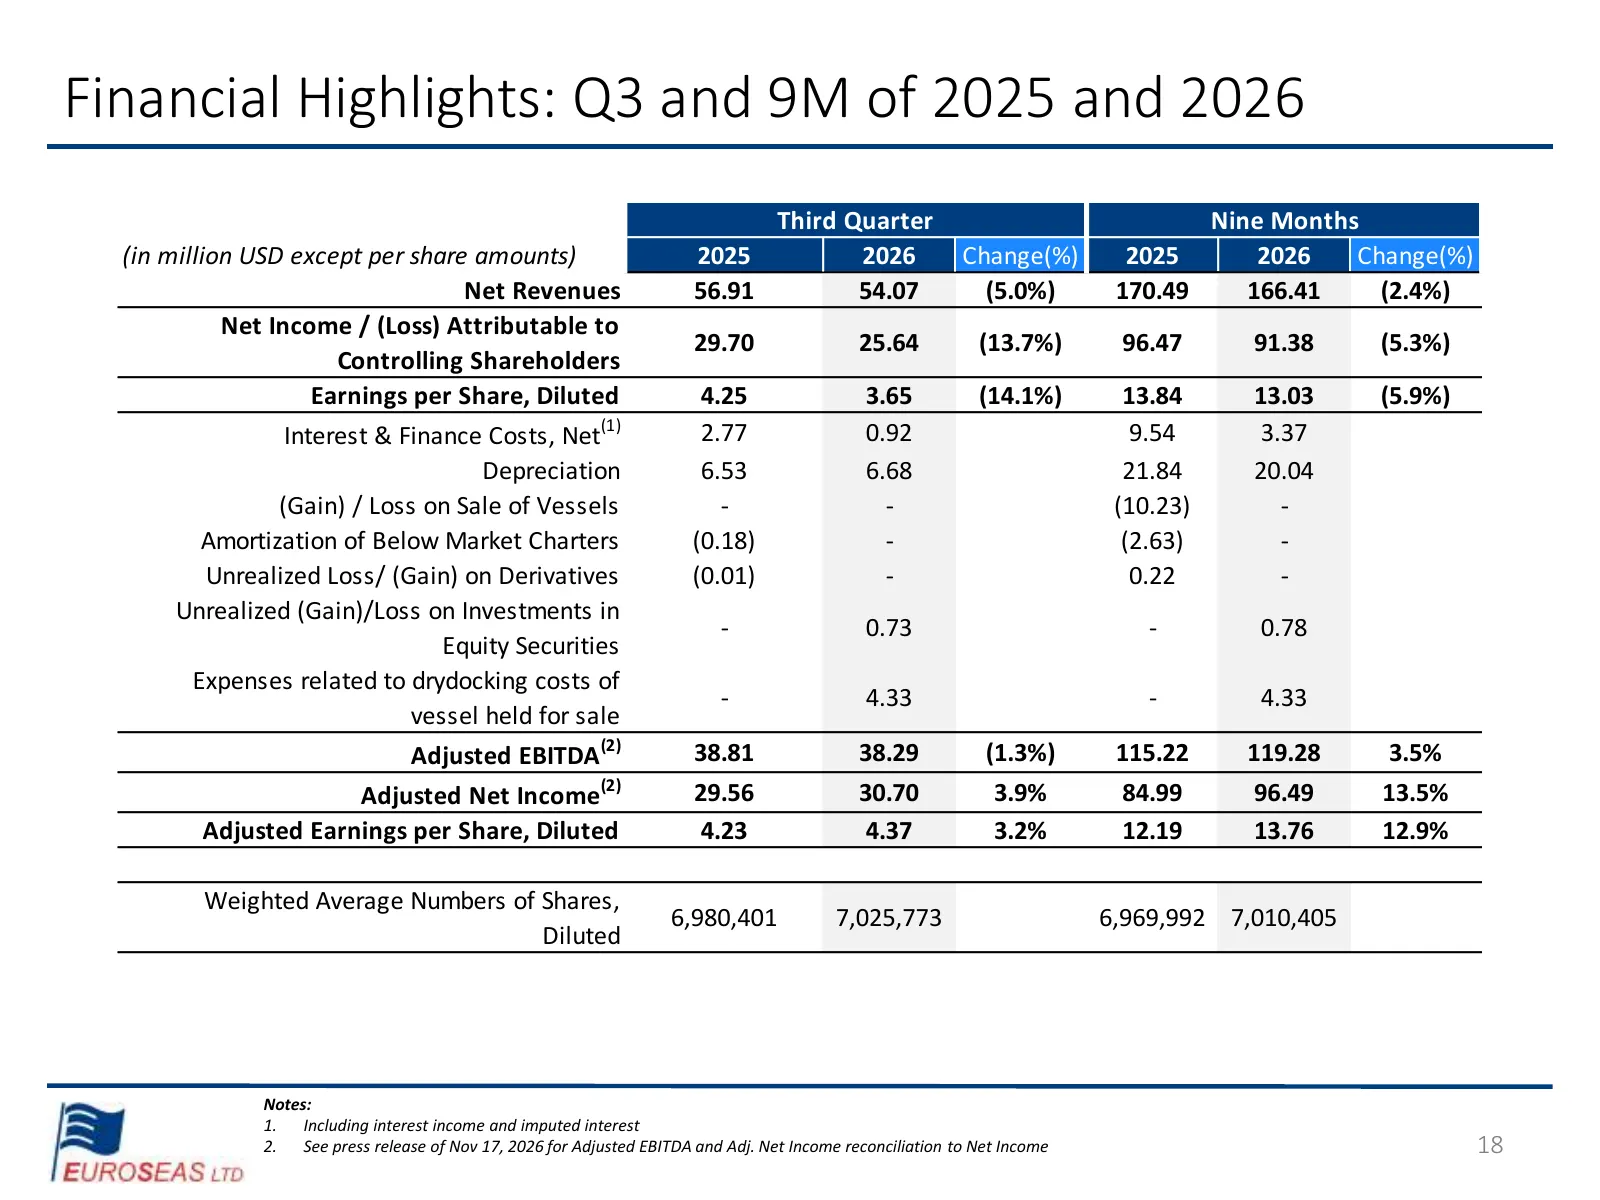
Financial Highlights: Q3 and 9M of 2025 and 2026 Third Quarter Nine Months (in million USD except per share amounts) 2025 2026 Change(%) 2025 2026 Change(%) Net Revenues 56.91 54.07 (5.0%) 170.49 166.41 (2.4%) Net Income / (Loss) Attributable to 29.70 25.64 (13.7%) 96.47 91.38 (5.3%) Controlling Sha
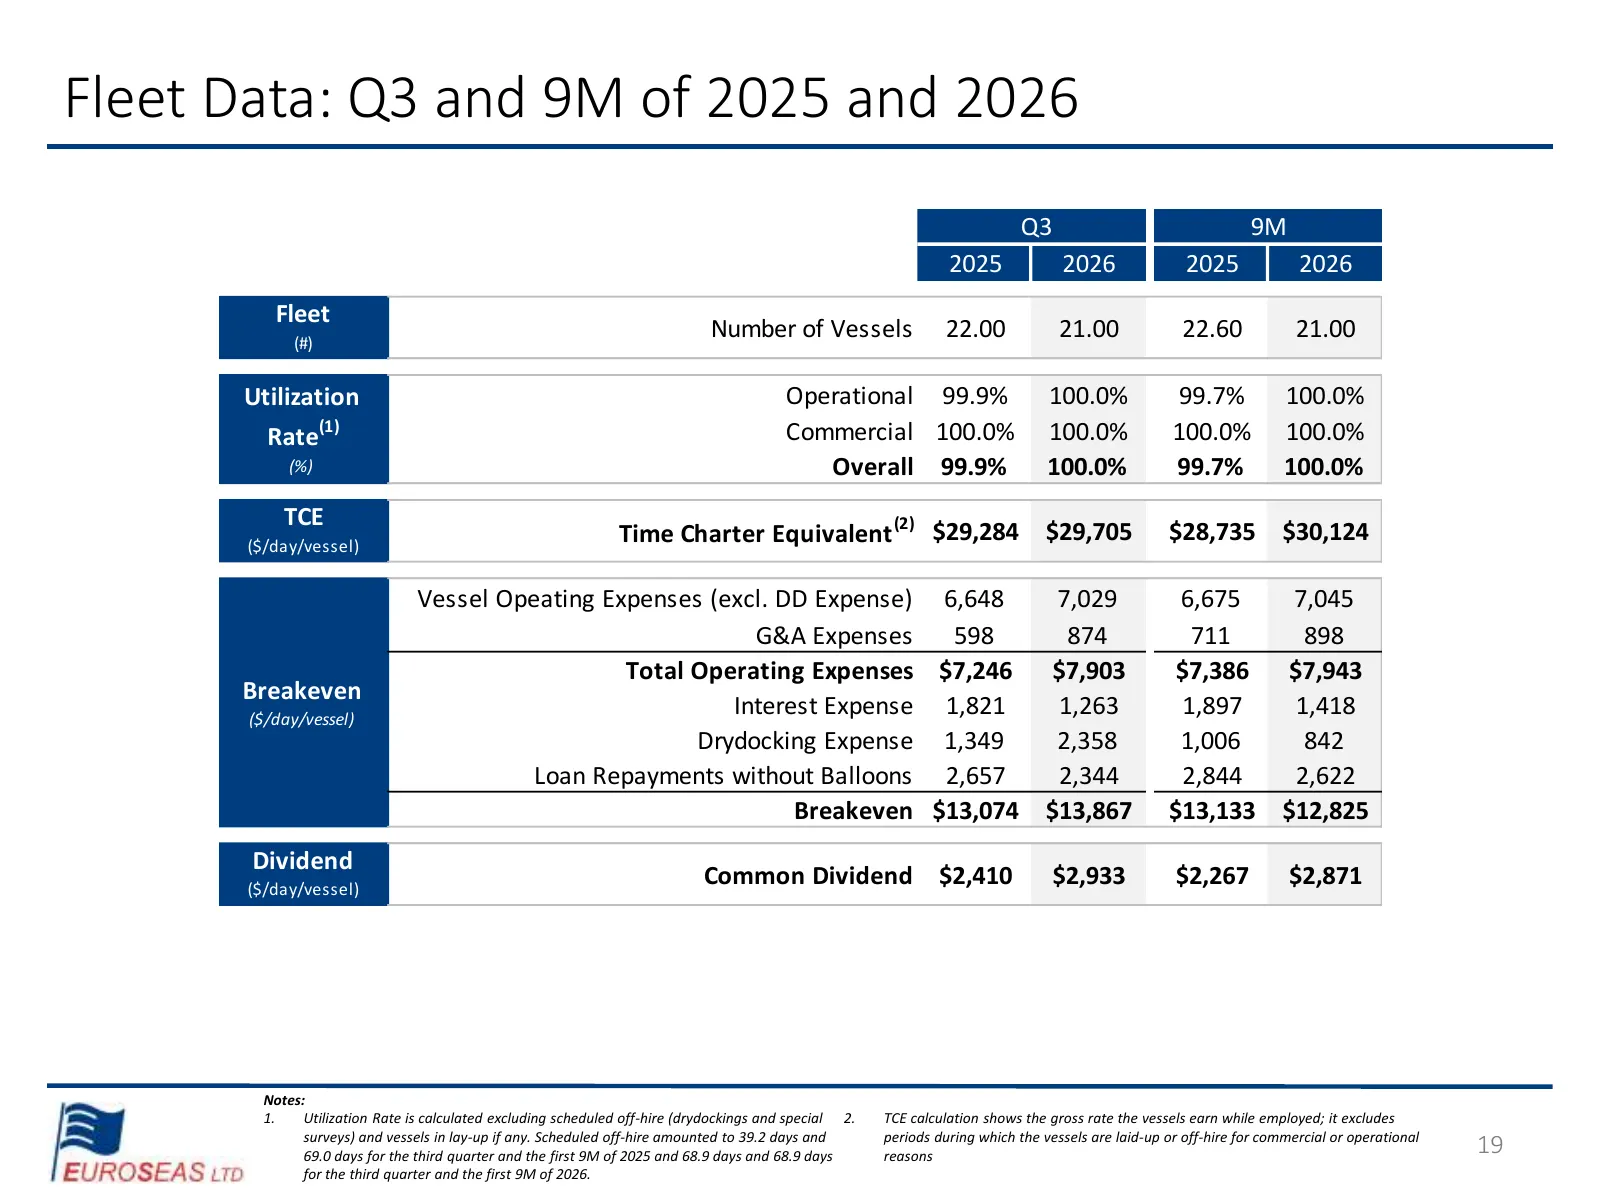
Slide 19: Fleet Data: Q3 and 9M of 2025 and 2026
Fleet Data: Q3 and 9M of 2025 and 2026 Q3 9M 2025 2026 2025 2026 Fleet (#) Number of Vessels 22.00 21.00 22.60 21.00 Utilization Operational 99.9% 100.0% 99.7% 100.0% (1) Commercial 100.0% 100.0% 100.0% 100.0% Rate (%) Overall 99.9% 100.0% 99.7% 100.0% TCE ($/day/vessel) Time Charter Equivalent (2)
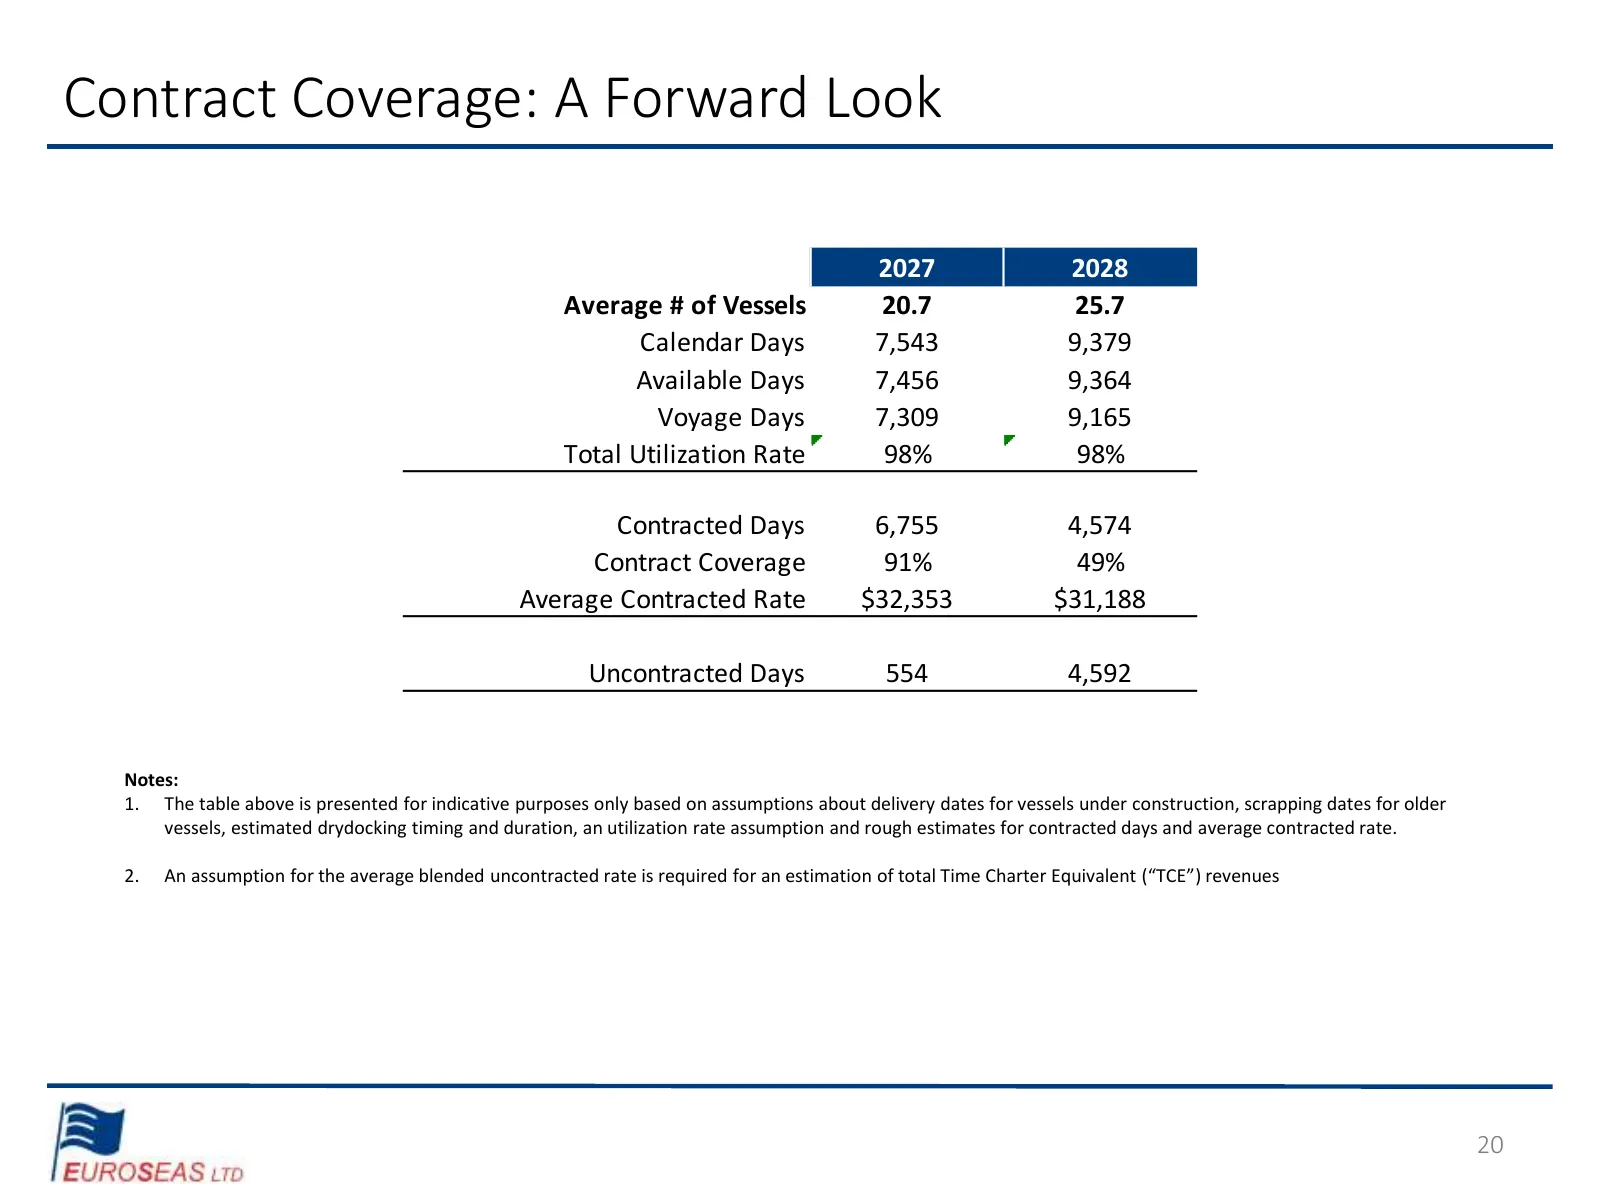
Slide 20: Contract Coverage: A Forward Look
Contract Coverage: A Forward Look 2027 2028 Average # of Vessels 20.7 25.7 Calendar Days 7,543 9,379 Available Days 7,456 9,364 Voyage Days 7,309 9,165 Total Utilization Rate 98% 98% Contracted Days 6,755 4,574 Contract Coverage 91% 49% Average Contracted Rate $32,353 $31,188 Uncontracted Days 554 4
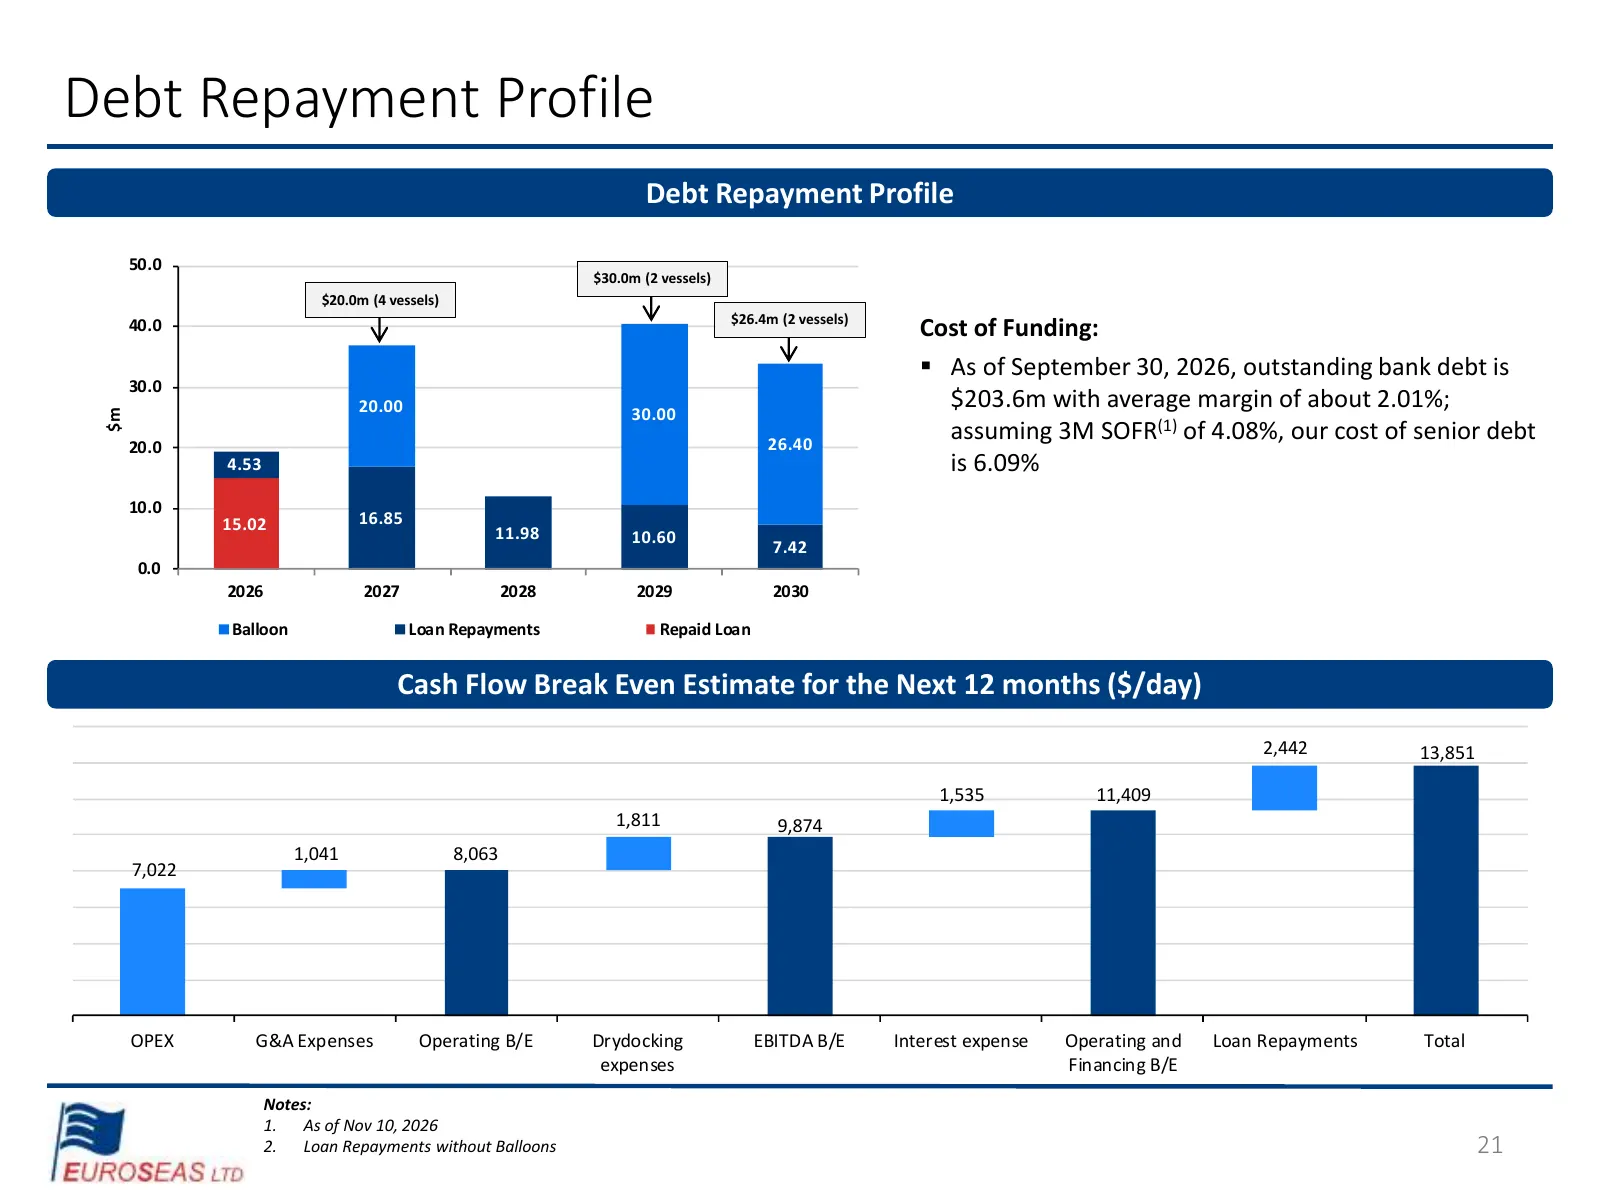
Slide 21: Debt Repayment Profile
Debt Repayment Profile Debt Repayment Profile 50.0 $30.0m (2 vessels) $20.0m (4 vessels) $26.4m (2 vessels) 40.0 Cost of Funding: ▪ As of September 30, 2026, outstanding bank debt is 30.0 20.00 30.00 $203.6m with average margin of about 2.01%; $m 26.40 assuming 3M SOFR(1) of 4.08%, our cost of senio
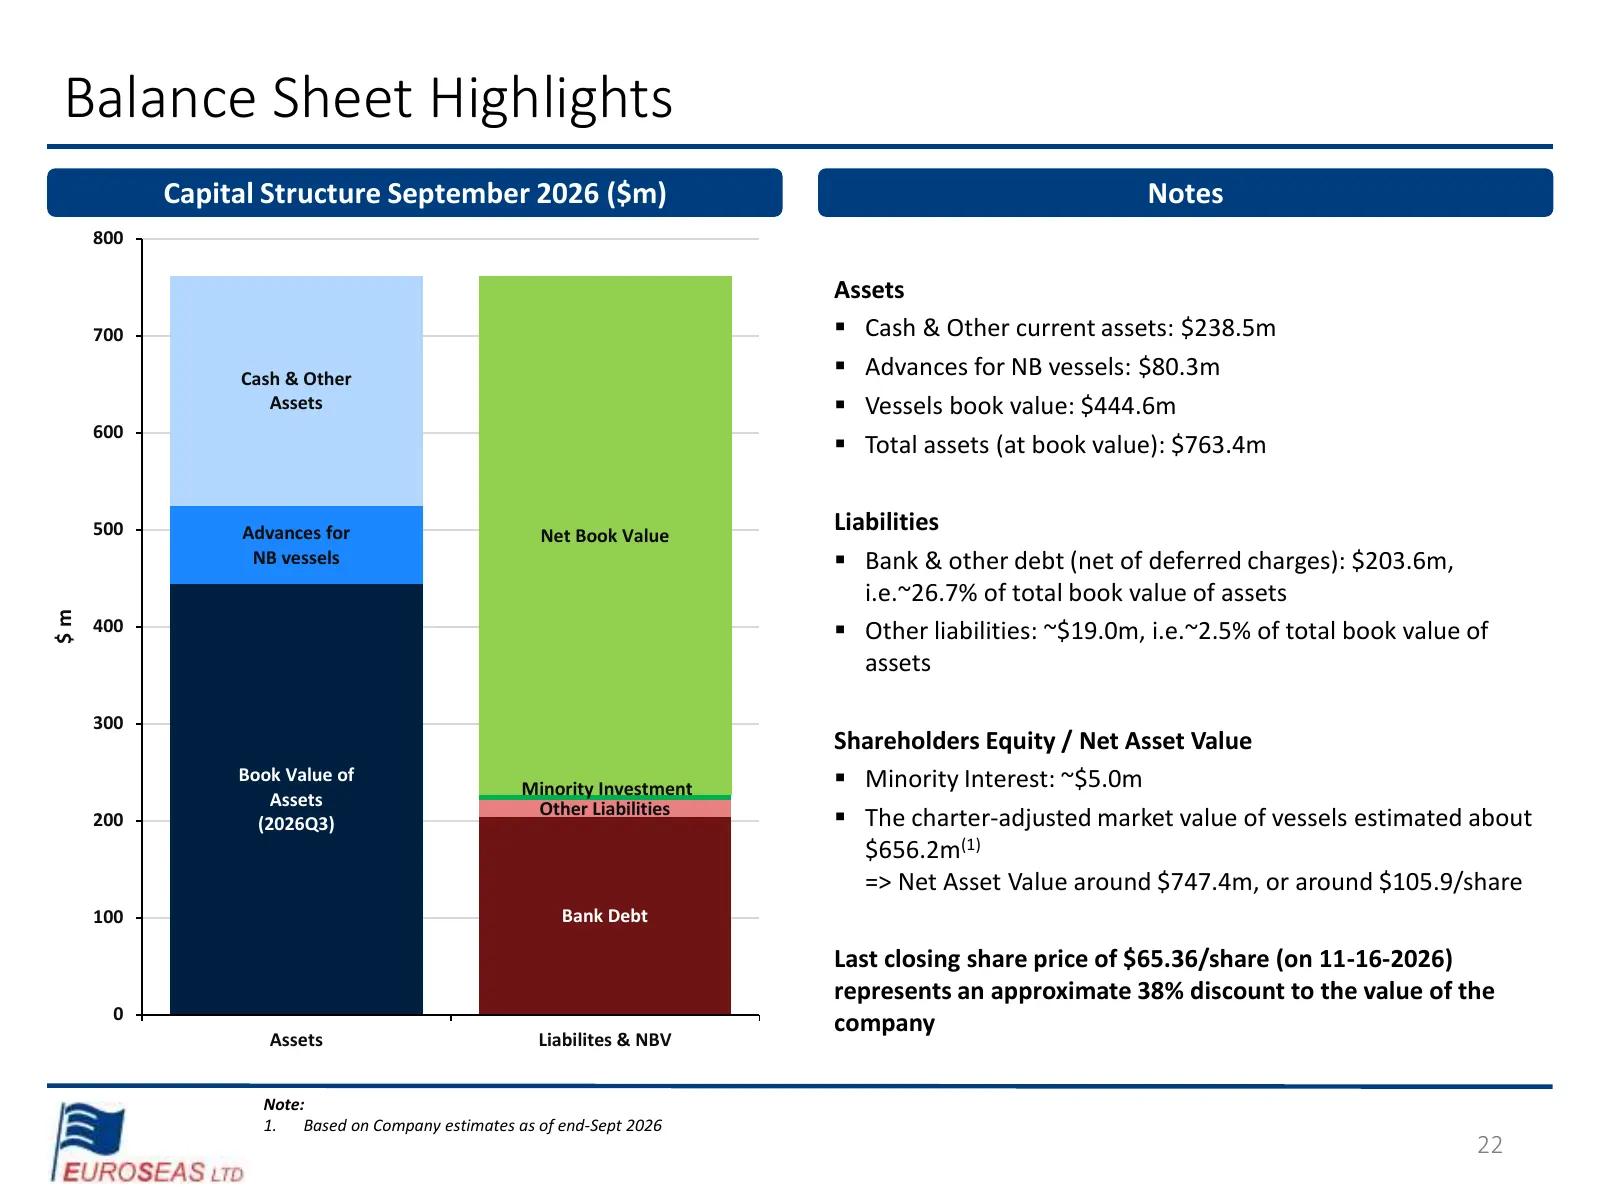
Slide 22: Balance Sheet Highlights
Balance Sheet Highlights Capital Structure September 2026 ($m) Notes 800 Assets 700 ▪ Cash & Other current assets: $238.5m Cash & Other ▪ Advances for NB vessels: $80.3m Assets ▪ Vessels book value: $444.6m 600 ▪ Total assets (at book value): $763.4m 500 Advances for Net Book Value Liabilities NB ve
Slide 23: Euroseas Contacts
Euroseas Contacts Euroseas Ltd. c/o Eurobulk Ltd 4, Messogiou & Evropis Street 151 24 Maroussi, Greece www.euroseas.gr euroseas@euroseas.gr Tel. +30-211-1804005 Fax.+30-211-1804097 Tasos Aslidis Nicolas Bornozis / Markella Kara Chief Financial Officer Investor Relations Euroseas Ltd. Capital Link, I
Source: company website
More decks from Euroseas Ltd.
 Q2 2026 Earnings Presentation23 slides · Aug 13, 2026
 Q1 2026 Earnings Presentation23 slides · May 21, 2026
 Q4 2025 Earnings Presentation23 slides · Feb 25, 2026
 Q3 2025 Earnings Presentation23 slides · Nov 18, 2025
 Q2 2025 Earnings Presentation21 slides · Aug 13, 2025
 Q1 2025 Earnings Presentation22 slides · Jun 18, 2025