National Penn Bancshares — IPO Roadshow (September 2009)
24 slides from National Penn Bancshares's IPO roadshow presentation, Sep 8, 2009
Slide 1: National Penn Bancshares, Inc. Follow-on Common Stock Offering
National Penn Bancshares, Inc. Follow-on Common Stock Offering NASDAQ: NPBC Glenn E. Moyer President & Chief Executive Officer Scott V. Fainor Chief Operating Officer Michael R. Reinhard Treasurer Michael J. Hughes Chief Financial Officer
Slide 2: Safe Harbor Regarding Forward Looking Statements
Safe Harbor Regarding Forward Looking Statements This presentation contains forward-looking information about National Penn Bancshares, Inc. that is intended to be covered by the safe harbor for forward-looking statements provided by the Private Securities Litigation Reform Act of 1995. Forward-look
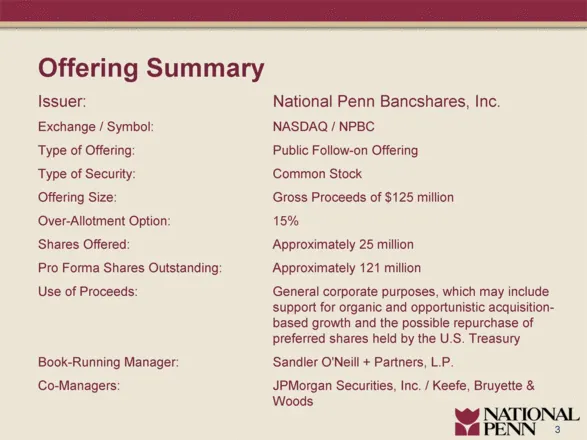
Slide 3: Offering Summary
Offering Summary 3 Issuer: National Penn Bancshares, Inc. Exchange / Symbol: NASDAQ / NPBC Type of Offering: Public Follow-on Offering Type of Security: Common Stock Offering Size: Gross Proceeds of $125 million Over-Allotment Option: 15% Shares Offered: Approximately 25 million Pro Forma Shares Out
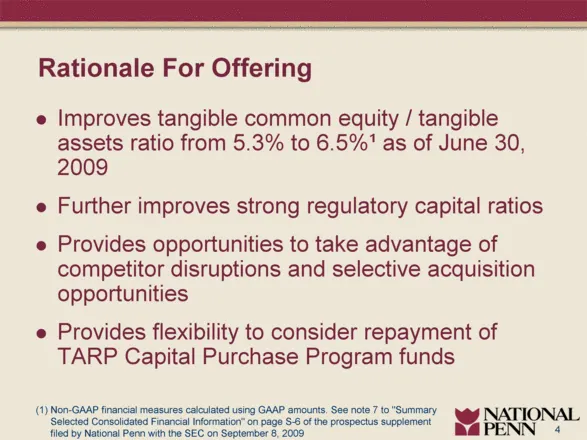
Slide 4: Rationale For Offering
Rationale For Offering Improves tangible common equity / tangible assets ratio from 5.3% to 6.5%1 as of June 30, 2009 Further improves strong regulatory capital ratios Provides opportunities to take advantage of competitor disruptions and selective acquisition opportunities Provides flexibility to c
Slide 5: National Penn Snapshot
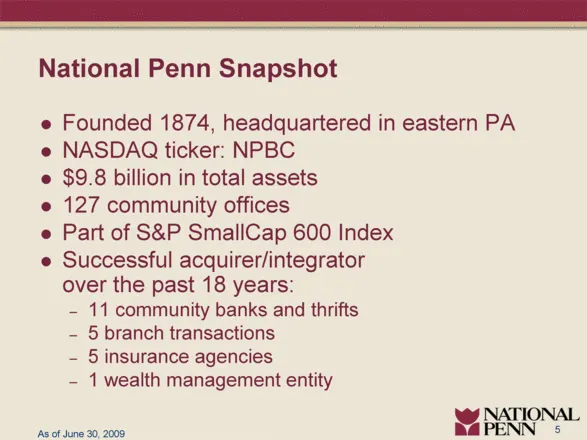
National Penn Snapshot Founded 1874, headquartered in eastern PA NASDAQ ticker: NPBC $9.8 billion in total assets 127 community offices Part of S&P SmallCap 600 Index Successful acquirer/integrator over the past 18 years: 11 community banks and thrifts 5 branch transactions 5 insurance agencies 1 we
Slide 6: Attractive Franchise in the Heart of the Mid-Atlantic Region
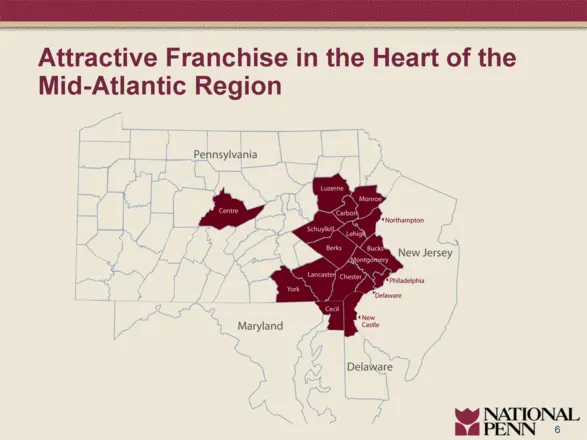
Attractive Franchise in the Heart of the Mid-Atlantic Region 6
Slide 7: Strong Market Share in Demographically Attractive Counties
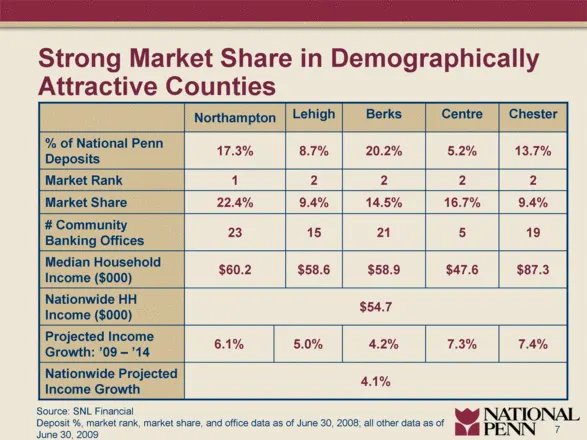
4.1% Nationwide Projected Income Growth $54.7 Nationwide HH Income ($000) $87.3 $47.6 $58.9 $58.6 $60.2 Median Household Income ($000) 7.4% 7.3% 4.2% 5.0% 6.1% Projected Income Growth: ’09 – ’14 19 5 21 15 23 # Community Banking Offices 9.4% 16.7% 14.5% 9.4% 22.4% Market Share 2 2 2 2 1 Market Rank
Slide 8: Market Disruption is a Key Opportunity
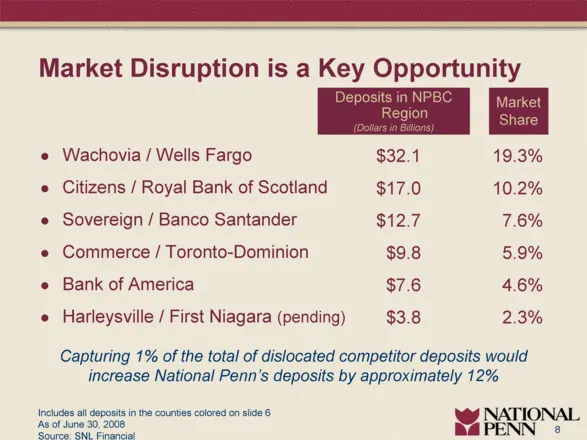
8 Market Disruption is a Key Opportunity Wachovia / Wells Fargo Citizens / Royal Bank of Scotland Sovereign / Banco Santander Commerce / Toronto-Dominion Bank of America Harleysville / First Niagara (pending) Deposits in NPBC Region (Dollars in Billions) $32.1 $17.0 $12.7 $9.8 $7.6 $3.8 Includes all
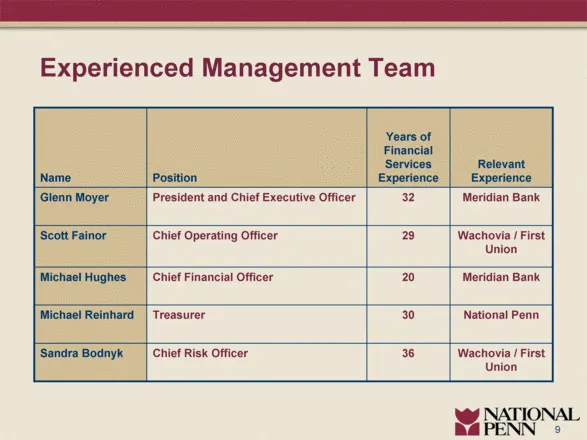
Slide 9: Experienced Management Team
Wachovia / First Union 36 Chief Risk Officer Sandra Bodnyk Wachovia / First Union 29 Chief Operating Officer Scott Fainor Meridian Bank 20 Chief Financial Officer Michael Hughes National Penn 30 Treasurer Michael Reinhard Meridian Bank 32 President and Chief Executive Officer Glenn Moyer Relevant Ex
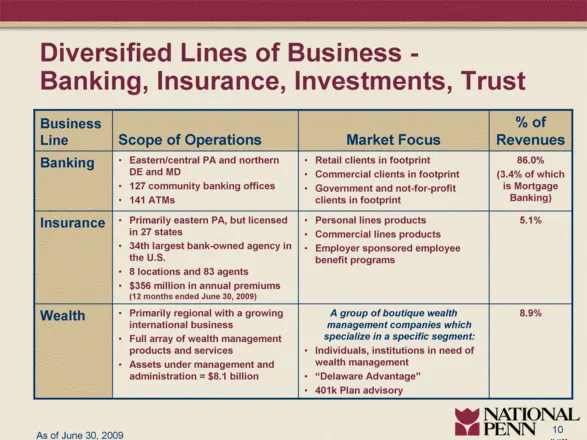
Slide 10: Business Segments: Banking, Wealth, Insurance
5.1% Personal lines products Commercial lines products Employer sponsored employee benefit programs Primarily eastern PA, but licensed in 27 states 34th largest bank-owned agency in the U.S. 8 locations and 83 agents $356 million in annual premiums (12 months ended June 30, 2009) Insurance 8.9% A gr
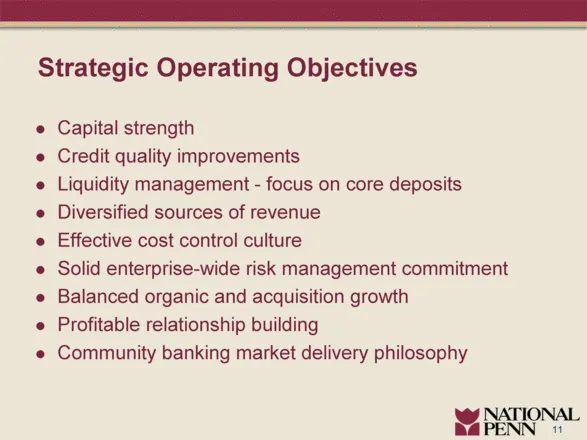
Slide 11: Strategic Operating Objectives
Strategic Operating Objectives Capital strength Credit quality improvements Liquidity management - focus on core deposits Diversified sources of revenue Effective cost control culture Solid enterprise-wide risk management commitment Balanced organic and acquisition growth Profitable relationship bui
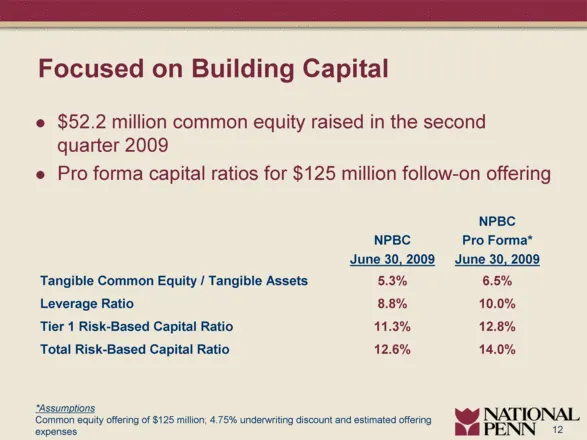
Slide 12: Focused on Building Capital
$52.2 million common equity raised in the second quarter 2009 Pro forma capital ratios for $125 million follow-on offering 12 10.0% 8.8% Leverage Ratio 12.8% 11.3% Tier 1 Risk-Based Capital Ratio 14.0% 12.6% Total Risk-Based Capital Ratio 6.5% 5.3% Tangible Common Equity / Tangible Assets NPBC Pro F
Slide 13: Strong Historical Asset and Loan Growth
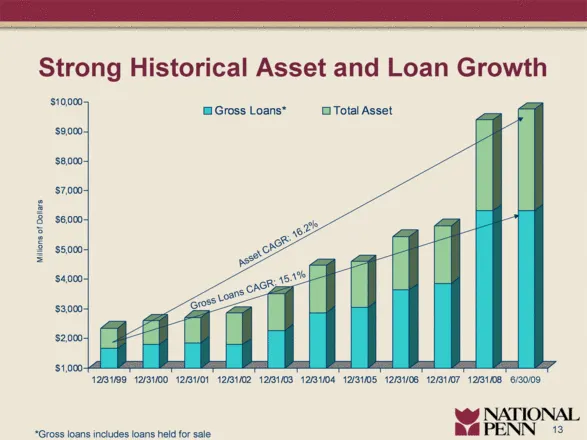
Strong Historical Asset and Loan Growth 13 Asset CAGR: 16.2% Gross Loans CAGR: 15.1% *Gross loans includes loans held for sale 6/30/09 $1,000 $2,000 $3,000 $4,000 $5,000 $6,000 $7,000 $8,000 $9,000 $10,000 Millions of Dollars 12/31/99 12/31/00 12/31/01 12/31/02 12/31/03 12/31/04 12/31/05 12/31/06 12
Slide 14: Credit Quality Compares Favorably to Peers
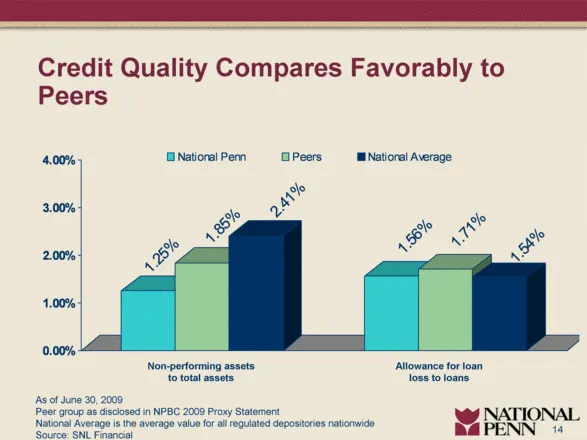
Credit Quality Compares Favorably to Peers Non-performing assets to total assets Allowance for loan loss to loans 14 As of June 30, 2009 Peer group as disclosed in NPBC 2009 Proxy Statement National Average is the average value for all regulated depositories nationwide Source: SNL Financial 1.25% 1.
Slide 15: Loan Risk Profile is Balanced
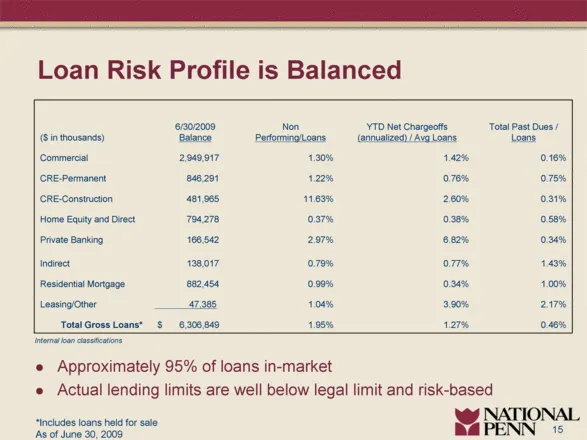
Loan Risk Profile is Balanced 1.27% 3.90% 0.34% 0.77% 6.82% 0.38% 2.60% 0.76% 1.42% YTD Net Chargeoffs (annualized) / Avg Loans 0.46% 1.95% $ 6,306,849 Total Gross Loans* 2.17% 1.04% 47,385 Leasing/Other 1.00% 0.99% 882,454 Residential Mortgage 1.43% 0.79% 138,017 Indirect 0.34% 2.97% 166,542 Privat
Slide 16: Loan Risk Profile is Balanced
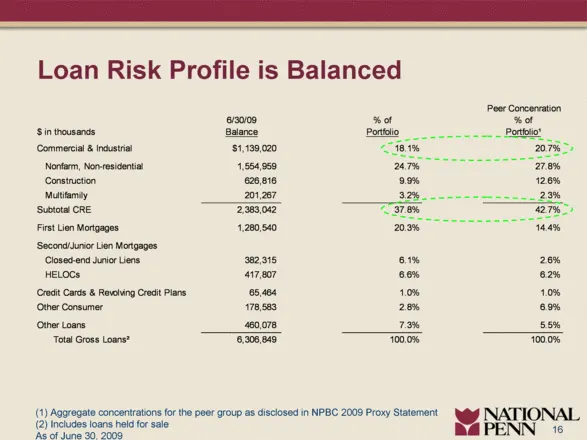
Loan Risk Profile is Balanced 16 Peer Concenration 6/30/09 % of % of $ in thousands Balance Portfolio Portfolio¹ Commercial & Industrial $1,139,020 18.1% 20.7% Nonfarm, Non-residential 1,554,959 24.7% 27.8% Construction 626,816 9.9% 12.6% Multifamily 201,267 3.2% 2.3% Subtotal CRE 2,383,042 37.8% 42
Slide 17: Thorough Credit Review Process
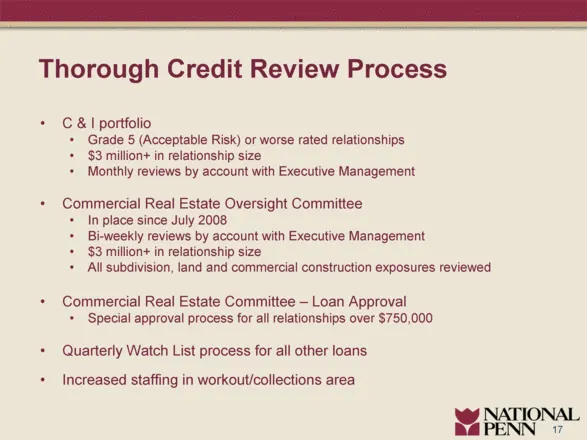
C & I portfolio Grade 5 (Acceptable Risk) or worse rated relationships $3 million+ in relationship size Monthly reviews by account with Executive Management Commercial Real Estate Oversight Committee In place since July 2008 Bi-weekly reviews by account with Executive Management $3 million+ in relat
Slide 18: Improved Sources of Funding
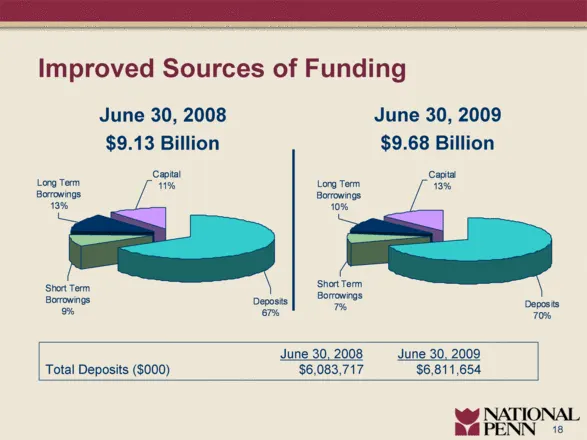
Improved Sources of Funding June 30, 2008 $9.13 Billion 18 June 30, 2009 $9.68 Billion June 30, 2008 June 30, 2009 Total Deposits ($000) $6,083,717 $6,811,654 Capital 13% Long Term Borrowings 10% Short Term Borrowings 7% Deposits 70% Capital 11% Long Term Borrowings 13% Short Term Borrowings 9% Depo
Slide 19: Strong Liquidity Position
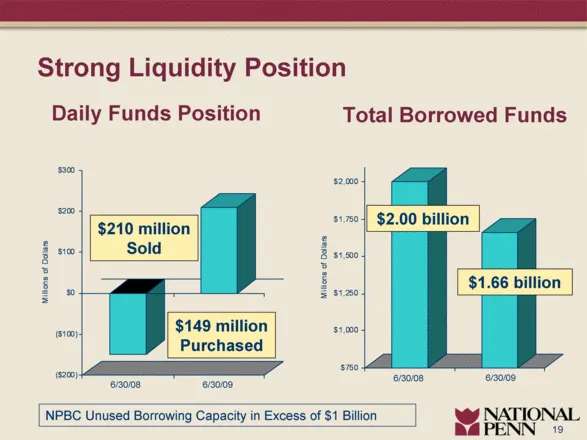
Daily Funds Position Total Borrowed Funds Strong Liquidity Position $149 million Purchased $210 million Sold $2.00 billion $1.66 billion 19 NPBC Unused Borrowing Capacity in Excess of $1 Billion 6/30/09 6/30/08 6/30/09 6/30/08 ($200) ($100) $0 $100 $200 $300 Millions of Dollars $750 $1,000 $1,250 $1
Slide 20: Proactive Management of the Investment Portfolio
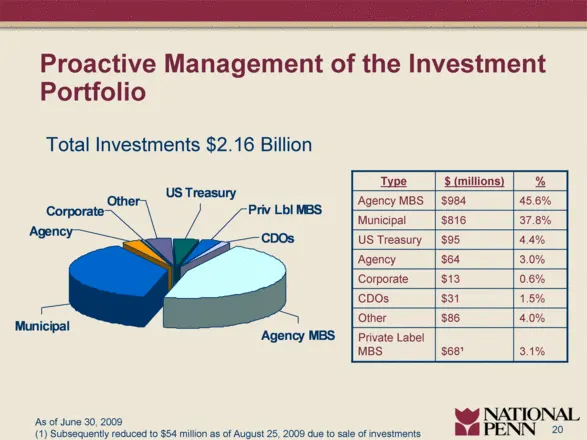
Proactive Management of the Investment Portfolio Total Investments $2.16 Billion 20 1.5% $31 CDOs 3.1% $681 Private Label MBS 4.0% $86 Other 0.6% $13 Corporate 3.0% $64 Agency 4.4% $95 US Treasury 37.8% $816 Municipal 45.6% $984 Agency MBS % $ (millions) Type As of June 30, 2009 (1) Subsequently red
Slide 21: Effective Cost Control Culture
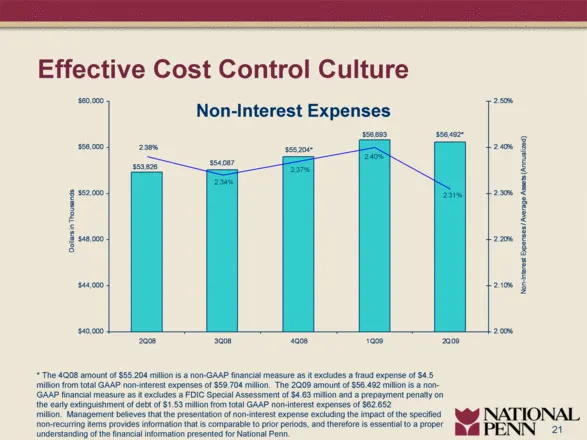
Effective Cost Control Culture Non-Interest Expenses 21 * The 4Q08 amount of $55.204 million is a non-GAAP financial measure as it excludes a fraud expense of $4.5 million from total GAAP non-interest expenses of $59.704 million. The 2Q09 amount of $56.492 million is a non-GAAP financial measure as
Slide 22: Strong Historical Growth in Diluted Earnings Per Share
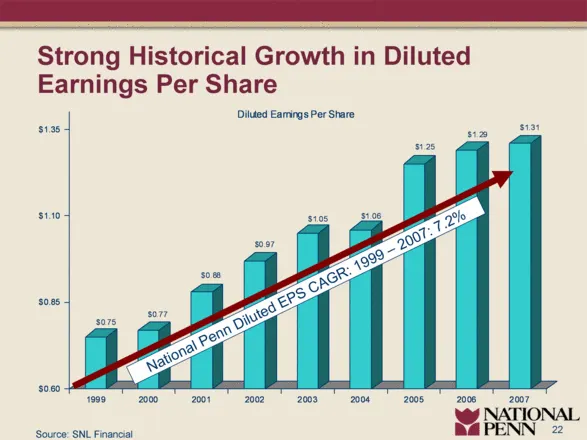
Strong Historical Growth in Diluted Earnings Per Share 22 Source: SNL Financial National Penn Diluted EPS CAGR: 1999 – 2007: 7.2% $0.75 $0.77 $0.88 $0.97 $1.05 $1.06 $1.25 $1.29 $1.31 $0.60 $0.85 $1.10 $1.35 1999 2000 2001 2002 2003 2004 2005 2006 2007 Diluted Earnings Per Share
Slide 23: Current Low Valuation to Peers
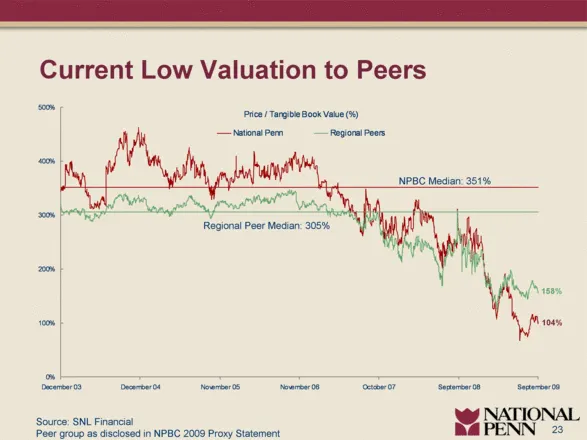
Current Low Valuation to Peers 23 Source: SNL Financial Peer group as disclosed in NPBC 2009 Proxy Statement NPBC Median: 351% Regional Peer Median: 305% 104% 158% Price / Tangible Book Value (%) 0% 100% 200% 300% 400% 500% December 03 December 04 November 05 November 06 October 07 September 08 Sept
Slide 24: Significant Investment Considerations
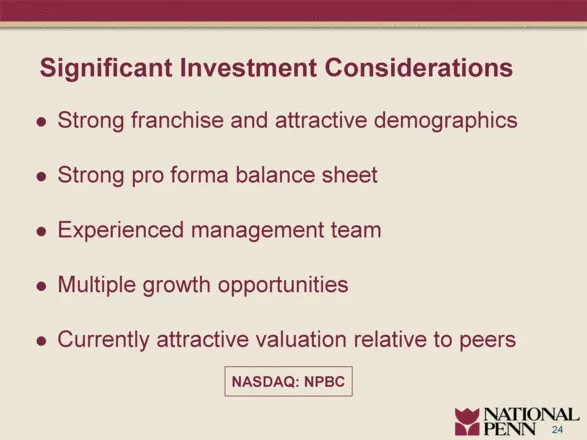
Significant Investment Considerations Strong franchise and attractive demographics Strong pro forma balance sheet Experienced management team Multiple growth opportunities Currently attractive valuation relative to peers 24 NASDAQ: NPBC
Source: SEC EDGAR · 8-K filed Sep 8, 2009
More decks from National Penn Bancshares
 BB&T Global Financial Services Conference (September 2015)33 slides · Sep 16, 2015
 Merger or Acquisition (August 2015)13 slides · Aug 18, 2015
 Q2 2015 Earnings Presentation17 slides · Jul 23, 2015
 Q1 2015 Earnings Presentation18 slides · Apr 24, 2015
 Investor Presentation (February 2015)36 slides · Feb 11, 2015
 Q4 2014 Earnings Presentation16 slides · Jan 22, 2015