NuStar Energy LP — 2019 Citi One-on-One Midstream/Energy Infrastructure Conference
41 slides from NuStar Energy LP's conference presentation, Aug 14, 2019
Slide 1: 2019 Citi One-on-One Midstream/Energy Infrastructure Conference
2019 Citi One-on-One Midstream/Energy Infrastructure Conference August 14 –15, 2019
Slide 2: Forward-Looking Statements
Forward-Looking Statements Statements contained in this presentation other than statements of historical fact are forward-looking statements. While these forward-looking statements, and any assumptions upon which they are based, are made in good faith and reflect our current judgment regarding the d
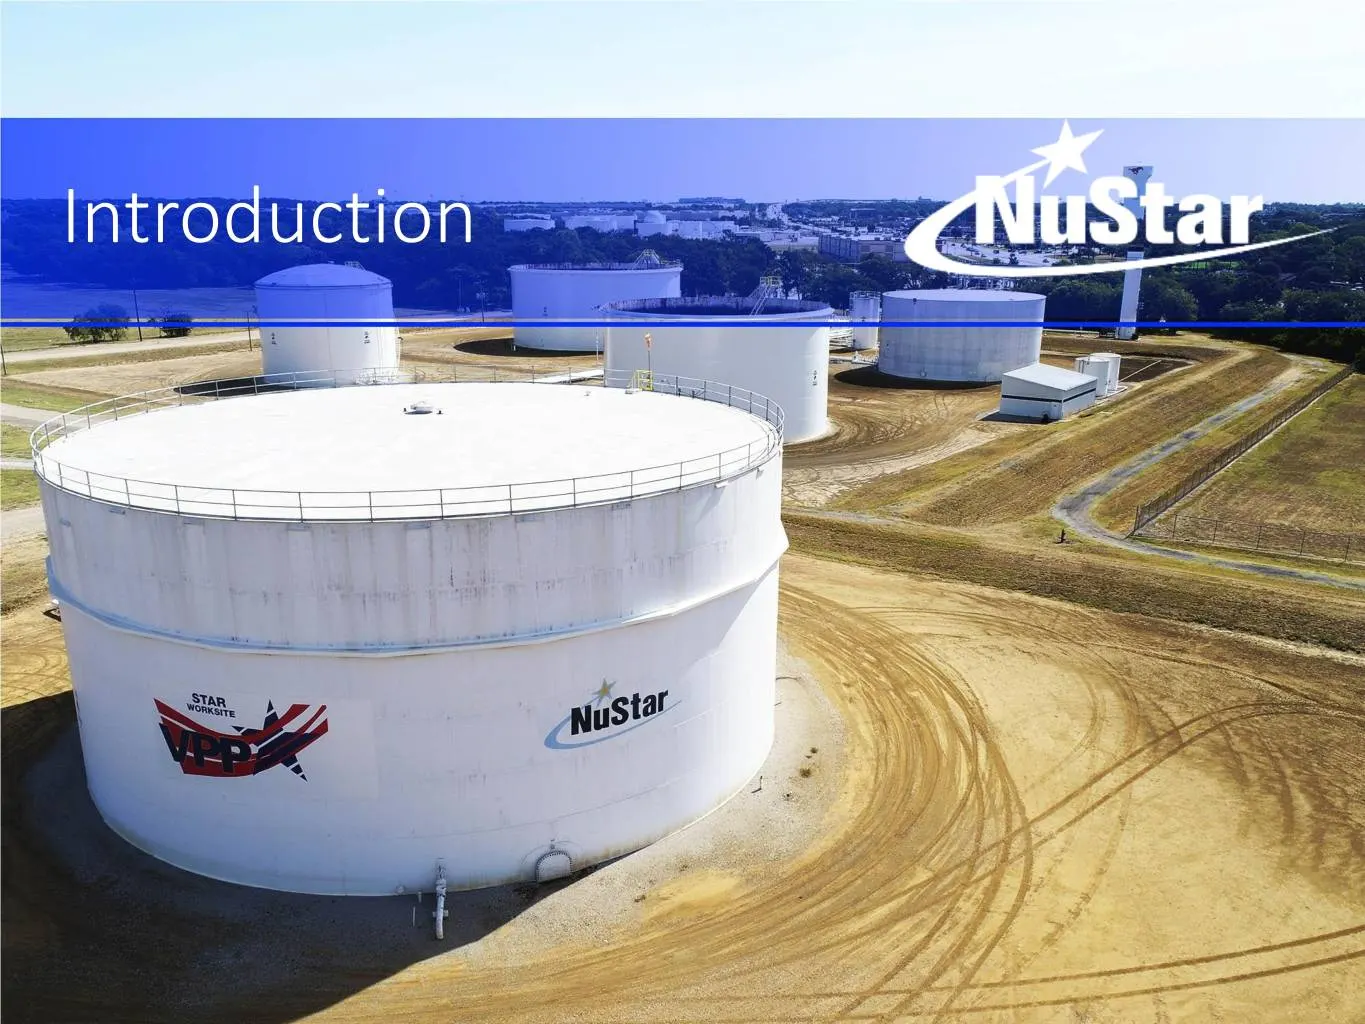
Slide 3: The Permian Basin: Phenomenal Growth Driving Midstream Opportunities
The Permian Basin: PhenomenalIntroduction Growth Driving Midstream Opportunities
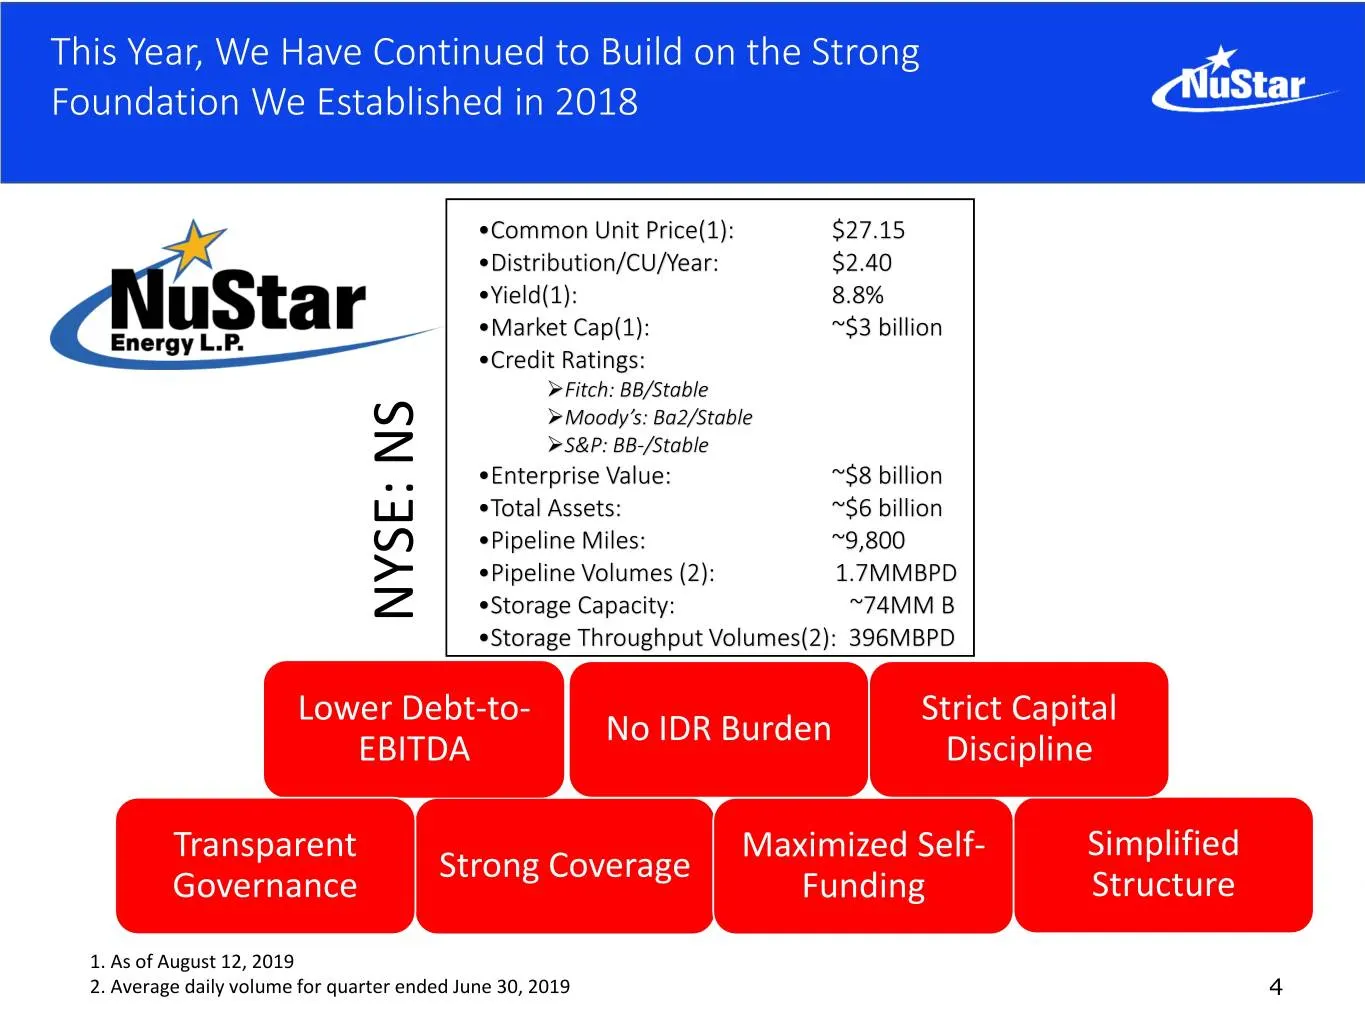
Slide 4: Foundation We Established in 2018: Strong Build This Year
FoundationWe Established in2018 This Year,We Have Continued toon theStrongBuild 2. Average2. daily volume quarterfor ended June 30, 2019 As 1. of August 12, 2019 Governance Transparent Lower Debt EBITDA NYSE: NS Strong Coverage - • • • • • • • • • • • to Storage Throughput Volumes(2): 396MBPD Storag
Slide 5: NuStar's Second Quarter 2019 Results Illustrate Our Progress and Growth
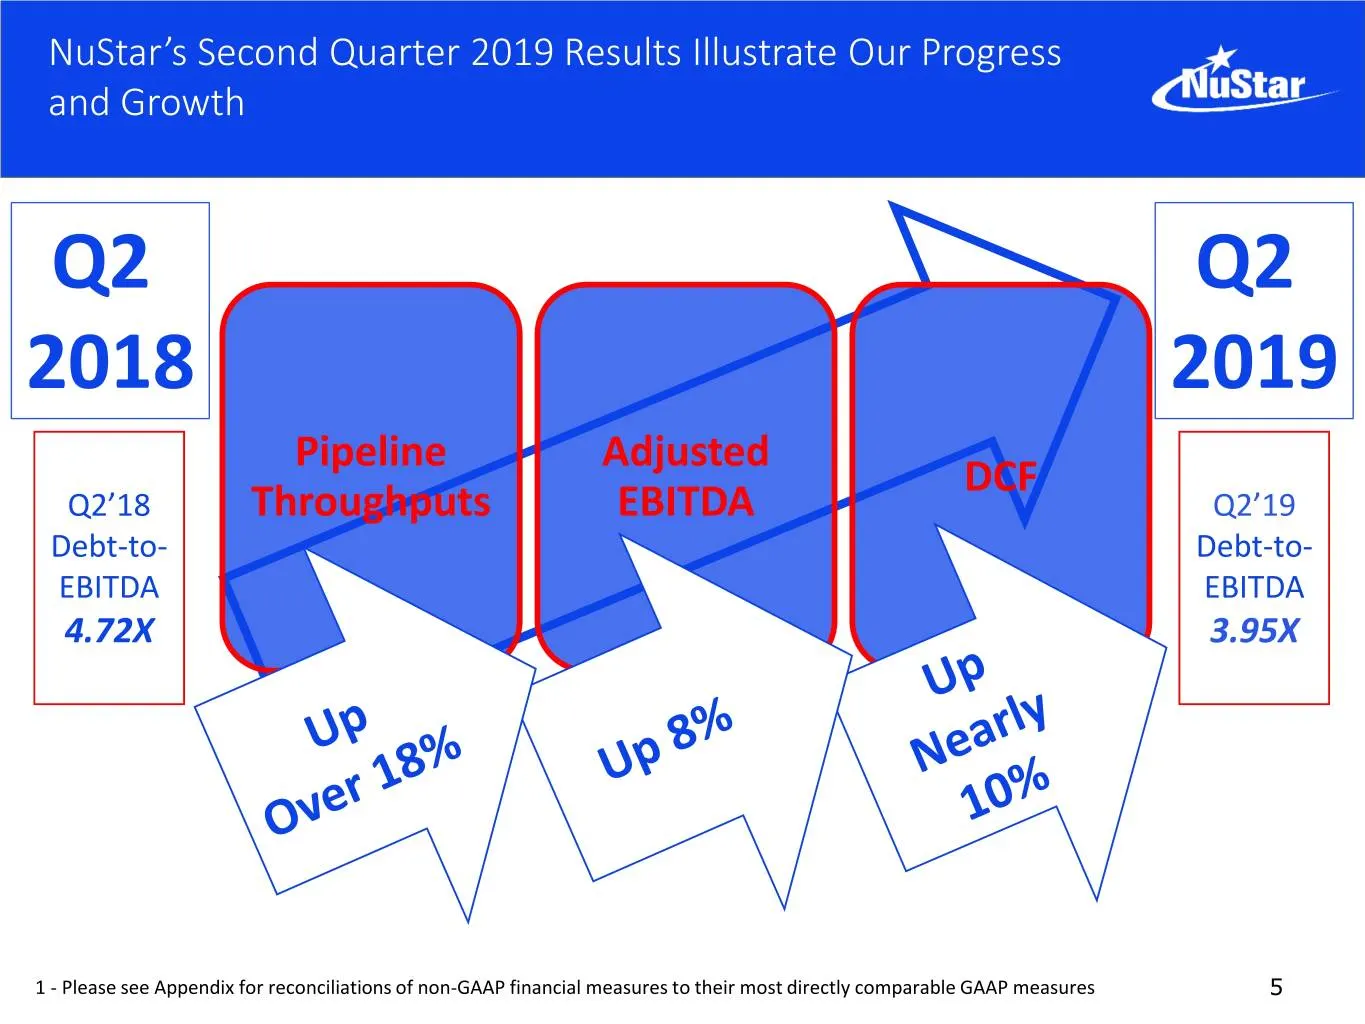
NuStar’s Second Quarter 2019 Results Illustrate Our Progress and Growth Q2 Q2 2018 2019 Pipeline Adjusted DCF Q2’18 Throughputs EBITDA Q2’19 Debt-to- Debt-to- EBITDA EBITDA 4.72X 3.95X 1 - Please see Appendix for reconciliations of non-GAAP financial measures to their most directly comparable GAAP m
Slide 6: Much of NuStar's Growth Has Emerged From Strong Shale Production
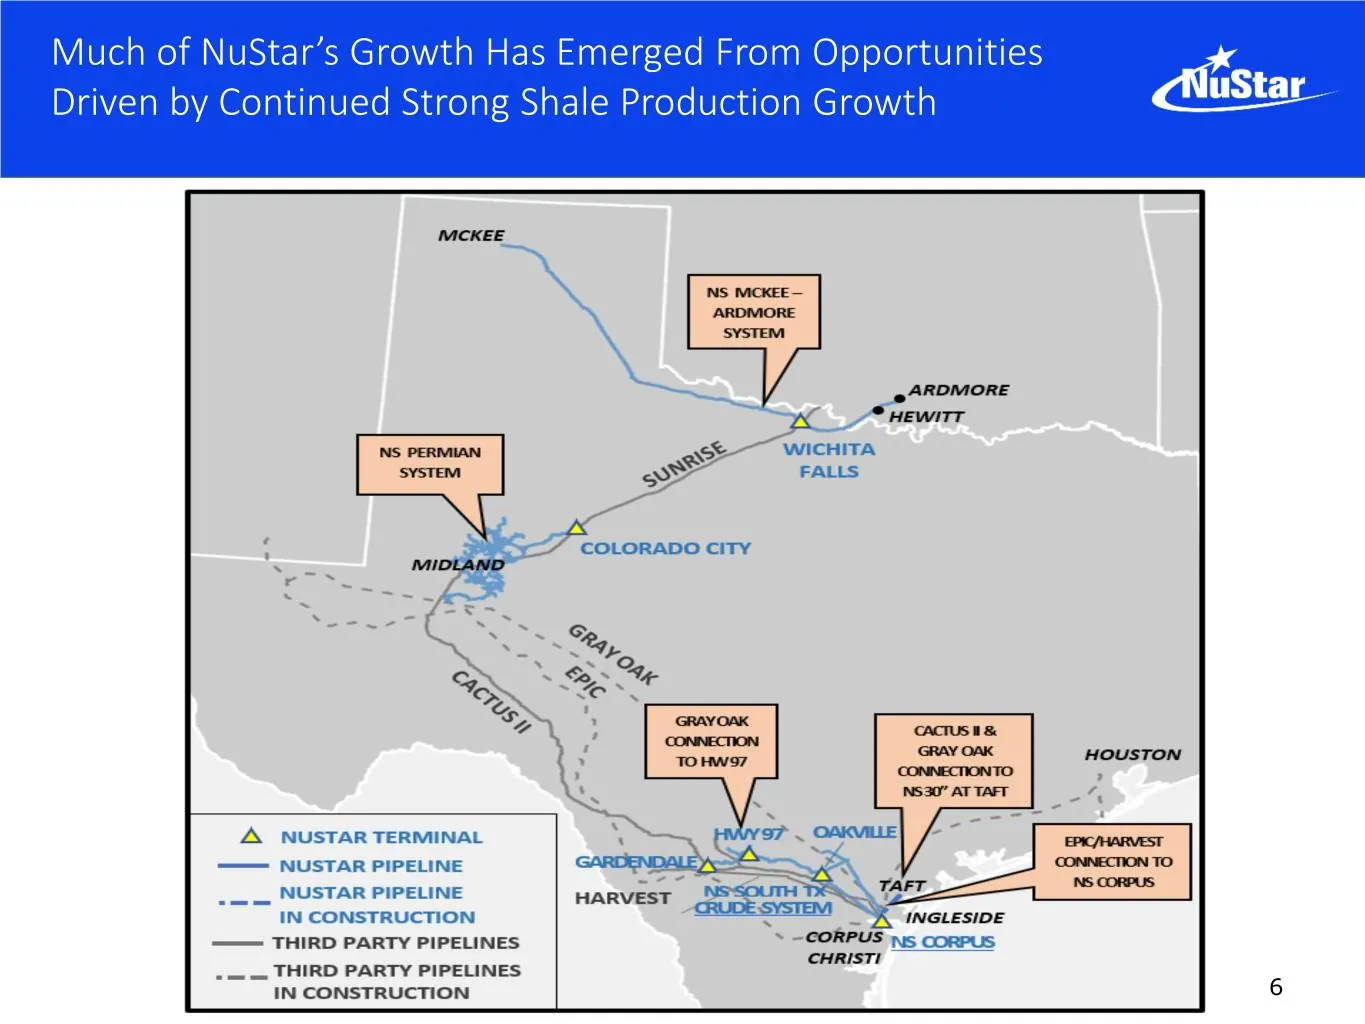
Much of NuStar’s Growth Has Emerged From Opportunities Driven by Continued Strong Shale Production Growth AP Master 8-12-19 6
Slide 7: Recent Divestitures Had a Substantial Positive Impact on Financial Strength
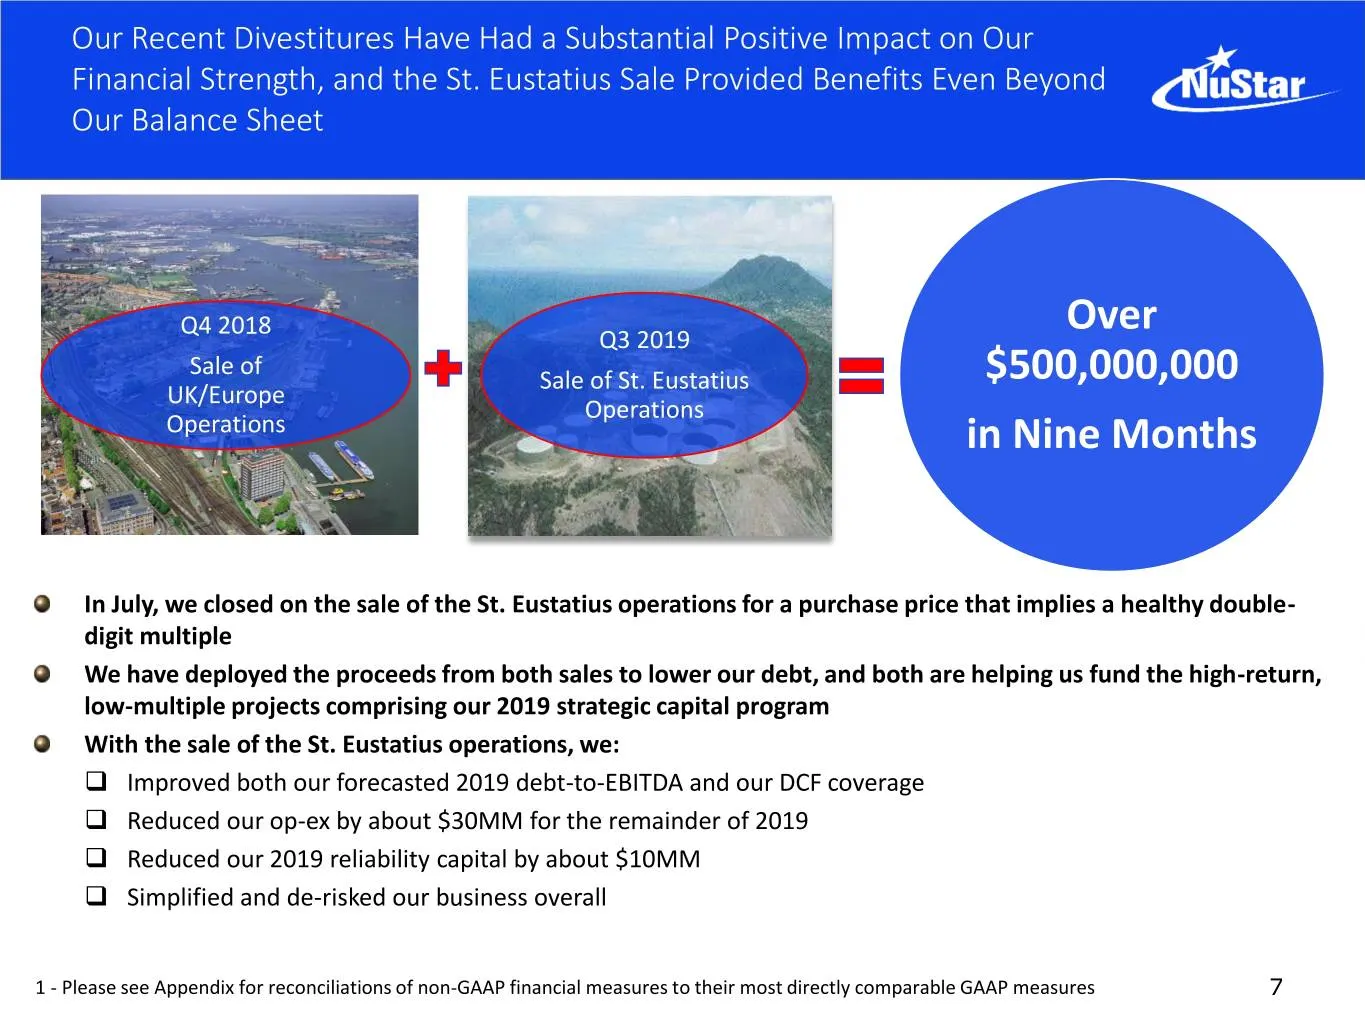
Our Recent Divestitures Have Had a Substantial Positive Impact on Our Financial Strength, and the St. Eustatius Sale Provided Benefits Even Beyond Our Balance Sheet Q4 2018 Over Q3 2019 Sale of Sale of St. Eustatius $500,000,000 UK/Europe Operations Operations in Nine Months In July, we closed on th
Slide 8: Improved Expected Full-Year 2019 Coverage and Leverage
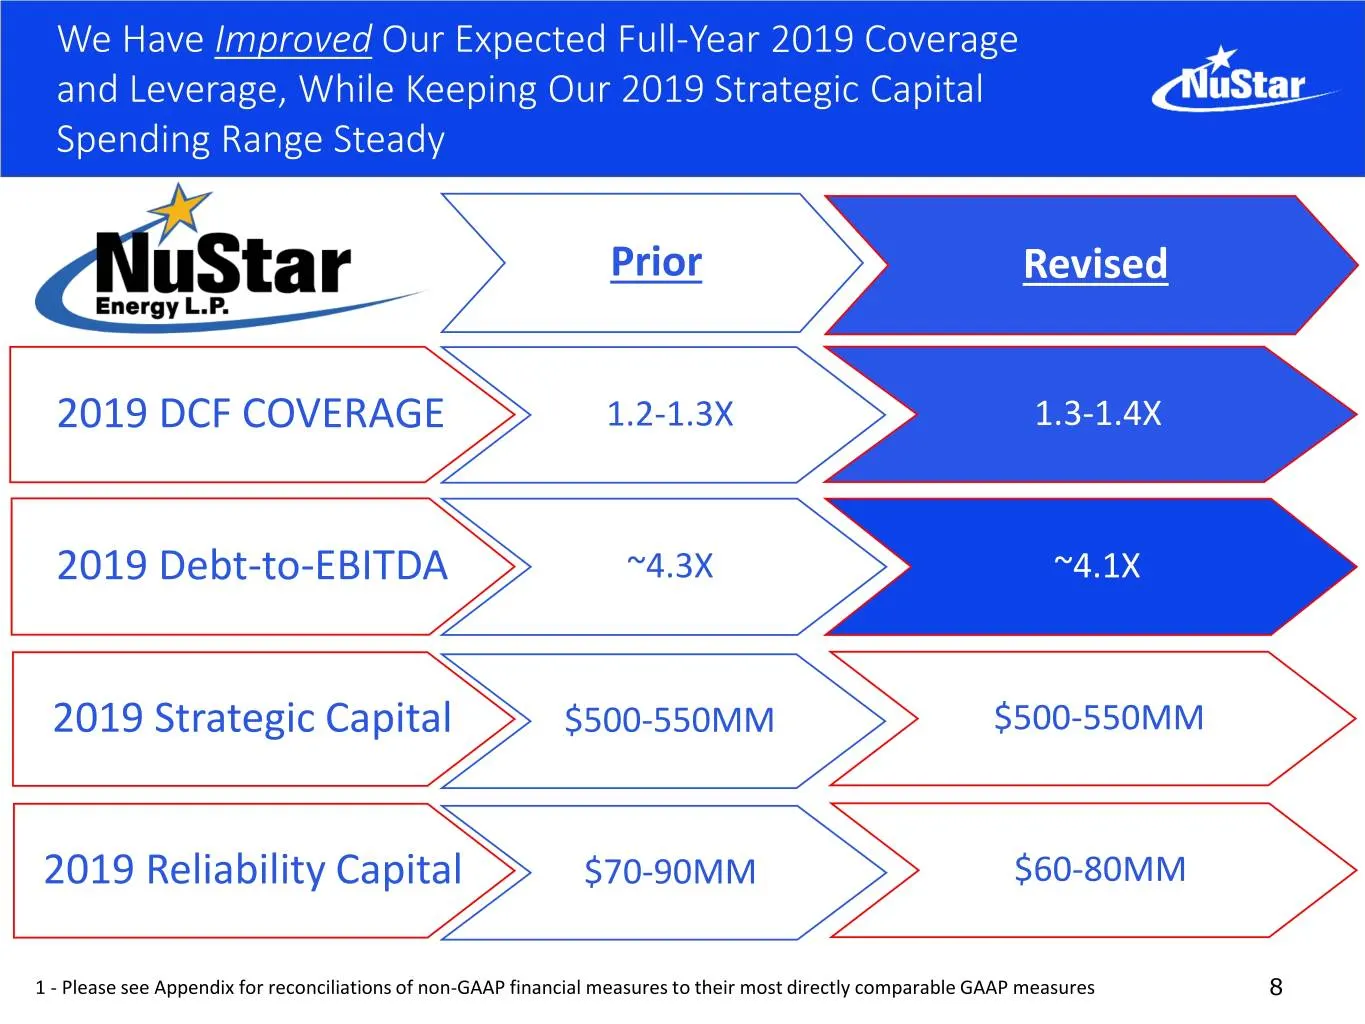
We Have Improved Our Expected Full-Year 2019 Coverage and Leverage, While Keeping Our 2019 Strategic Capital Spending Range Steady Prior Revised 2019 DCF COVERAGE 1.2-1.3X 1.3-1.4X 2019 Debt-to-EBITDA ~4.3X ~4.1X 2019 Strategic Capital $500-550MM $500-550MM 2019 Reliability Capital $70-90MM $60-80MM
Slide 9: 2019 Capital Project Program Update
2019 Capital Project Program Update
Slide 10: Expect to Spend $500-550MM This Year on Capital Spending Program
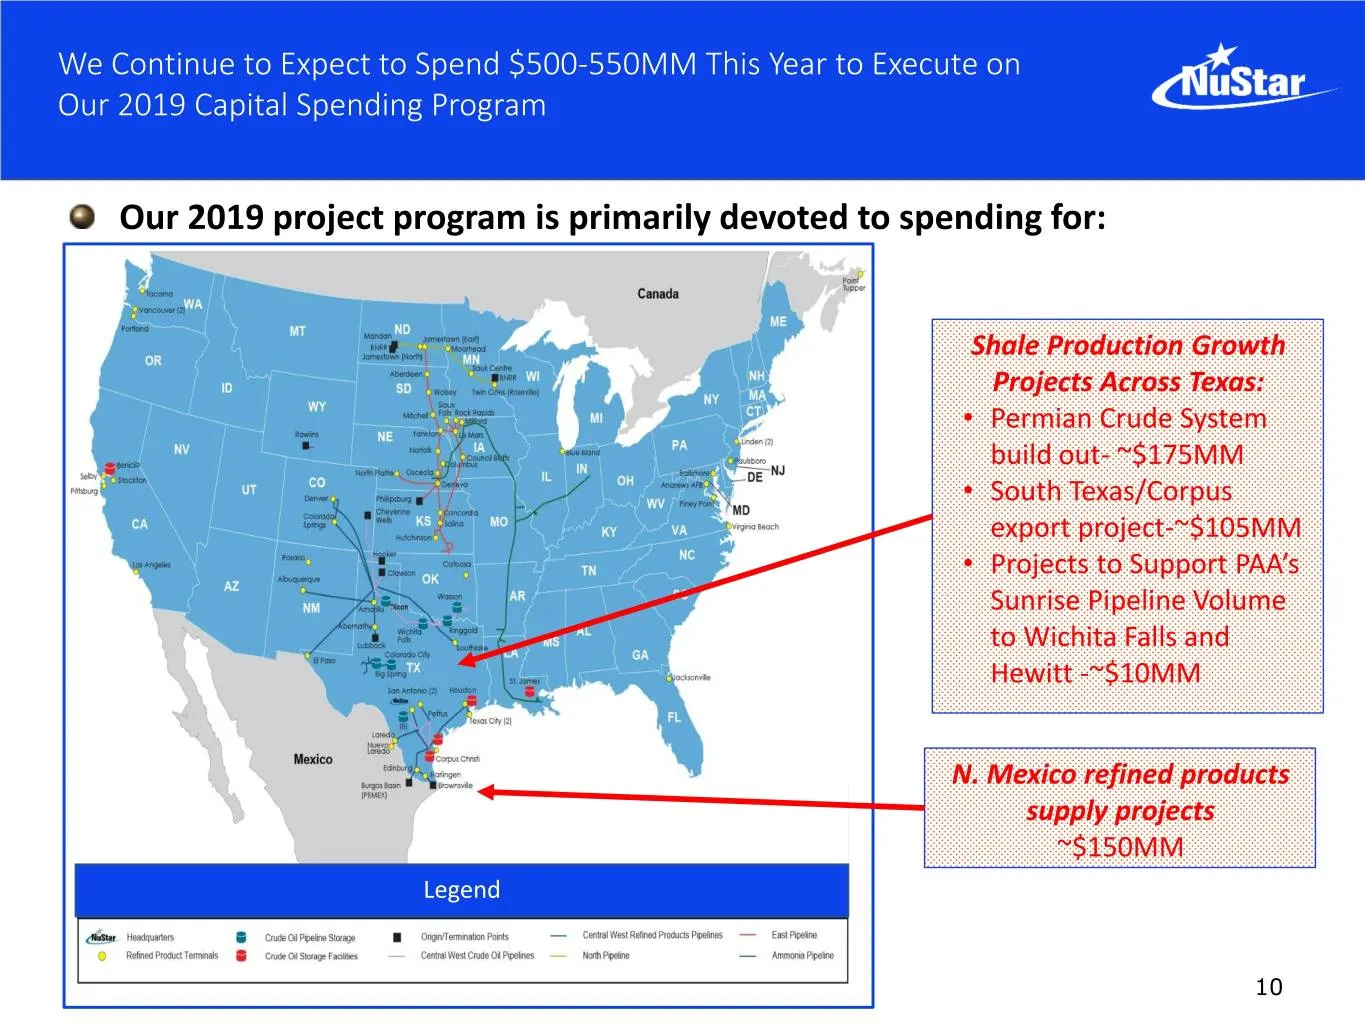
We Continue to Expect to Spend $500-550MM This Year to Execute on Our 2019 Capital Spending Program Our 2019 project program is primarily devoted to spending for: Shale Production Growth Projects Across Texas: • Permian Crude System build out- ~$175MM • South Texas/Corpus export project-~$105MM • Pr
Slide 11: Expanding and Connecting Our Permian Crude System
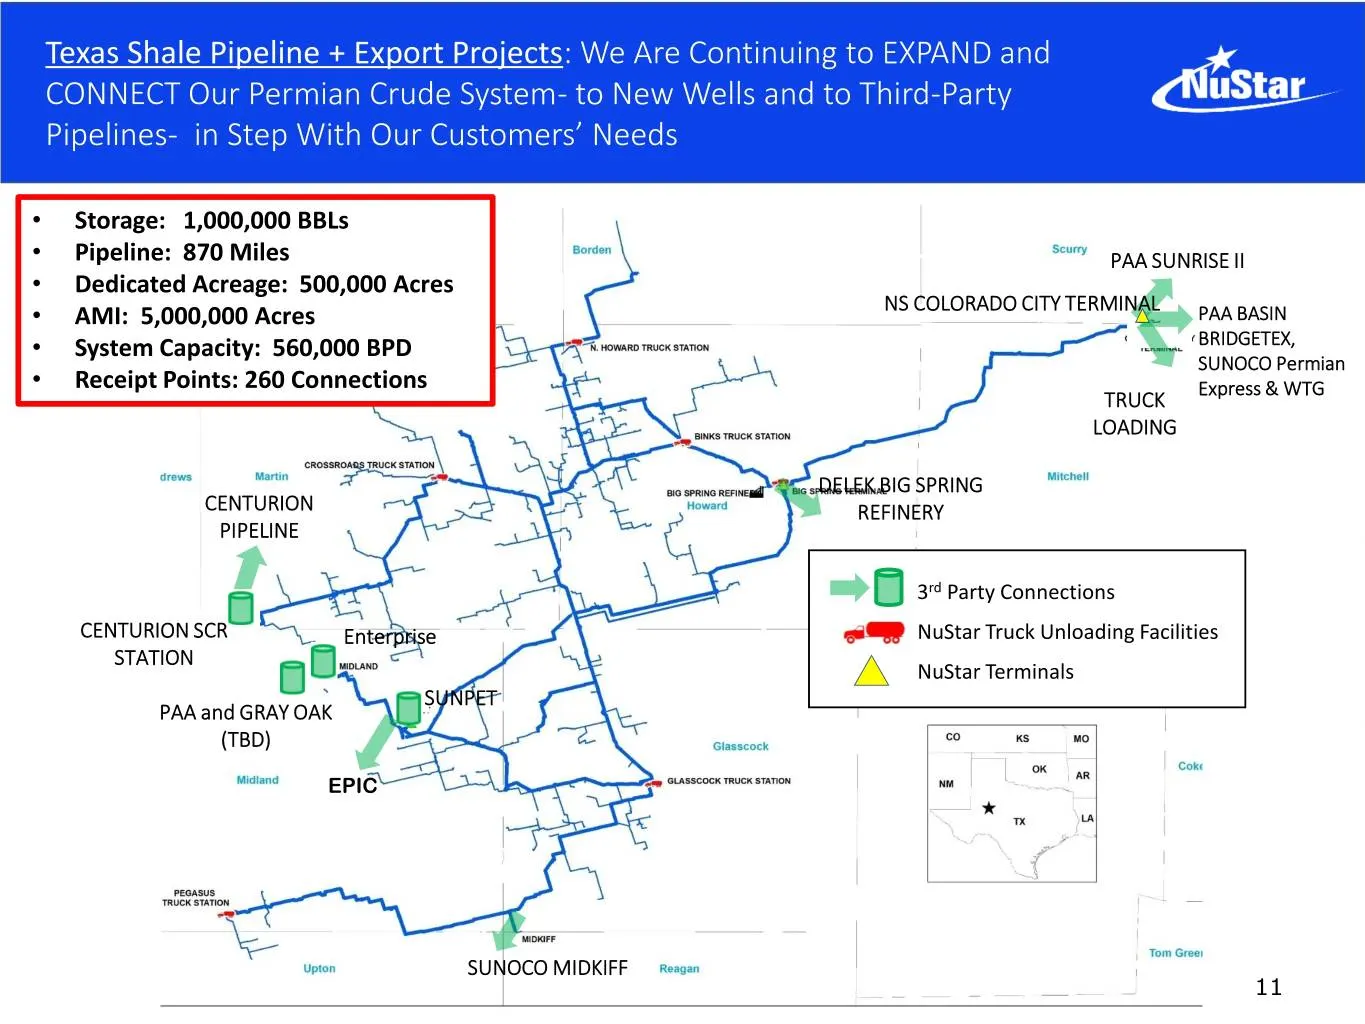
Texas Shale Pipeline + Export Projects: We Are Continuing to EXPAND and CONNECT Our Permian Crude System- to New Wells and to Third-Party Pipelines- in Step With Our Customers’ Needs • Storage: 1,000,000 BBLs • Pipeline: 870 Miles PAA SUNRISE II • Dedicated Acreage: 500,000 Acres • AMI: 5,000,000 Ac
Slide 12: Permian Crude System Receipts and EBITDA Continue to Grow Rapidly
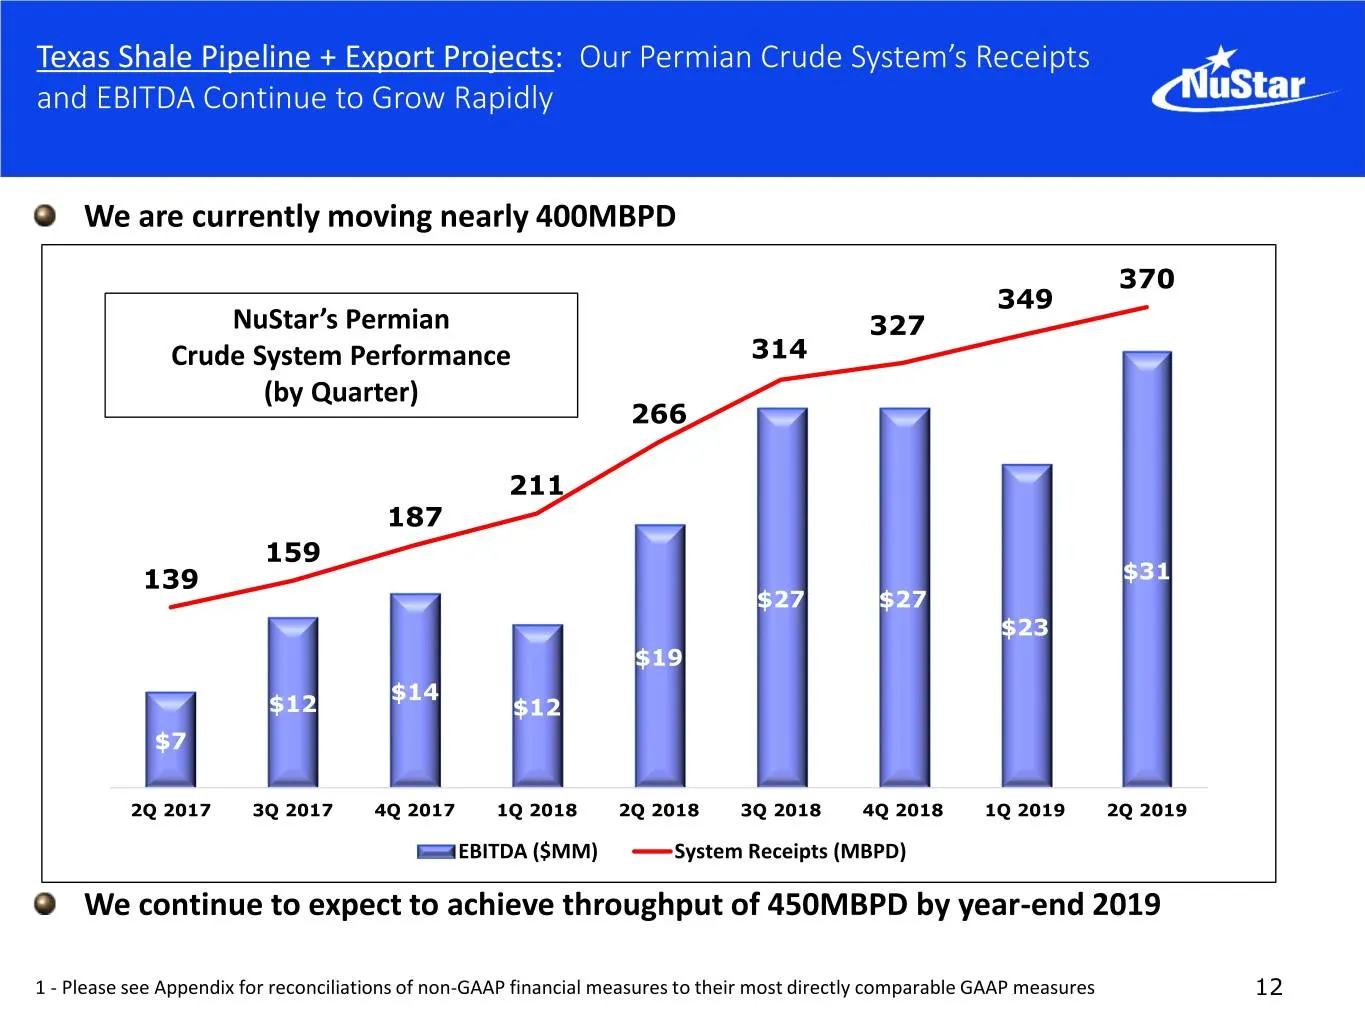
Texas Shale Pipeline + Export Projects: Our Permian Crude System’s Receipts and EBITDA Continue to Grow Rapidly We are currently moving nearly 400MBPD 370 400 $35 349 NuStar’s Permian 327 350 314 $30 Crude System Performance (by Quarter) 300 266 $25 250 211 $20 187 200 159 $15 139 $31 $27 $27 150 $2
Slide 13: Permian Basin's Resiliency and Efficiency Should Drive Strong Growth
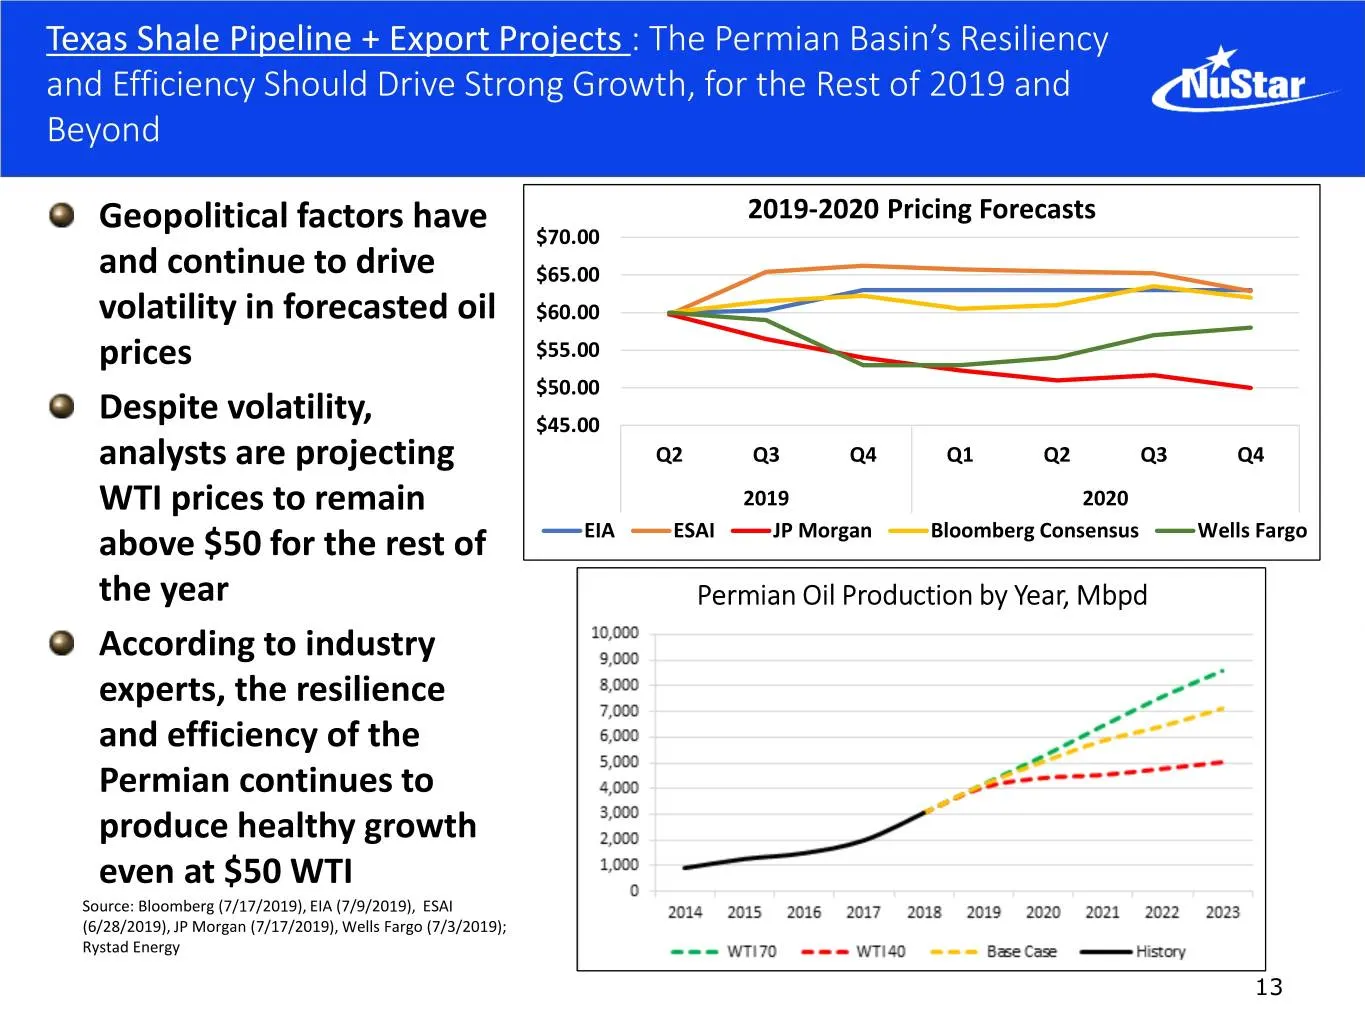
Texas Shale Pipeline + Export Projects : The Permian Basin’s Resiliency and Efficiency Should Drive Strong Growth, for the Rest of 2019 and Beyond Geopolitical factors have 2019-2020 Pricing Forecasts $70.00 and continue to drive $65.00 volatility in forecasted oil $60.00 prices $55.00 $50.00 Despit
Slide 14: South Texas Crude System and Corpus Export Assets' Utilization Has Grown
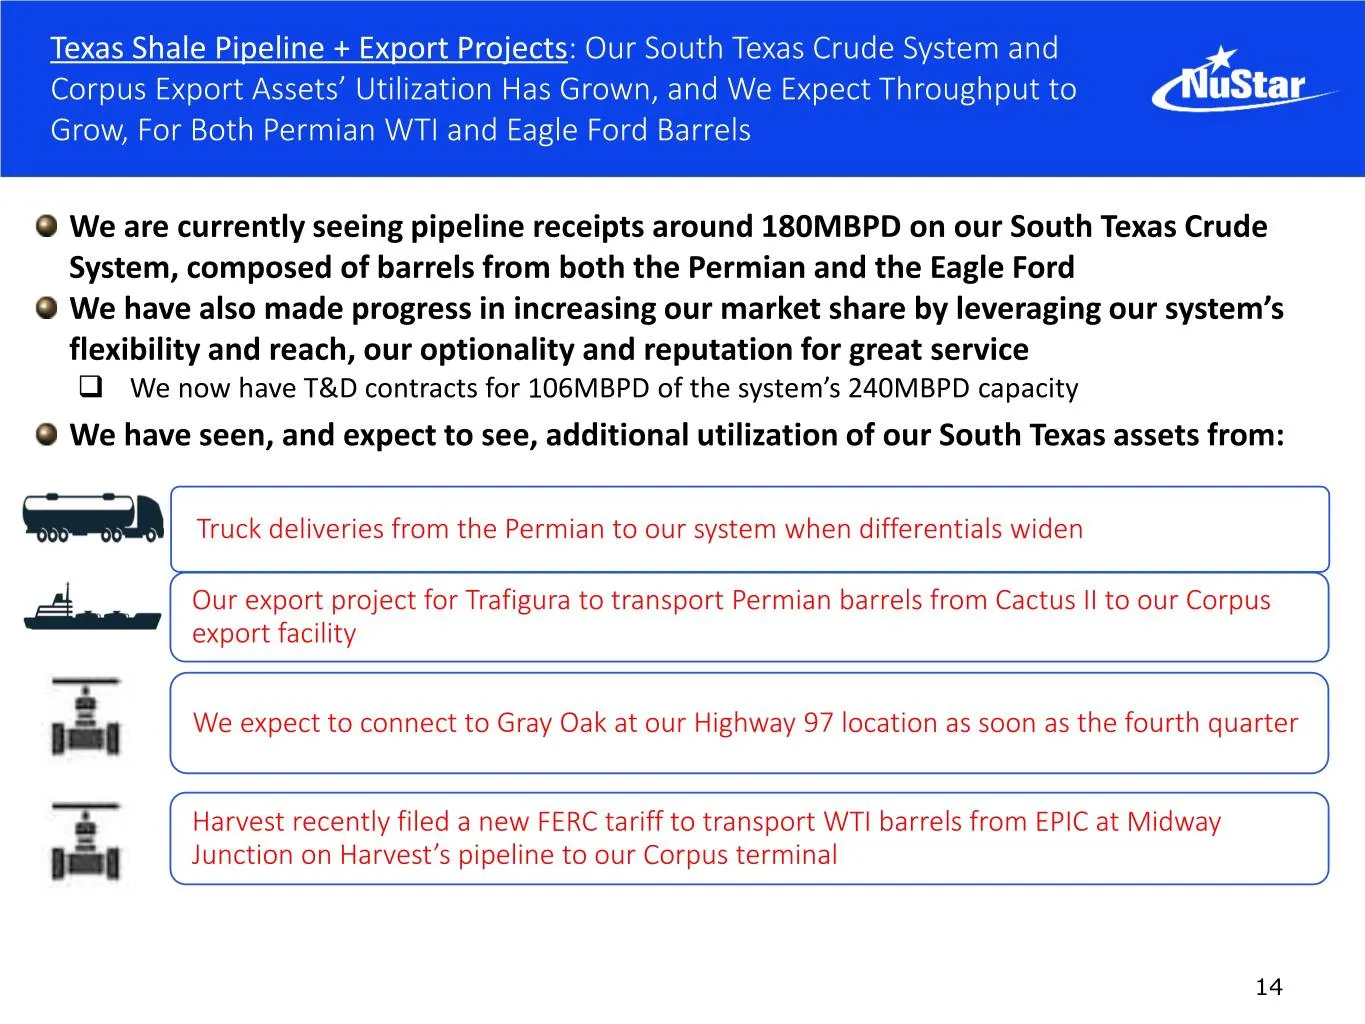
Texas Shale Pipeline + Export Projects: Our South Texas Crude System and Corpus Export Assets’ Utilization Has Grown, and We Expect Throughput to Grow, For Both Permian WTI and Eagle Ford Barrels We are currently seeing pipeline receipts around 180MBPD on our South Texas Crude System, composed of ba
Slide 15: South Texas Crude System Utilization Improves Near 2015 Levels
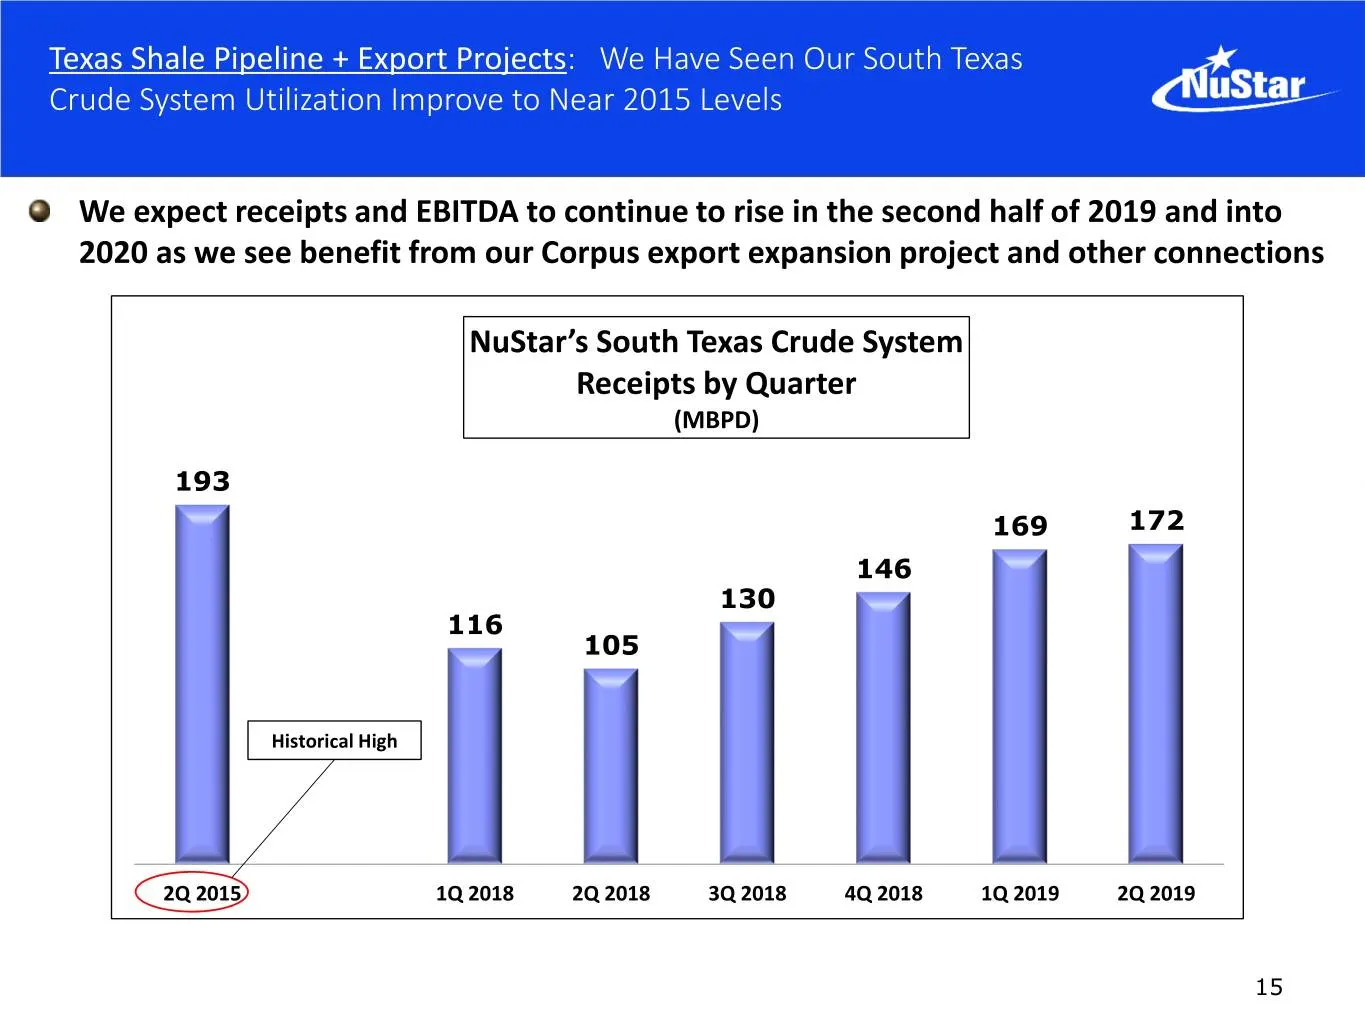
Texas Shale Pipeline + Export Projects: We Have Seen Our South Texas Crude System Utilization Improve to Near 2015 Levels We expect receipts and EBITDA to continue to rise in the second half of 2019 and into 2020 as we see benefit from our Corpus export expansion project and other connections NuStar
Slide 16: Transporting Permian Barrels From Connection With Plains' Sunrise II Pipeline
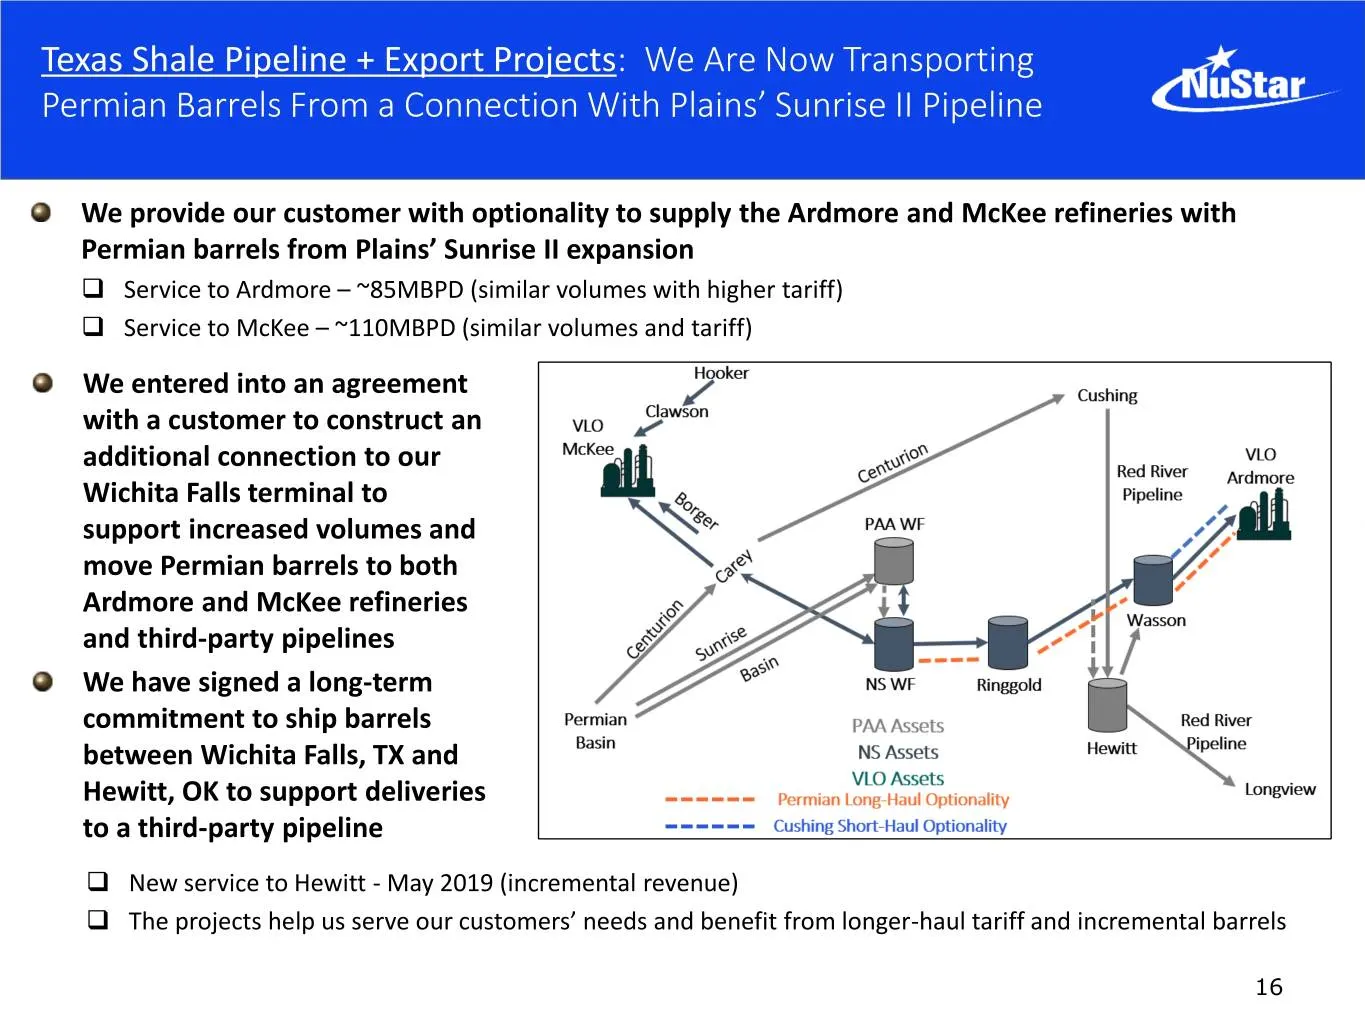
Texas Shale Pipeline + Export Projects: We Are Now Transporting Permian Barrels From a Connection With Plains’ Sunrise II Pipeline We provide our customer with optionality to supply the Ardmore and McKee refineries with Permian barrels from Plains’ Sunrise II expansion Service to Ardmore – ~85MBPD
Slide 17: Corpus Facility Handling the Leading Edge of Permian Long-haul Barrels
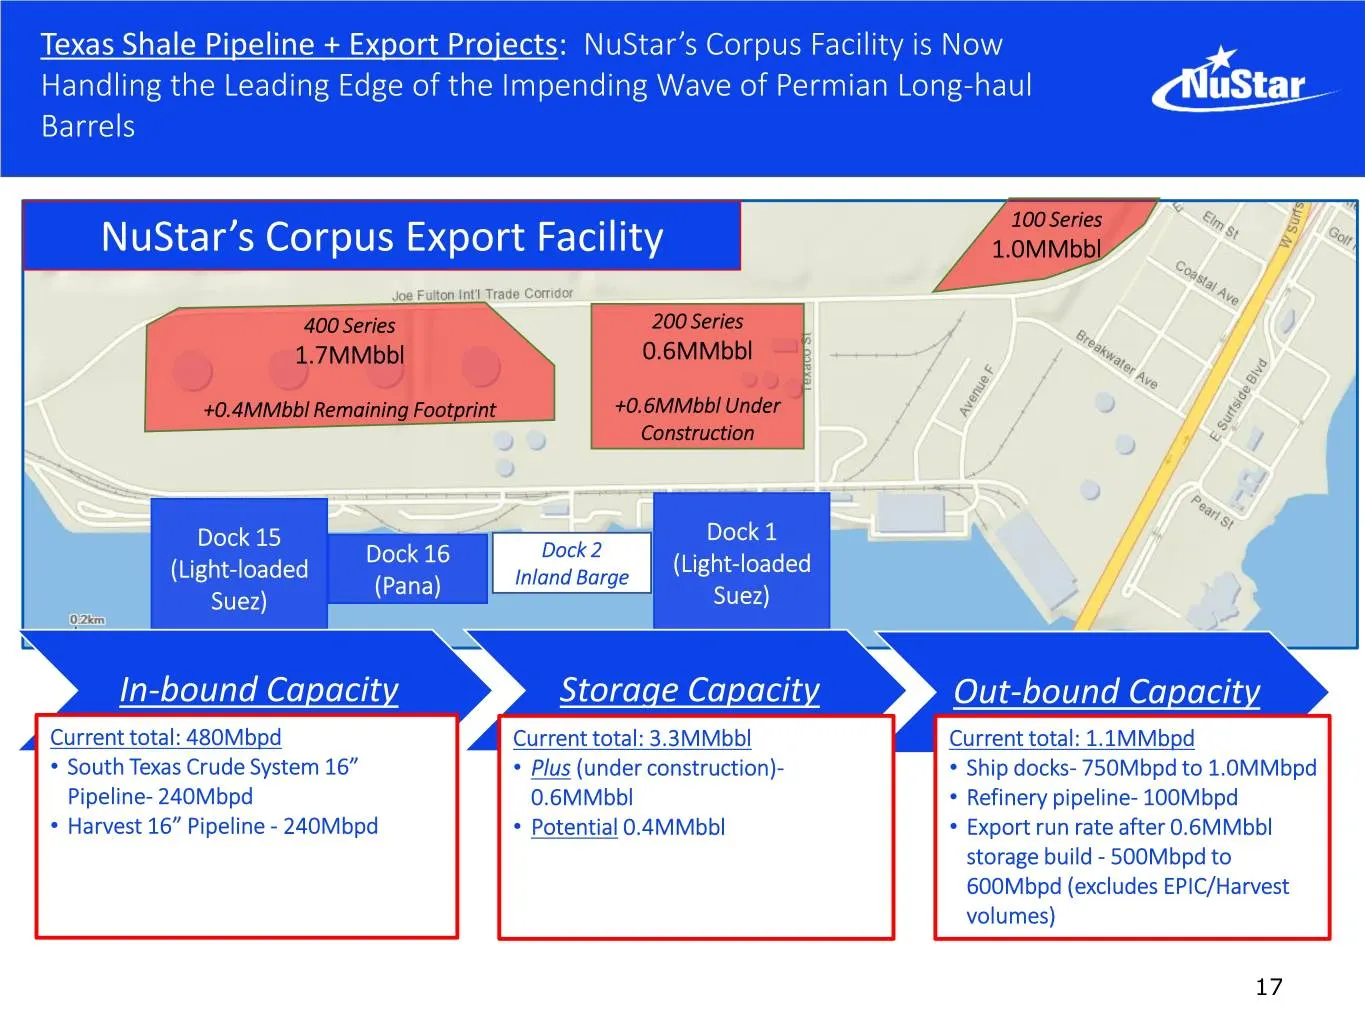
Texas Shale Pipeline + Export Projects: NuStar’s Corpus Facility is Now Handling the Leading Edge of the Impending Wave of Permian Long-haul Barrels 100 Series NuStar’s Corpus Export Facility 1.0MMbbl 400 Series 200 Series 1.7MMbbl 0.6MMbbl +0.4MMbbl Remaining Footprint +0.6MMbbl Under Construction
Slide 18: Our Project for Trafigura Expands Gulf Coast Export Ability
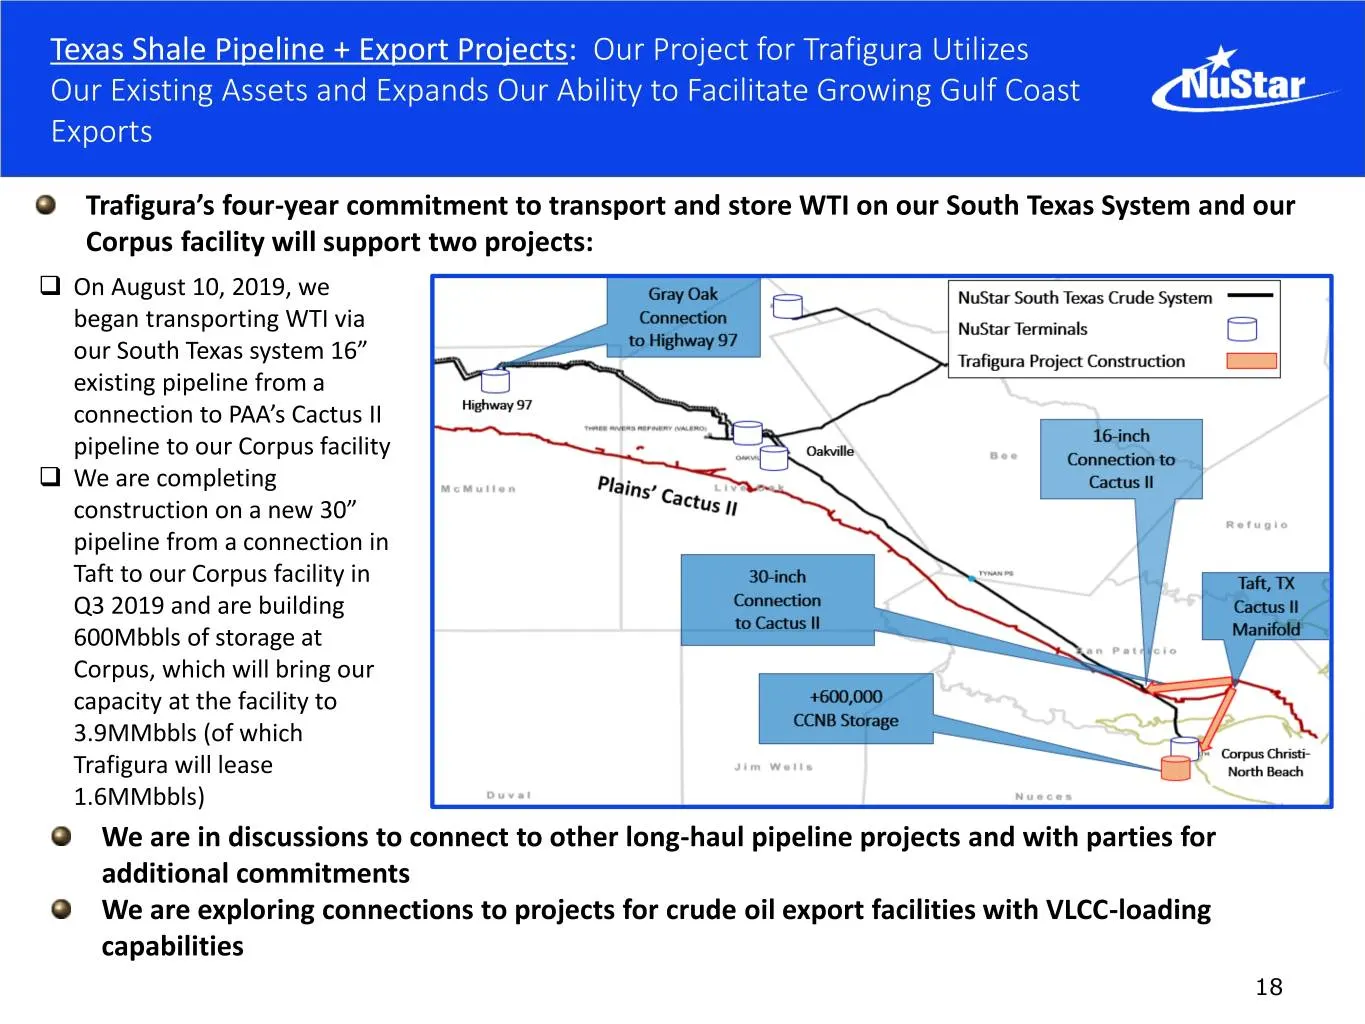
Texas Shale Pipeline + Export Projects: Our Project for Trafigura Utilizes Our Existing Assets and Expands Our Ability to Facilitate Growing Gulf Coast Exports Trafigura’s four-year commitment to transport and store WTI on our South Texas System and our Corpus facility will support two projects: O
Slide 19: Northern Mexico Refined Products Supply
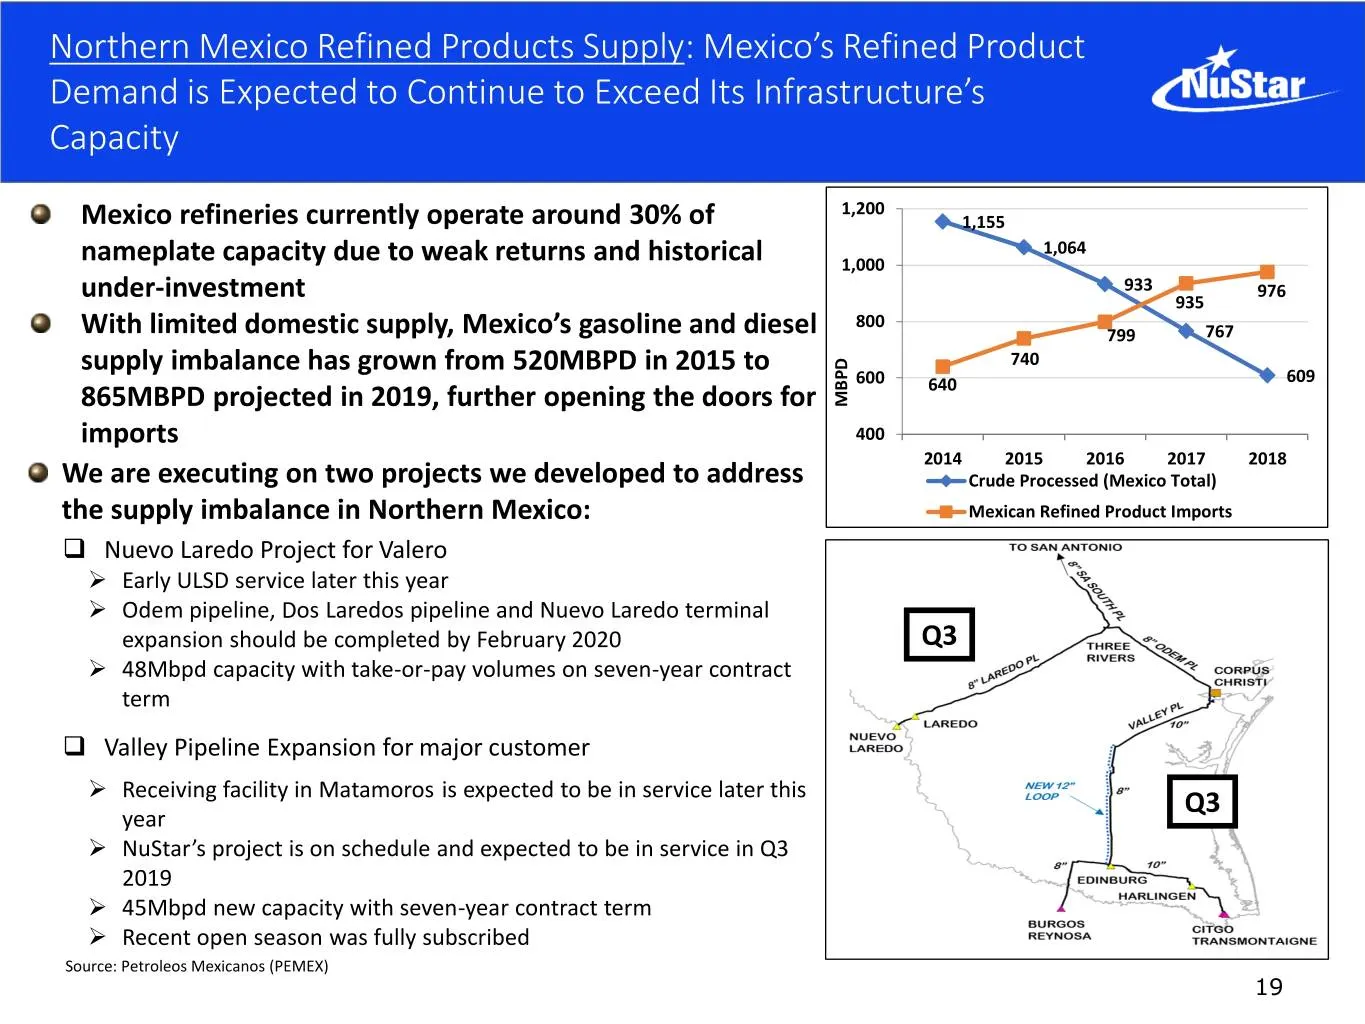
Northern Mexico Refined Products Supply: Mexico’s Refined Product Demand is Expected to Continue to Exceed Its Infrastructure’s Capacity 1,200 Mexico refineries currently operate around 30% of 1,155 1,064 nameplate capacity due to weak returns and historical 1,000 933 976 under-investment 935 800 Wi
Slide 20: Beyond 2019: Increased EBITDA + Decreased Capital Spending
TheBeyond Permian 2019: Basin: Increased EBITDA + PhenomenalDecreased Capital Growth Spending Driving Midstream Opportunities AP Master 8-12-19
Slide 21: In 2020 We Expect a Significant Ramp-Down in Spending
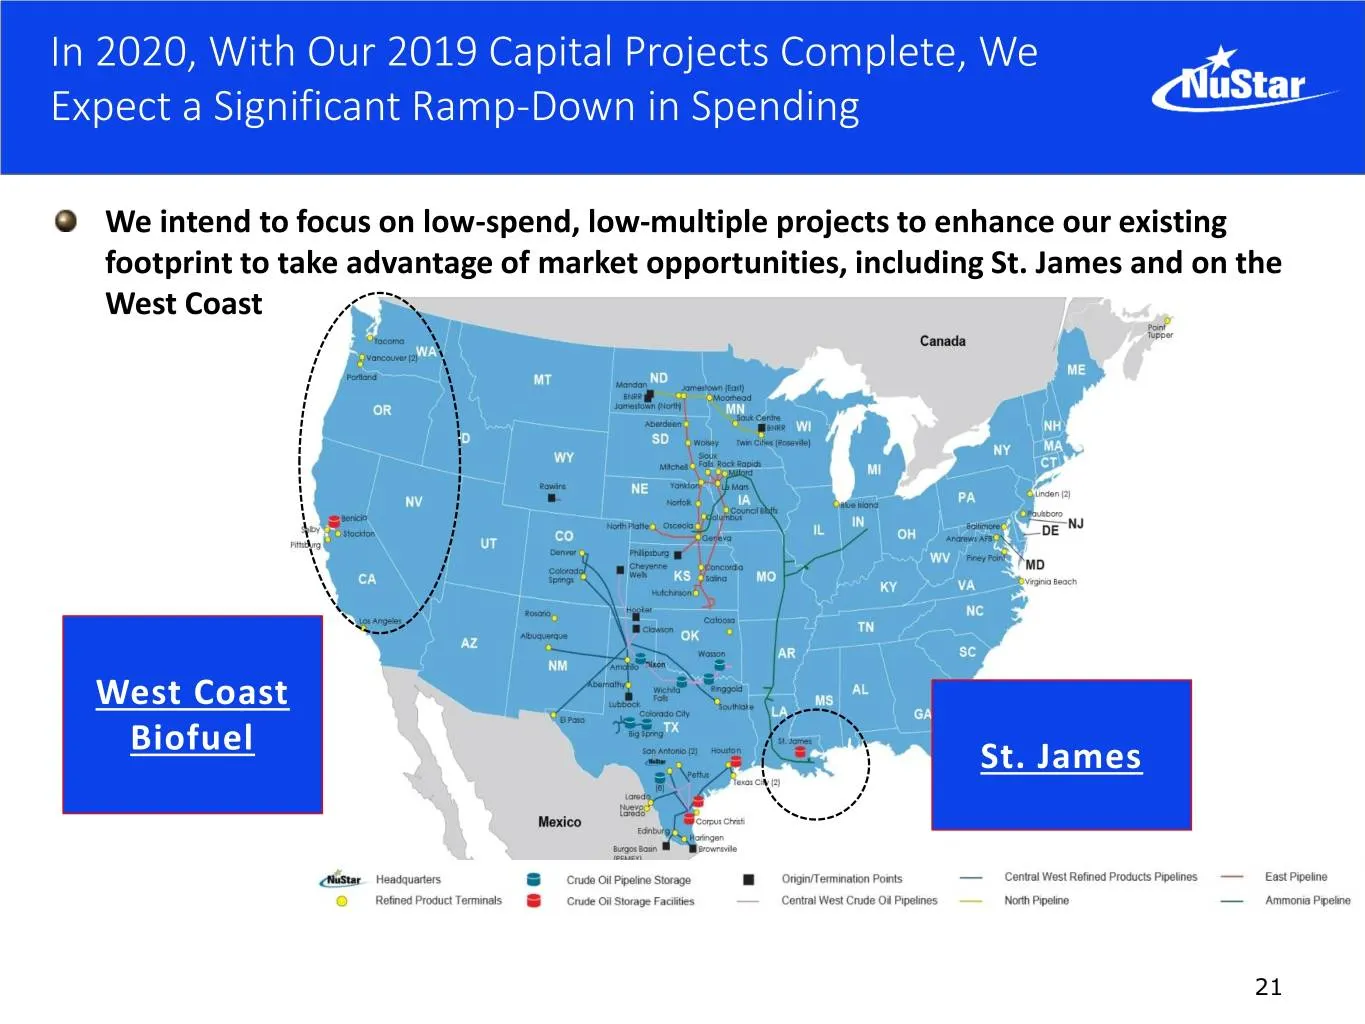
In 2020, With Our 2019 Capital Projects Complete, We Expect a Significant Ramp-Down in Spending We intend to focus on low-spend, low-multiple projects to enhance our existing footprint to take advantage of market opportunities, including St. James and on the West Coast West Coast Biofuel St. James 2
Slide 22: Shale Production Growth Has Reversed Crude Flows to St. James, LA
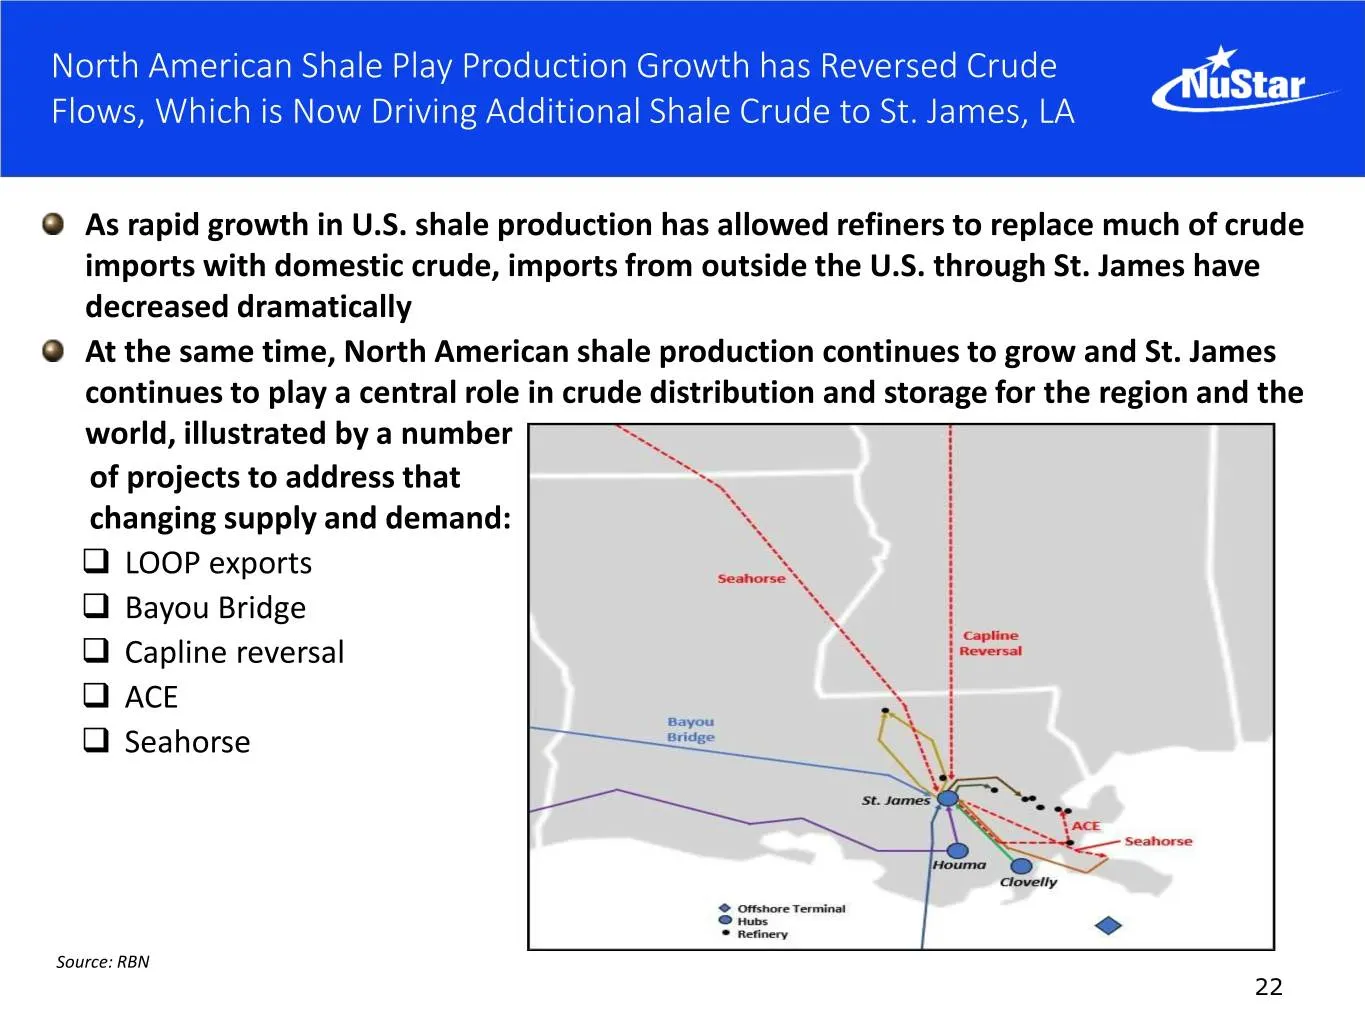
North American Shale Play Production Growth has Reversed Crude Flows, Which is Now Driving Additional Shale Crude to St. James, LA As rapid growth in U.S. shale production has allowed refiners to replace much of crude imports with domestic crude, imports from outside the U.S. through St. James have
Slide 23: St. James Terminal Capacity, Connectivity and Expandability
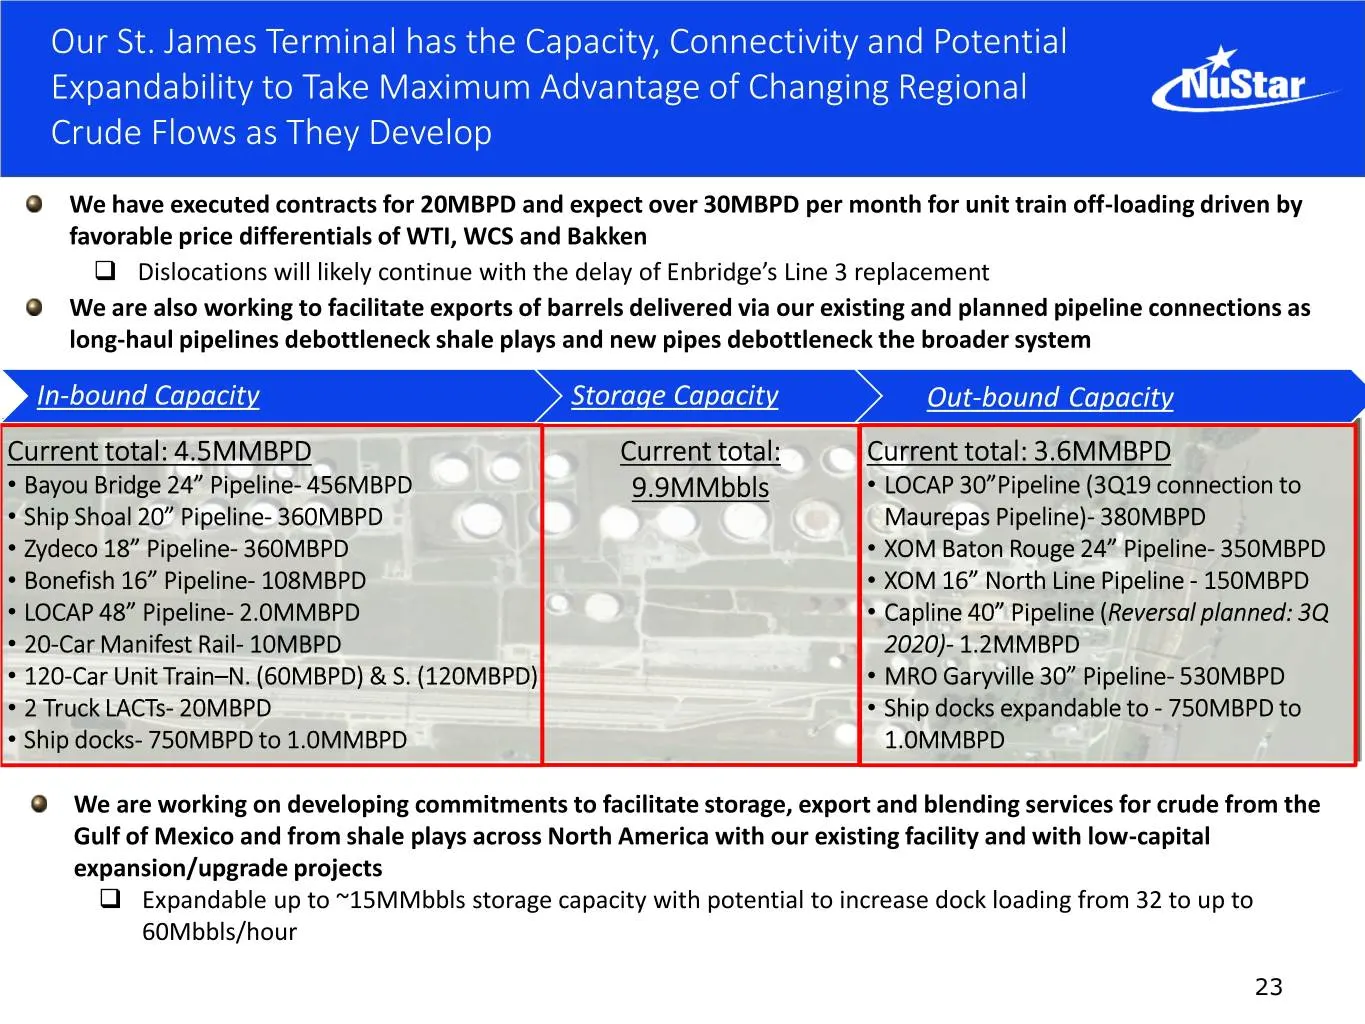
Our St. James Terminal has the Capacity, Connectivity and Potential Expandability to Take Maximum Advantage of Changing Regional Crude Flows as They Develop We have executed contracts for 20MBPD and expect over 30MBPD per month for unit train off-loading driven by favorable price differentials of WT
Slide 24: Continue to Develop Bio-Fuels Logistics Projects for Customers
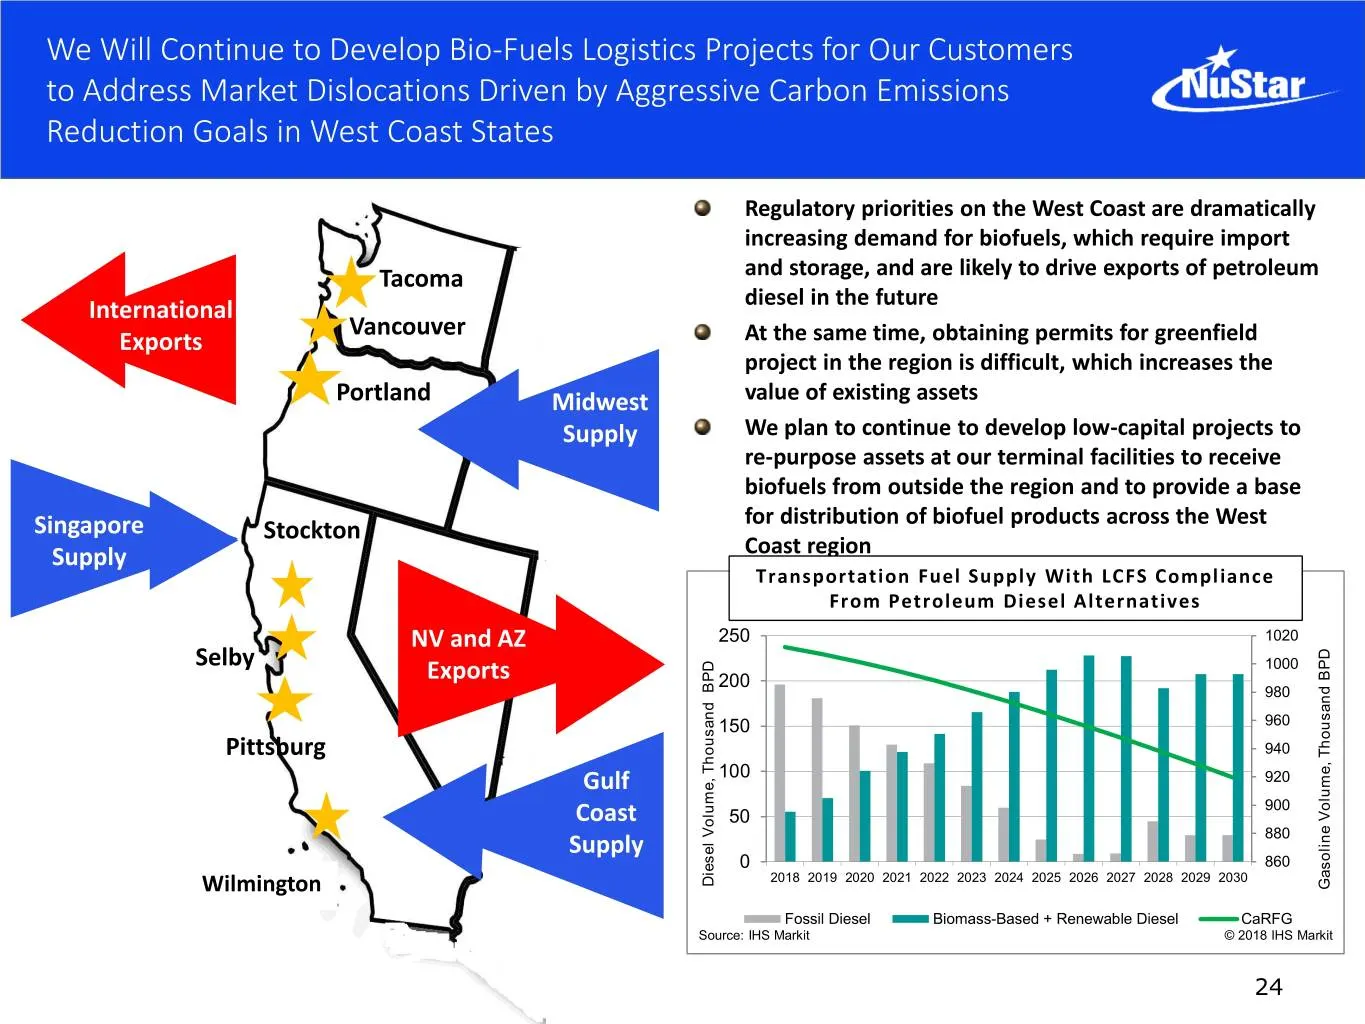
We Will Continue to Develop Bio-Fuels Logistics Projects for Our Customers to Address Market Dislocations Driven by Aggressive Carbon Emissions Reduction Goals in West Coast States Regulatory priorities on the West Coast are dramatically increasing demand for biofuels, which require import Tacoma an
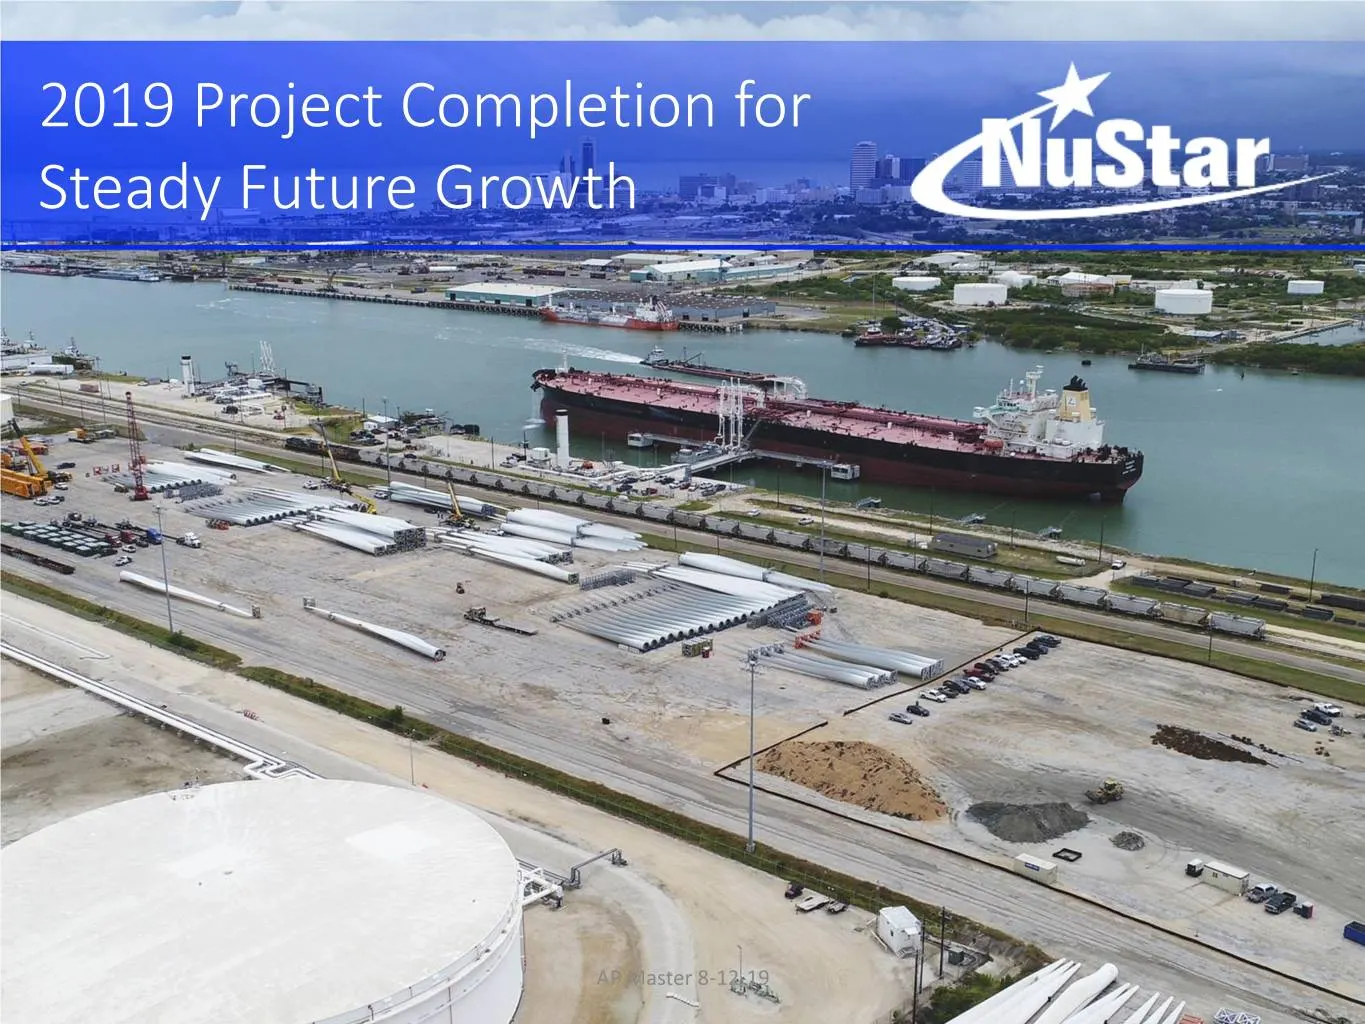
Slide 25: 2019 Project Completion for Continued Growth
2019 Project Completion for ContinuedSteady Future Improvement: Growth Our 2019 Plan AP Master 8-12-19
Slide 26: Focus on Completing Our 2019 Project Program
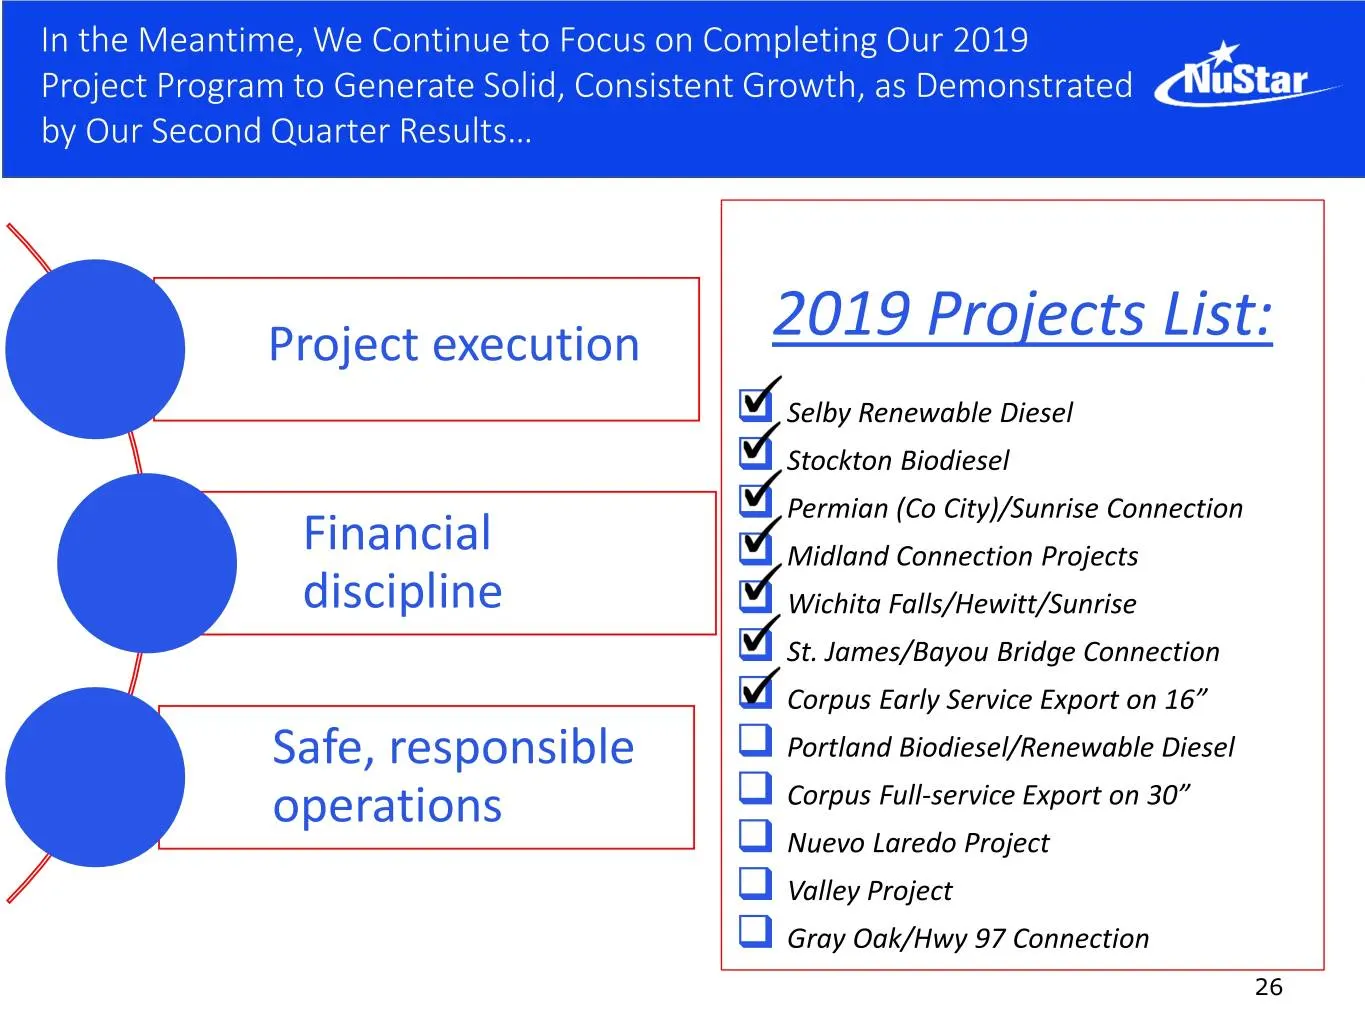
In the Meantime, We Continue to Focus on Completing Our 2019 Project Program to Generate Solid, Consistent Growth, as Demonstrated by Our Second Quarter Results… Project execution 2019 Projects List: Selby Renewable Diesel Stockton Biodiesel Permian (Co City)/Sunrise Connection Financial Mid
Slide 27: Safe, Responsible and Efficient Operations Are NuStar's #1 Priority
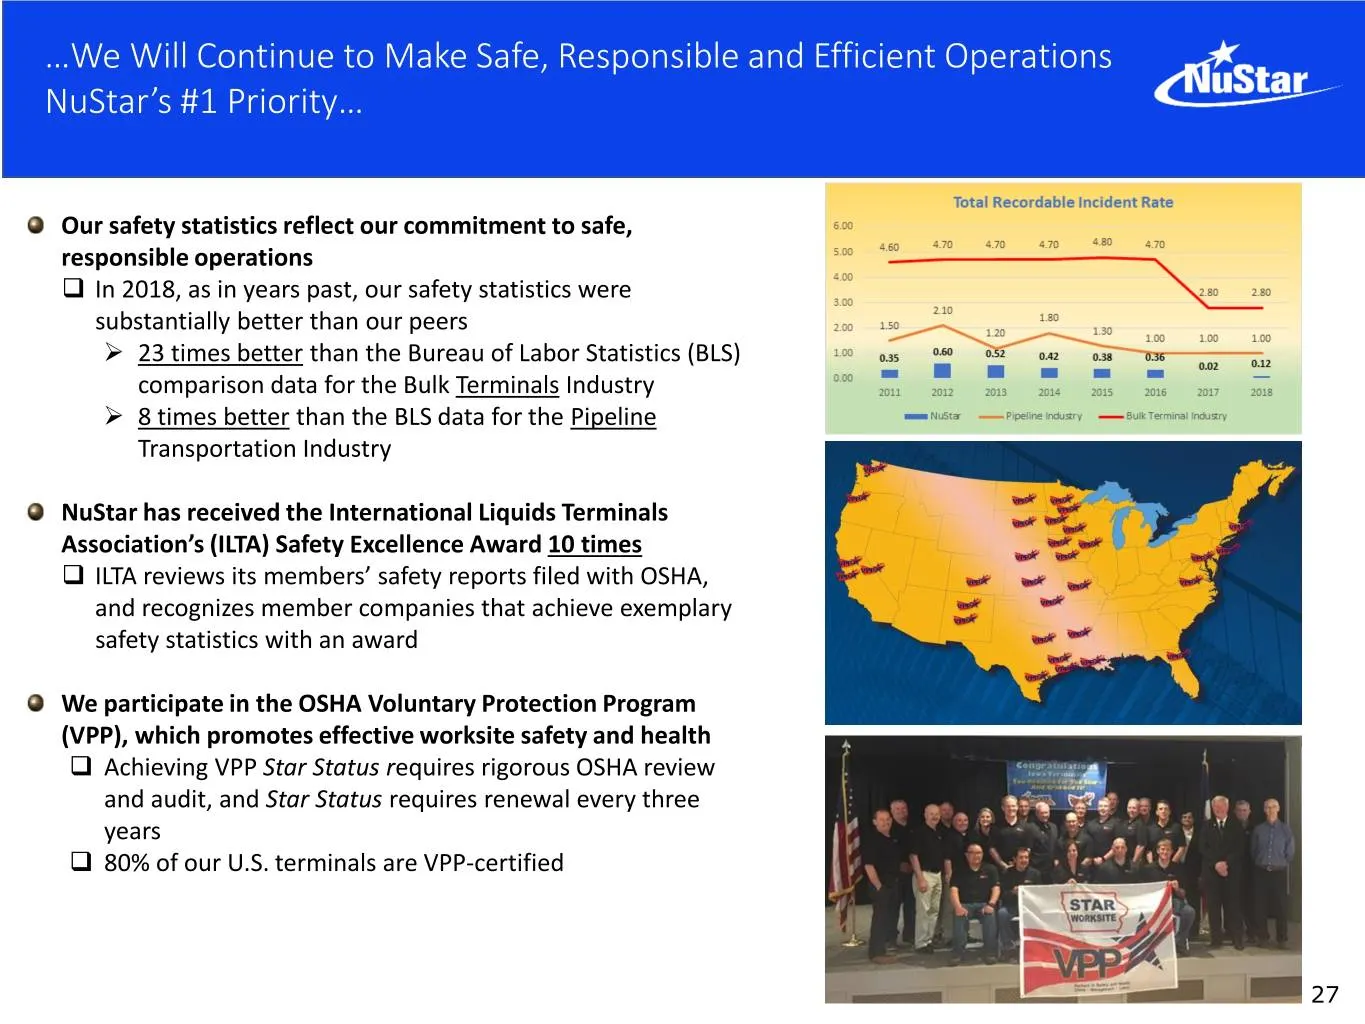
…We Will Continue to Make Safe, Responsible and Efficient Operations NuStar’s #1 Priority… Our safety statistics reflect our commitment to safe, responsible operations In 2018, as in years past, our safety statistics were substantially better than our peers ➢ 23 times better than the Bureau of Lab
Slide 28: Committed to Our Employees and Communities Across North America
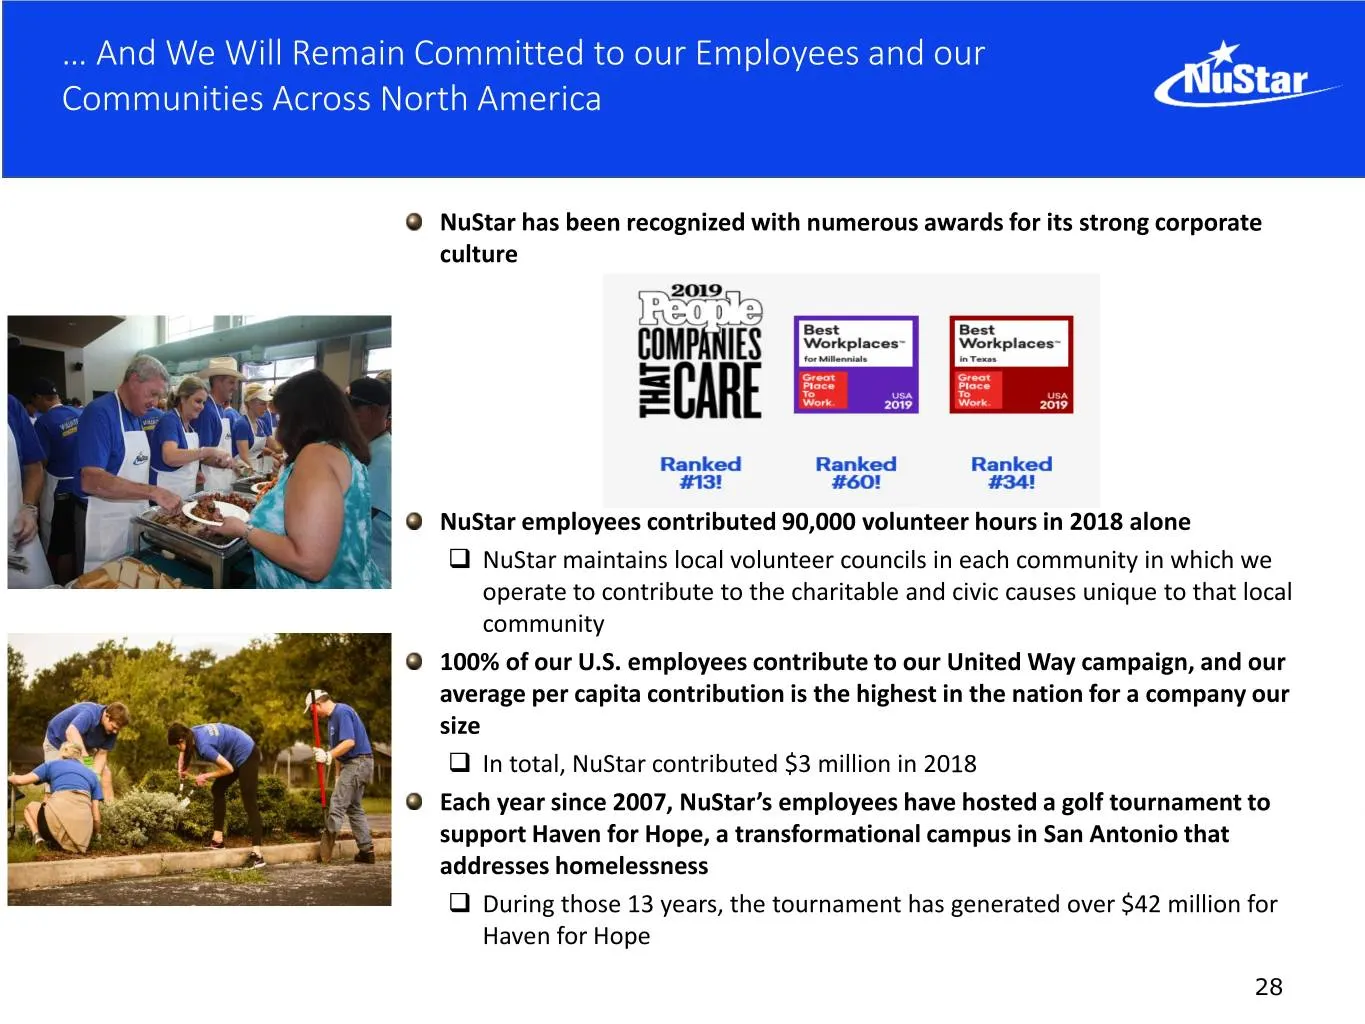
… And We Will Remain Committed to our Employees and our Communities Across North America NuStar has been recognized with numerous awards for its strong corporate culture NuStar employees contributed 90,000 volunteer hours in 2018 alone NuStar maintains local volunteer councils in each community in
Slide 29: Appendix
Appendix Continued Improvement: Our 2019 Plan
Slide 30: Producers in the Basin Remain Bullish on Permian Growth
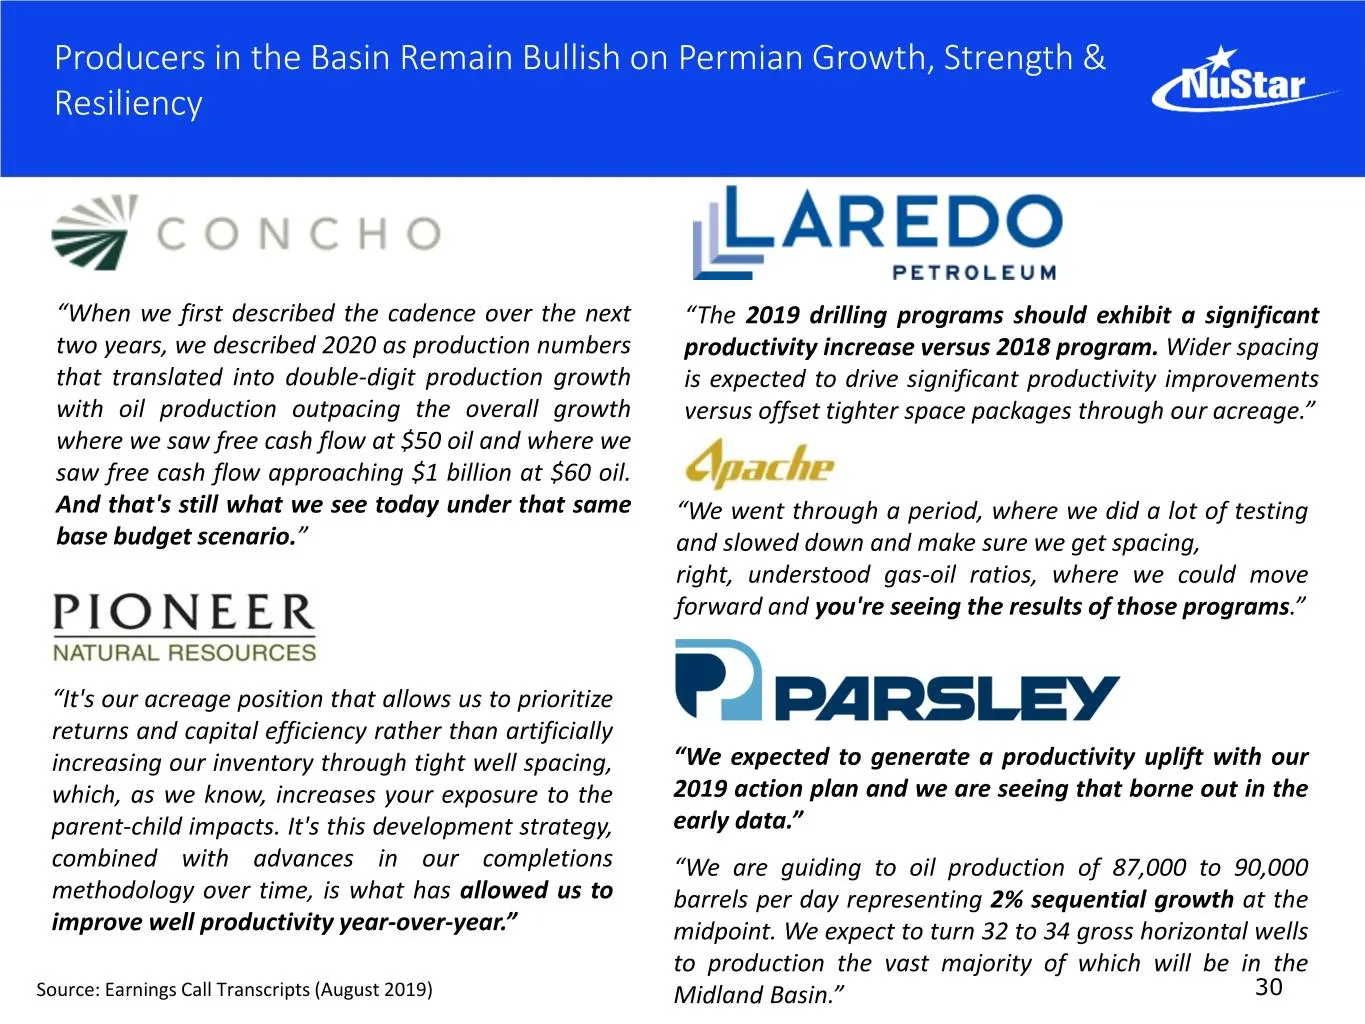
Producers in the Basin Remain Bullish on Permian Growth, Strength & Resiliency “When we first described the cadence over the next “The 2019 drilling programs should exhibit a significant two years, we described 2020 as production numbers productivity increase versus 2018 program. Wider spacing that
Slide 31: Long-Haul Pipelines Will Bring Additional 2.1MMBPD Capacity to Corpus Christi
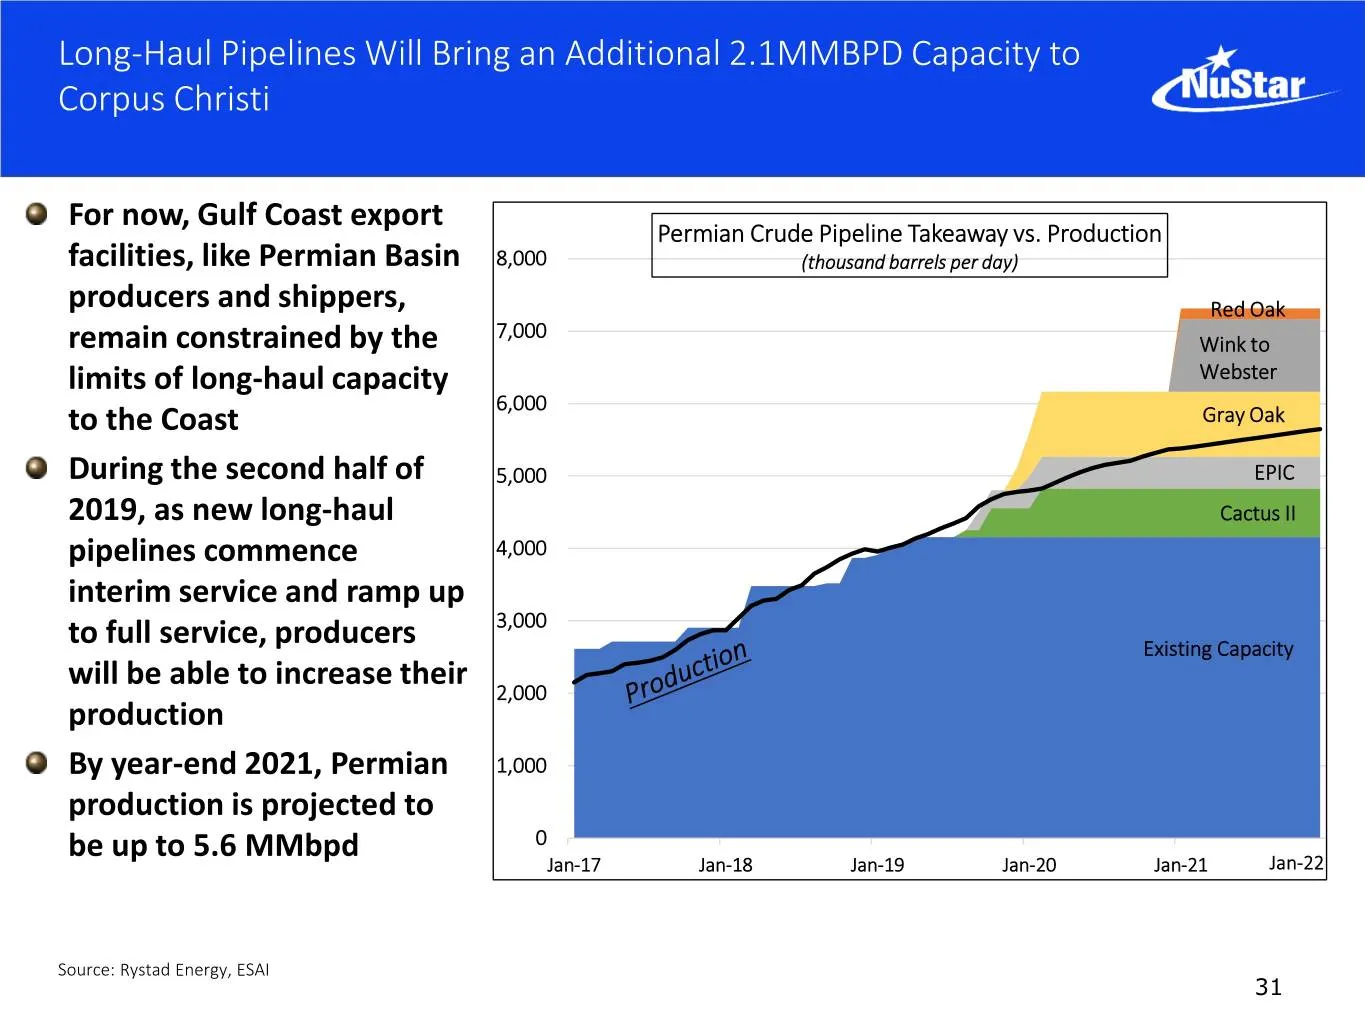
Long-Haul Pipelines Will Bring an Additional 2.1MMBPD Capacity to Corpus Christi For now, Gulf Coast export Permian Crude Pipeline Takeaway vs. Production facilities, like Permian Basin 8,000 (thousand barrels per day) producers and shippers, Red Oak 7,000 remain constrained by the Wink to limits of
Slide 32: Port of Corpus Christi Expected to Become Largest U.S. Crude Export Hub
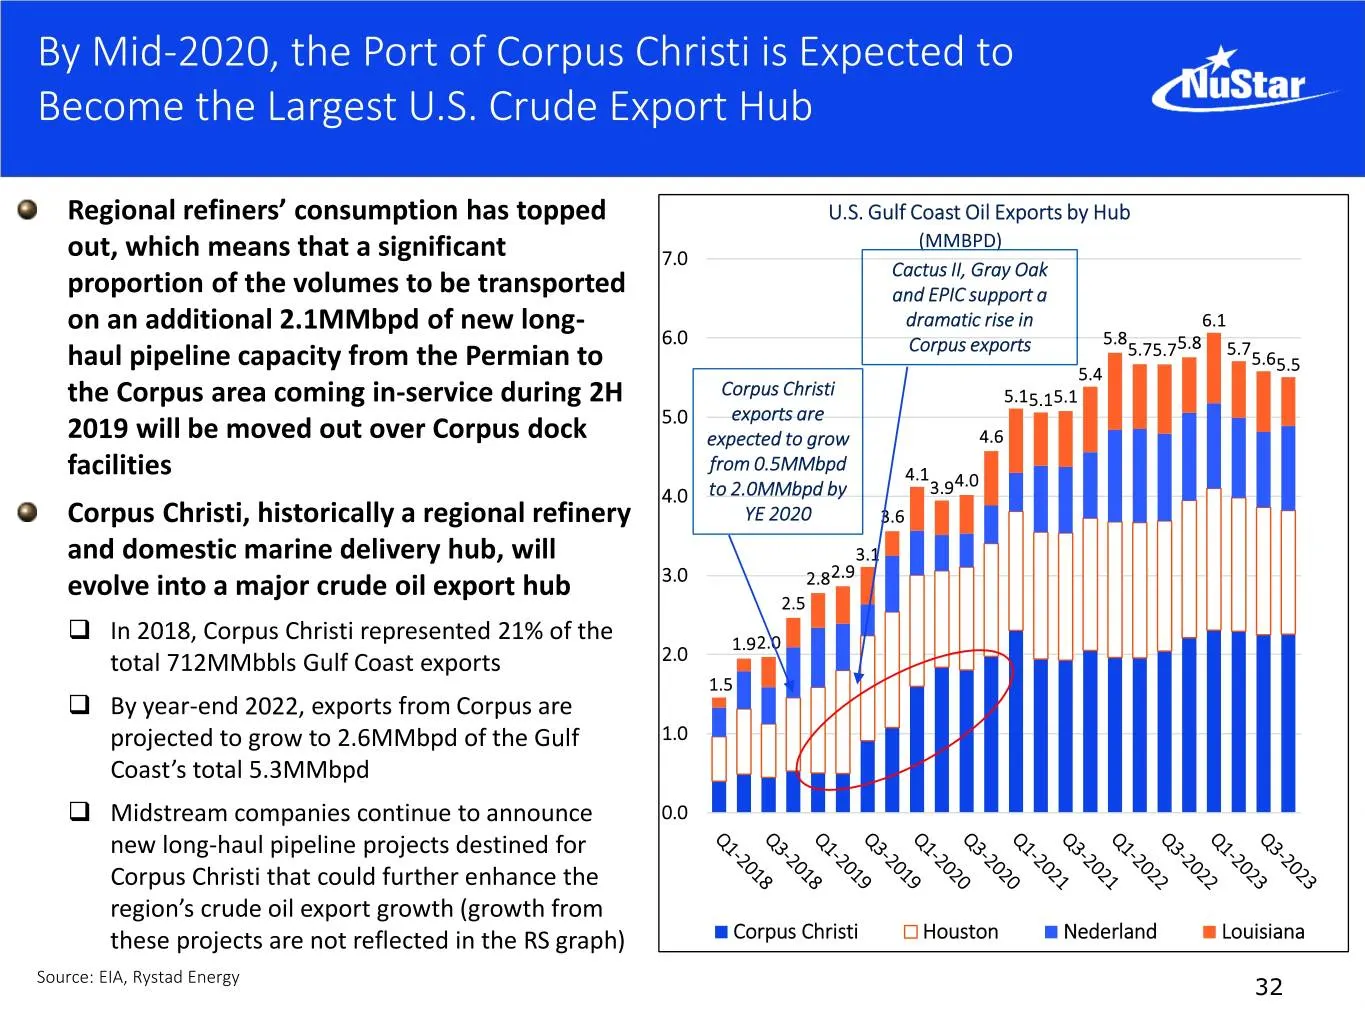
By Mid-2020, the Port of Corpus Christi is Expected to Become the Largest U.S. Crude Export Hub Regional refiners’ consumption has topped U.S. Gulf Coast Oil Exports by Hub (MMBPD) out, which means that a significant 7.0 Cactus II, Gray Oak proportion of the volumes to be transported and EPIC suppor
Slide 33: New Connections in Taft, Texas Establish Footprint in South Texas Hub
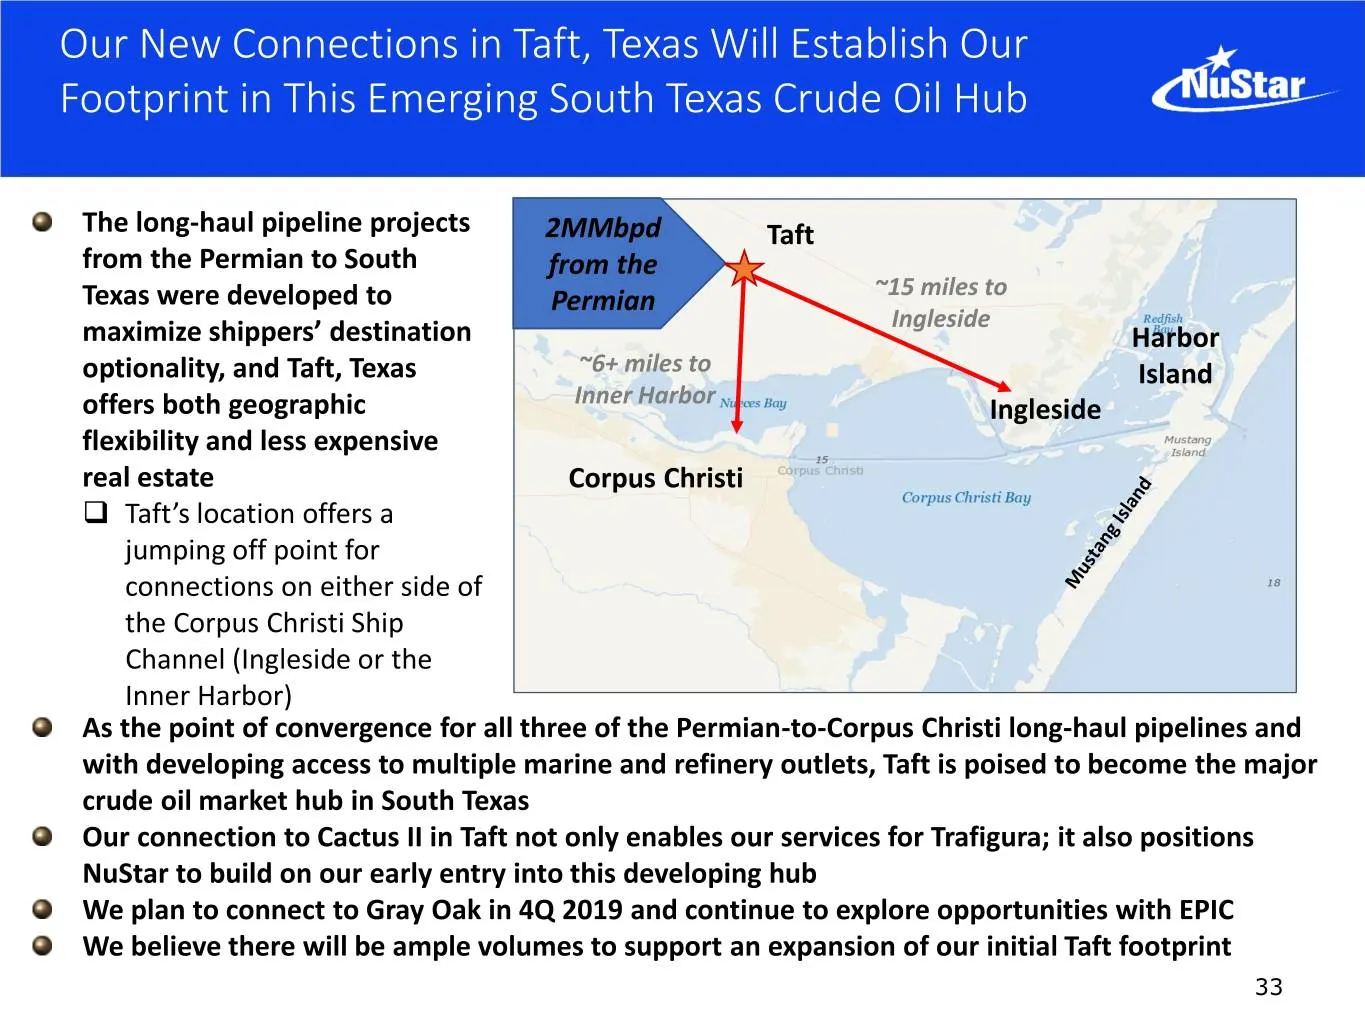
Our New Connections in Taft, Texas Will Establish Our Footprint in This Emerging South Texas Crude Oil Hub The long-haul pipeline projects 2MMbpd Taft from the Permian to South from the Texas were developed to Permian ~15 miles to Ingleside maximize shippers’ destination Harbor optionality, and Taft
Slide 34: West Coast Bio-Fuel Strategy Projects
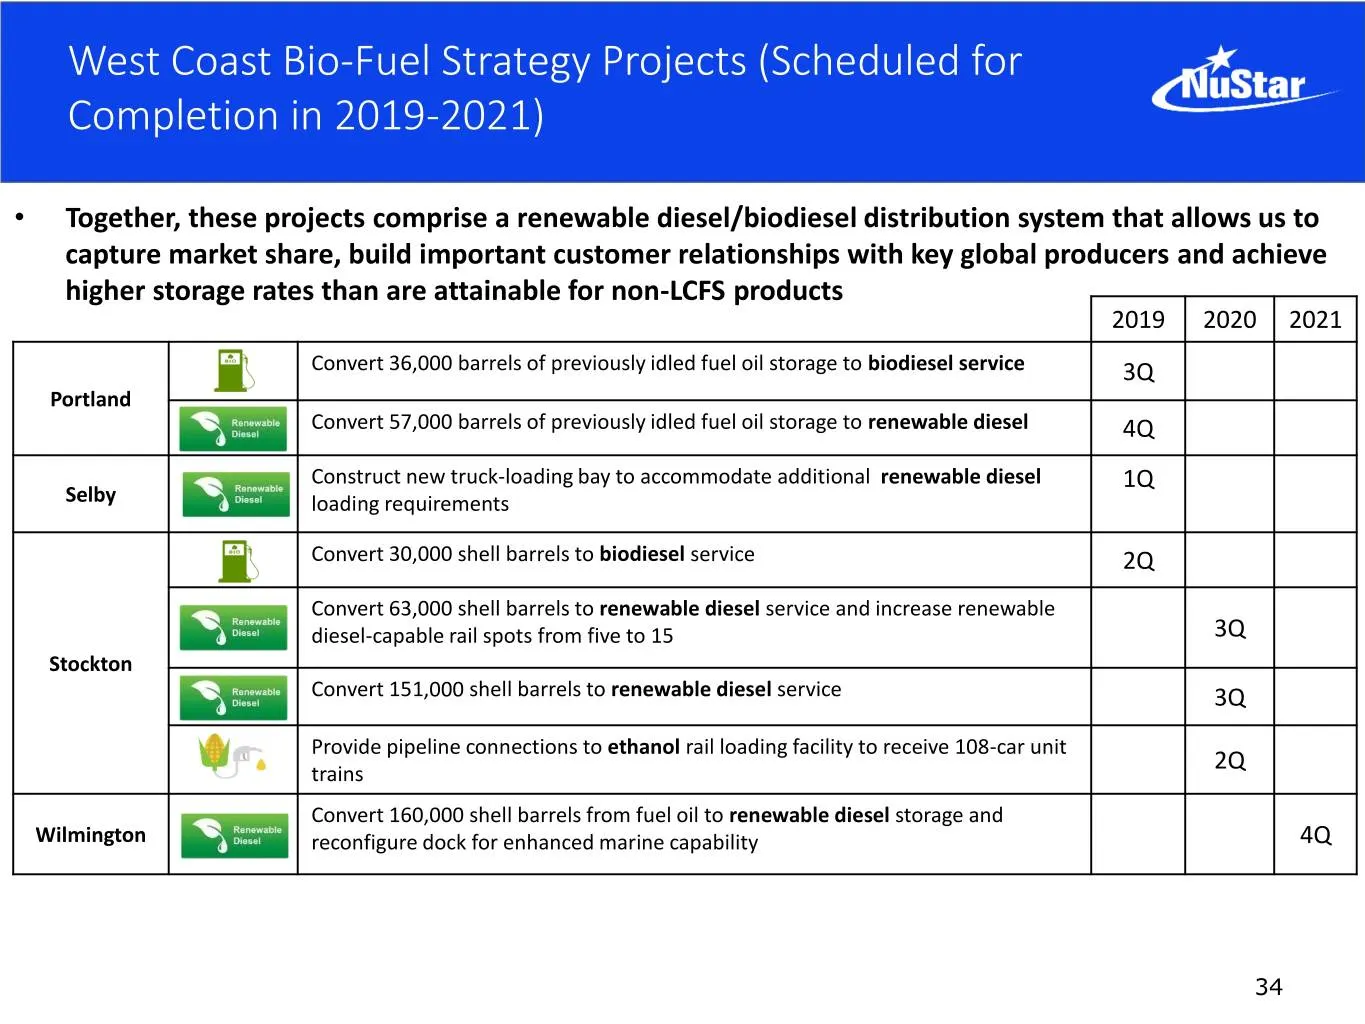
West Coast Bio-Fuel Strategy Projects (Scheduled for Completion in 2019-2021) • Together, these projects comprise a renewable diesel/biodiesel distribution system that allows us to capture market share, build important customer relationships with key global producers and achieve higher storage rates
Slide 35: Historic and 2019 Estimated Capital Spending
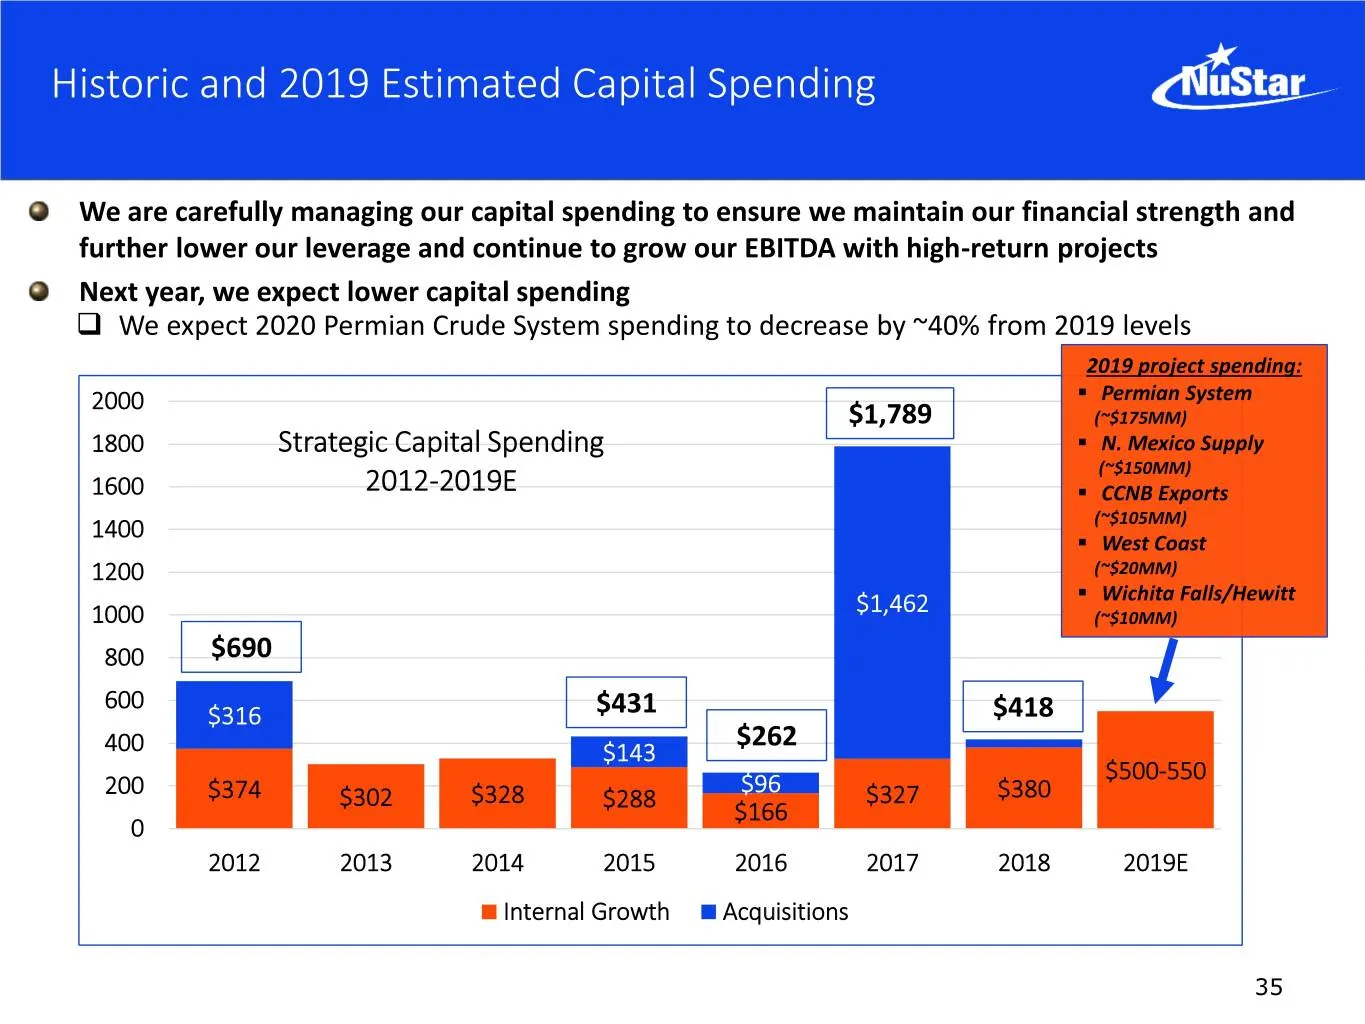
Historic and 2019 Estimated Capital Spending We are carefully managing our capital spending to ensure we maintain our financial strength and further lower our leverage and continue to grow our EBITDA with high-return projects Next year, we expect lower capital spending We expect 2020 Permian Crude
Slide 36: Debt Maturity Schedule
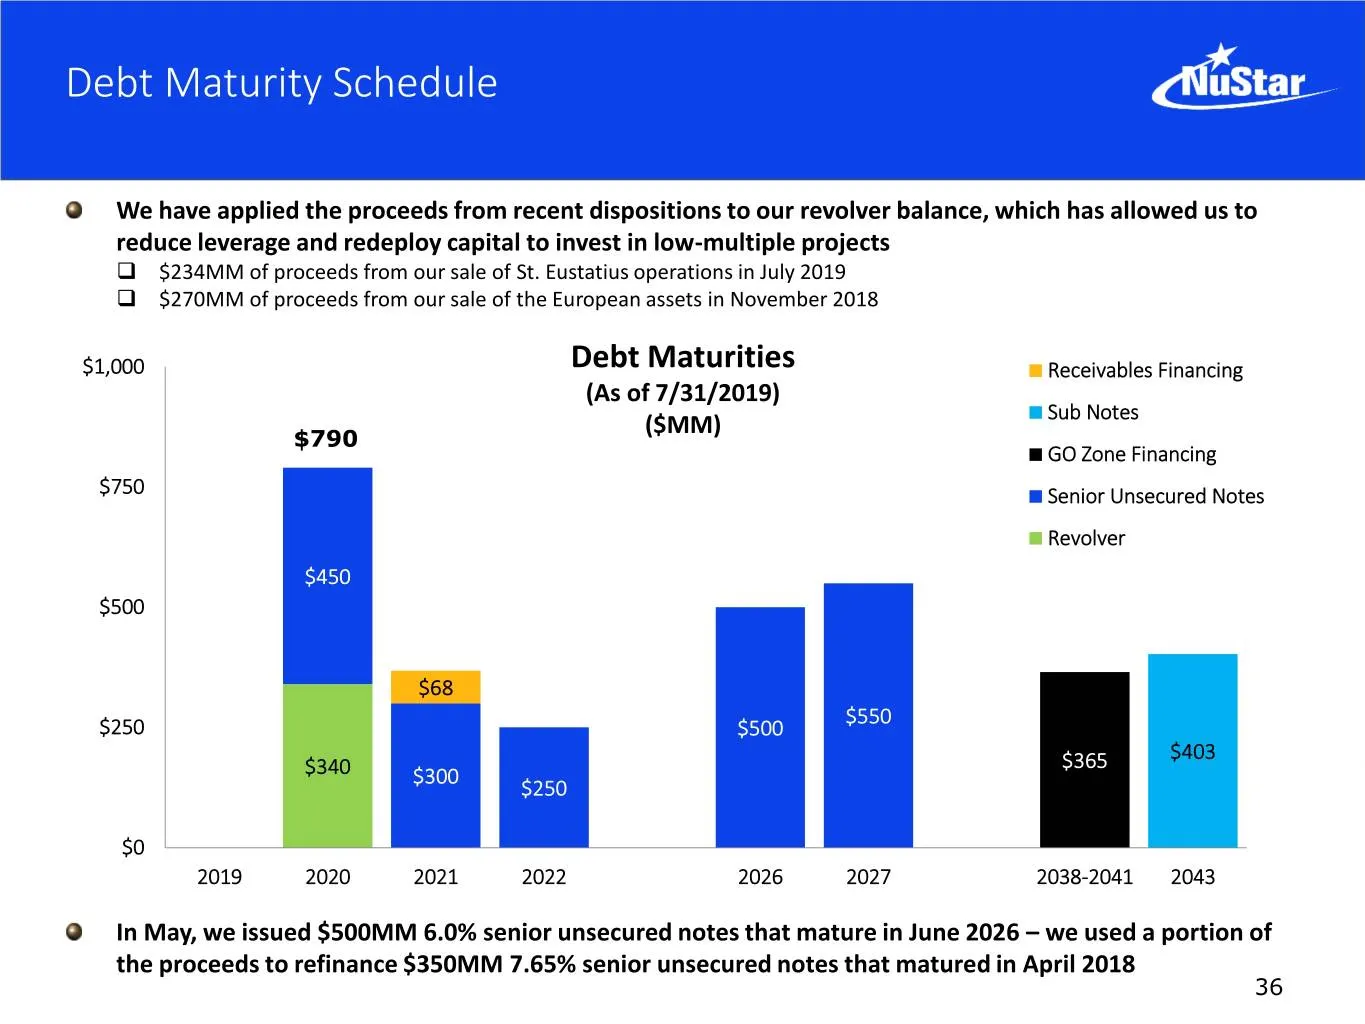
Debt Maturity Schedule We have applied the proceeds from recent dispositions to our revolver balance, which has allowed us to reduce leverage and redeploy capital to invest in low-multiple projects $234MM of proceeds from our sale of St. Eustatius operations in July 2019 $270MM of proceeds from
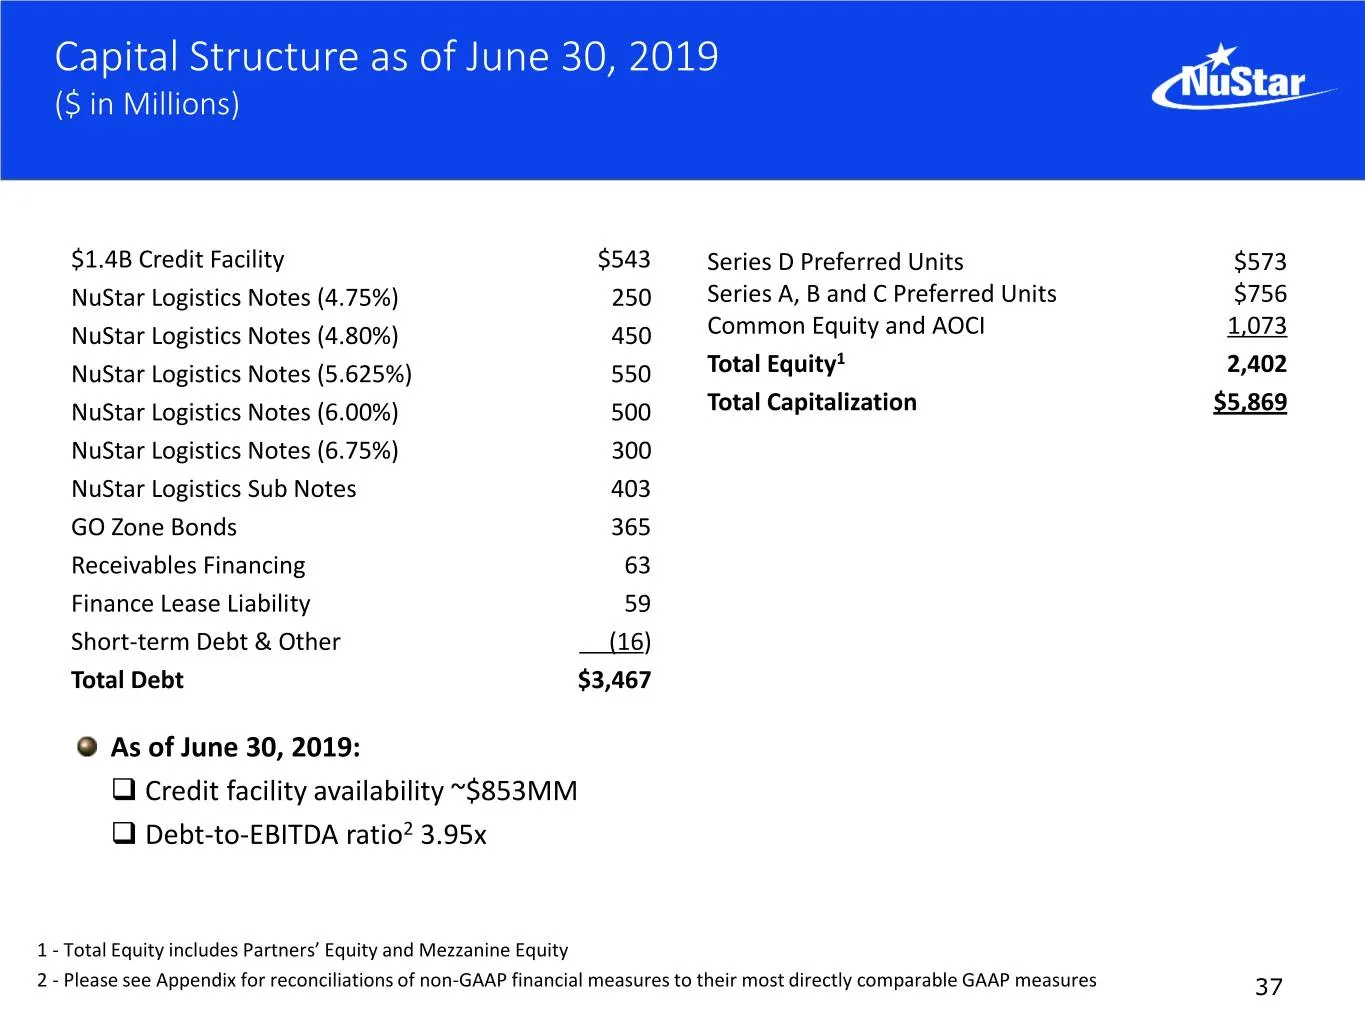
Slide 37: Capital Structure as of June 30, 2019
Capital Structure as of June 30, 2019 ($ in Millions) $1.4B Credit Facility $543 Series D Preferred Units $573 NuStar Logistics Notes (4.75%) 250 Series A, B and C Preferred Units $756 NuStar Logistics Notes (4.80%) 450 Common Equity and AOCI 1,073 1 NuStar Logistics Notes (5.625%) 550 Total Equity
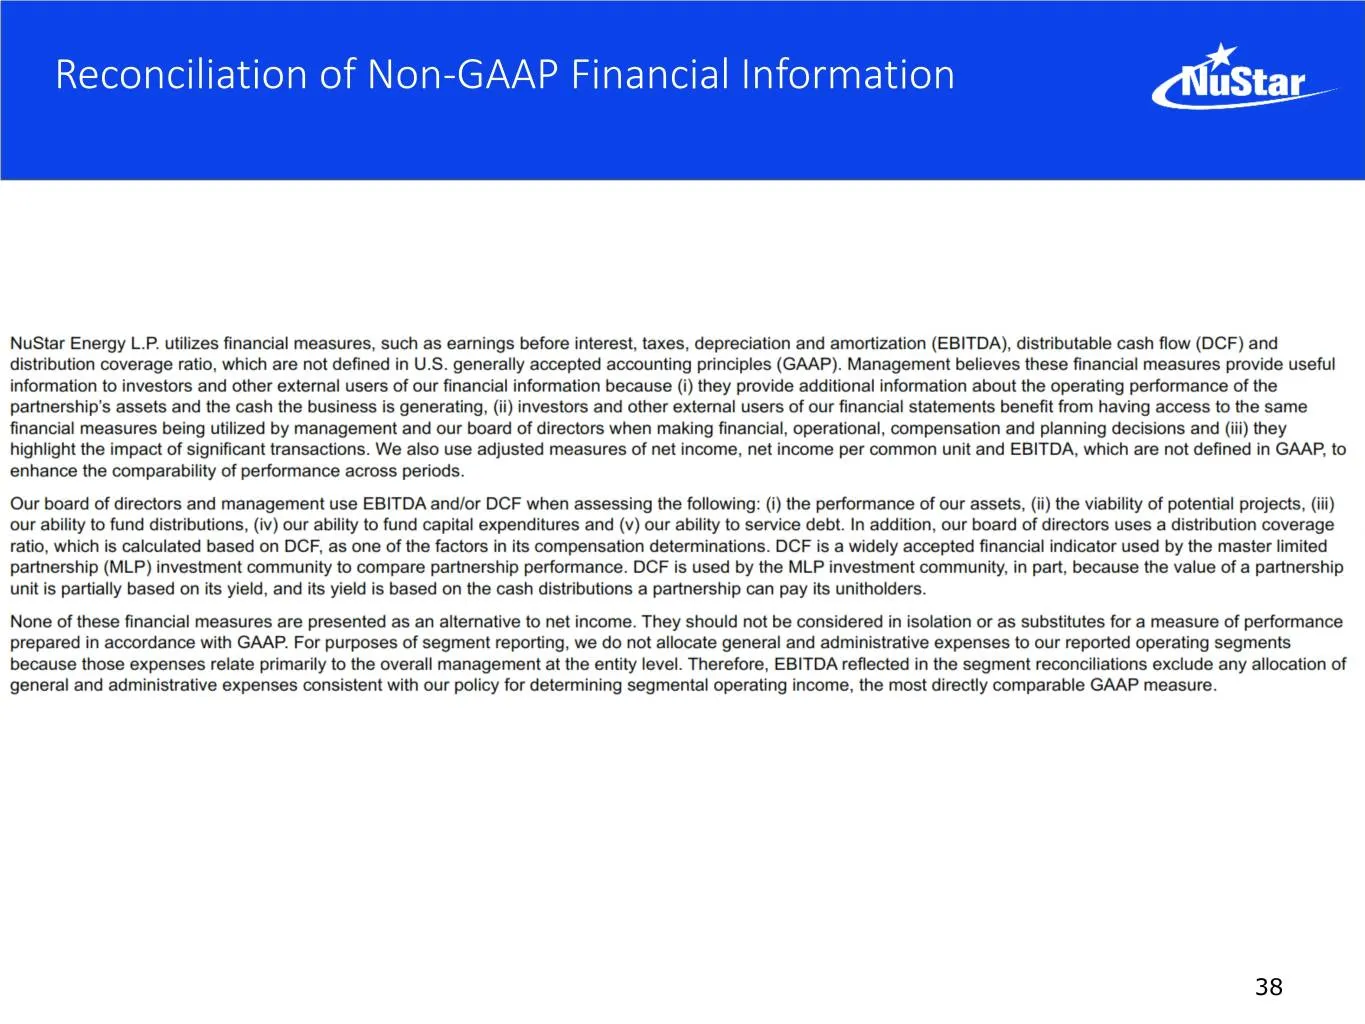
Slide 38: Reconciliation of Non-GAAP Financial Information
Reconciliation of Non-GAAP Financial Information 38
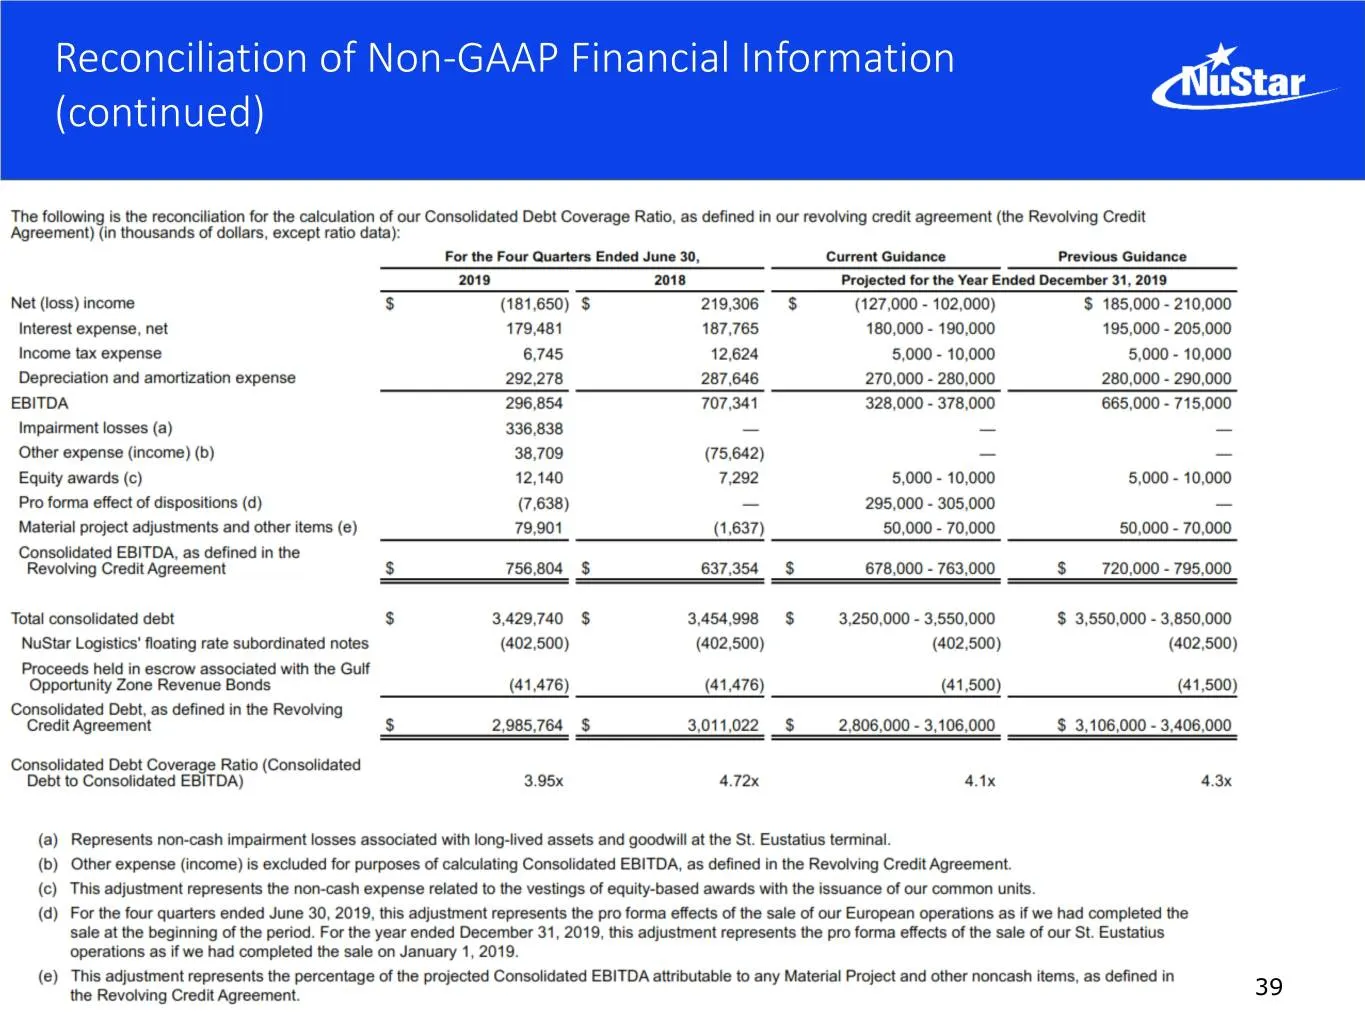
Slide 39: Reconciliation of Non-GAAP Financial Information (continued)
Reconciliation of Non-GAAP Financial Information (continued) 39
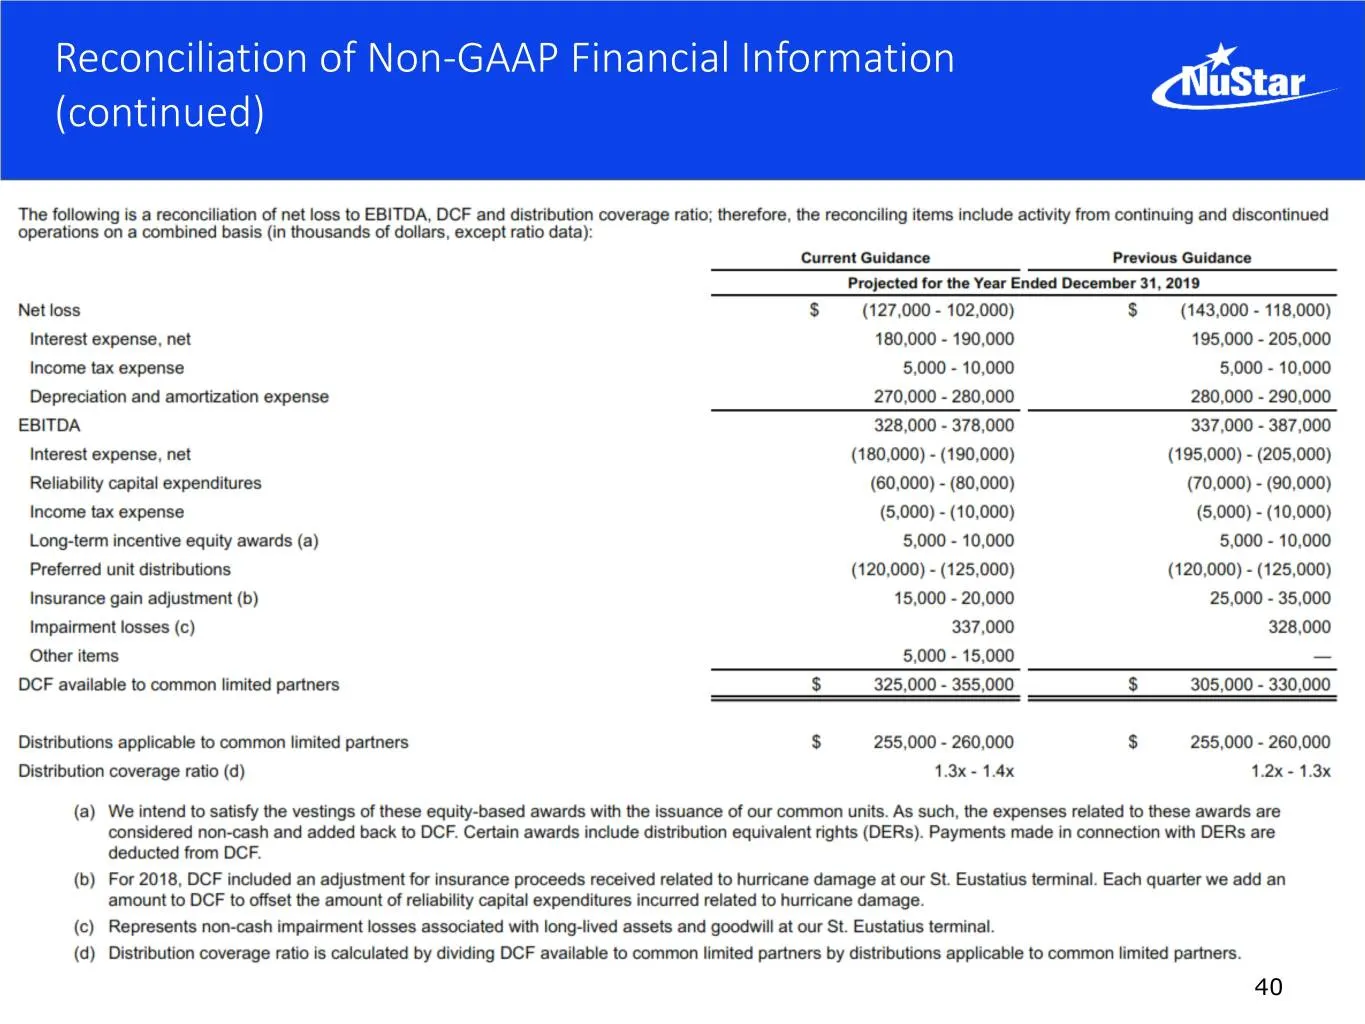
Slide 40: Reconciliation of Non-GAAP Financial Information (continued)
Reconciliation of Non-GAAP Financial Information (continued) 40
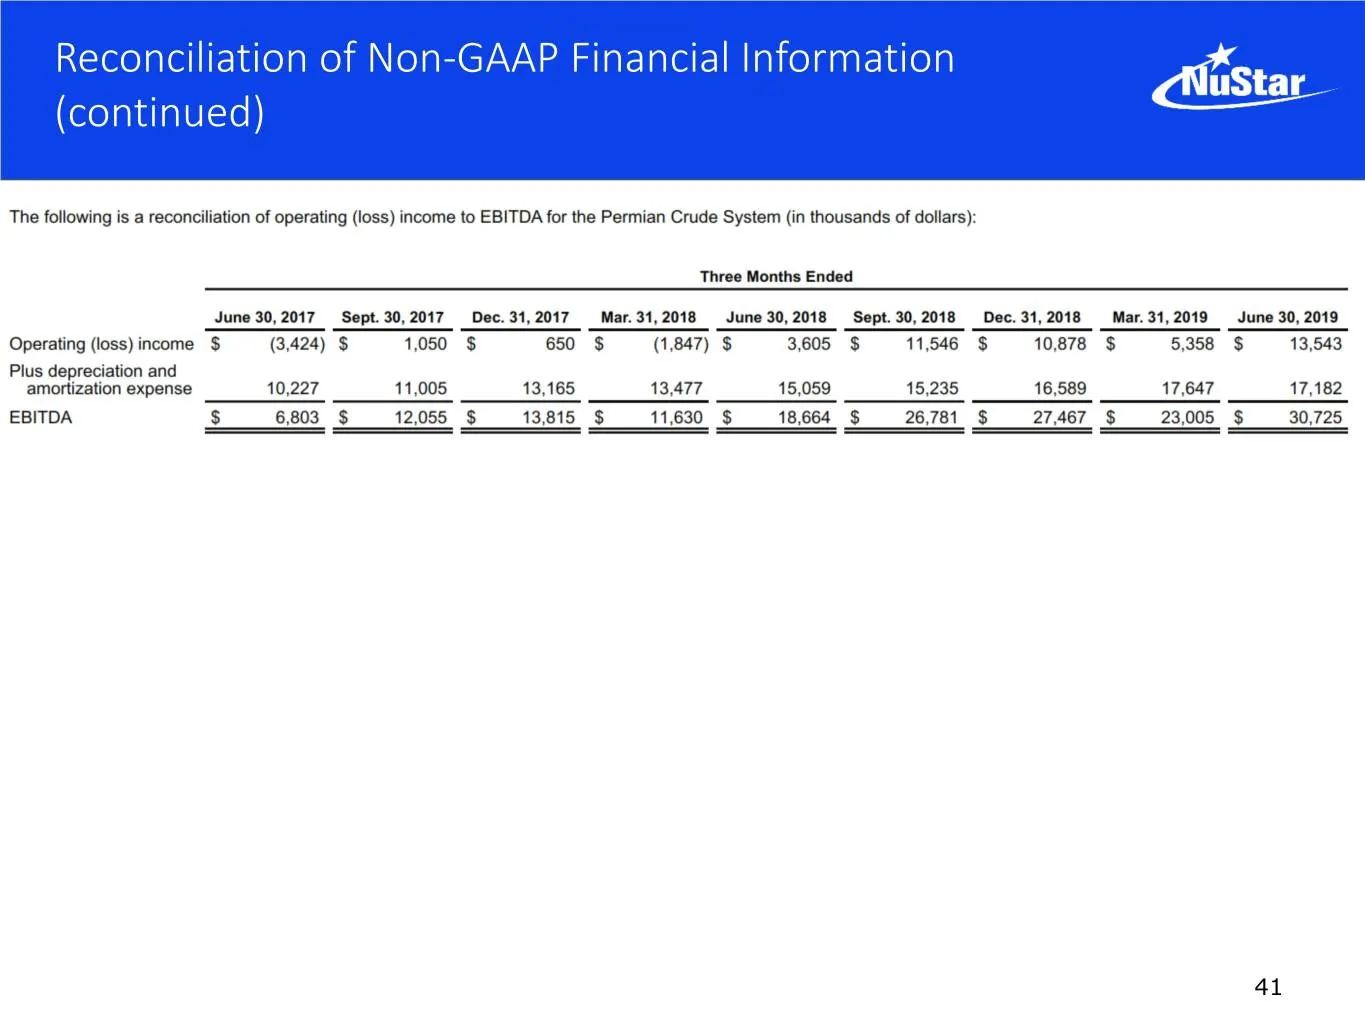
Slide 41: Reconciliation of Non-GAAP Financial Information (continued)
Reconciliation of Non-GAAP Financial Information (continued) 41
Source: SEC EDGAR · 8-K filed Aug 14, 2019
More decks from NuStar Energy LP
 Merger or Acquisition (January 2024)14 slides · Jan 22, 2024
 Investor Presentation (December 2023)35 slides · Dec 5, 2023
 Raymond James Virtual Energy Supply Chain Conference 2023; Pickering Energy Partners TE&MF36 slides · Sep 19, 2023
 Barclays CEO Energy-Power Conference 202336 slides · Sep 6, 2023
 Citi One-on-One Midstream/Energy Infrastructure Conference 202336 slides · Aug 22, 2023
 8th Annual J.P. Morgan Energy, Power & Renewables Conference 202336 slides · Jun 21, 2023