Beacon Roofing Supply — Investor Day (February 2022)
83 slides from Beacon Roofing Supply's investor day presentation, Feb 24, 2022

Slide 1: Investor Day, February 24, 2022
INVESTOR DAY BEACON PRESENTS FEBRUARY 24, 2022 | HOUSTON, TX Exhibit 99.1
Slide 2: Disclosure Notice
Disclosure Notice This presentation contains information about management's view of the Company's future expectations, plans and prospects that constitute forward-looking statements for purposes of the safe harbor provisions under the Private Securities Litigation Reform Act of 1995. In addition, or
Slide 3: Agenda
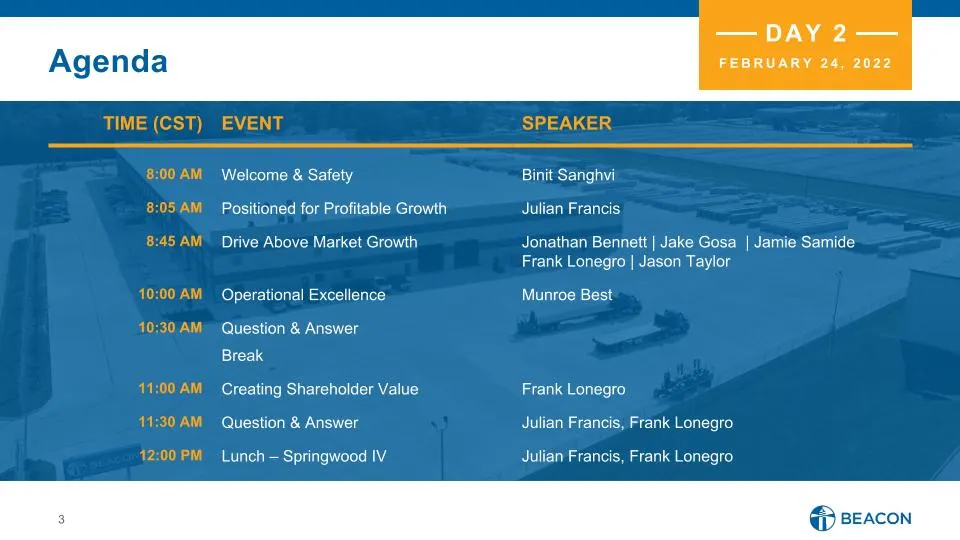
Agenda DAY 2 FEBRUARY 24, 2022 TIME (CST) EVENT SPEAKER 8:00 AM Welcome & Safety Binit Sanghvi 8:05 AM Positioned for Profitable Growth Julian Francis 8:45 AM Drive Above Market Growth Jonathan Bennett | Jake Gosa | Jamie Samide Frank Lonegro | Jason Taylor 10:00 AM Operational Excellence Munroe Bes

Slide 4: Unlocking Our Potential
Julian Francis, Chief Executive Officer Unlocking Our Potential
Slide 5: Our North America Footprint
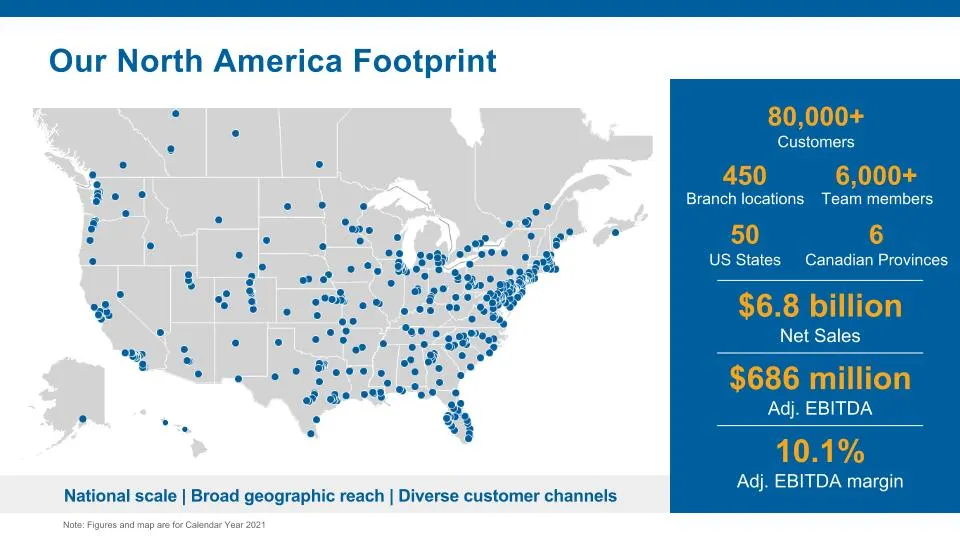
National scale | Broad geographic reach | Diverse customer channels 450 Branch locations 50 US States 80,000+ Customers 10.1% Adj. EBITDA margin 6 Canadian Provinces $6.8 billion Net Sales $686 million Adj. EBITDA Note: Figures and map are for Calendar Year 2021 Our North America Footprint 6,000+ Te
Slide 6: Roofing and Complementary Products
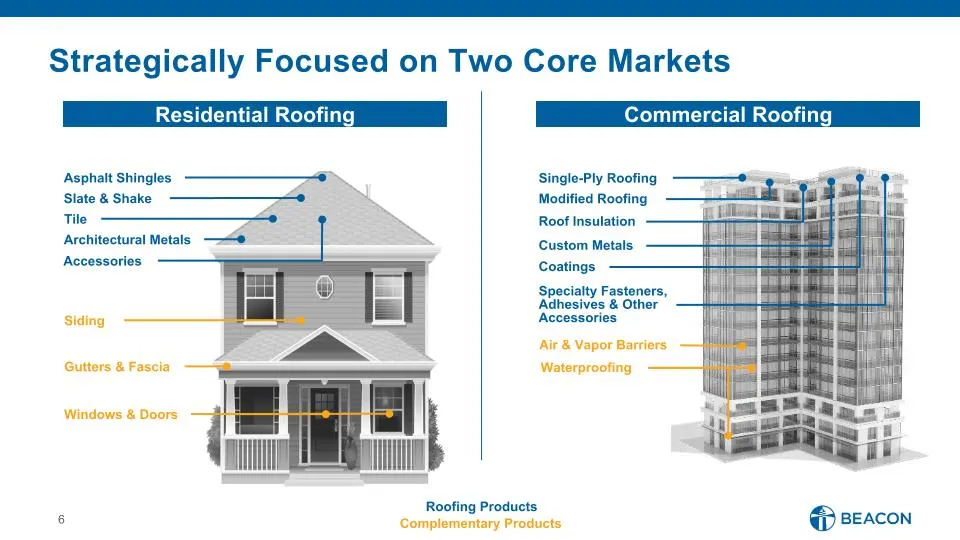
Slate & Shake Asphalt Shingles Gutters & Fascia Siding Windows & Doors Roofing Products Complementary Products Roof Insulation Single-Ply Roofing Waterproofing Air & Vapor Barriers Architectural Metals Accessories Modified Roofing Specialty Fasteners, Adhesives & Other Accessories Custom Metals Tile
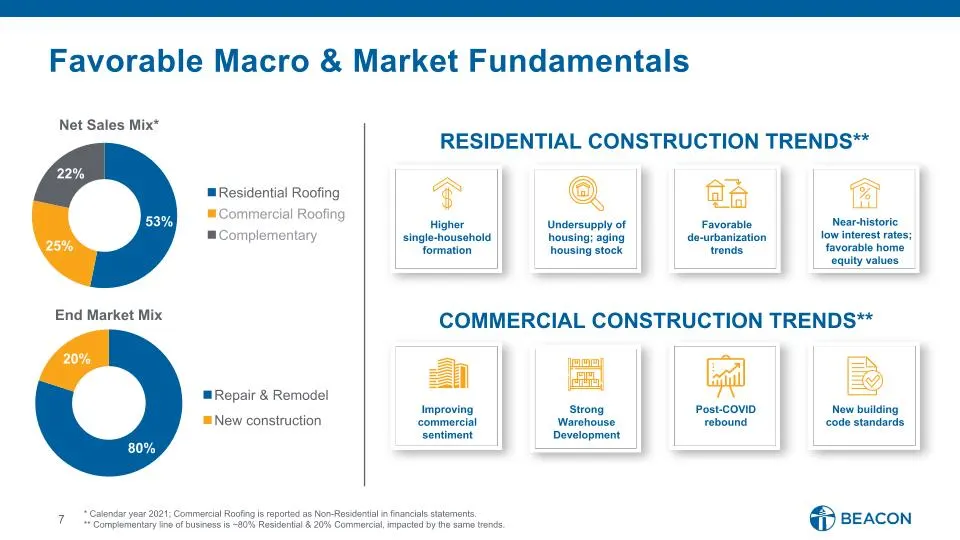
Slide 7: Favorable Macro & Market Fundamentals
7 * Calendar year 2021; Commercial Roofing is reported as Non-Residential in financials statements. ** Complementary line of business is ~80% Residential & 20% Commercial, impacted by the same trends. Improving commercial sentiment Higher single-household formation Undersupply of housing; aging hous
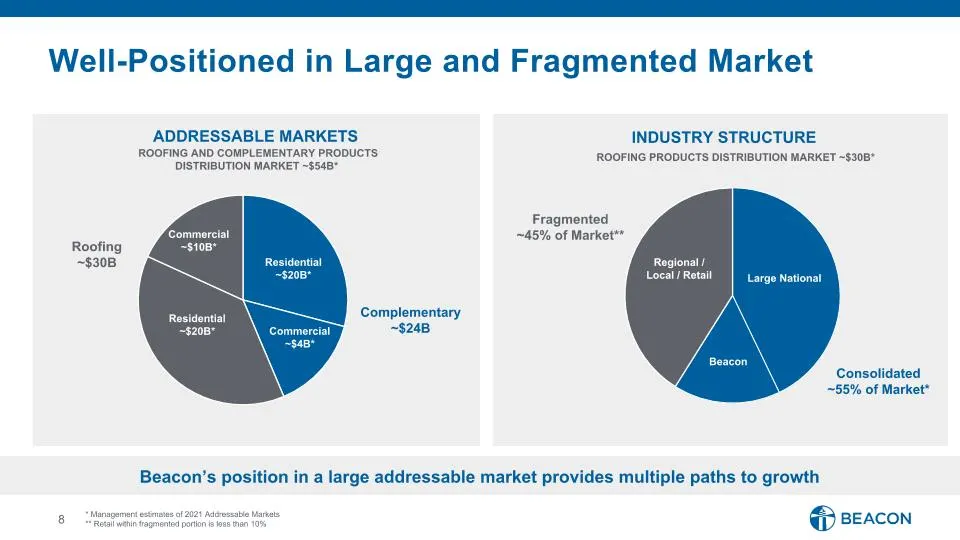
Slide 8: Well-Positioned in Large and Fragmented Market
Well-Positioned in Large and Fragmented Market ADDRESSABLE MARKETS * Management estimates of 2021 Addressable Markets ** Retail within fragmented portion is less than 10% Complementary ~$24B Roofing ~$30B Residential ~$20B* Commercial ~$4B* Regional / Local / Retail Beacon Consolidated ~55% of Marke
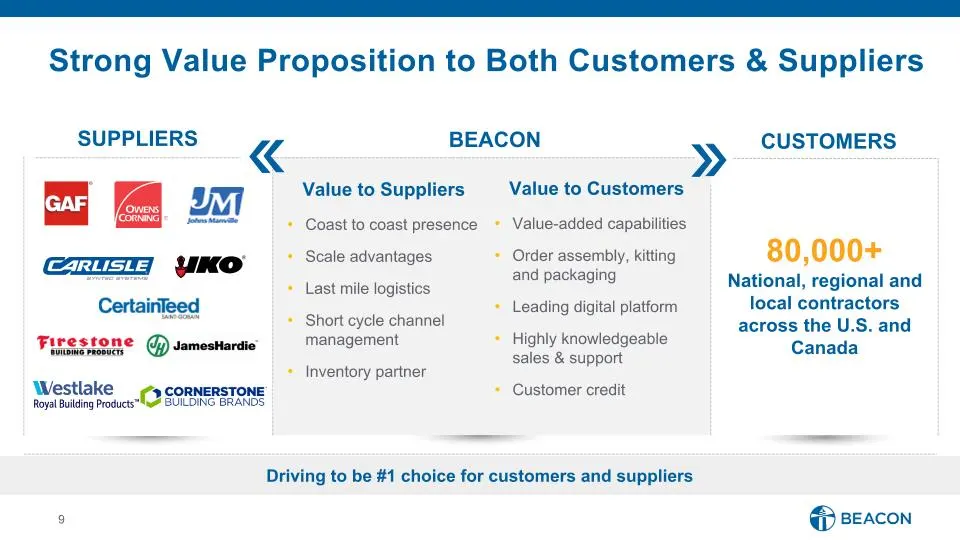
Slide 9: Strong Value Proposition to Both Customers & Suppliers
80,000+ National, regional and local contractors across the U.S. and Canada Value to Suppliers Coast to coast presence Scale advantages Last mile logistics Short cycle channel management Inventory partner Value to Customers Value-added capabilities Order assembly, kitting and packaging Leading digit
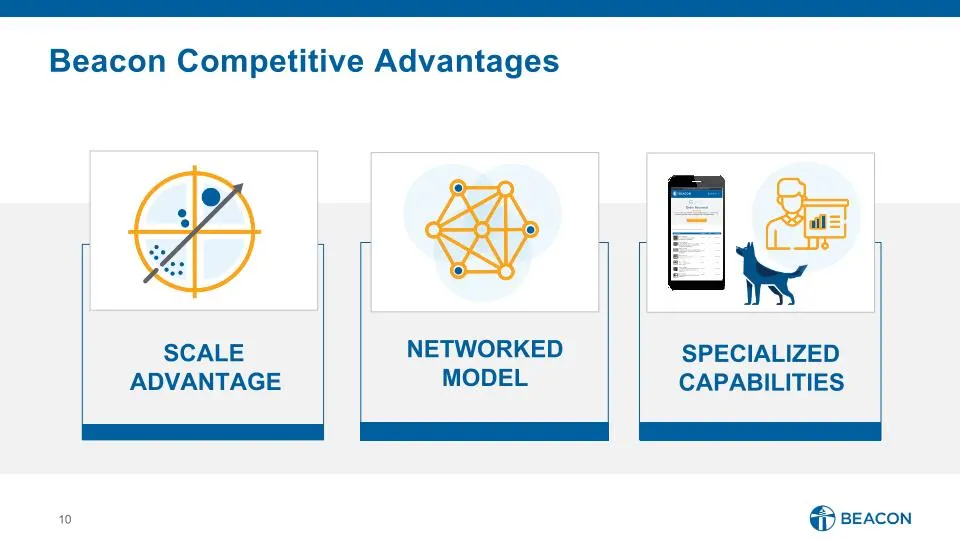
Slide 10: Beacon Competitive Advantages
Beacon Competitive Advantages SCALE ADVANTAGE SPECIALIZED CAPABILITIES NETWORKED MODEL
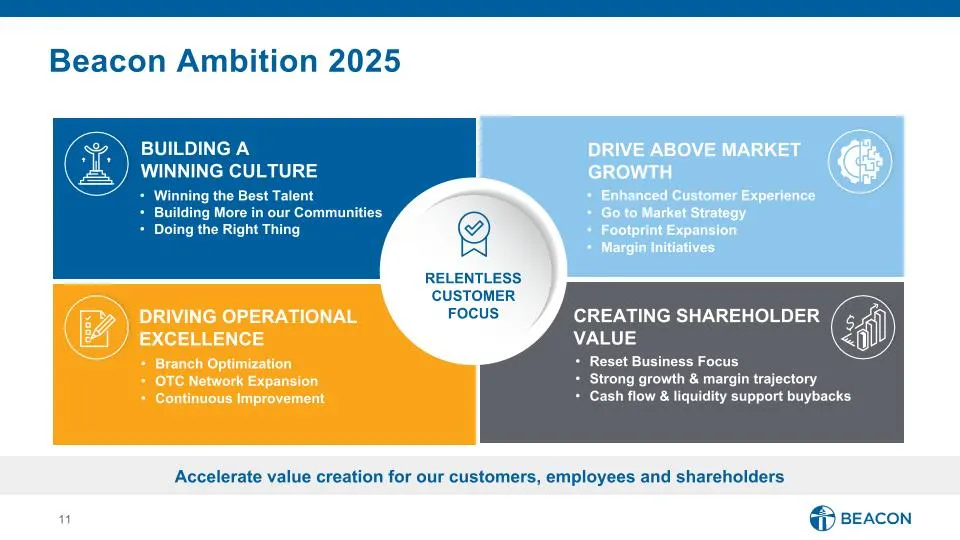
Slide 11: Beacon Ambition 2025
RELENTLESS CUSTOMER FOCUS DRIVING OPERATIONAL EXCELLENCE Branch Optimization OTC Network Expansion Continuous Improvement BUILDING A WINNING CULTURE Winning the Best Talent Building More in our Communities Doing the Right Thing Drive Above Market Growth Enhanced Customer Experience Go to Market Stra
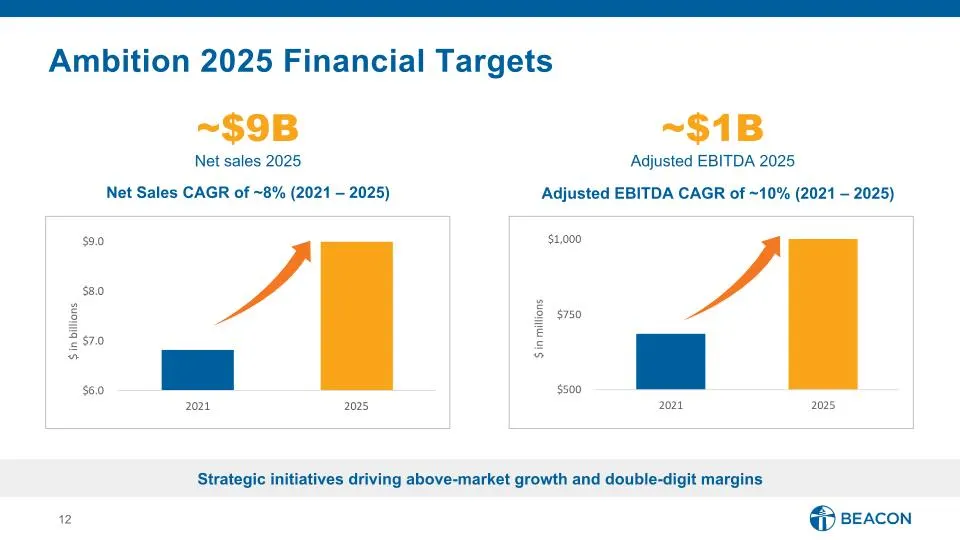
Slide 12: Ambition 2025 Financial Targets
Ambition 2025 Financial Targets Strategic initiatives driving above-market growth and double-digit margins Net Sales CAGR of ~8% (2021 – 2025) Adjusted EBITDA CAGR of ~10% (2021 – 2025) ~$9B Net sales 2025 ~$1B Adjusted EBITDA 2025
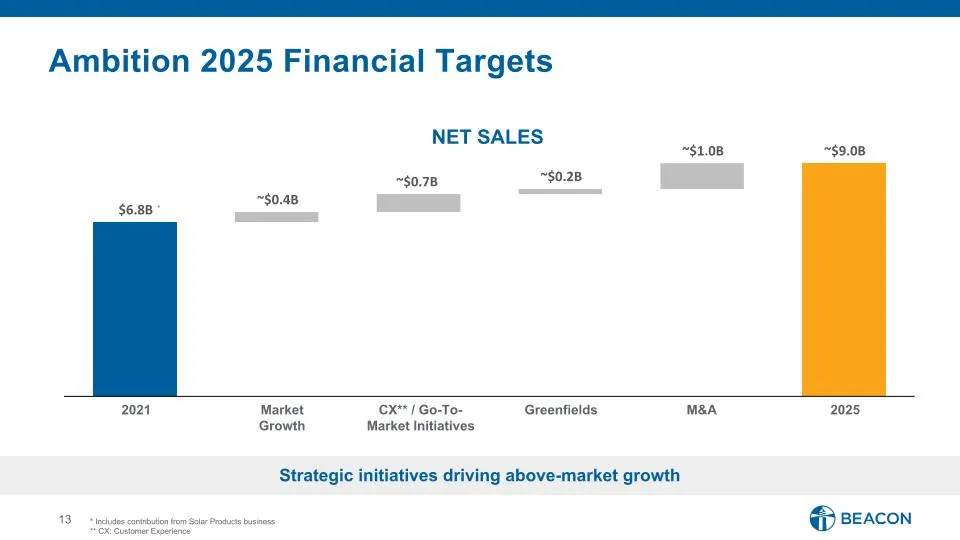
Slide 13: Ambition 2025 Financial Targets: Net Sales
Ambition 2025 Financial Targets NET SALES * Includes contribution from Solar Products business ** CX: Customer Experience 2021 Market Growth CX** / Go-To-Market Initiatives Greenfields M&A 2025 * $6.8B ~$0.4B ~$0.7B ~$0.2B ~$1.0B ~$9.0B Strategic initiatives driving above-market growth
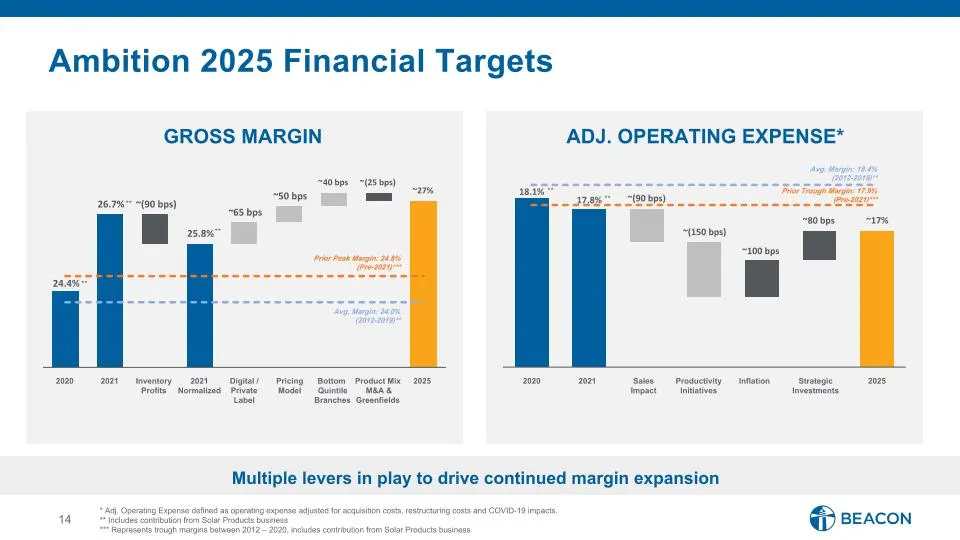
Slide 14: Ambition 2025 Financial Targets: Margin Expansion
18.1% 17.8% ~(90 bps) ~(150 bps) ~100 bps ~80 bps ~17% 24.4% 26.7% ~(90 bps) 25.8% ~ 65 bps ~ 50 bps ~ 40 bps ~ (25 bps) ~27% Ambition 2025 Financial Targets Multiple levers in play to drive continued margin expansion * Adj. Operating Expense defined as operating expense adjusted for acquisition cos
Slide 15: Strong Investment Thesis
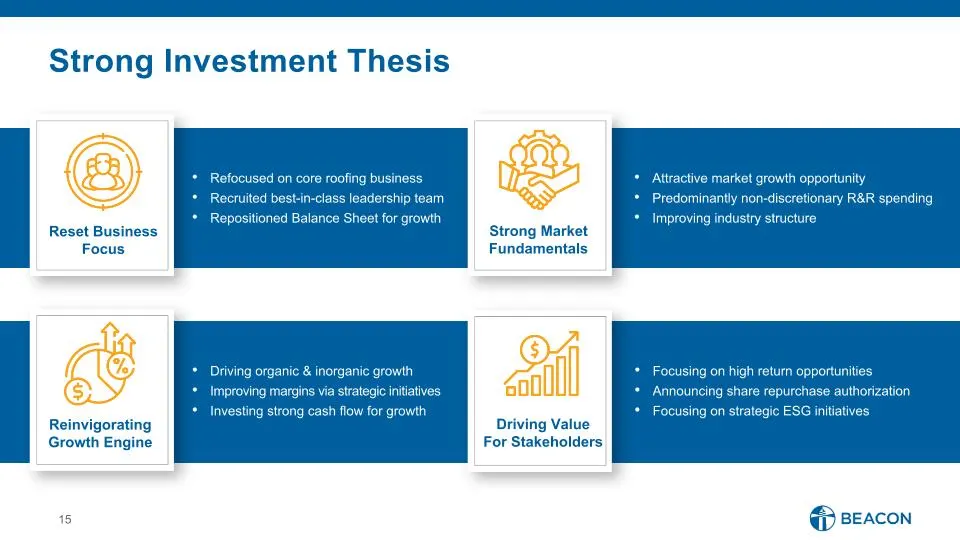
Strong Investment Thesis Refocused on core roofing business Recruited best-in-class leadership team Repositioned Balance Sheet for growth Reset Business Focus Strong Market Fundamentals Attractive market growth opportunity Predominantly non-discretionary R&R spending Improving industry structure Dri
Slide 16: Initiatives and Investments to Drive Above Market Growth
Jonathan Bennett, Chief Commercial Officer Initiatives and Investments to Drive Above Market Growth
Slide 17: Ambition 2025 – Sales Growth and Margin Drivers
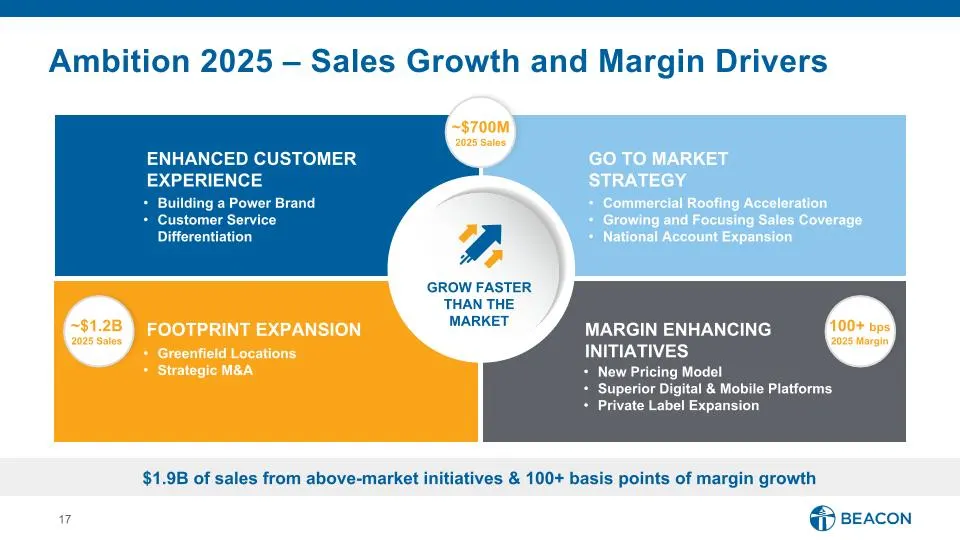
GROW FASTER THAN THE MARKET 100+ bps 2025 Margin MARGIN ENHANCING INITIATIVES New Pricing Model Superior Digital & Mobile Platforms Private Label Expansion ENHANCED CUSTOMER EXPERIENCE Building a Power Brand Customer Service Differentiation GO TO MARKET STRATEGY Commercial Roofing Acceleration Growi
Slide 18: Ambition 2025 – Sales Growth and Margin Drivers
MARGIN ENHANCING INITIATIVES ENHANCED CUSTOMER EXPERIENCE GO TO MARKET STRATEGY FOOTPRINT EXPANSION Ambition 2025 – Sales Growth and Margin Drivers GROW FASTER THAN THE MARKET
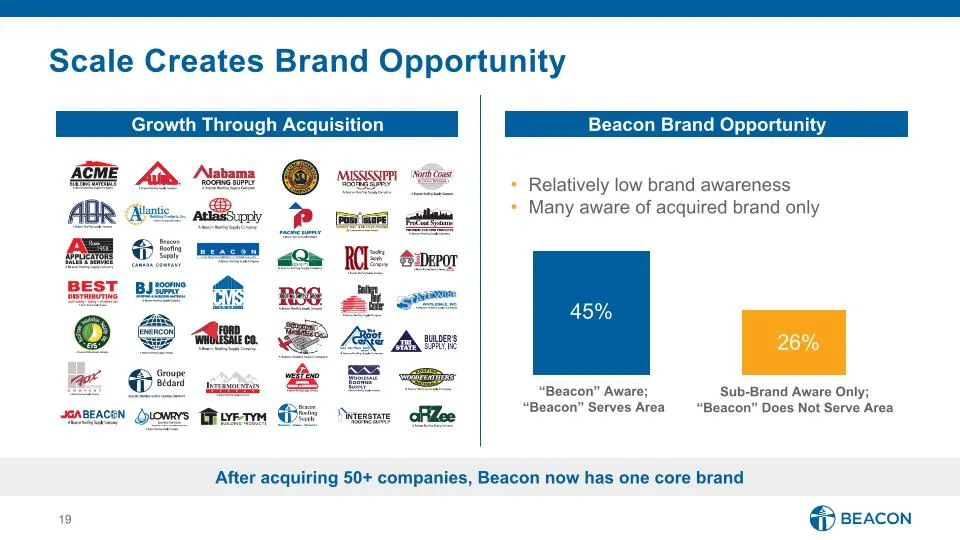
Slide 19: Scale Creates Brand Opportunity
Scale Creates Brand Opportunity Relatively low brand awareness Many aware of acquired brand only “Beacon” Aware; “Beacon” Serves Area Sub-Brand Aware Only; “Beacon” Does Not Serve Area 45% 26% Beacon Brand Opportunity Growth Through Acquisition After acquiring 50+ companies, Beacon now has one core
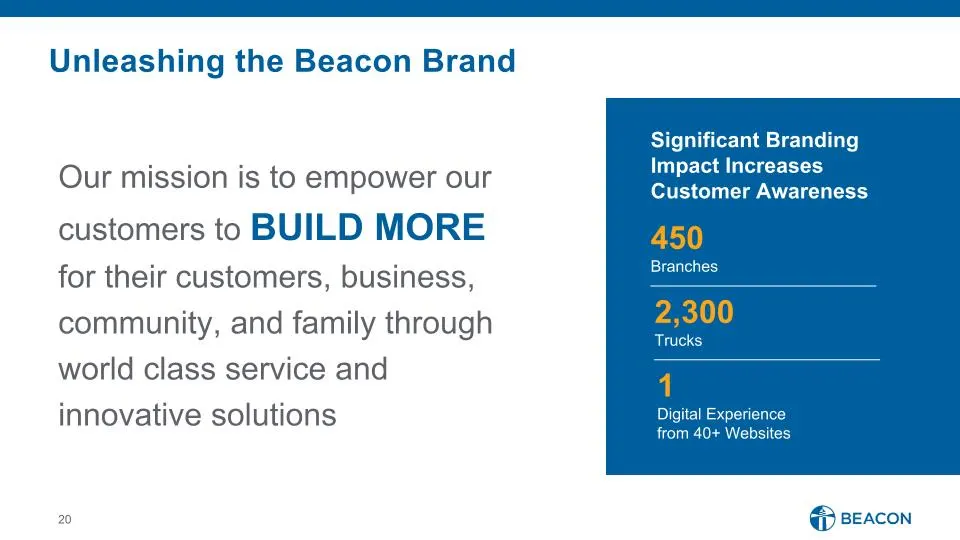
Slide 20: Unleashing the Beacon Brand
Unleashing the Beacon Brand 450 Branches 2,300 Trucks 1 Digital Experience from 40+ Websites Our mission is to empower our customers to BUILD MORE for their customers, business, community, and family through world class service and innovative solutions Significant Branding Impact Increases Customer
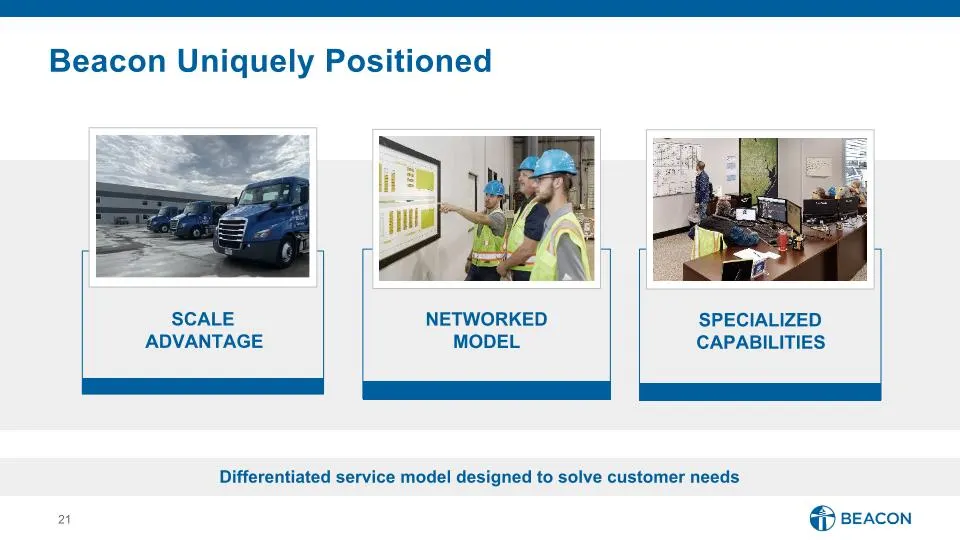
Slide 21: Beacon Uniquely Positioned
Beacon Uniquely Positioned SCALE ADVANTAGE SPECIALIZED CAPABILITIES NETWORKED MODEL Differentiated service model designed to solve customer needs
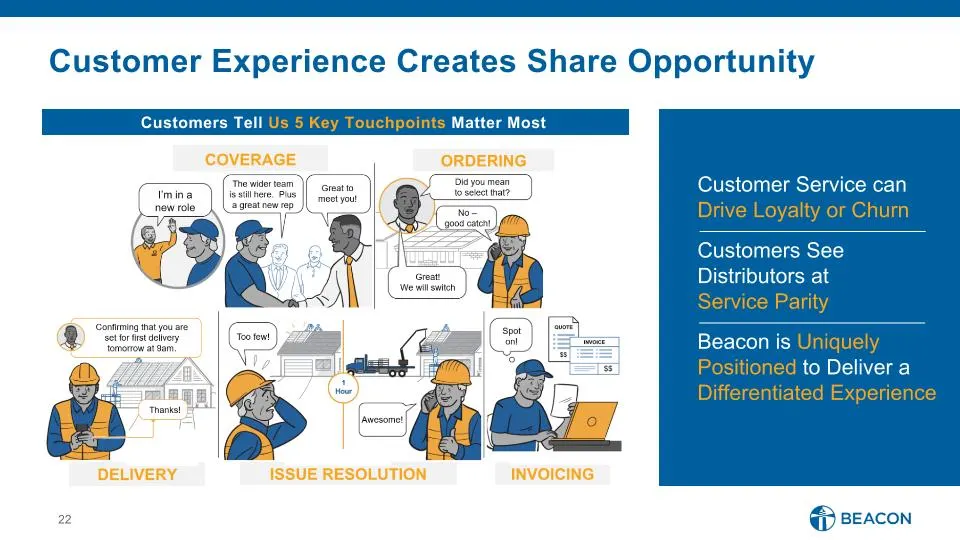
Slide 22: Customer Experience Creates Share Opportunity
COVERAGE ORDERING DELIVERY ISSUE RESOLUTION INVOICING I’m in a new role Customer Service can Drive Loyalty or Churn Customers See Distributors at Service Parity Beacon is Uniquely Positioned to Deliver a Differentiated Experience Customers Tell Us 5 Key Touchpoints Matter Most Customer Experience Cr
Slide 23: Beacon Service Model Solves for Customer Needs
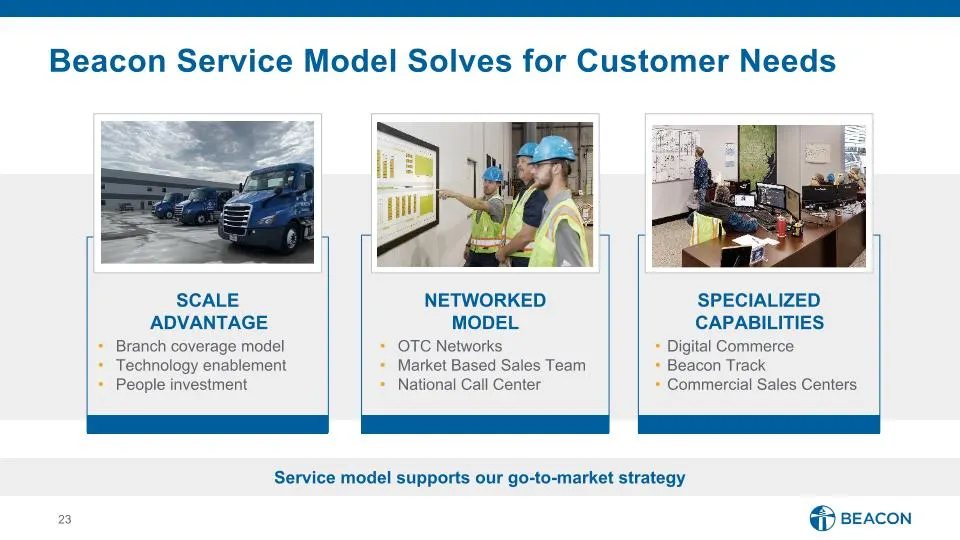
Beacon Service Model Solves for Customer Needs Service model supports our go-to-market strategy Branch coverage model Technology enablement People investment Digital Commerce Beacon Track Commercial Sales Centers OTC Networks Market Based Sales Team National Call Center SCALE ADVANTAGE SPECIALIZED C
Slide 24: Ambition 2025 – Sales Growth and Margin Drivers
MARGIN ENHANCING INITIATIVES ENHANCED CUSTOMER EXPERIENCE GO TO MARKET STRATEGY FOOTPRINT EXPANSION Ambition 2025 – Sales Growth and Margin Drivers GROW FASTER THAN THE MARKET
Slide 25: Opportunity to Accelerate Commercial Roofing Sales
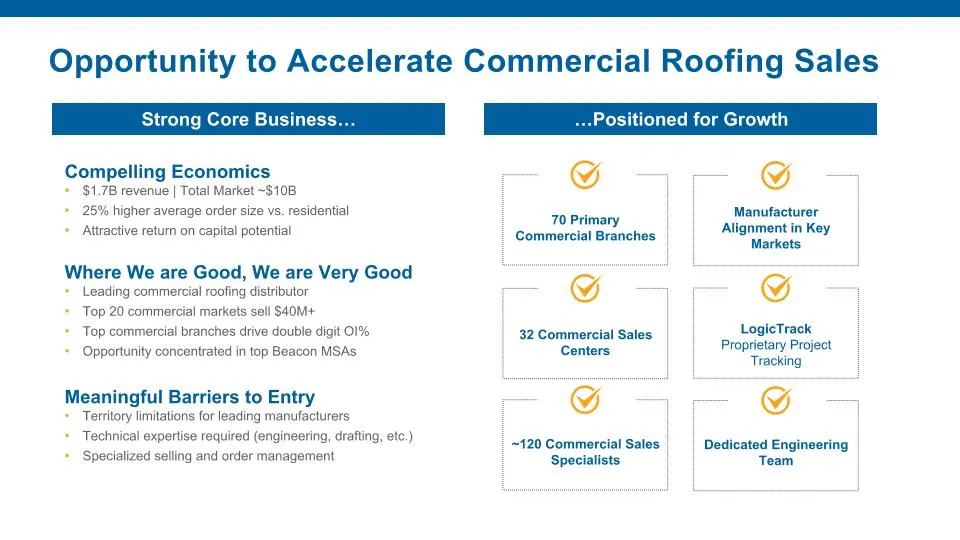
Opportunity to Accelerate Commercial Roofing Sales 70 Primary Commercial Branches LogicTrack Proprietary Project Tracking ~120 Commercial Sales Specialists 32 Commercial Sales Centers Compelling Economics $1.7B revenue | Total Market ~$10B 25% higher average order size vs. residential Attractive ret
Slide 26: Commercial Roofing Strategic Growth Plan
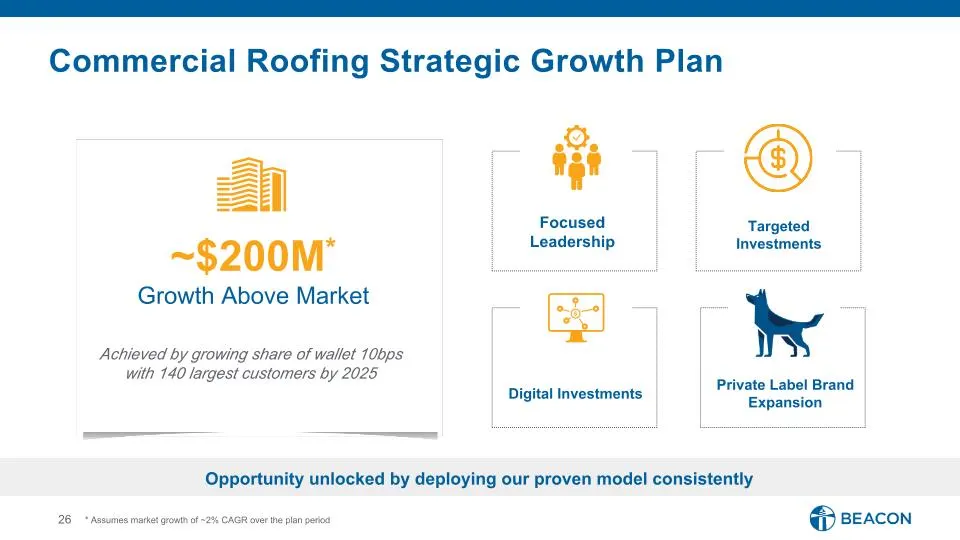
Commercial Roofing Strategic Growth Plan Focused Leadership Digital Investments Targeted Investments Private Label Brand Expansion ~$200M* Growth Above Market Opportunity unlocked by deploying our proven model consistently Achieved by growing share of wallet 10bps with 140 largest customers by 2025
Slide 27: Lead Generation
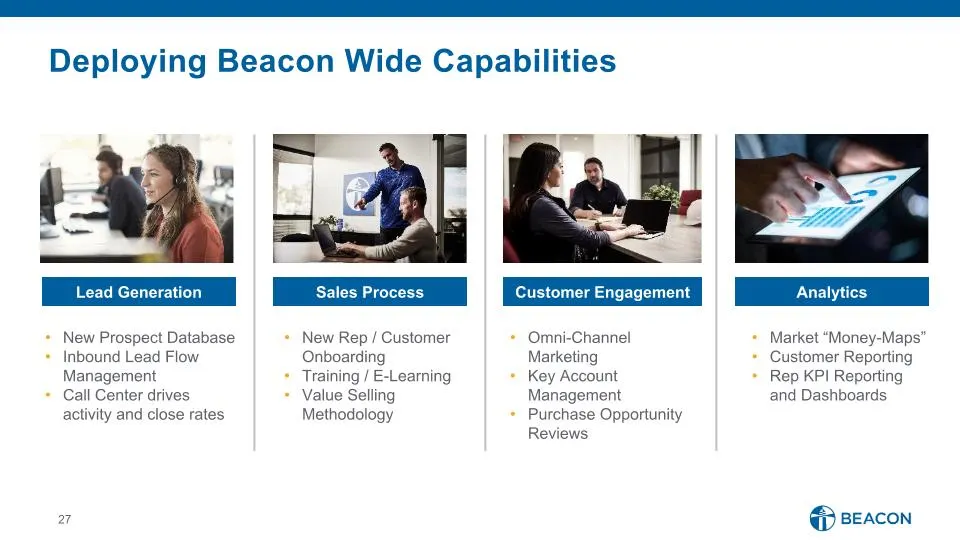
Lead Generation Deploying Beacon Wide Capabilities Market “Money-Maps” Customer Reporting Rep KPI Reporting and Dashboards New Rep / Customer Onboarding Training / E-Learning Value Selling Methodology Omni-Channel Marketing Key Account Management Purchase Opportunity Reviews New Prospect Database In
Slide 28: Outside Sales Rep (OSR) Investment
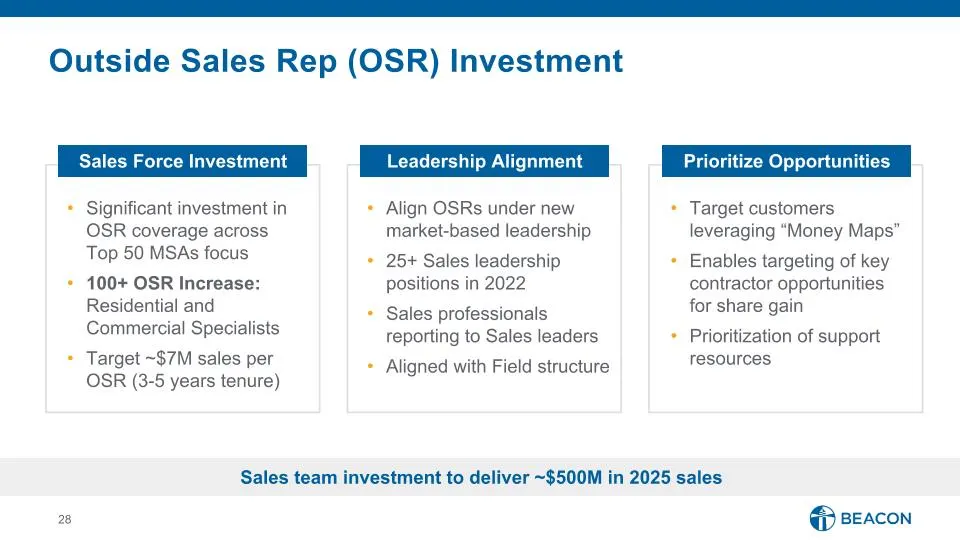
Outside Sales Rep (OSR) Investment Align OSRs under new market-based leadership 25+ Sales leadership positions in 2022 Sales professionals reporting to Sales leaders Aligned with Field structure Significant investment in OSR coverage across Top 50 MSAs focus 100+ OSR Increase: Residential and Commer
Slide 29: National Account Relationships Drive Growth
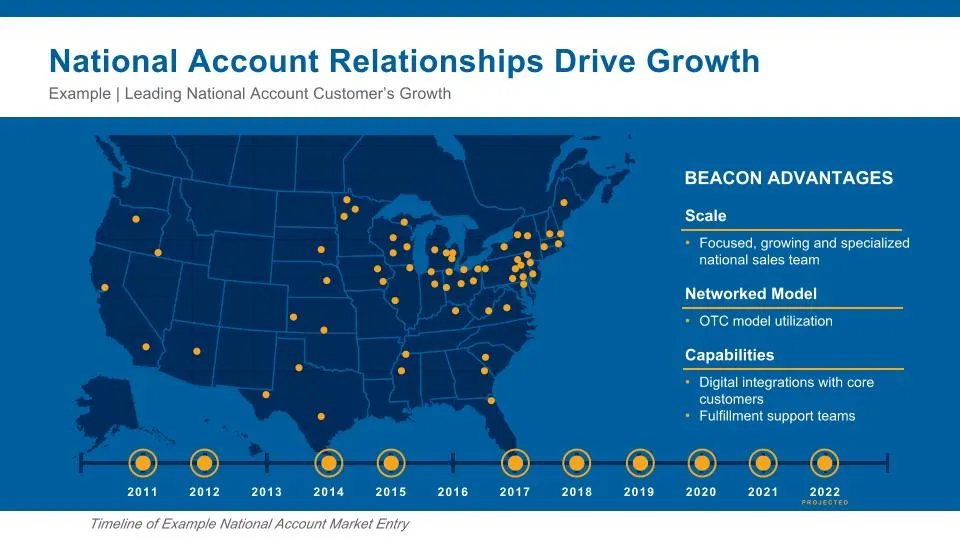
2012 2013 2014 2015 2016 2017 2018 2019 2020 2021 2022 PROJECTED 2011 Timeline of Example National Account Market Entry Example | Leading National Account Customer’s Growth National Account Relationships Drive Growth Scale Focused, growing and specialized national sales team Networked Model OTC mode
Slide 30: National Accounts | Path to $1B
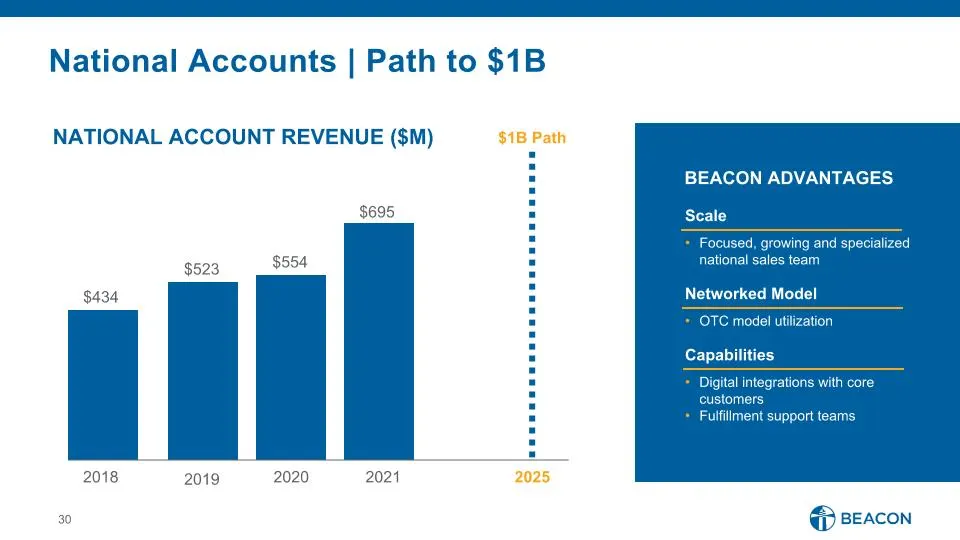
National Accounts | Path to $1B NATIONAL ACCOUNT REVENUE ($M) 2018 2019 2020 2021 $434 $523 $554 $695 $1B Path 2025 Scale Focused, growing and specialized national sales team Networked Model OTC model utilization Capabilities Digital integrations with core customers Fulfillment support teams BEACON
Slide 31: Ambition 2025 – Sales Growth and Margin Drivers
MARGIN ENHANCING INITIATIVES ENHANCED CUSTOMER EXPERIENCE GO TO MARKET STRATEGY FOOTPRINT EXPANSION Ambition 2025 – Sales Growth and Margin Drivers GROW FASTER THAN THE MARKET
Slide 32: Greenfields to Deliver ~$200M Sales Growth
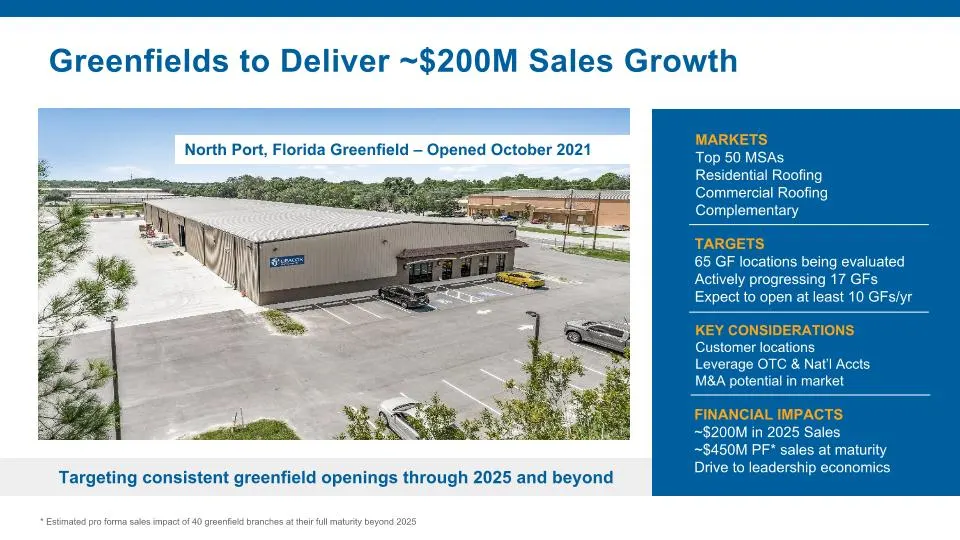
Greenfields to Deliver ~$200M Sales Growth North Port, Florida Greenfield – Opened October 2021 Targeting consistent greenfield openings through 2025 and beyond * Estimated pro forma sales impact of 40 greenfield branches at their full maturity beyond 2025 MARKETS Top 50 MSAs Residential Roofing Com
Slide 33: Accelerating the Path to Sales Maturity
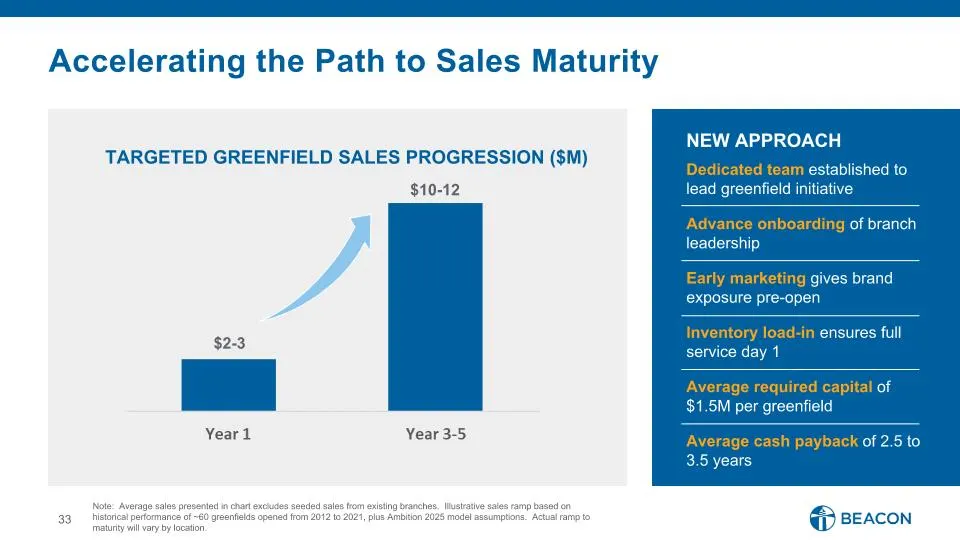
Accelerating the Path to Sales Maturity TARGETED GREENFIELD SALES PROGRESSION ($M) $2-3 $10-12 Note: Average sales presented in chart excludes seeded sales from existing branches. Illustrative sales ramp based on historical performance of ~60 greenfields opened from 2012 to 2021, plus Ambition 2025
Slide 34: San Marcos, Texas Greenfield
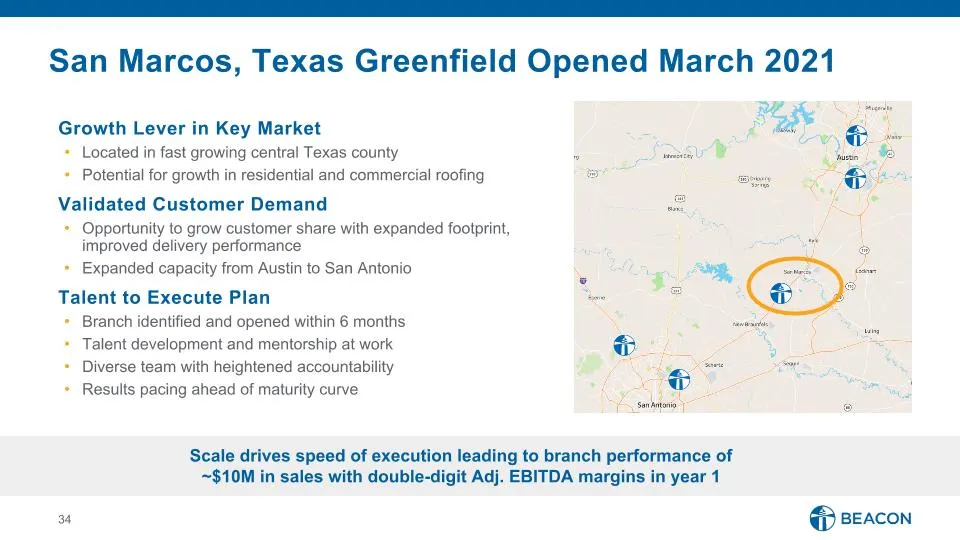
San Marcos, Texas Greenfield Opened March 2021 Growth Lever in Key Market Located in fast growing central Texas county Potential for growth in residential and commercial roofing Validated Customer Demand Opportunity to grow customer share with expanded footprint, improved delivery performance Expand
Slide 35: Significant Opportunity to Drive Accretive M&A
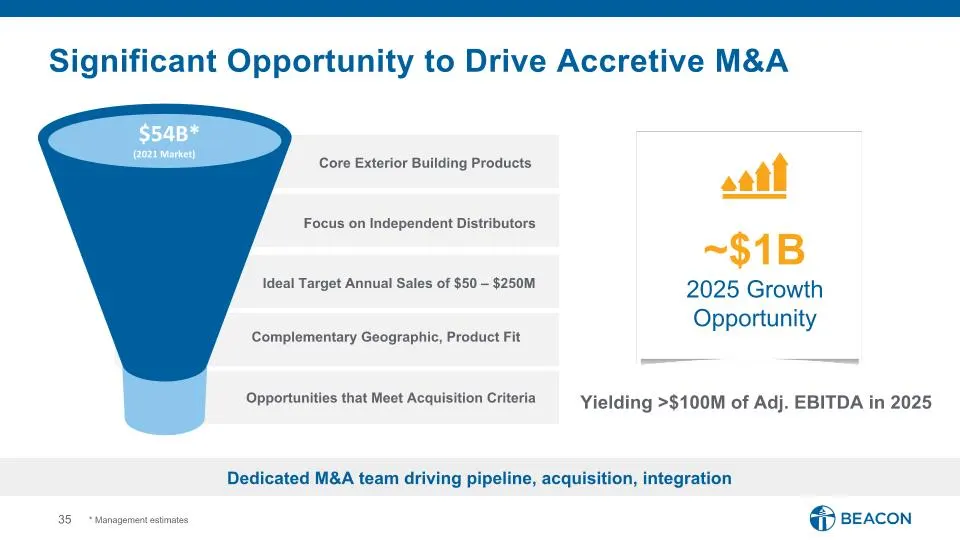
Significant Opportunity to Drive Accretive M&A ~$1B 2025 Growth Opportunity Yielding >$100M of Adj. EBITDA in 2025 $54B* (2021 Market) Core Exterior Building Products Focus on Independent Distributors Ideal Target Annual Sales of $50 – $250M Complementary Geographic, Product Fit Opportunities that M
Slide 36: The Beacon Advantage Drives M&A Synergies
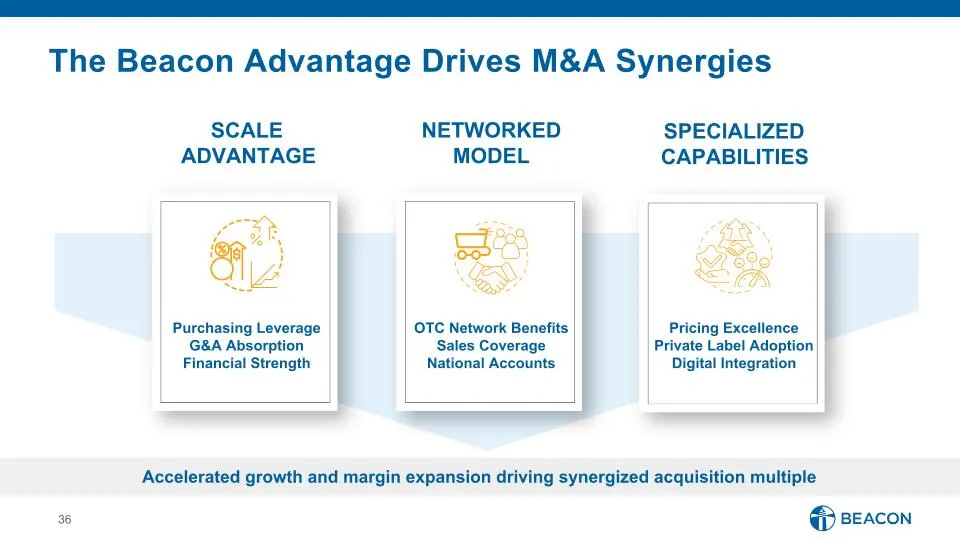
The Beacon Advantage Drives M&A Synergies Accelerated growth and margin expansion driving synergized acquisition multiple SPECIALIZED CAPABILITIES SCALE ADVANTAGE NETWORKED MODEL Purchasing Leverage G&A Absorption Financial Strength OTC Network Benefits Sales Coverage National Accounts Pricing Excel
Slide 37: Successful Midway Transaction
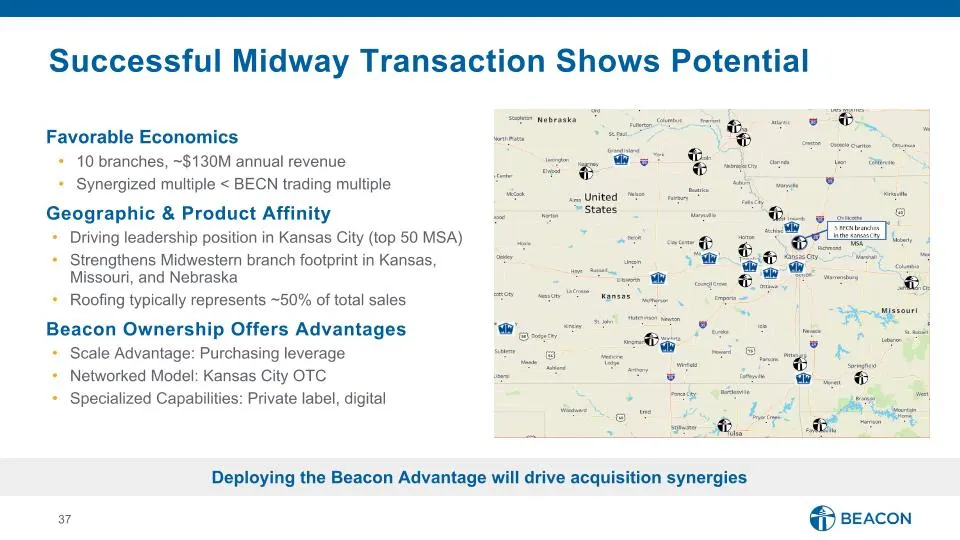
Successful Midway Transaction Shows Potential Favorable Economics 10 branches, ~$130M annual revenue Synergized multiple < BECN trading multiple Geographic & Product Affinity Driving leadership position in Kansas City (top 50 MSA) Strengthens Midwestern branch footprint in Kansas, Missouri, and Nebr
Slide 38: Ambition 2025 – Sales Growth and Margin Drivers
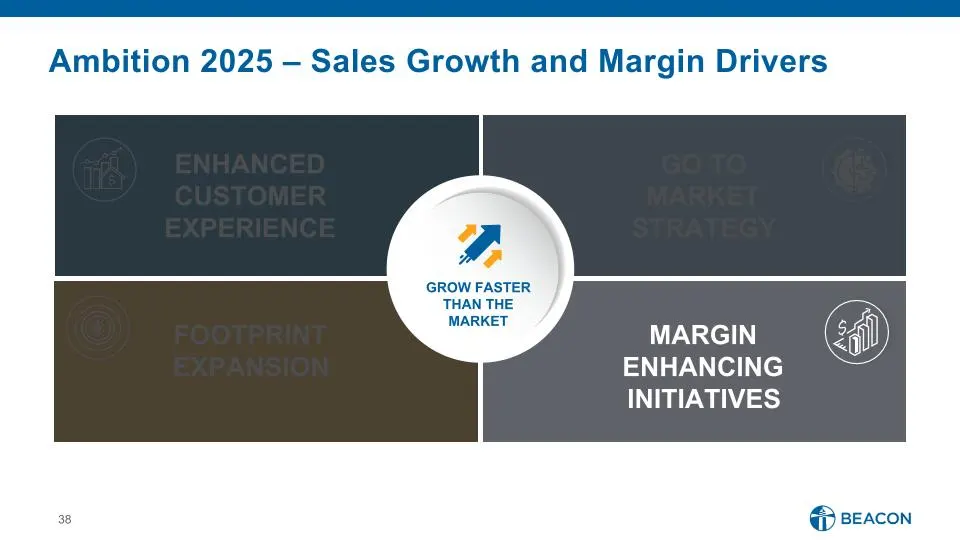
MARGIN ENHANCING INITIATIVES ENHANCED CUSTOMER EXPERIENCE GO TO MARKET STRATEGY FOOTPRINT EXPANSION Ambition 2025 – Sales Growth and Margin Drivers GROW FASTER THAN THE MARKET
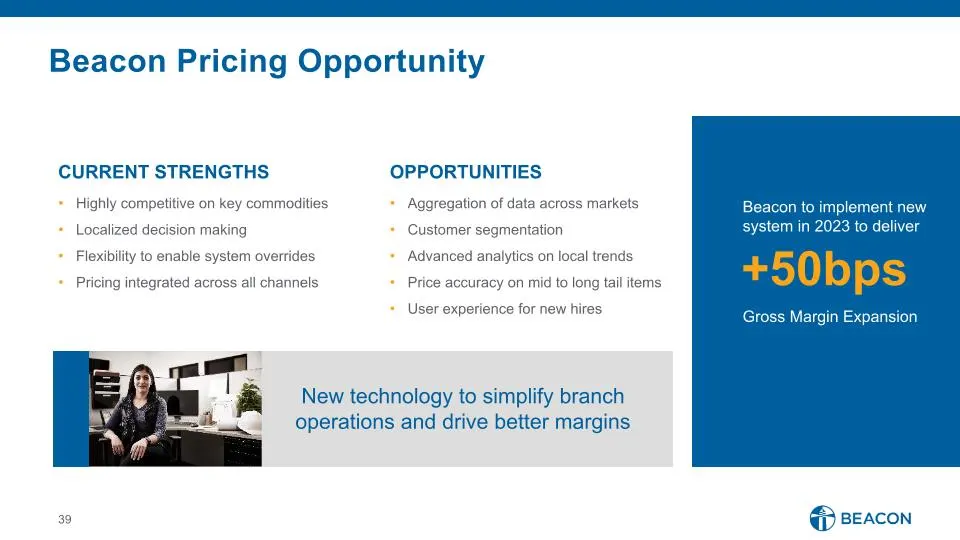
Slide 39: Beacon Pricing Opportunity
Beacon Pricing Opportunity OPPORTUNITIES Aggregation of data across markets Customer segmentation Advanced analytics on local trends Price accuracy on mid to long tail items User experience for new hires Beacon to implement new system in 2023 to deliver +50bps Gross Margin Expansion CURRENT STRENGTH
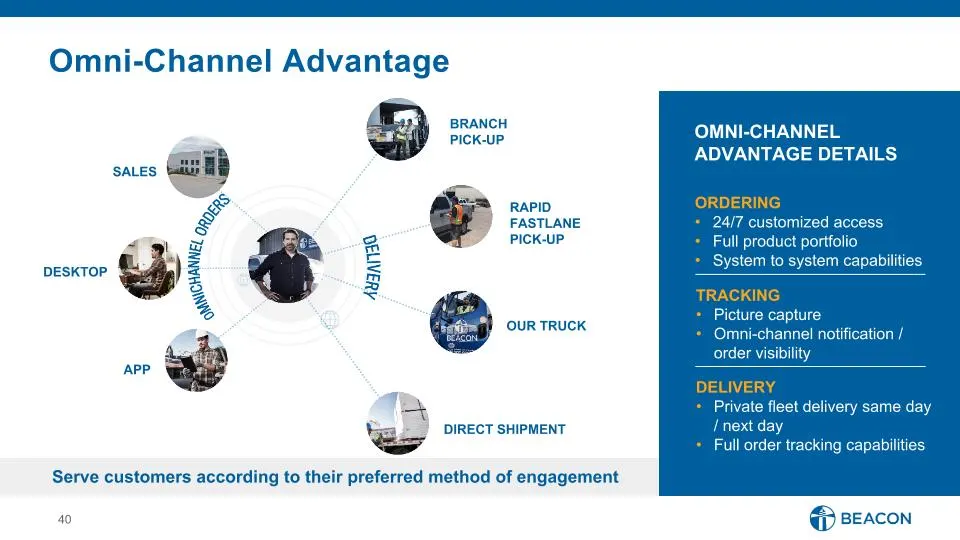
Slide 40: Omni-Channel Advantage
Omni-Channel Advantage ORDERING 24/7 customized access Full product portfolio System to system capabilities TRACKING Picture capture Omni-channel notification / order visibility DELIVERY Private fleet delivery same day / next day Full order tracking capabilities Serve customers according to their pr
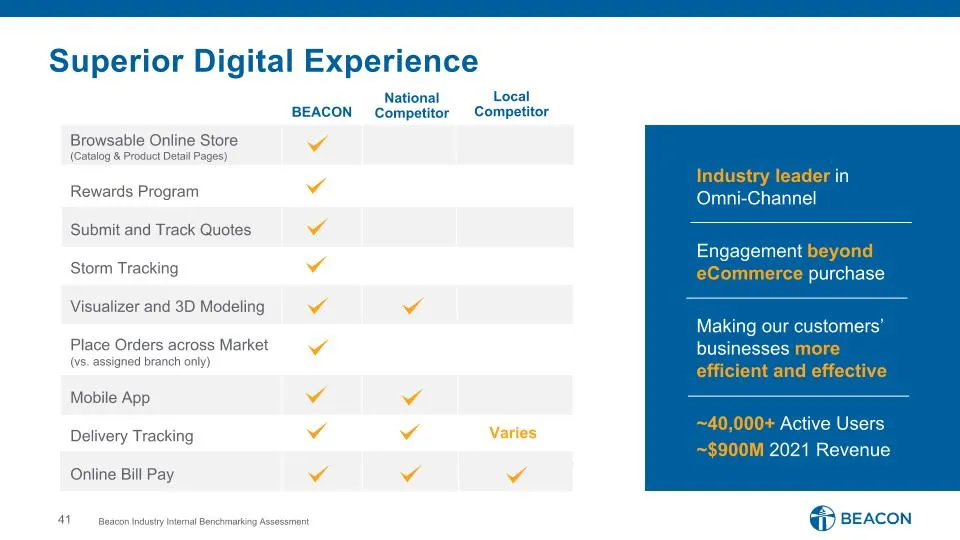
Slide 41: Superior Digital Experience
Superior Digital Experience Industry leader in Omni-Channel Engagement beyond eCommerce purchase Making our customers’ businesses more efficient and effective ~40,000+ Active Users ~$900M 2021 Revenue Browsable Online Store (Catalog & Product Detail Pages) Rewards Program Submit and Track Quotes Sto
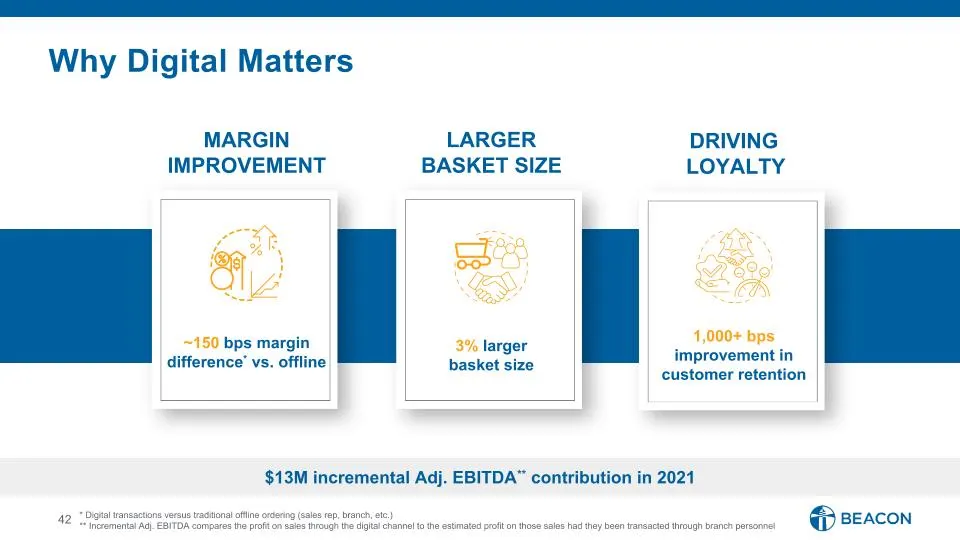
Slide 42: Why Digital Matters
Why Digital Matters DRIVING LOYALTY MARGIN IMPROVEMENT LARGER BASKET SIZE 1,000+ bps improvement in customer retention ~150 bps margin difference* vs. offline 3% larger basket size $13M incremental Adj. EBITDA** contribution in 2021 * Digital transactions versus traditional offline ordering (sales r
Slide 43: Innovation & Integrations Drive Growth
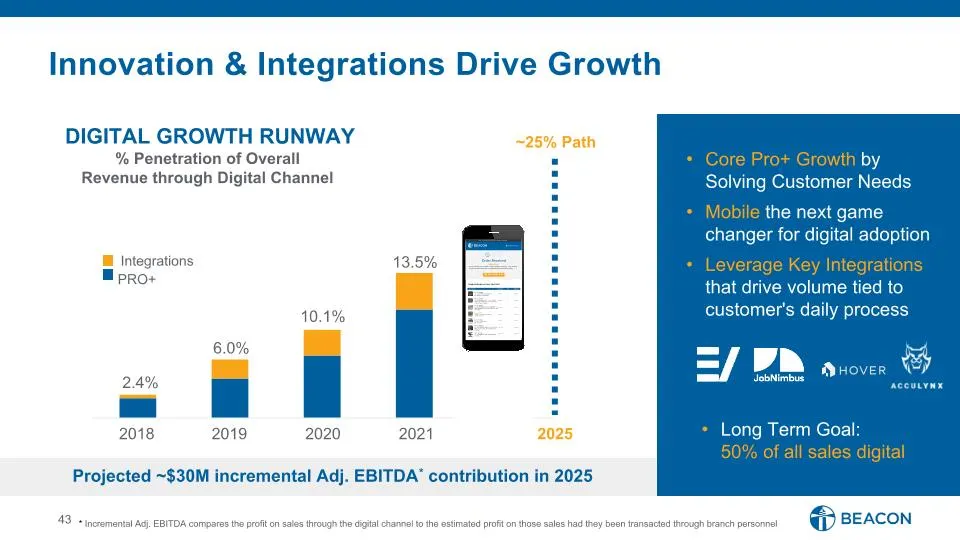
Innovation & Integrations Drive Growth Core Pro+ Growth by Solving Customer Needs Mobile the next game changer for digital adoption Leverage Key Integrations that drive volume tied to customer's daily process Long Term Goal: 50% of all sales digital Projected ~$30M incremental Adj. EBITDA* contribut
Slide 44: Mobile Experience
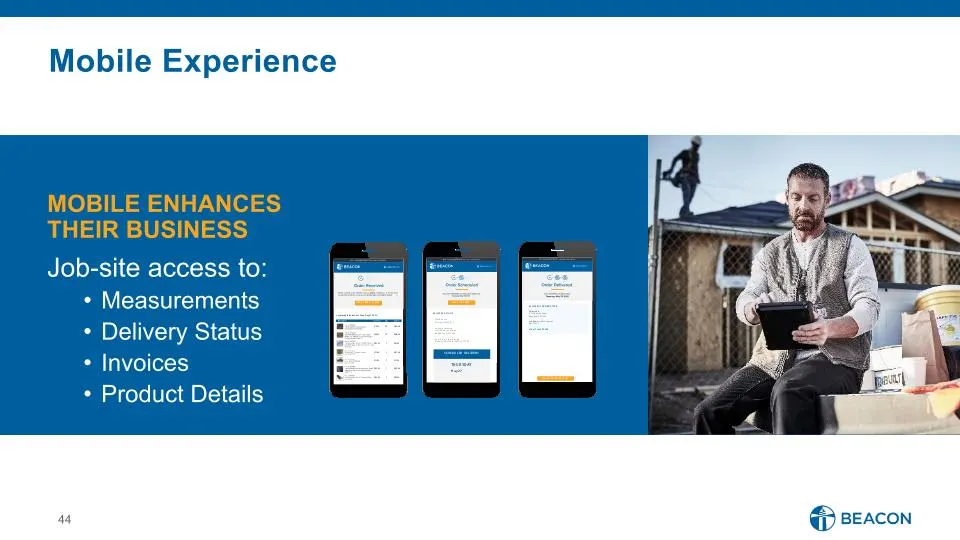
Mobile Experience MOBILE ENHANCES THEIR BUSINESS Job-site access to: Measurements Delivery Status Invoices Product Details
Slide 45: Building a Brand
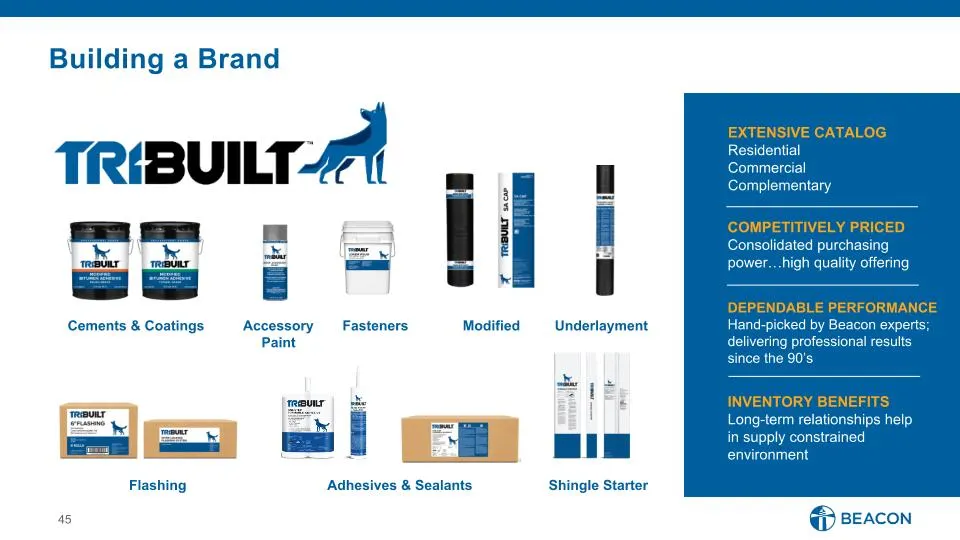
Building a Brand EXTENSIVE CATALOG Residential Commercial Complementary INVENTORY BENEFITS Long-term relationships help in supply constrained environment DEPENDABLE PERFORMANCE Hand-picked by Beacon experts; delivering professional results since the 90’s COMPETITIVELY PRICED Consolidated purchasing
Slide 46: TRI-BUILT Growth Plan
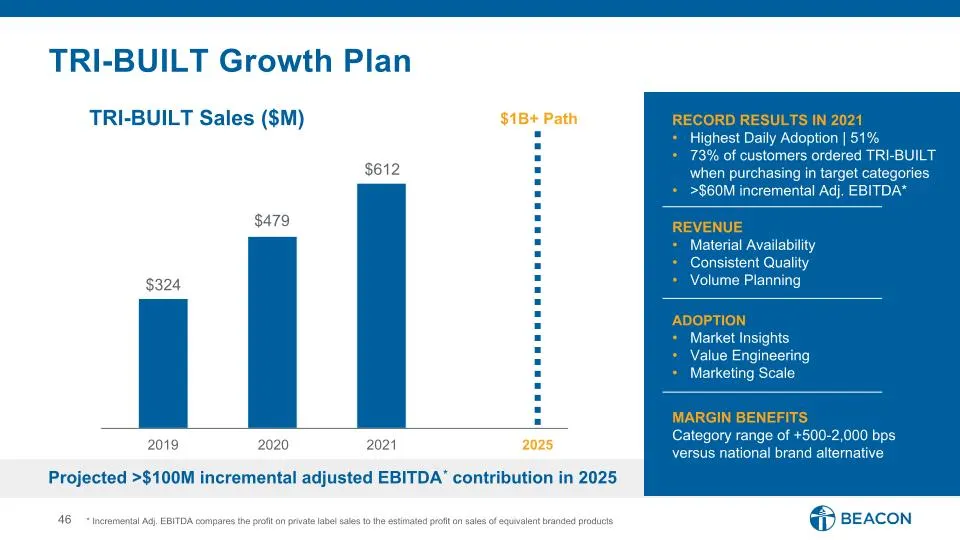
Projected >$100M incremental adjusted EBITDA* contribution in 2025 $324 $479 $612 $1B+ Path TRI-BUILT Sales ($M) 2019 2020 2021 2025 * Incremental Adj. EBITDA compares the profit on private label sales to the estimated profit on sales of equivalent branded products TRI-BUILT Growth Plan RECORD RESUL
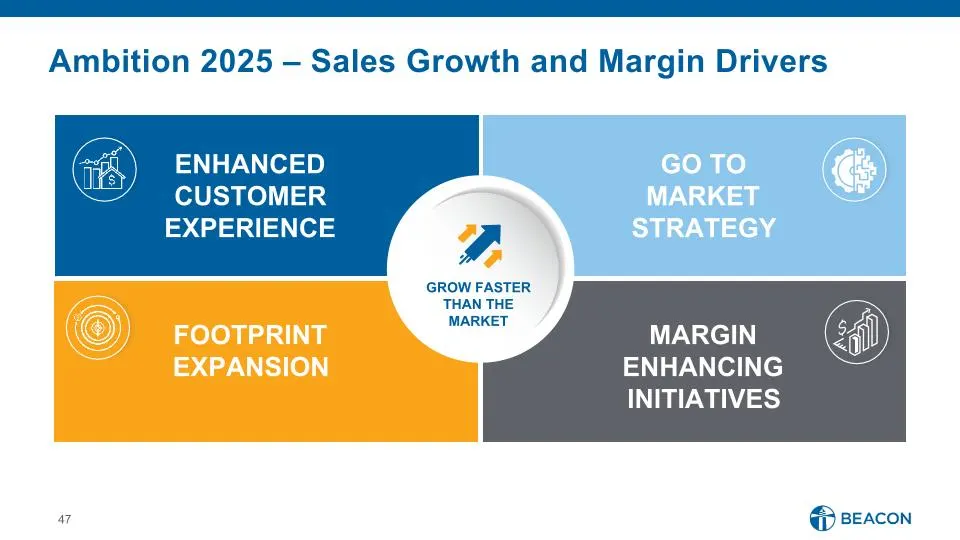
Slide 47: Ambition 2025 – Sales Growth and Margin Drivers
MARGIN ENHANCING INITIATIVES ENHANCED CUSTOMER EXPERIENCE GO TO MARKET STRATEGY FOOTPRINT EXPANSION Ambition 2025 – Sales Growth and Margin Drivers GROW FASTER THAN THE MARKET
Slide 48: Productivity & Capacity Via Operational Excellence
Munroe Best, President, South Division Productivity & Capacity Via Operational Excellence
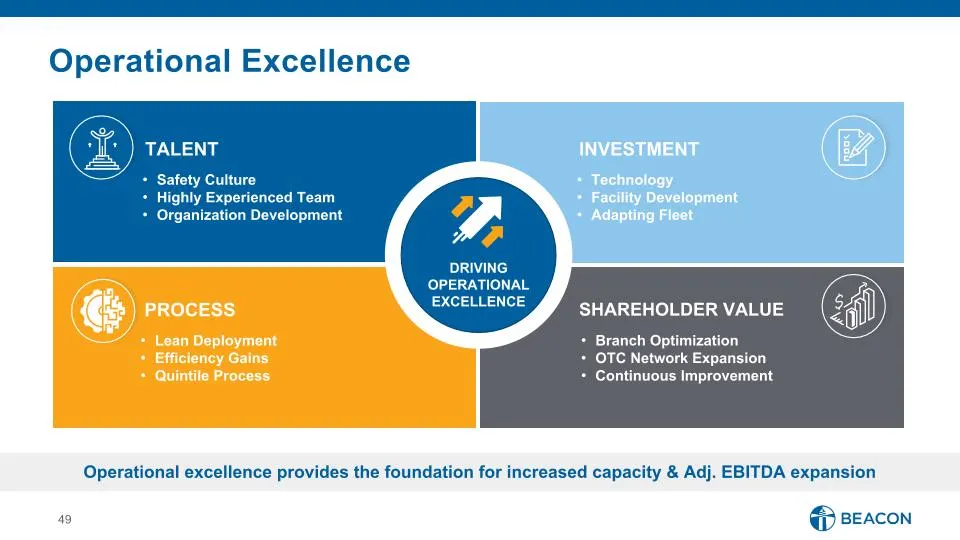
Slide 49: Operational Excellence
INVESTMENT TALENT Safety Culture Highly Experienced Team Organization Development Process Shareholder Value Operational excellence provides the foundation for increased capacity & Adj. EBITDA expansion DRIVING OPERATIONAL EXCELLENCE Lean Deployment Efficiency Gains Quintile Process Technology Facili
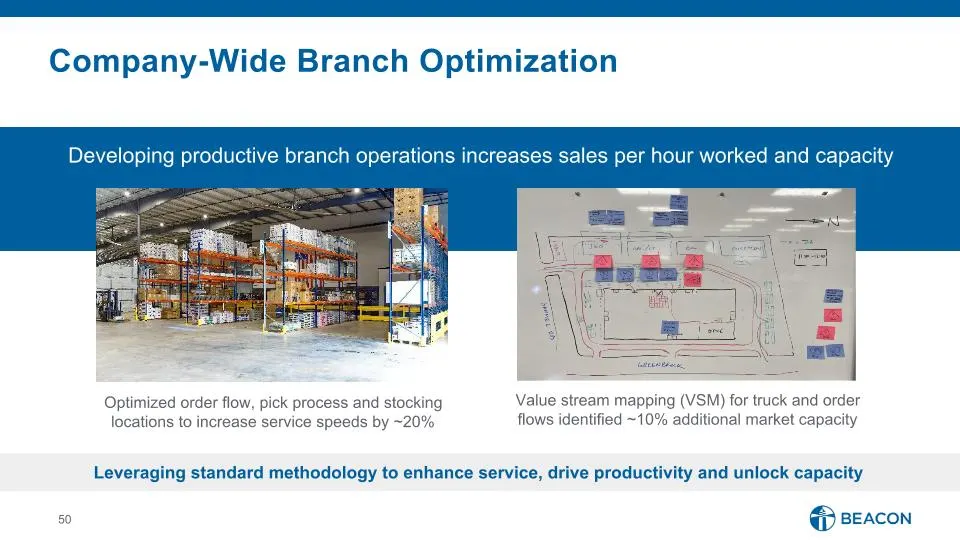
Slide 50: Company-Wide Branch Optimization
Company-Wide Branch Optimization Value stream mapping (VSM) for truck and order flows identified ~10% additional market capacity Optimized order flow, pick process and stocking locations to increase service speeds by ~20% Leveraging standard methodology to enhance service, drive productivity and unl
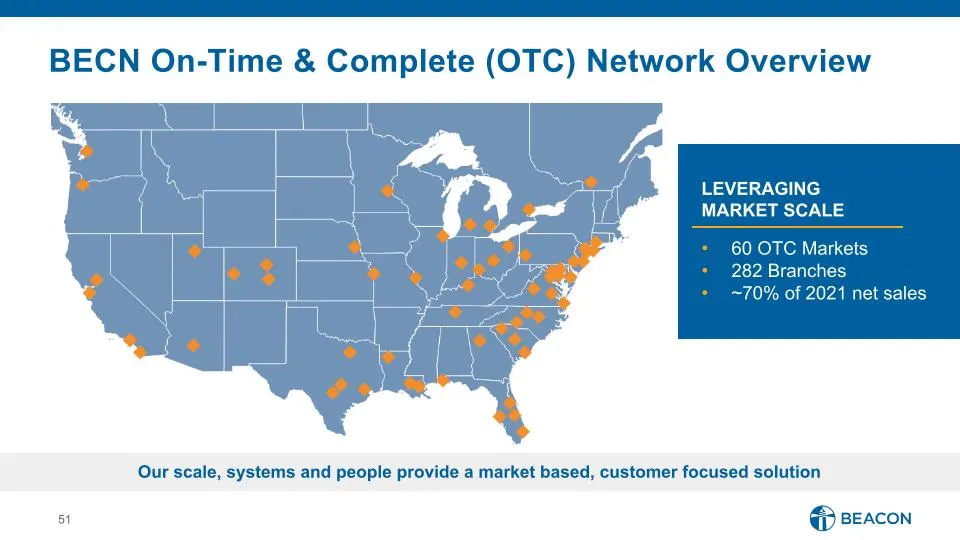
Slide 51: On-Time & Complete (OTC) Network Overview
Our scale, systems and people provide a market based, customer focused solution LEVERAGING MARKET SCALE 60 OTC Markets 282 Branches ~70% of 2021 net sales BECN On-Time & Complete (OTC) Network Overview
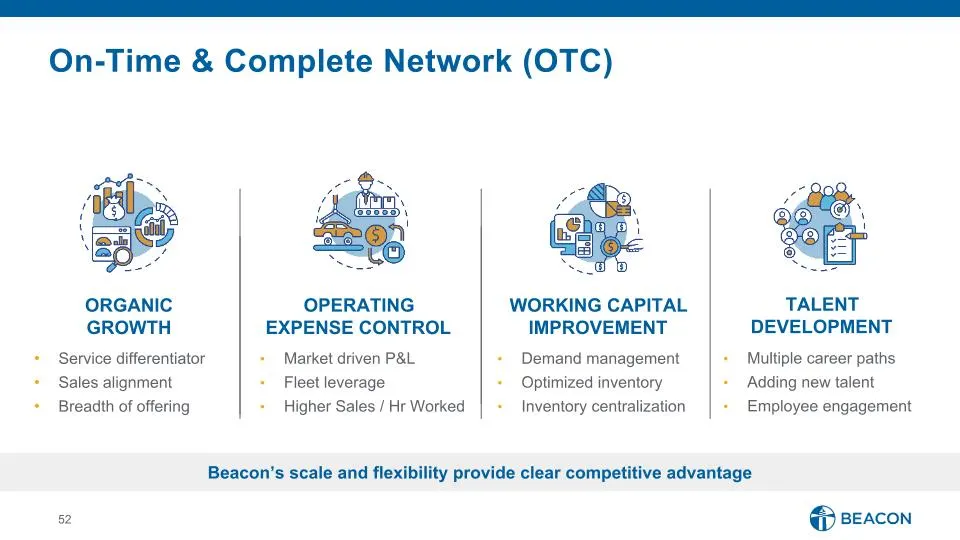
Slide 52: On-Time & Complete Network
Service differentiator Sales alignment Breadth of offering Market driven P&L Fleet leverage Higher Sales / Hr Worked Demand management Optimized inventory Inventory centralization Multiple career paths Adding new talent Employee engagement ORGANIC GROWTH OPERATING EXPENSE CONTROL WORKING CAPITAL IMP
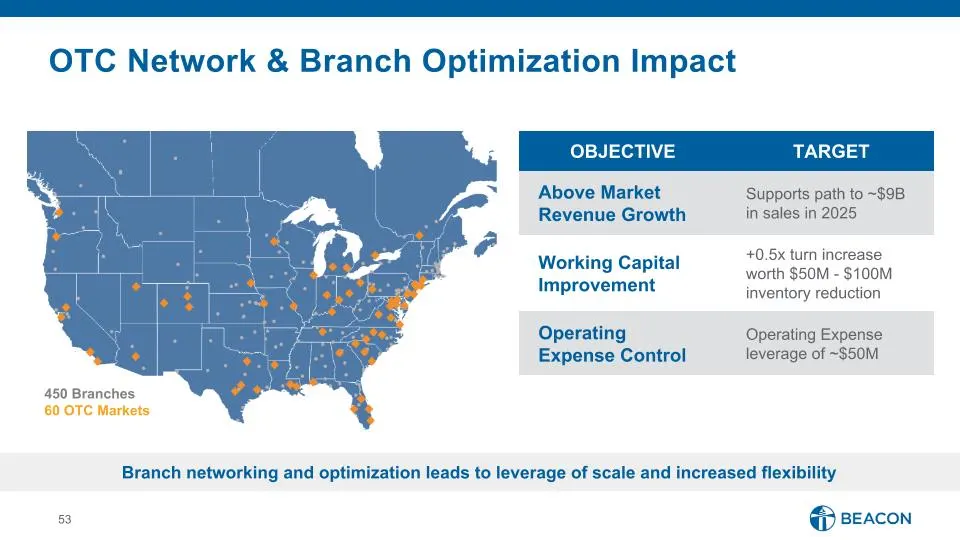
Slide 53: OTC Network & Branch Optimization Impact
OTC Network & Branch Optimization Impact Branch networking and optimization leads to leverage of scale and increased flexibility OBJECTIVE TARGET Above Market Revenue Growth Supports path to ~$9B in sales in 2025 Working Capital Improvement +0.5x turn increase worth $50M - $100M inventory reduction
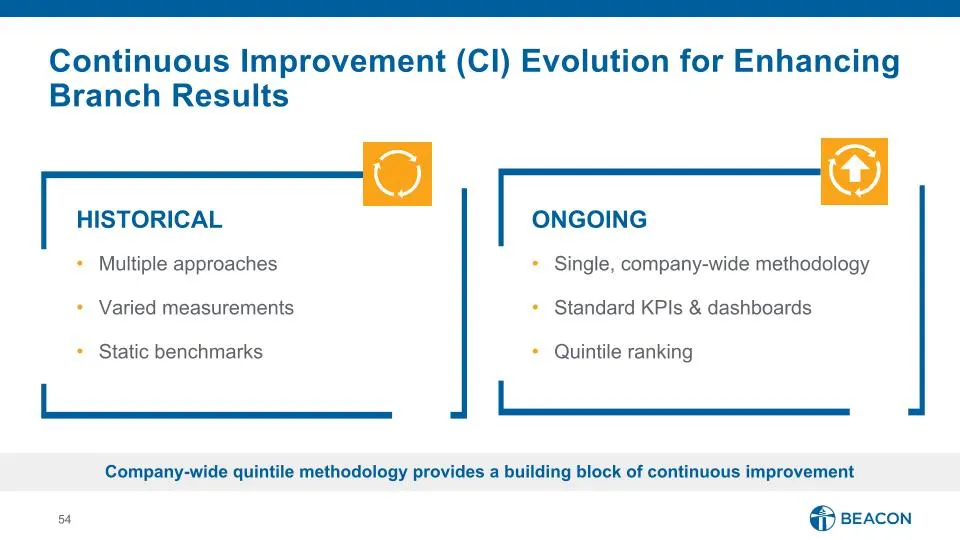
Slide 54: Continuous Improvement Evolution
Continuous Improvement (CI) Evolution for Enhancing Branch Results HISTORICAL Multiple approaches Varied measurements Static benchmarks ONGOING Single, company-wide methodology Standard KPIs & dashboards Quintile ranking Company-wide quintile methodology provides a building block of continuous impro
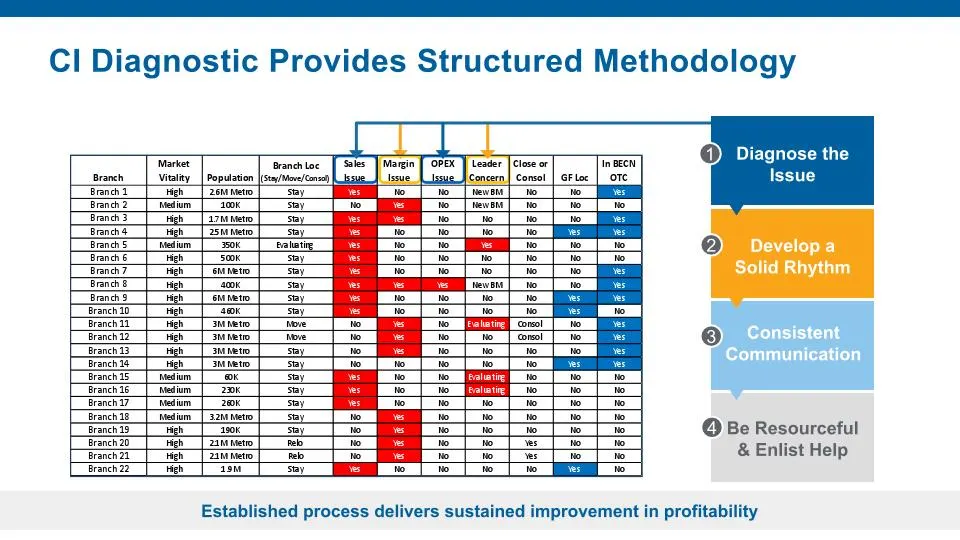
Slide 55: CI Diagnostic Provides Structured Methodology
2 3 4 Consistent Communication Develop a Solid Rhythm Be Resourceful & Enlist Help Established process delivers sustained improvement in profitability Diagnose the Issue 1 CI Diagnostic Provides Structured Methodology
Slide 56: Bottom Quintile Success Stories
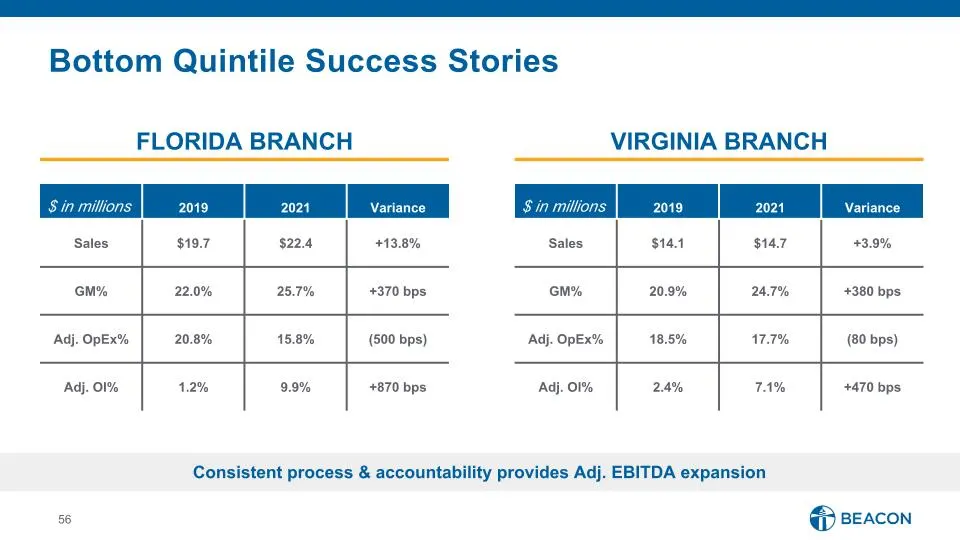
Bottom Quintile Success Stories FLORIDA BRANCH $ in millions 2019 2021 Variance Sales $19.7 $22.4 +13.8% GM% 22.0% 25.7% +370 bps Adj. OpEx% 20.8% 15.8% (500 bps) Adj. OI% 1.2% 9.9% +870 bps $ in millions 2019 2021 Variance Sales $14.1 $14.7 +3.9% GM% 20.9% 24.7% +380 bps Adj. OpEx% 18.5% 17.7% (80
Slide 57: Continuing Value from Quintile Process
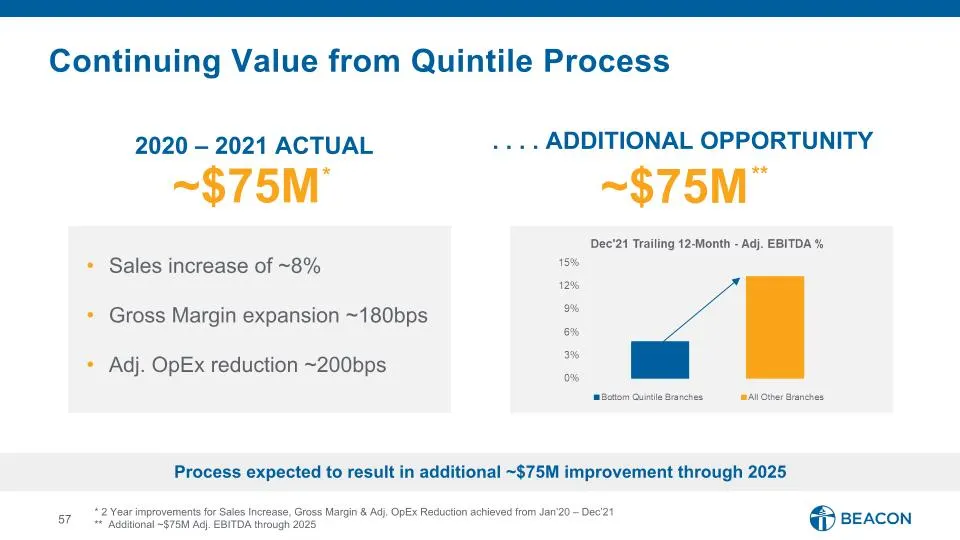
Sales increase of ~8% Gross Margin expansion ~180bps Adj. OpEx reduction ~200bps ~$75M ~$75M Process expected to result in additional ~$75M improvement through 2025 2020 – 2021 ACTUAL . . . . ADDITIONAL OPPORTUNITY * 2 Year improvements for Sales Increase, Gross Margin & Adj. OpEx Reduction achieved
Slide 58: Creating Shareholder Value
Frank Lonegro, Chief Financial Officer Creating Shareholder Value
Slide 59: Strong Investment Thesis
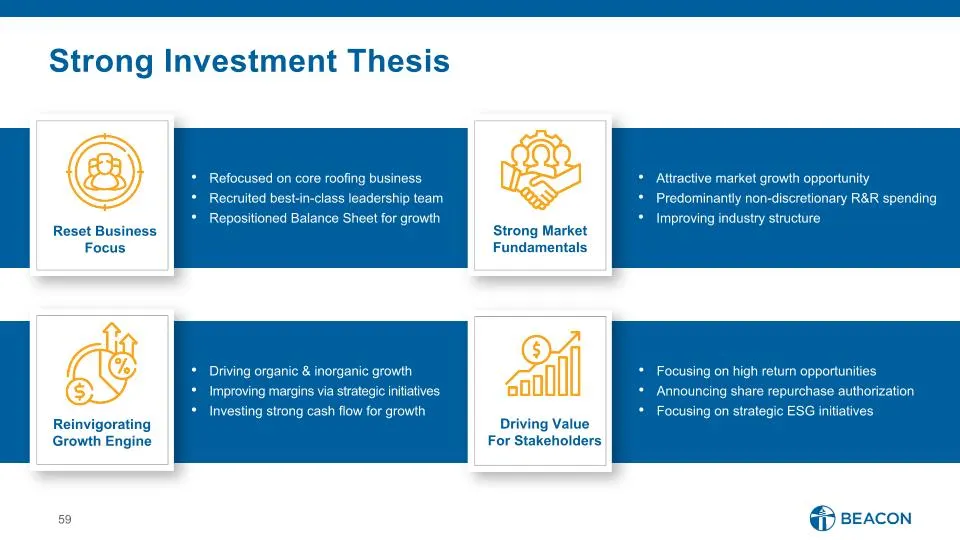
Strong Investment Thesis Refocused on core roofing business Recruited best-in-class leadership team Repositioned Balance Sheet for growth Attractive market growth opportunity Predominantly non-discretionary R&R spending Improving industry structure Driving organic & inorganic growth Improving margin
Slide 60: Transformed Financial Performance Since 2019
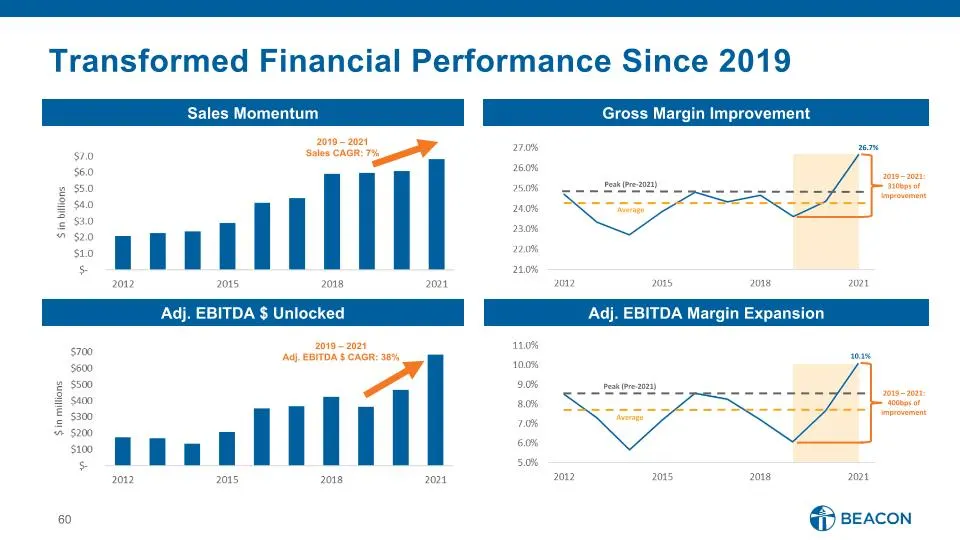
Transformed Financial Performance Since 2019 Sales Momentum Gross Margin Improvement Adj. EBITDA $ Unlocked Adj. EBITDA Margin Expansion Average Peak (Pre-2021) Average Peak (Pre-2021) 2019 – 2021: 310bps of improvement 2019 – 2021: 400bps of improvement 26.7% 10.1% 2019 – 2021 Adj. EBITDA $ CAGR: 3
Slide 61: Strengthened Financial Flexibility
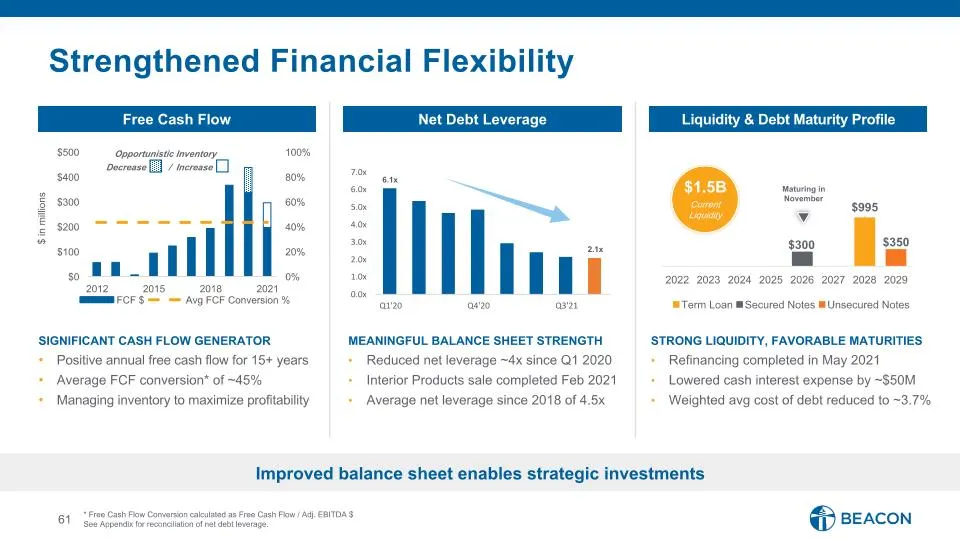
6.1x 2.1x 0.0x 1.0x 2.0x 3.0x 4.0x 5.0x 6.0x 7.0x Q1'20 Q4'20 Q3'21 Net Debt Leverage Free Cash Flow SIGNIFICANT CASH FLOW GENERATOR Positive annual free cash flow for 15+ years Average FCF conversion* of ~45% Managing inventory to maximize profitability Strengthened Financial Flexibility STRONG LIQ
Slide 62: Ambition 2025 Financial Targets
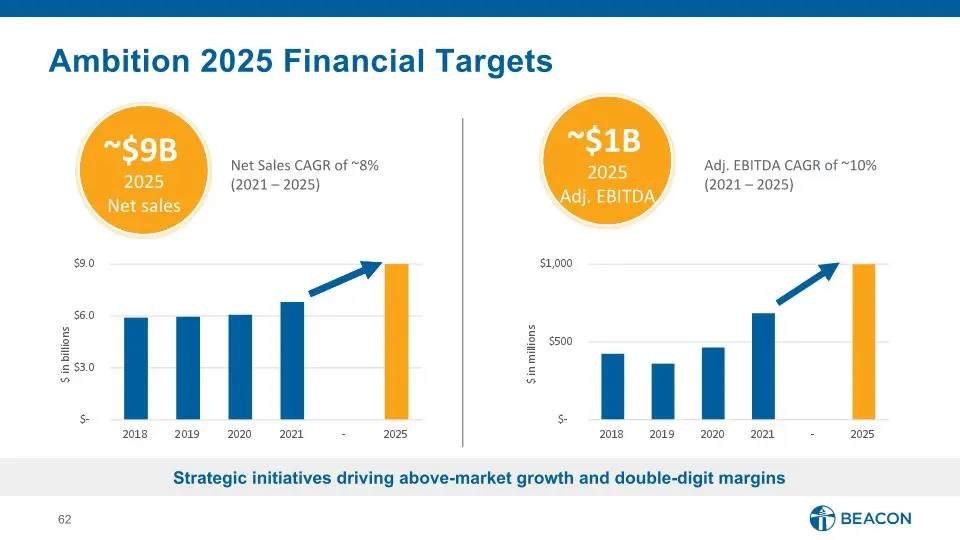
Ambition 2025 Financial Targets Net Sales CAGR of ~8% (2021 – 2025) ~$9B 2025 Net sales ~$1B 2025 Adj. EBITDA Adj. EBITDA CAGR of ~10% (2021 – 2025) Strategic initiatives driving above-market growth and double-digit margins
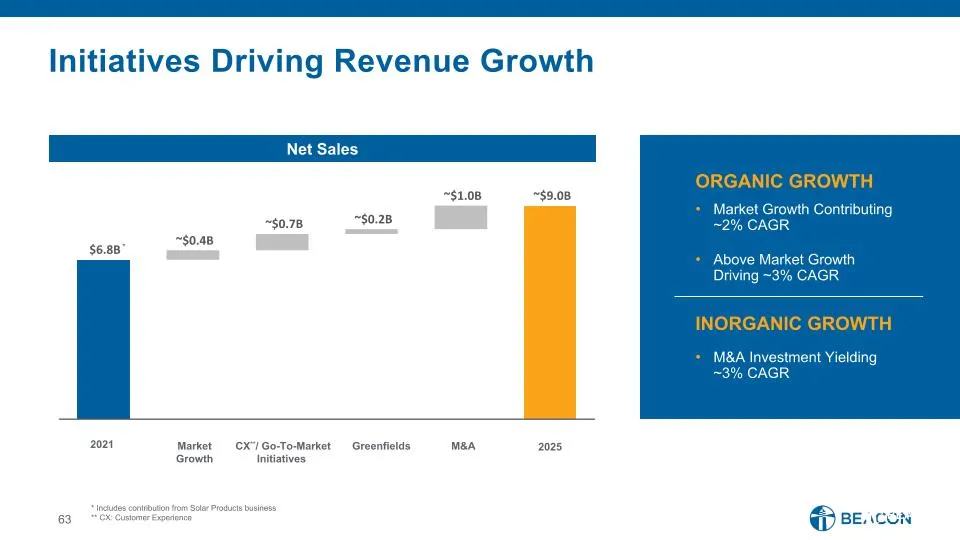
Slide 63: Initiatives Driving Revenue Growth
$6.8B ~$0.4B ~$0.7B ~$0.2B ~$1.0B ~$9.0B Initiatives Driving Revenue Growth Market Growth Contributing ~2% CAGR Above Market Growth Driving ~3% CAGR M&A Investment Yielding ~3% CAGR * Includes contribution from Solar Products business ** CX: Customer Experience 2021 Market Growth CX**/ Go-To-Market
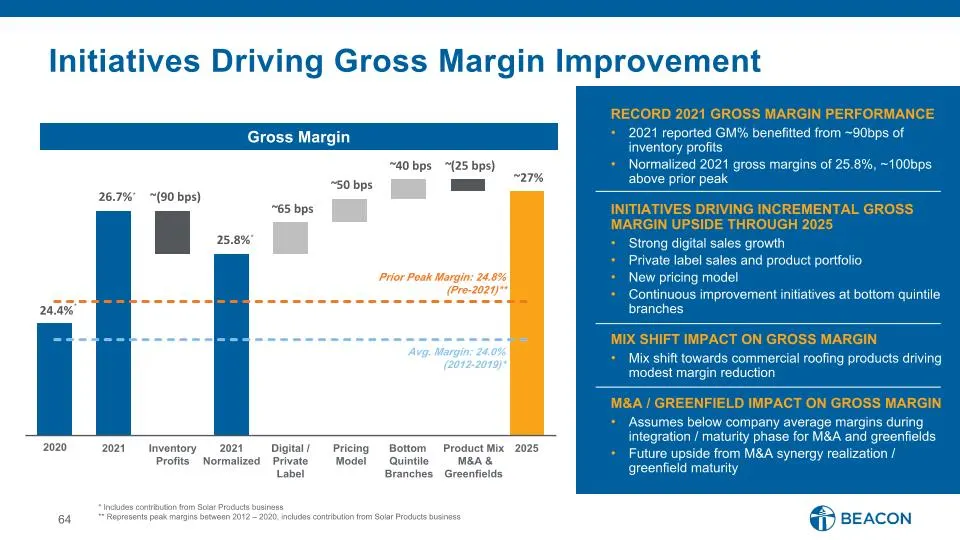
Slide 64: Initiatives Driving Gross Margin Improvement
24.4% 26.7% ~(90 bps) 25.8% ~ 65 bps ~ 50 bps ~ 40 bps ~ (25 bps) ~27% Initiatives Driving Gross Margin Improvement RECORD 2021 GROSS MARGIN PERFORMANCE 2021 reported GM% benefitted from ~90bps of inventory profits Normalized 2021 gross margins of 25.8%, ~100bps above prior peak INITIATIVES DRIVING
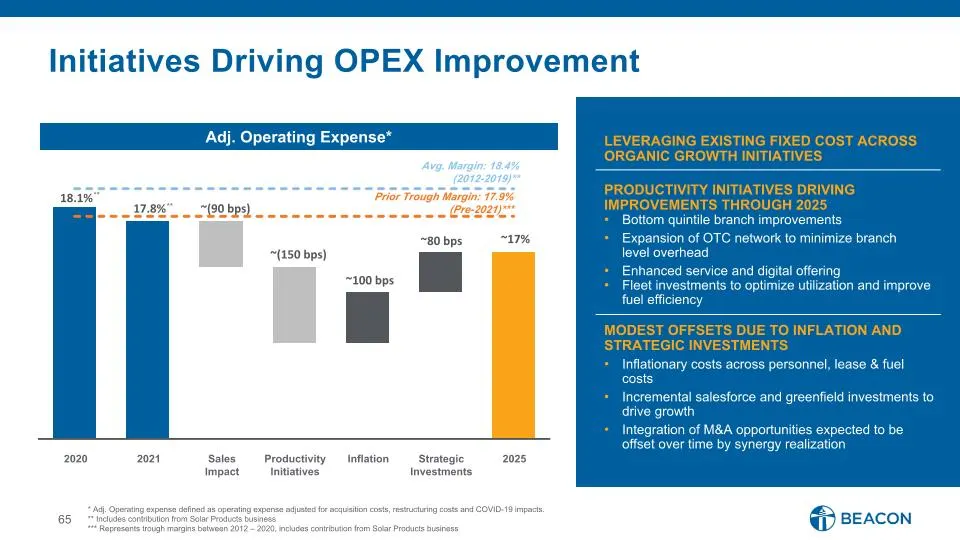
Slide 65: Initiatives Driving OPEX Improvement
18.1% 17.8% ~(90 bps) ~(150 bps) ~100 bps ~80 bps ~17% Initiatives Driving OPEX Improvement * Adj. Operating expense defined as operating expense adjusted for acquisition costs, restructuring costs and COVID-19 impacts. ** Includes contribution from Solar Products business *** Represents trough marg
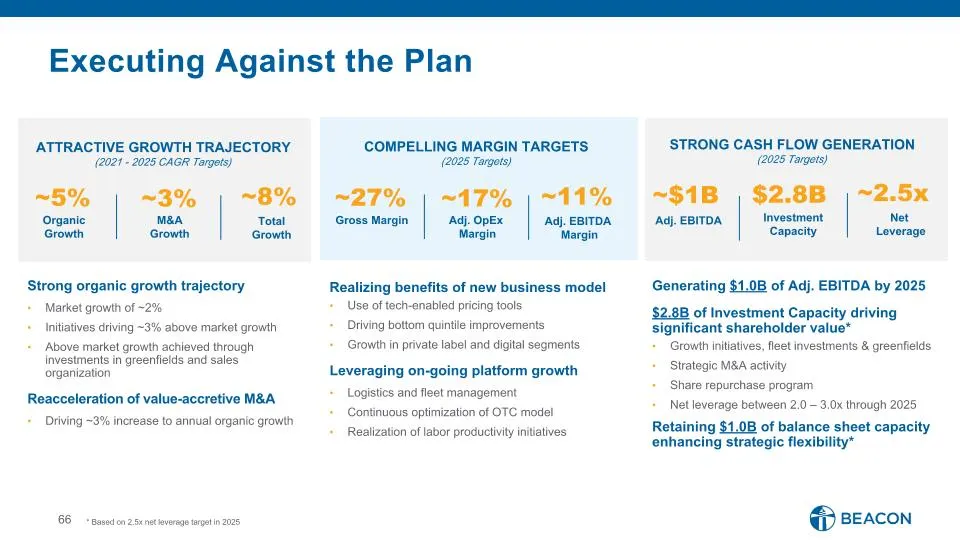
Slide 66: Executing Against the Plan
STRONG CASH FLOW GENERATION (2025 Targets) Executing Against the Plan ATTRACTIVE GROWTH TRAJECTORY (2021 - 2025 CAGR Targets) Strong organic growth trajectory Market growth of ~2% Initiatives driving ~3% above market growth Above market growth achieved through investments in greenfields and sales or
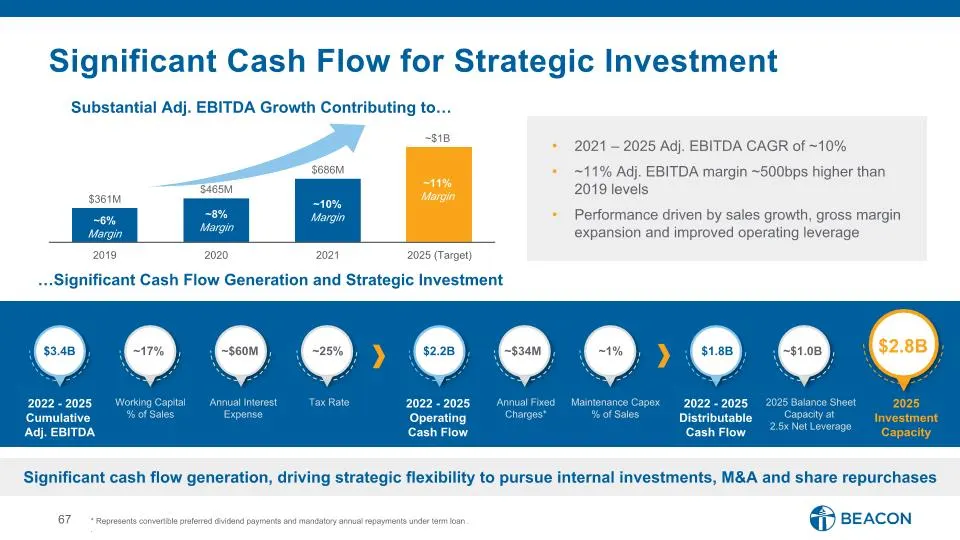
Slide 67: Significant Cash Flow Generation and Strategic Investment
$361M $465M $686M ~$1B 2019 2020 2021 2025 (Target) Significant cash flow generation, driving strategic flexibility to pursue internal investments, M&A and share repurchases Significant Cash Flow for Strategic Investment Substantial Adj. EBITDA Growth Contributing to… 2021 – 2025 Adj. EBITDA CAGR of
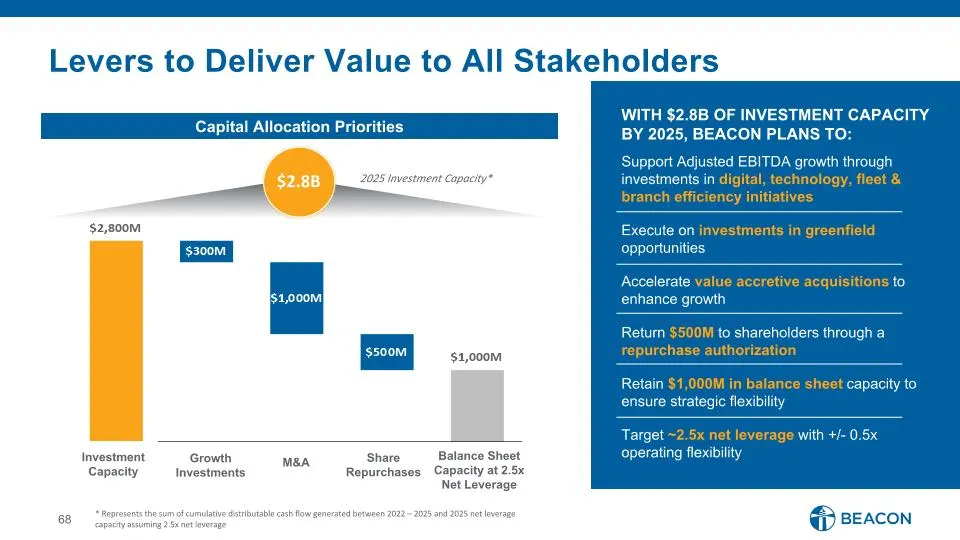
Slide 68: Capital Allocation Priorities
Support Adjusted EBITDA growth through investments in digital, technology, fleet & branch efficiency initiatives Execute on investments in greenfield opportunities Accelerate value accretive acquisitions to enhance growth Return $500M to shareholders through a repurchase authorization Retain $1,000M
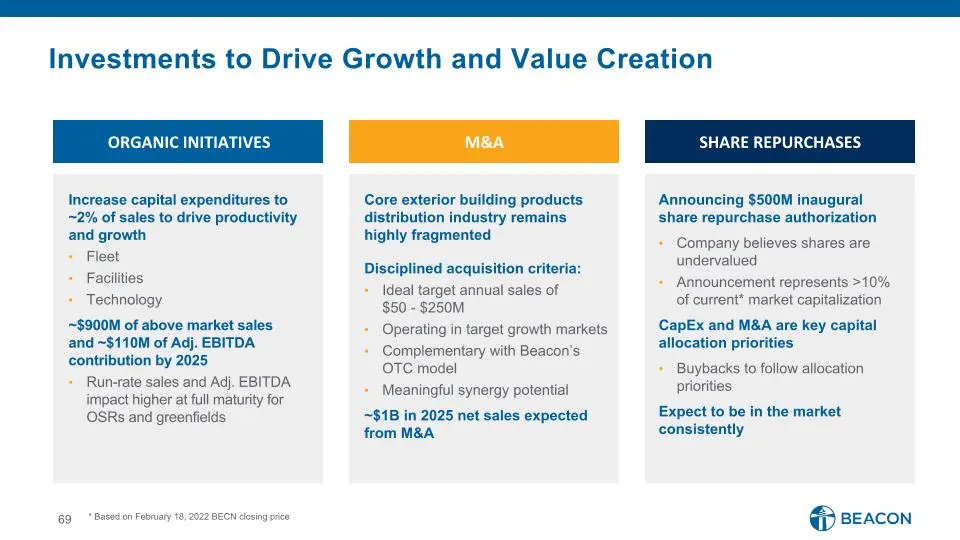
Slide 69: Investments to Drive Growth and Value Creation
Investments to Drive Growth and Value Creation SHARE REPURCHASES ORGANIC INITIATIVES M&A Announcing $500M inaugural share repurchase authorization Company believes shares are undervalued Announcement represents >10% of current* market capitalization CapEx and M&A are key capital allocation prioritie
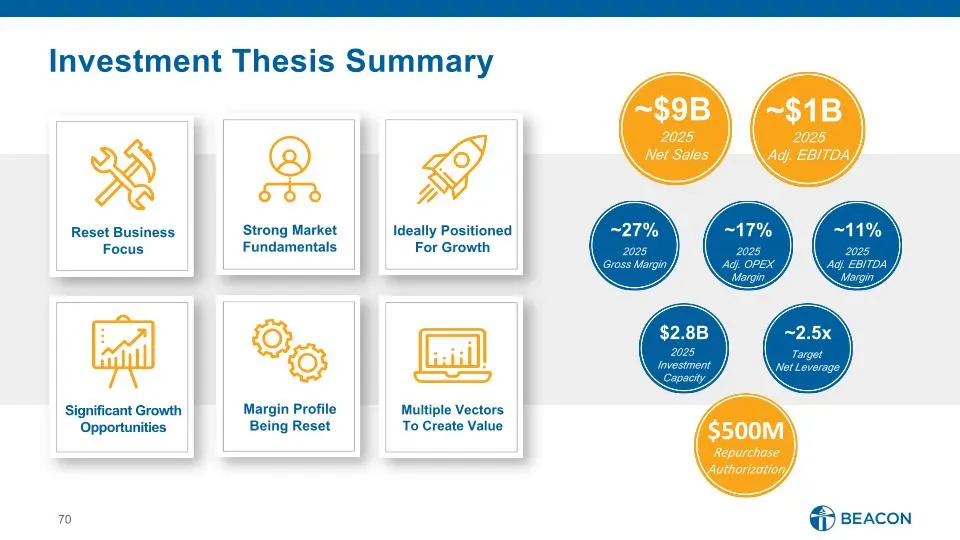
Slide 70: Investment Thesis Summary
Investment Thesis Summary Reset Business Focus Strong Market Fundamentals Ideally Positioned For Growth Significant Growth Opportunities Margin Profile Being Reset Multiple Vectors To Create Value ~27% 2025 Gross Margin ~$1B 2025 Adj. EBITDA ~$9B 2025 Net Sales ~17% 2025 Adj. OPEX Margin ~11% 2025 A

Slide 71: Conclusion
Conclusion Julian Francis, Chief Executive Officer
Slide 72: Key Takeaways
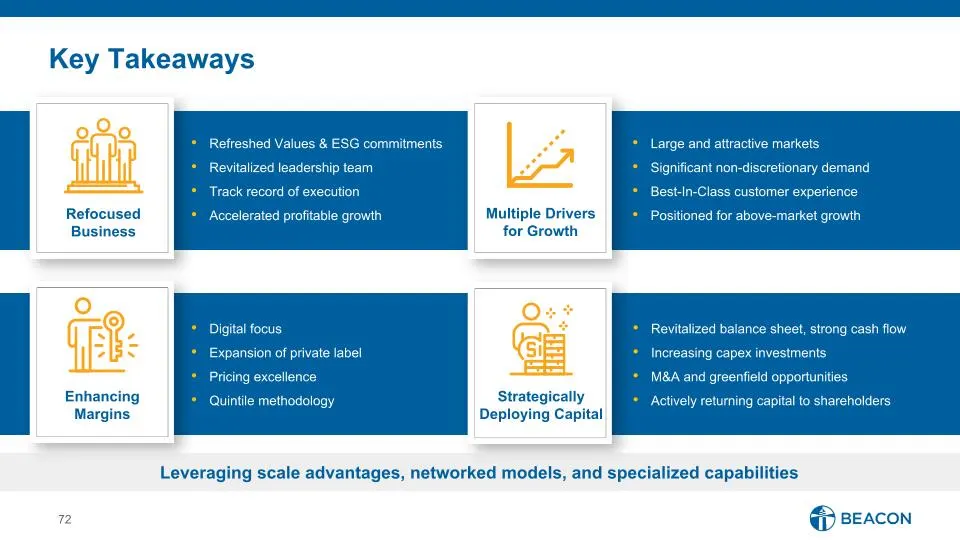
Key Takeaways Refreshed Values & ESG commitments Revitalized leadership team Track record of execution Accelerated profitable growth Refocused Business Multiple Drivers for Growth Large and attractive markets Significant non-discretionary demand Best-In-Class customer experience Positioned for above
Slide 73: Appendix
APPENDIX @D BEACON
Slide 74: Reconciliations: Non-GAAP Financial Measures
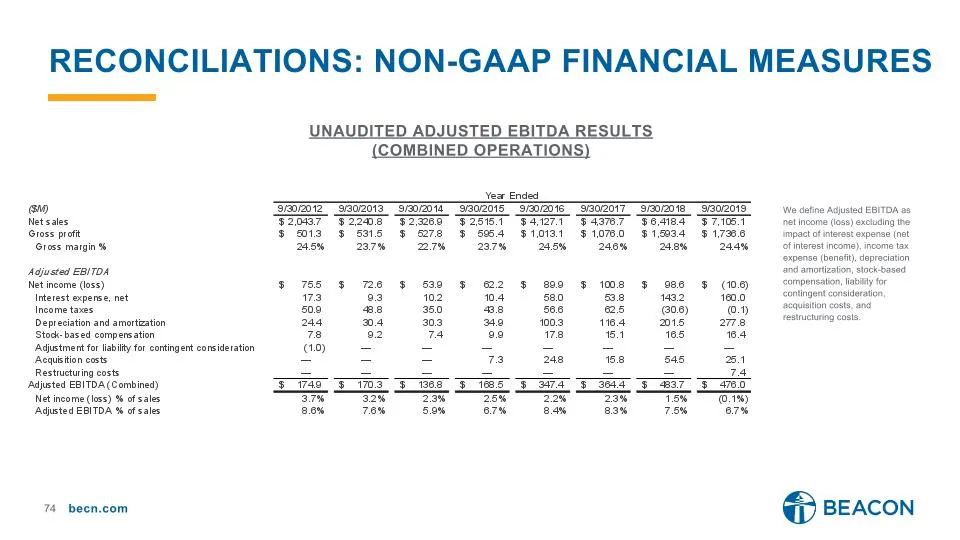
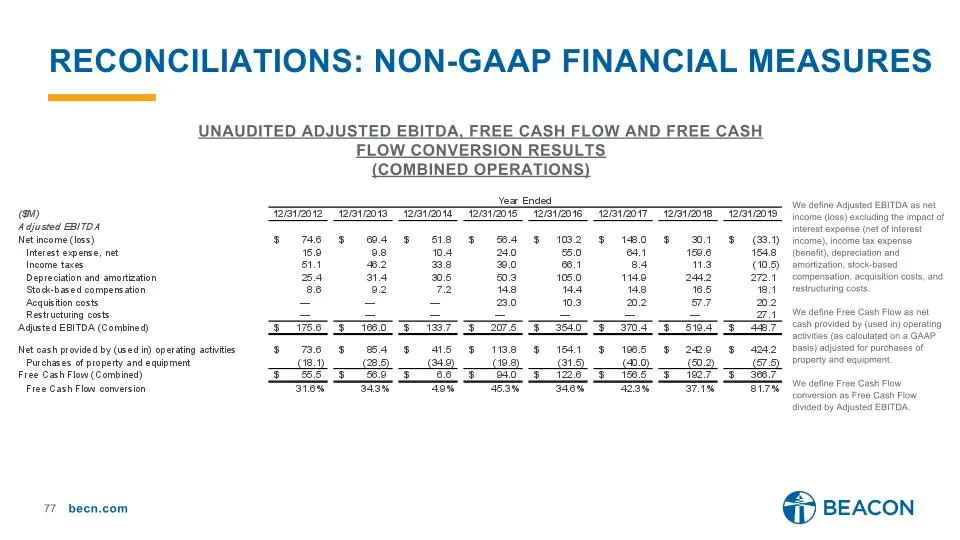
Reconciliations: non-gaap financial measures Unaudited Adjusted Ebitda results (combined operations) We define Adjusted EBITDA as net income (loss) excluding the impact of interest expense (net of interest income), income tax expense (benefit), depreciation and amortization, stock-based compensation
Slide 75: Reconciliations: Non-GAAP Financial Measures
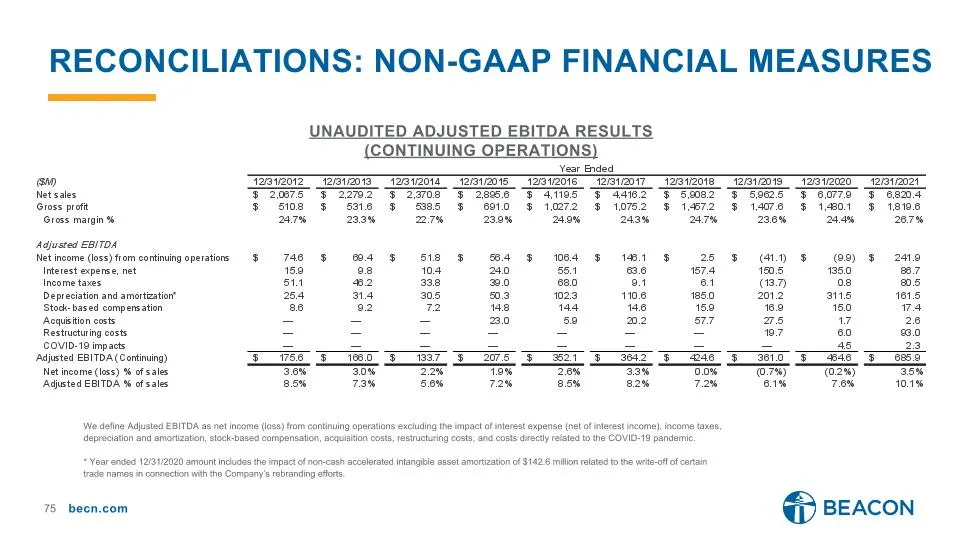
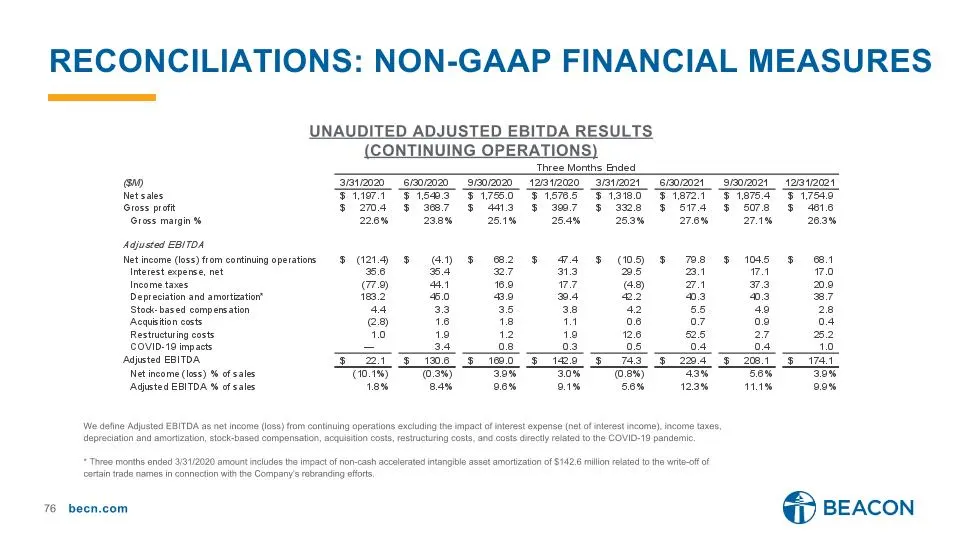
Reconciliations: non-gaap financial measures Unaudited Adjusted Ebitda results (Continuing operations) We define Adjusted EBITDA as net income (loss) from continuing operations excluding the impact of interest expense (net of interest income), income taxes, depreciation and amortization, stock-based
Slide 76: Reconciliations: Non-GAAP Financial Measures
Reconciliations: non-gaap financial measures Unaudited Adjusted Ebitda results (Continuing operations) We define Adjusted EBITDA as net income (loss) from continuing operations excluding the impact of interest expense (net of interest income), income taxes, depreciation and amortization, stock-based
Slide 77: Reconciliations: Non-GAAP Financial Measures
Reconciliations: non-gaap financial measures We define Adjusted EBITDA as net income (loss) excluding the impact of interest expense (net of interest income), income tax expense (benefit), depreciation and amortization, stock-based compensation, acquisition costs, and restructuring costs. We define
Slide 78: Reconciliations: Non-GAAP Financial Measures
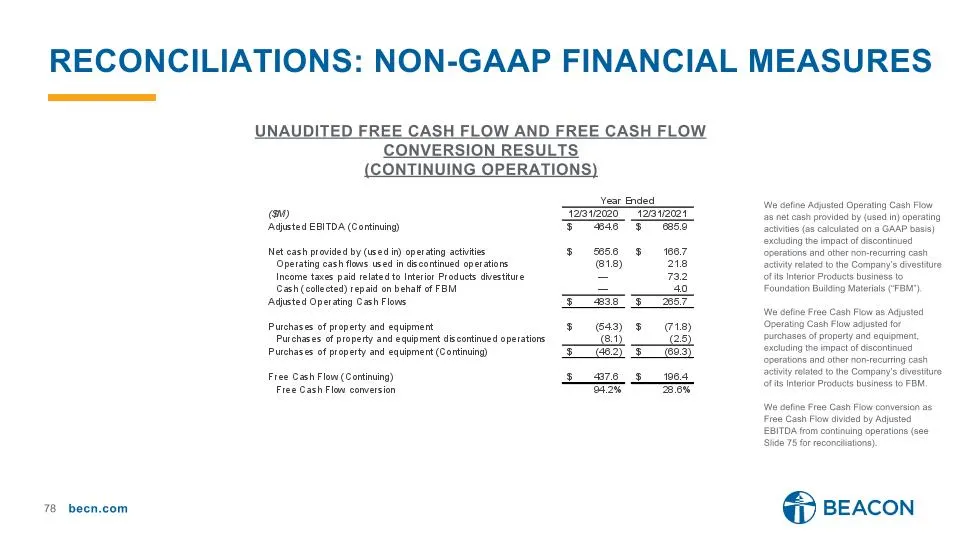
Reconciliations: non-gaap financial measures We define Adjusted Operating Cash Flow as net cash provided by (used in) operating activities (as calculated on a GAAP basis) excluding the impact of discontinued operations and other non-recurring cash activity related to the Company’s divestiture of its
Slide 79: Reconciliations: Net Debt Leverage
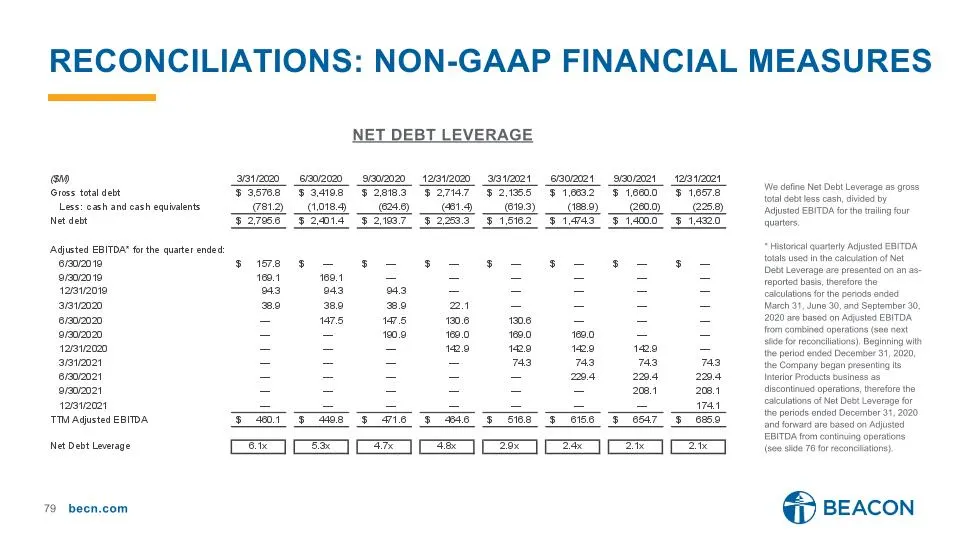
Reconciliations: non-gaap financial measures Net debt leverage We define Net Debt Leverage as gross total debt less cash, divided by Adjusted EBITDA for the trailing four quarters. * Historical quarterly Adjusted EBITDA totals used in the calculation of Net Debt Leverage are presented on an as-repor
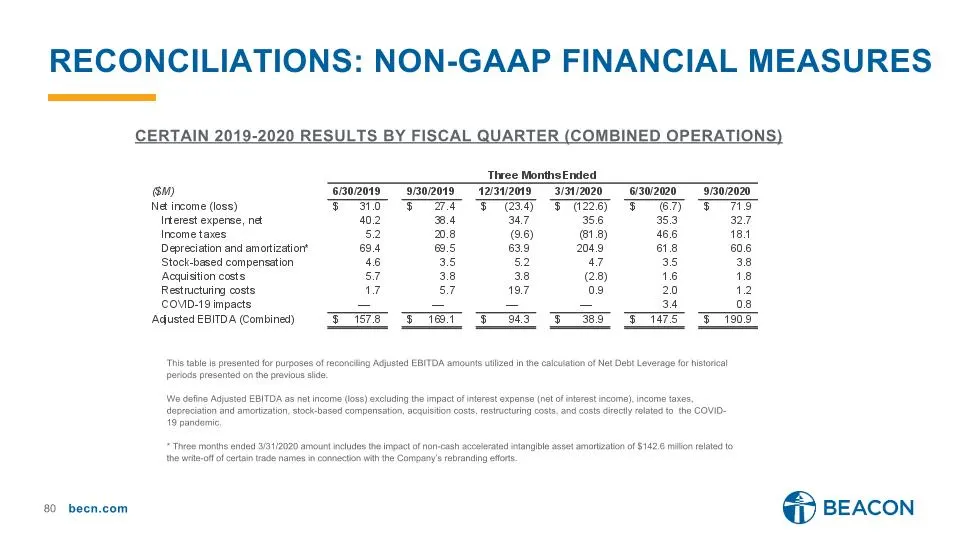
Slide 80: Reconciliations: Non-GAAP Financial Measures
Reconciliations: non-gaap financial measures Certain 2019-2020 results by Fiscal Quarter (combined operations) This table is presented for purposes of reconciling Adjusted EBITDA amounts utilized in the calculation of Net Debt Leverage for historical periods presented on the previous slide. We defin
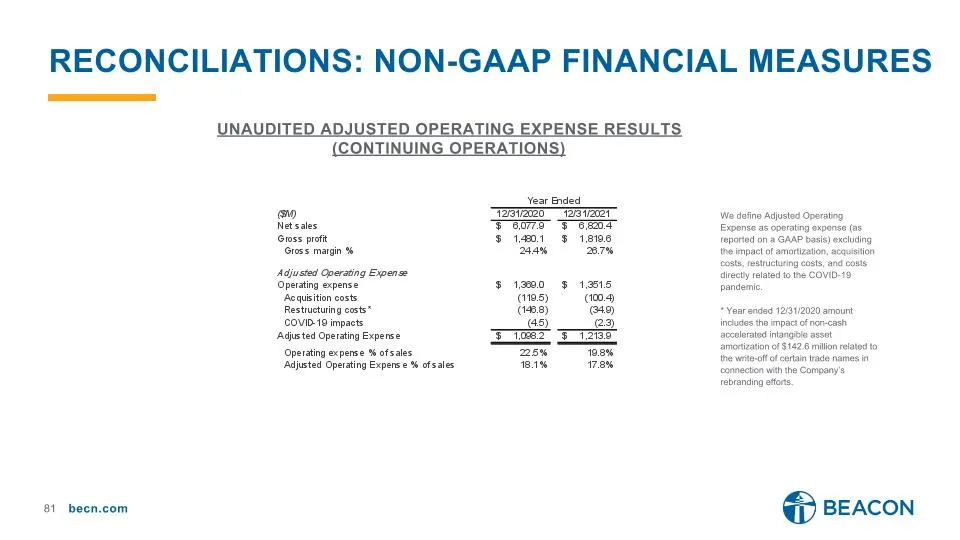
Slide 81: Reconciliations: Non-GAAP Financial Measures
Reconciliations: non-gaap financial measures We define Adjusted Operating Expense as operating expense (as reported on a GAAP basis) excluding the impact of amortization, acquisition costs, restructuring costs, and costs directly related to the COVID-19 pandemic. * Year ended 12/31/2020 amount inclu
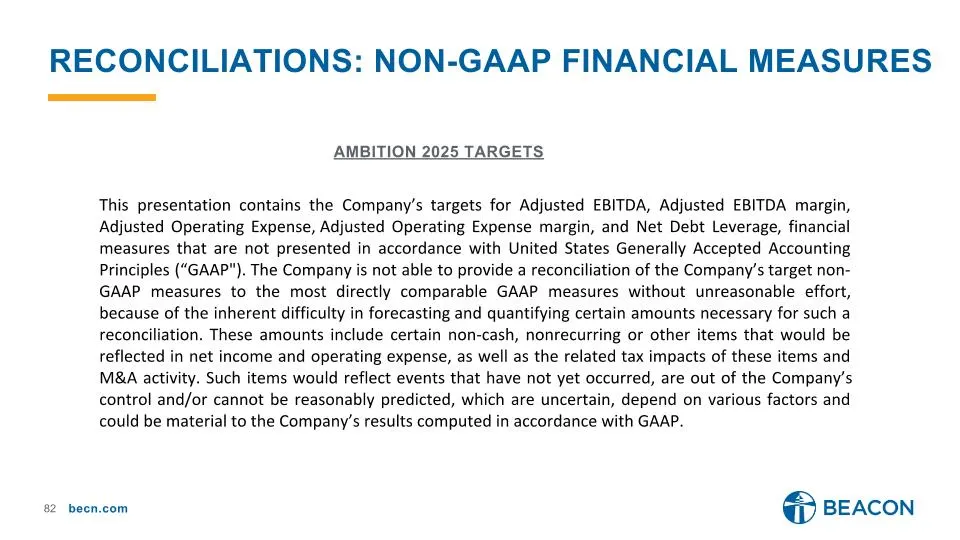
Slide 82: Reconciliations: Non-GAAP Financial Measures
Reconciliations: non-gaap financial measures This presentation contains the Company’s targets for Adjusted EBITDA, Adjusted EBITDA margin, Adjusted Operating Expense, Adjusted Operating Expense margin, and Net Debt Leverage, financial measures that are not presented in accordance with United States

Slide 83: @p BEACON
@p BEACON
Source: SEC EDGAR · 8-K filed Feb 24, 2022
More decks from Beacon Roofing Supply Inc
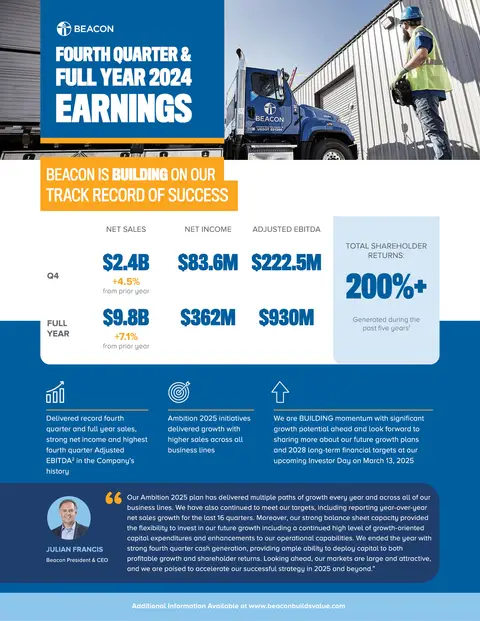 Proxy Contest (February 2025)10 slides · Feb 27, 2025
 Q4 2024 Earnings Presentation18 slides · Feb 27, 2025
 Proxy Contest (February 2025)17 slides · Feb 21, 2025
 Proxy Contest (February 2025)12 slides · Feb 6, 2025
 Q3 2024 Earnings Presentation15 slides · Oct 31, 2024
 Q2 2024 Earnings Presentation15 slides · Aug 1, 2024