Emaar Properties (P.J.S.C) · DFM:EMAAR
Emaar Properties (P.J.S.C) — Emaar Properties — Q3 2017 Earnings Presentation
54 slides from Emaar Properties (P.J.S.C)'s earnings presentation, Nov 16, 2017
Slide 1: Emaar Properties Q3-2017 Results
Emaar Properties Q3-2017 Results November 2017
Slide 2: Disclaimer
Disclaimer Emaar Properties PJSC, for themselves and for Emaar Group, give notice that: The particulars of this presentation do not constitute any part of an offer or a contract. Given that the presentation contains information based on forecasts and roll outs, all statements contained in this prese
Slide 3: Table of Contents
Table of Contents KEY HIGHLIGHTS INCOME STATEMENT BALANCE SHEET OPERATIONAL OVERVIEW APPENDIX Q3 2017 Results Presentation 16 November 2017 Page 2
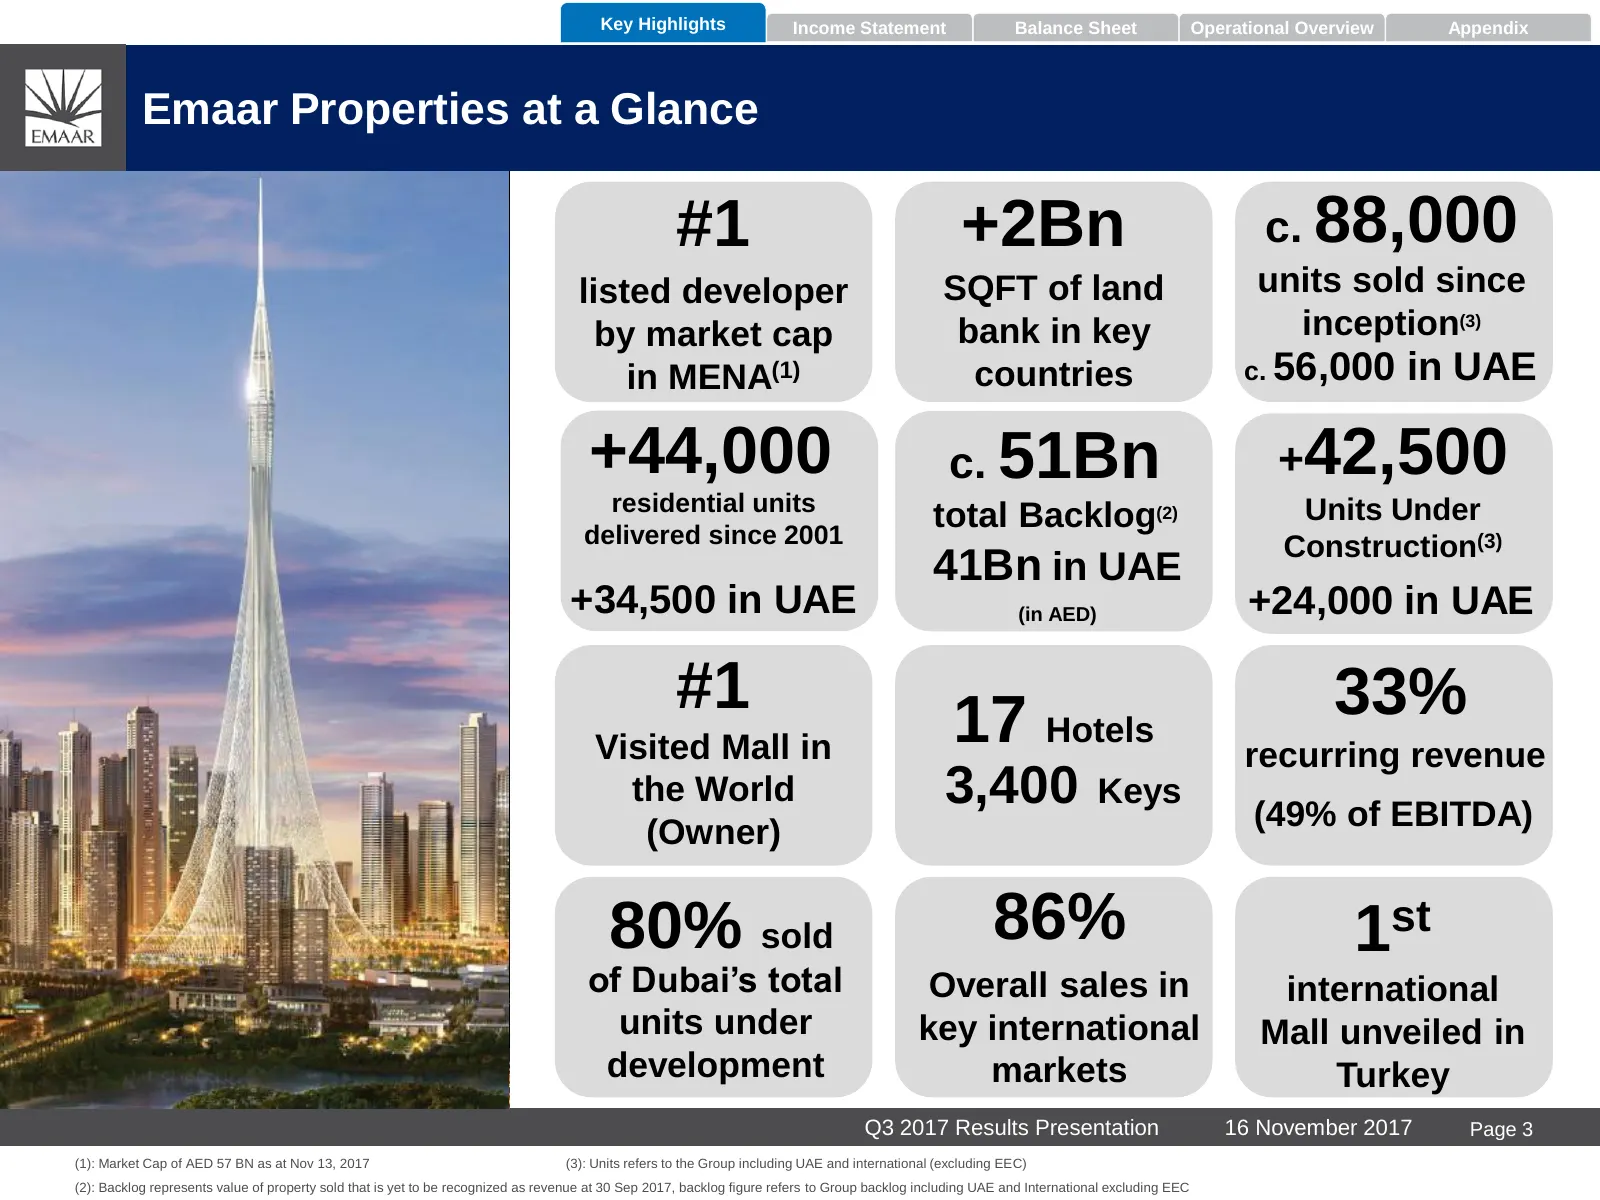
Slide 4: Emaar Properties at a Glance
Key Highlights Income Statement Balance Sheet Operational Overview Appendix Emaar Properties at a Glance #1 +2Bn c. 88,000 listed developer SQFT of land units sold since by market cap bank in key inception(3) in MENA(1) countries c. 56,000 in UAE +44,000 c. 51Bn +42,500 residential units Units Under
Slide 5: Key Financial Highlights for the Group
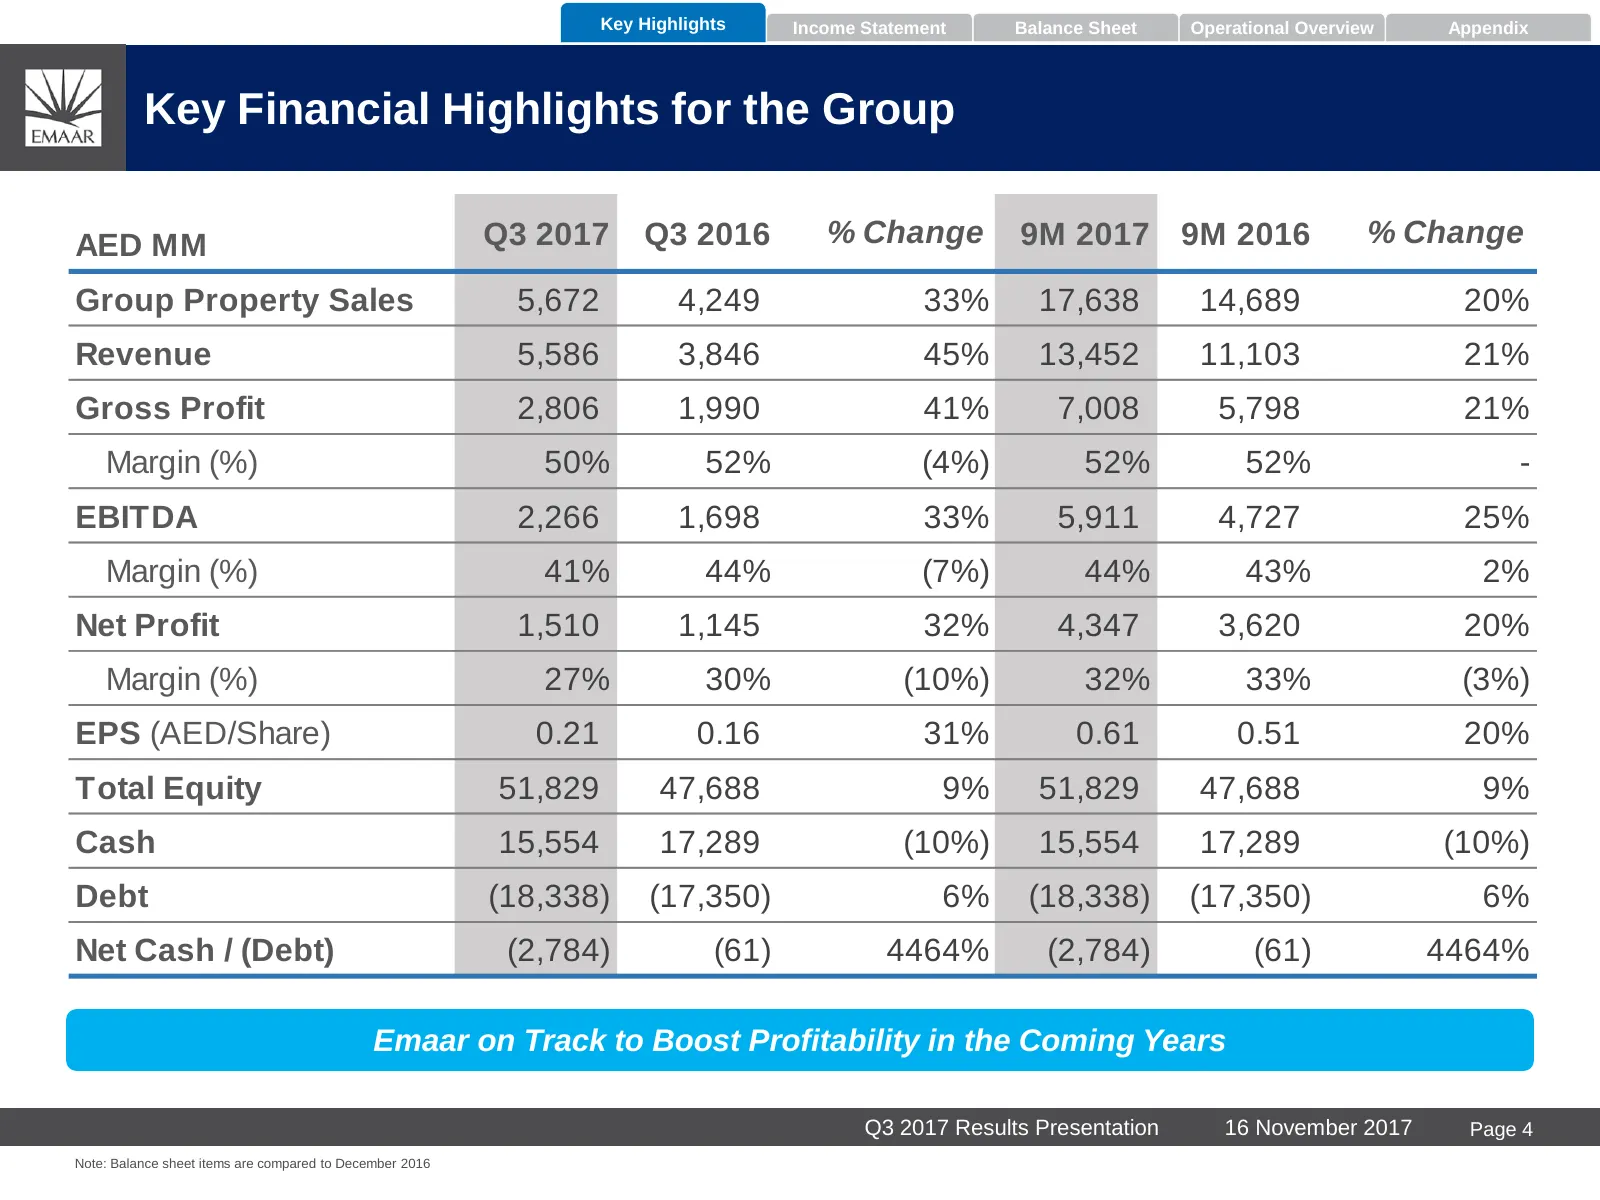
Key Highlights Income Statement Balance Sheet Operational Overview Appendix Key Financial Highlights for the Group AED MM Q3 2017 Q3 2016 % Change 9M 2017 9M 2016 % Change Group Property Sales 5,672 4,249 33% 17,638 14,689 20% Revenue 5,586 3,846 45% 13,452 11,103 21% Gross Profit 2,806 1,990 41% 7,
Slide 6: Key Achievements – 9 months 2017
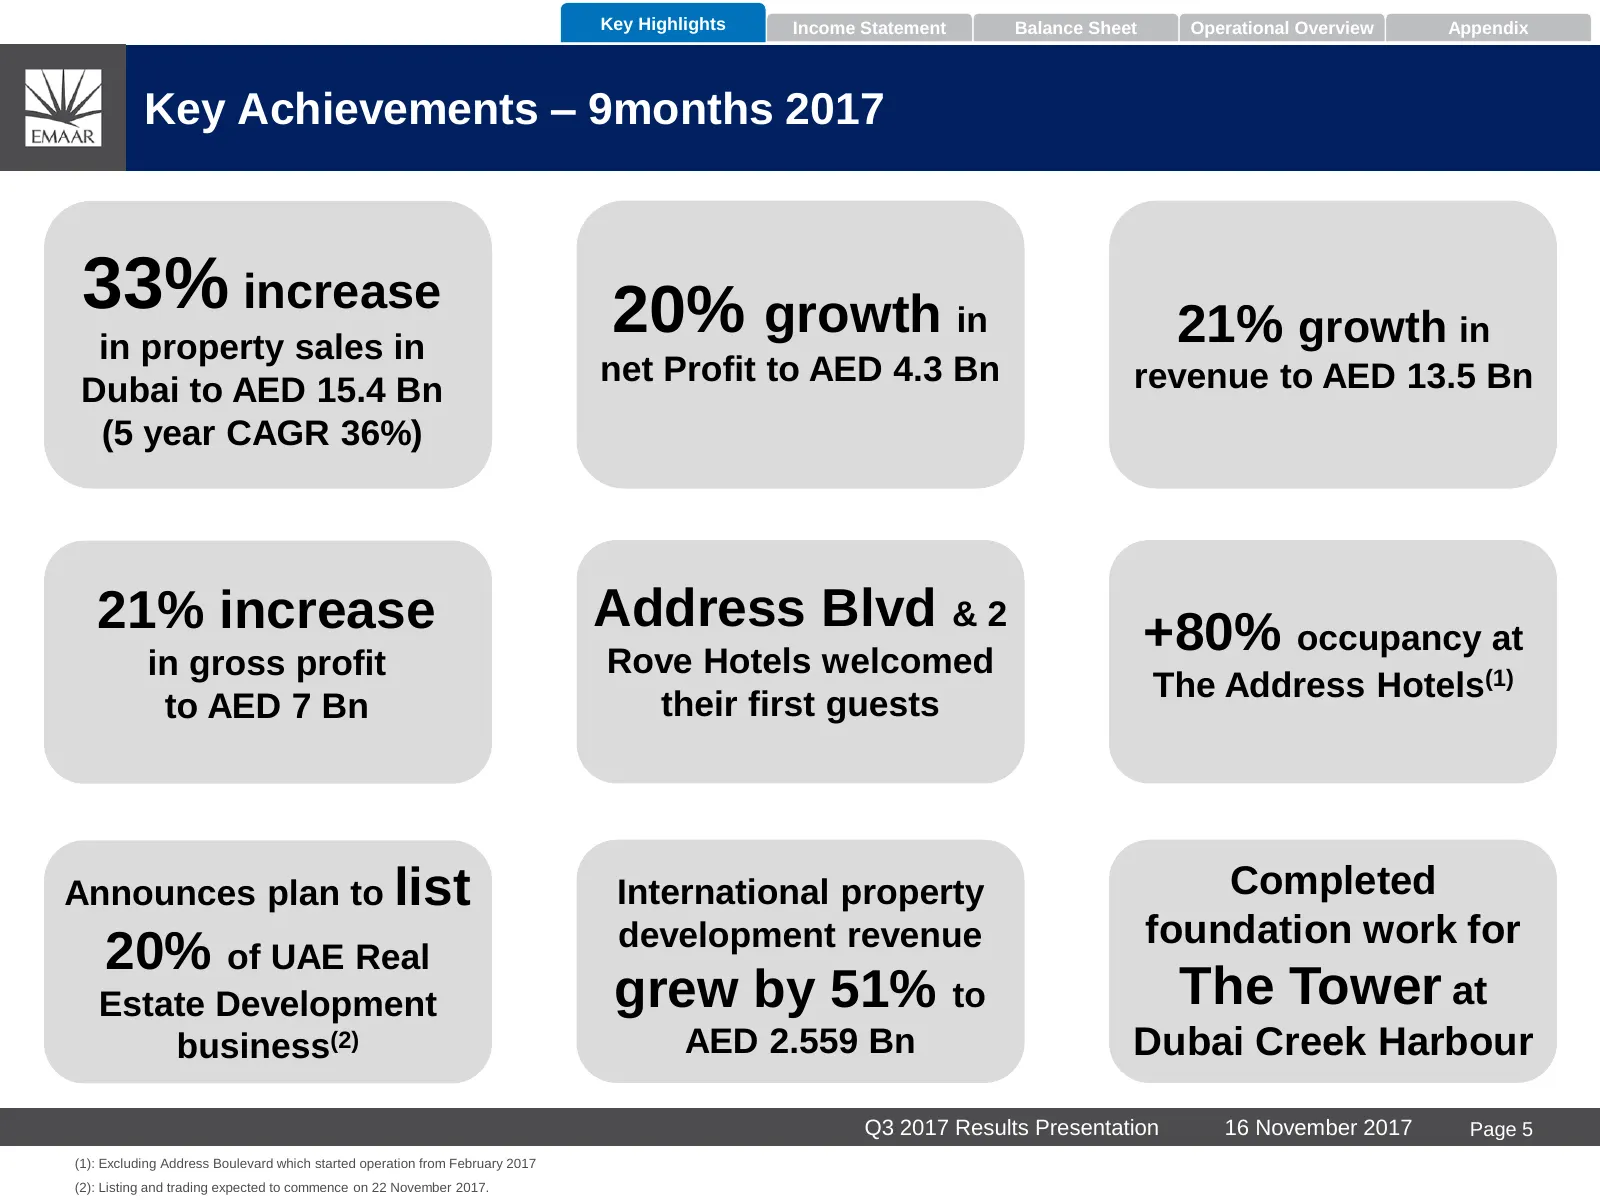
Key Highlights Income Statement Balance Sheet Operational Overview Appendix Key Achievements – 9months 2017 33% increase 20% growth in 21% growth in in property sales in net Profit to AED 4.3 Bn revenue to AED 13.5 Bn Dubai to AED 15.4 Bn (5 year CAGR 36%) 21% increase Address Blvd & 2 +80% occupanc
Slide 7: Results by Segment
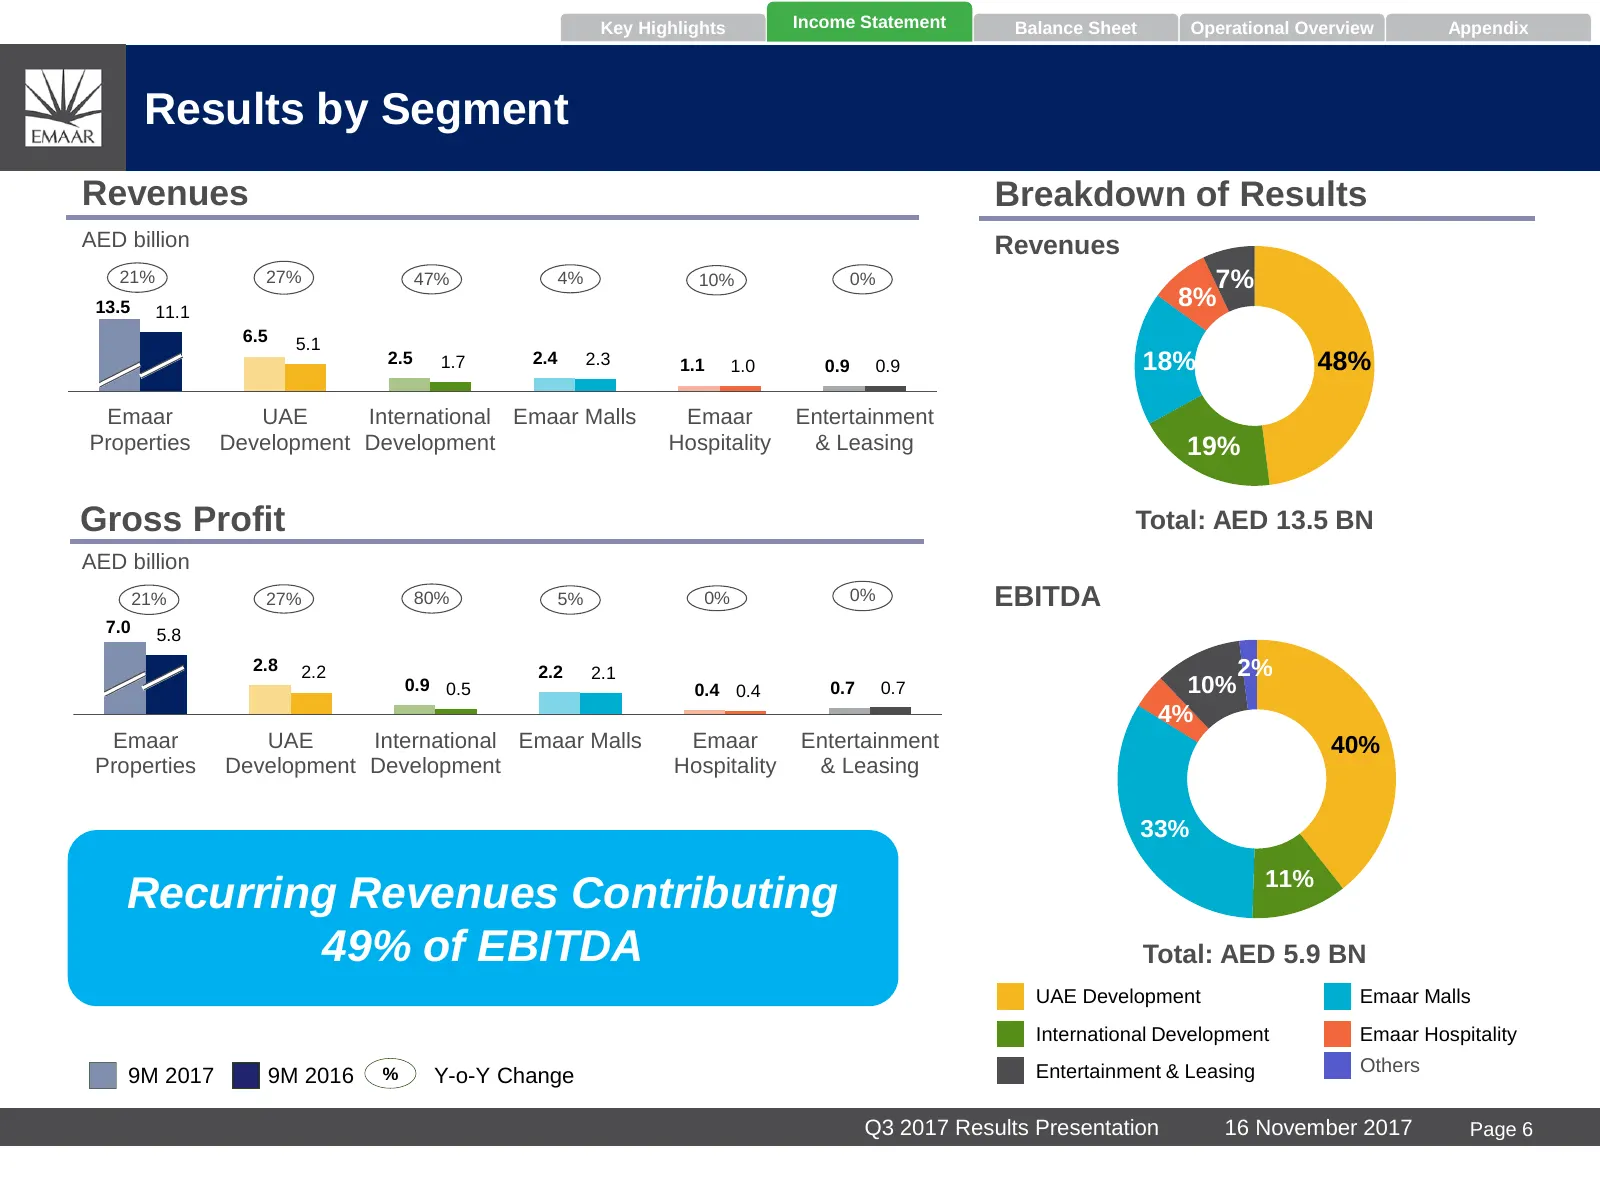
Key Highlights Income Statement Balance Sheet Operational Overview Appendix Results by Segment Revenues Breakdown of Results AED billion Revenues 21% 27% 47% 4% 10% 0% 7% 13.5 11.1 8% 6.5 5.1 2.5 1.7 2.4 2.3 1.1 1.0 0.9 0.9 18% 48% Emaar UAE International Emaar Malls Emaar Entertainment Properties D
Slide 8: Balance Sheet Overview at Sep 2017
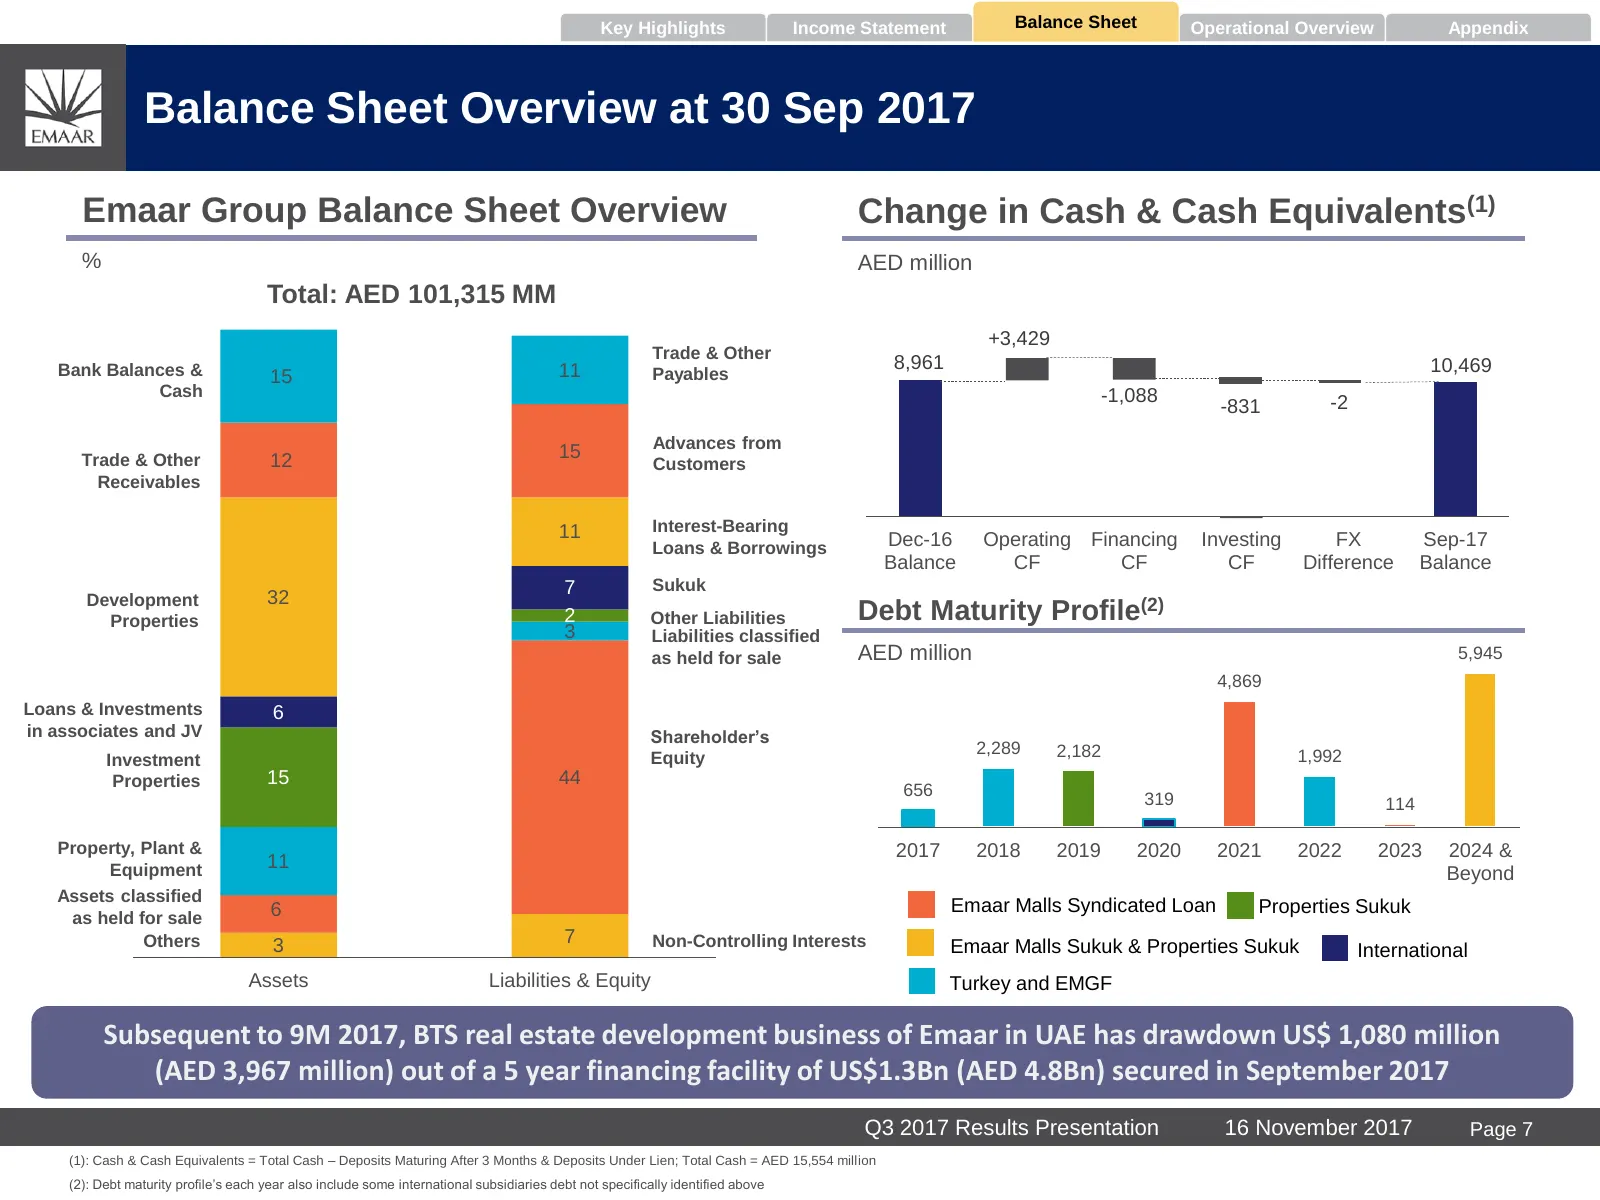
Key Highlights Income Statement Balance Sheet Operational Overview Appendix Balance Sheet Overview at 30 Sep 2017 Emaar Group Balance Sheet Overview Change in Cash & Cash Equivalents(1) % AED million Total: AED 101,315 MM +3,429 Trade & Other Bank Balances & 11 8,961 10,469 15 Payables Cash -1,088 -
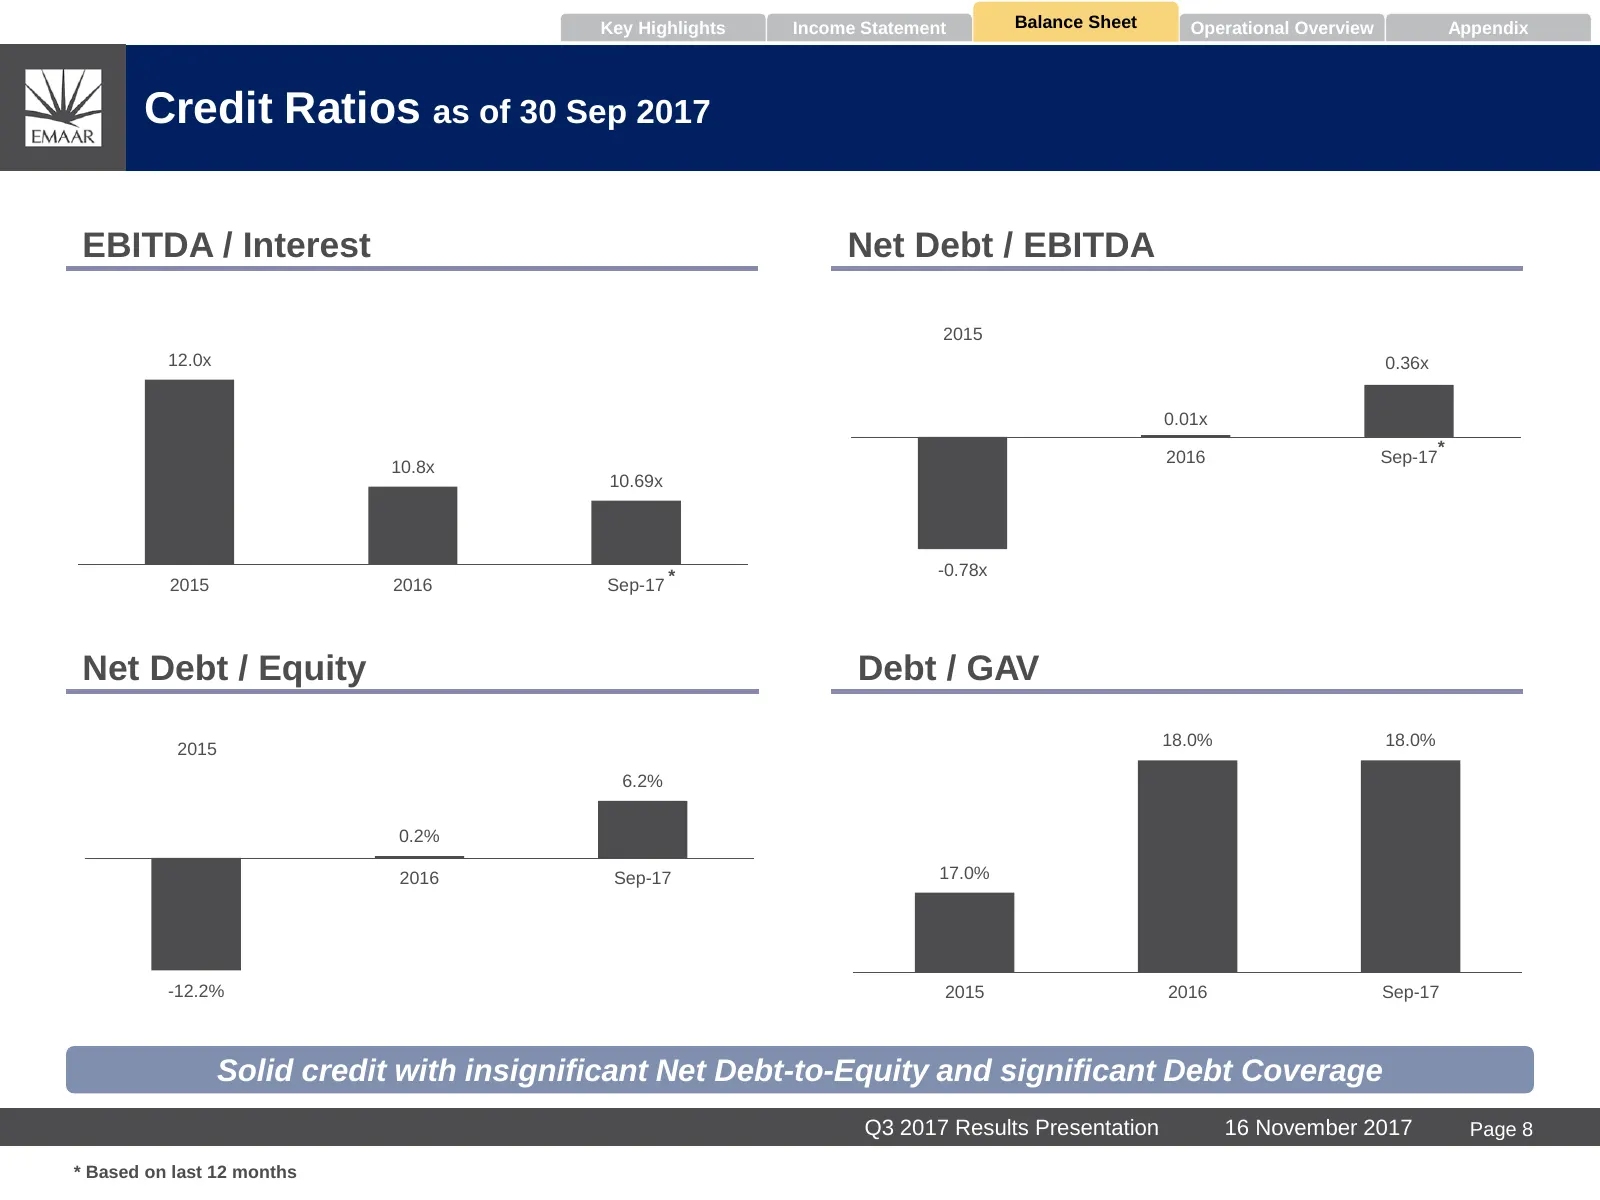
Slide 9: Credit Ratios as of Sep 2017
Key Highlights Income Statement Balance Sheet Operational Overview Appendix Credit Ratios as of 30 Sep 2017 EBITDA / Interest Net Debt / EBITDA 2015 12.0x 0.36x 0.01x * 2015 2016 Sep-17 10.8x 10.69x -0.78x 2015 2016 Sep-17 * Net Debt / Equity Debt / GAV 2015 18.0% 18.0% 6.2% 0.2% 2015 2016 Sep-17 17
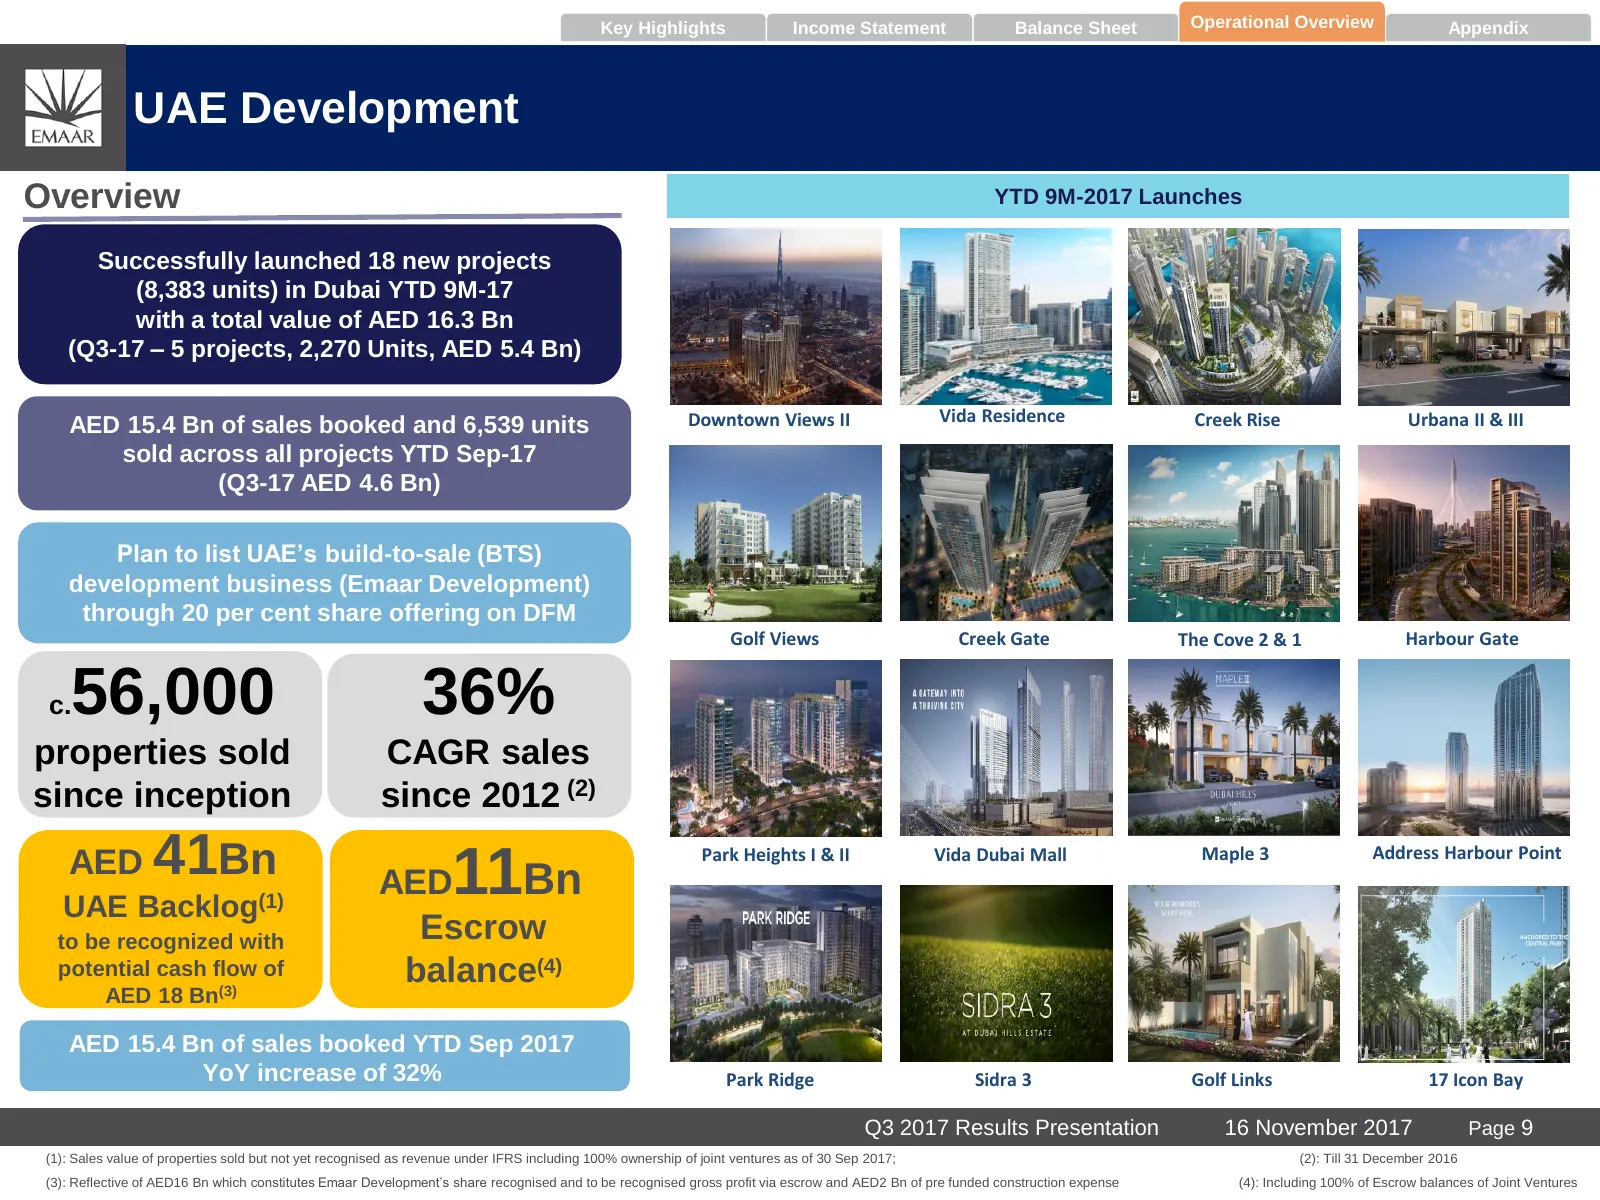
Slide 10: UAE Development Overview
Key Highlights Income Statement Balance Sheet Operational Overview Appendix UAE Development Overview YTD 9M-2017 Launches Successfully launched 18 new projects (8,383 units) in Dubai YTD 9M-17 with a total value of AED 16.3 Bn (Q3-17 – 5 projects, 2,270 Units, AED 5.4 Bn) Downtown Views II Vida Resi
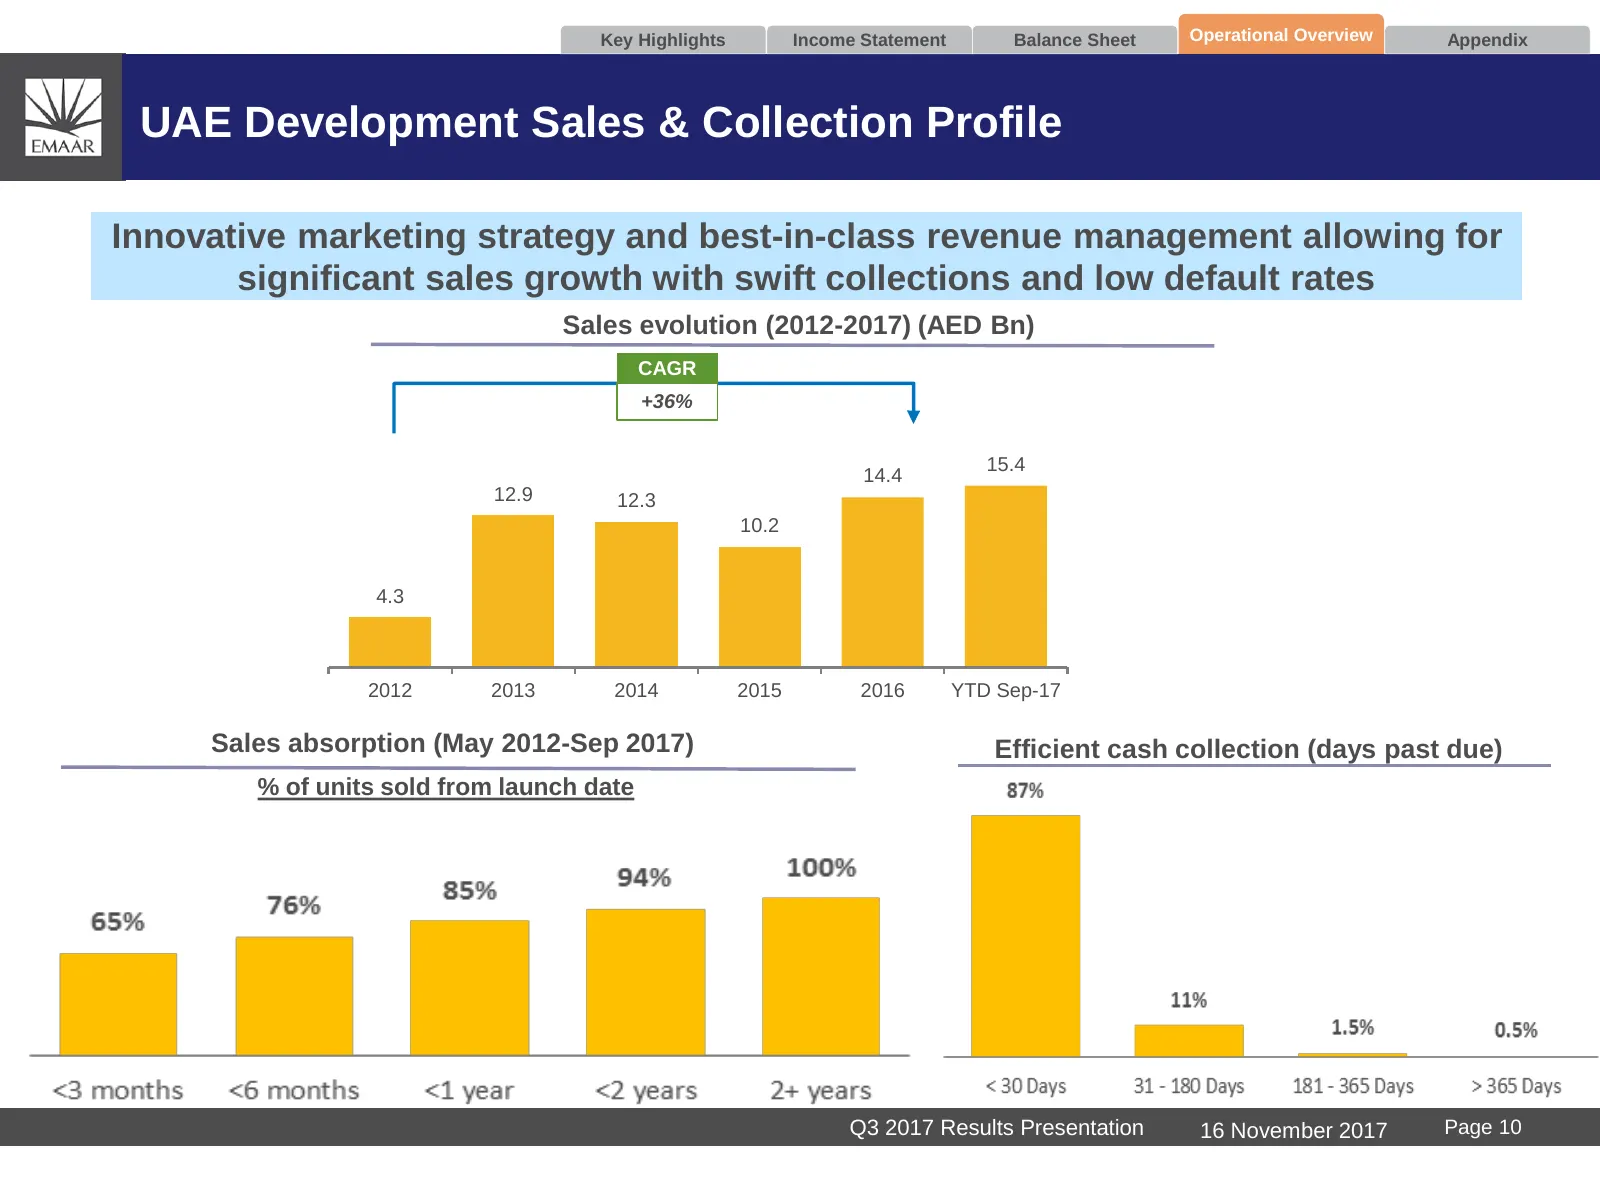
Slide 11: UAE Development Sales & Collection Profile
Key Highlights Income Statement Balance Sheet Operational Overview Appendix UAE Development Sales & Collection Profile Innovative marketing strategy and best-in-class revenue management allowing for significant sales growth with swift collections and low default rates Sales evolution (2012-2017) (AE
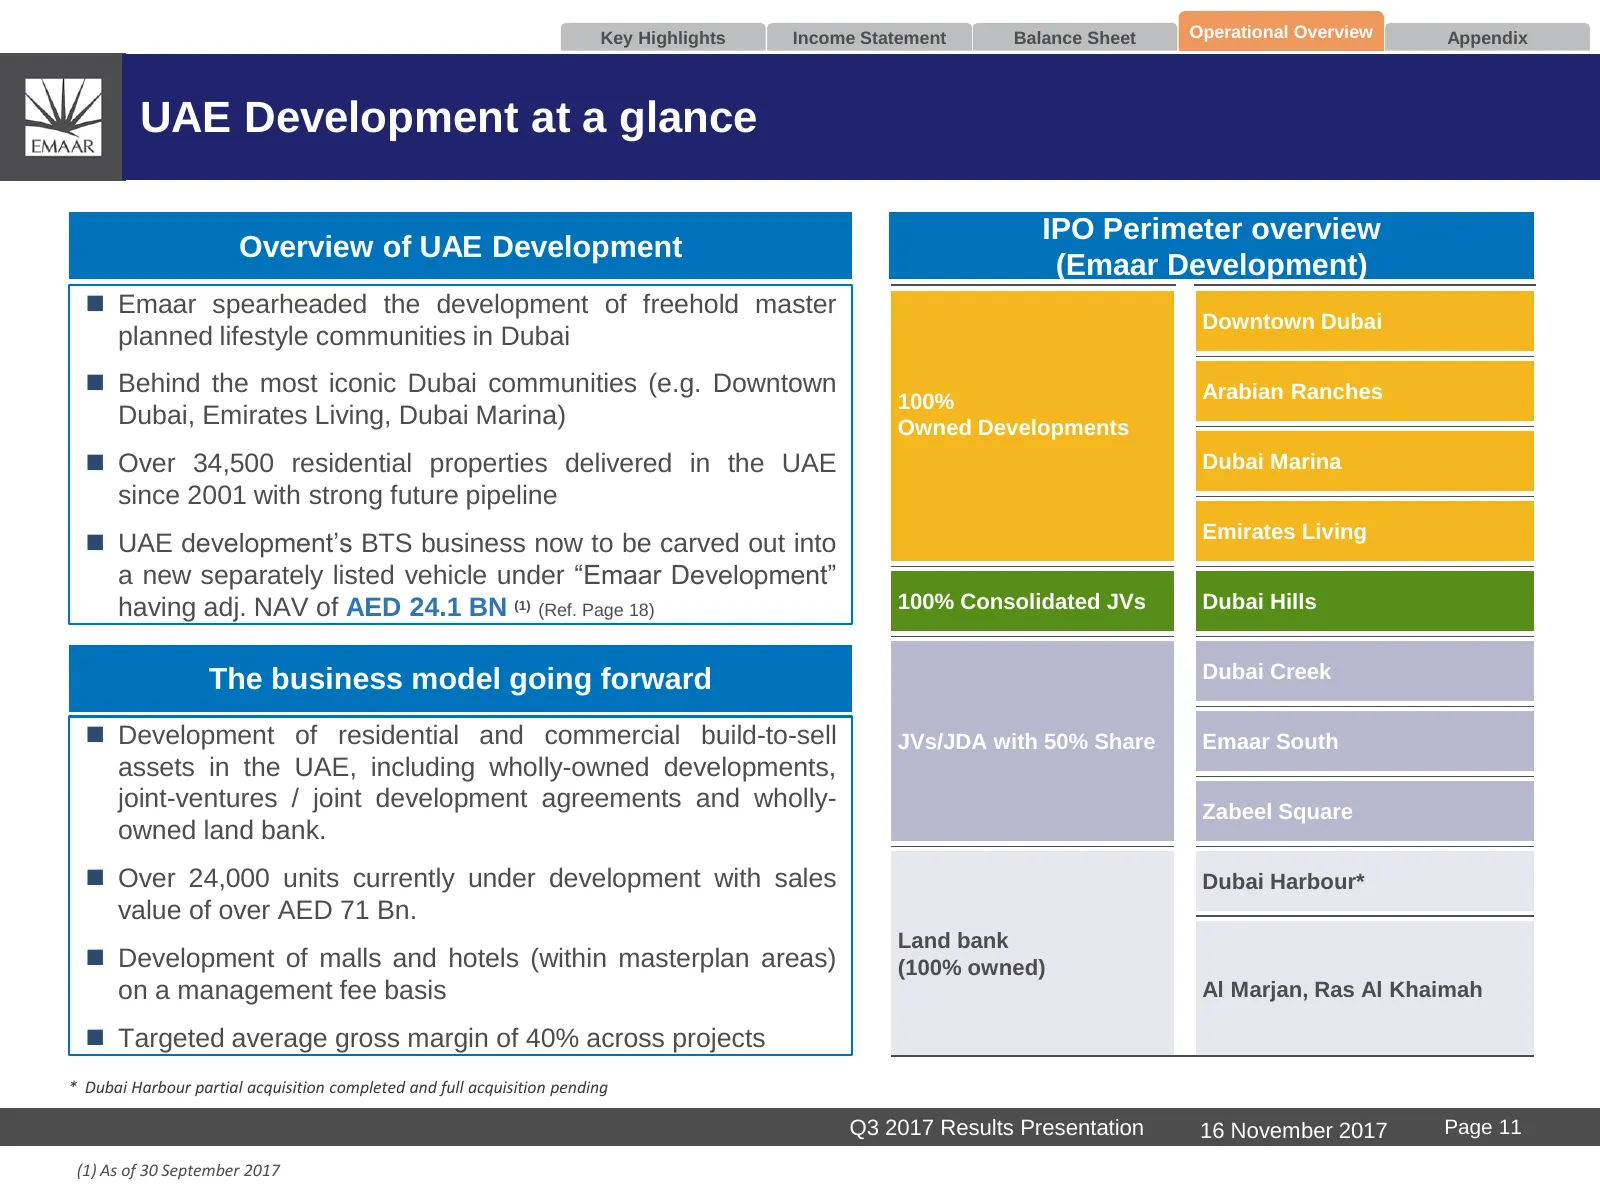
Slide 12: UAE Development at a glance
Key Highlights Income Statement Balance Sheet Operational Overview Appendix UAE Development at a glance IPO Perimeter overview Overview of UAE Development (Emaar Development) Emaar spearheaded the development of freehold master Downtown Dubai planned lifestyle communities in Dubai Behind the mos
Slide 13: Emaar Development - Financial Performance
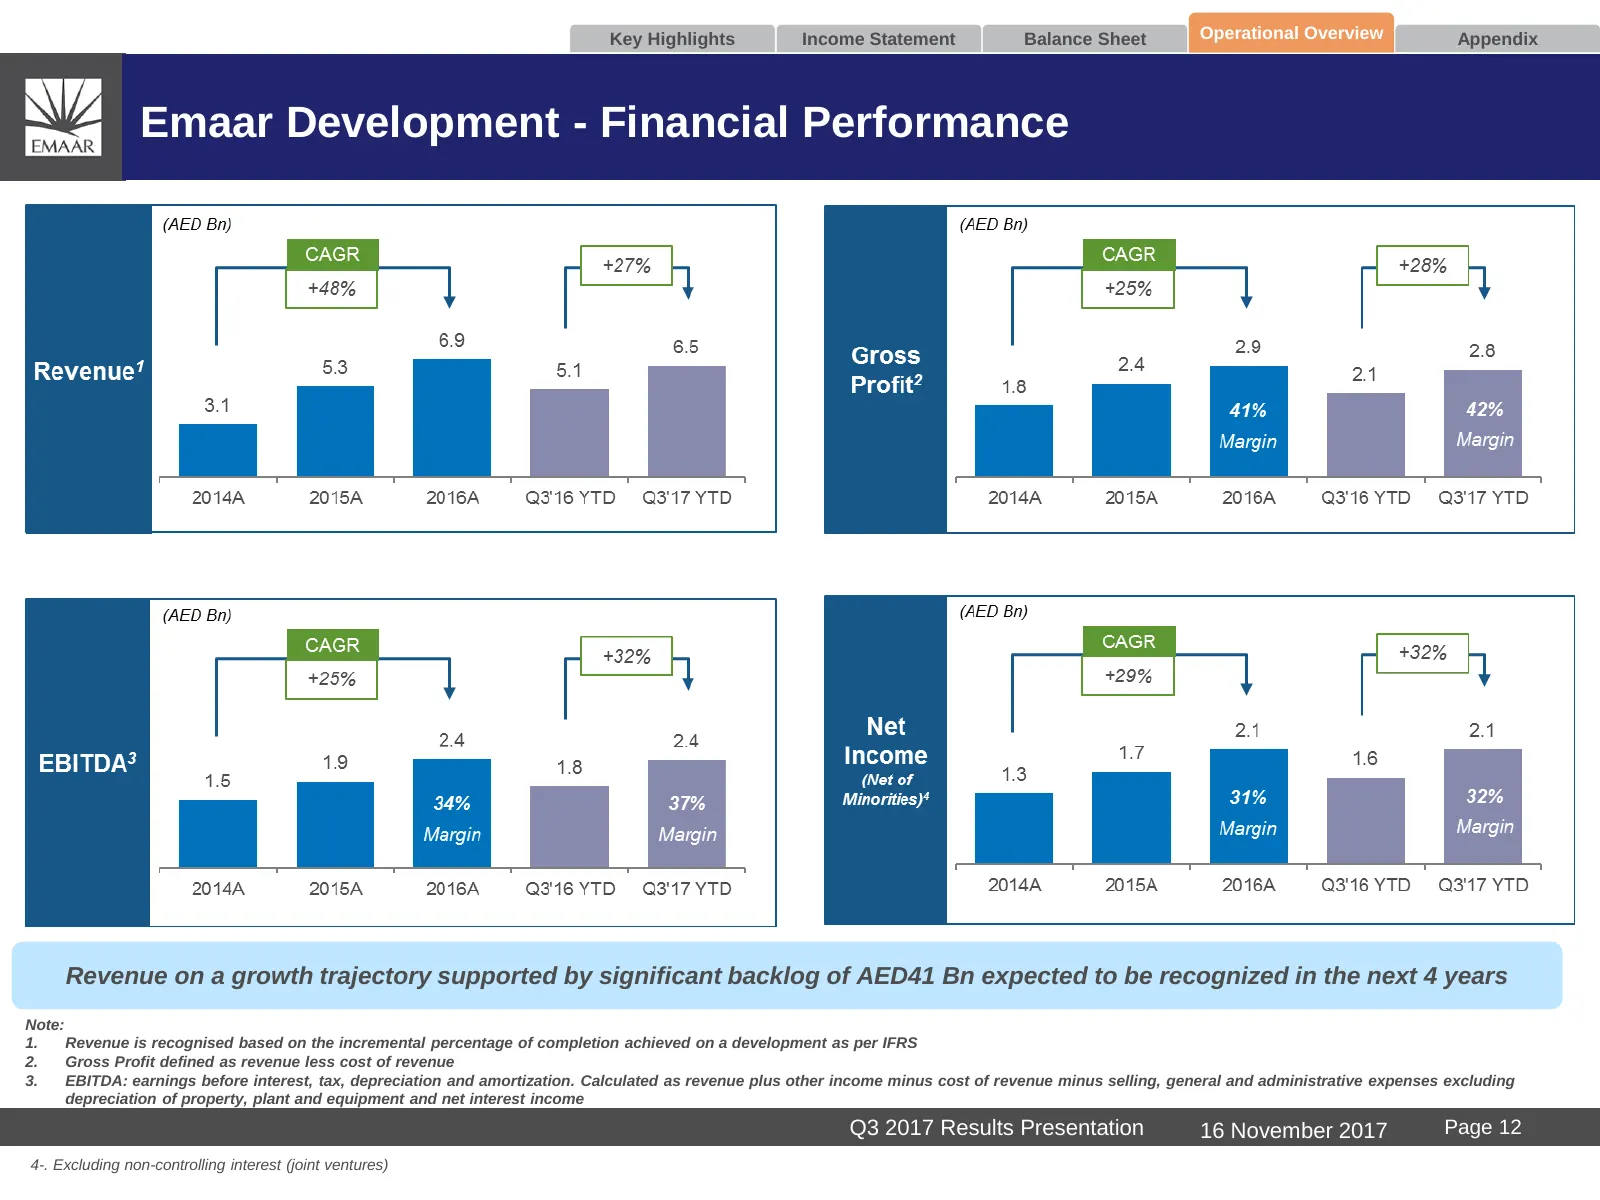
Key Highlights Income Statement Balance Sheet Operational Overview Appendix Emaar Development - Financial Performance Revenue on a growth trajectory supported by significant backlog of AED41 Bn expected to be recognized in the next 4 years Note: 1. Revenue is recognised based on the incremental perc
Slide 14: Emaar Development - Balance Sheet Overview
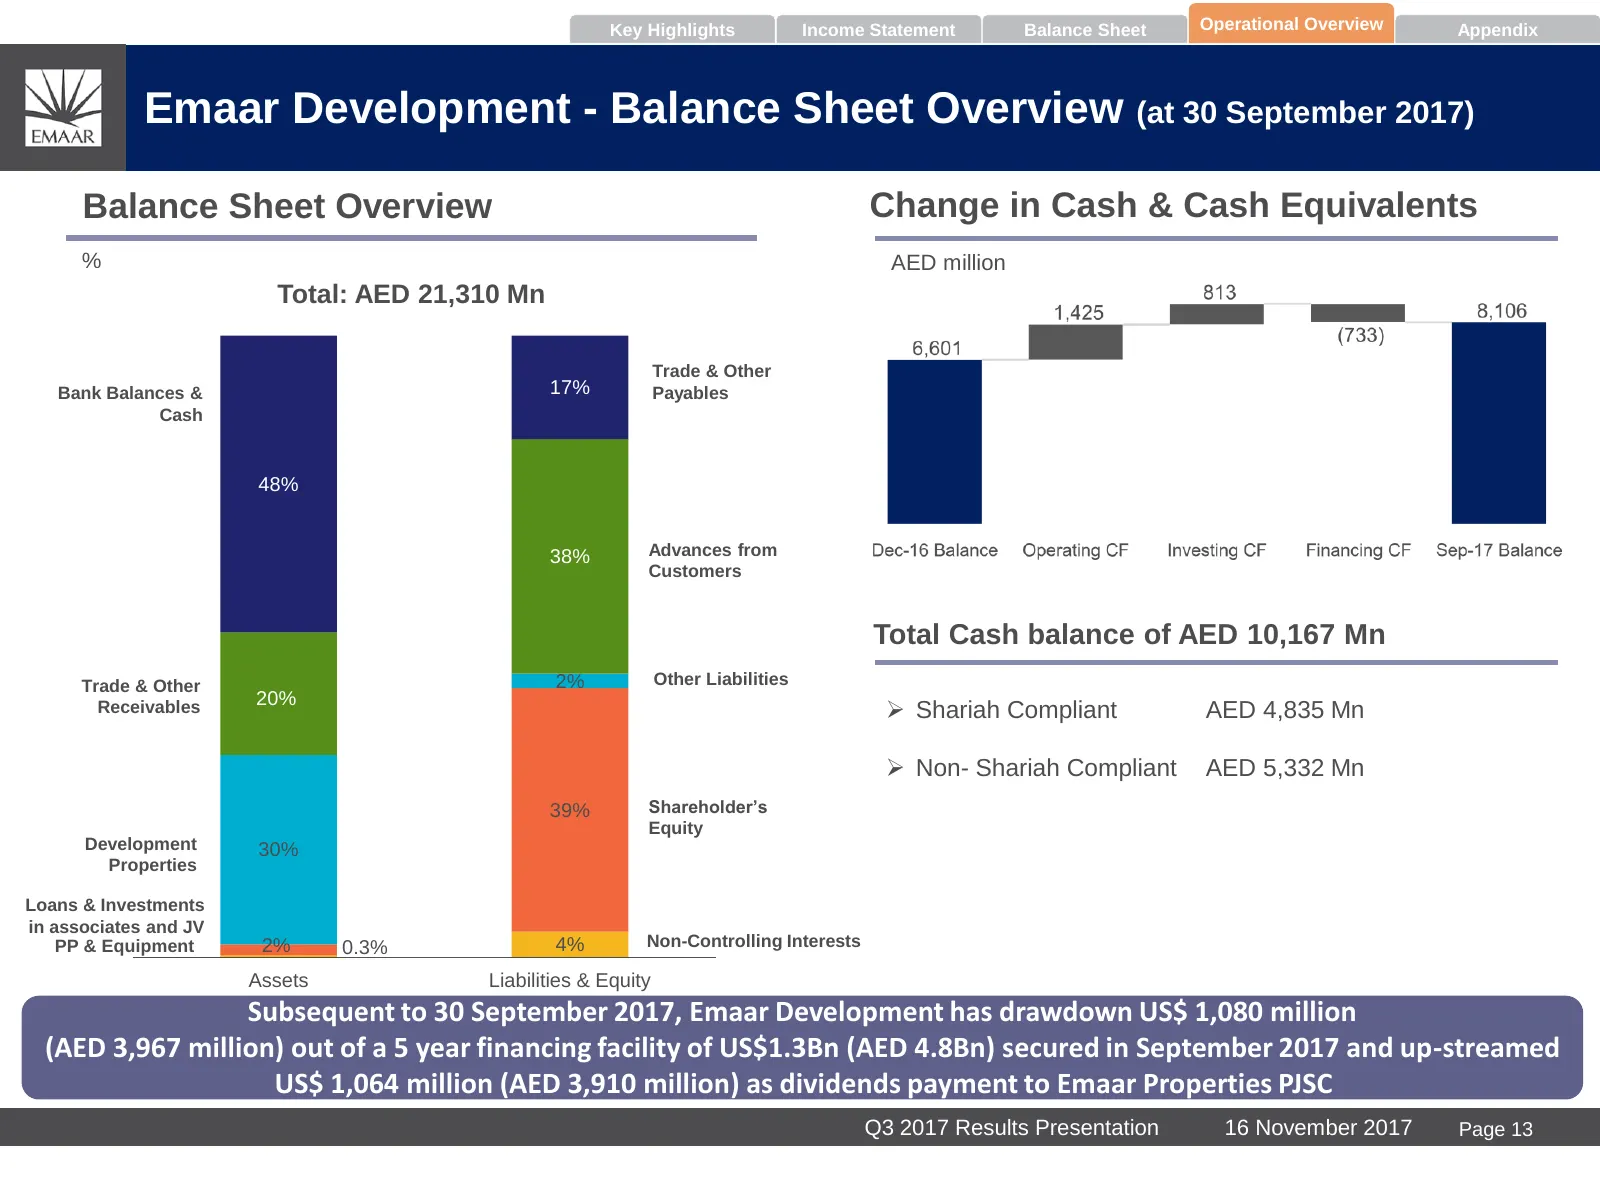
Key Highlights Income Statement Balance Sheet Operational Overview Appendix Emaar Development - Balance Sheet Overview (at 30 September 2017) Balance Sheet Overview Change in Cash & Cash Equivalents % AED million Total: AED 21,310 Mn Trade & Other Bank Balances & 17% Payables Cash 48% 38% Advances f
Slide 15: UAE Development Overview
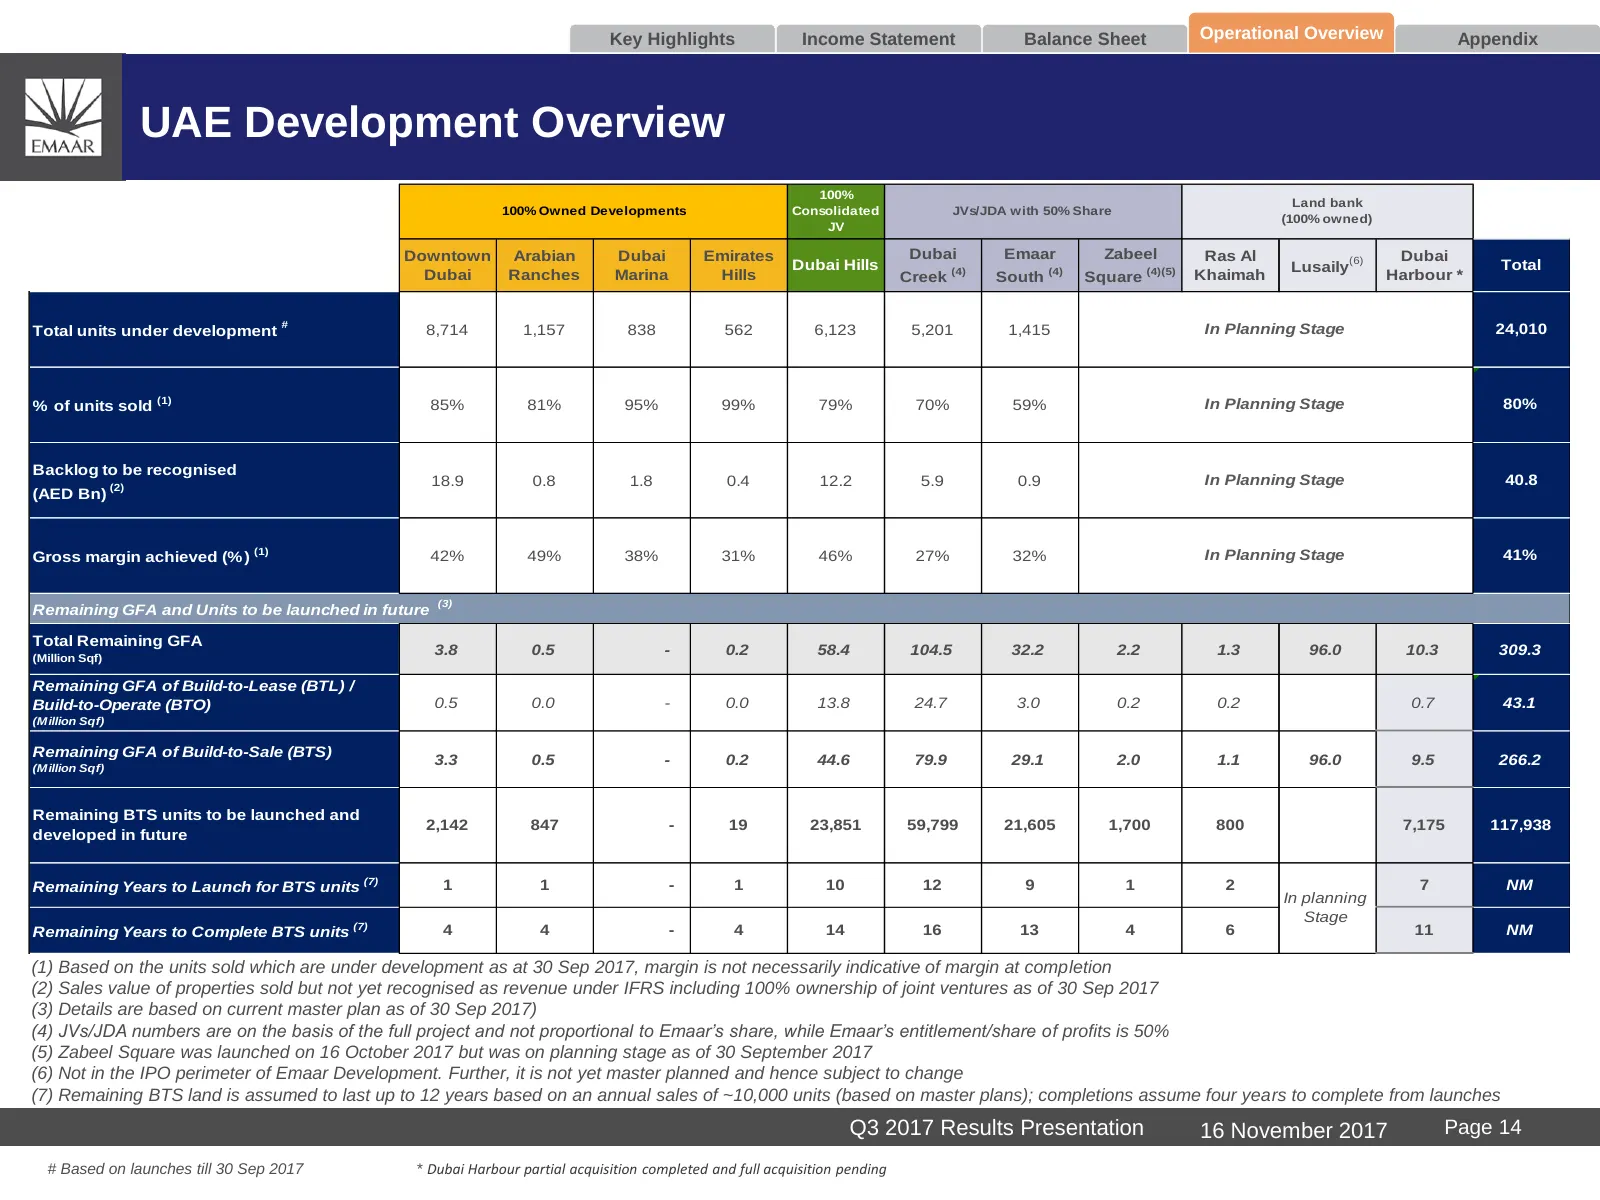
Key Highlights Income Statement Balance Sheet Operational Overview Appendix UAE Development Overview 100% Land bank 100% Owned Developments Consolidated JVs/JDA with 50% Share (100% owned) JV Downtown Arabian Dubai Emirates Dubai Emaar Zabeel Ras Al (6) Dubai Dubai Hills Lusaily Total Dubai Ranches
Slide 16: Rationale for the proposed IPO of Emaar Development
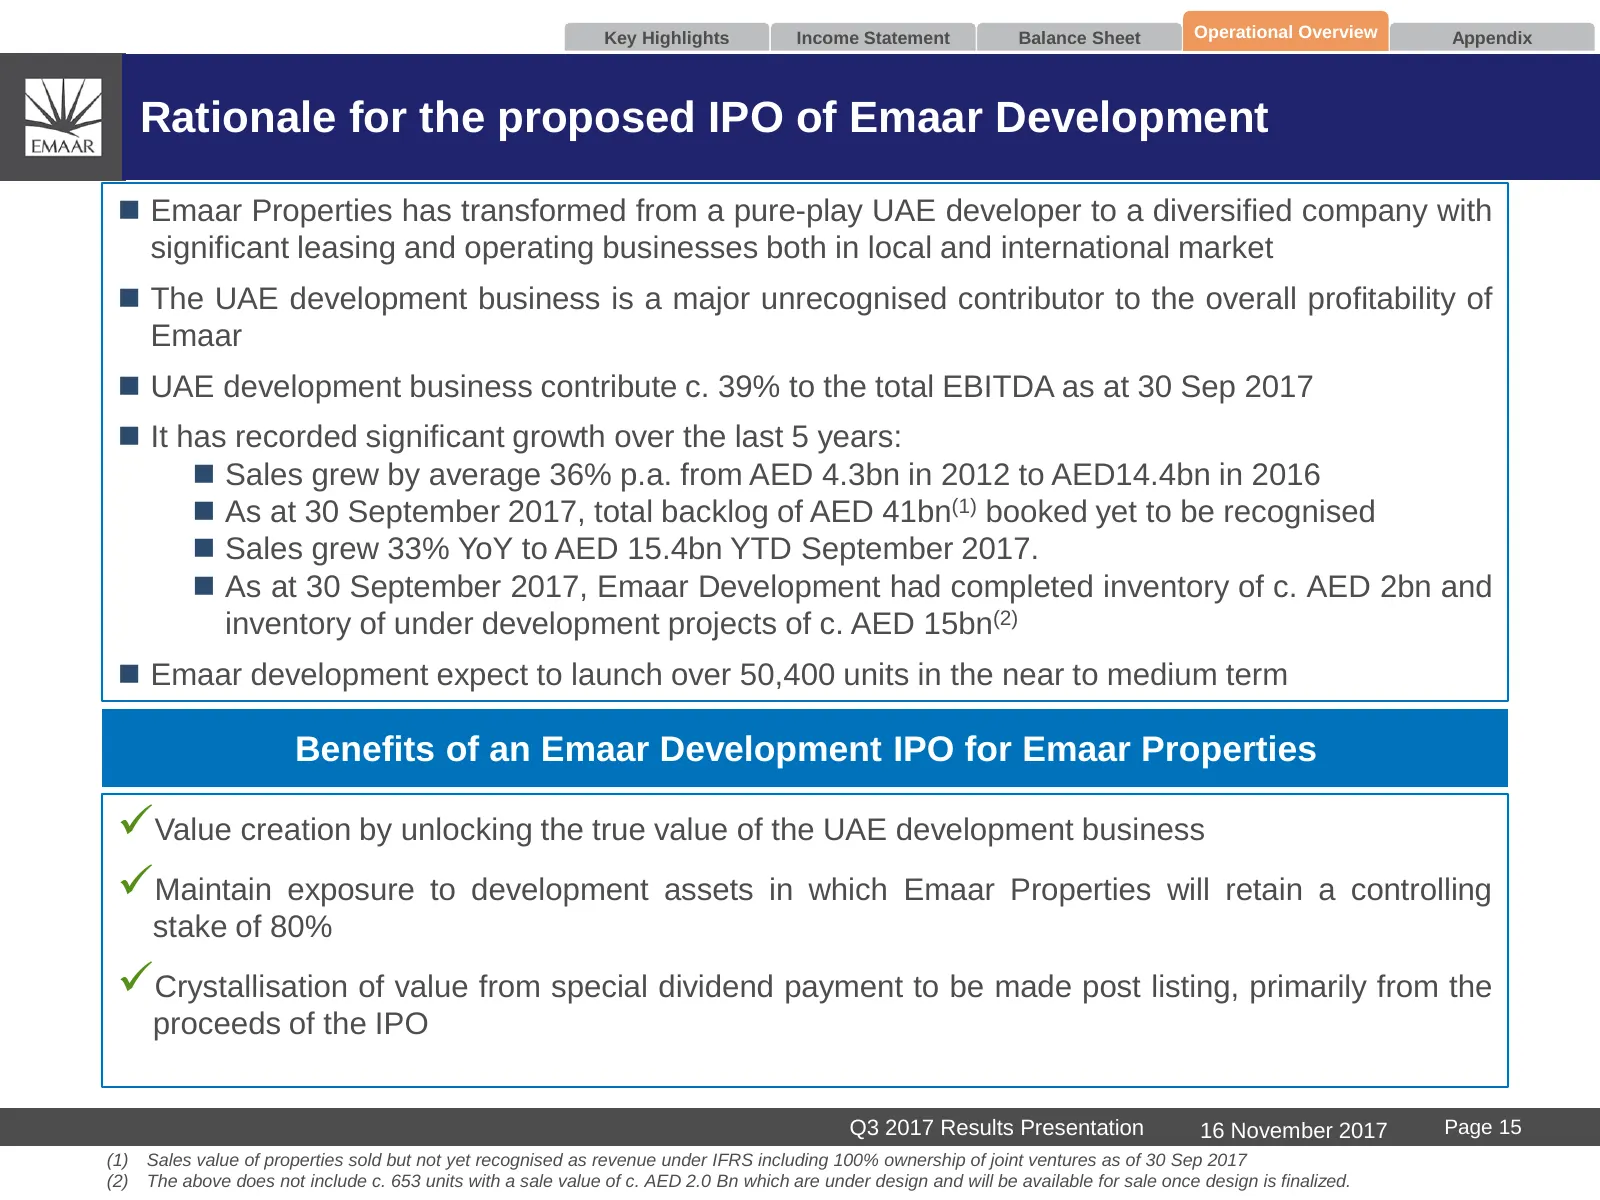
Key Highlights Income Statement Balance Sheet Operational Overview Appendix Rationale for the proposed IPO of Emaar Development Emaar Properties has transformed from a pure-play UAE developer to a diversified company with significant leasing and operating businesses both in local and international
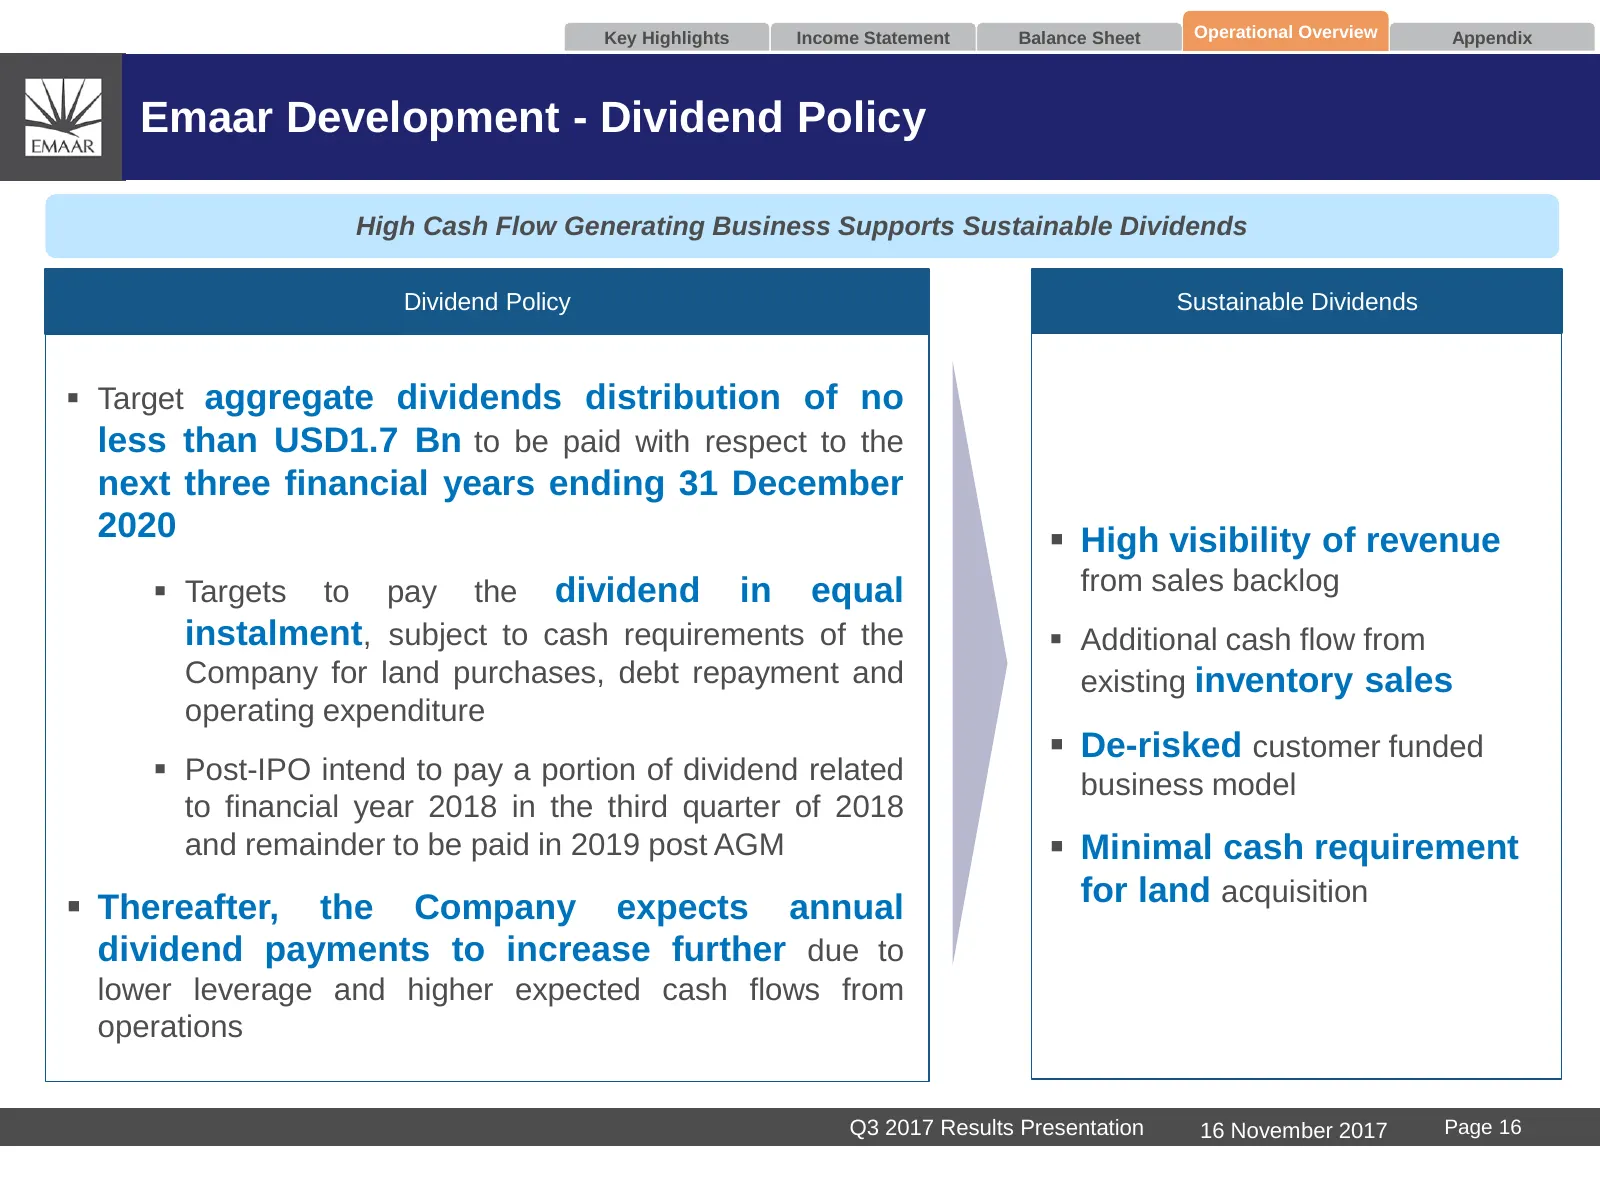
Slide 17: Emaar Development - Dividend Policy
Key Highlights Income Statement Balance Sheet Operational Overview Appendix Emaar Development - Dividend Policy High Cash Flow Generating Business Supports Sustainable Dividends Dividend Policy Sustainable Dividends Target aggregate dividends distribution of no less than USD1.7 Bn to be paid with
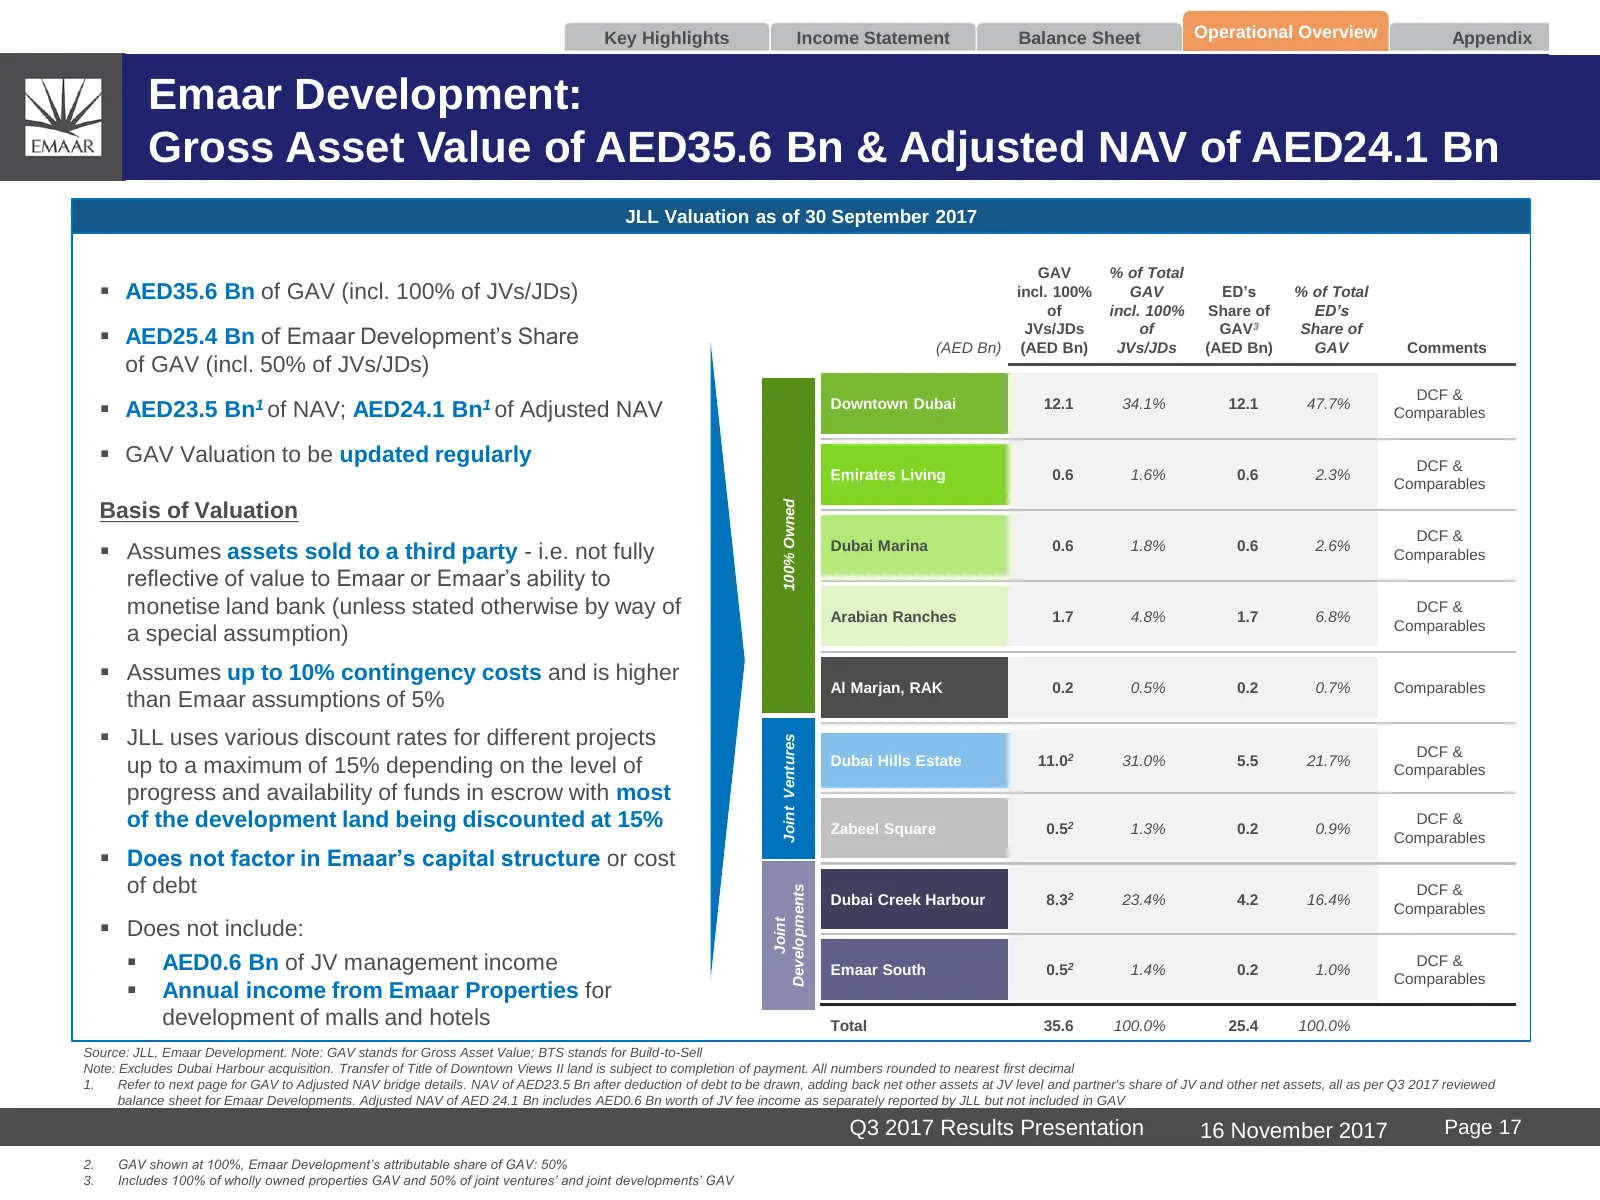
Slide 18: Emaar Development: GAV of AED35.6 Bn & Adjusted NAV of AED24.1 Bn
Key Highlights Income Statement Balance Sheet Operational Overview Appendix Emaar Development: Gross Asset Value of AED35.6 Bn & Adjusted NAV of AED24.1 Bn JLL Valuation as of 30 September 2017 GAV % of Total AED35.6 Bn of GAV (incl. 100% of JVs/JDs) incl. 100% GAV ED’s % of Total of incl. 100% Sh
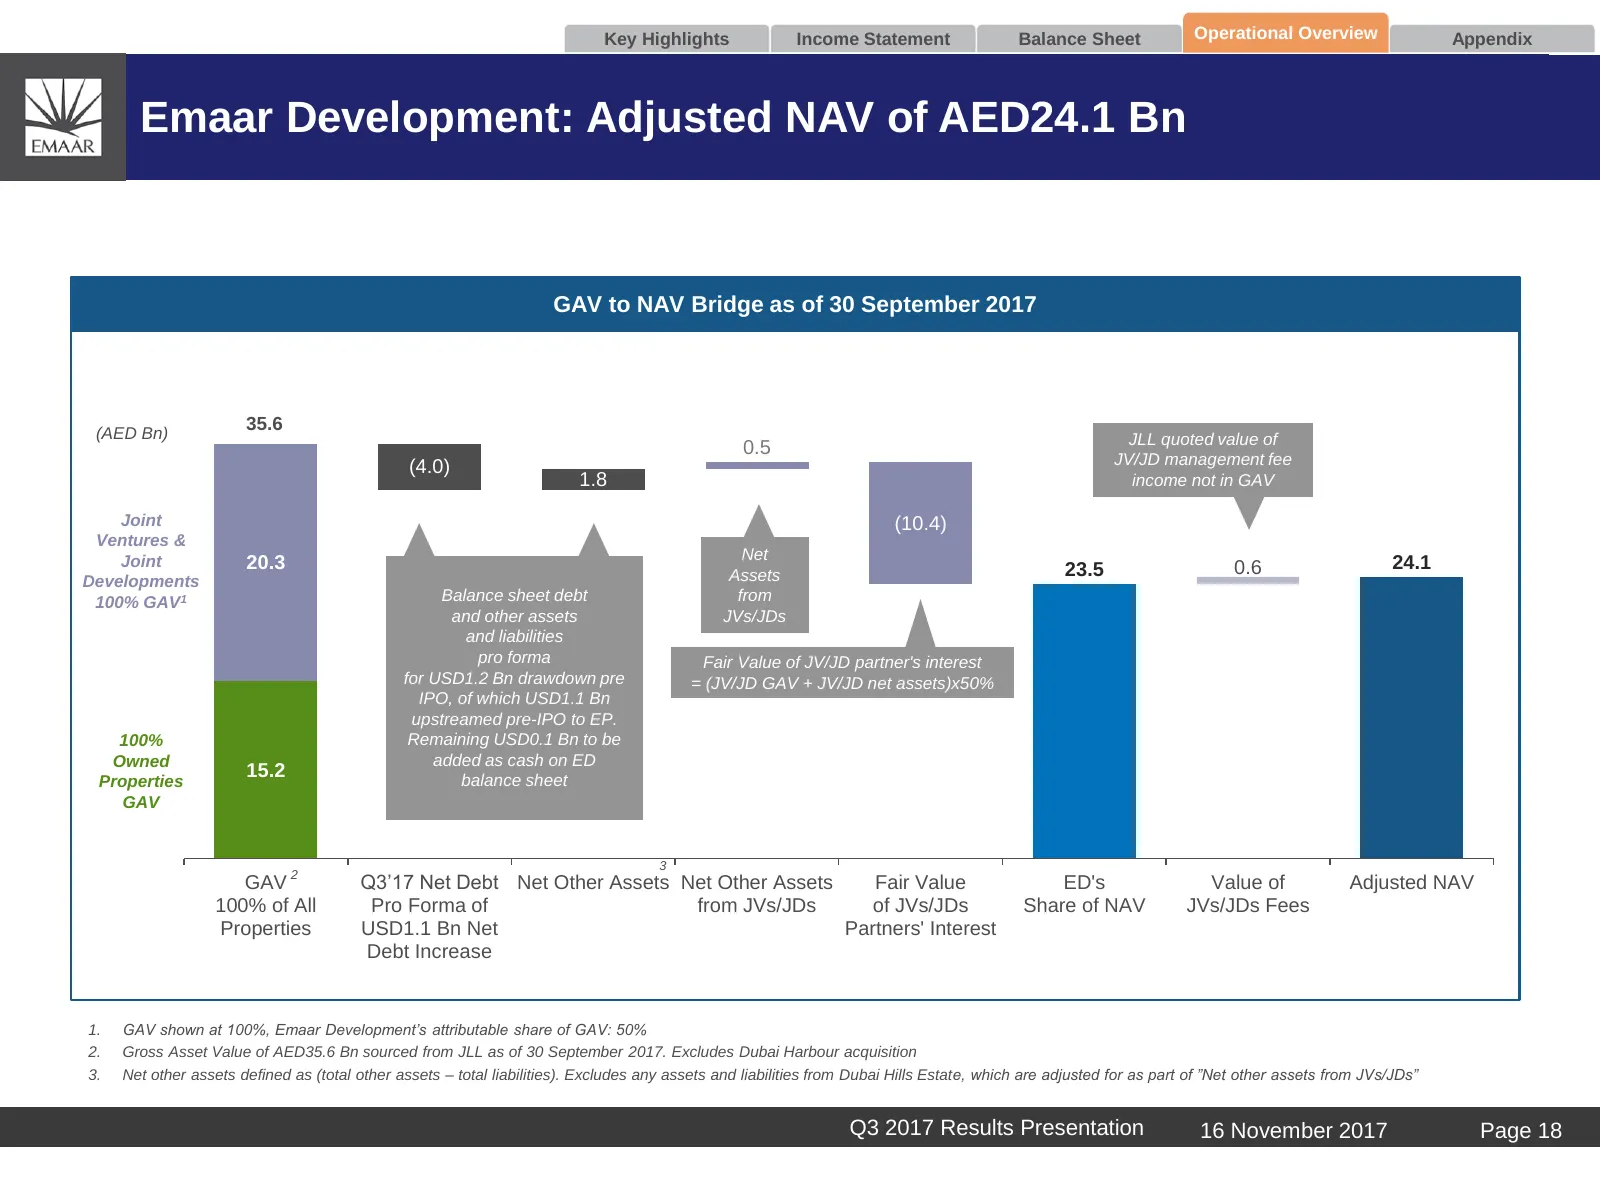
Slide 19: Emaar Development: Adjusted NAV of AED24.1 Bn
Key Highlights Income Statement Balance Sheet Operational Overview Appendix Emaar Development: Adjusted NAV of AED24.1 Bn GAV to NAV Bridge as of 30 September 2017 (AED Bn) 35.6 JLL quoted value of 0.5 (4.0) JV/JD management fee 1.8 income not in GAV Joint (10.4) Ventures & Joint Net 20.3 23.5 0.6 2
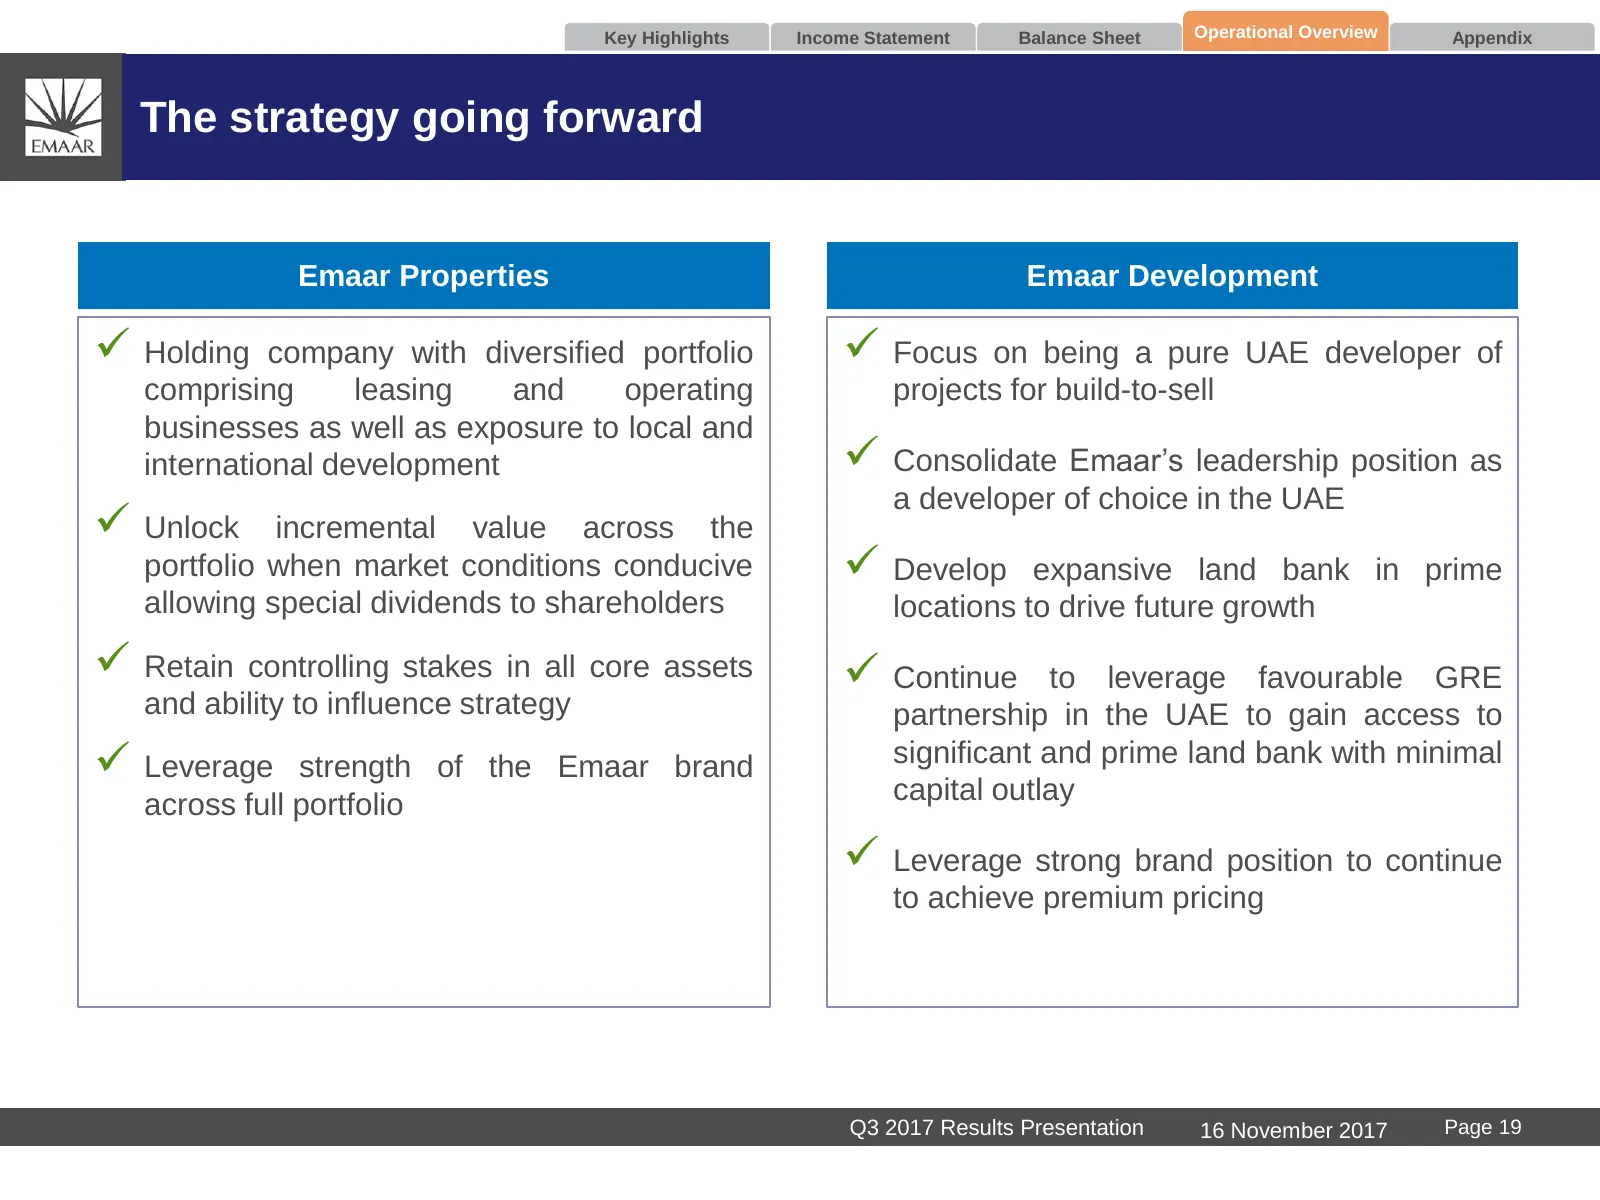
Slide 20: The strategy going forward
Key Highlights Income Statement Balance Sheet Operational Overview Appendix The strategy going forward Emaar Properties Emaar Development Holding company with diversified portfolio Focus on being a pure UAE developer of comprising leasing and operating projects for build-to-sell businesses as we
Slide 21: International Development
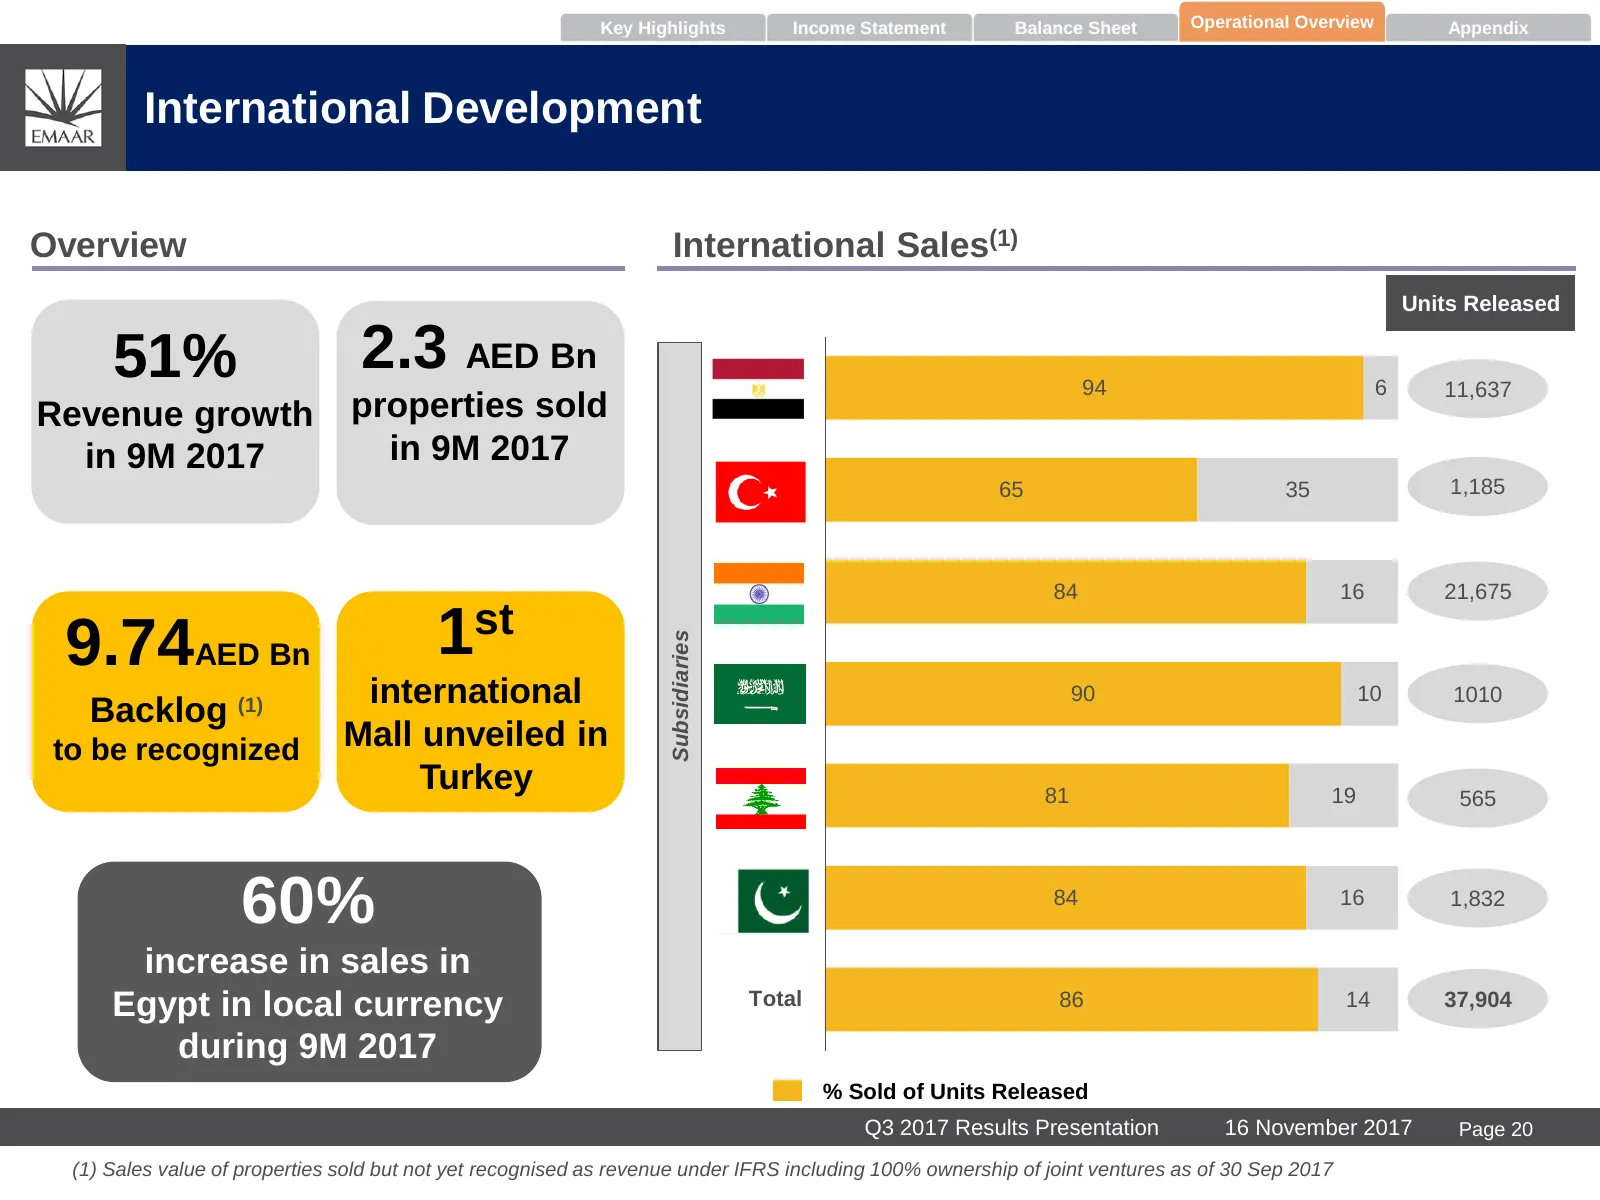
Key Highlights Income Statement Balance Sheet Operational Overview Appendix International Development Overview International Sales(1) Units Released 51% 2.3 AED Bn Egy 94 6 11,637 Revenue growth properties sold pt in 9M 2017 in 9M 2017 Turk 1,185 65 35 ey Indi 84 16 21,675 a 9.74AED Bn 1st Subsidiar
Slide 22: Emaar Malls
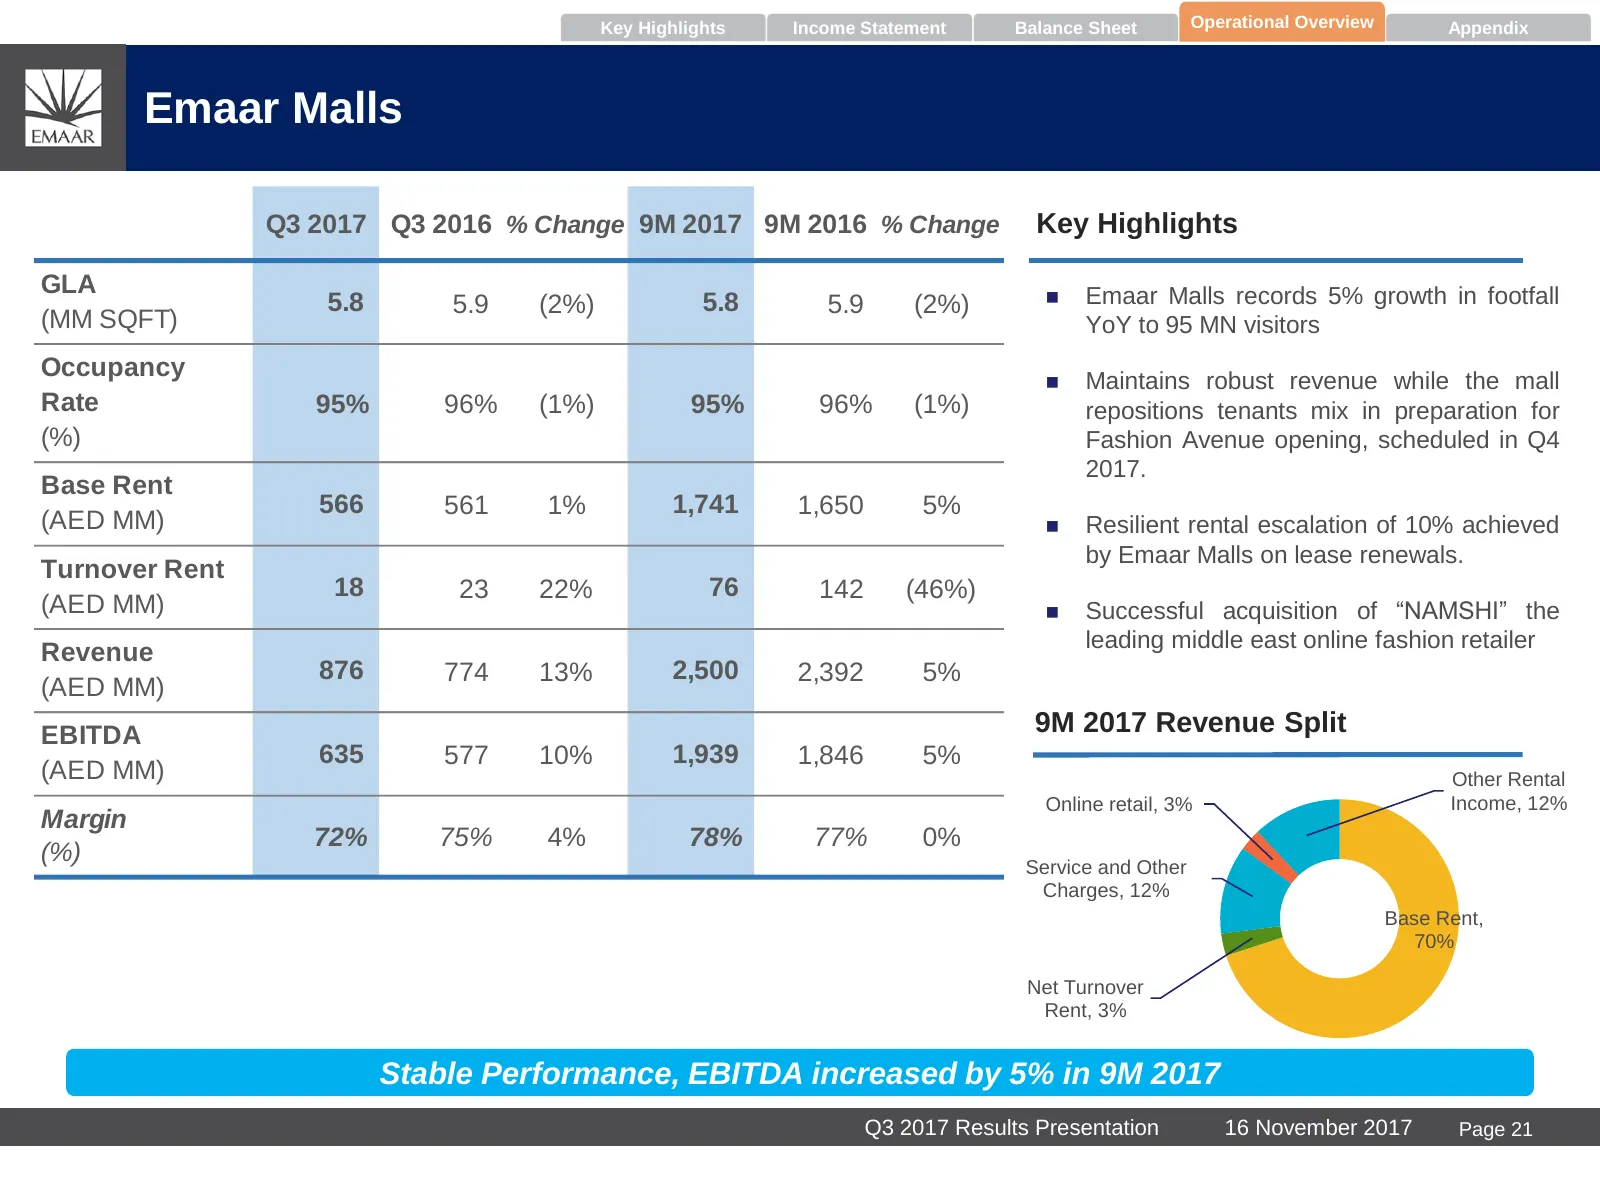
Key Highlights Income Statement Balance Sheet Operational Overview Appendix Emaar Malls Q3 2017 Q3 2016 % Change 9M 2017 9M 2016 % Change Key Highlights GLA Emaar Malls records 5% growth in footfall 5.8 5.9 (2%) 5.8 5.9 (2%) (MM SQFT) YoY to 95 MN visitors Occupancy Maintains robust revenue whil
Slide 23: The Dubai Mall Expansions
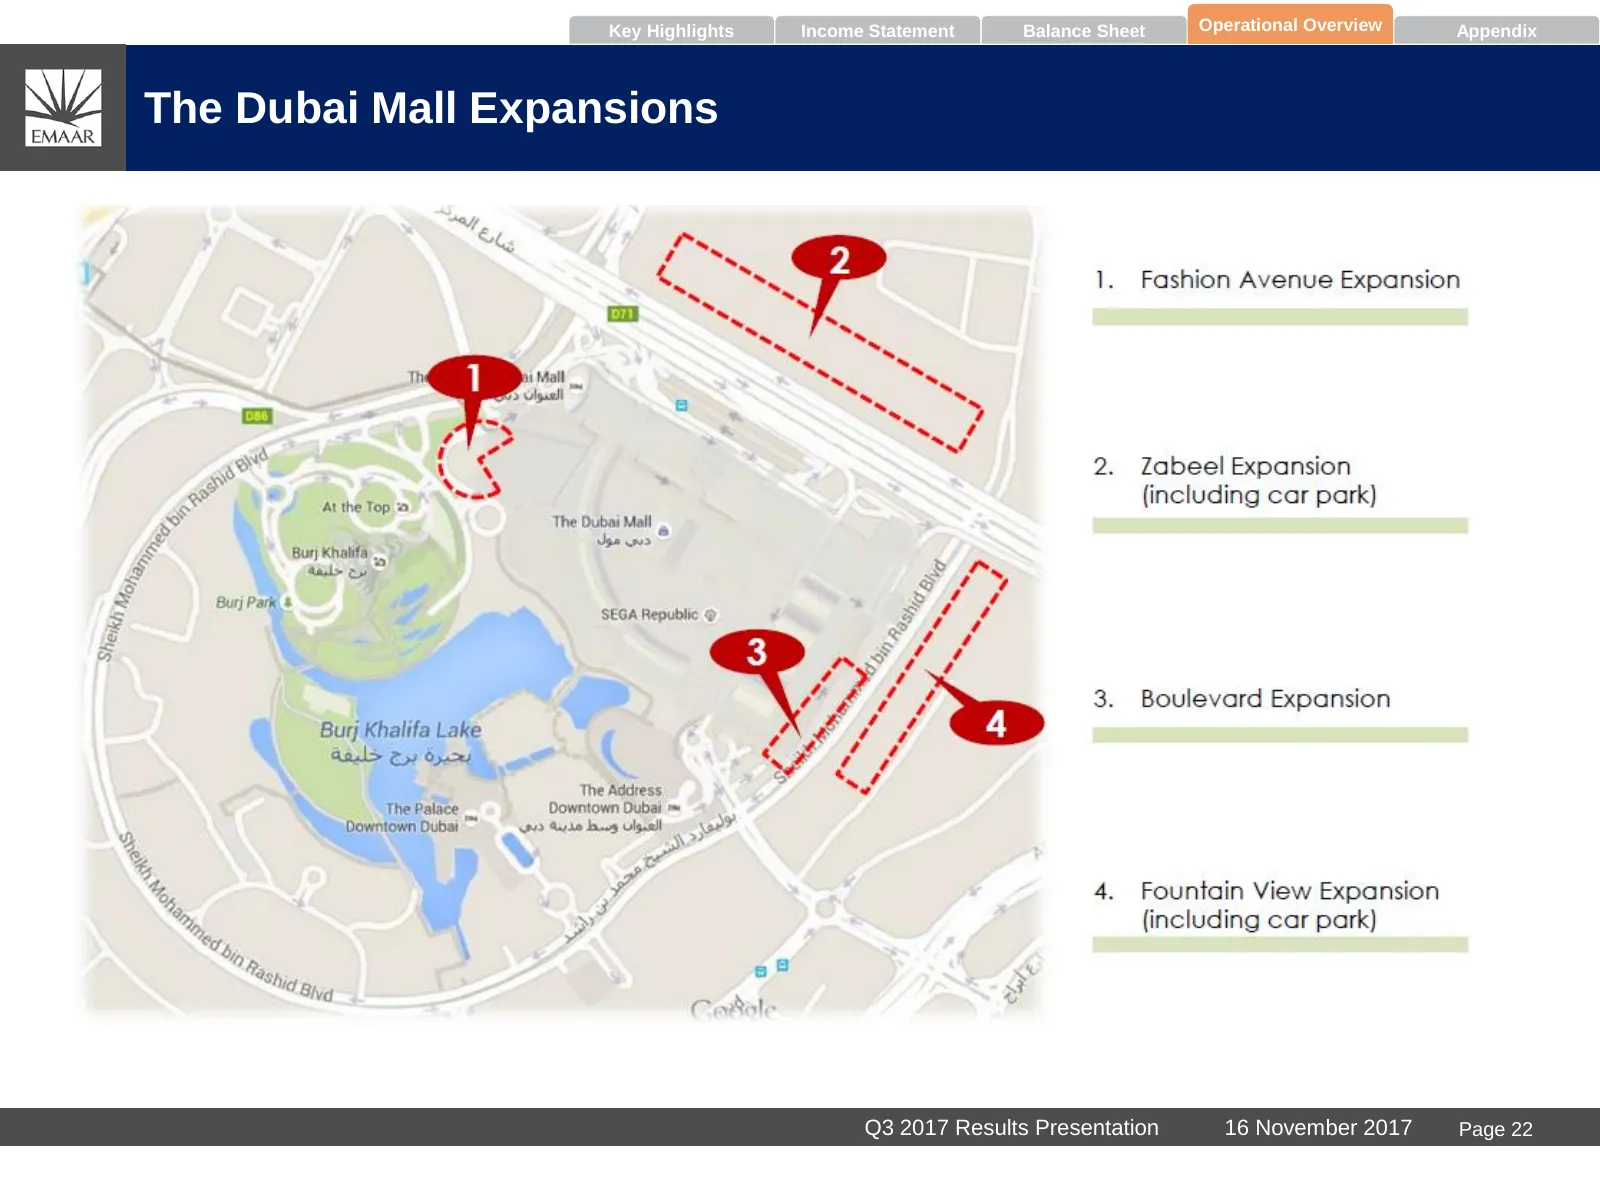
Key Highlights Income Statement Balance Sheet Operational Overview Appendix The Dubai Mall Expansions Q3 2017 Results Presentation 16 November 2017 Page 22
Slide 24: Emaar Hospitality Group
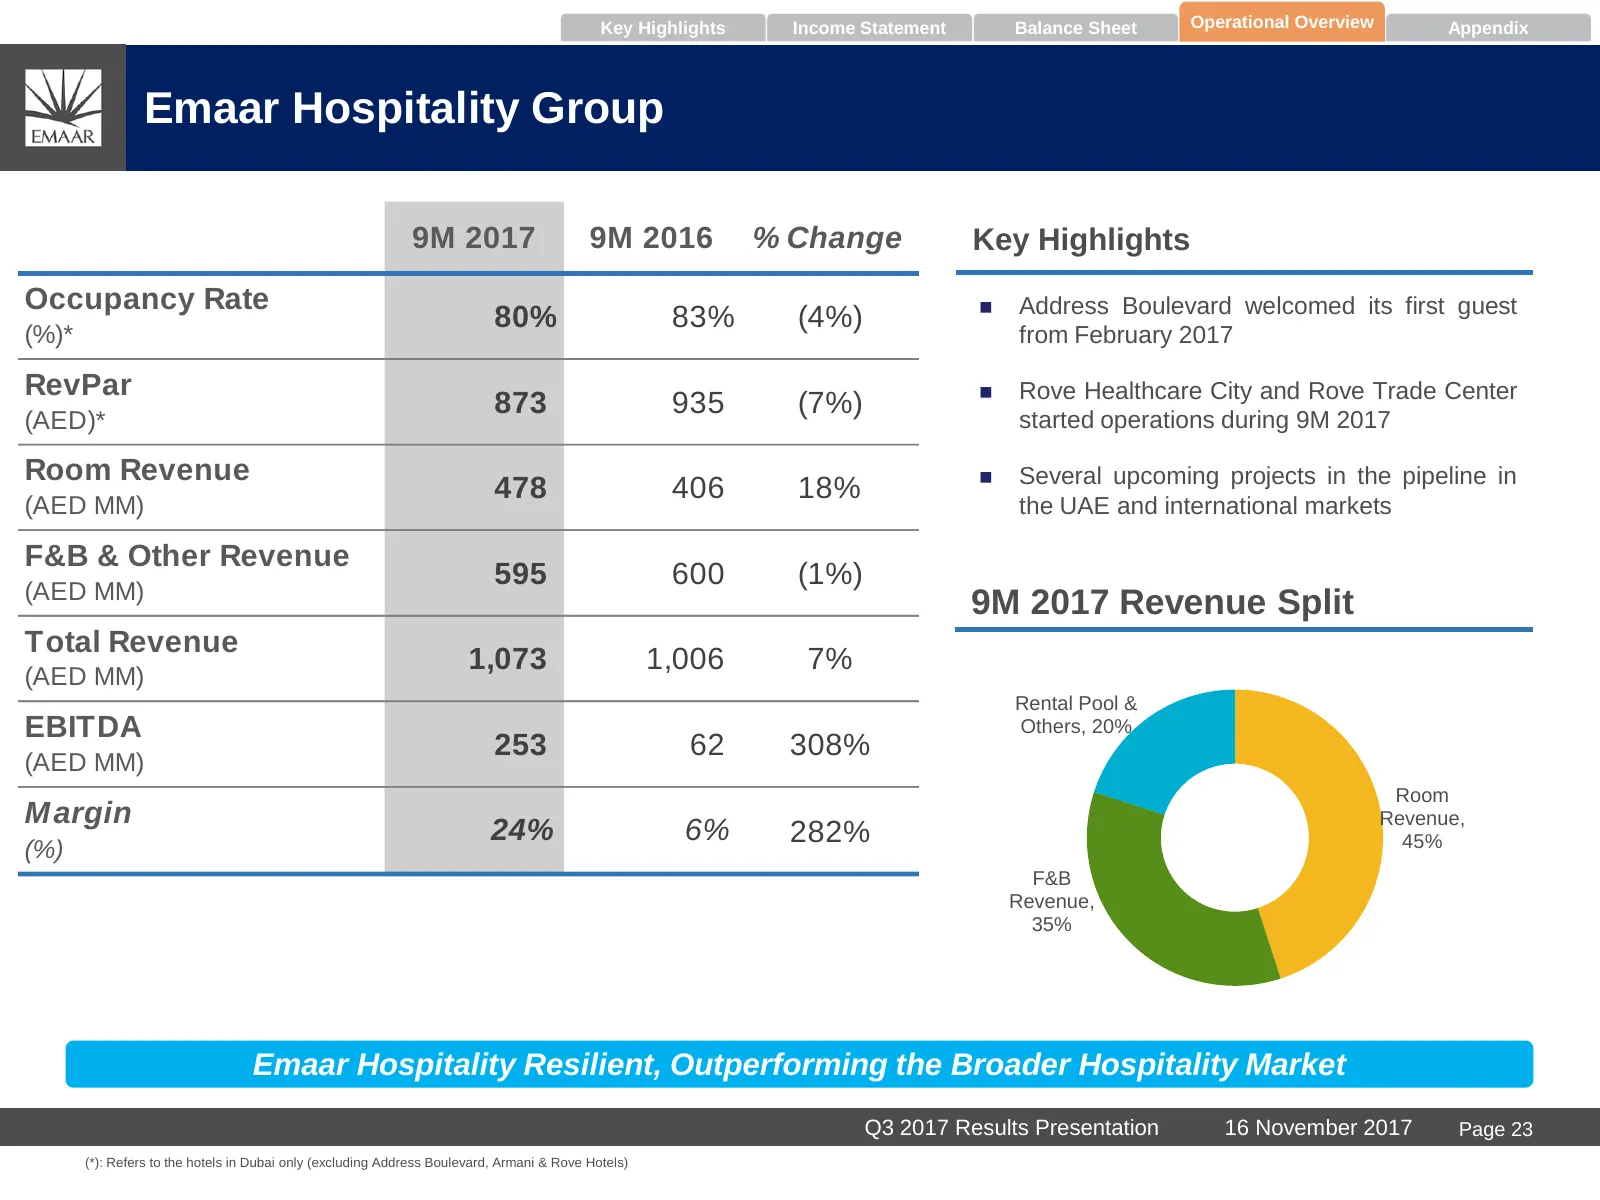
Key Highlights Income Statement Balance Sheet Operational Overview Appendix Emaar Hospitality Group 9M 2017 9M 2016 % Change Key Highlights Occupancy Rate Address Boulevard welcomed its first guest 80% 83% (4%) (%)* from February 2017 RevPar Rove Healthcare City and Rove Trade Center 873 935 (7%
Slide 25: Emaar Misr for Development
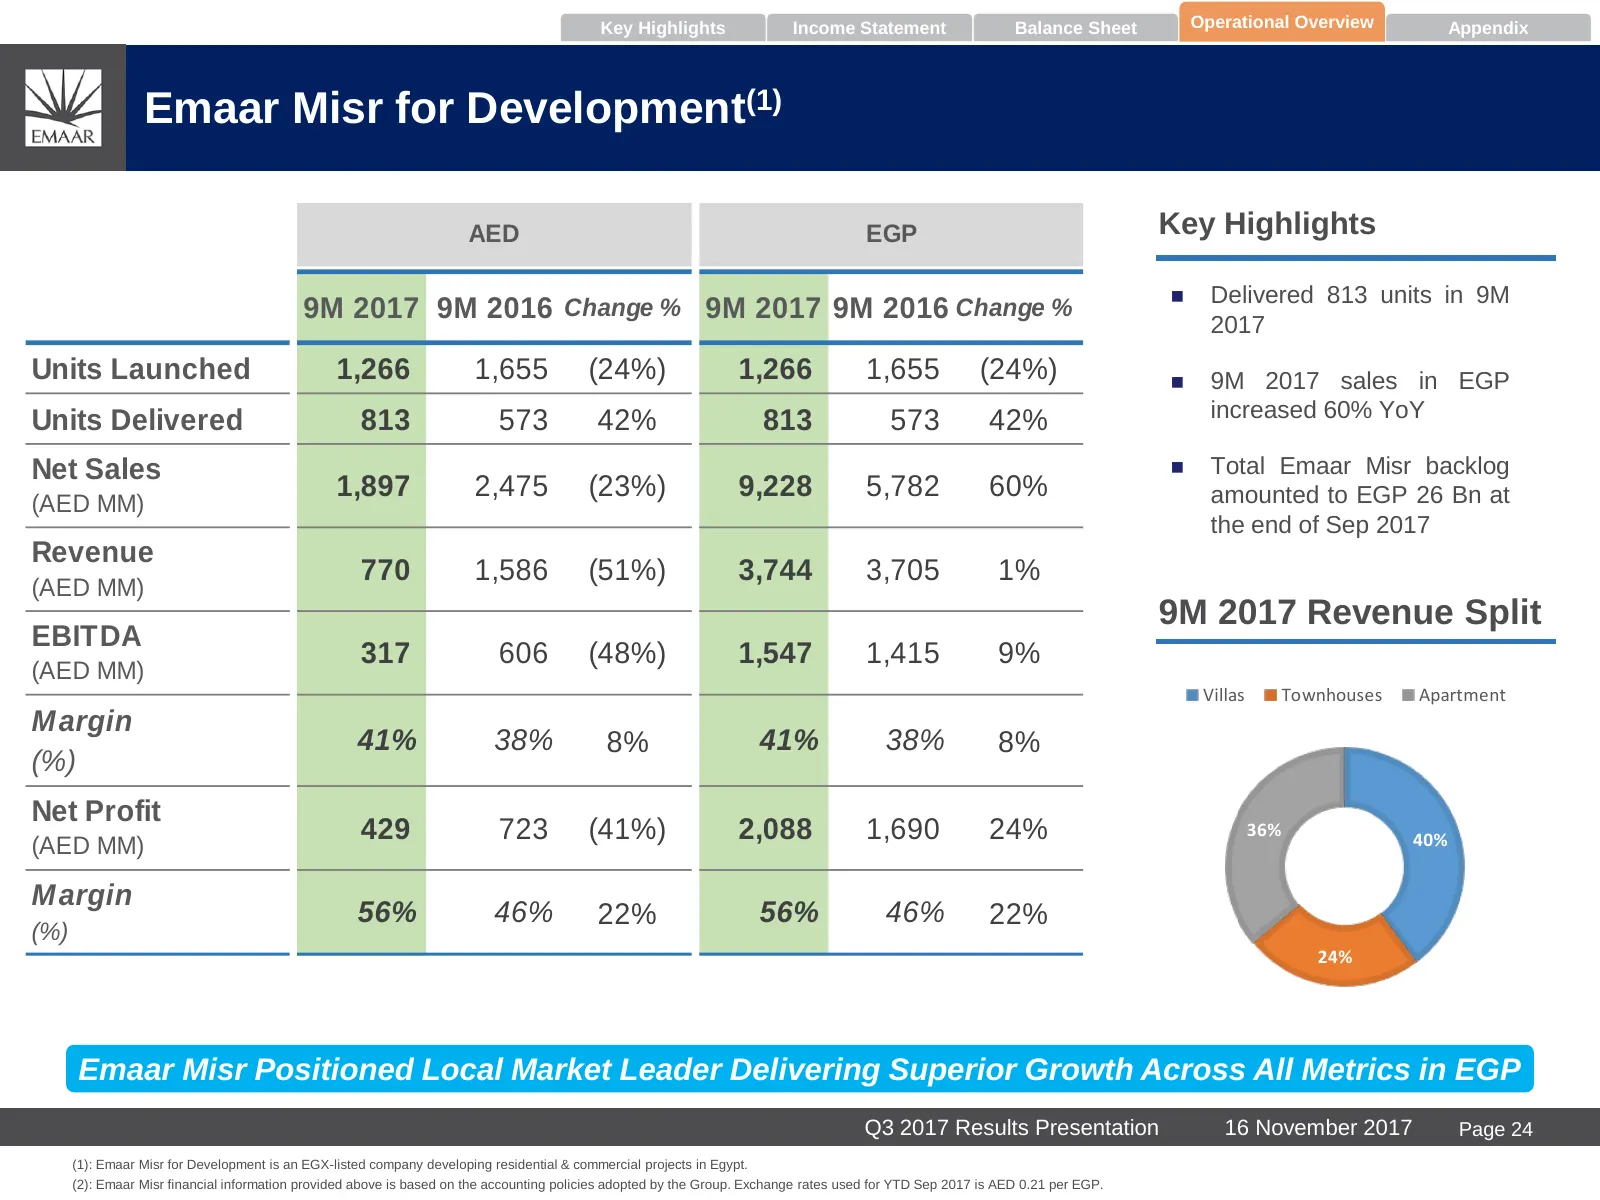
Key Highlights Income Statement Balance Sheet Operational Overview Appendix Emaar Misr for Development(1) AED EGP Key Highlights Delivered 813 units in 9M 9M 2017 9M 2016 Change % 9M 2017 9M 2016 Change % 2017 Units Launched 1,266 1,655 (24%) 1,266 1,655 (24%) 9M 2017 sales in EGP Units Delivere
Slide 26: Summary
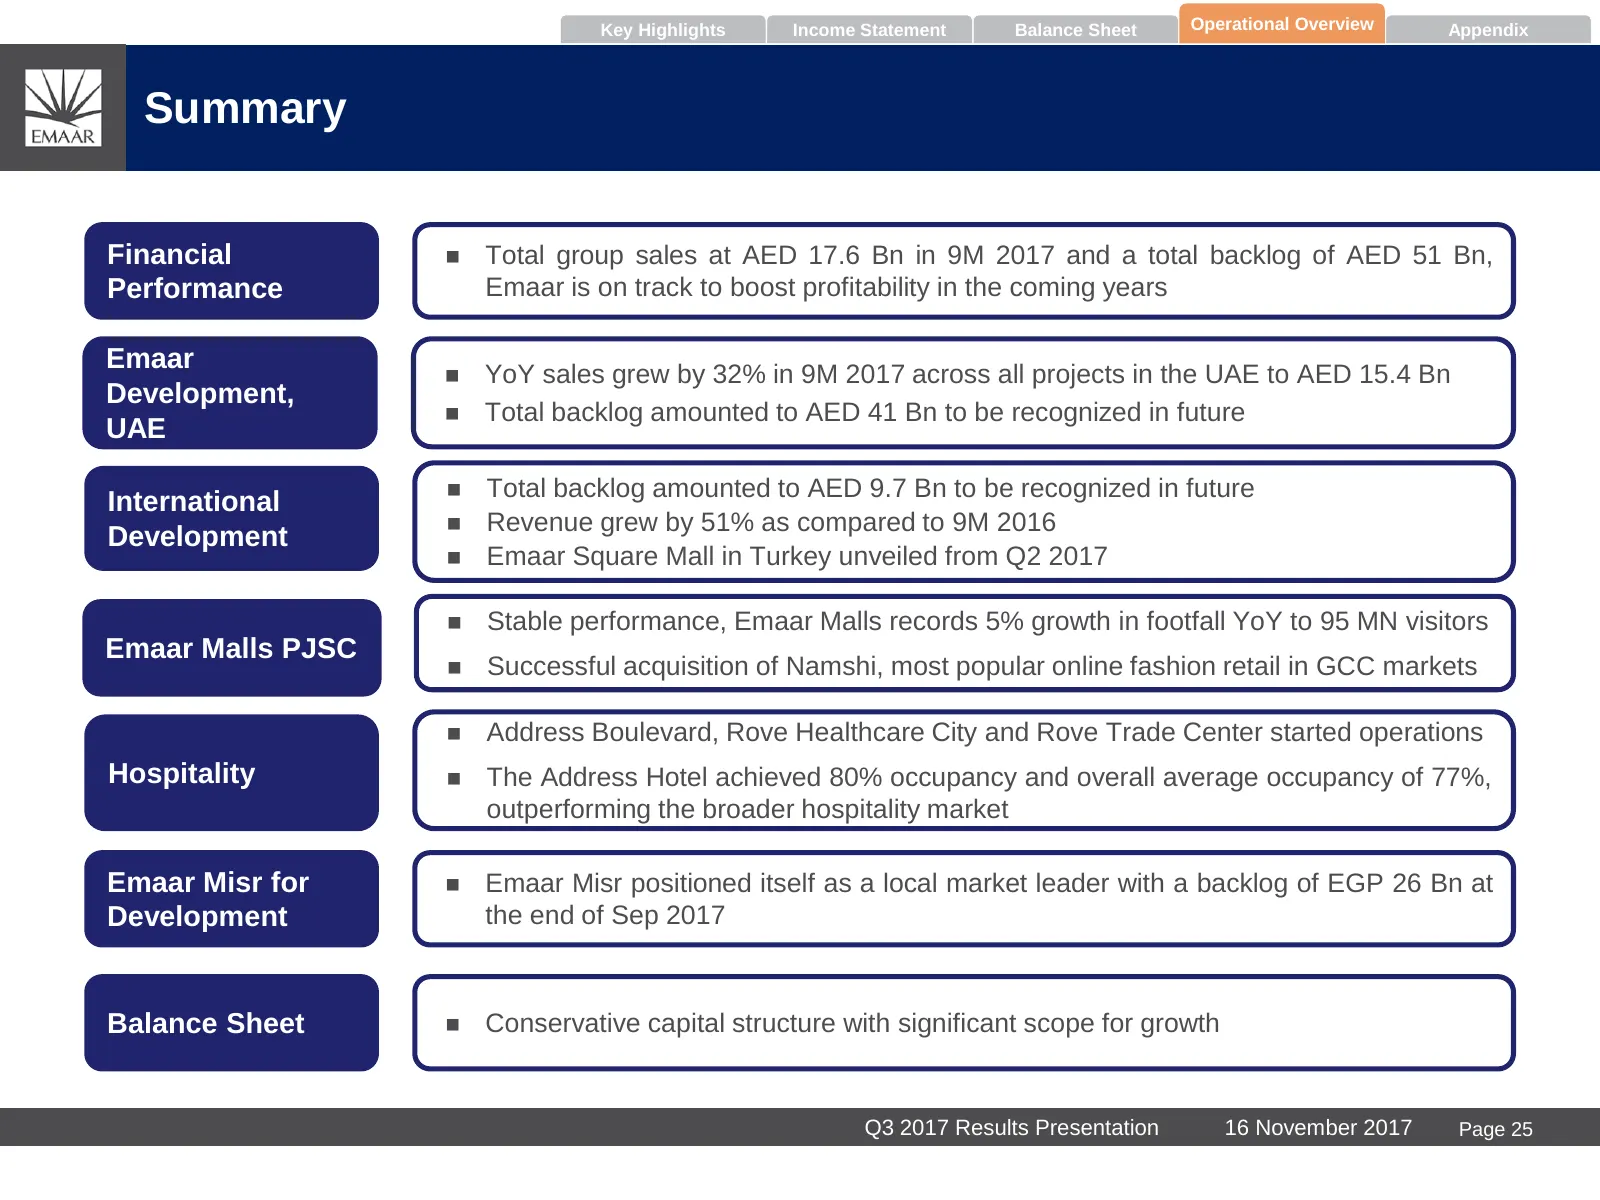
Key Highlights Income Statement Balance Sheet Operational Overview Appendix Summary Financial Total group sales at AED 17.6 Bn in 9M 2017 and a total backlog of AED 51 Bn, Performance Emaar is on track to boost profitability in the coming years Emaar YoY sales grew by 32% in 9M 2017 across all p
Slide 27: Appendix
ph %! Appendix id rg ft NY mre
Slide 28: Appendix A – Overview of Divisions and Strategy
Appendix A – Overview of Divisions and Strategy 16 November Q3 2017 Results Presentation 2017 Page 27
Slide 29: Overview of Divisions of Emaar Properties
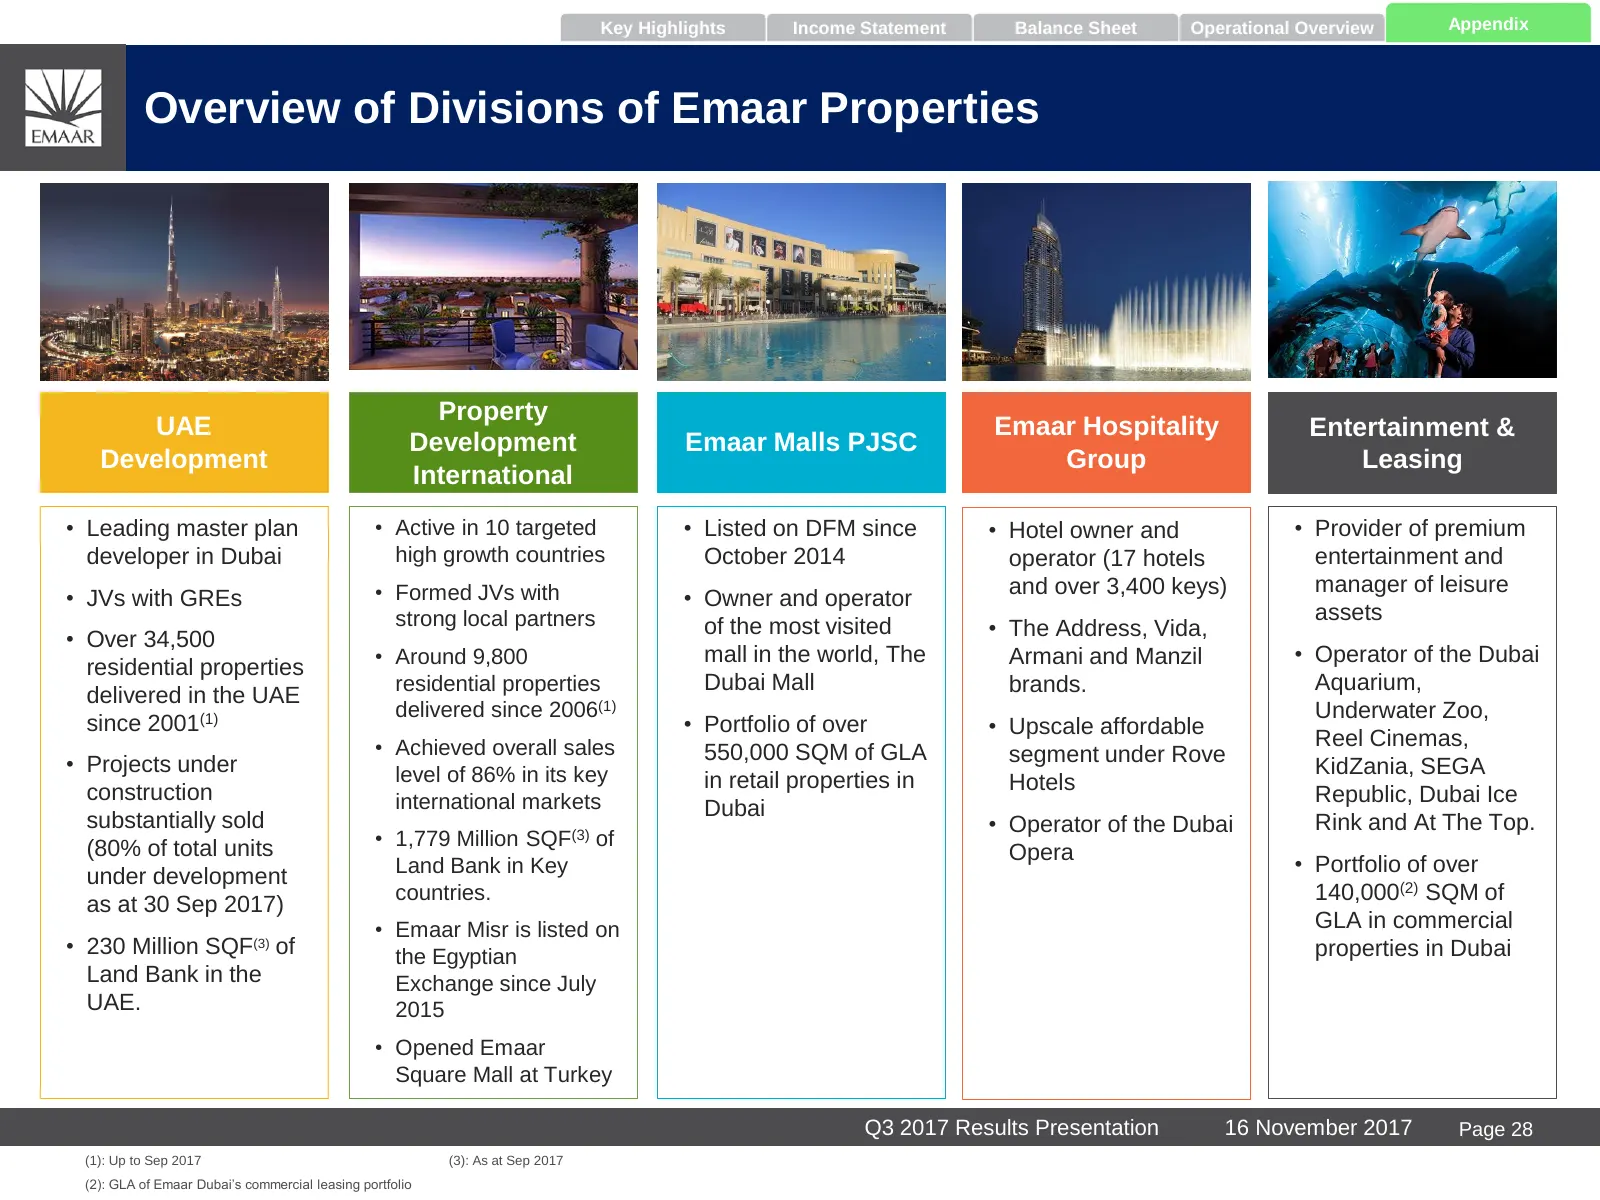
Key Highlights Income Statement Balance Sheet Operational Overview Appendix Overview of Divisions of Emaar Properties Property UAE Emaar Hospitality Entertainment & Development Emaar Malls PJSC Development Group Leasing International • Leading master plan • Active in 10 targeted • Listed on DFM sinc
Slide 30: Strategy
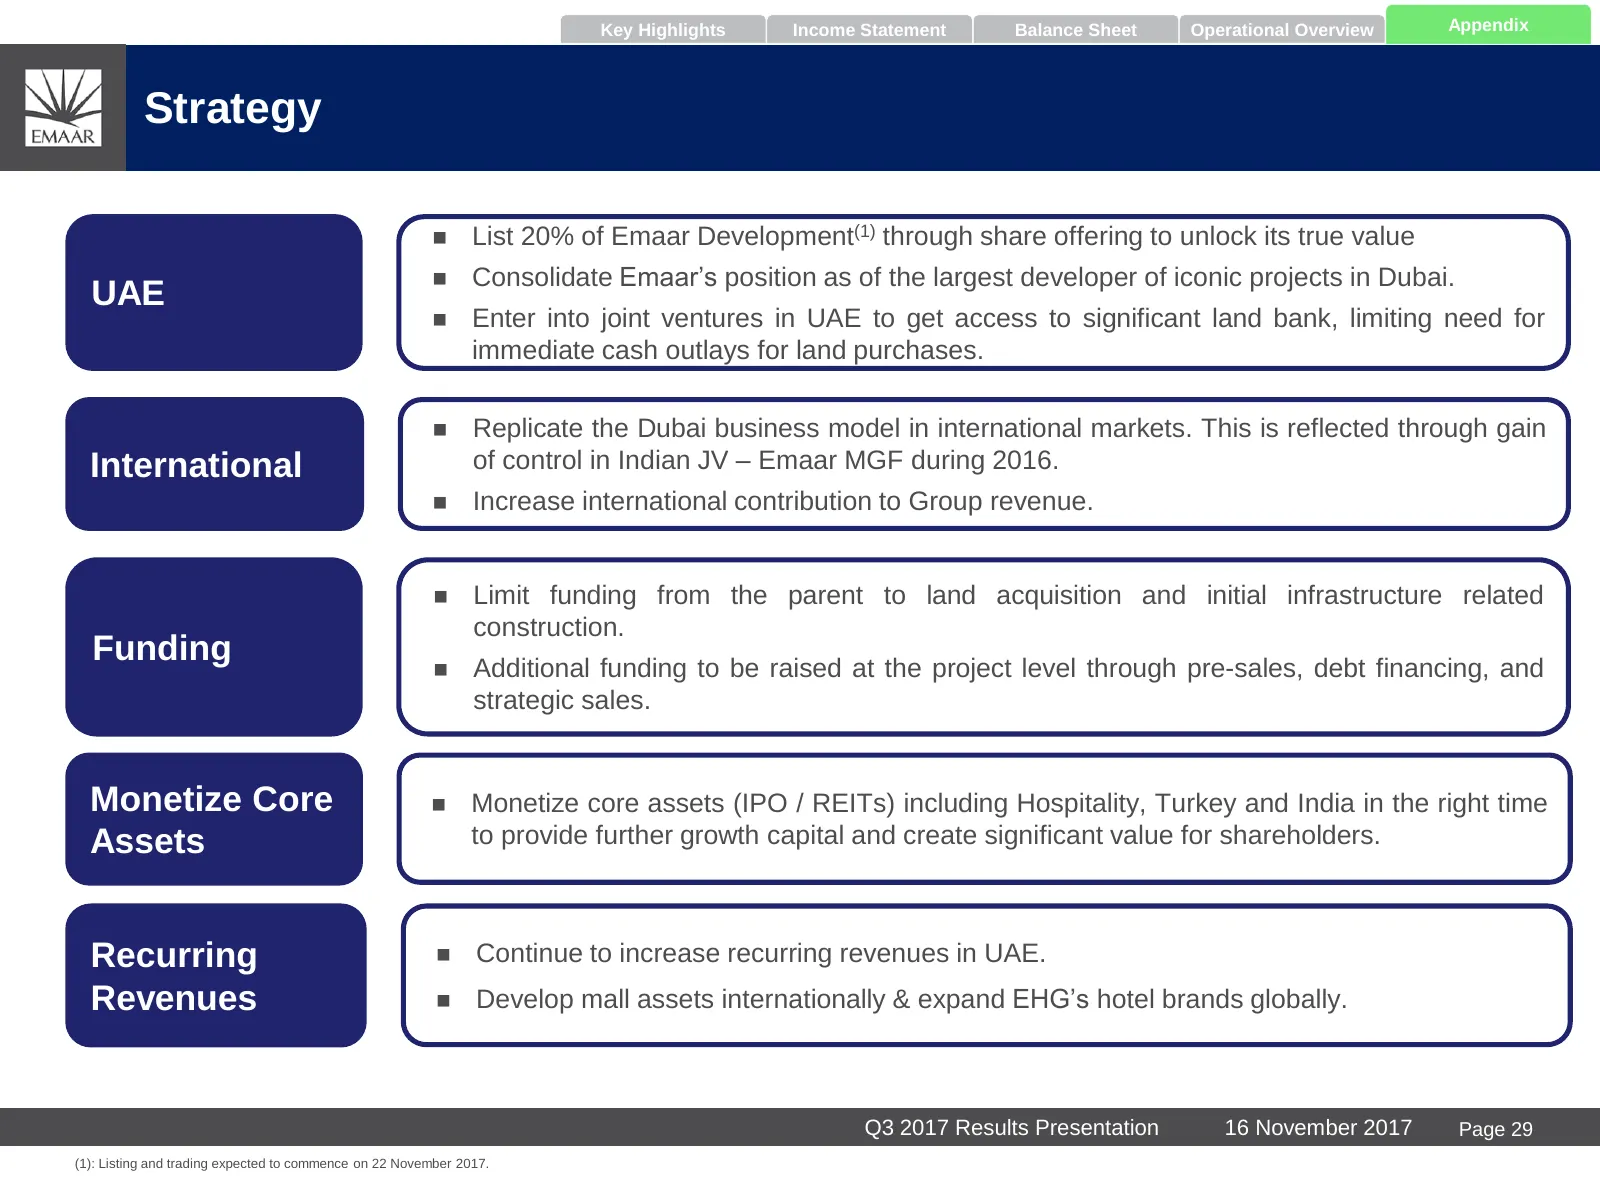
Key Highlights Income Statement Balance Sheet Operational Overview Appendix Strategy List 20% of Emaar Development(1) through share offering to unlock its true value Consolidate Emaar’s position as of the largest developer of iconic projects in Dubai. UAE Enter into joint ventures in UAE to ge
Slide 31: Appendix B – Overview of Emaar Development
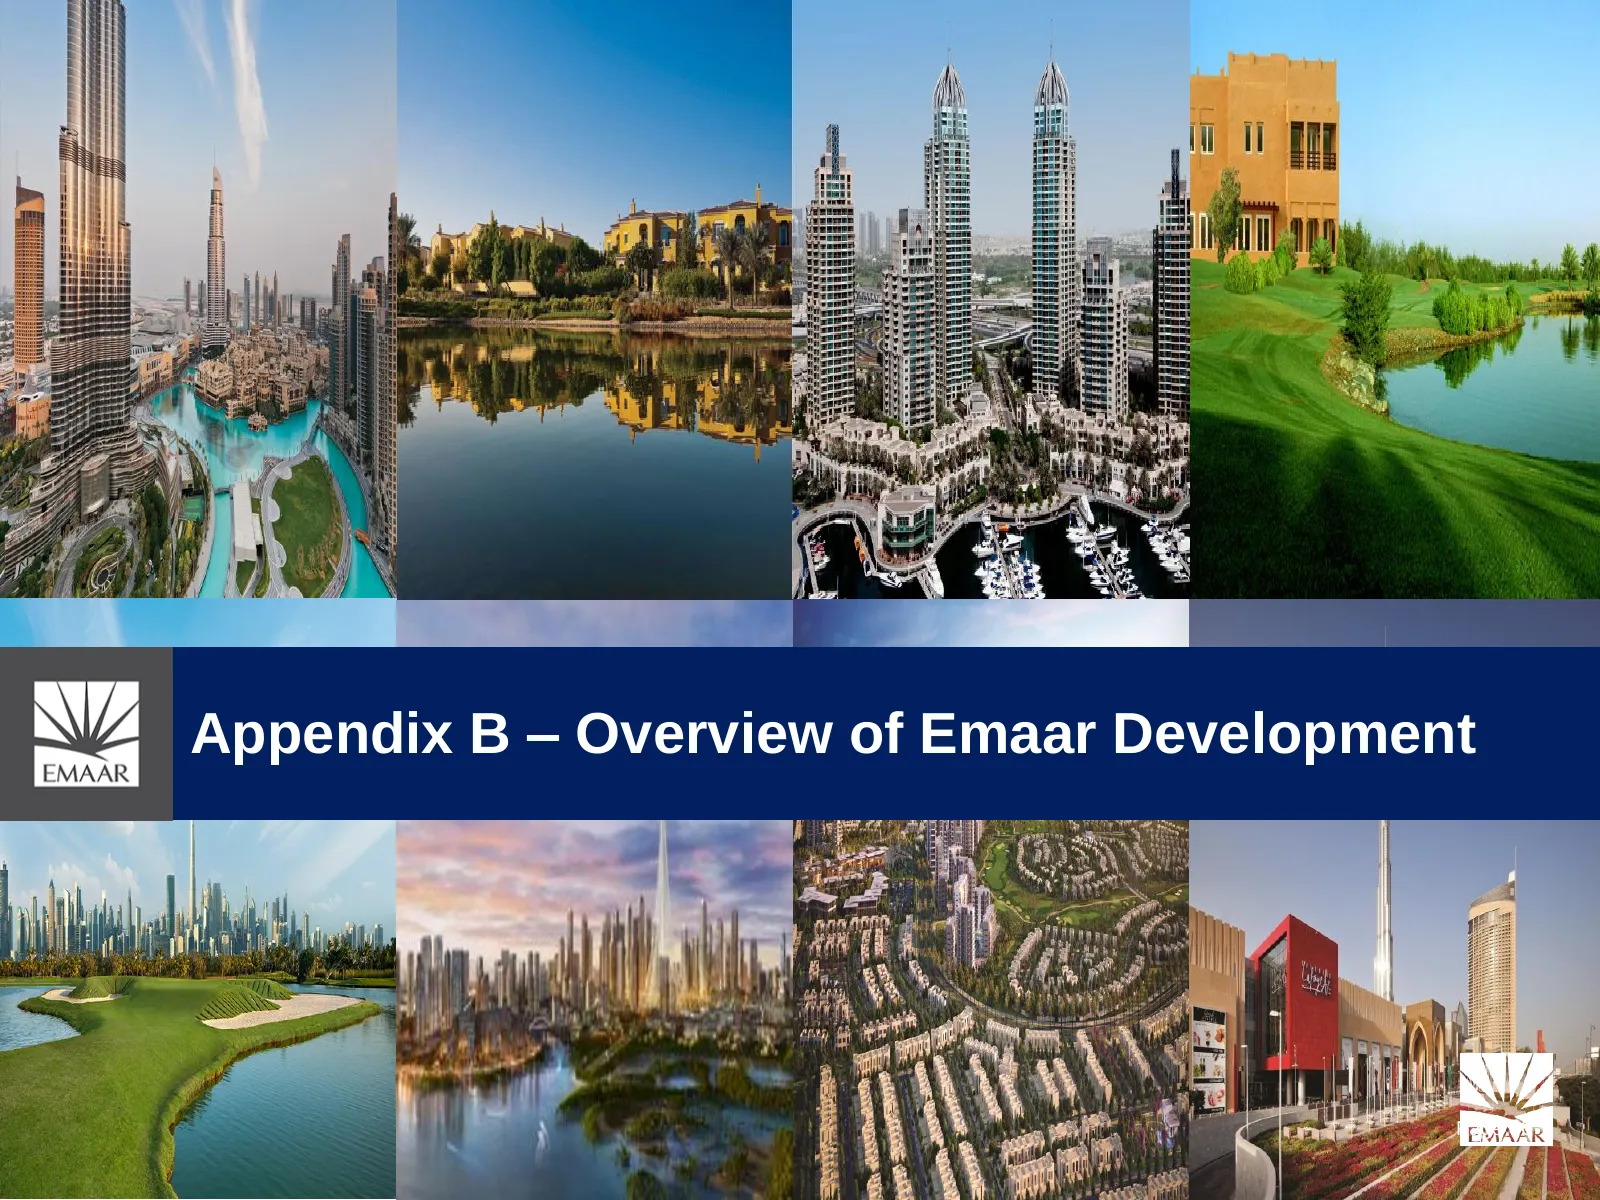
Appendix B – Overview of Emaar Development Page 30
Slide 32: Projects overview
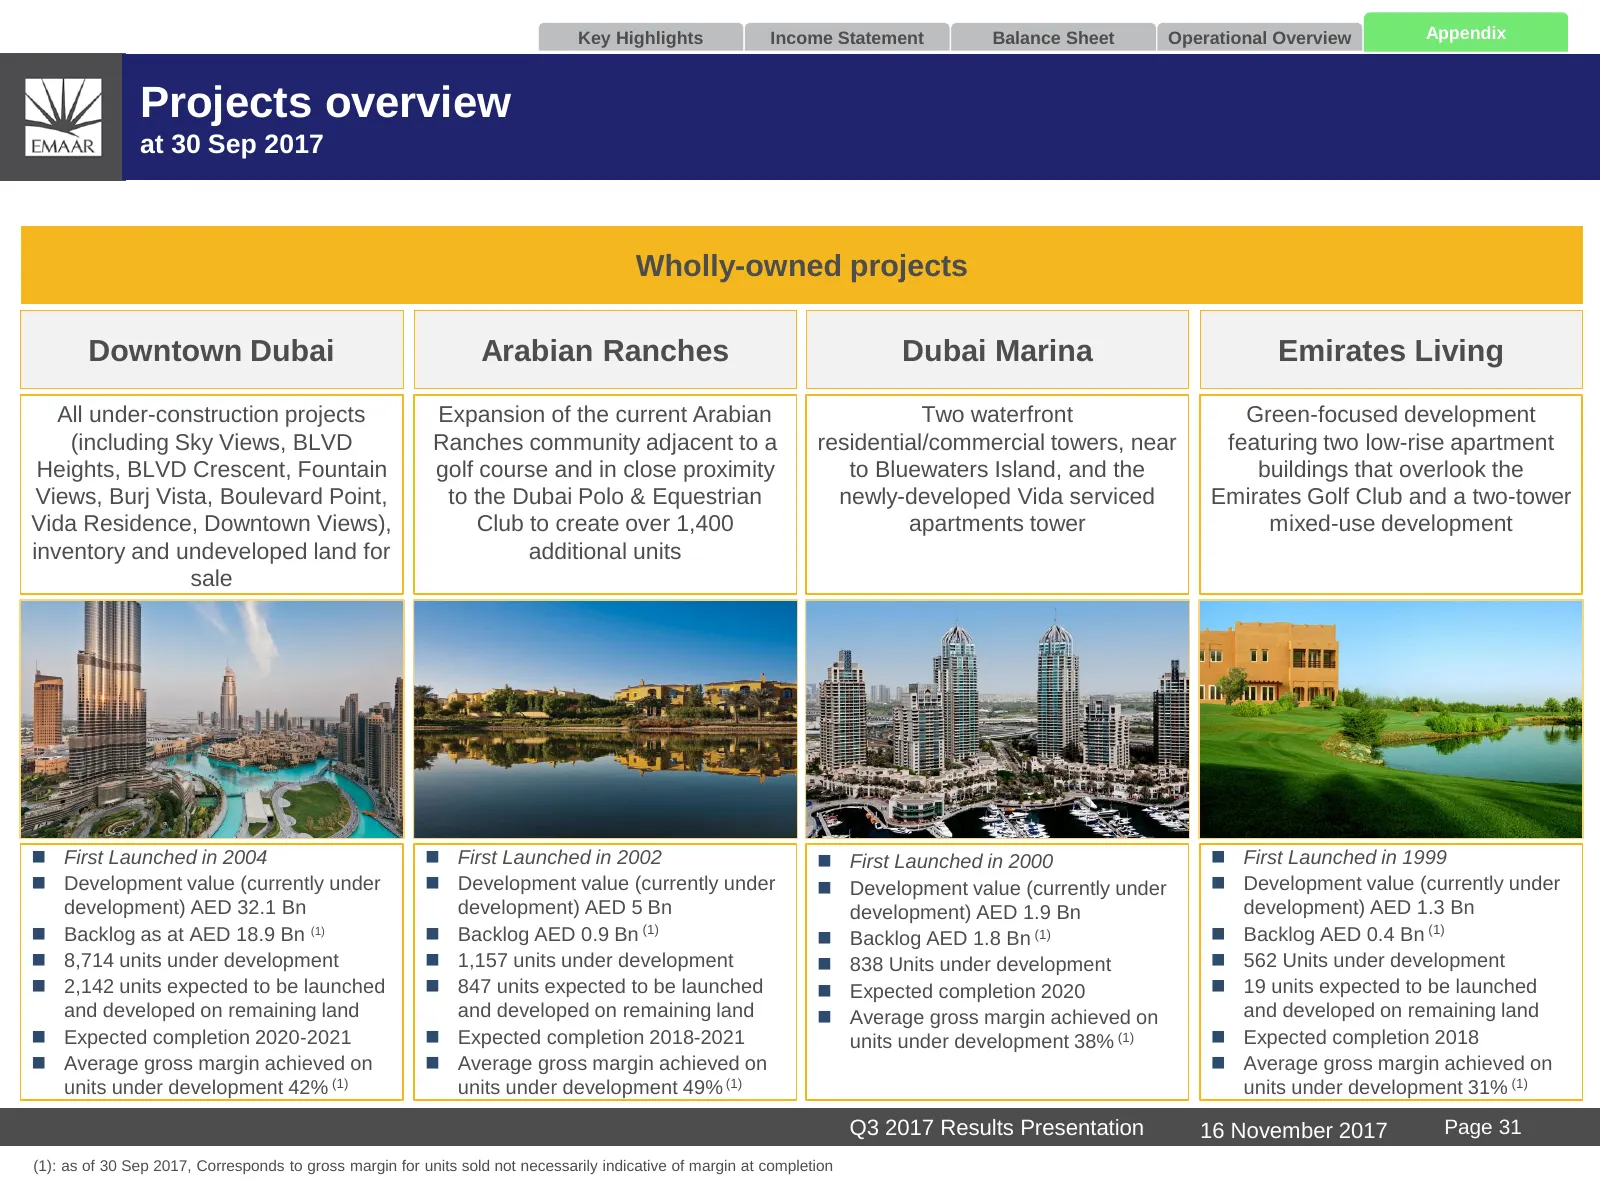
Key Highlights Income Statement Balance Sheet Operational Overview Appendix Projects overview at 30 Sep 2017 Wholly-owned projects Downtown Dubai Arabian Ranches Dubai Marina Emirates Living All under-construction projects Expansion of the current Arabian Two waterfront Green-focused development (in
Slide 33: Projects overview (cont’d)
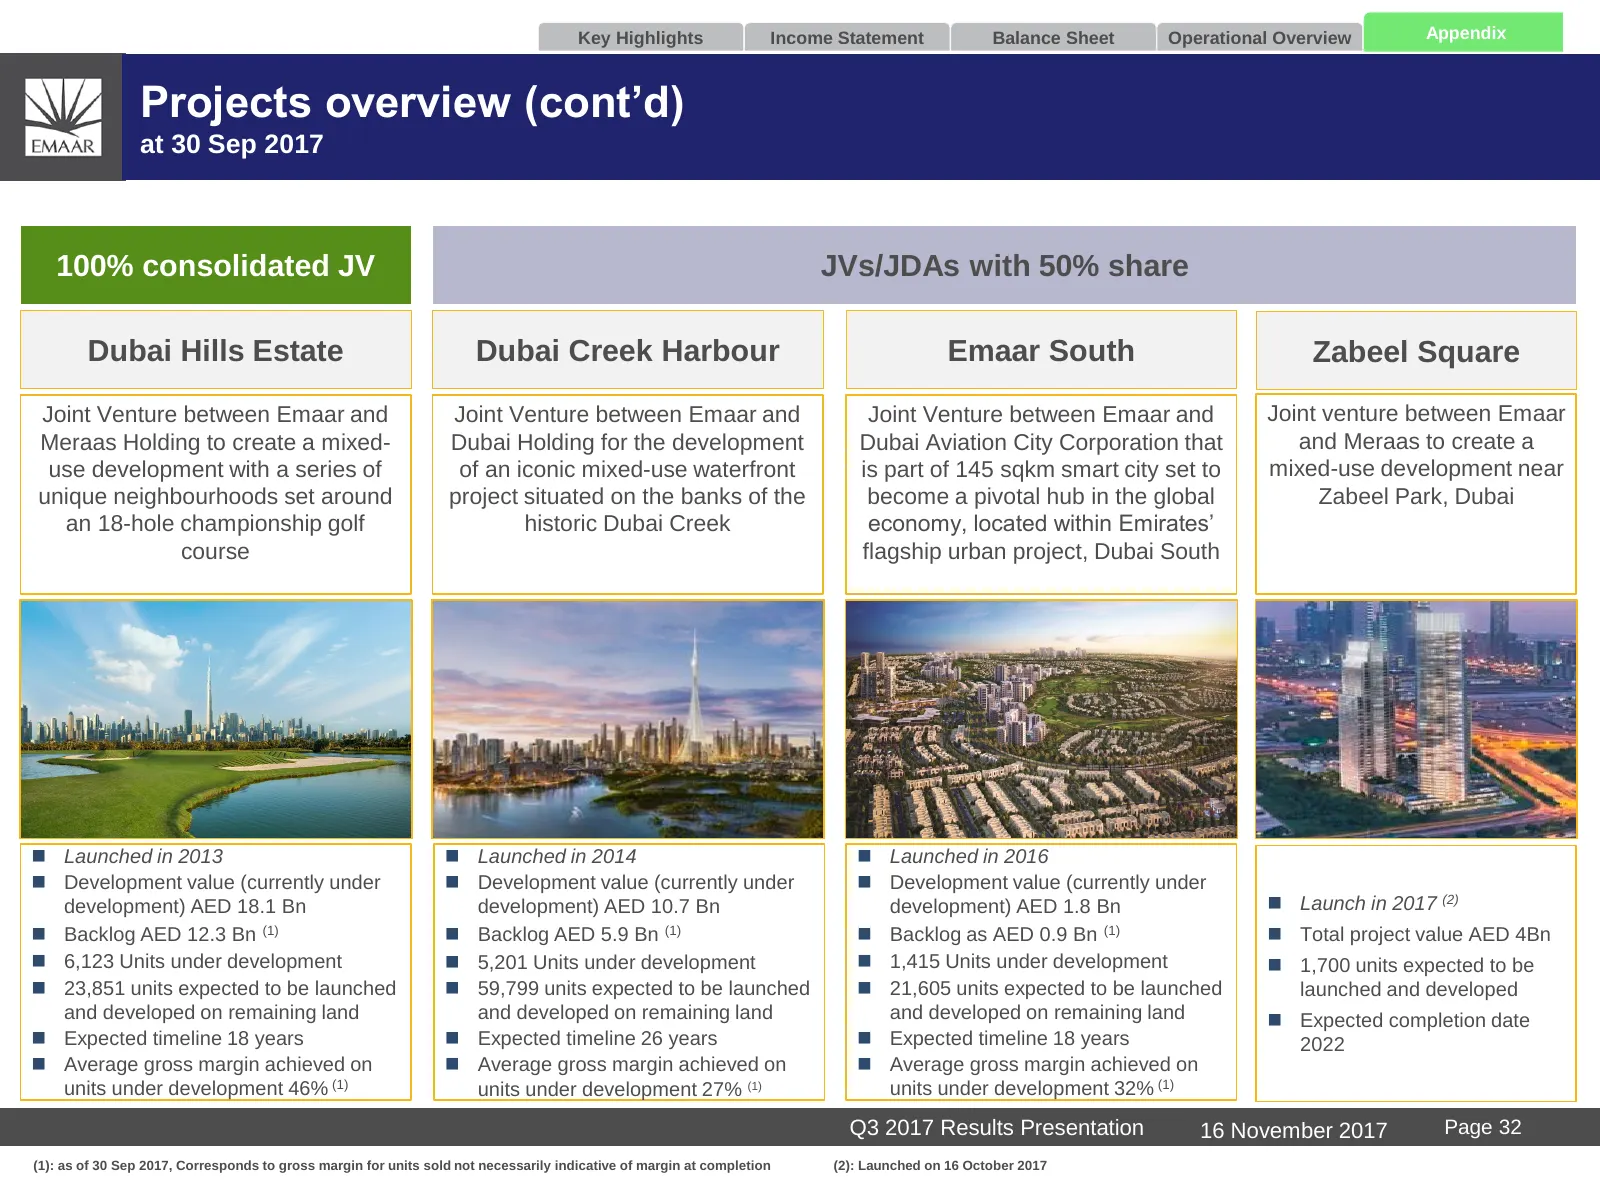
Key Highlights Income Statement Balance Sheet Operational Overview Appendix Projects overview (cont’d) at 30 Sep 2017 100% consolidated JV JVs/JDAs with 50% share Dubai Hills Estate Dubai Creek Harbour Emaar South Zabeel Square Joint Venture between Emaar and Joint Venture between Emaar and Joint Ve
Slide 34: Projects overview (cont’d)
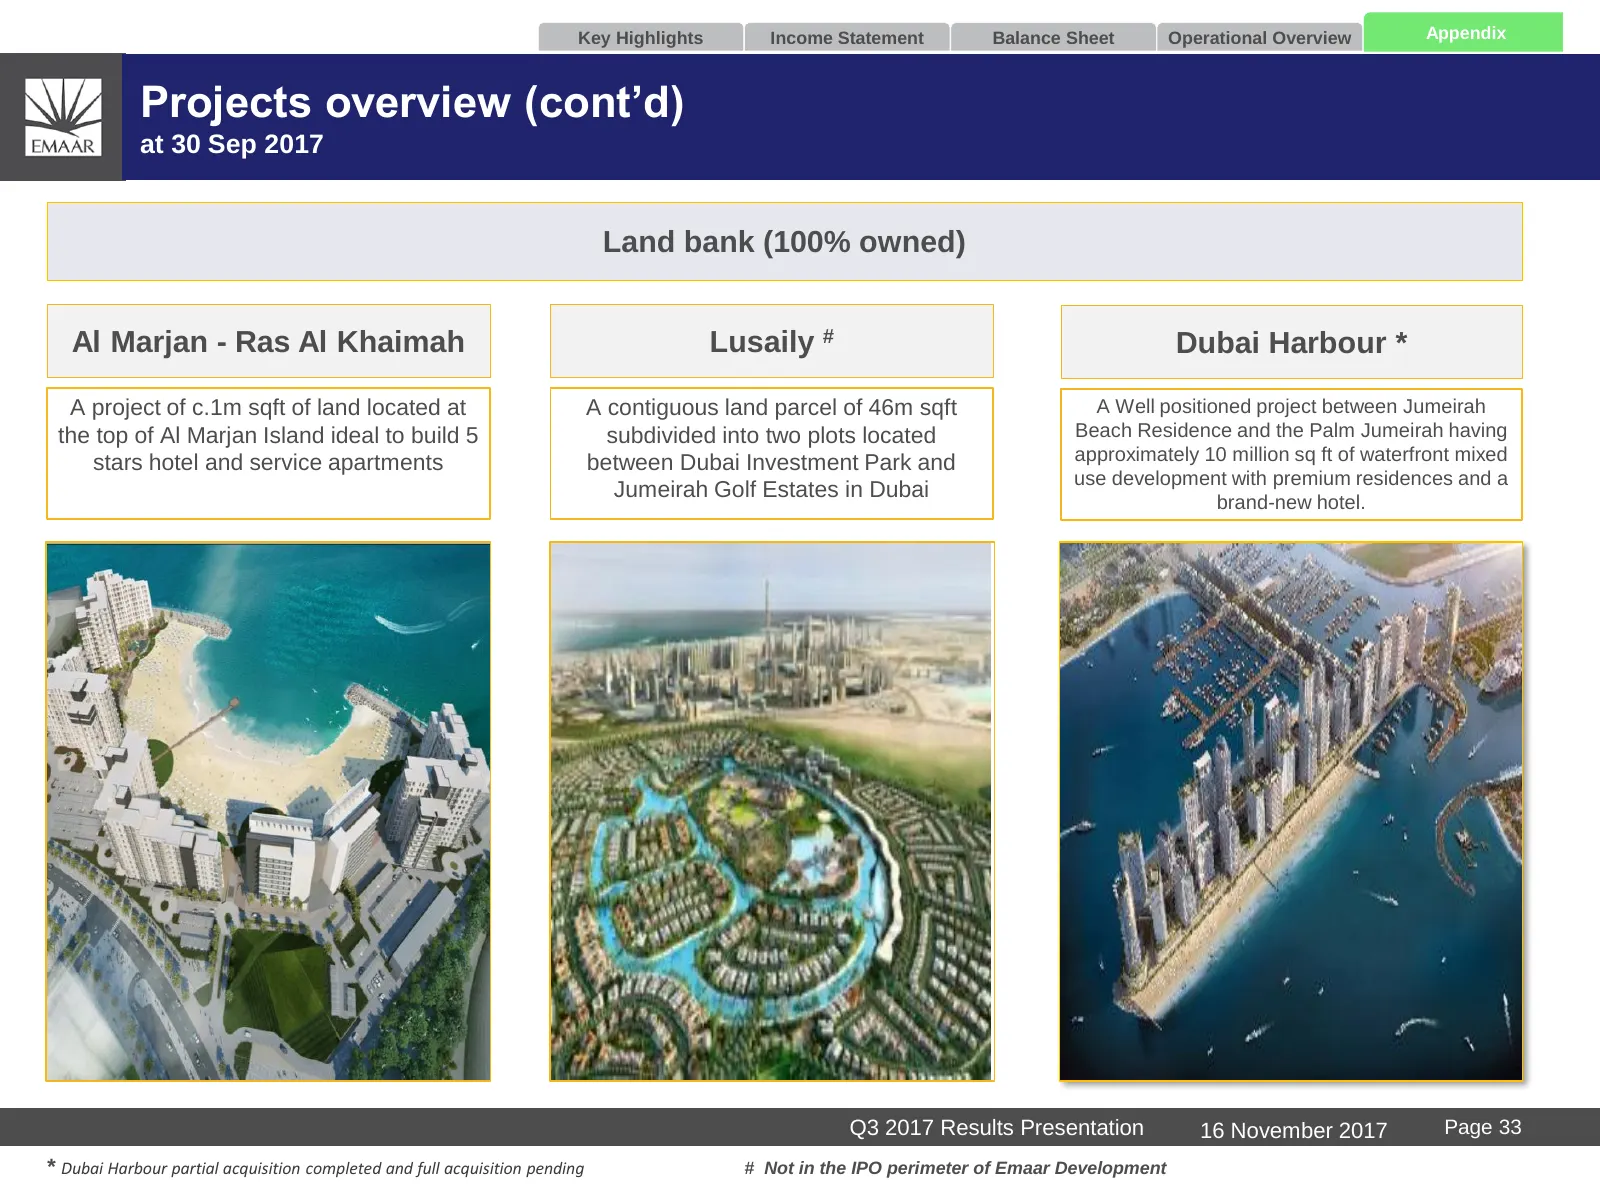
Key Highlights Income Statement Balance Sheet Operational Overview Appendix Projects overview (cont’d) at 30 Sep 2017 Land bank (100% owned) Al Marjan - Ras Al Khaimah Lusaily # Dubai Harbour * A project of c.1m sqft of land located at A contiguous land parcel of 46m sqft A Well positioned project b
Slide 35: Overview of projects under development
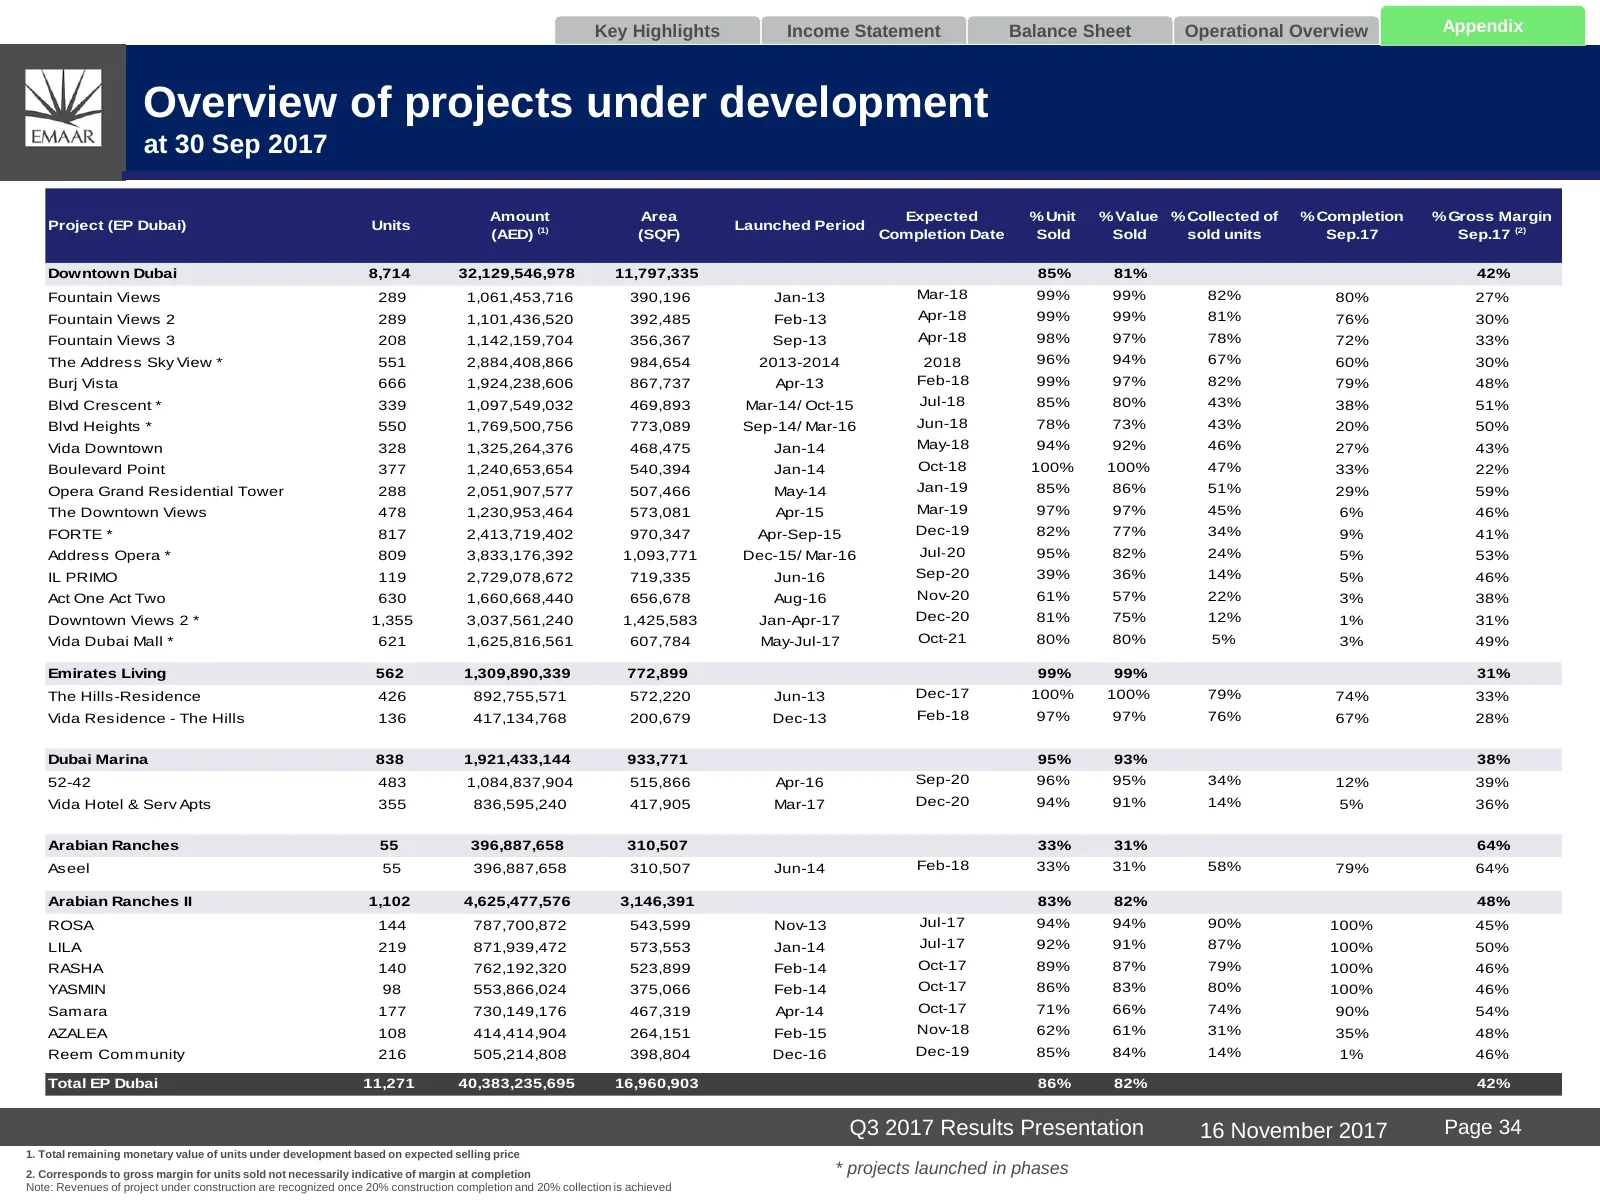
Key Highlights Income Statement Balance Sheet Operational Overview Appendix Overview of projects under development at 30 Sep 2017 Amount Area Expected % Unit % Value % Collected of % Completion % Gross Margin Project (EP Dubai) Units Launched Period (AED) (1) (SQF) Completion Date Sold Sold sold uni
Slide 36: Overview of projects under development (Cont’d)
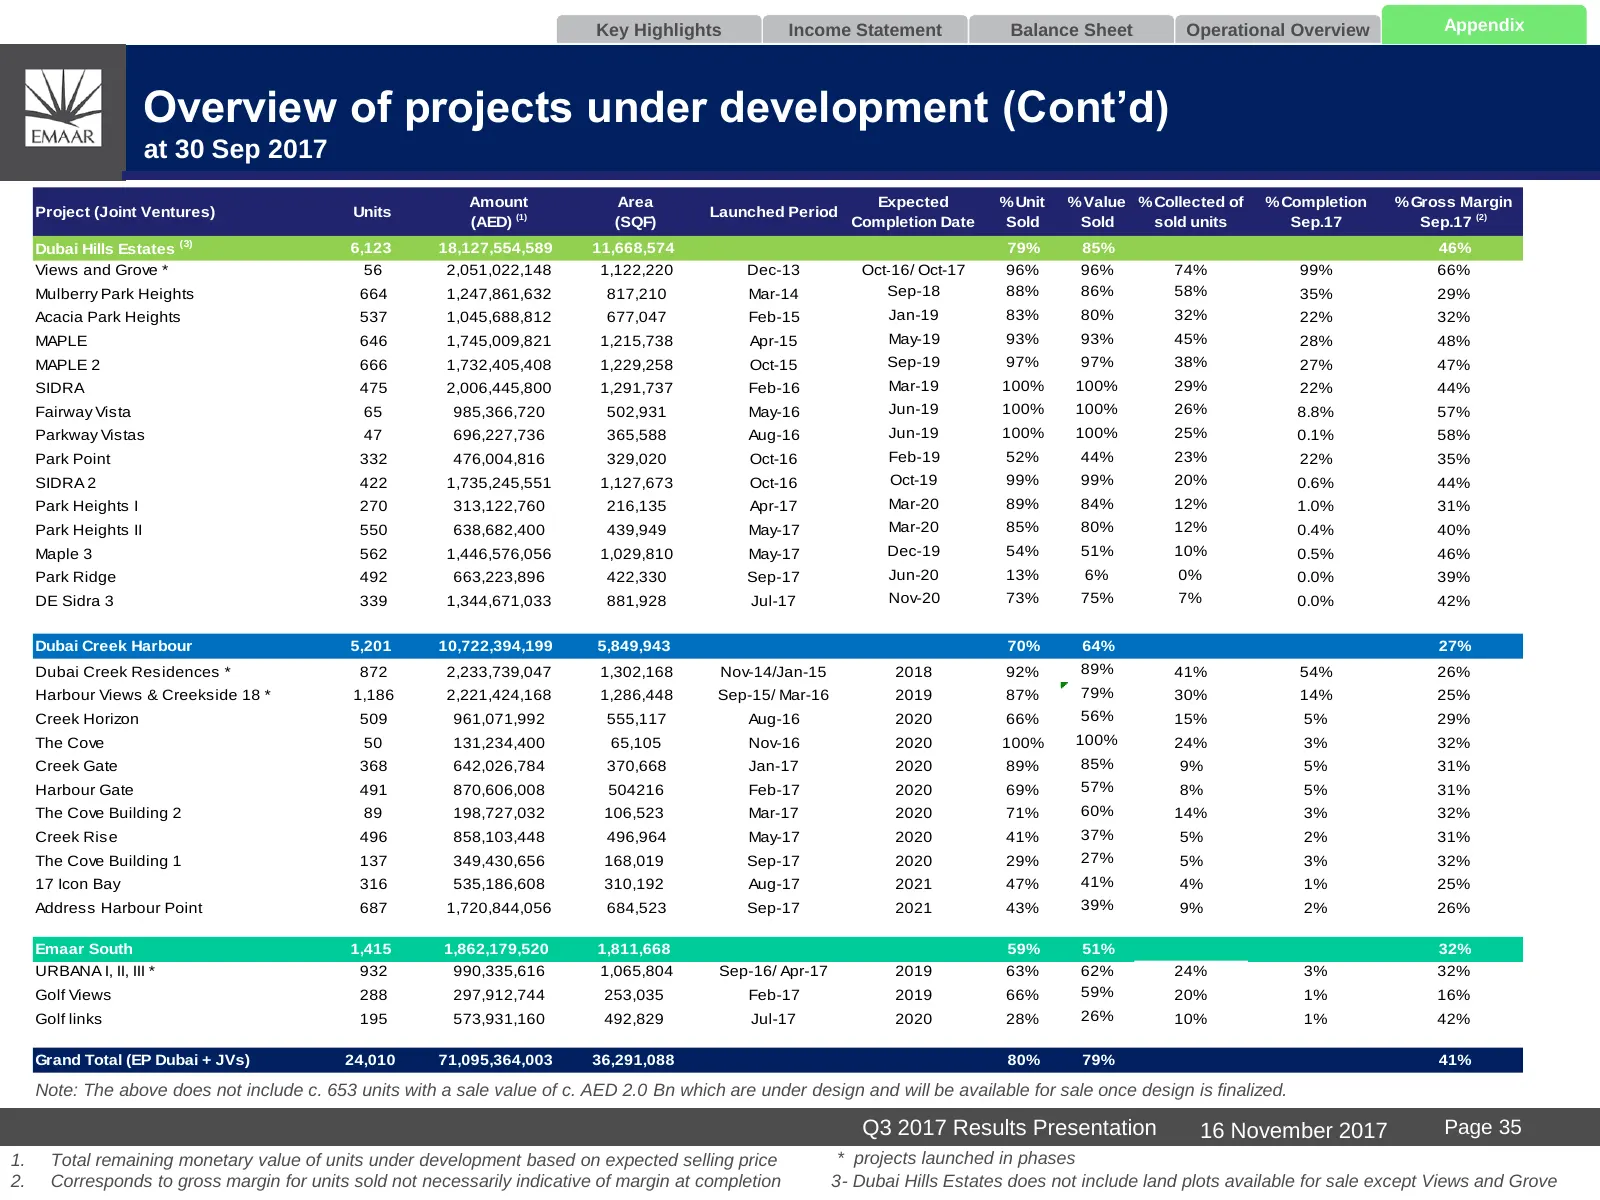
Key Highlights Income Statement Balance Sheet Operational Overview Appendix Overview of projects under development (Cont’d) at 30 Sep 2017 Amount Area Expected % Unit % Value % Collected of % Completion % Gross Margin Project (Joint Ventures) Units Launched Period (AED) (1) (SQF) Completion Date Sol
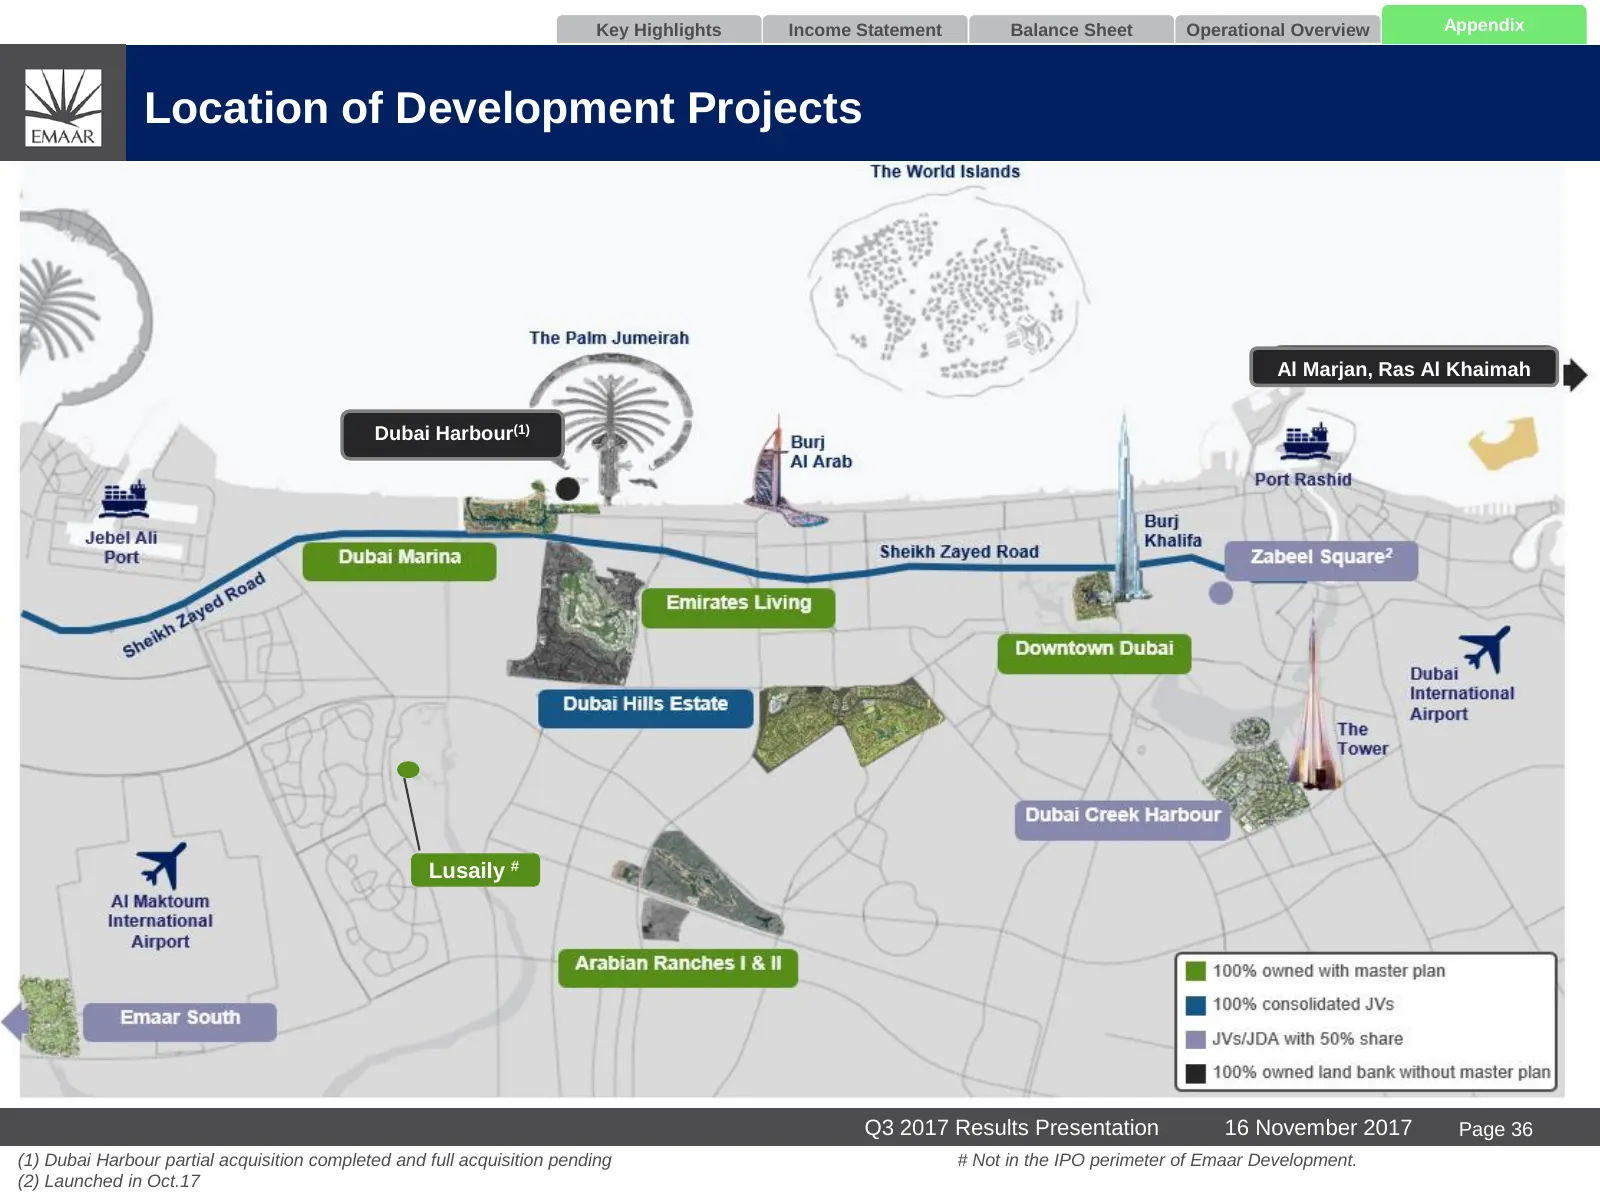
Slide 37: Location of Development Projects
Key Highlights Income Statement Balance Sheet Operational Overview Appendix Location of Development Projects Al Marjan, Ras Al Khaimah Dubai Harbour(1) Zaabeel Lusaily # Q3 2017 Results Presentation 16 November 2017 Page 36 (1) Dubai Harbour partial acquisition completed and full acquisition pending
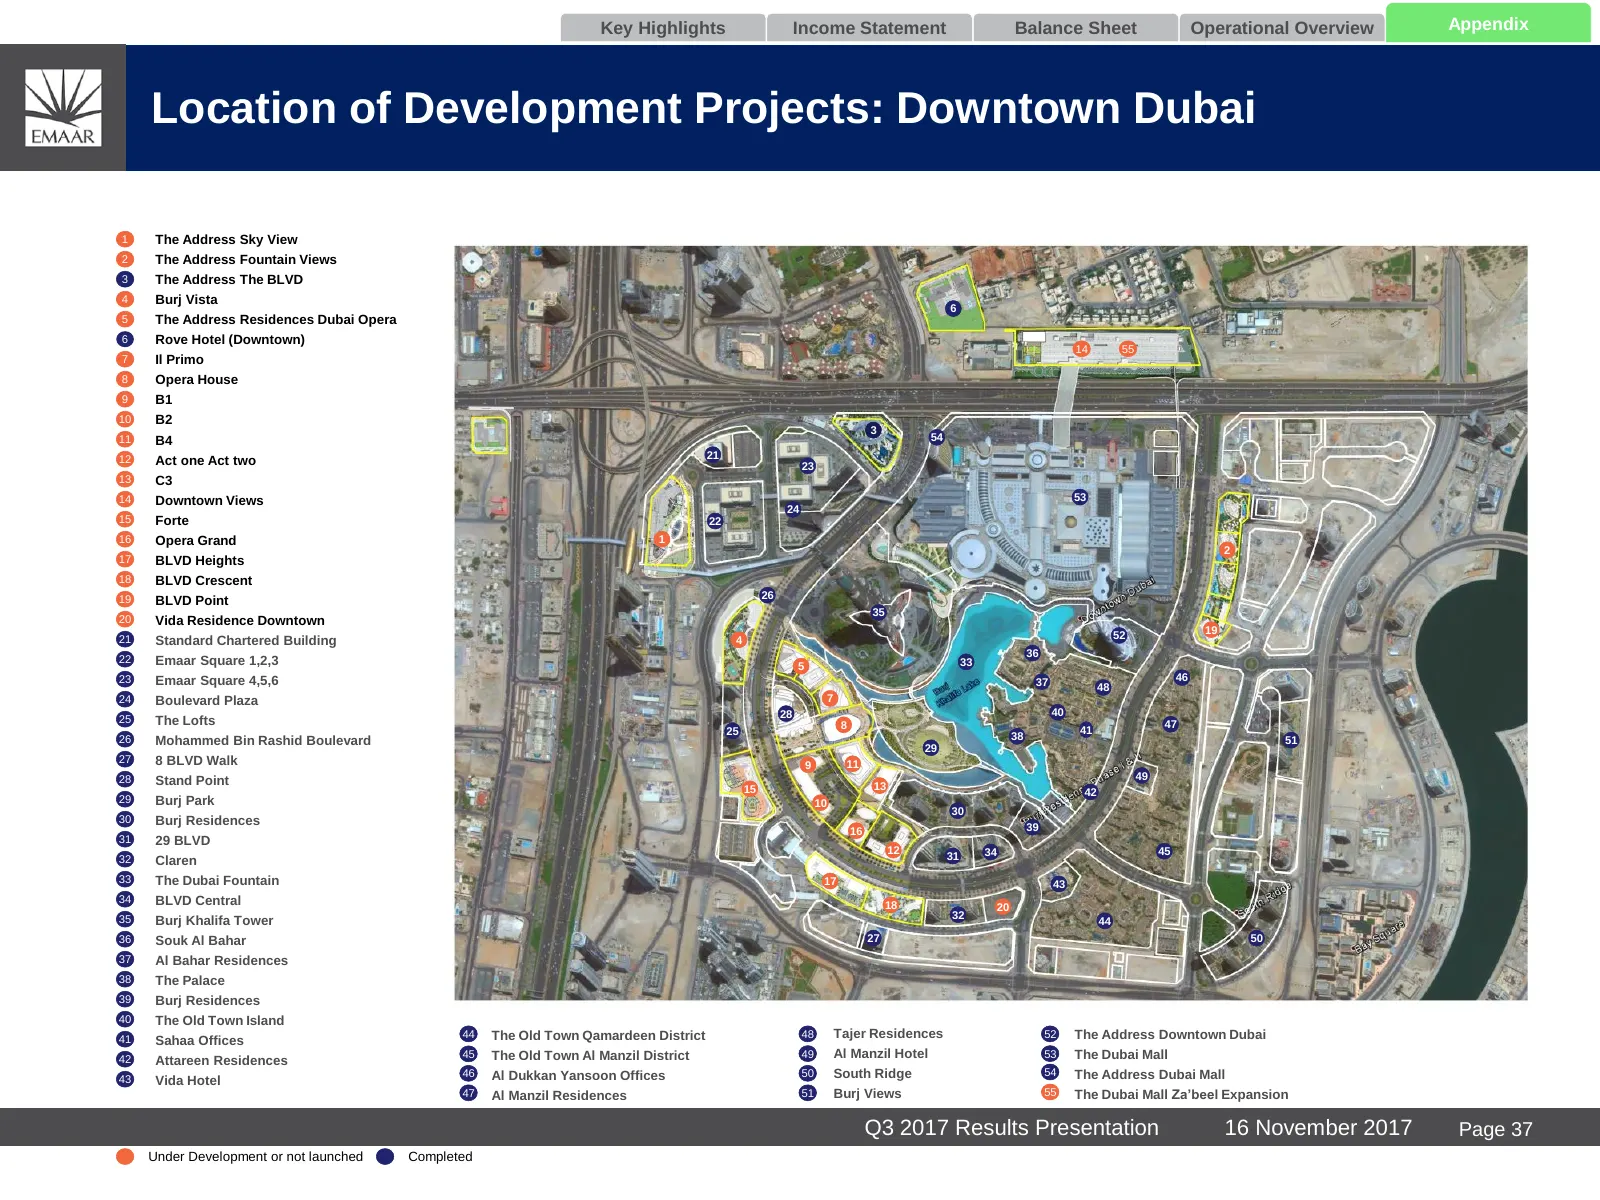
Slide 38: Location of Development Projects: Downtown Dubai
Key Highlights Income Statement Balance Sheet Operational Overview Appendix Location of Development Projects: Downtown Dubai 1 The Address Sky View 2 The Address Fountain Views 3 The Address The BLVD 4 Burj Vista 6 5 The Address Residences Dubai Opera 6 Rove Hotel (Downtown) 14 55 7 Il Primo 8 Opera
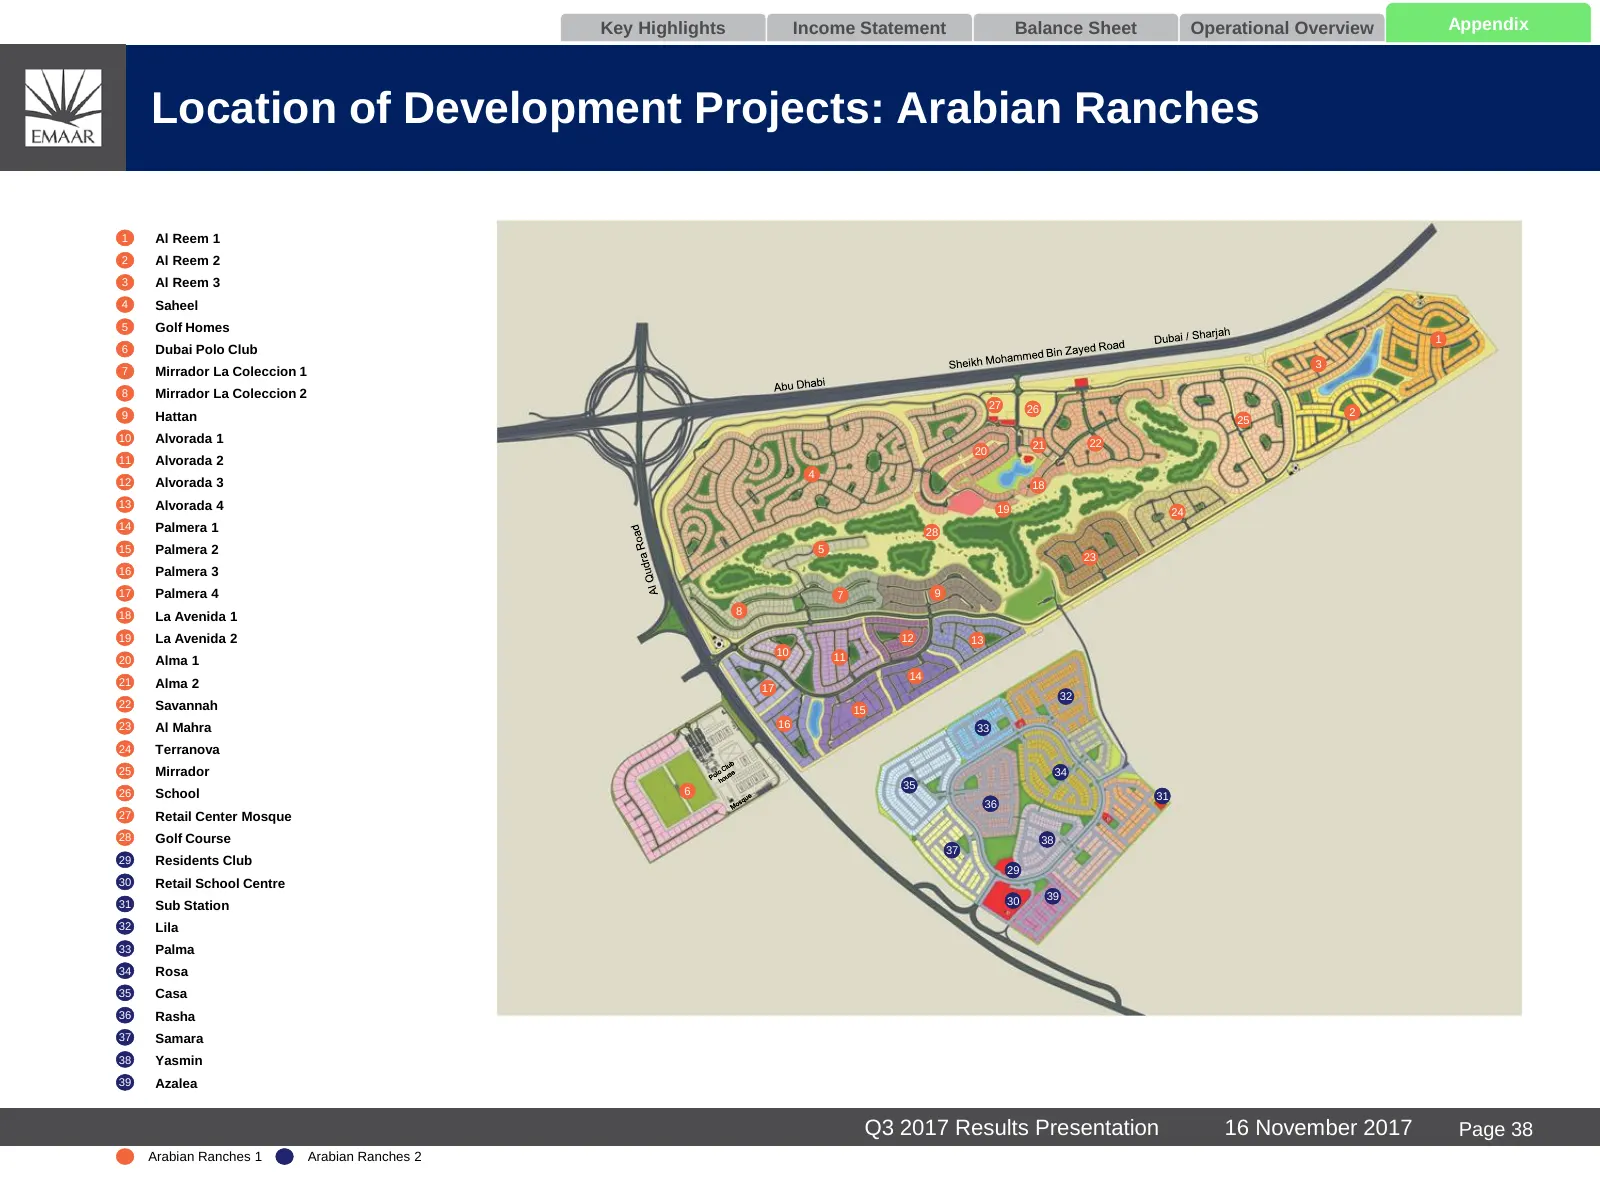
Slide 39: Location of Development Projects: Arabian Ranches
Key Highlights Income Statement Balance Sheet Operational Overview Appendix Location of Development Projects: Arabian Ranches 1 Al Reem 1 2 Al Reem 2 3 Al Reem 3 4 Saheel 5 Golf Homes 1 6 Dubai Polo Club 3 7 Mirrador La Coleccion 1 8 Mirrador La Coleccion 2 27 26 9 Hattan 2 25 10 Alvorada 1 21 22 20
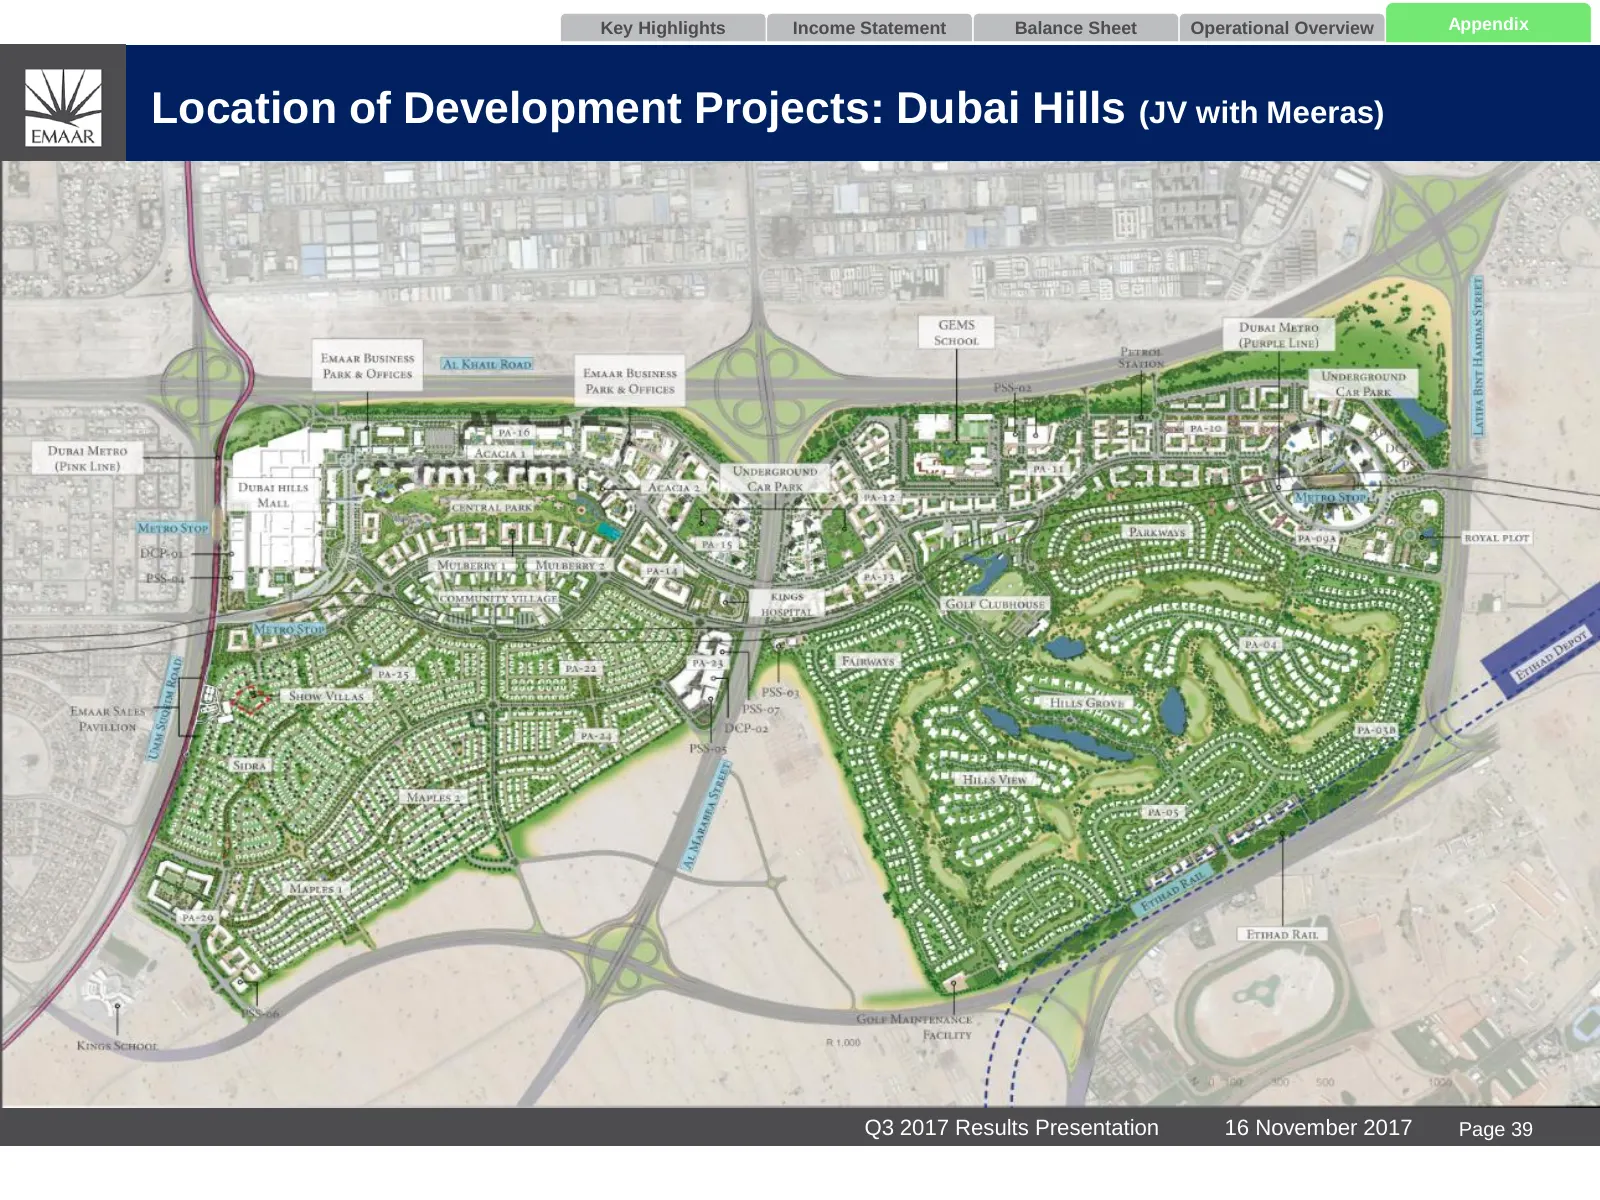
Slide 40: Location of Development Projects: Dubai Hills
Key Highlights Income Statement Balance Sheet Operational Overview Appendix Location of Development Projects: Dubai Hills (JV with Meeras) Q3 2017 Results Presentation 16 November 2017 Page 39
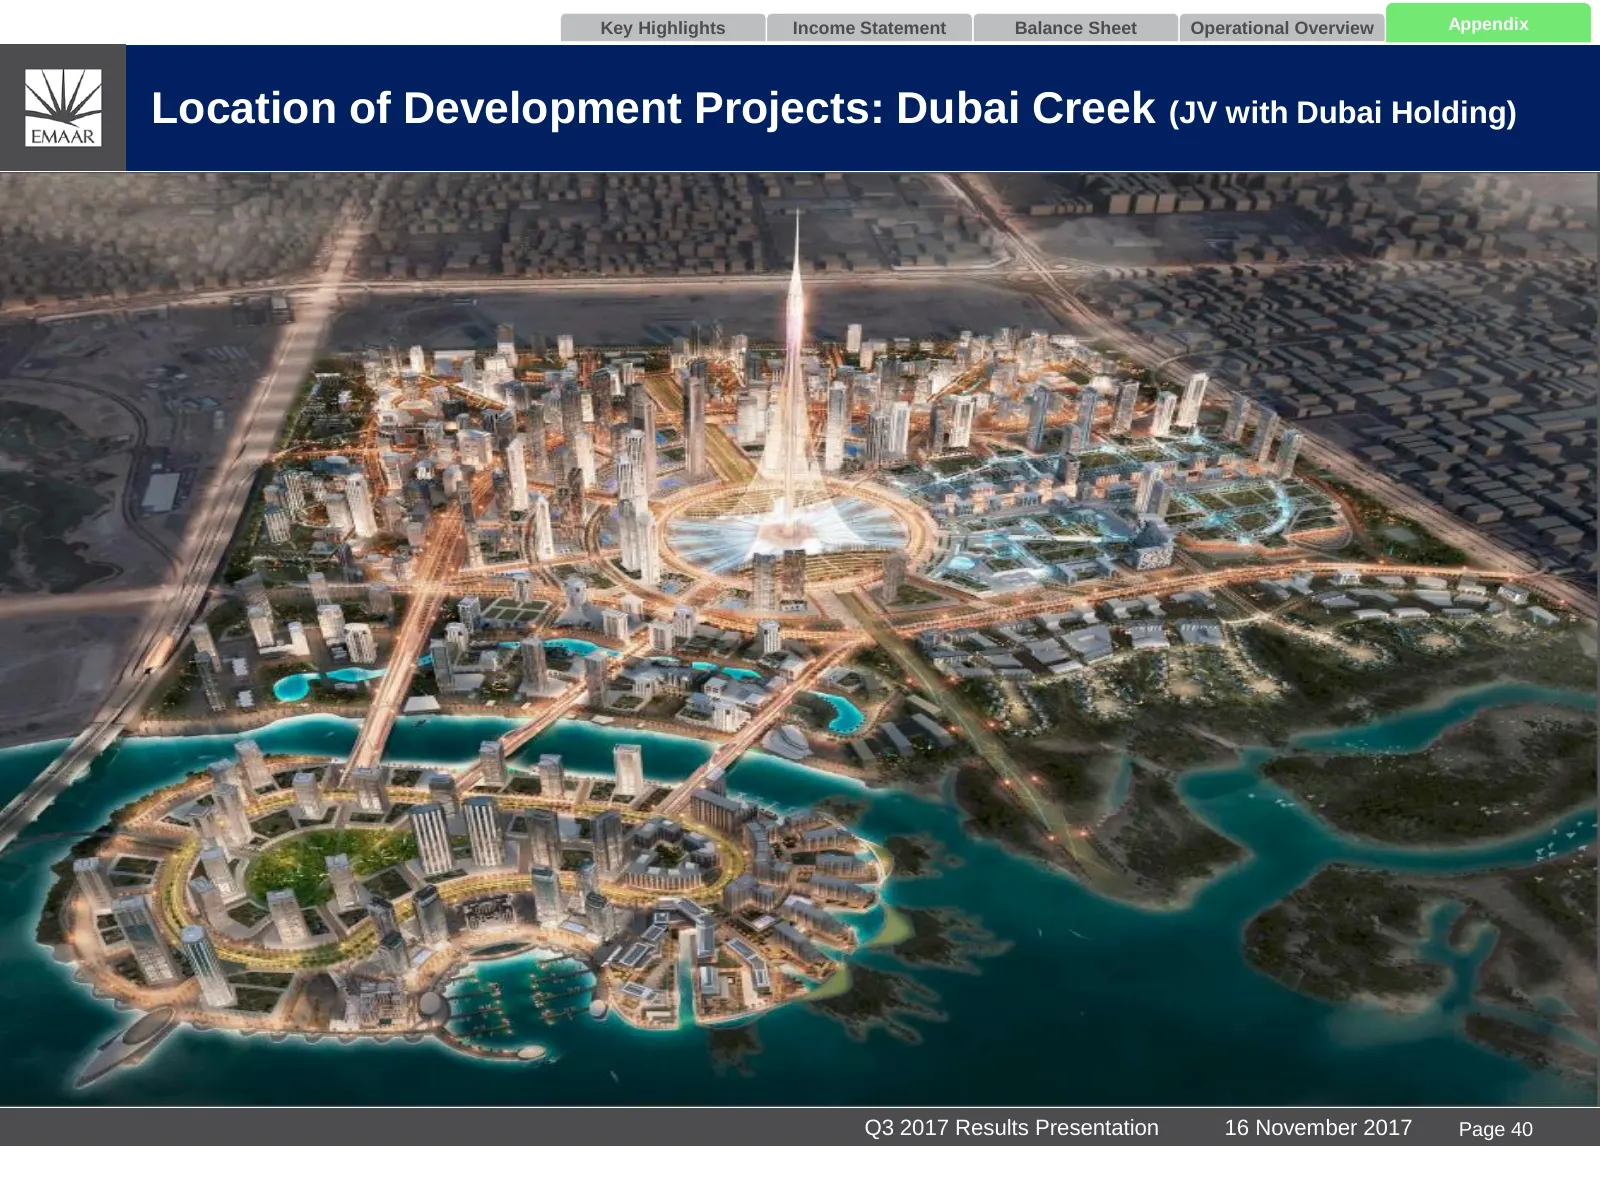
Slide 41: Location of Development Projects: Dubai Creek
Key Highlights Income Statement Balance Sheet Operational Overview Appendix Location of Development Projects: Dubai Creek (JV with Dubai Holding) Q3 2017 Results Presentation 16 November 2017 Page 40
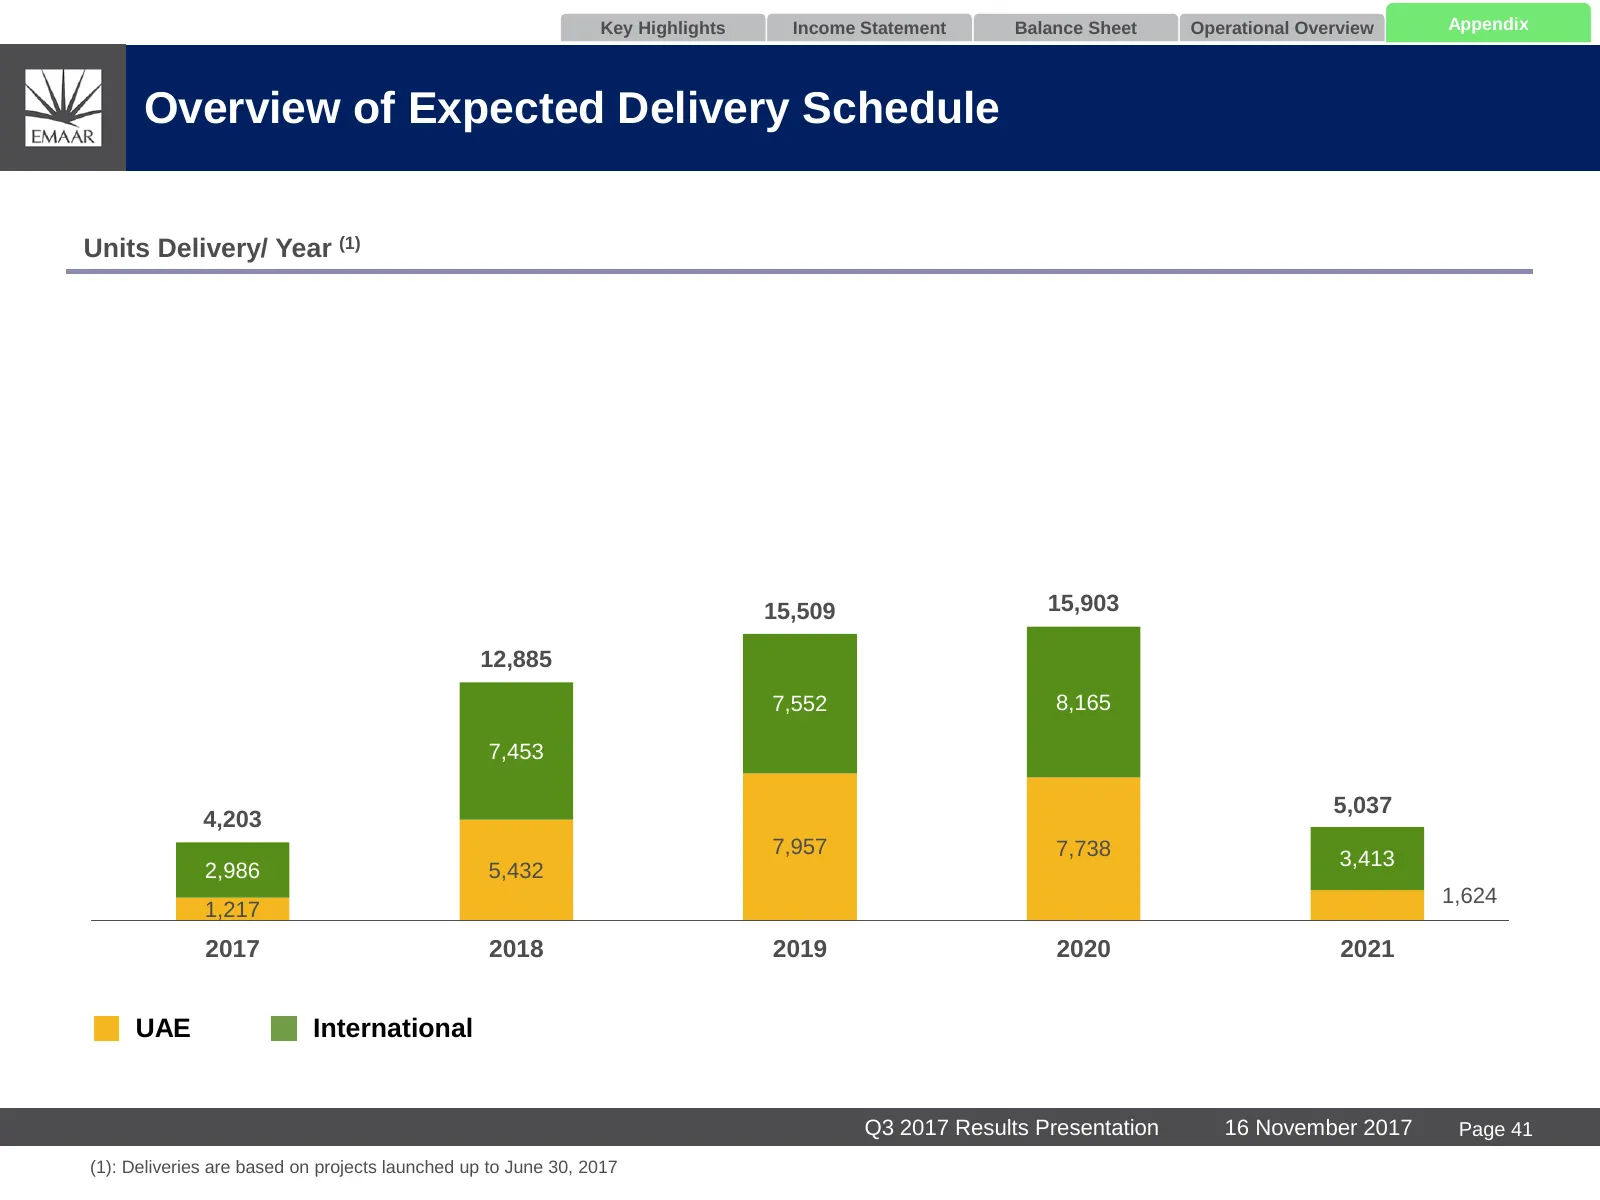
Slide 42: Overview of Expected Delivery Schedule
Key Highlights Income Statement Balance Sheet Operational Overview Appendix Overview of Expected Delivery Schedule Units Delivery/ Year (1) 15,509 15,903 12,885 7,552 8,165 7,453 5,037 4,203 7,957 7,738 3,413 2,986 5,432 1,624 1,217 2017 2018 2019 2020 2021 UAE International Q3 2017 Results Presenta
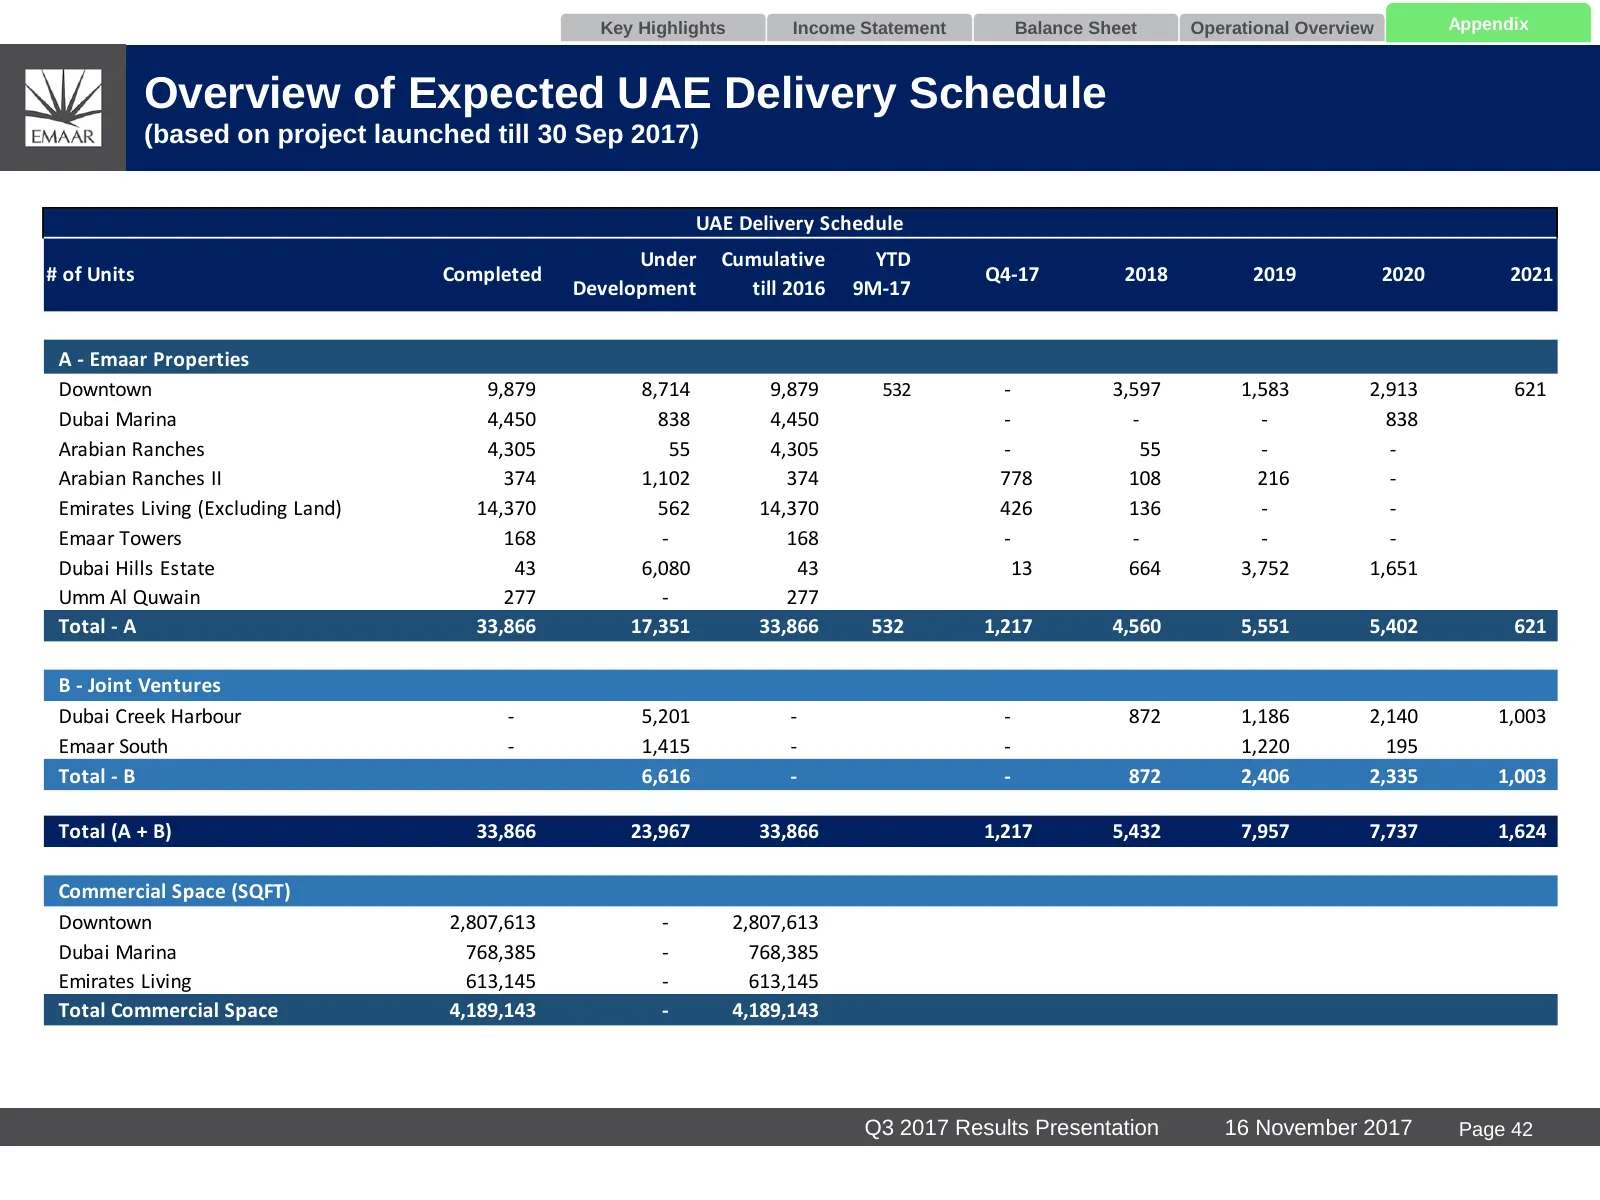
Slide 43: Overview of Expected UAE Delivery Schedule
Key Highlights Income Statement Balance Sheet Operational Overview Appendix Overview of Expected UAE Delivery Schedule (based on project launched till 30 Sep 2017) UAE Delivery Schedule Under Cumulative YTD # of Units Completed Q4-17 2018 2019 2020 2021 Development till 2016 9M-17 A - Emaar Properti
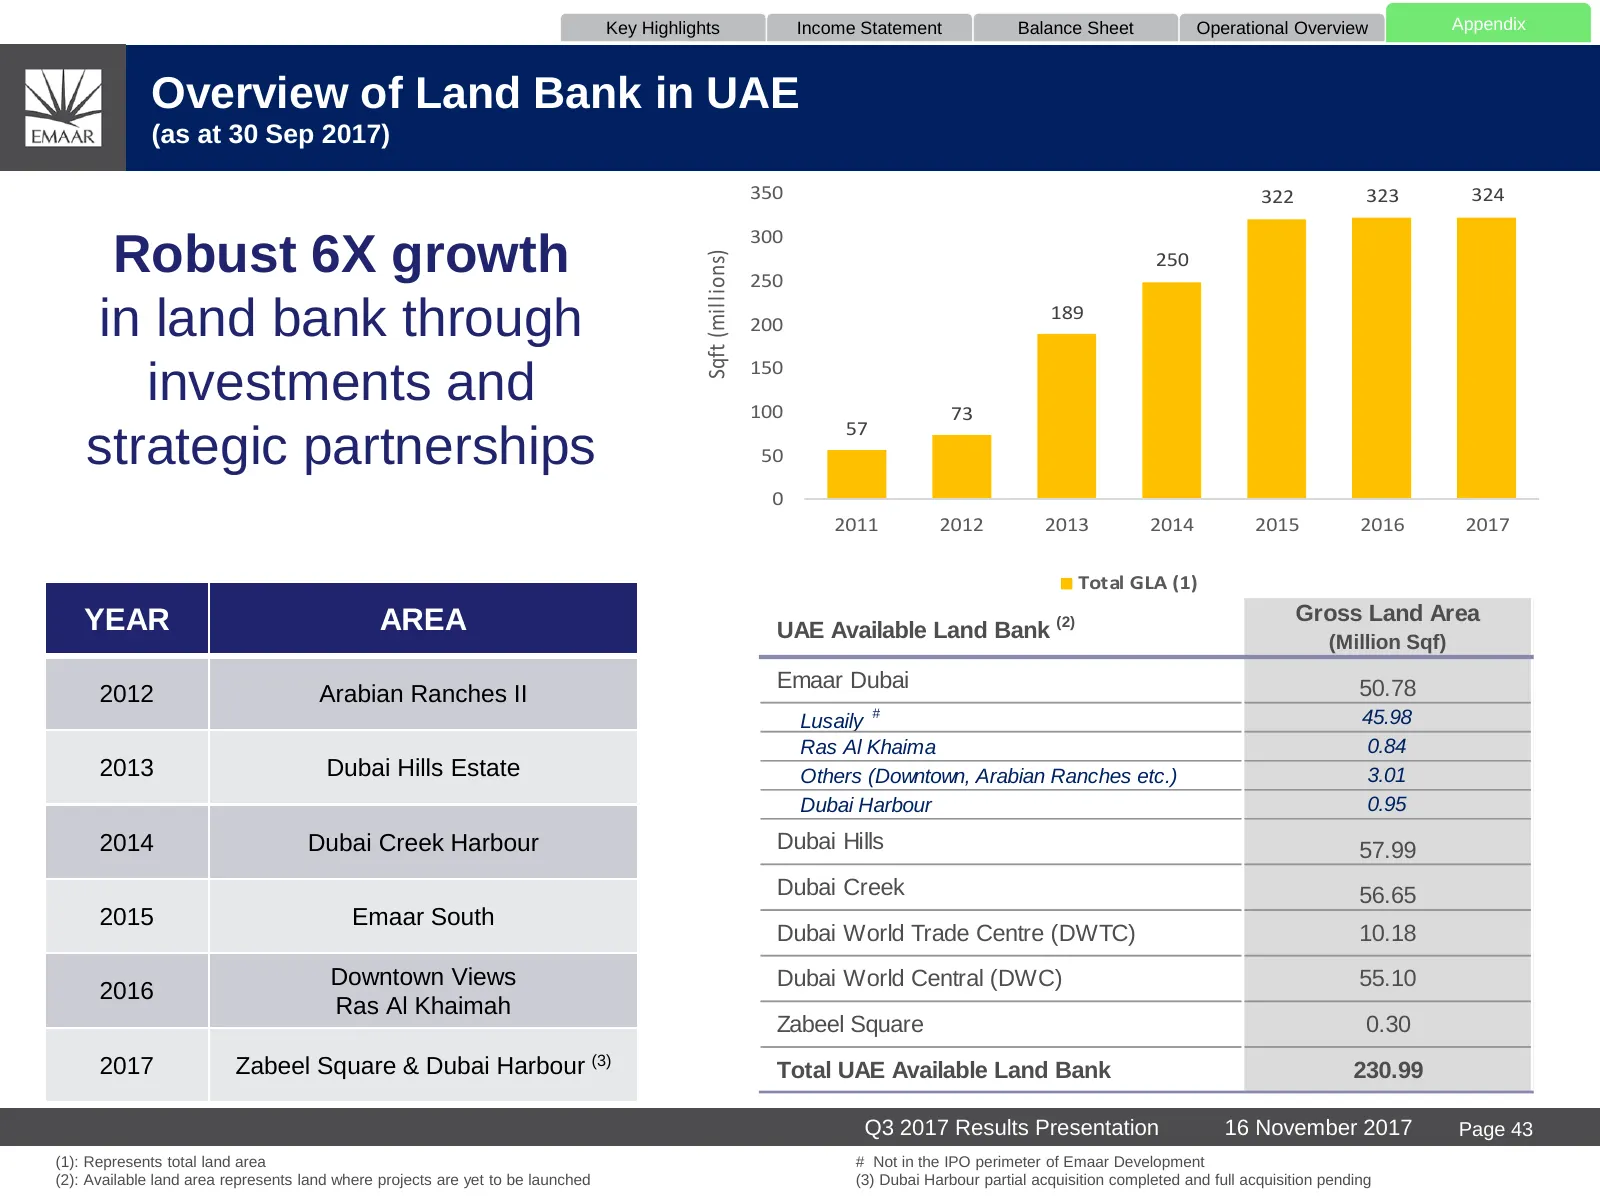
Slide 44: Overview of Land Bank in UAE
Key Highlights Income Statement Balance Sheet Operational Overview Appendix Overview of Land Bank in UAE (as at 30 Sep 2017) 350 322 323 324 300 Robust 6X growth Sqft (millions) 250 250 in land bank through 200 189 150 investments and 100 73 57 strategic partnerships 50 0 2011 2012 2013 2014 2015 20
Slide 45: Accounting Treatment
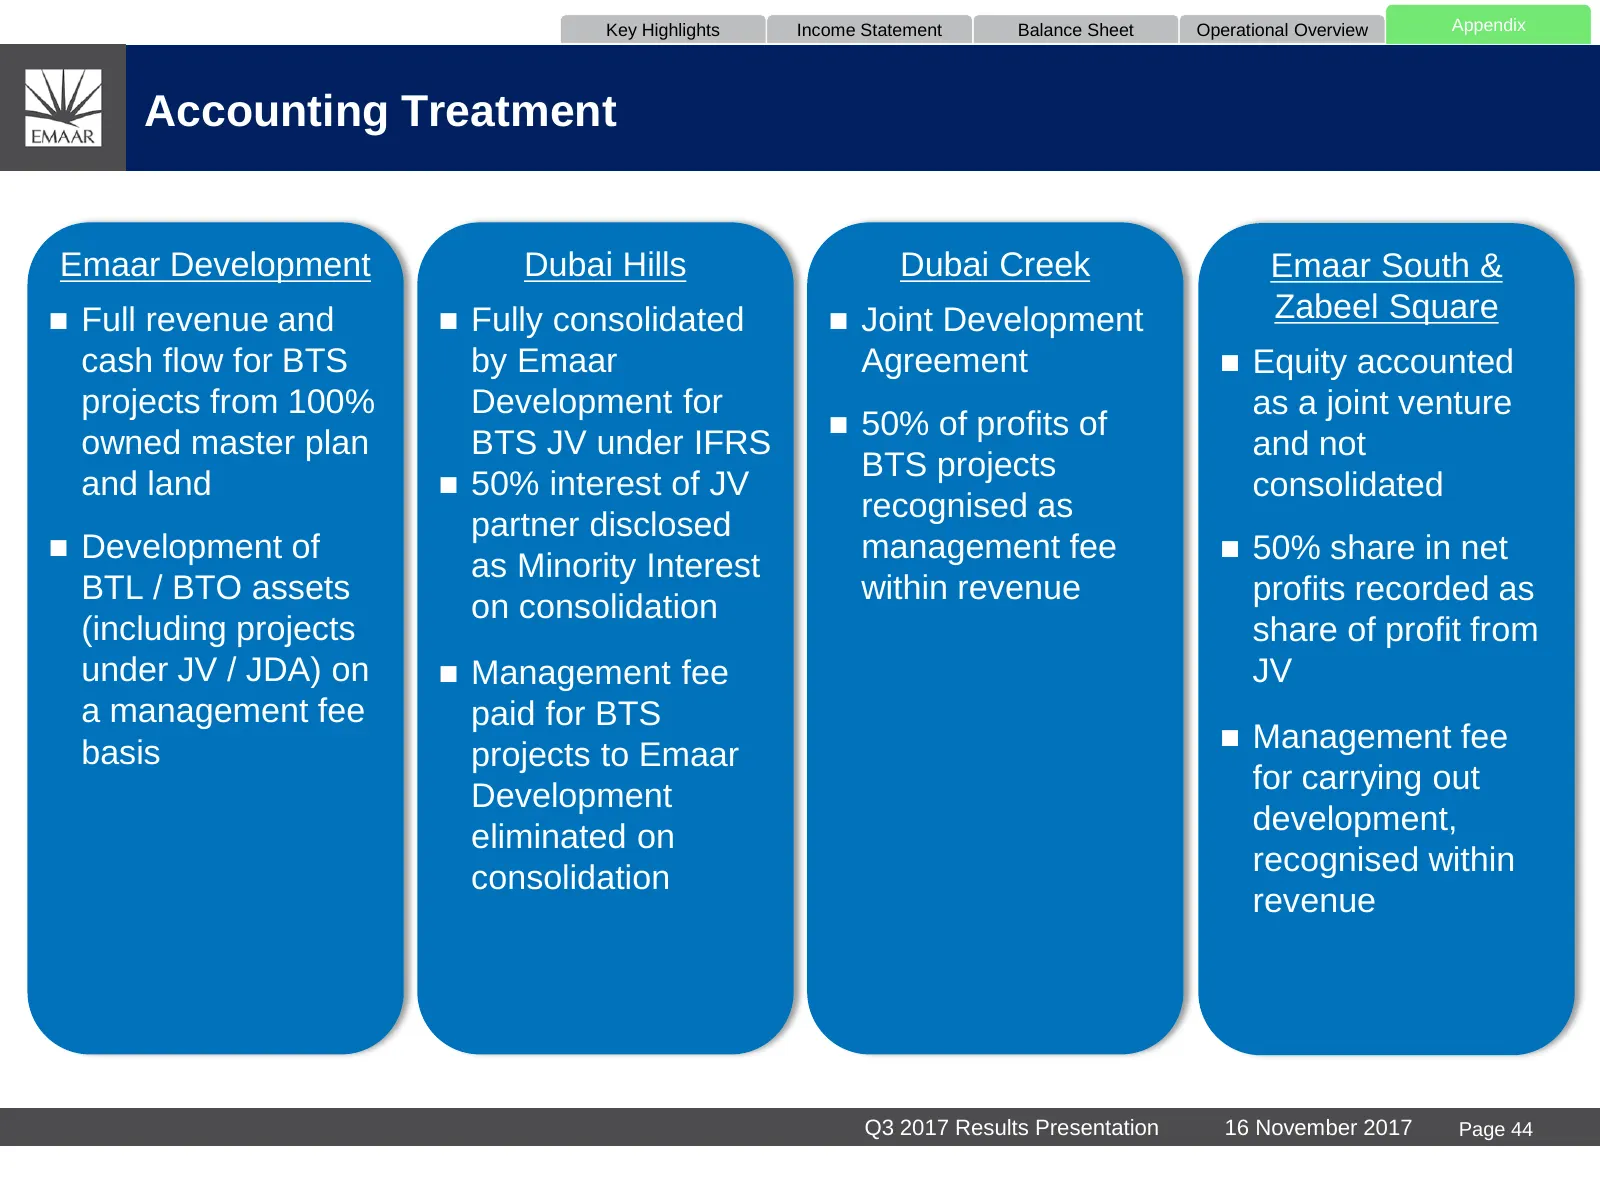
Key Highlights Income Statement Balance Sheet Operational Overview Appendix Accounting Treatment Emaar Development Dubai Hills Dubai Creek Emaar South & Full revenue and Fully consolidated Joint Development Zabeel Square cash flow for BTS by Emaar Agreement Equity accounted projects from 100
Slide 46: Appendix C – Overview of International Development
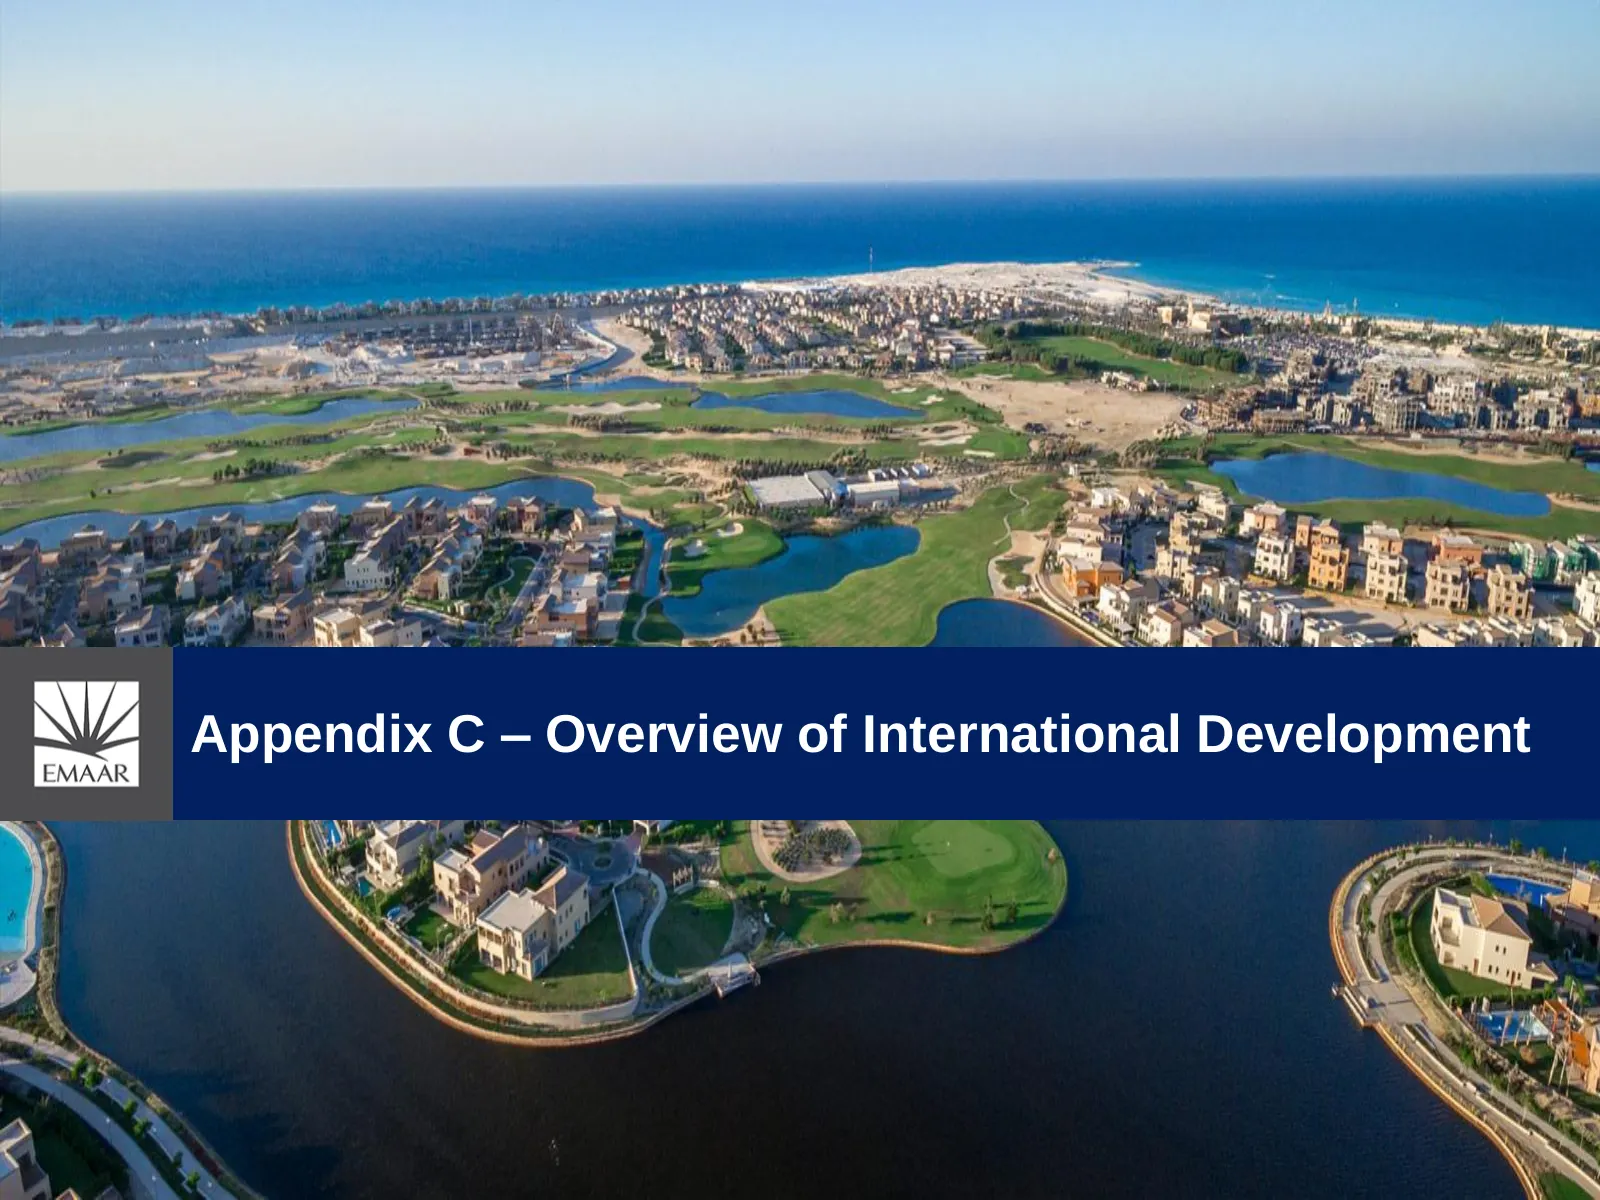
Appendix C – Overview of International Development
Slide 47: International Expected Delivery Schedule
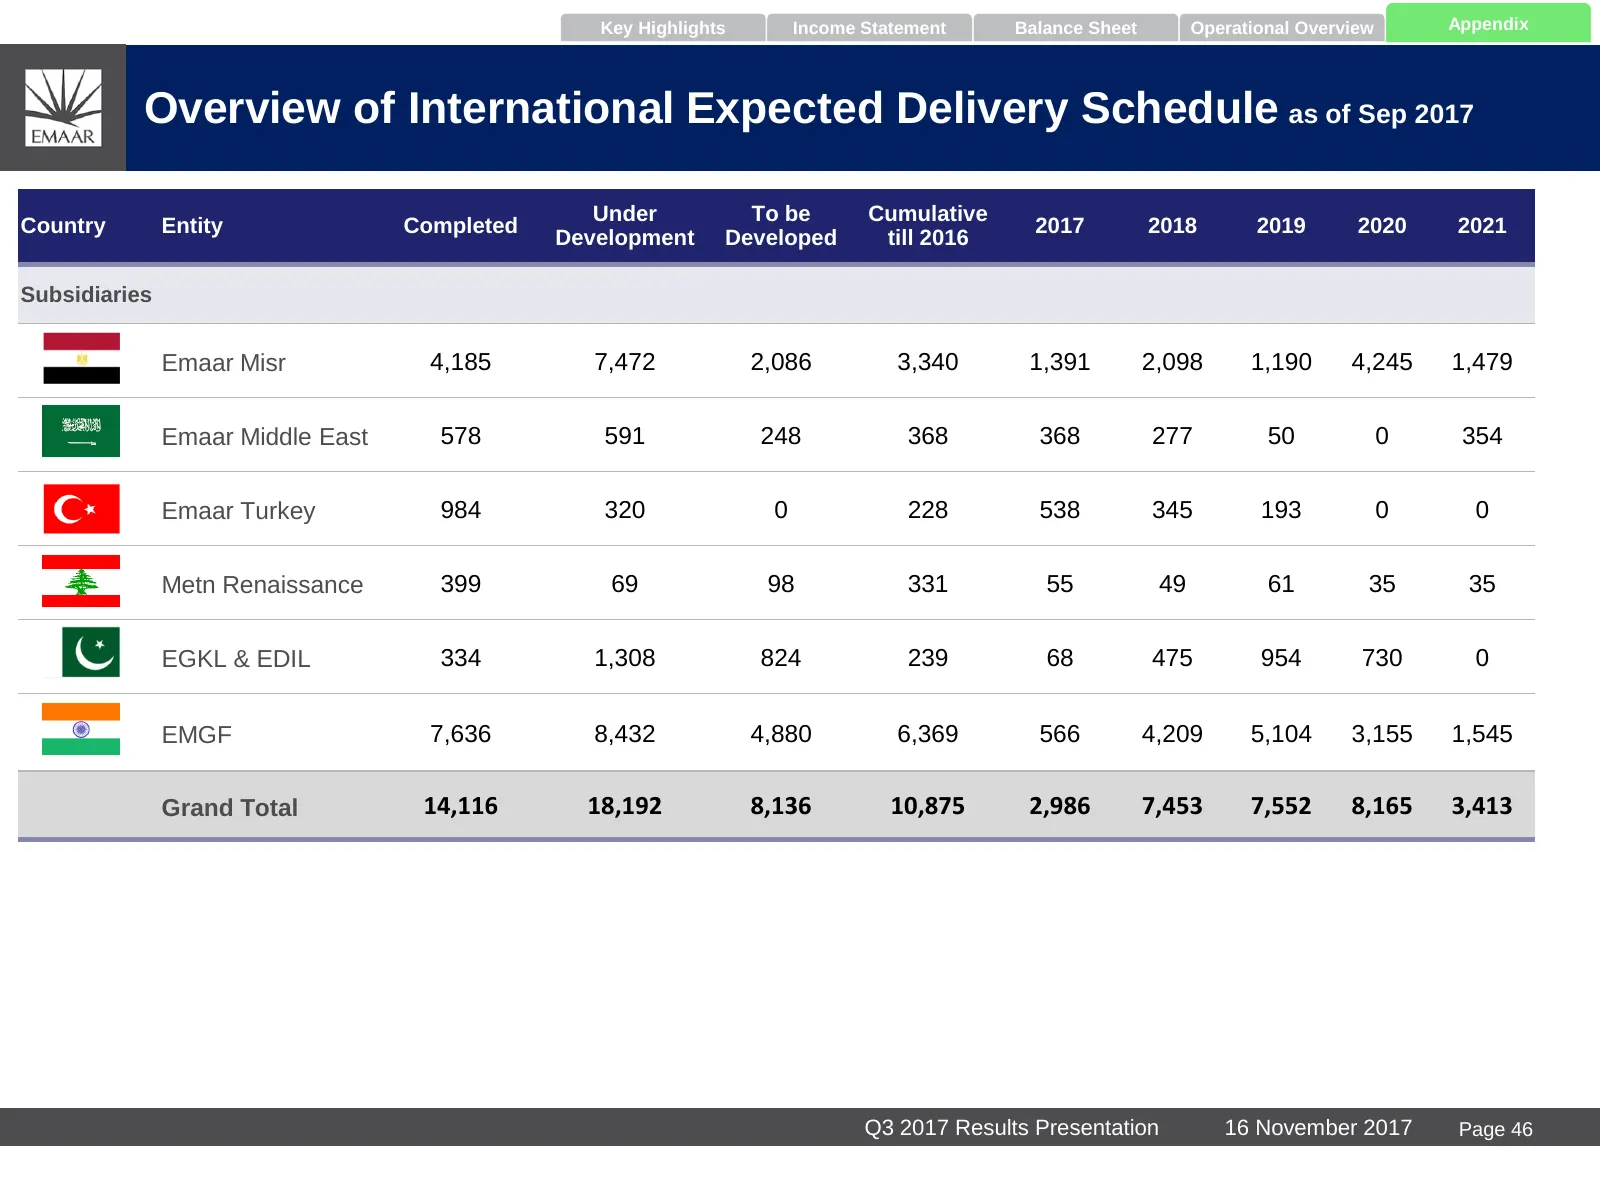
Key Highlights Income Statement Balance Sheet Operational Overview Appendix Overview of International Expected Delivery Schedule as of Sep 2017 Under To be Cumulative Country Entity Completed 2017 2018 2019 2020 2021 Development Developed till 2016 Subsidiaries Emaar Misr 4,185 7,472 2,086 3,340 1,3
Slide 48: Overview of International Land Bank
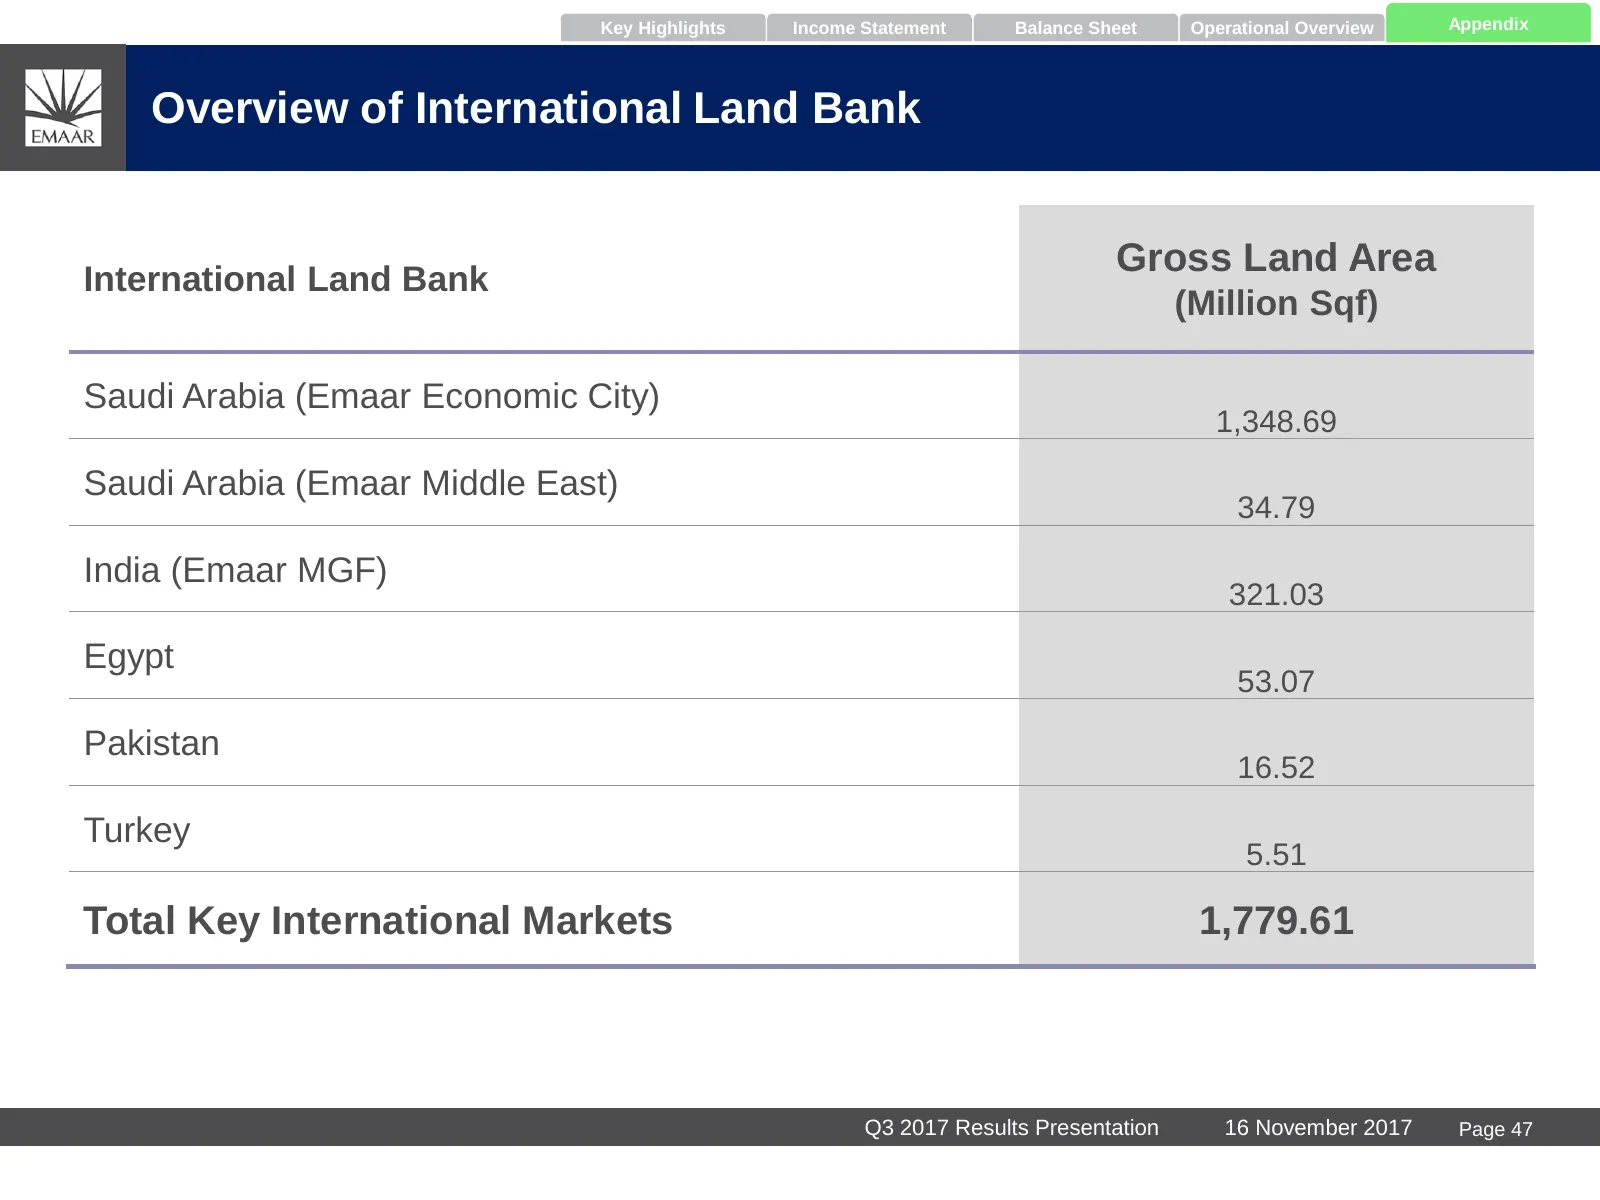
Key Highlights Income Statement Balance Sheet Operational Overview Appendix Overview of International Land Bank International Land Bank Gross Land Area (Million Sqf) Saudi Arabia (Emaar Economic City) 1,348.69 Saudi Arabia (Emaar Middle East) 34.79 India (Emaar MGF) 321.03 Egypt 53.07 Pakistan 16.52
Slide 49: Appendix D – Overview of Emaar Hospitality Group
Appendix D – Overview of Emaar Hospitality Group Page 48
Slide 50: Emaar Hospitality Group Portfolio
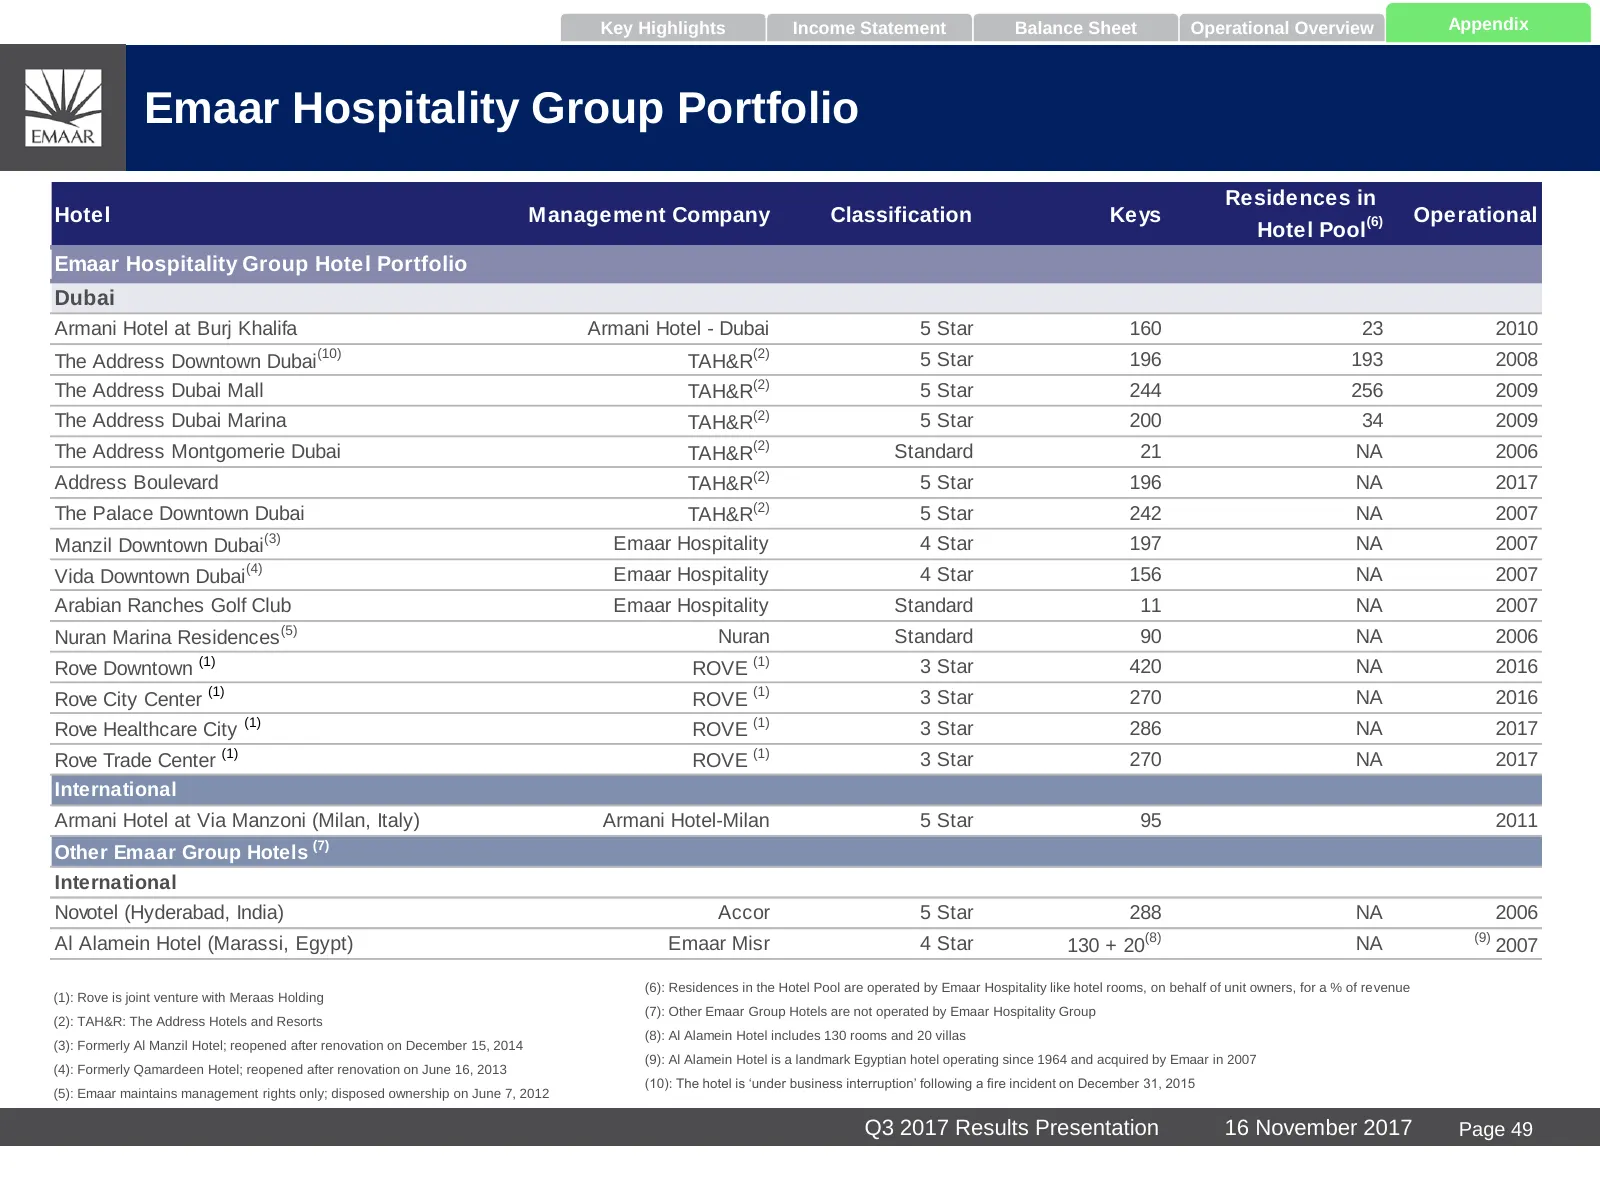
Key Highlights Income Statement Balance Sheet Operational Overview Appendix Emaar Hospitality Group Portfolio Residences in Hotel Management Company Classification Keys Operational Hotel Pool(6) Emaar Hospitality Group Hotel Portfolio Dubai Armani Hotel at Burj Khalifa Armani Hotel - Dubai 5 Star 16
Slide 51: Emaar Hospitality Group: Asset Performance Breakdown
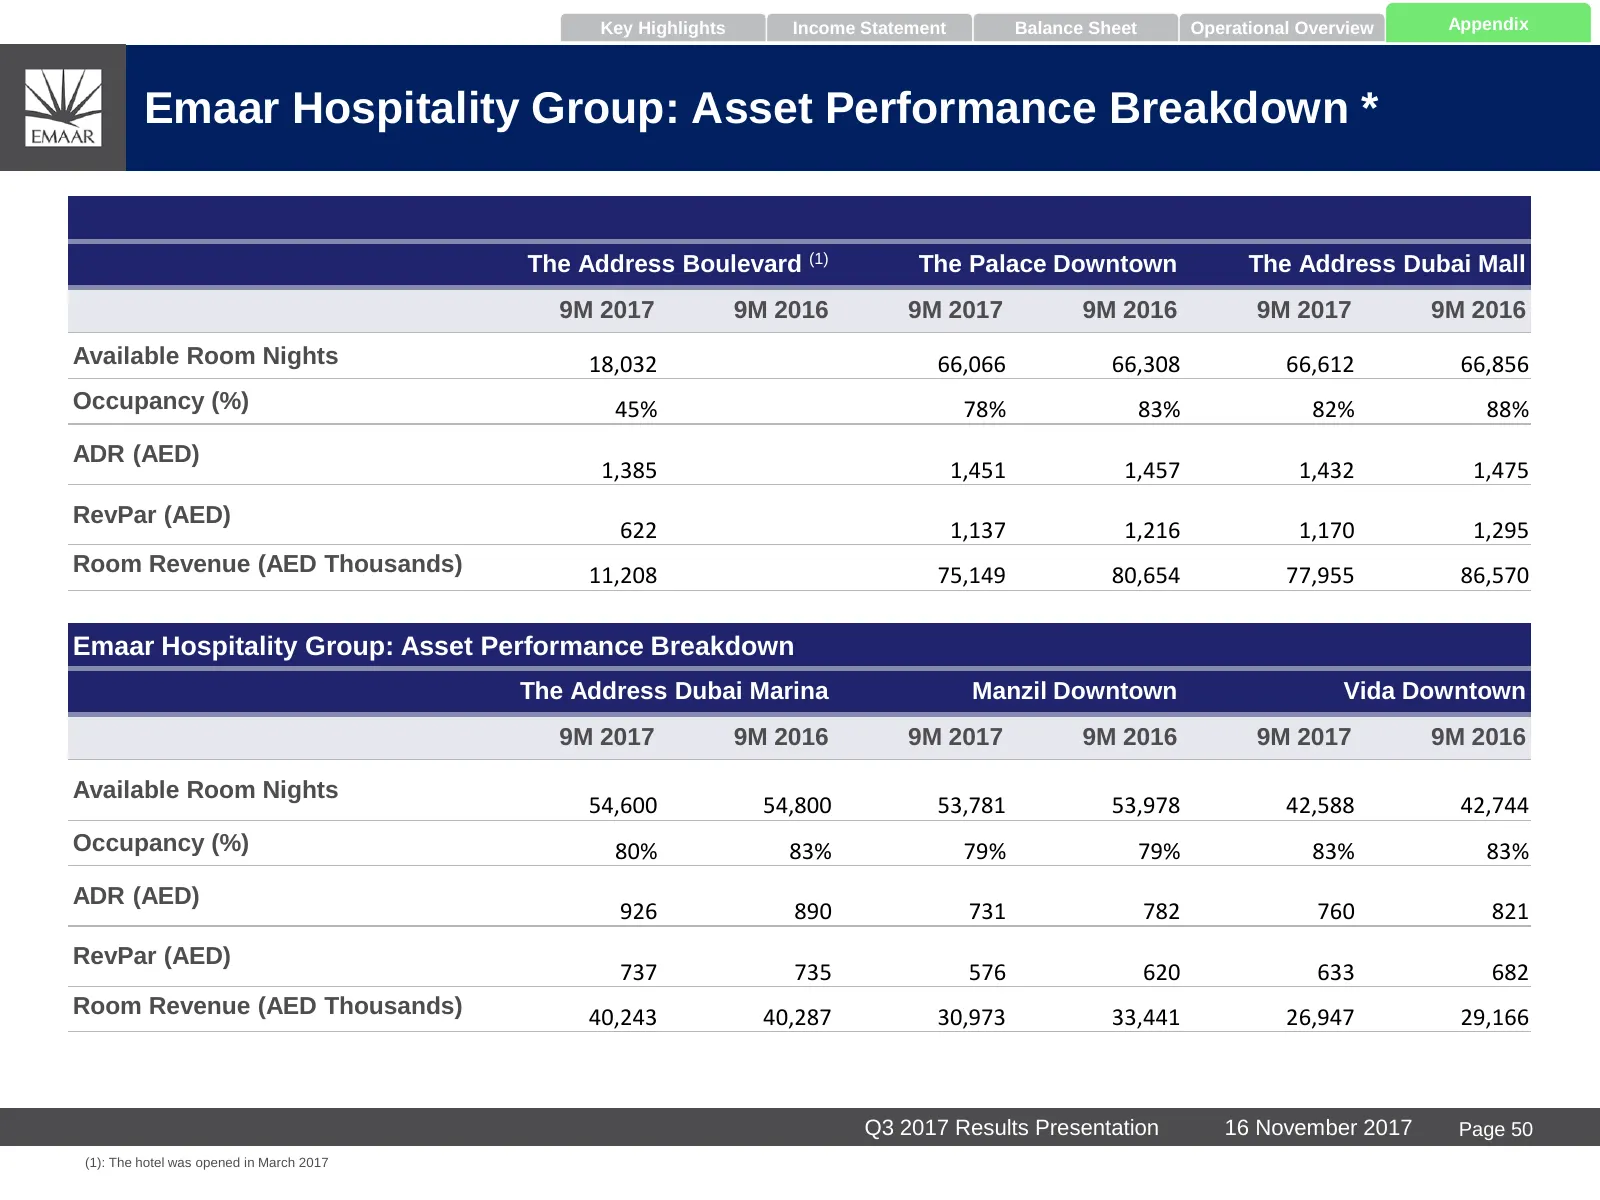
Key Highlights Income Statement Balance Sheet Operational Overview Appendix Emaar Hospitality Group: Asset Performance Breakdown * The Address Boulevard (1) The Palace Downtown The Address Dubai Mall 9M 2017 9M 2016 9M 2017 9M 2016 9M 2017 9M 2016 Available Room Nights 18,032 66,066 66,308 66,612 66
Slide 52: Hotels / Apartments Under Development
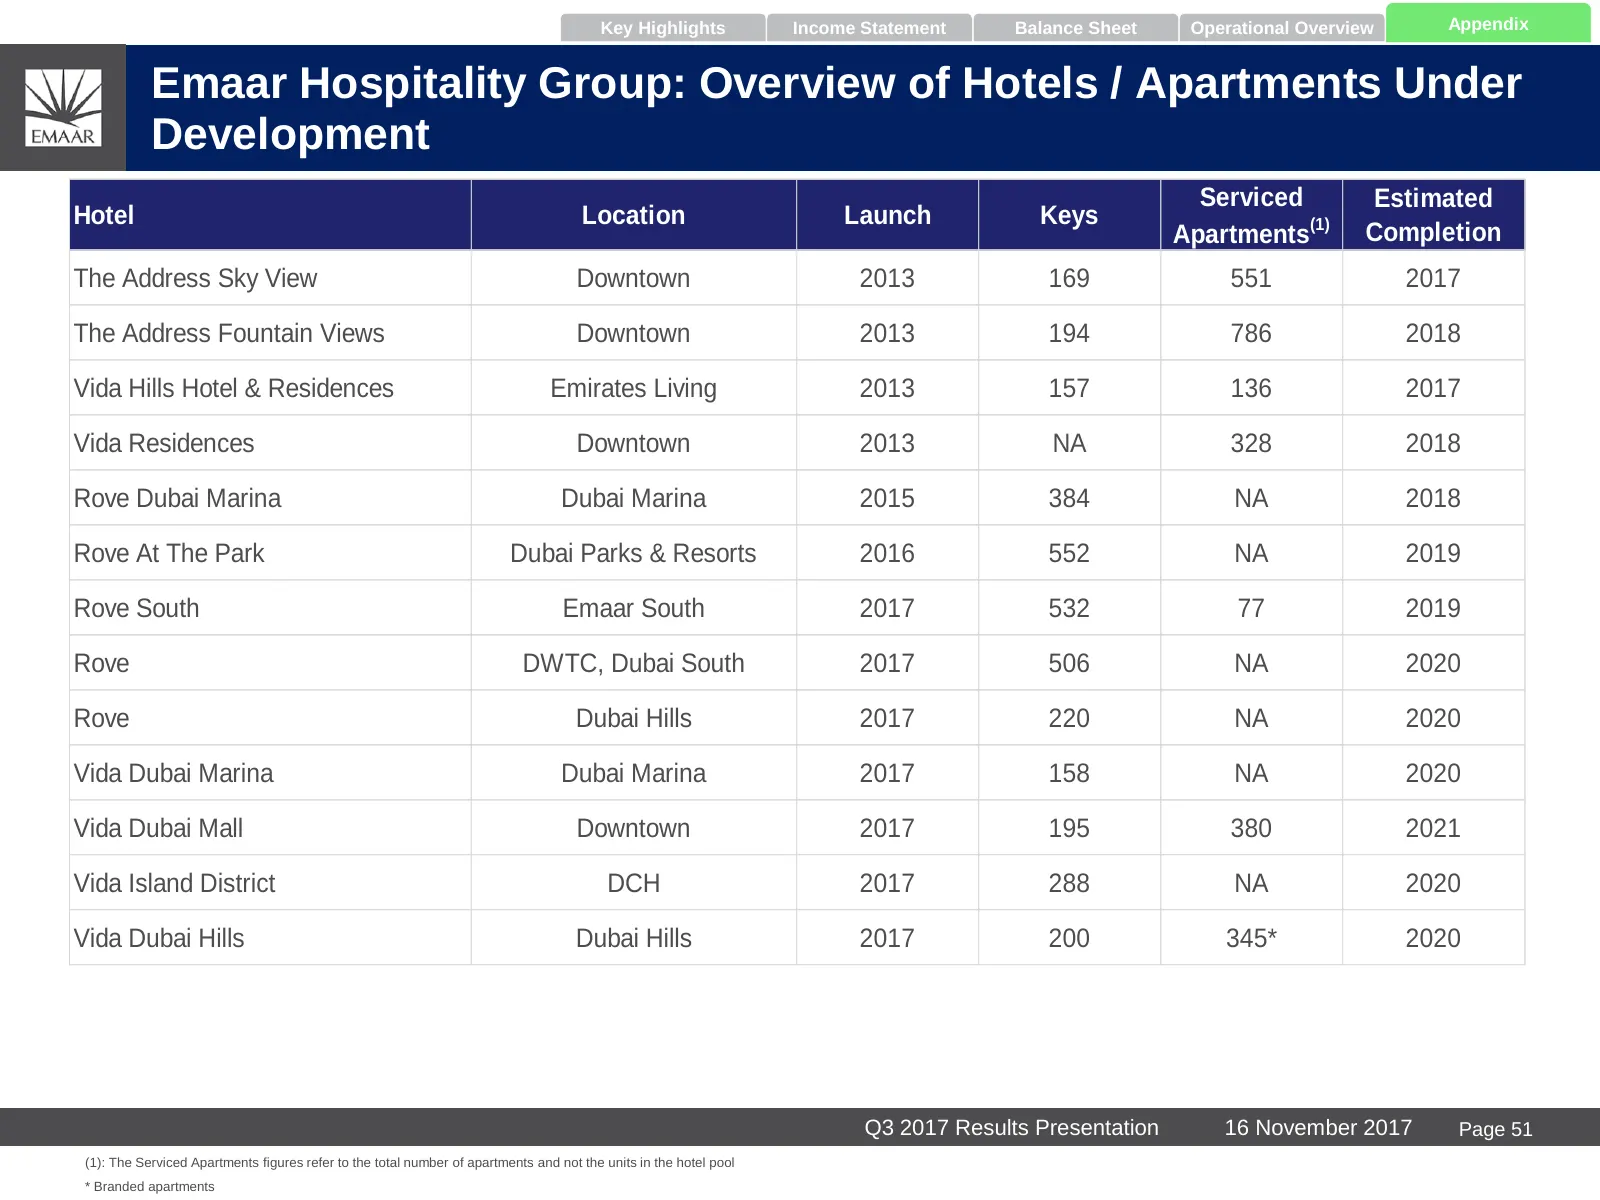
Key Highlights Income Statement Balance Sheet Operational Overview Appendix Emaar Hospitality Group: Overview of Hotels / Apartments Under Development Serviced Estimated Hotel Location Launch Keys Apartments(1) Completion The Address Sky View Downtown 2013 169 551 2017 The Address Fountain Views Dow
Slide 53: Appendix E – Group Structure
Appendix E – Group Structure Page 52
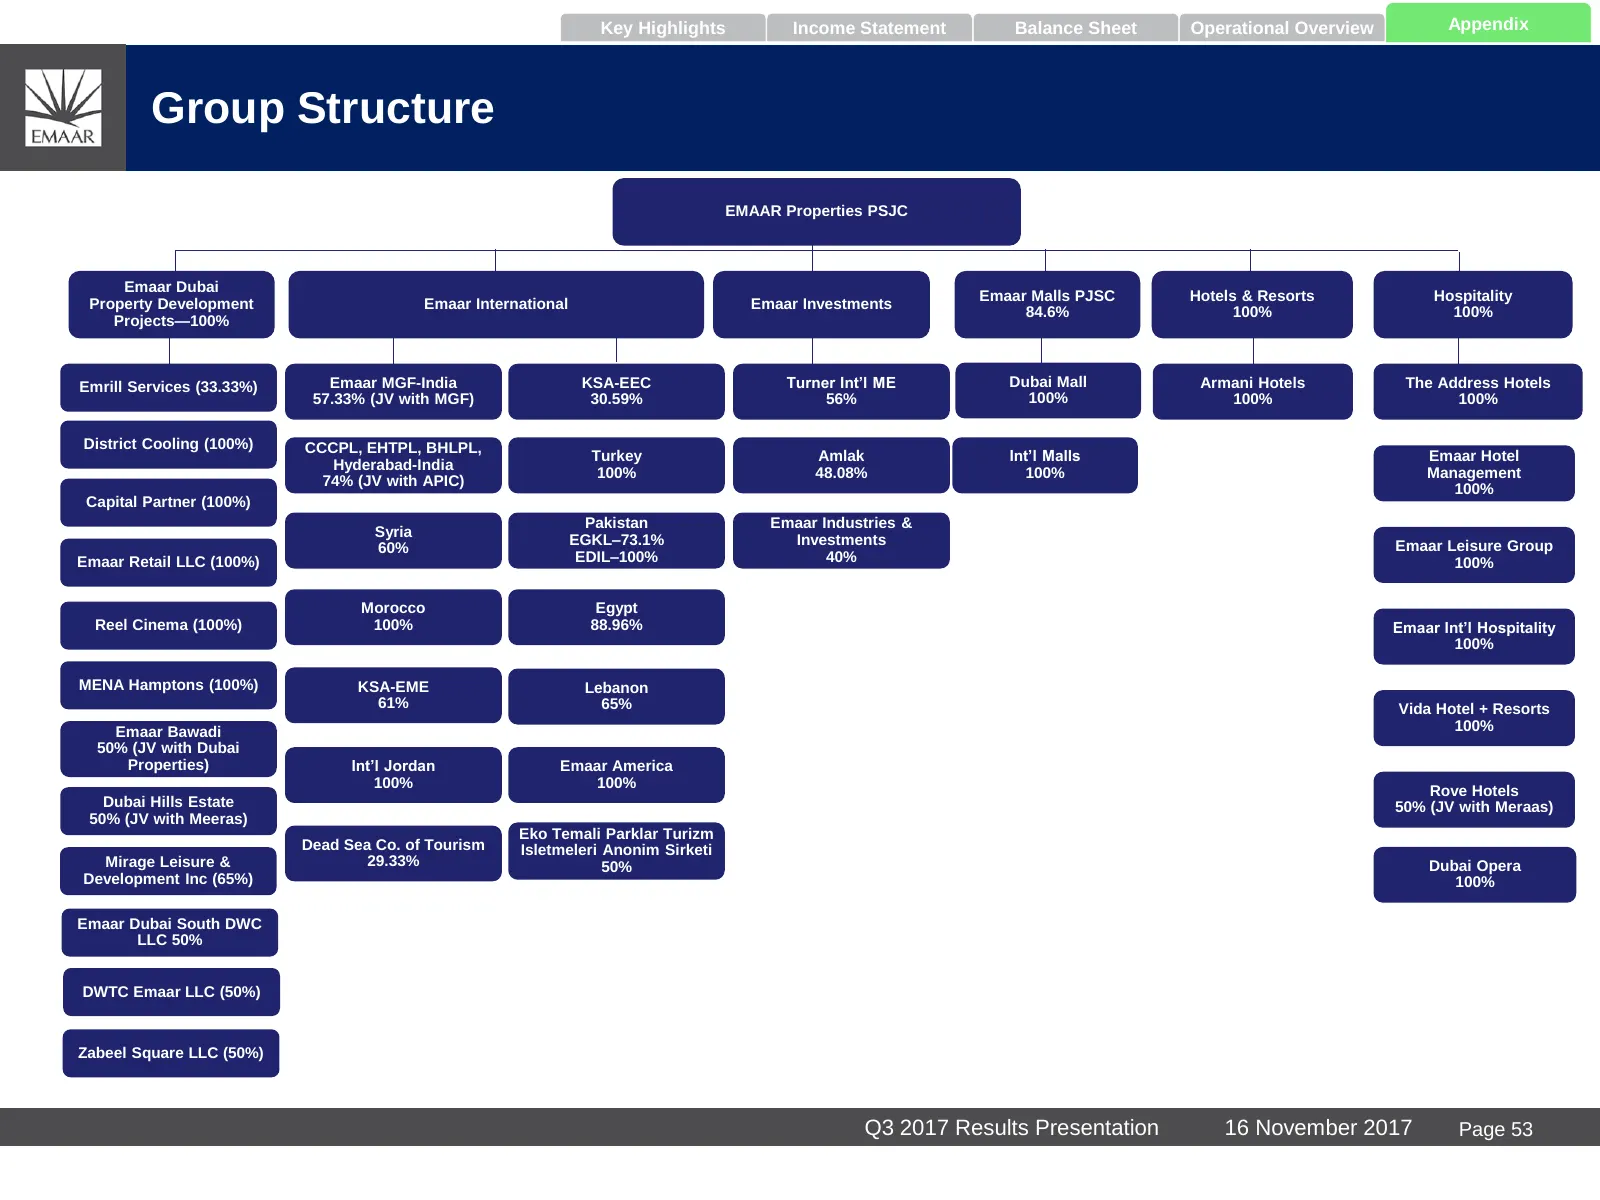
Slide 54: Group Structure
Key Highlights Income Statement Balance Sheet Operational Overview Appendix Group Structure EMAAR Properties PSJC Emaar Dubai Emaar Malls PJSC Hotels & Resorts Hospitality Property Development Emaar International Emaar Investments 84.6% 100% 100% Projects—100% Emrill Services (33.33%) Emaar MGF-Indi
Source: Internet Archive copy of cdn.properties.emaar.com
More decks from Emaar Properties (P.J.S.C)
 H1 2026 Earnings Presentation78 slides · 2026
 Emaar Properties — 9M 2025 Earnings Presentation69 slides · November 2025
 H1 2025 Earnings Presentation69 slides · August 2025
 Emaar Properties — Q1 2025 Earnings Presentation68 slides · May 2025
 Emaar Properties — FY2025 Earnings Presentation71 slides · May 2025
 FY2024 Earnings Presentation70 slides · Feb 24, 2025