American National Bankshares Inc
American National Bankshares — Investor Presentation (August 2008)
31 slides from American National Bankshares's investor presentation, Aug 5, 2008
Slide 1: American National Bankshares Inc.
AMERICAN NATIONAL BANKSHARES INC.
Slide 2: Contact Information
=— > AMERICAN NATIONAL BANKSHARES INC. Contact Information Charles H. Majors Neal A. Petrovich President and Chief Executive Officer Senior Vice President and 628 Main Street Chief Financial Officer Danville, VA 24541 103 Tower Drive Phone: 434-773-2219 Danville, VA 24540 E-mail: majorsc@amnb.com Ph
Slide 3: Forward-Looking Statements
= Sa AMERICAN NATIONAL BANKSHARES INC. Forward-Looking Statements This presentation may contain "forward-looking statements," within the meaning of federal securities laws that involve significant risks and uncertainties. Statements herein are based on certain assumptions and analyses by the Corpora
Slide 4: Balance Sheet Highlights — 6/30/08
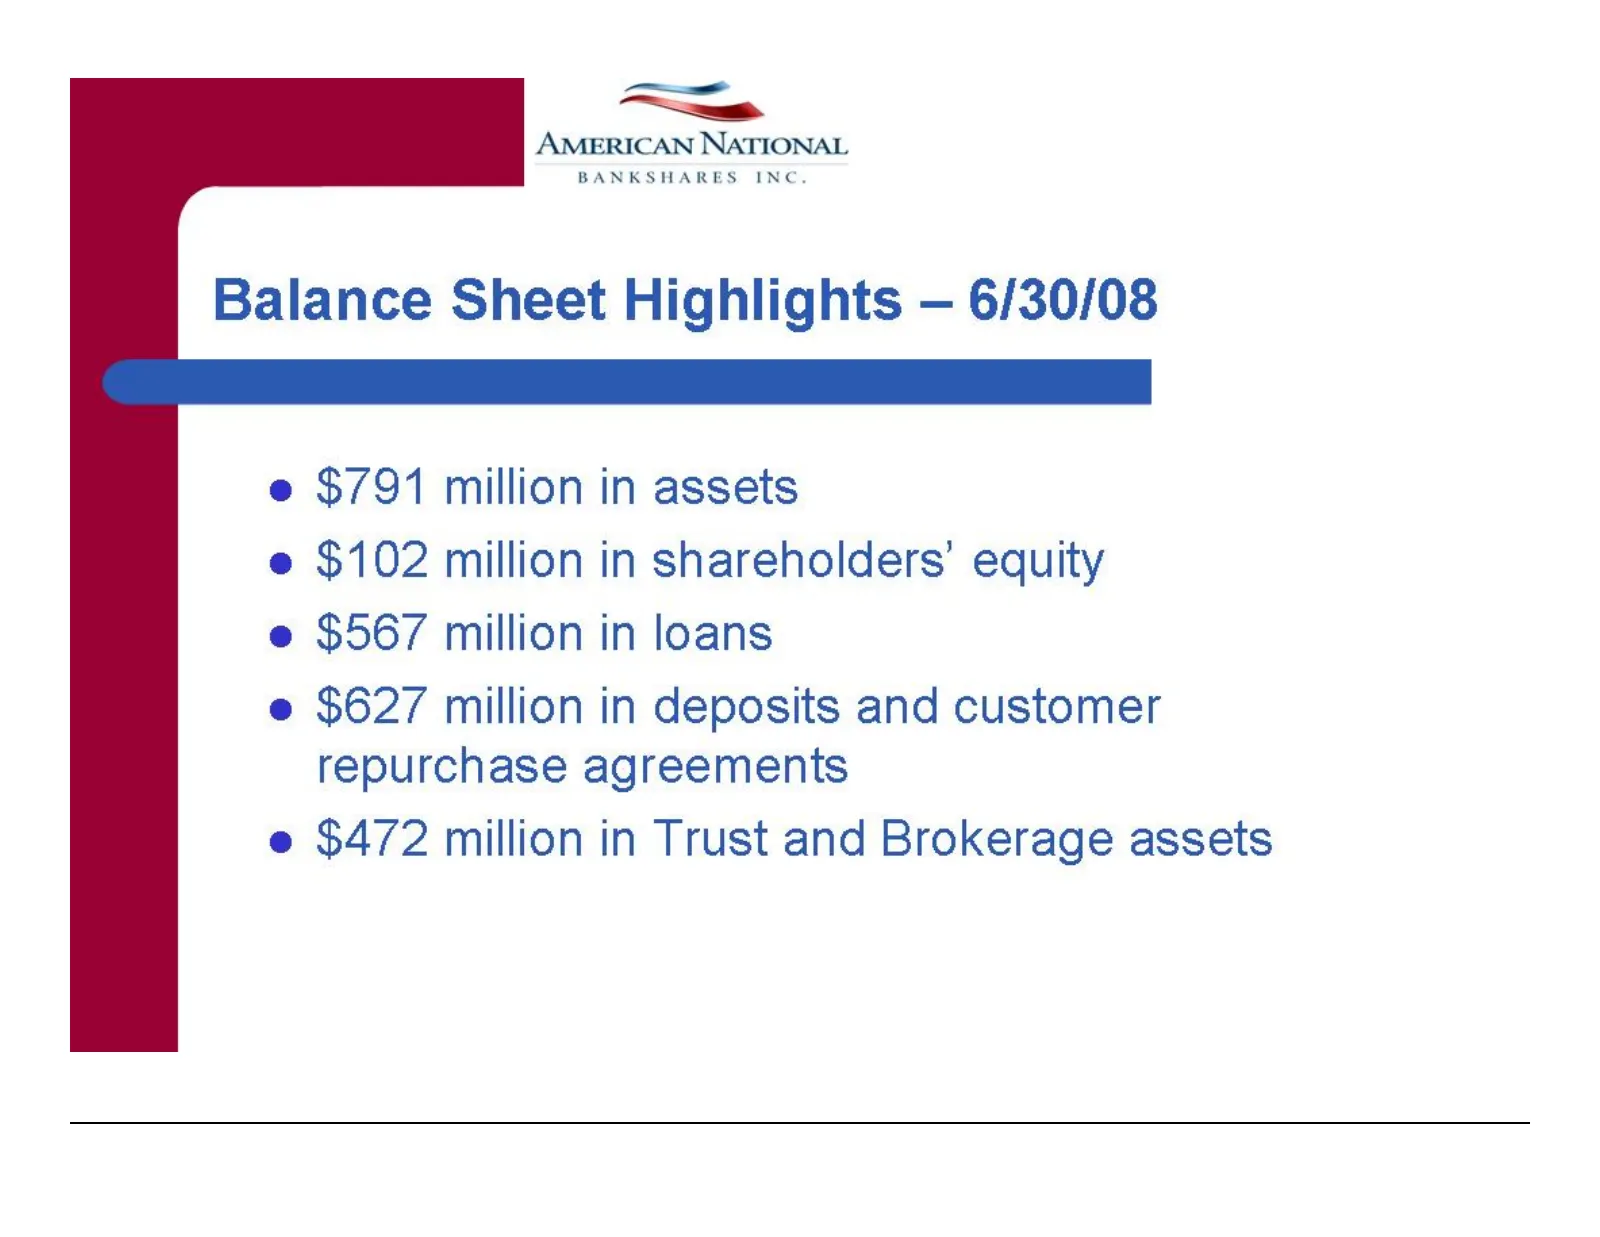
AMERICAN NATIONAL BA Ss ES INC. Balance Sheet Highlights — 6/30/08 e $791 million in assets e $102 million in shareholders’ equity e $567 million in loans e $627 million in deposits and customer repurchase agreements e $472 million in Trust and Brokerage assets
Slide 5: American National Profile
=— > AMERICAN NATIONAL BANKSHARES INC. American National Profile e@ Bank founded in 1909 @ Holding company founded in 1984 e@ Headquartered in Danville, VA e@ Commercial and retail banking = e Financial services > — Trust ~ Eee AMERICAN NATIONAL — Insurance — Mortgage Your Relationship Bank e Twenty
Slide 6: Market Area
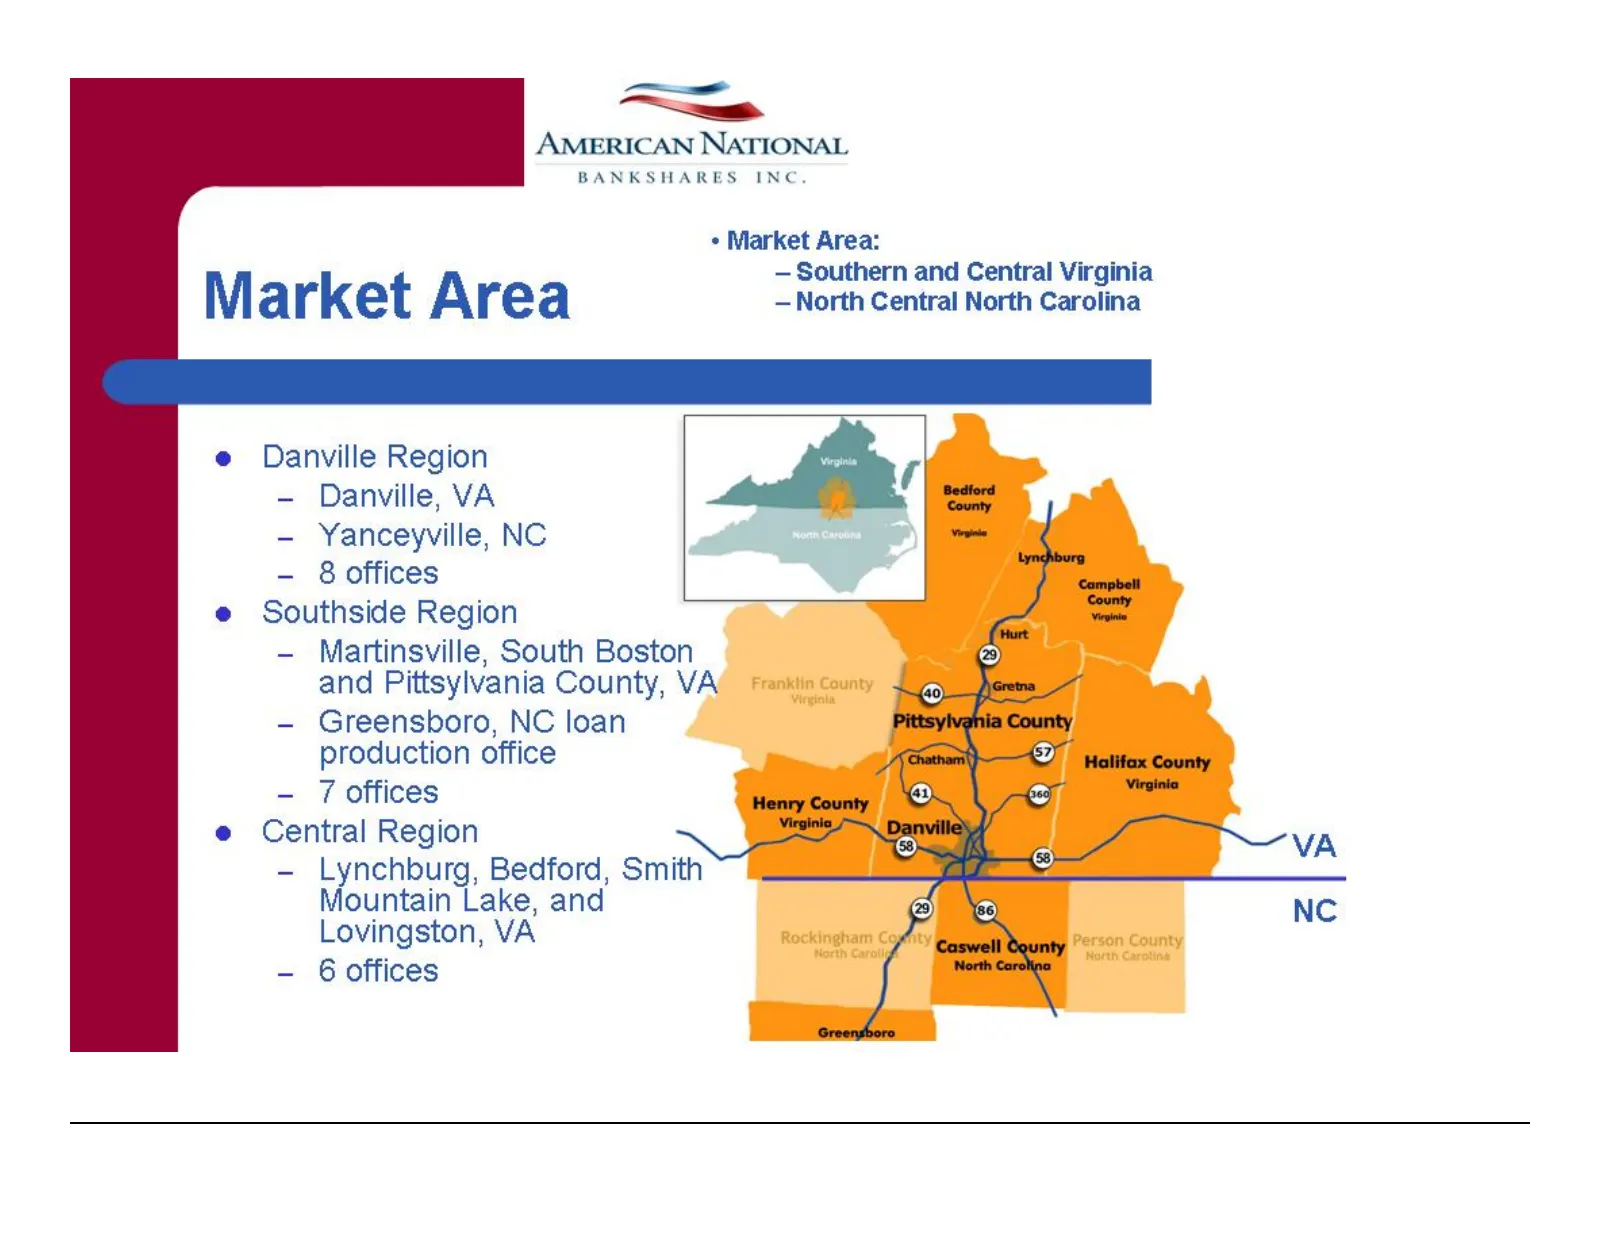
i > AMERICAN NATIONAL BANKSHARES INC. * Market Area: Market Area sn ye hig e Danville Region - Danville, VA - Yanceyville, NC - 8 offices e Southside Region - Martinsville, South Boston and Pittsylvania County, VA - Greensboro, NC loan production office - 7 offices e Central Region - Lynchburg, Bedf
Slide 7: Acquisition of Community First Financial Corporation
AMERICAN NATIONAL BA Ss ES INC. Acquisition of Community First Financial Corporation e Parent company of Community First Bank e Date Closed — April 1, 2006 e Approximately $140 million in loans and deposits each e Growth market e Four offices
Slide 8: Deposit and Loan Distribution by Market
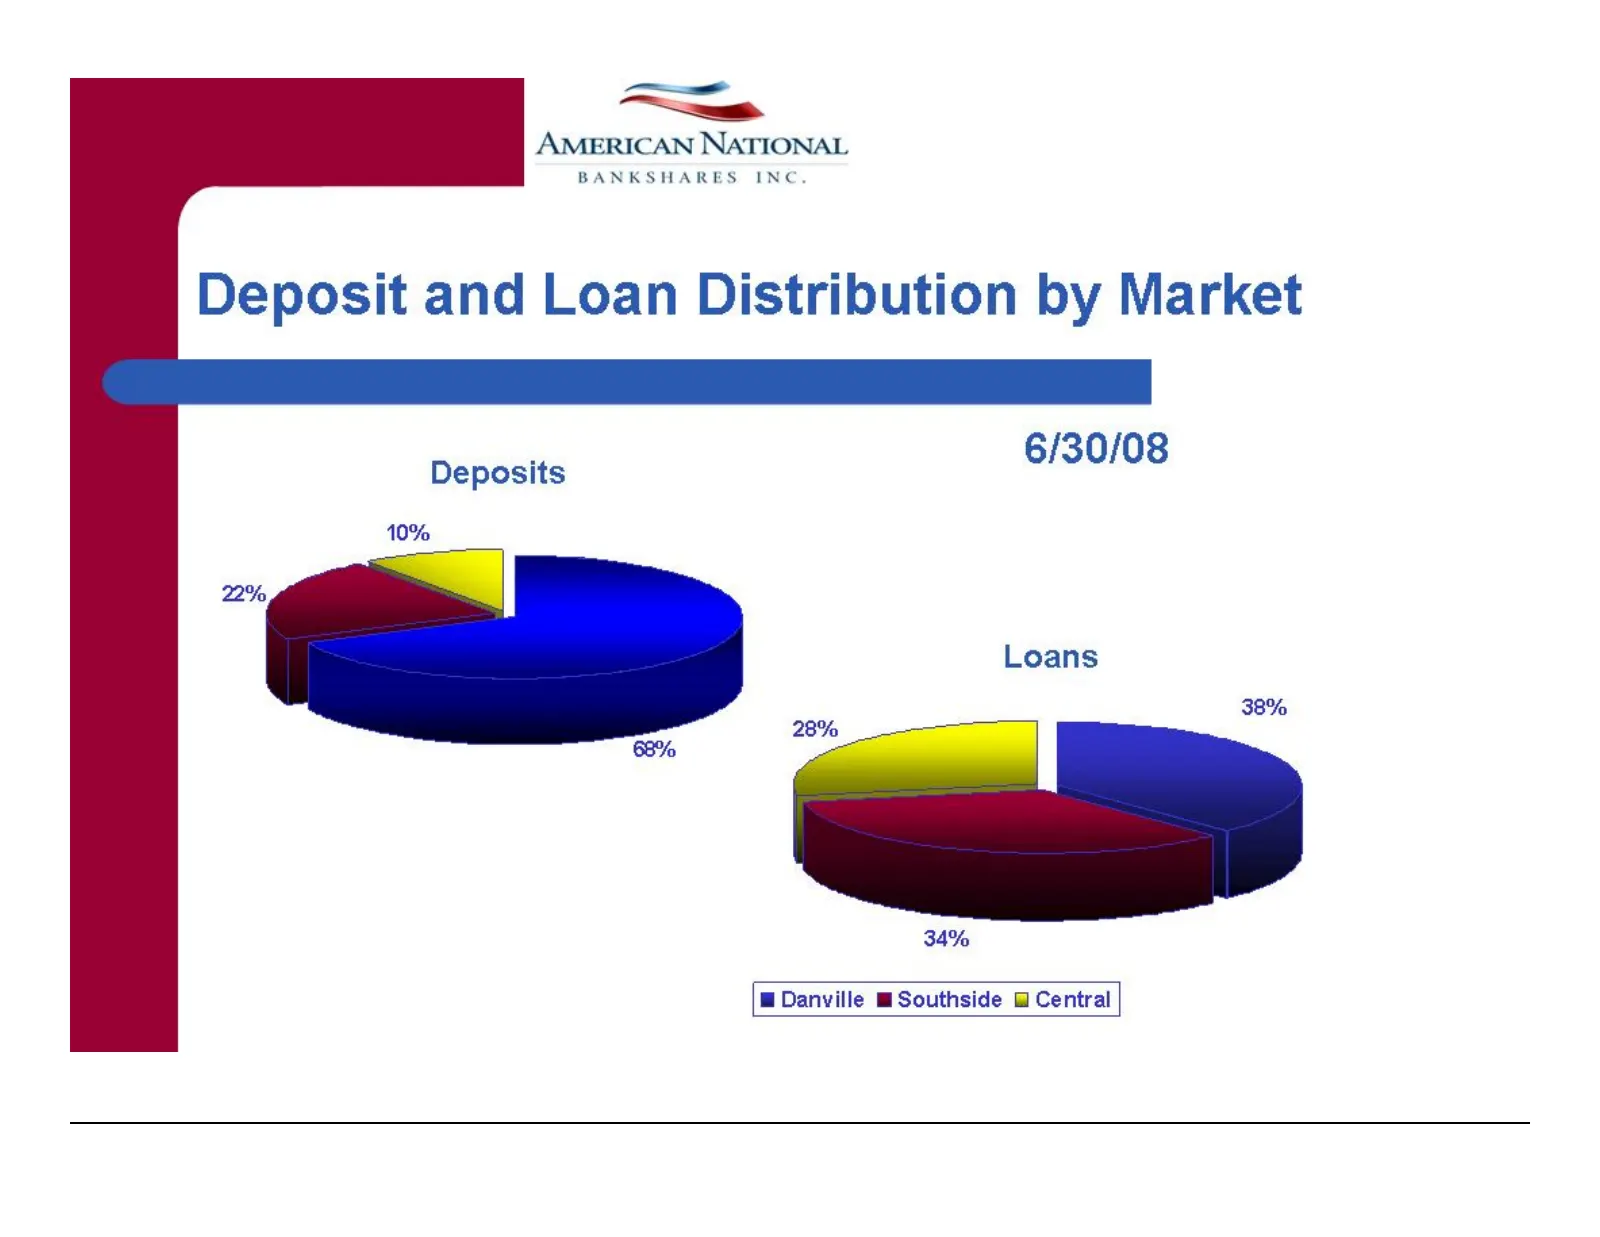
ee — AMERICAN NATIONAL BANKSHARES INC. Deposit and Loan Distribution by Market 6/30/08 Deposits 10% Loans 38% 34% @ Danville @ Southside @ Central
Slide 9: Common Stock Information
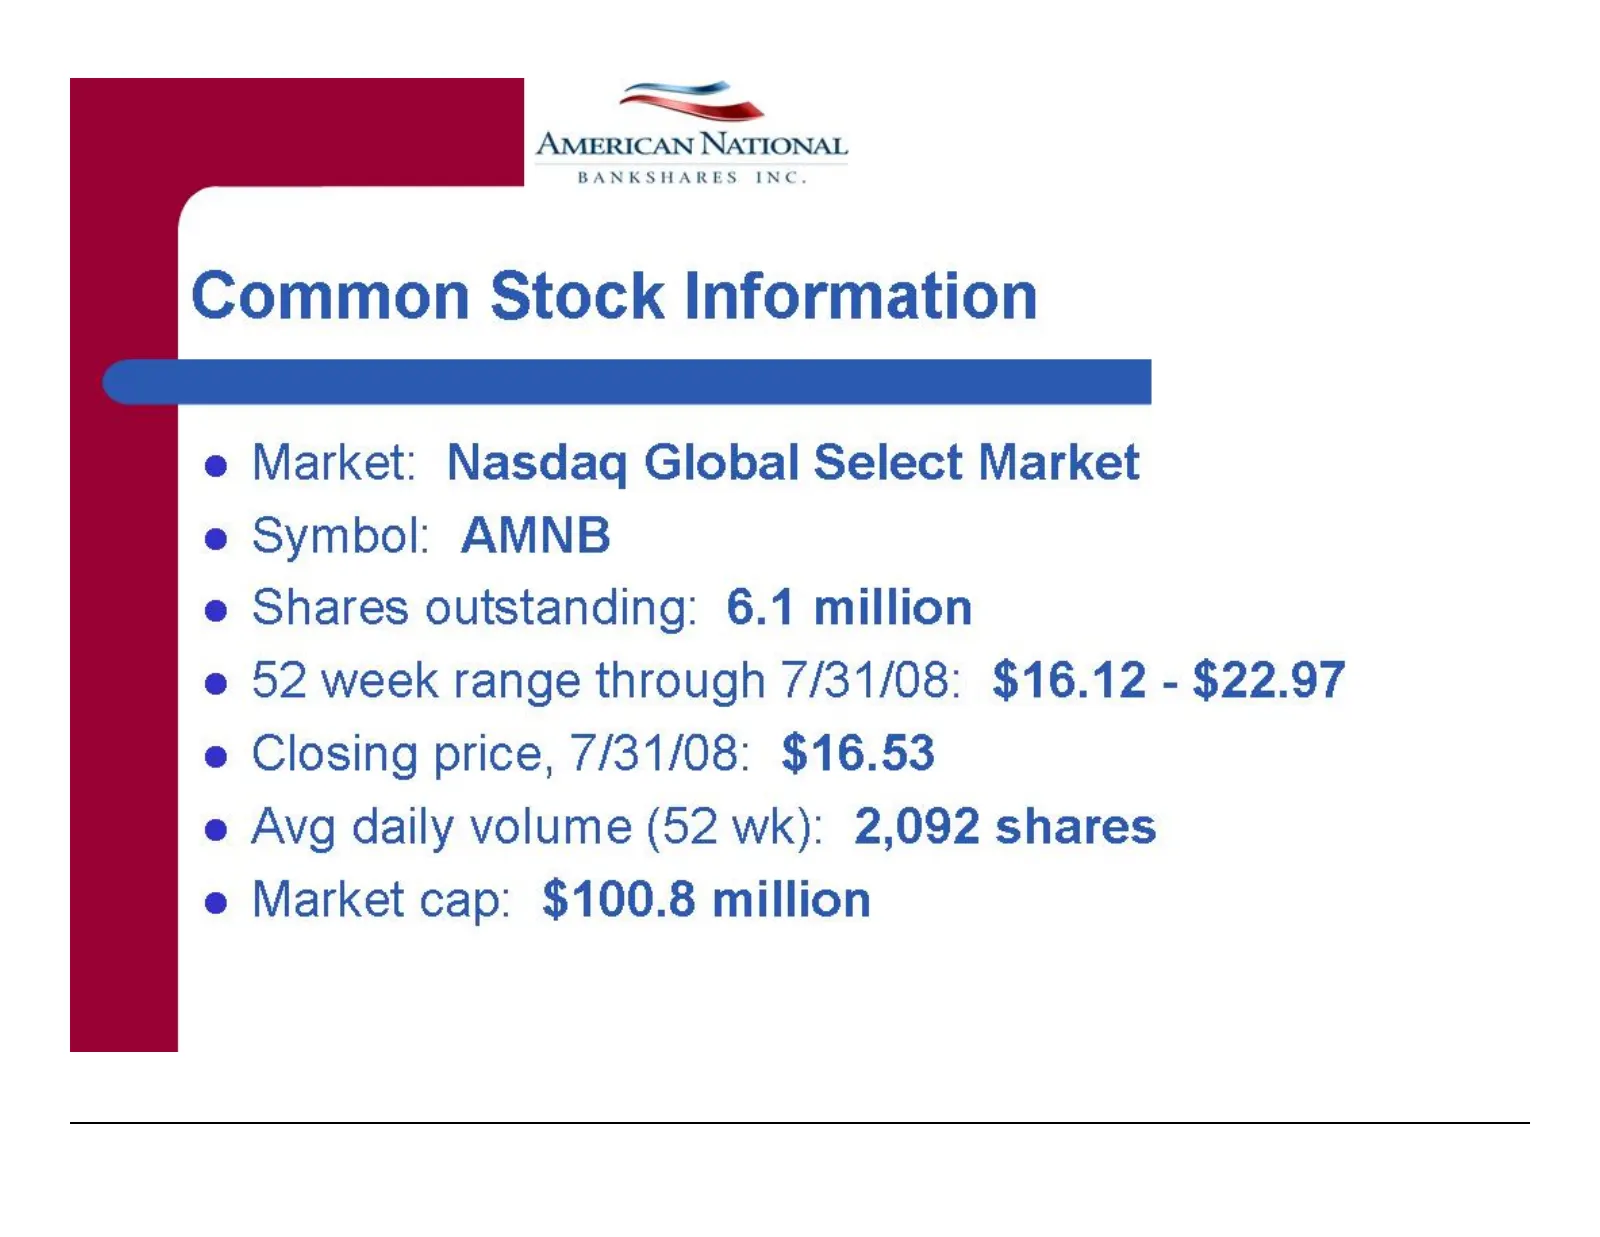
Common Stock Information e Market: Nasdaq Global Select Market e Symbol: AMNB e Shares outstanding: 6.1 million e 52 week range through 7/31/08: $16.12 - $22.97 e Closing price, 7/31/08: $16.53 e Avg daily volume (52 wk): 2,092 shares e Market cap: $100.8 million
Slide 10: Strategic Focus
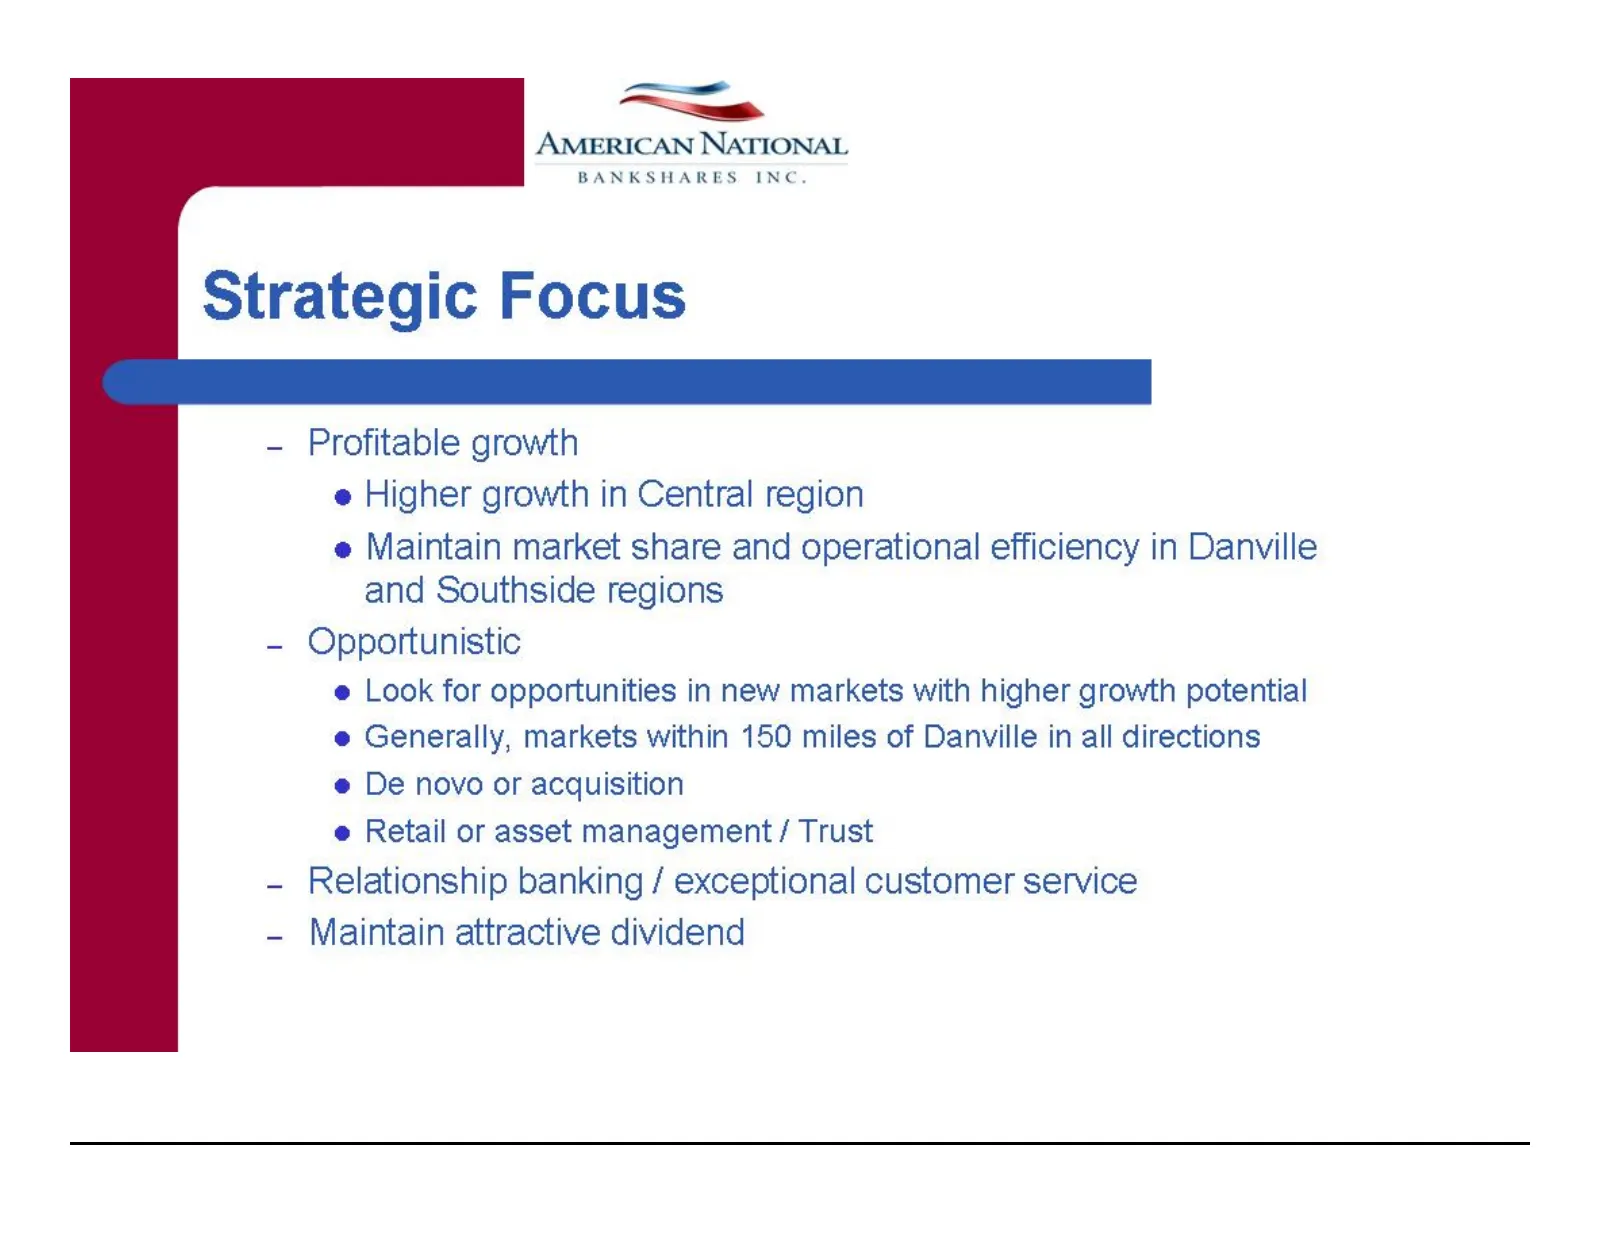
=— > AMERICAN NATIONAL BANKSHARES INC. Strategic Focus Profitable growth e Higher growth in Central region e Maintain market share and operational efficiency in Danville and Southside regions - Opportunistic e Look for opportunities in new markets with higher growth potential e Generally, markets wi
Slide 11: Attractive Stock Price
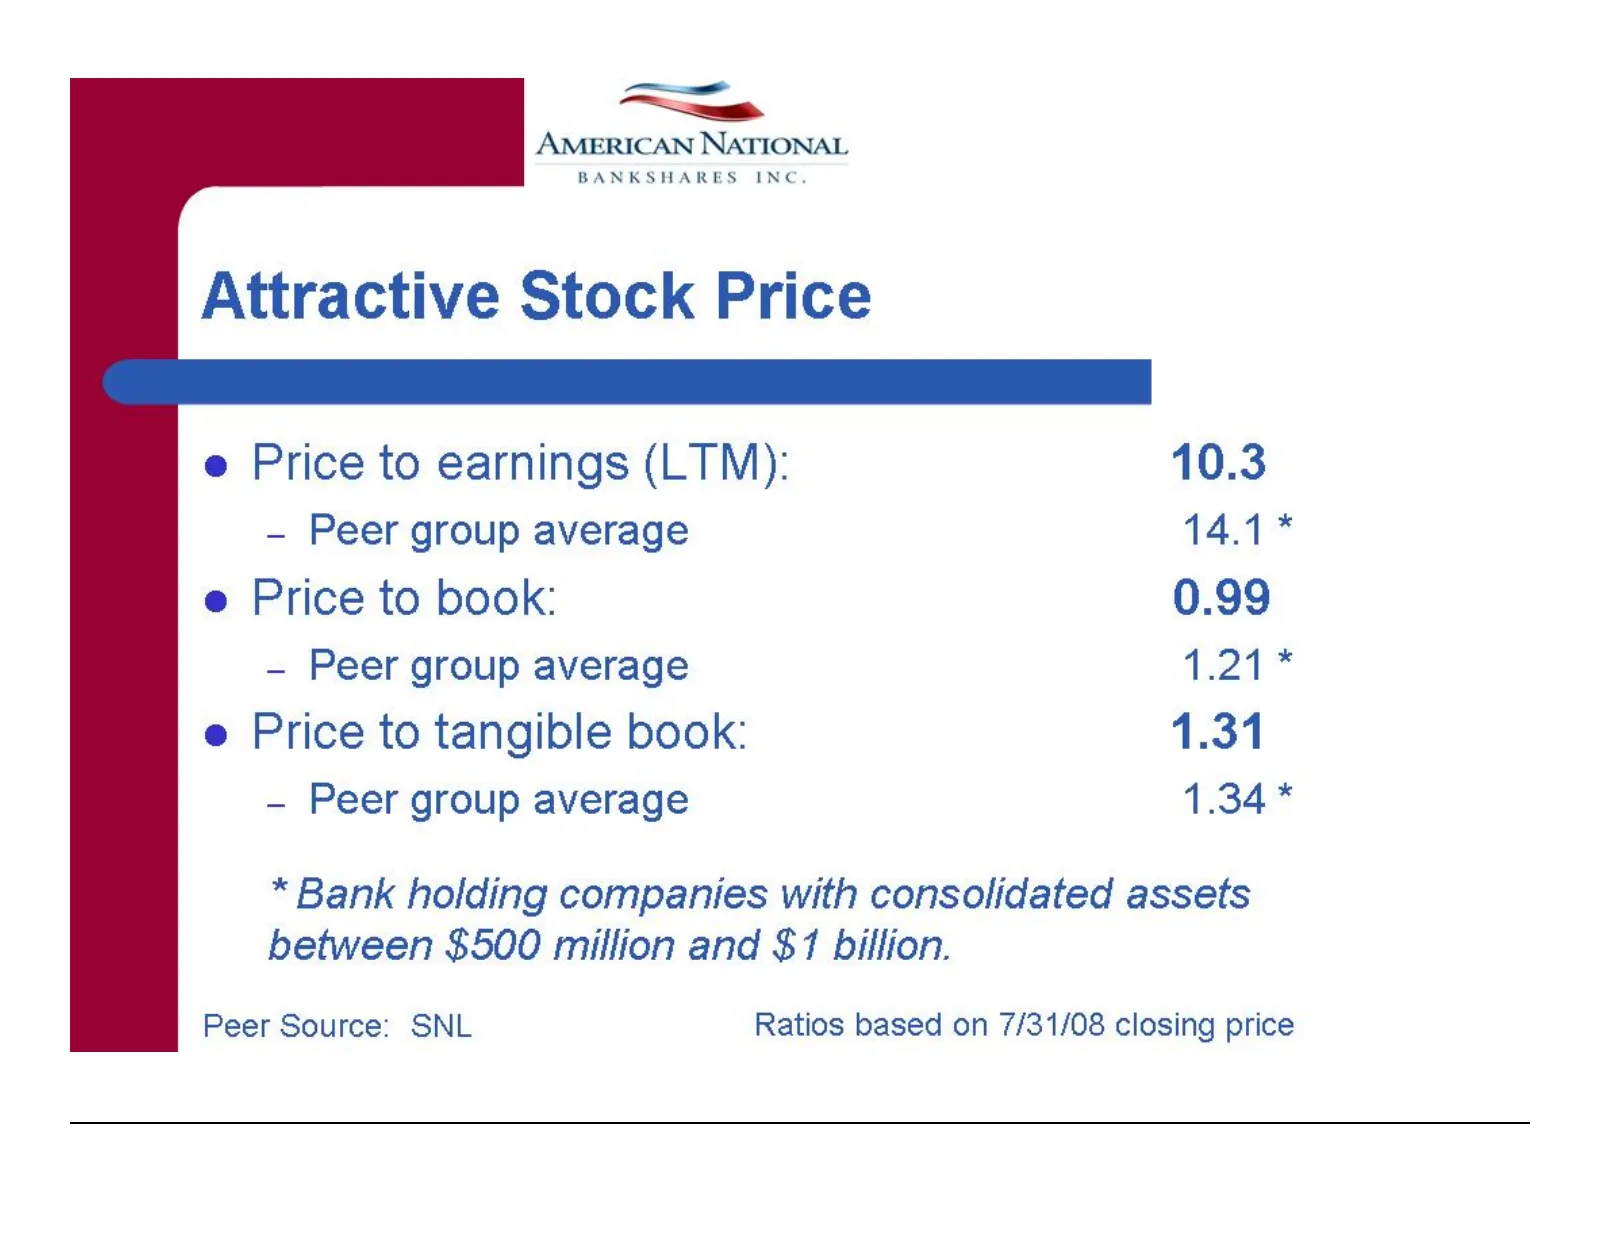
=— > AMERICAN NATIONAL BANKSHARES INC. Attractive Stock Price e Price to earnings (LTM): 10.3 - Peer group average 14.1 * e Price to book: 0.99 — Peer group average 1.21* e Price to tangible book: 1.31 - Peer group average 1.34* * Bank holding companies with consolidated assets between $500 million
Slide 12: Dividends
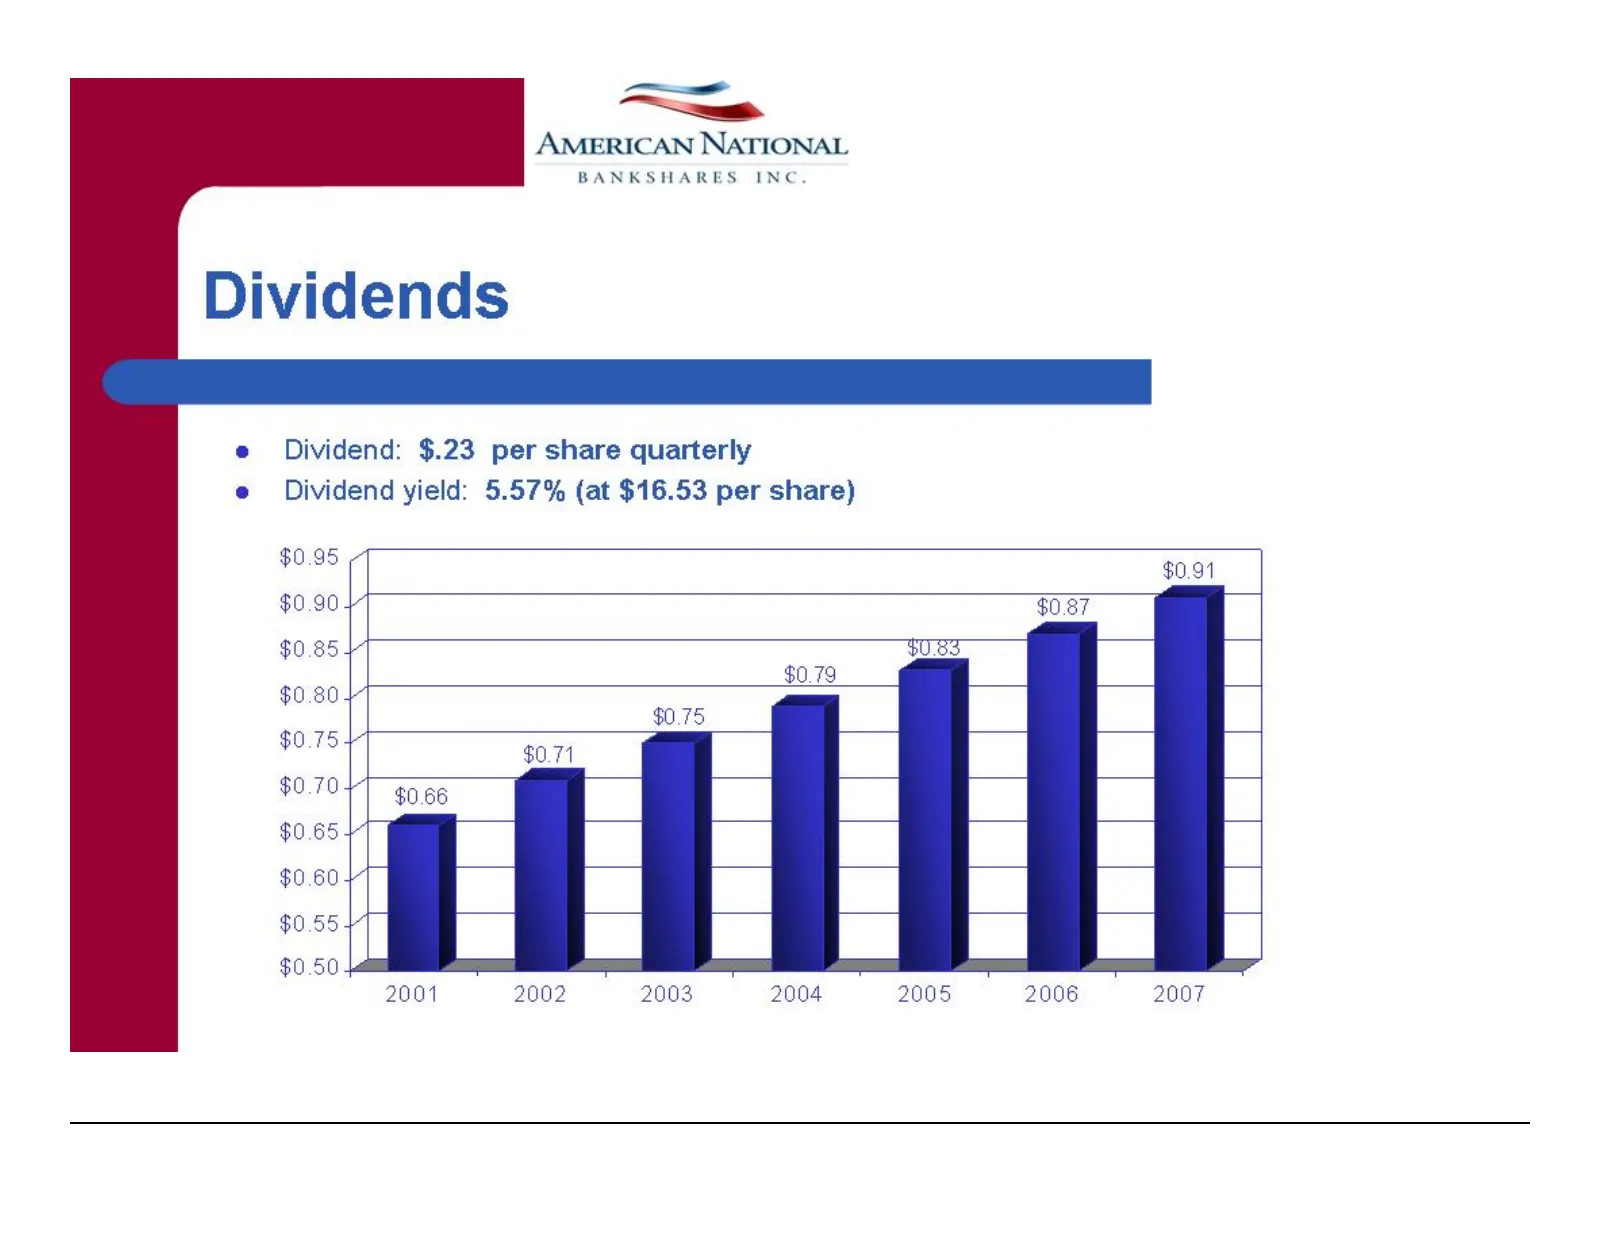
——_ > AMERICAN NATIONAL BANKSHARES INC. Dividends e Dividend: $.23 per share quarterly e Dividend yield: 5.57% (at $16.53 per share) $0.95 $0.90 4 $0.85 4 $0.80 4 $0.75 4 $0.70 4 $0.91 2001 2002 2003 2004 2005 2006 2007
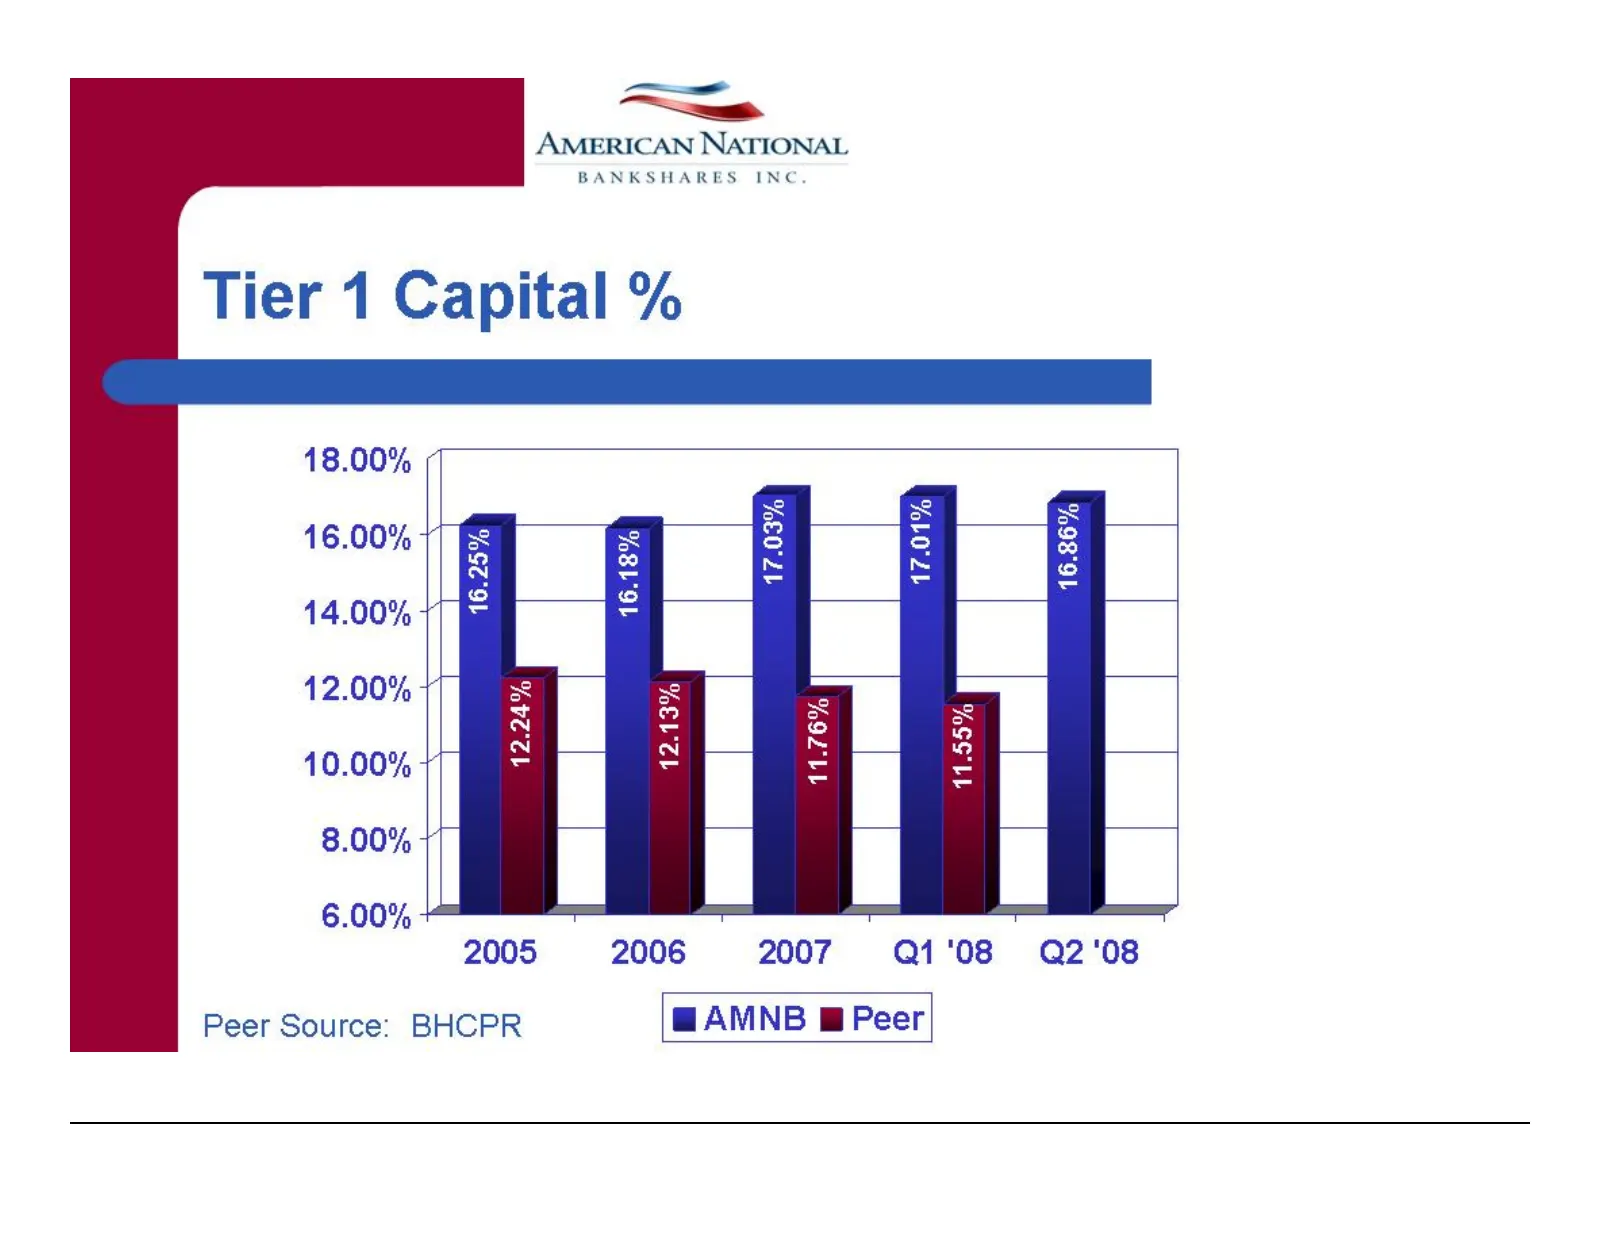
Slide 13: Tier Capital %
Tier 1 Capital % — > AMERICAN NATIONAL BANKSHARES INC. 18.00% 16.00% | 14.00% | 12.00% | 10.00% + 8.00% | 6.00% * 2005 Peer Source: BHCPR 2006 2007. Q1'08 )§=Q2'08 @ AMNB @ Peer
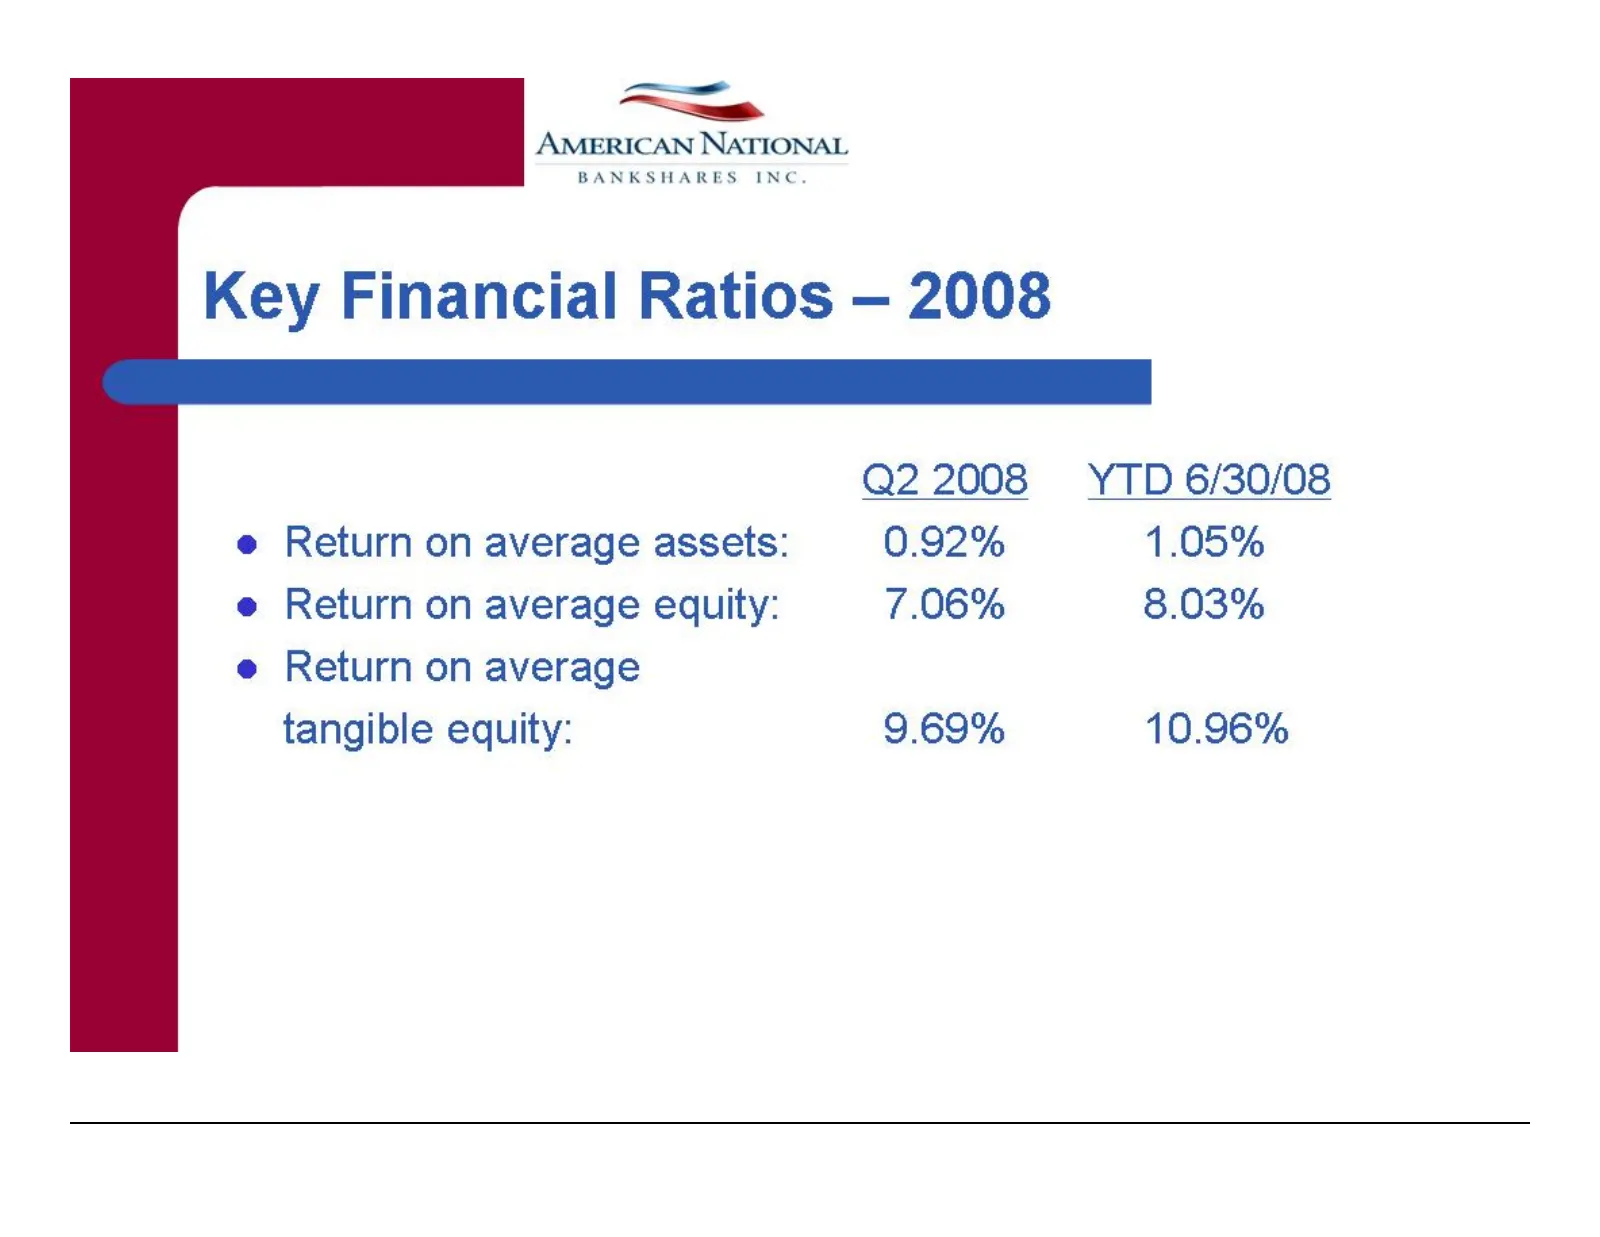
Slide 14: Key Financial Ratios — 2008
=— > AMERICAN NATIONAL BANKSHARES INC. Key Financial Ratios — 2008 Q2 2008 YTD 6/30/08 e Return on average assets: 0.92% 1.05% e Return on average equity: 7.06% 8.03% e Return on average tangible equity: 9.69% 10.96%
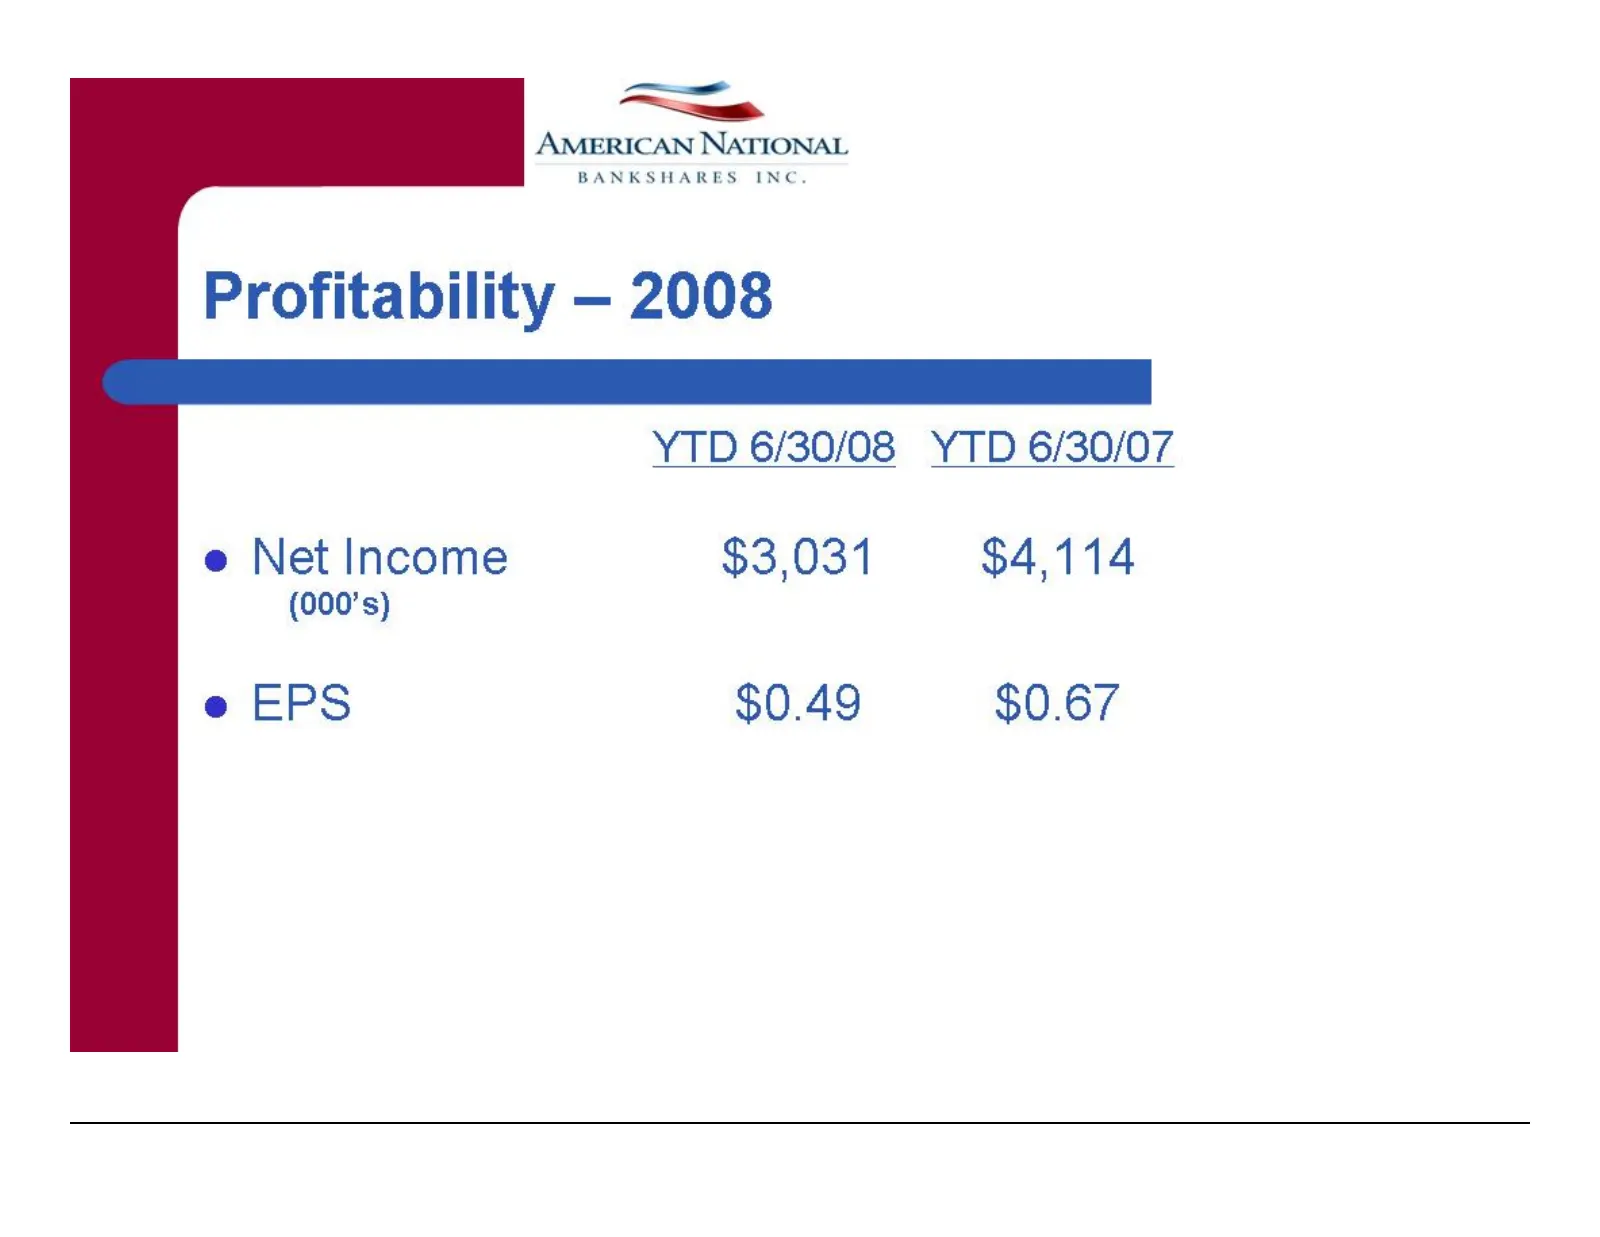
Slide 15: Profitability — 2008
AMERICAN NATIONAL eee econ Profitability — 2008 YTD 6/30/08 YTD 6/30/07 e Net Income $3,031 $4,114 (000’s) e EPS $0.49 $0.67
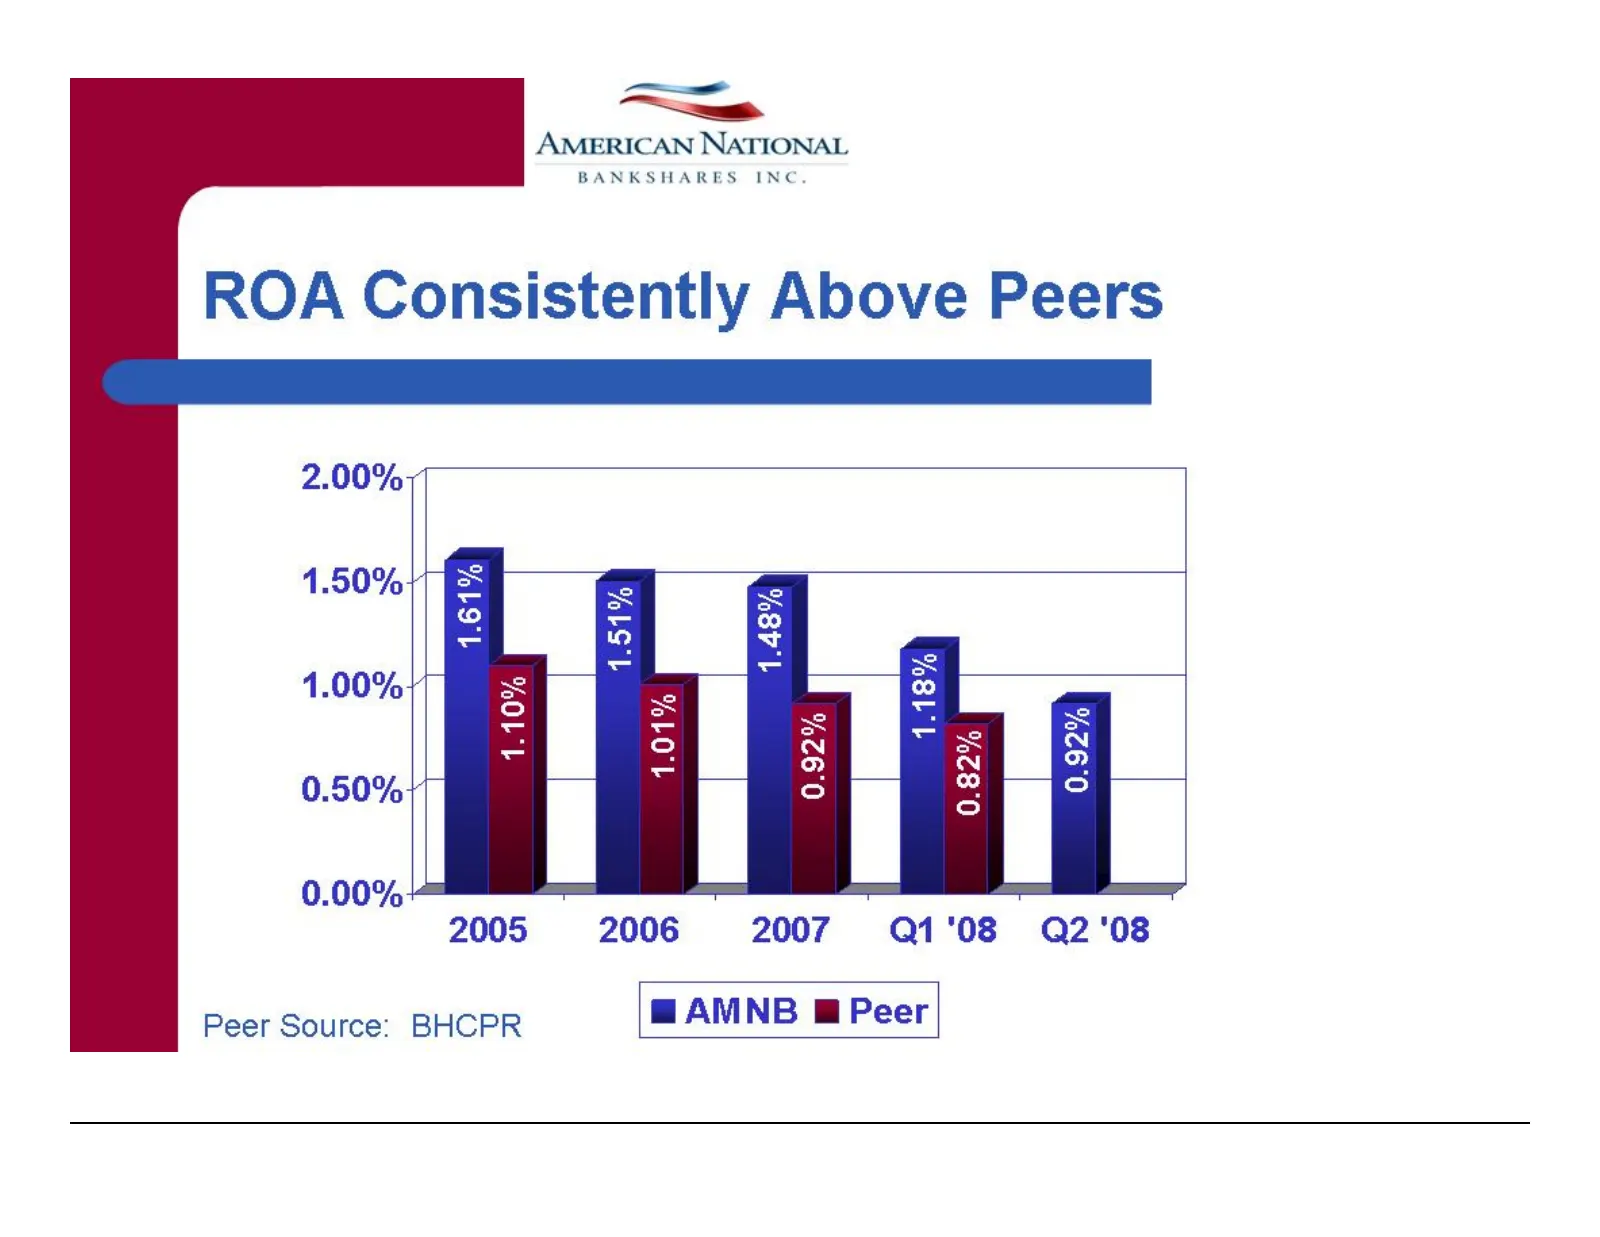
Slide 16: ROA Consistently Above Peers
—_—————— > AMERICAN NATIONAL BANKSHARES INC. ROA Consistently Above Peers 2.00%) 1.50% 1.00% 0.50% 0.00%: 2005 2006 2007. Q1'08 = Q2'08 Peer Source: BHCPR @ AMNB @ Peer
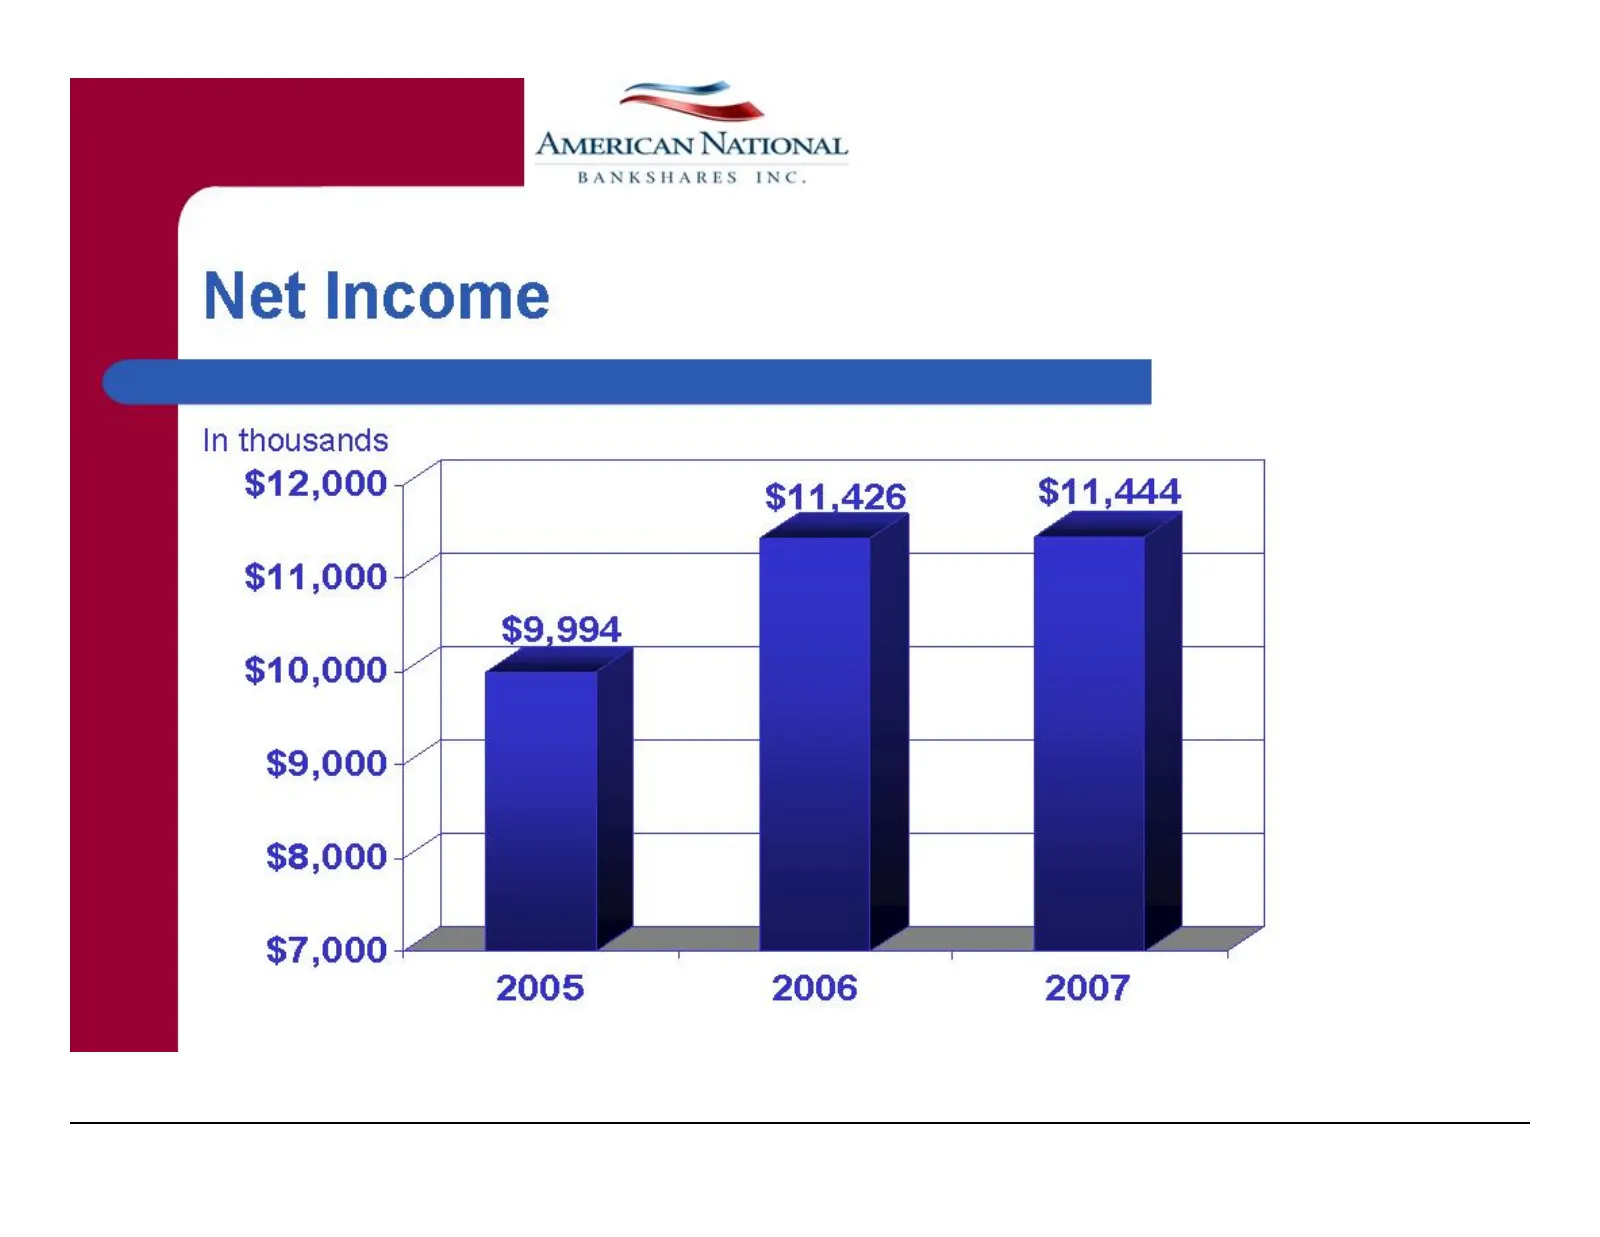
Slide 17: Net Income
In thousands $12,000 - $11,000 ; $10,000, $9,000 | $8,000, Net Income $7,000; <P —> AMERICAN NATIONAL BANKSHARES INC. $11,426 2005 2006 2007
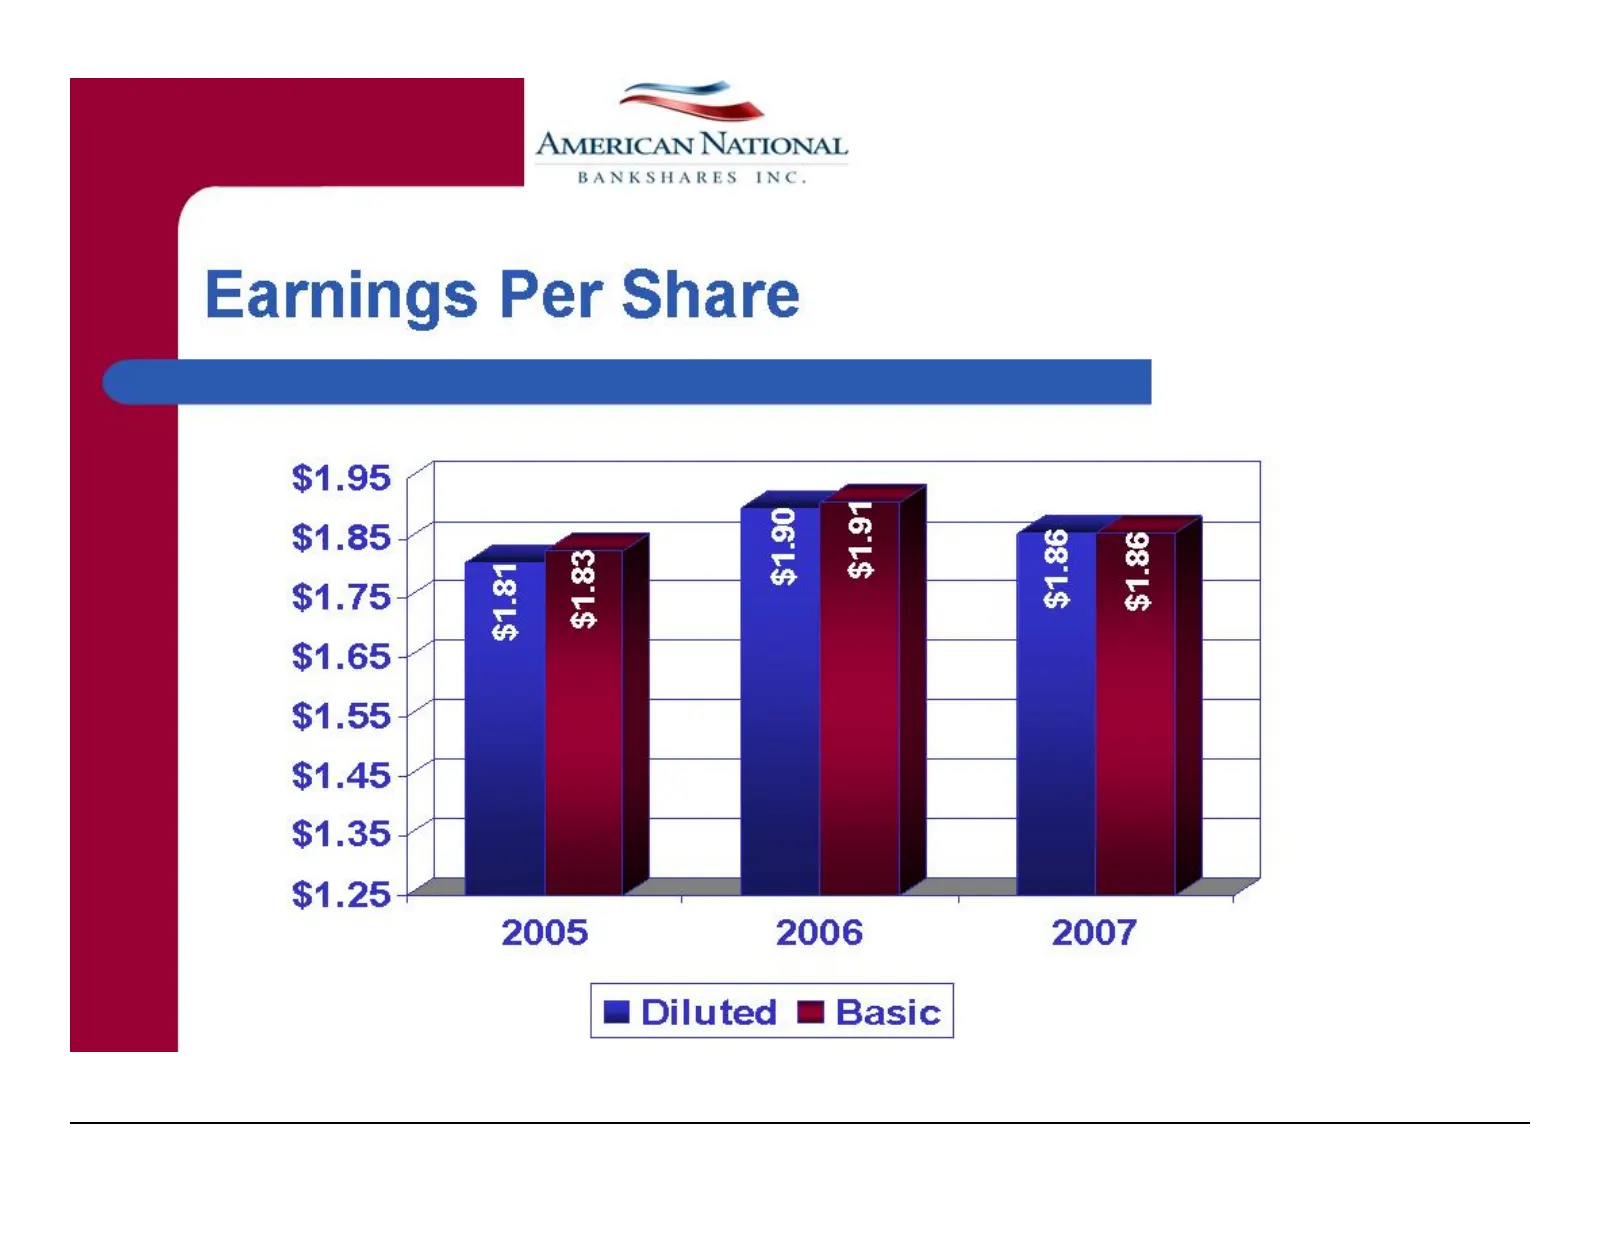
Slide 18: Earnings Per Share
—_—————— > AMERICAN NATIONAL BANKSHARES INC. Earnings Per Share 2006 @ Diluted M@ Basic
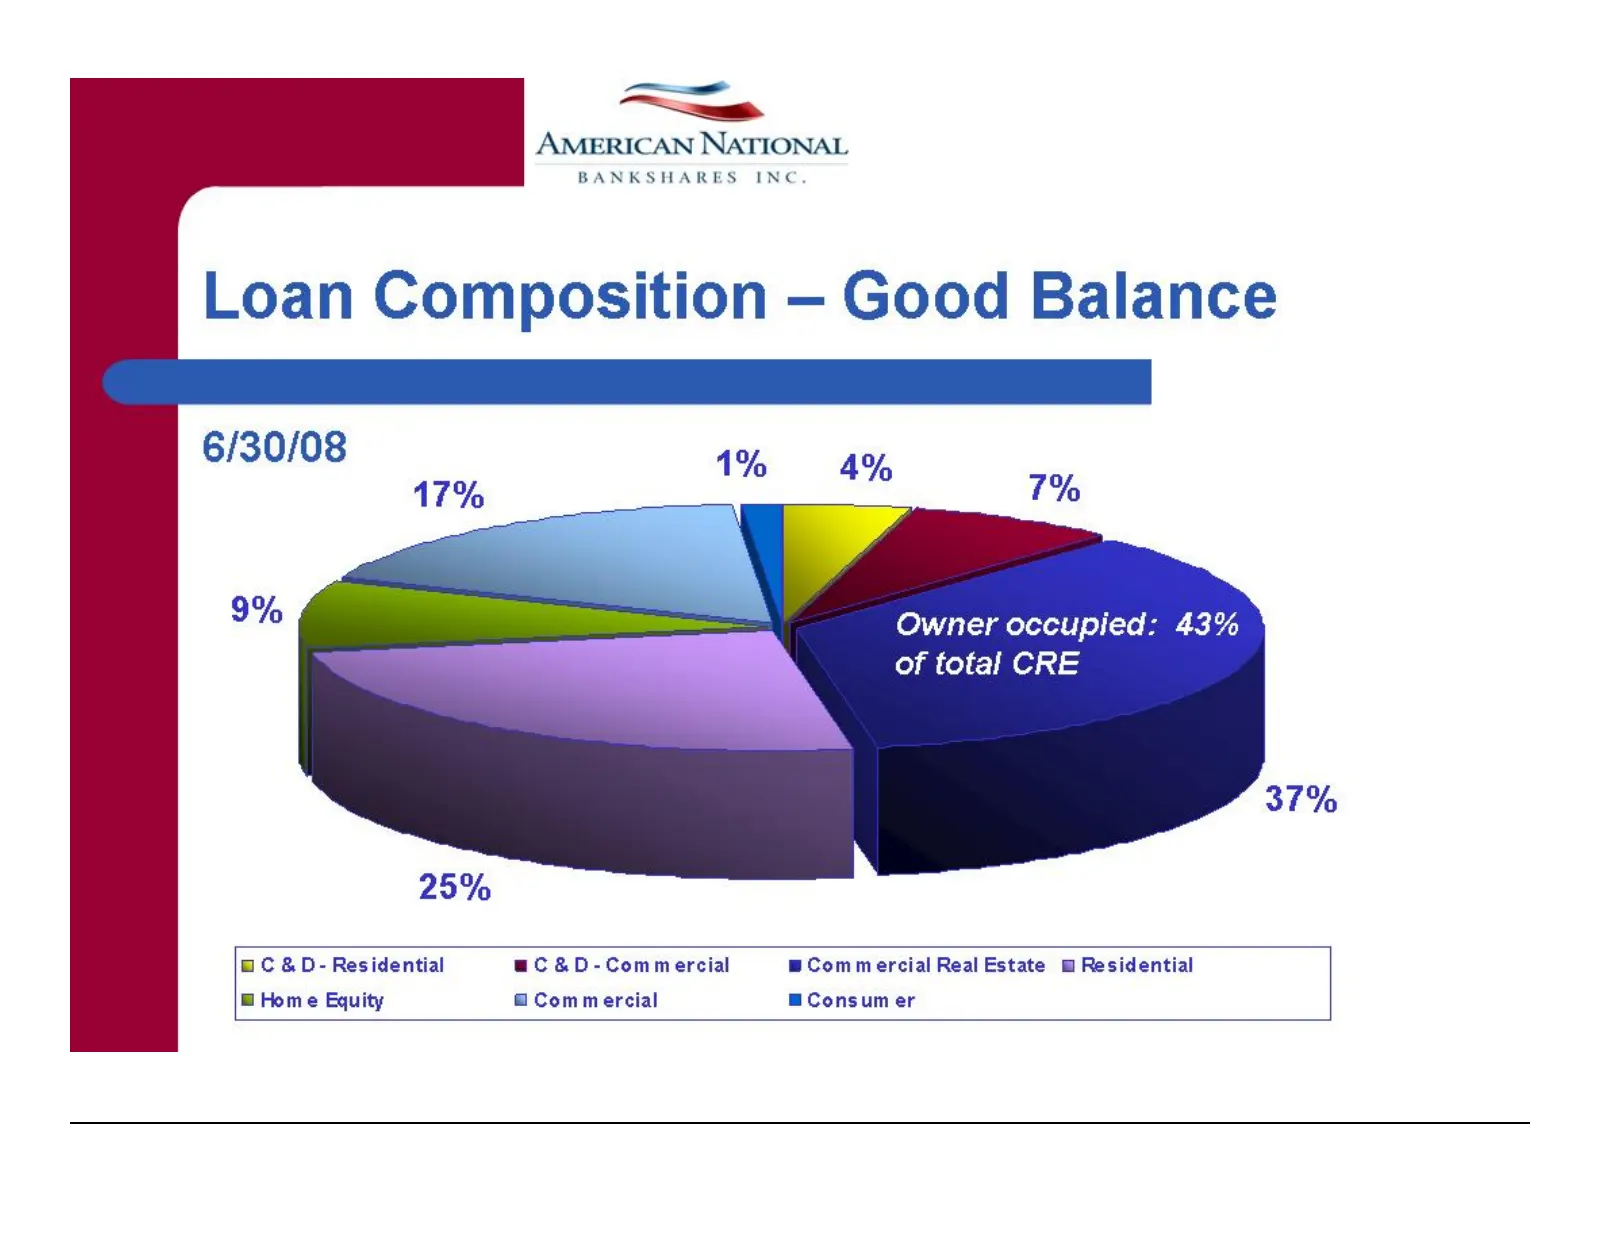
Slide 19: Loan Composition
AMERICAN NATIONAL BANKSHARES INC — ilanc C&D-Re wComr @ Home Equity @ Consumer
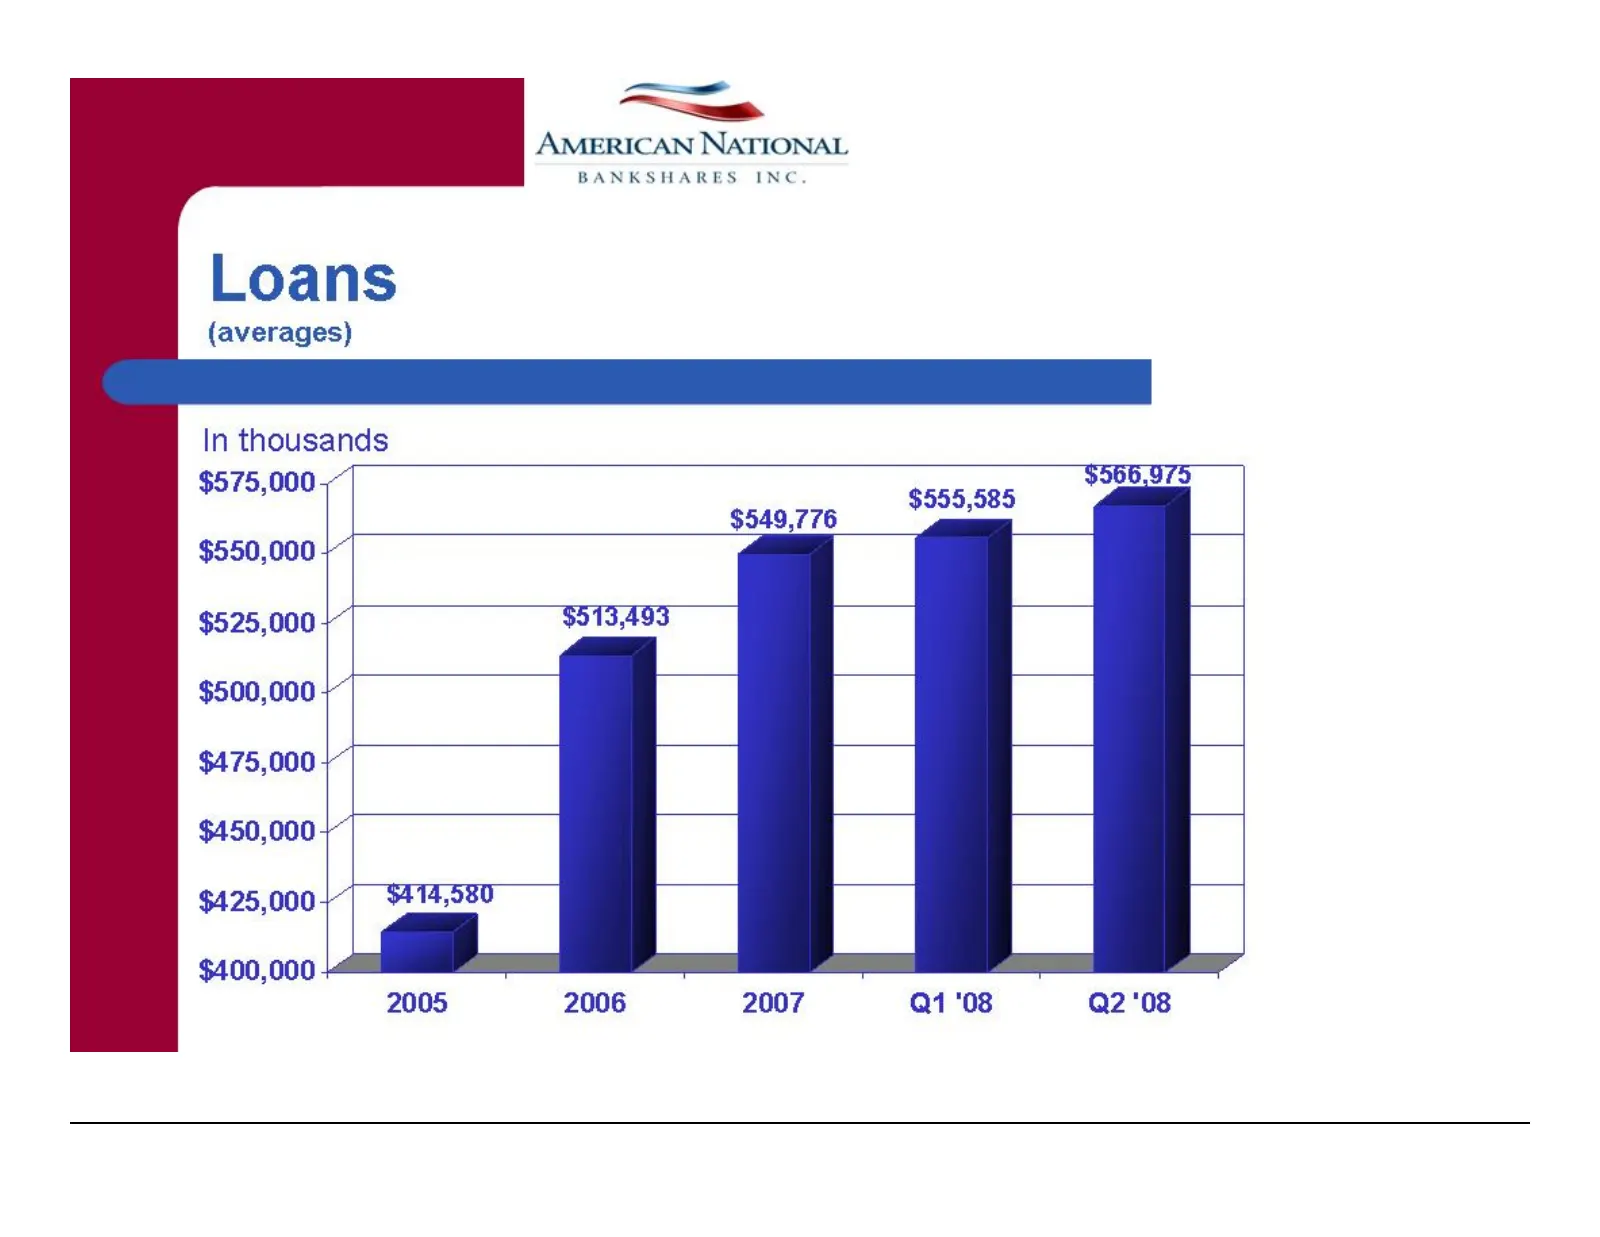
Slide 20: Loans (averages)
— > AMERICAN NATIONAL BANKSHARES INC. Loans (averages) In thousands ; $566,975 $575,000 $555,585 $549,776 $550,000 ; $525,000 ; $513,493 $500,000 | $475,000 | $450,000 + $425,000 4 $400,000 4 2005 2006 2007 Q1 ‘08 Q2'08
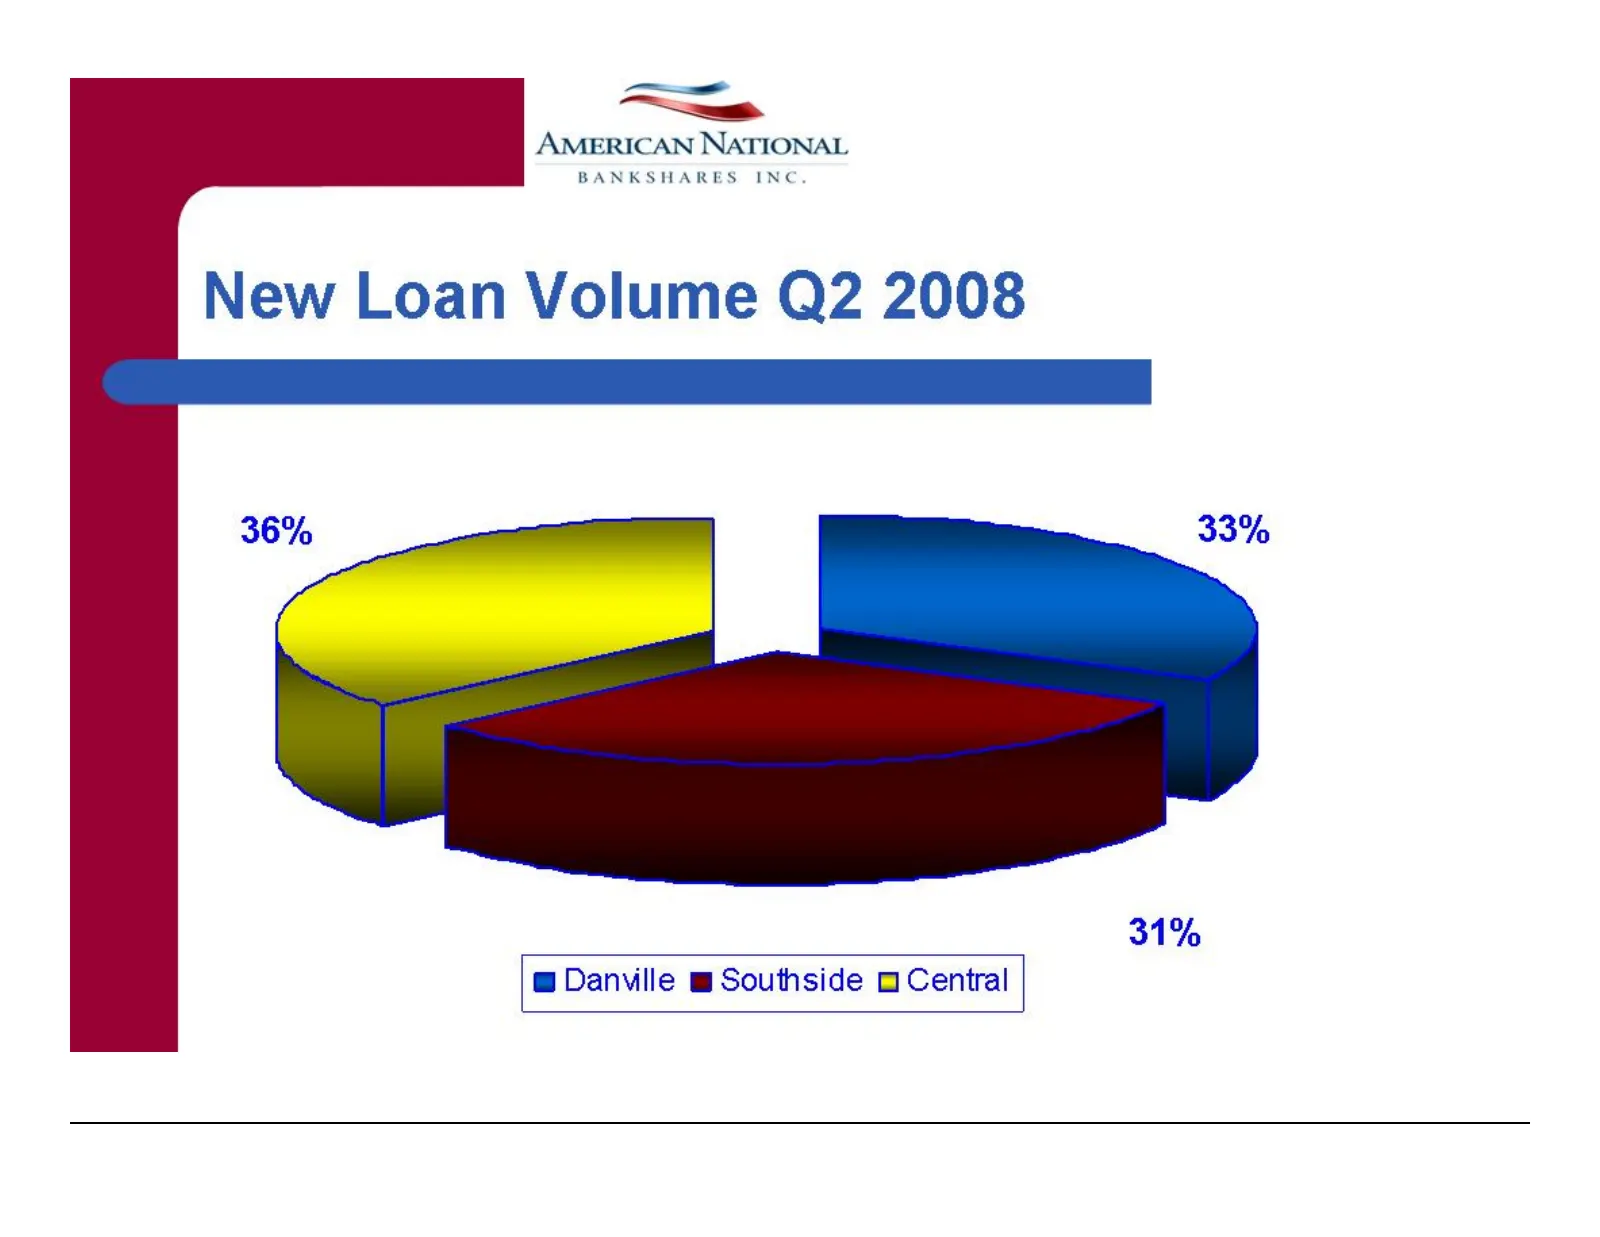
Slide 21: New Loan Volume Q2 2008
——_ => AMERICAN NATIONAL BANKSHARES INC. New Loan Volume Q2 2008 @ Danville mw Southside O Central
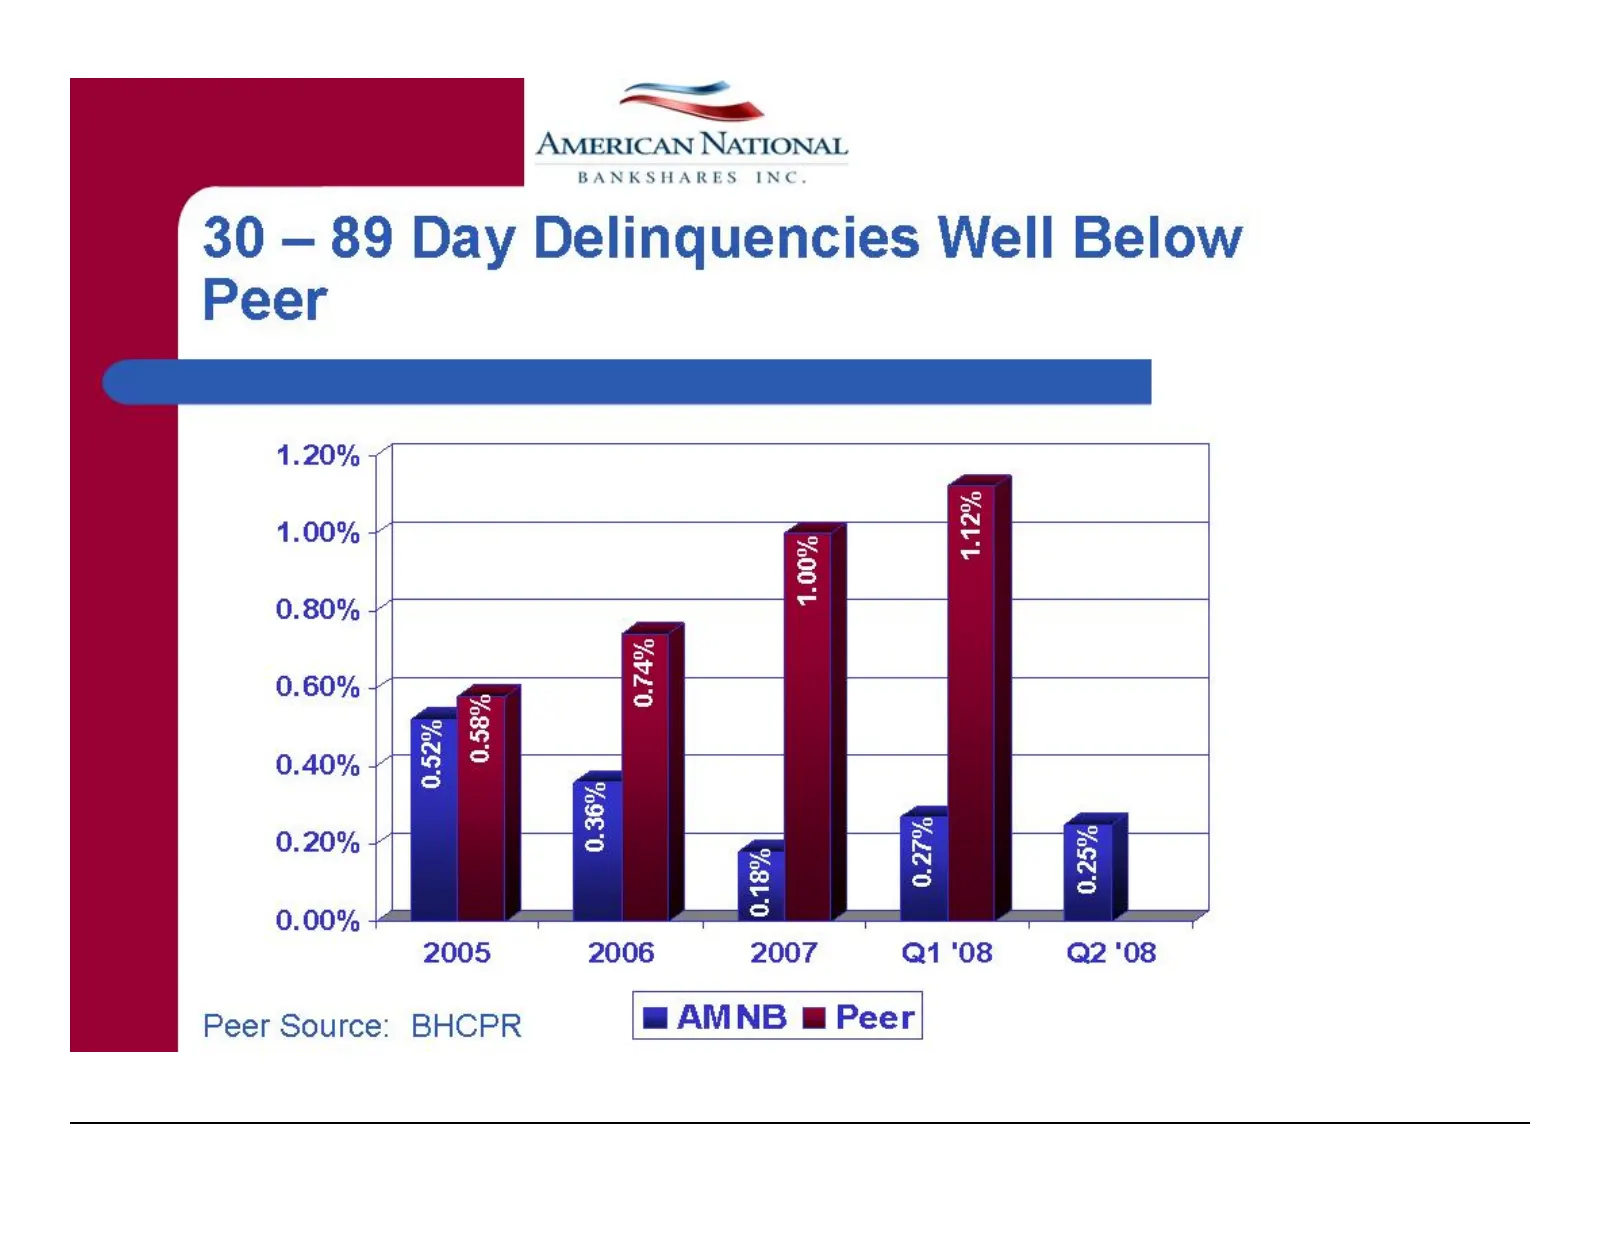
Slide 22: Loan Delinquencies Well Below Peer
Peer — > AMERICAN NATIONAL BANKSHARES INC. 30 — 89 Day Delinquencies Well Below 1.20% + 1.00% + 0.80% + 0.60% 5 0.40% + 0.20% + 0.00% + 2005 Peer Source: BHCPR 2006 2007 Q1 ‘08 Q2'08 m@ AMNB @ Peer
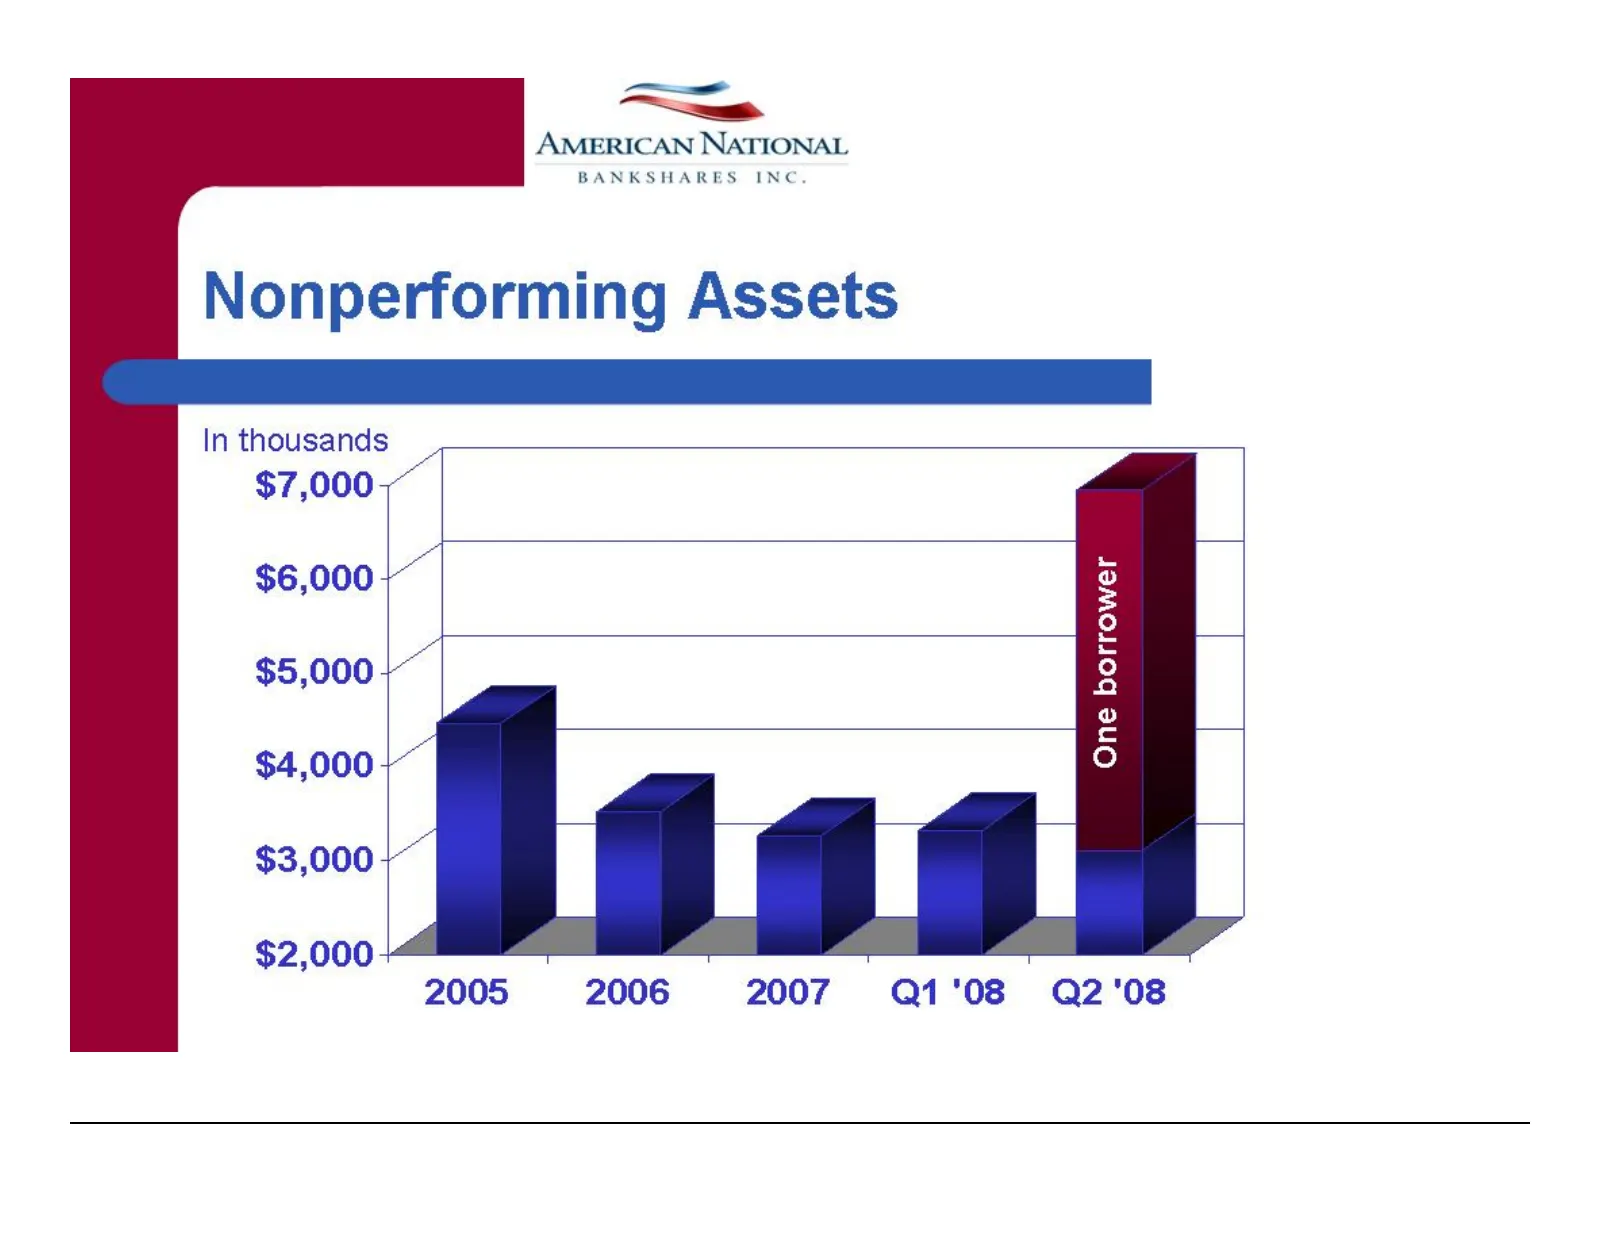
Slide 23: Nonperforming Assets
In thousands $7,000, $6,000 | $5,000 | $4,000 ; $3,000 | $2,000 - ——_ > AMERICAN NATIONAL BANKSHARES INC. Nonperforming Assets 2005 One borrower 2006 2007 Q1'08 = Q2'08
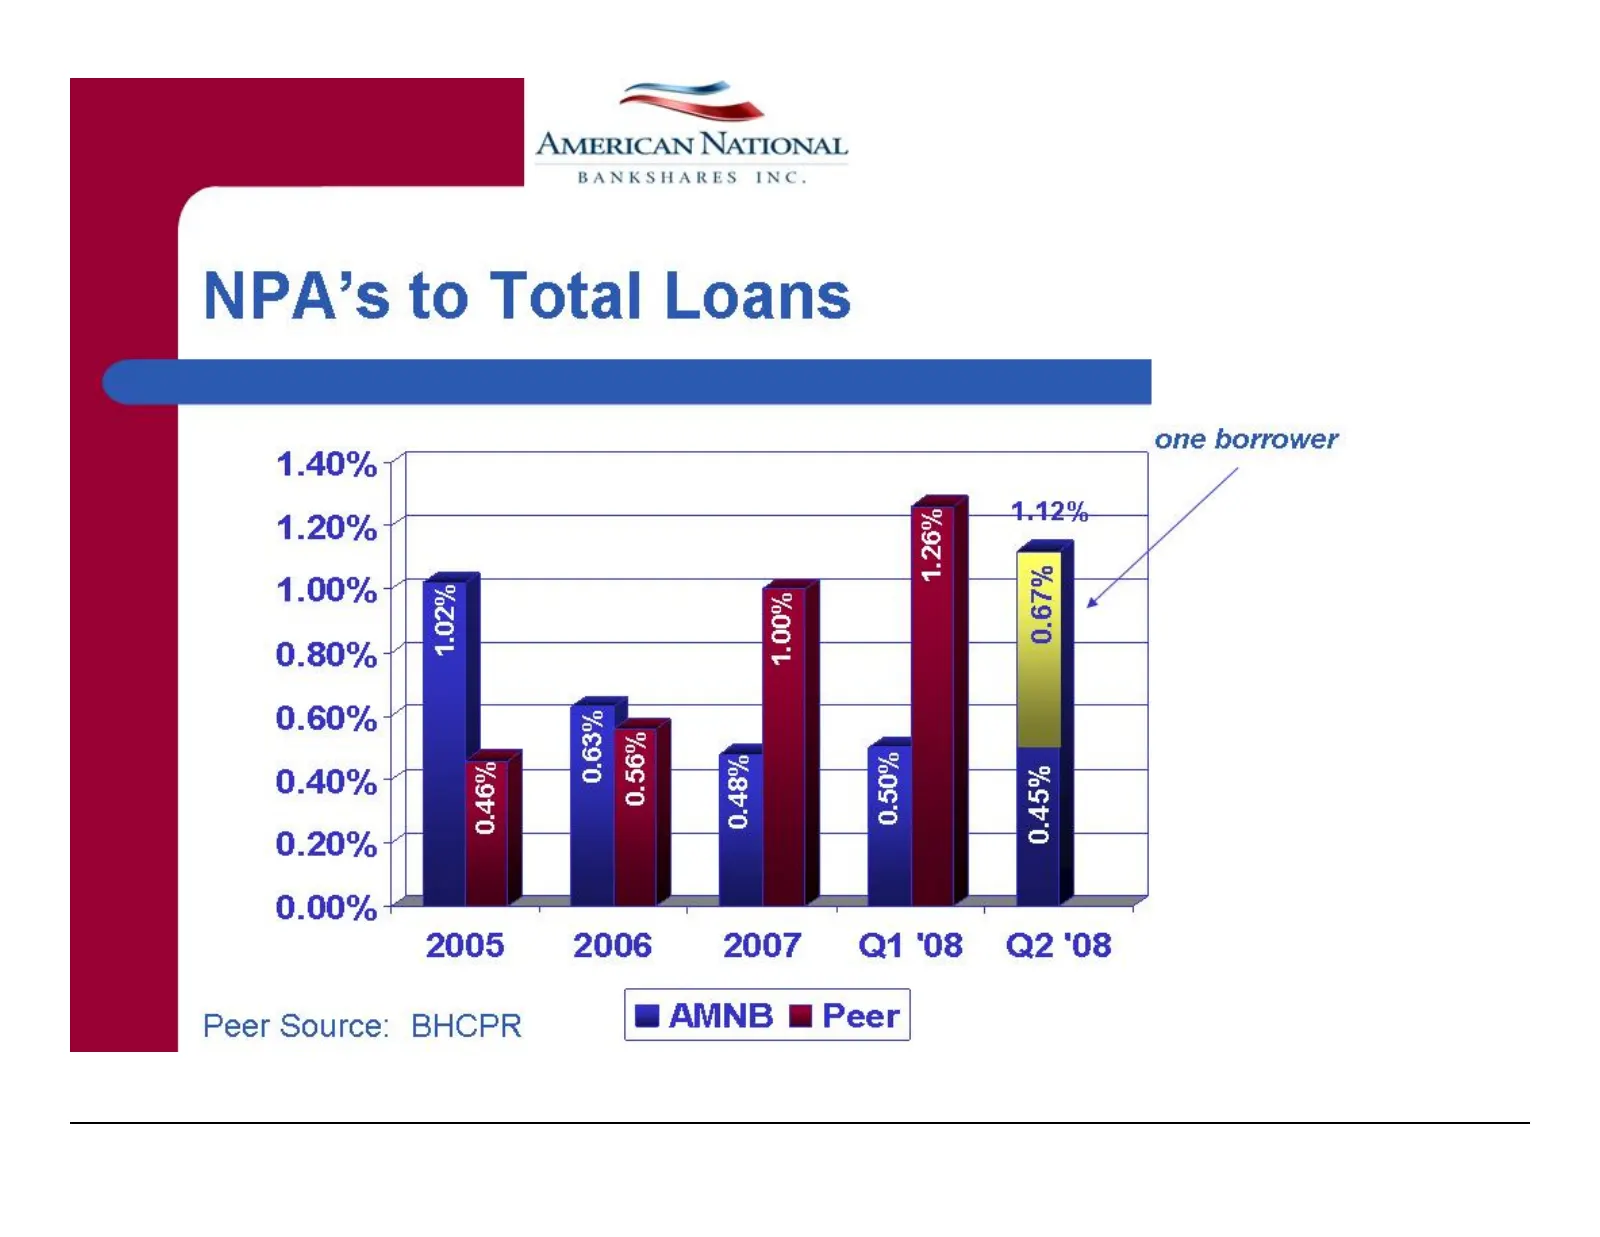
Slide 24: NPAs to Total Loans
1.40%) 1.20%} 1.00% | 0.80% | 0.60% | 0.40% | 0.20% | 0.00% * Peer Source: — > AMERICAN NATIONAL BANKSHARES INC. NPA’s to Total Loans 2005 BHCPR 2006 2007 Q1'08 Q2‘08 @ AMNB @ Peer one borrower
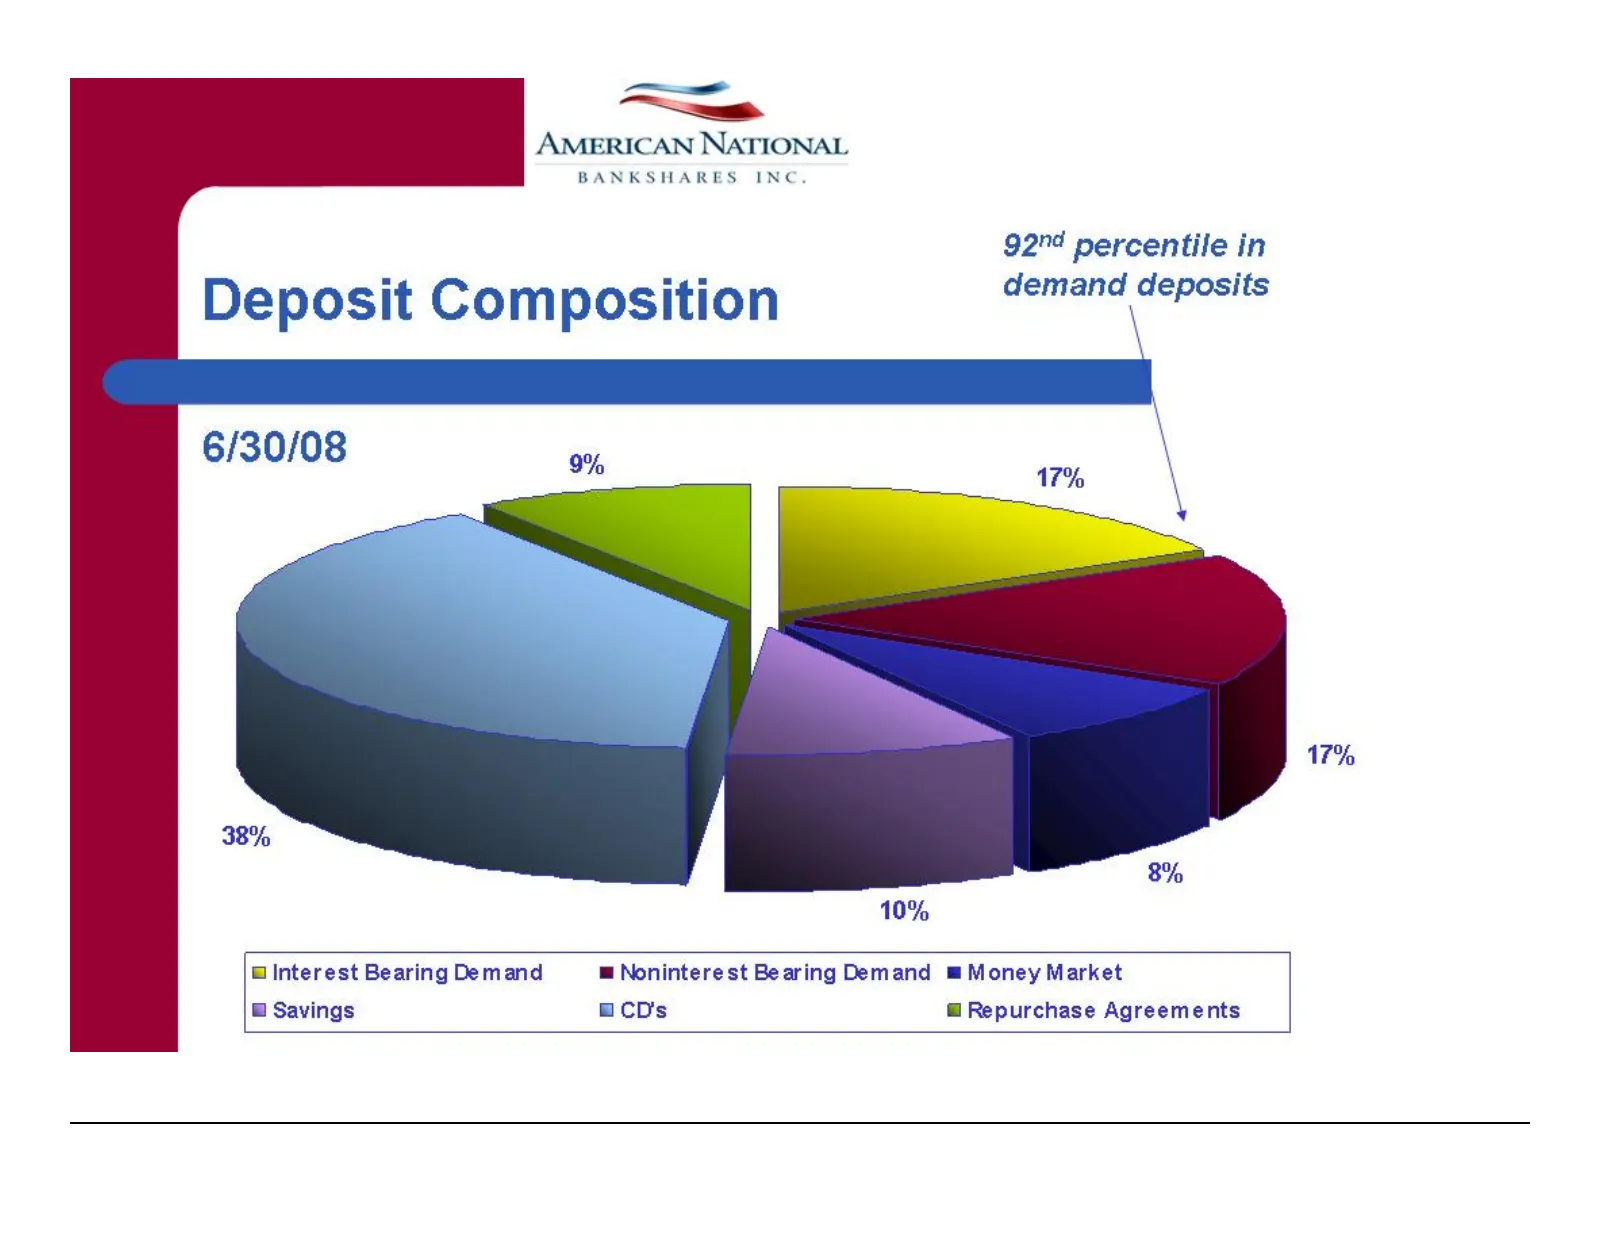
Slide 25: Deposit Composition 6/30/08
AMERICAN NATIONAL BANKSHARES INC 92"¢ percentile in Deposit Composition a Nall 6/30/08 17% 10% @ Interest Bearing Demand @ Noninterest Bearing Demand # Money Market @ Savings BCD's @ Repurchase Agreements
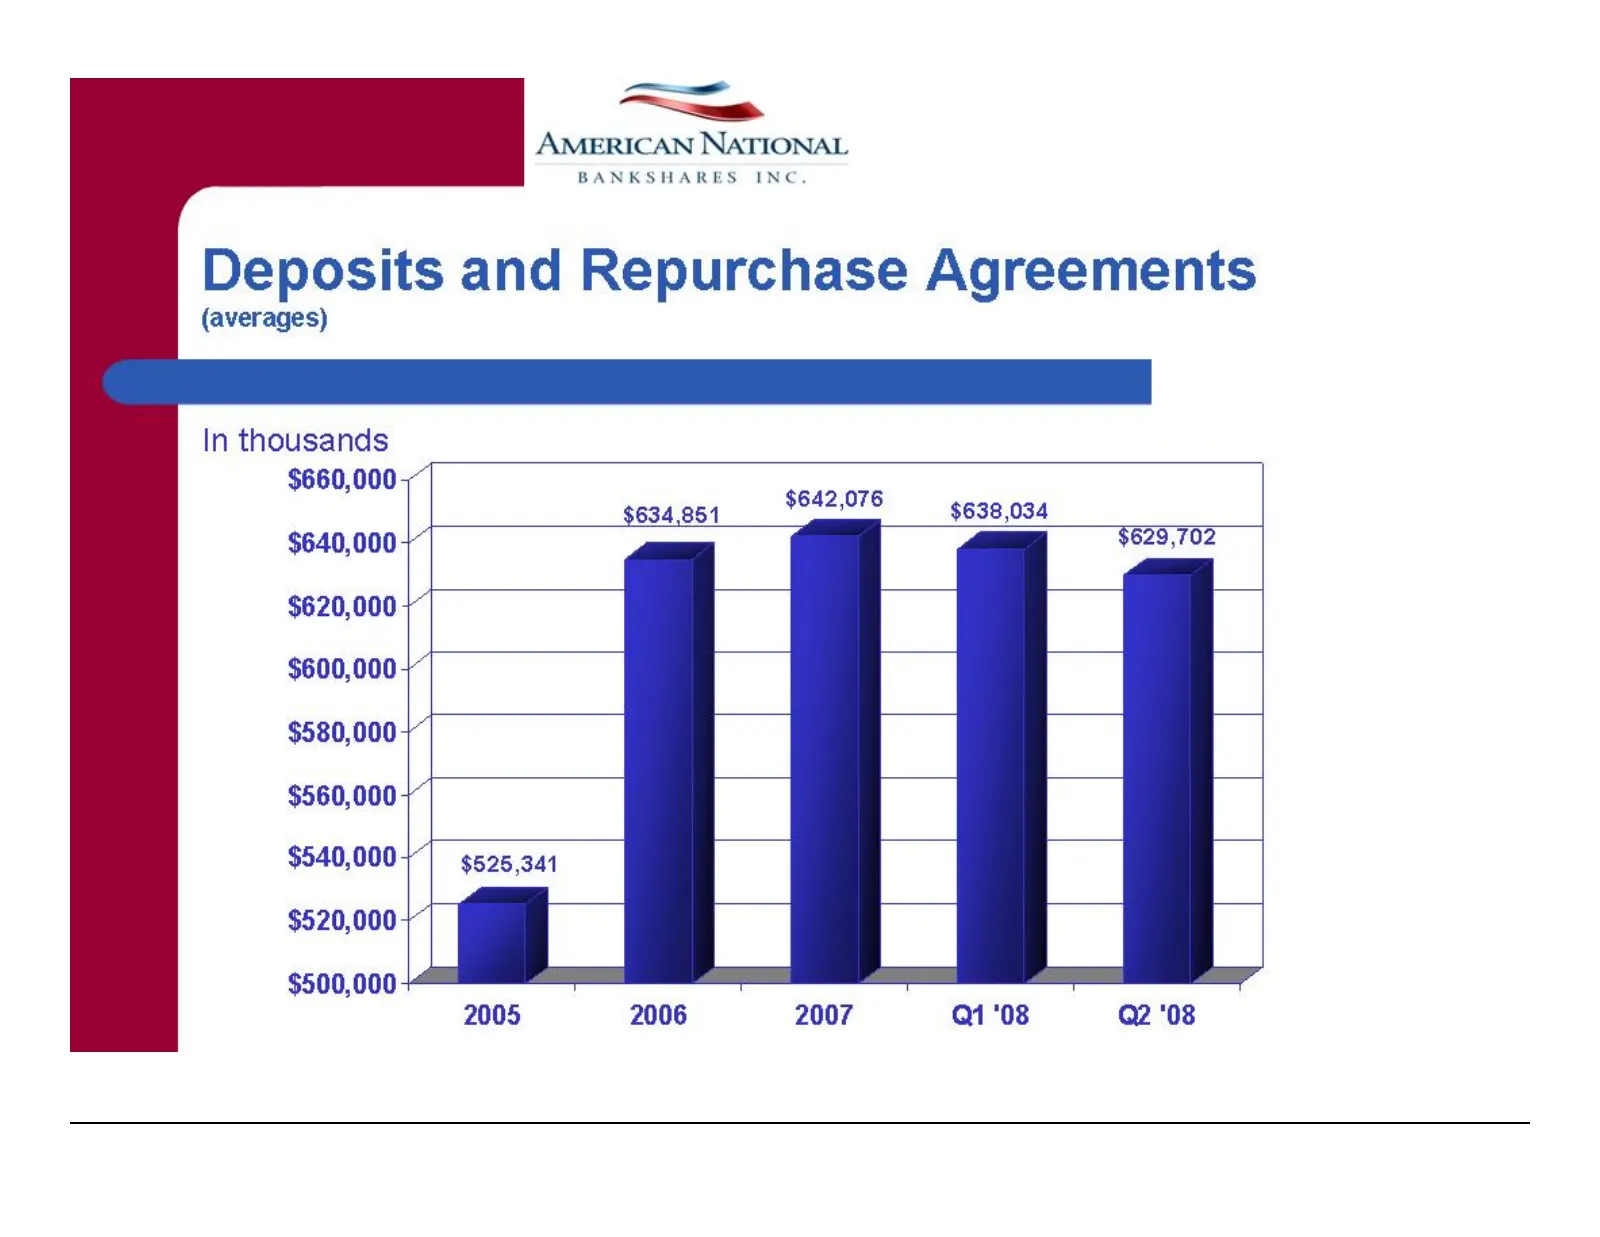
Slide 26: Deposits and Repurchase Agreements
——_ > AMERICAN NATIONAL BANKSHARES INC. Deposits and Repurchase Agreements (averages) In thousands $660,000, $642,076 $634,851 $638,034 $640,000 5 $629,702 $620,000 $600,000; $580,000, $560,000 $540,000/") $525,341 $520,000 + $500,000+ 2005 2006 2007 Q1'08 Q2'08
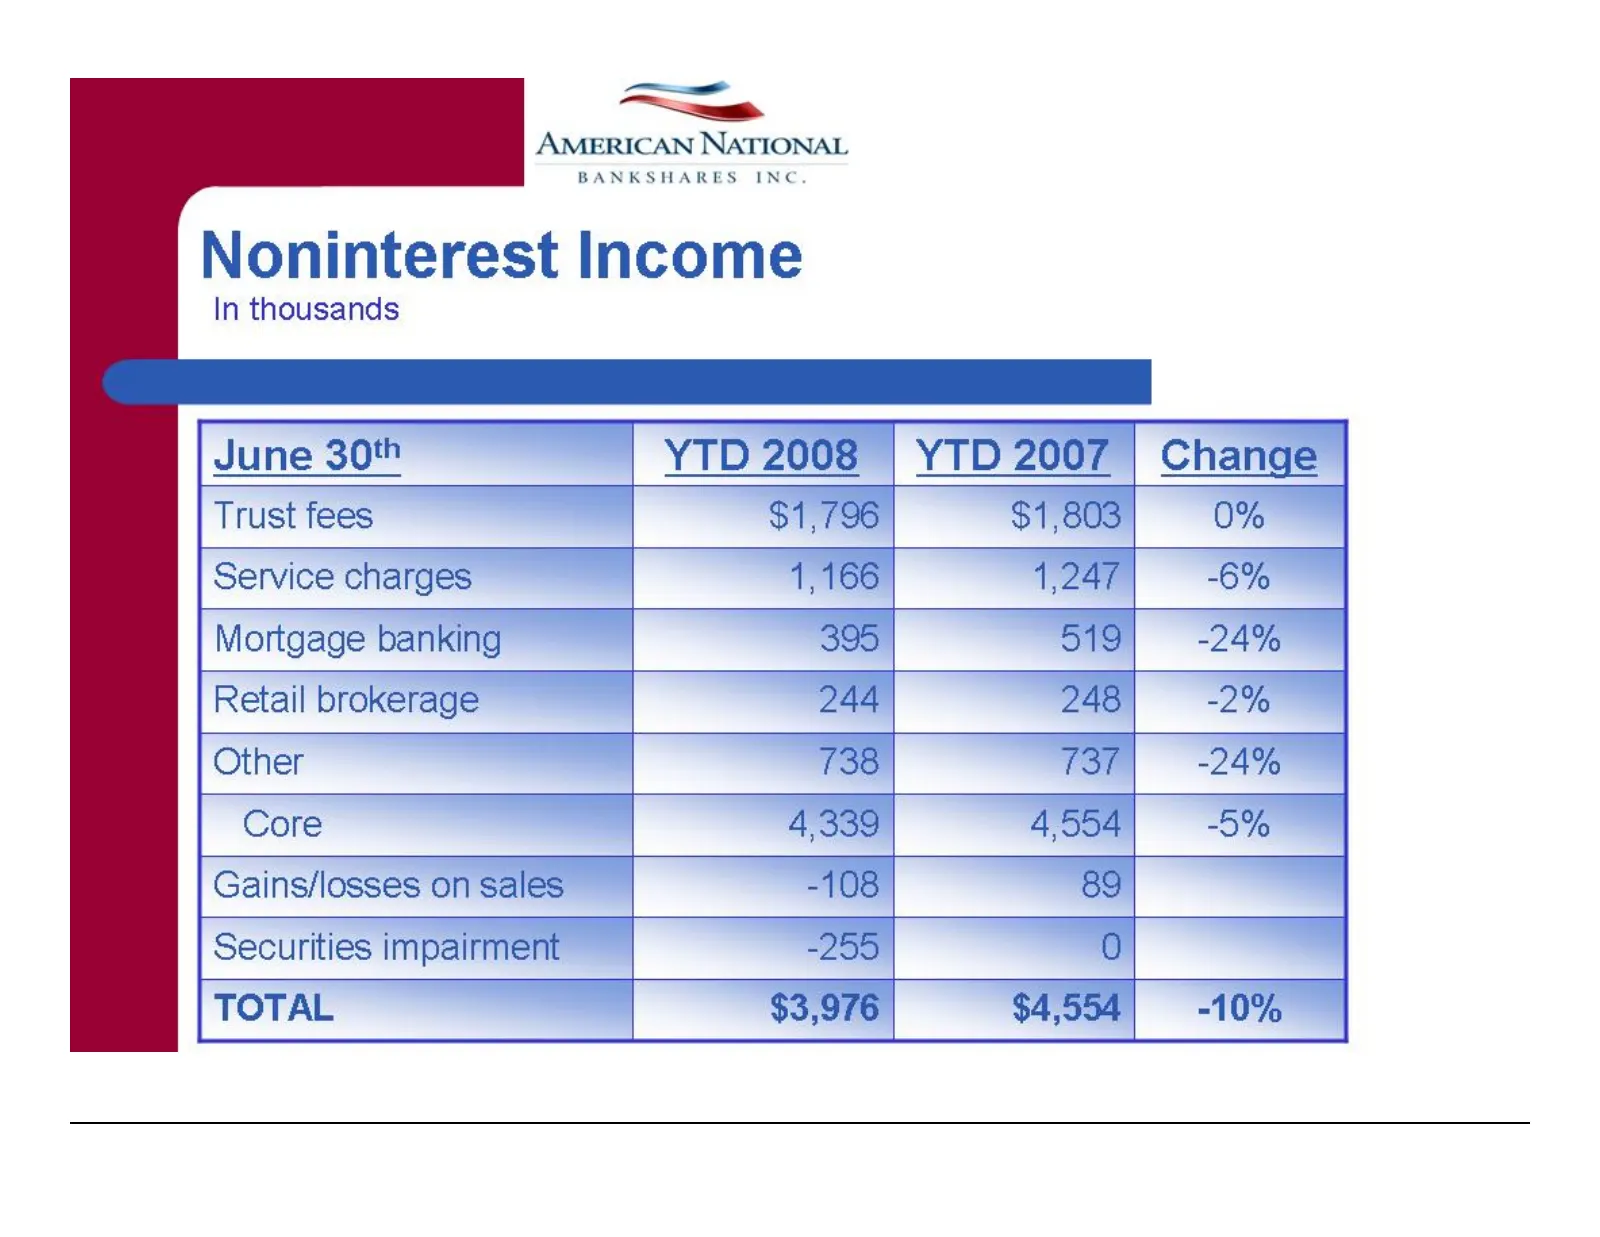
Slide 27: Noninterest Income
In thousands AMERICAN NATIONAL BANKSHARES INC Noninterest Income June 30% YTD 2008 | YTD 2007 | Change Trust fees $1,796 $1,803 0% Service charges 1,166 T 24 -6% Mortgage banking 395 519 -24% Retail brokerage 244 248 -2% Other 738 Tor -24% Core 4,339 4,554 -5% Gains/losses on sales -108 89 Securitie
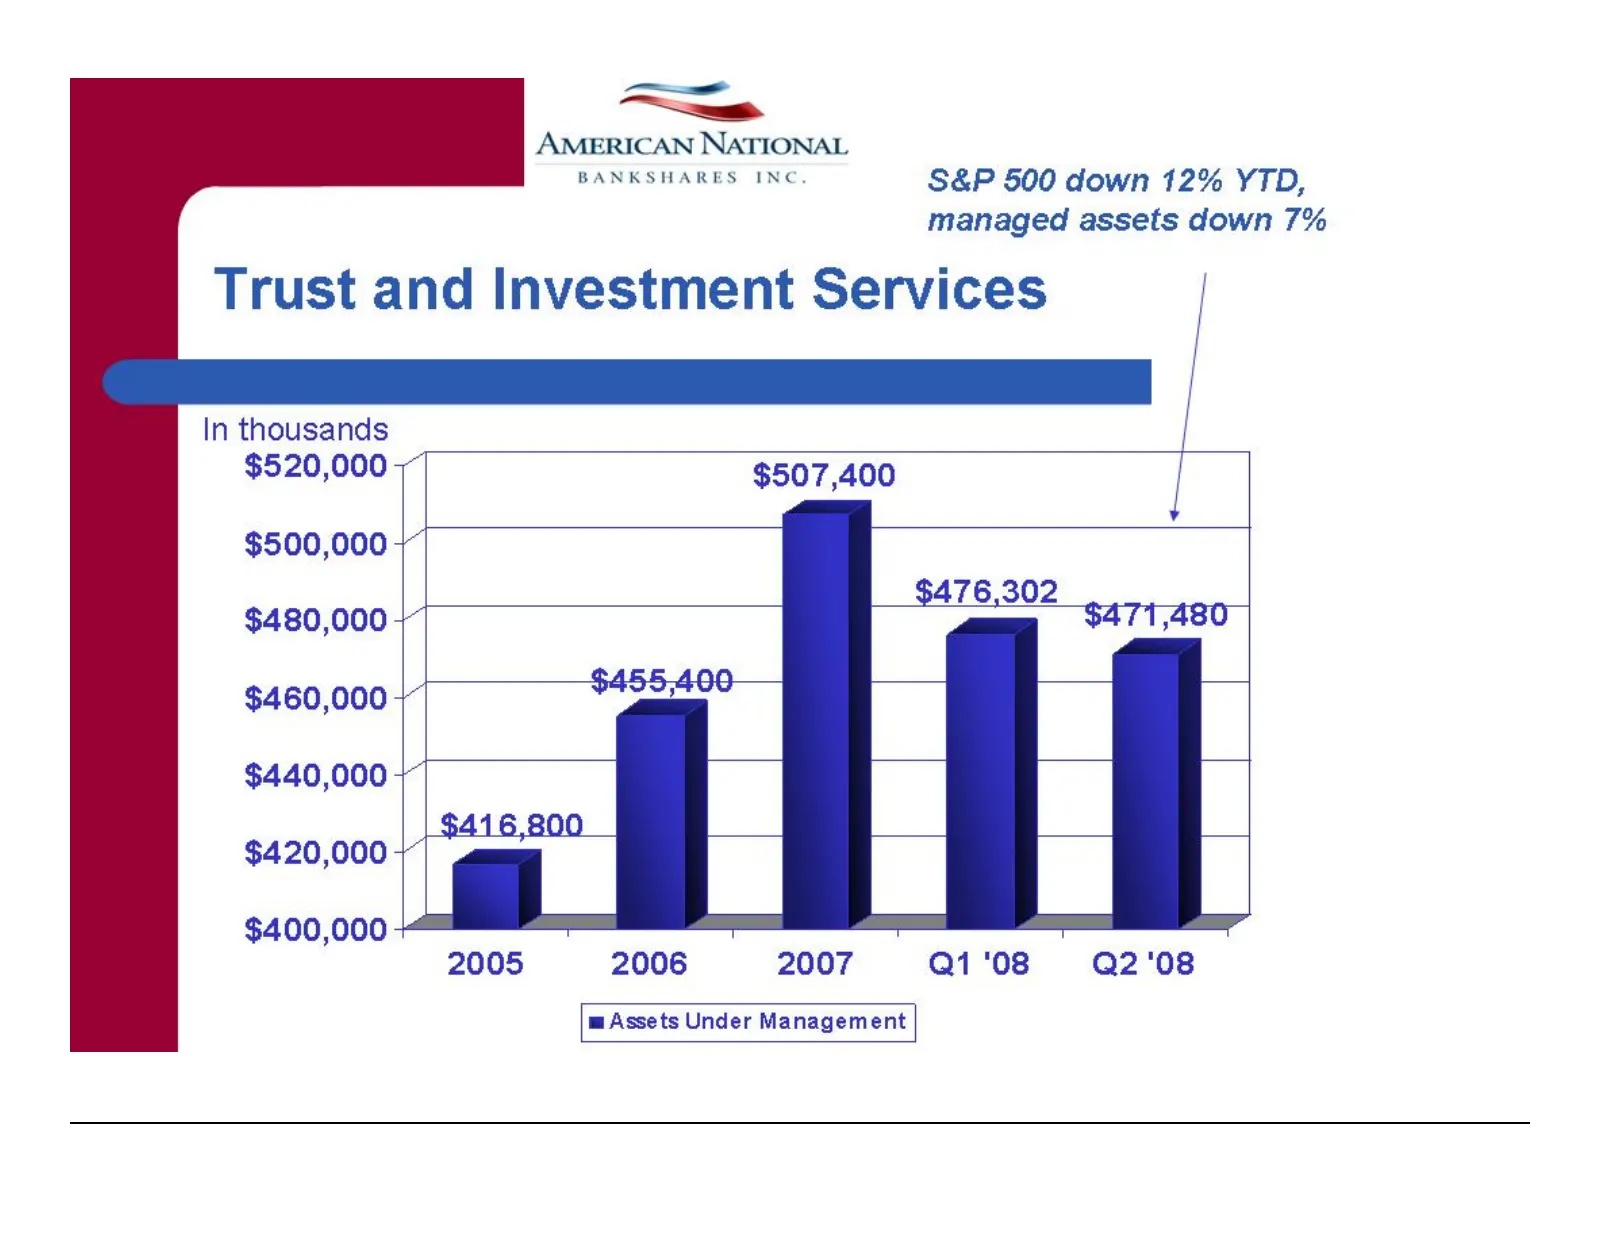
Slide 28: Trust and Investment Services
——_ > AMERICAN NATIONAL BANKSHARES INC. S&P 500 down 12% ¥TD; managed assets down 7% Trust and Investment Services In thousands $520,000 - $507,400 | $500,000 - 476,302 $480,000 - . po a $460,000 5 $440,000 5 $420,000 5 $400,000 + 2005 2006 2007 Q1 ‘08 Q2'08 mAssets Under Management
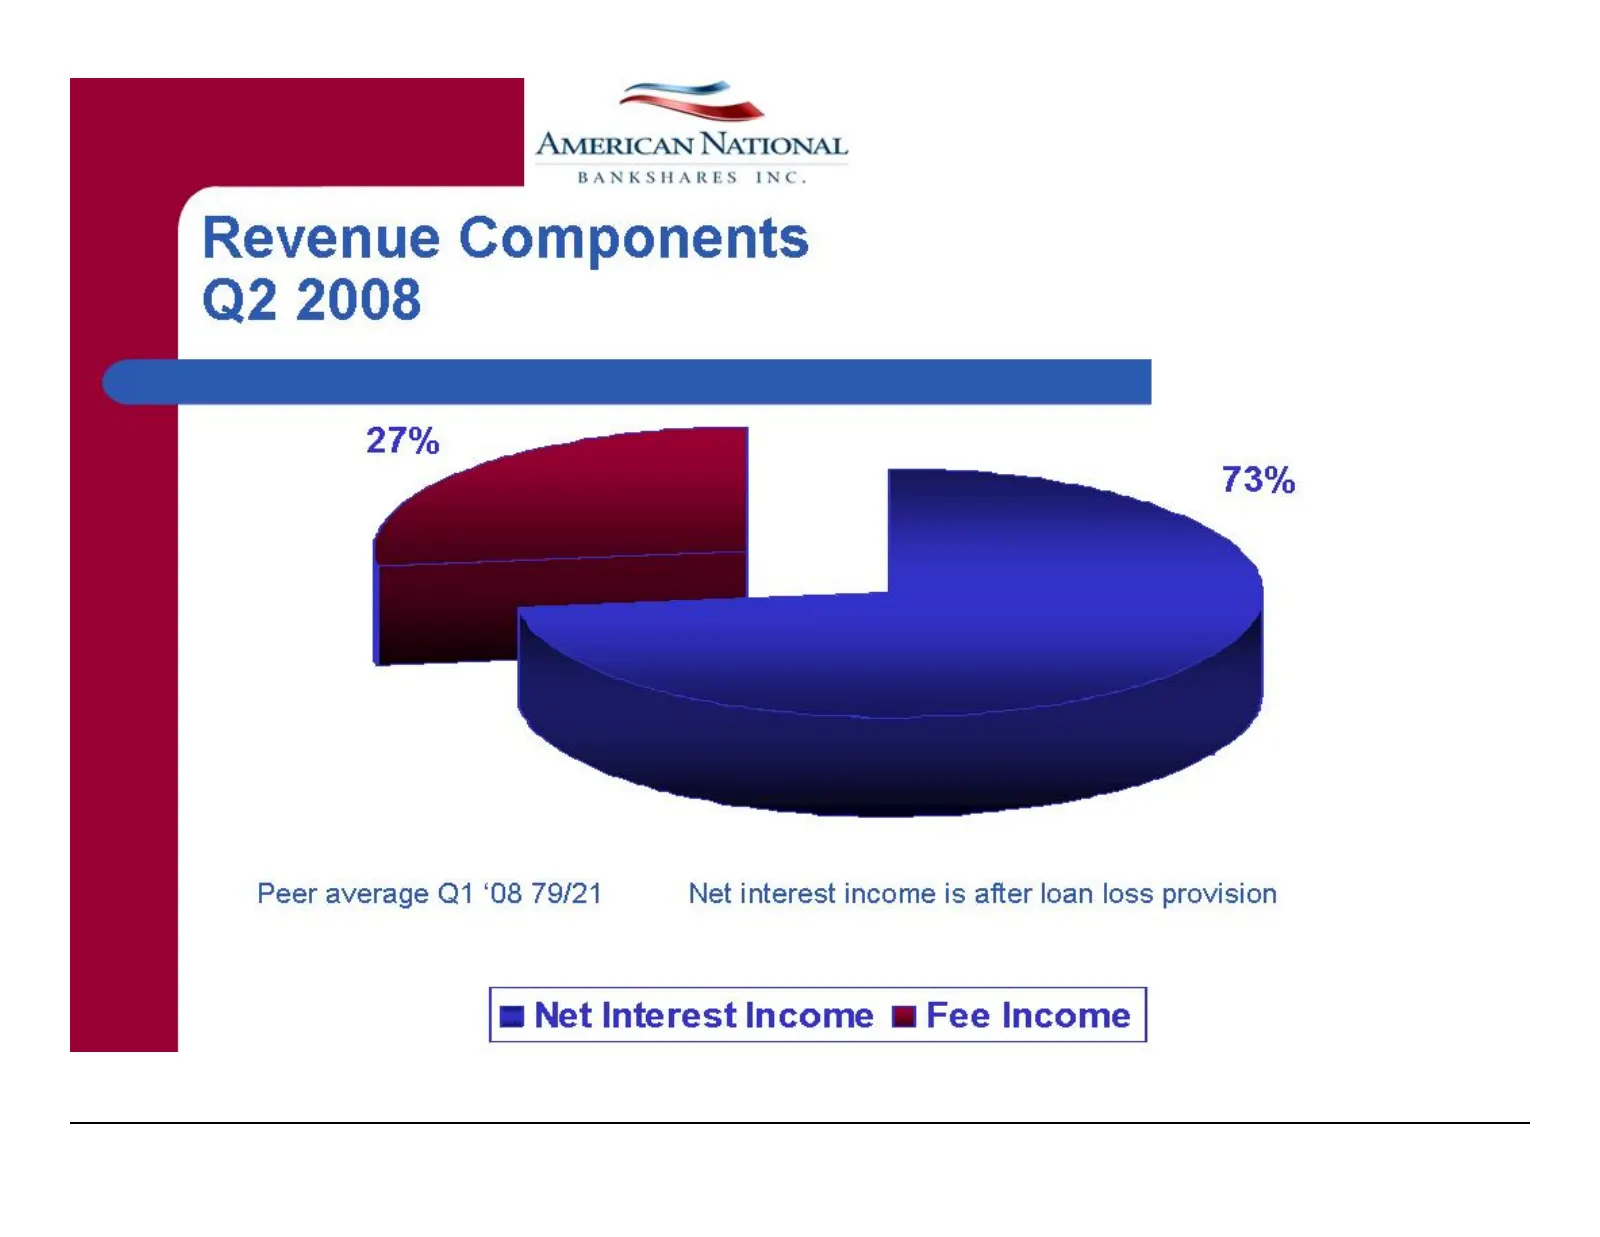
Slide 29: Revenue Components Q2 2008
— Sa AMERICAN NATIONAL BANKSHARES INC. Revenue Components Q2 2008 Peer average Q1 ‘08 79/21 Net interest income is after loan loss provision w Net Interest Income m Fee Income
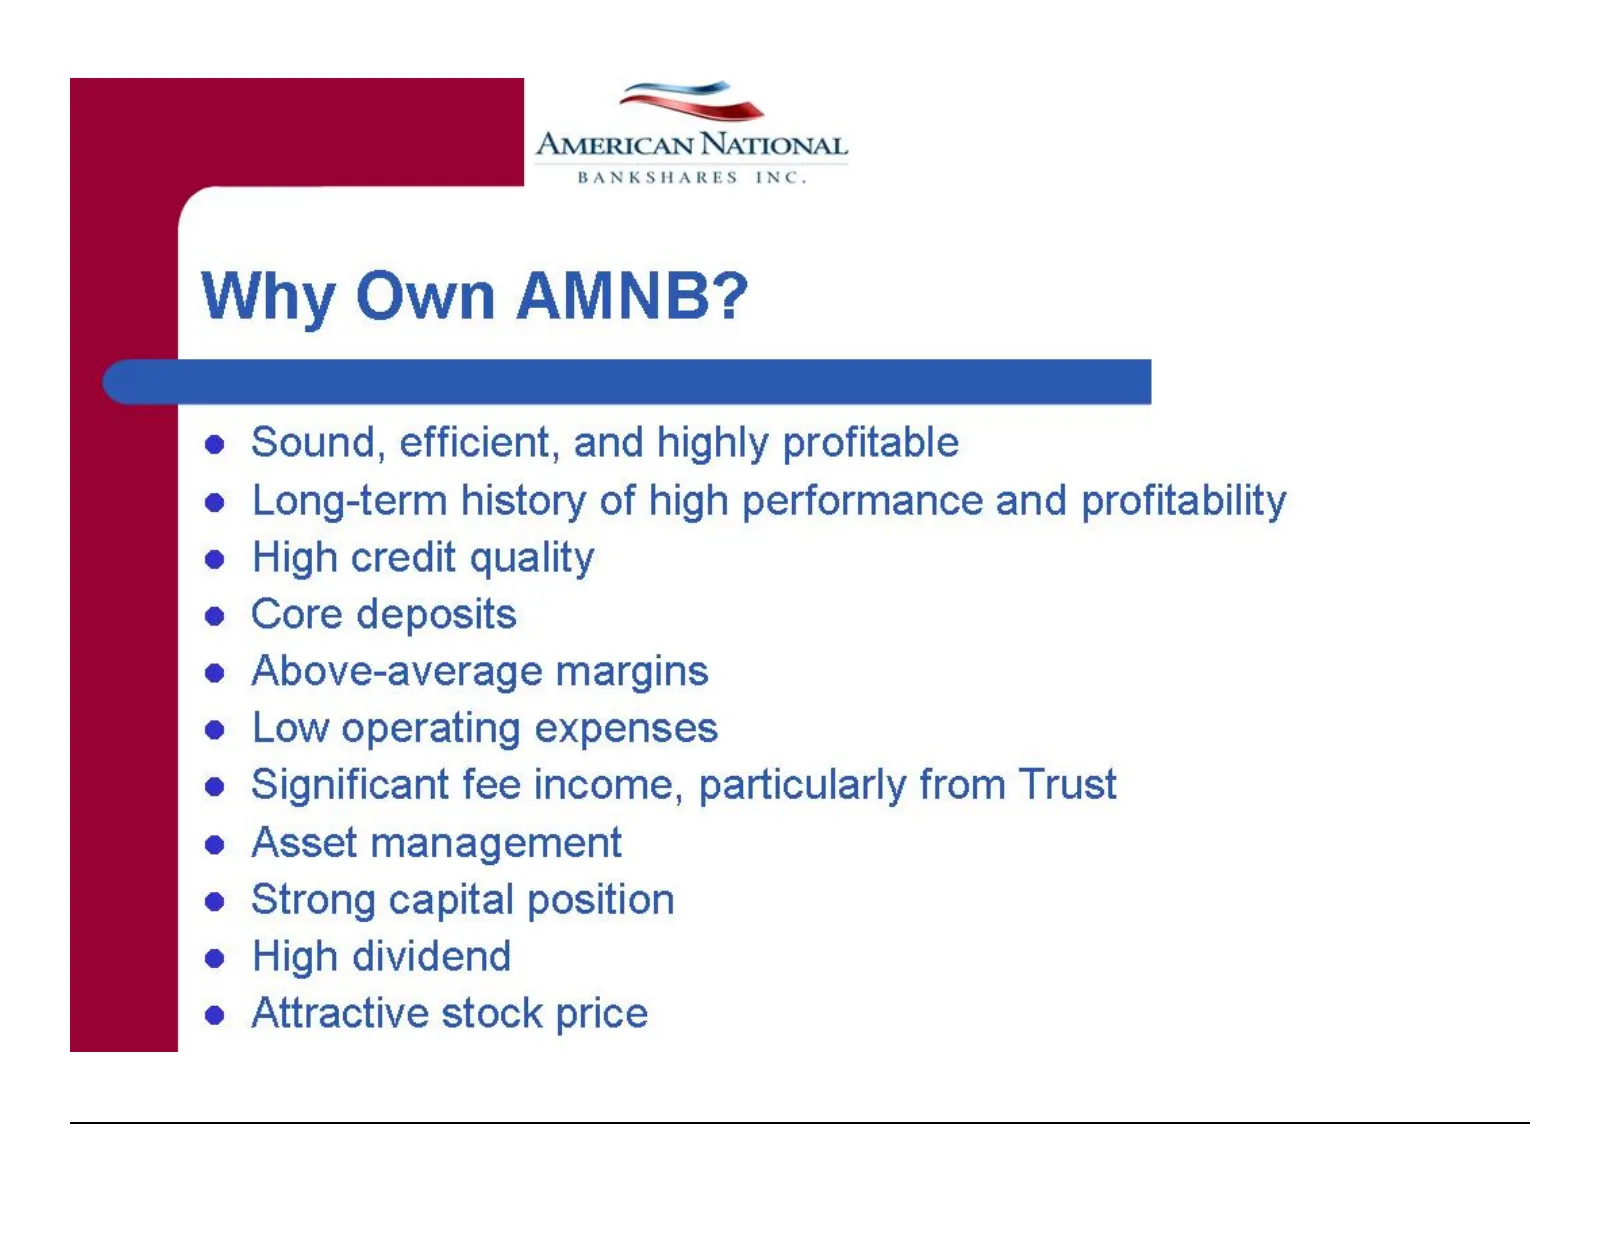
Slide 30: Why Own AMNB?
=— > AMERICAN NATIONAL BANKSHARES INC. Why Own AMNB? Sound, efficient, and highly profitable Long-term history of high performance and profitability High credit quality Core deposits Above-average margins Low operating expenses Significant fee income, particularly from Trust Asset management Strong
Slide 31: Lv q
Lv q nN ¥ : —= a — AMERICAN NATIONAL BANKSHARES INC.
Source: SEC EDGAR · 8-K filed Aug 5, 2008
More decks from American National Bankshares Inc
 Investor Presentation (July 2022)32 slides · Jul 27, 2022
 Investor Presentation (June 2022)32 slides · Jun 14, 2022
 Investor Presentation (May 2021)34 slides · May 28, 2021
 Investor Presentation (July 2019)47 slides · Jul 29, 2019
 Investor Presentation (July 2019)47 slides · Jul 8, 2019
 Investor Presentation (March 2019)42 slides · Mar 25, 2019