HKT Trust and HKT Ltd · HKEX:6823
HKT Trust and HKT — HKT — H1 2021 Earnings Presentation
33 slides from HKT Trust and HKT's earnings presentation, Aug 5, 2021
Slide 1: 2021 Interim Results
2021 Interim Results For the six months ended June 30, 2021 August 5, 2021 – Hong Kong
Slide 2: Forward Looking Statements
Forward Looking Statements This presentation may contain "forward-looking statements" that are not historical in nature. These forward-looking statements, which include, without limitation, statements regarding HKT’s future results of operations, financial condition or business prospects, are based

Slide 3: Business Review
Business Review Susanna Hui Group Managing Director 3
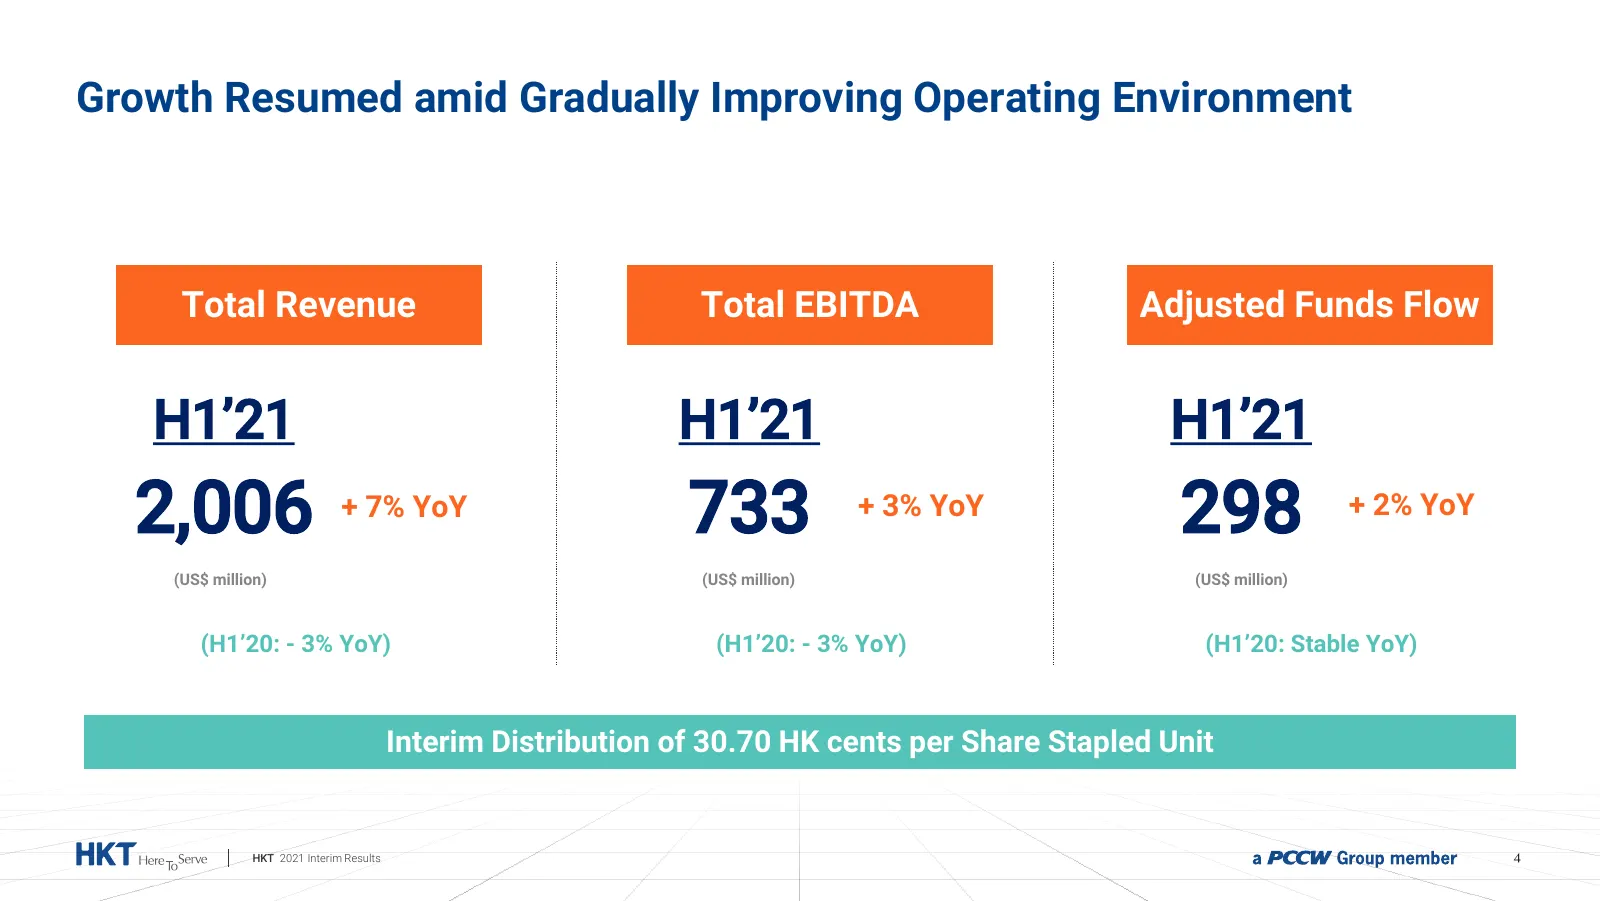
Slide 4: Growth Resumed amid Gradually Improving Operating Environment
Growth Resumed amid Gradually Improving Operating Environment Total Revenue Total EBITDA Adjusted Funds Flow H1’21 H1’21 H1’21 2,006 + 7% YoY 733 + 3% YoY 298 + 2% YoY (US$ million) (US$ million) (US$ million) (H1’20: - 3% YoY) (H1’20: - 3% YoY) (H1’20: Stable YoY) Interim Distribution of 30.70 HK c
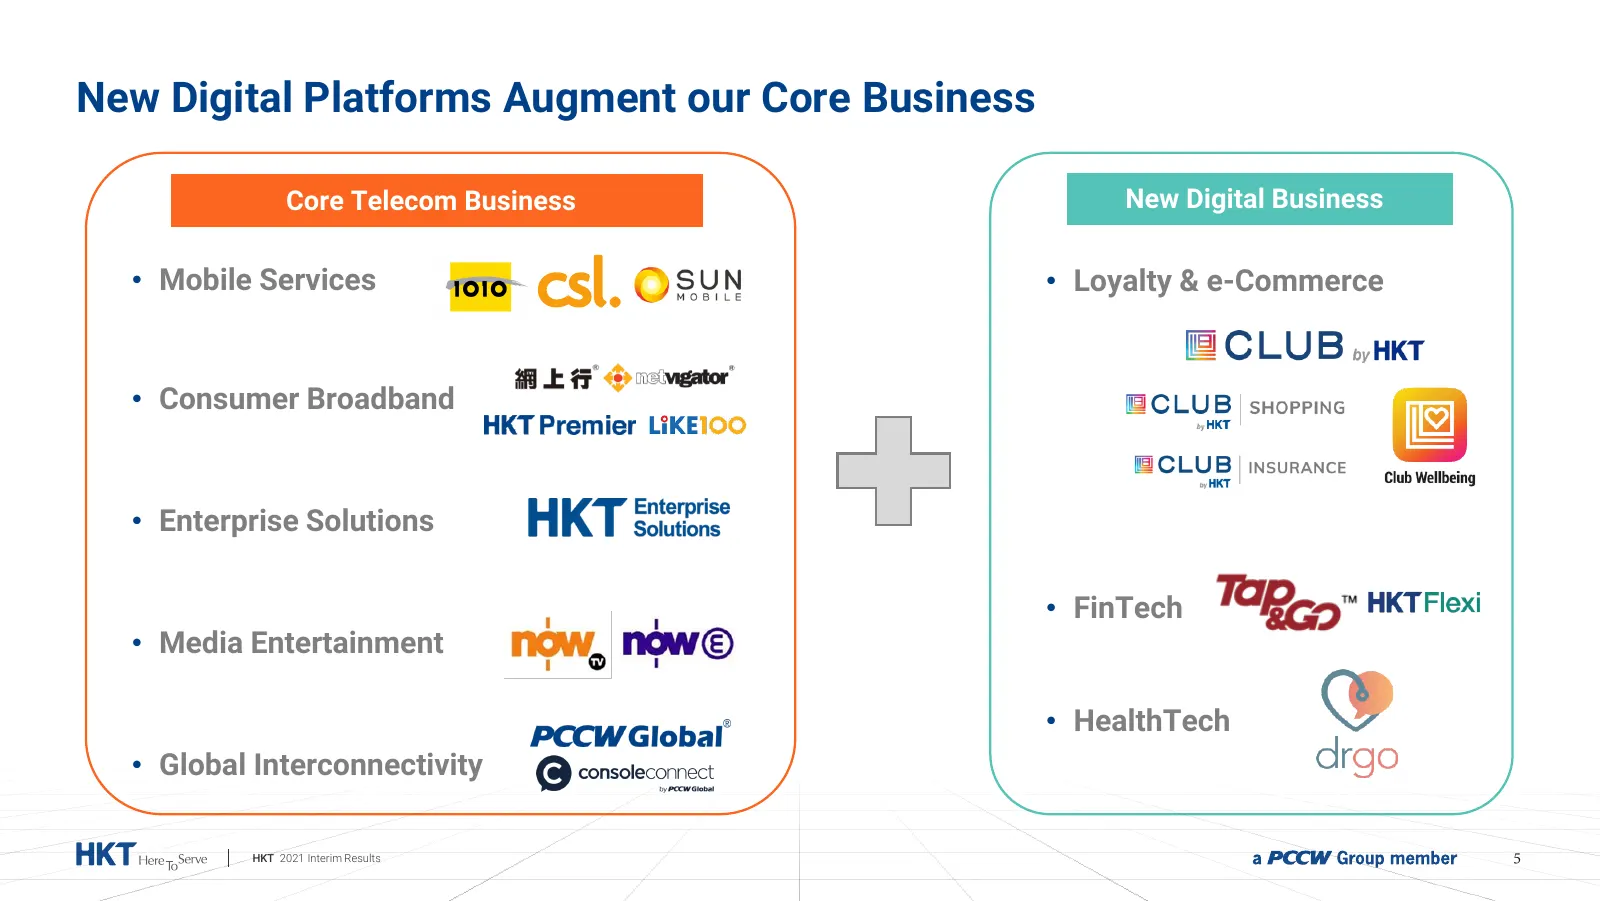
Slide 5: New Digital Platforms Augment our Core Business
New Digital Platforms Augment our Core Business Core Telecom Business New Digital Business • Mobile Services • Loyalty & e-Commerce • Consumer Broadband • Enterprise Solutions • FinTech • Media Entertainment • HealthTech • Global Interconnectivity HKT 2021 Interim Results 5
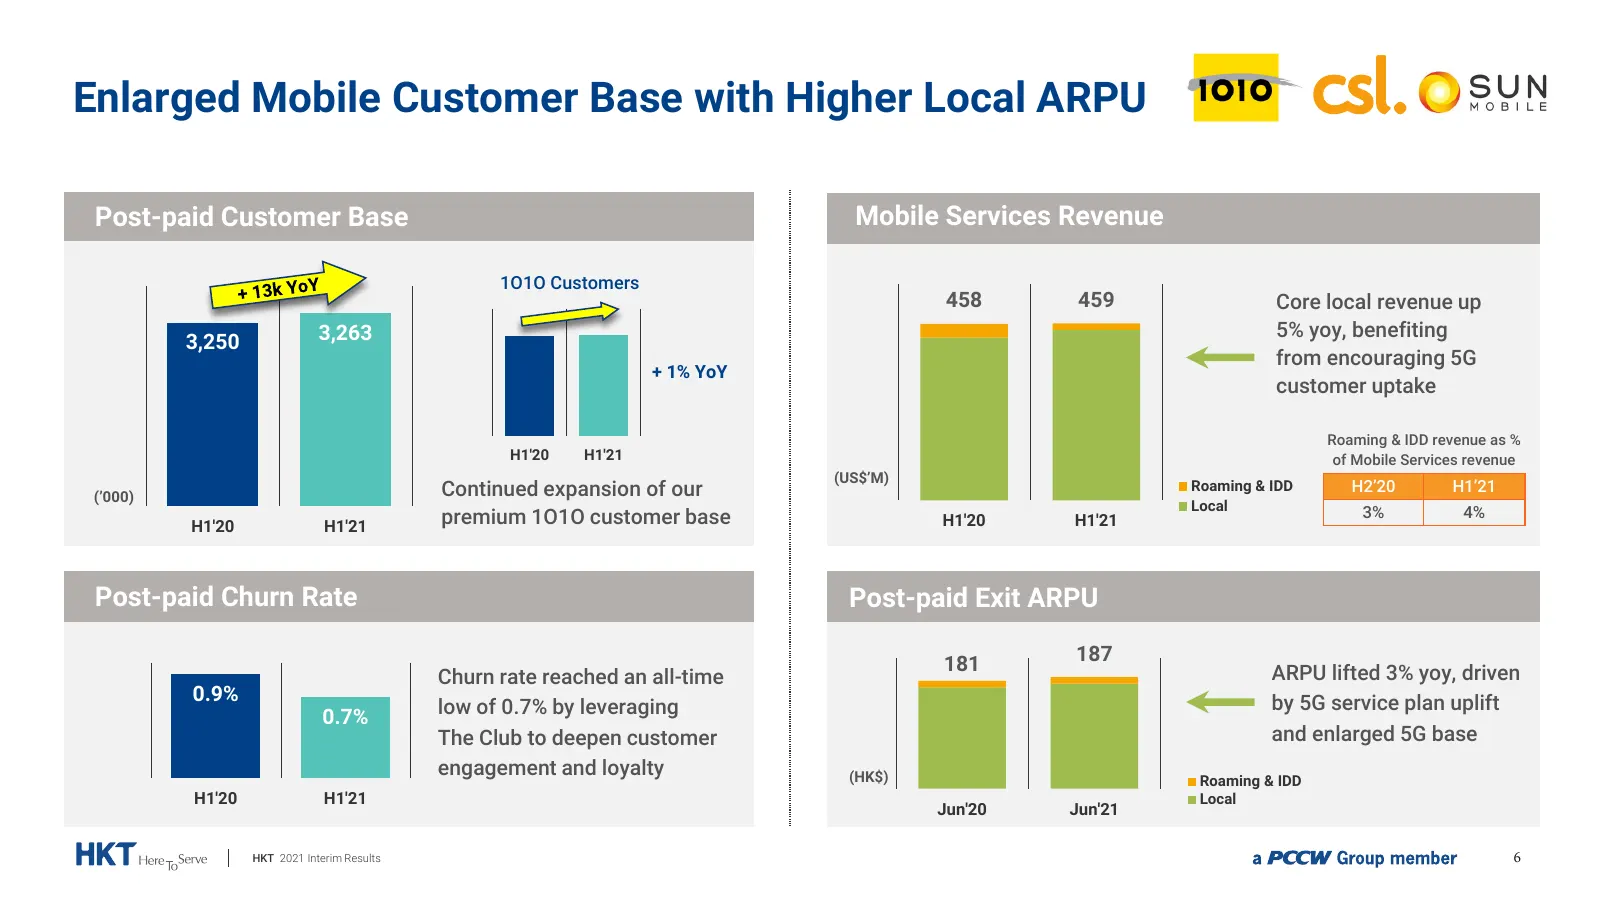
Slide 6: Enlarged Mobile Customer Base with Higher Local ARPU
Enlarged Mobile Customer Base with Higher Local ARPU Post-paid Customer Base Mobile Services Revenue 1O1O Customers 458 459 Core local revenue up 3,263 5% yoy, benefiting 3,250 from encouraging 5G + 1% YoY customer uptake Roaming & IDD revenue as % H1'20 H1'21 of Mobile Services revenue (US$’M) Cont
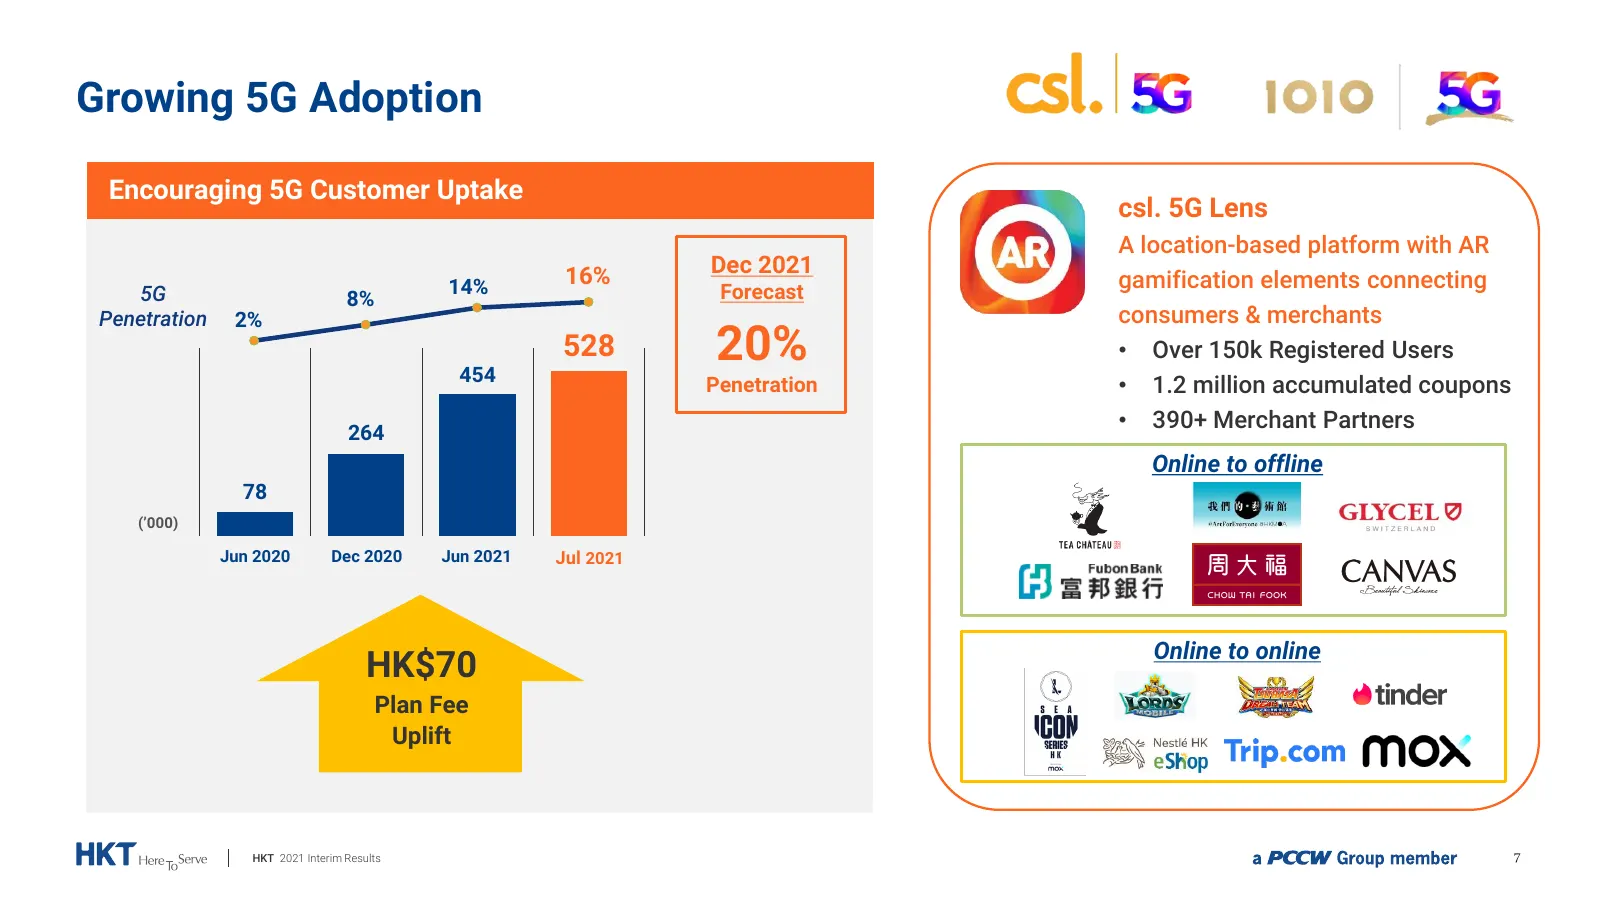
Slide 7: Growing 5G Adoption
Growing 5G Adoption Encouraging 5G Customer Uptake csl. 5G Lens A location-based platform with AR 16% Dec 2021 14% Forecast gamification elements connecting 5G 8% Penetration 2% consumers & merchants 454 528 20% • Over 150k Registered Users Penetration • 1.2 million accumulated coupons 264 • 390+ Me
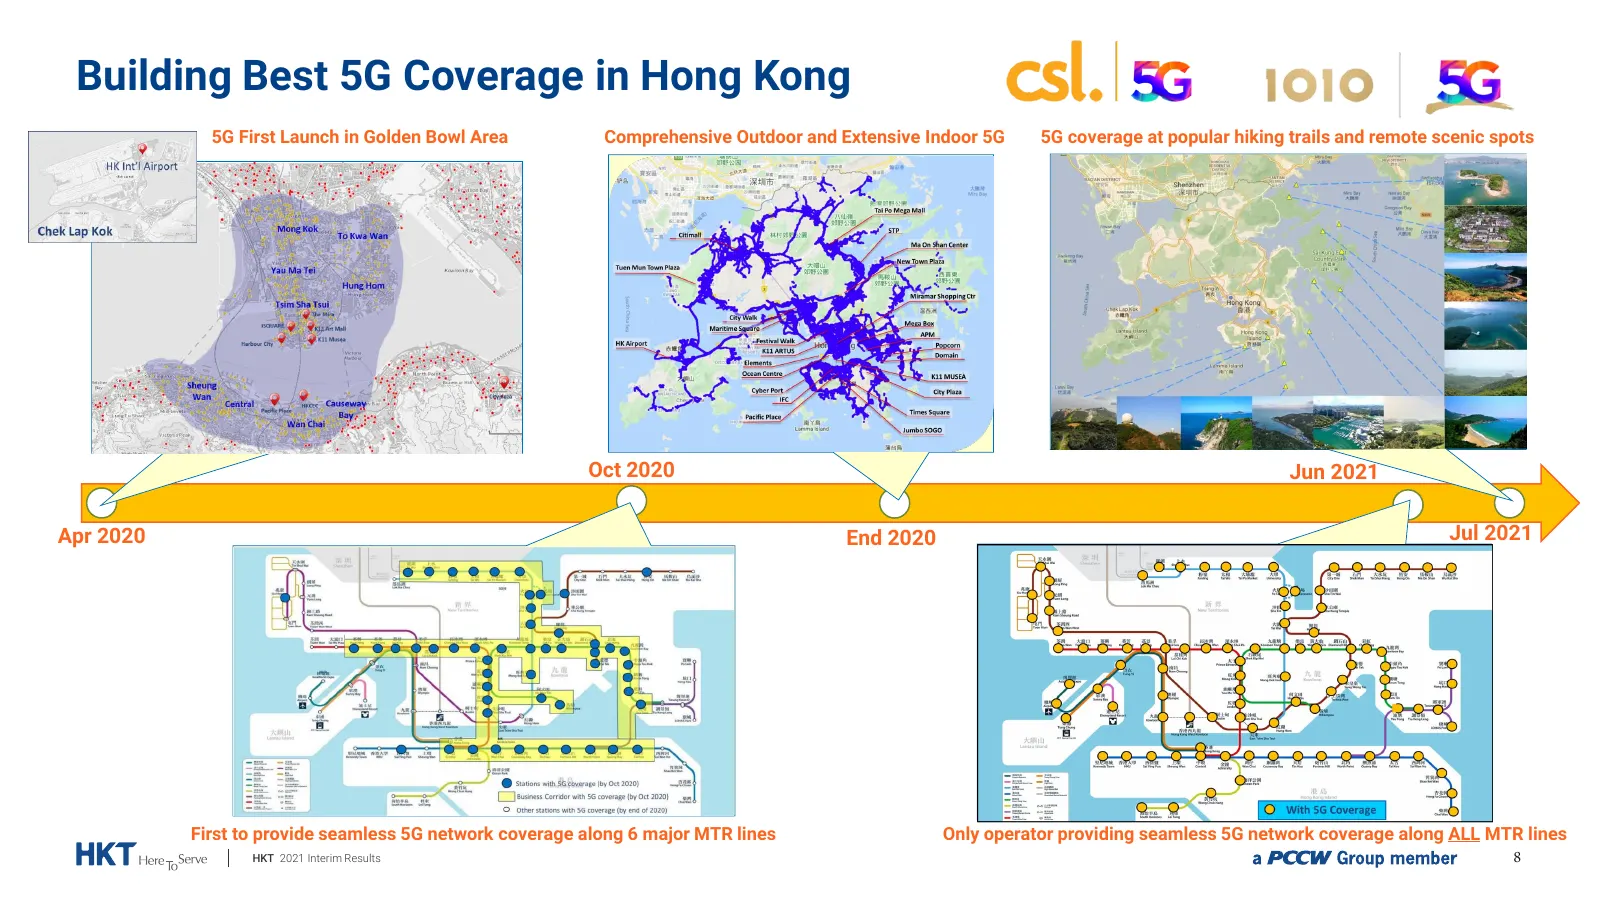
Slide 8: Building Best 5G Coverage in Hong Kong
Building Best 5G Coverage in Hong Kong 5G First Launch in Golden Bowl Area Comprehensive Outdoor and Extensive Indoor 5G 5G coverage at popular hiking trails and remote scenic spots Oct 2020 Jun 2021 Apr 2020 End 2020 Jul 2021 First to provide seamless 5G network coverage along 6 major MTR lines Onl
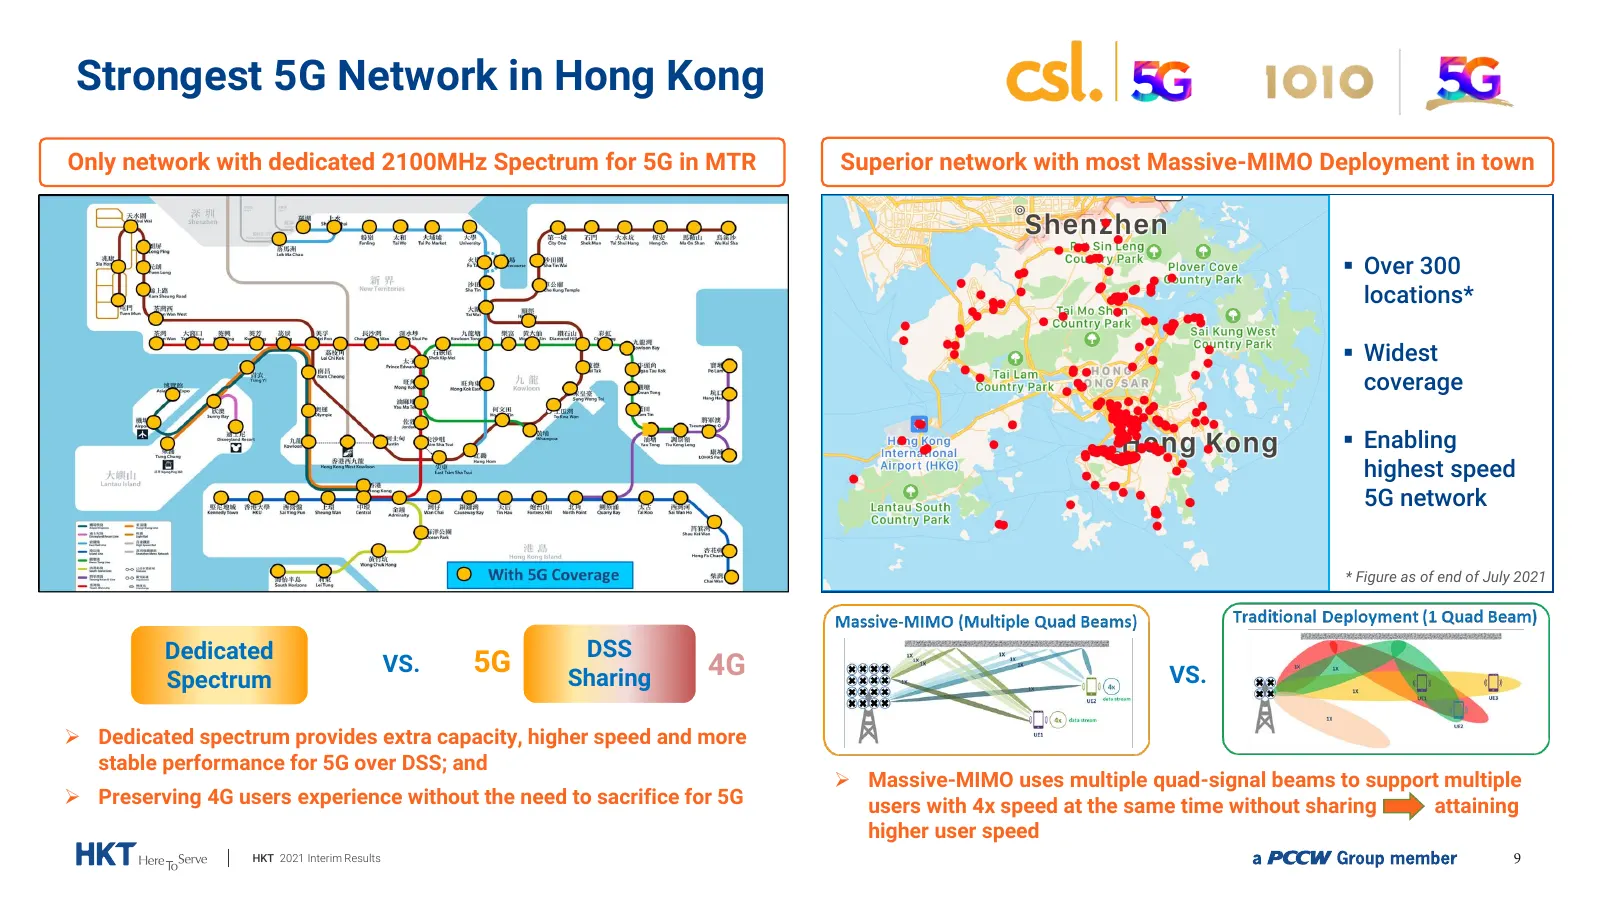
Slide 9: Strongest 5G Network in Hong Kong
Strongest 5G Network in Hong Kong Only network with dedicated 2100MHz Spectrum for 5G in MTR Superior network with most Massive-MIMO Deployment in town Over 300 locations* Widest coverage Enabling highest speed 5G network * Figure as of end of July 2021 Dedicated DSS VS. 5G Sharing 4G VS. Spec
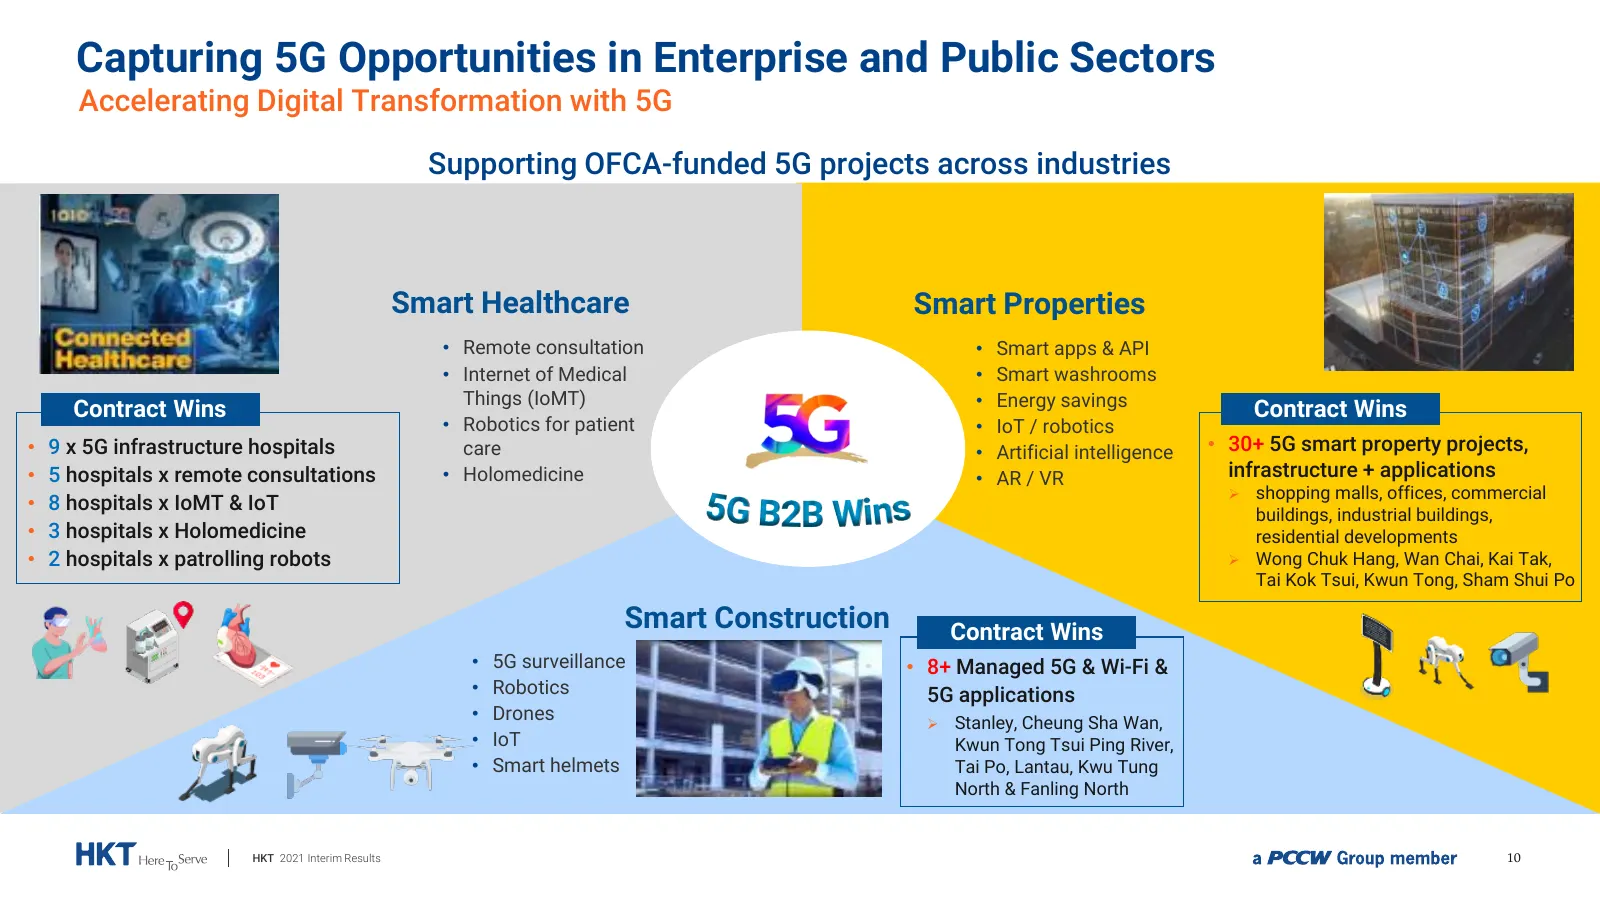
Slide 10: Capturing 5G Opportunities in Enterprise and Public Sectors
Capturing 5G Opportunities in Enterprise and Public Sectors Accelerating Digital Transformation with 5G Supporting OFCA-funded 5G projects across industries Smart Healthcare Smart Properties • Remote consultation • Smart apps & API • Internet of Medical • Smart washrooms Things (IoMT) • Energy savin
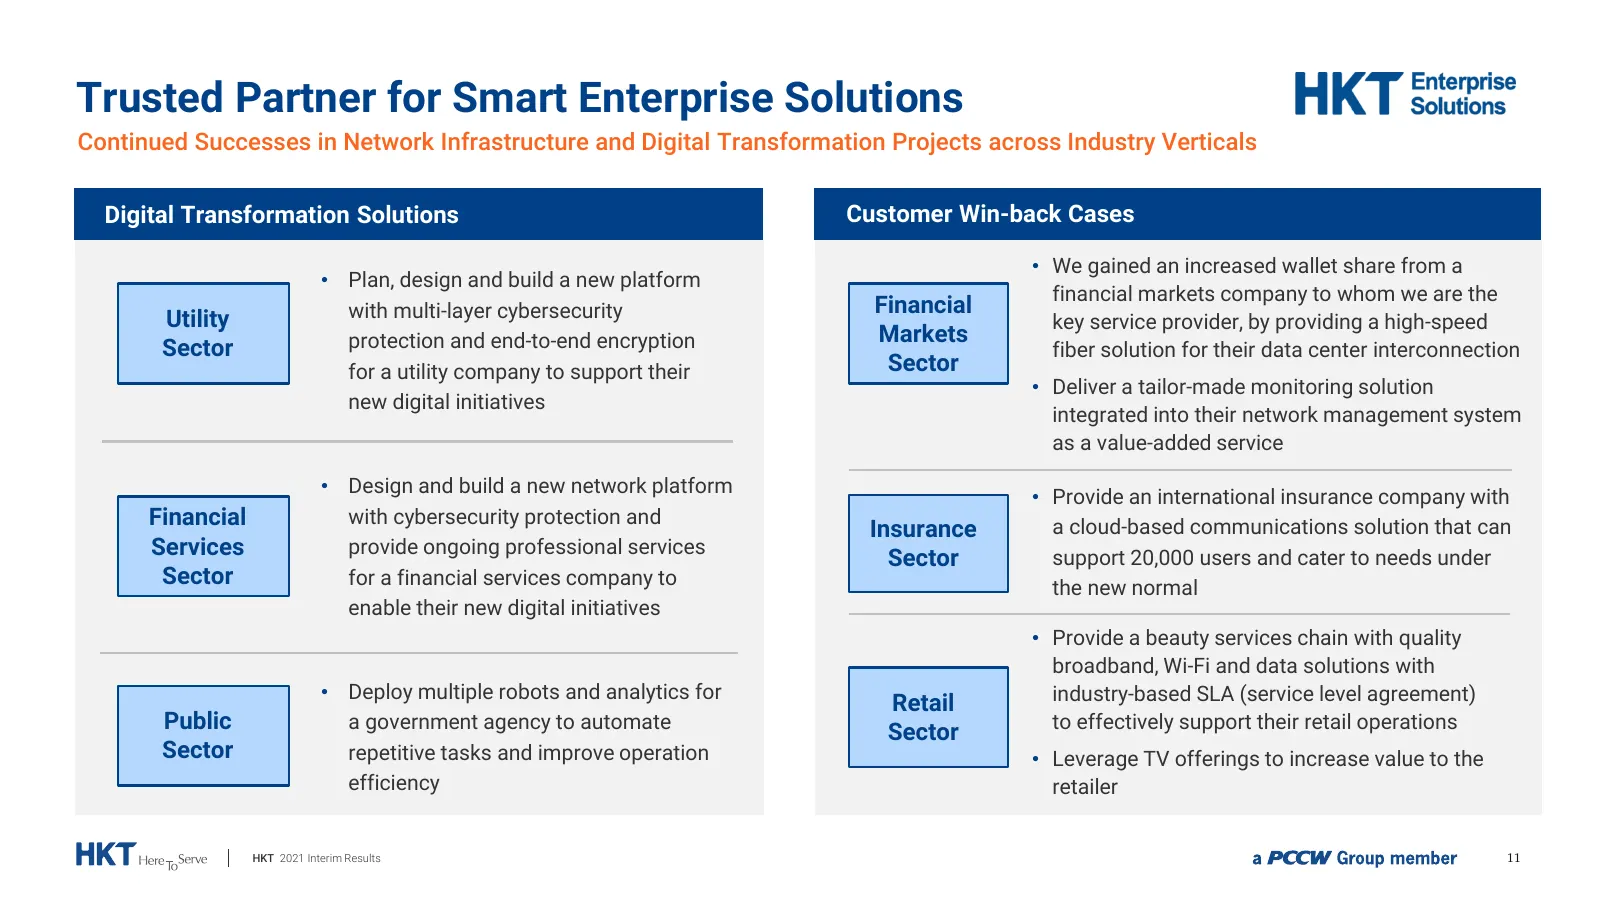
Slide 11: Trusted Partner for Smart Enterprise Solutions
Trusted Partner for Smart Enterprise Solutions Continued Successes in Network Infrastructure and Digital Transformation Projects across Industry Verticals Digital Transformation Solutions Customer Win-back Cases • We gained an increased wallet share from a • Plan, design and build a new platform fin
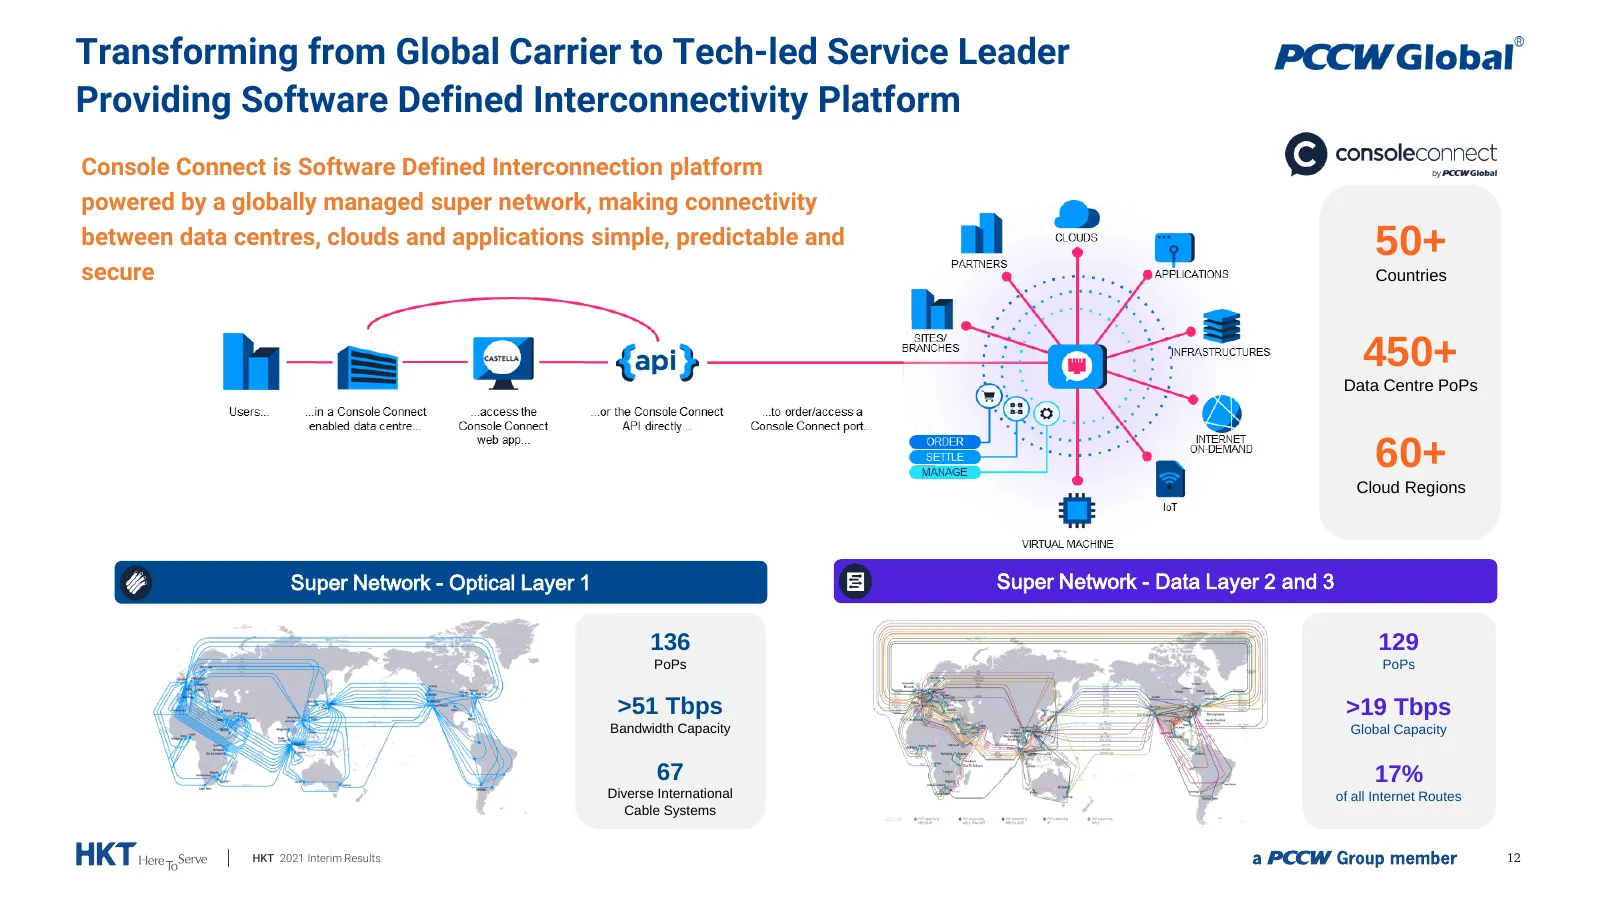
Slide 12: Transforming from Global Carrier to Tech-led Service Leader
Transforming from Global Carrier to Tech-led Service Leader Providing Software Defined Interconnectivity Platform Console Connect is Software Defined Interconnection platform powered by a globally managed super network, making connectivity between data centres, clouds and applications simple, predic
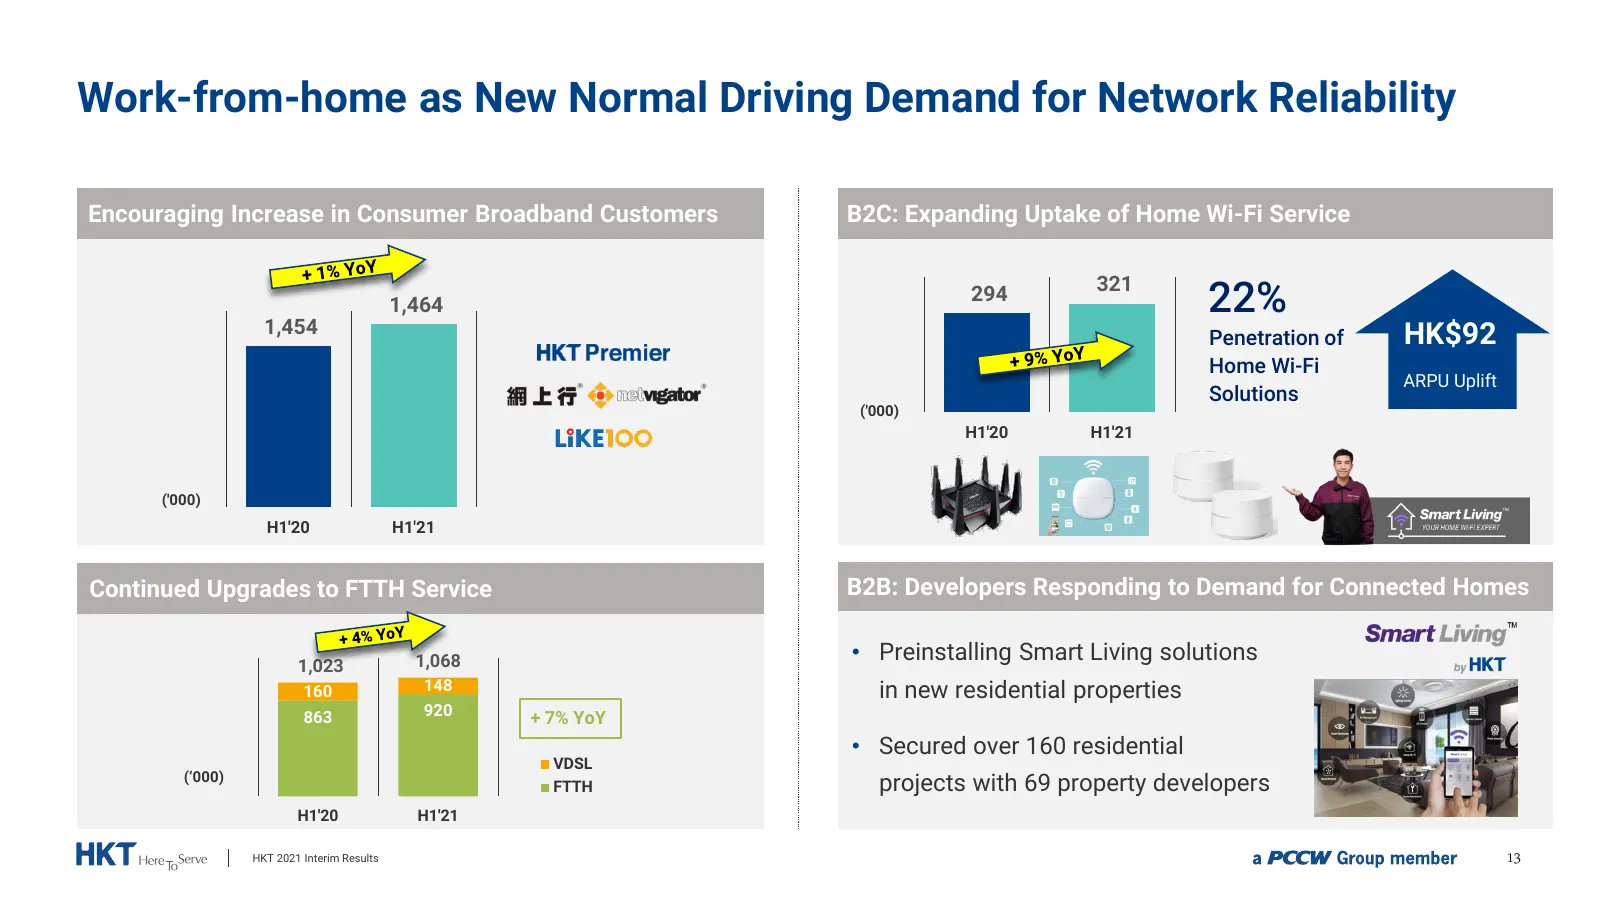
Slide 13: Work-from-home as New Normal Driving Demand for Network Reliability
Work-from-home as New Normal Driving Demand for Network Reliability Encouraging Increase in Consumer Broadband Customers B2C: Expanding Uptake of Home Wi-Fi Service 321 1,464 294 22% 1,454 HK$92 Penetration of Home Wi-Fi ARPU Uplift Solutions ('000) H1'20 H1'21 ('000) H1'20 H1'21 Continued Upgrades
Slide 14: Unrivaled Fiber Connectivity
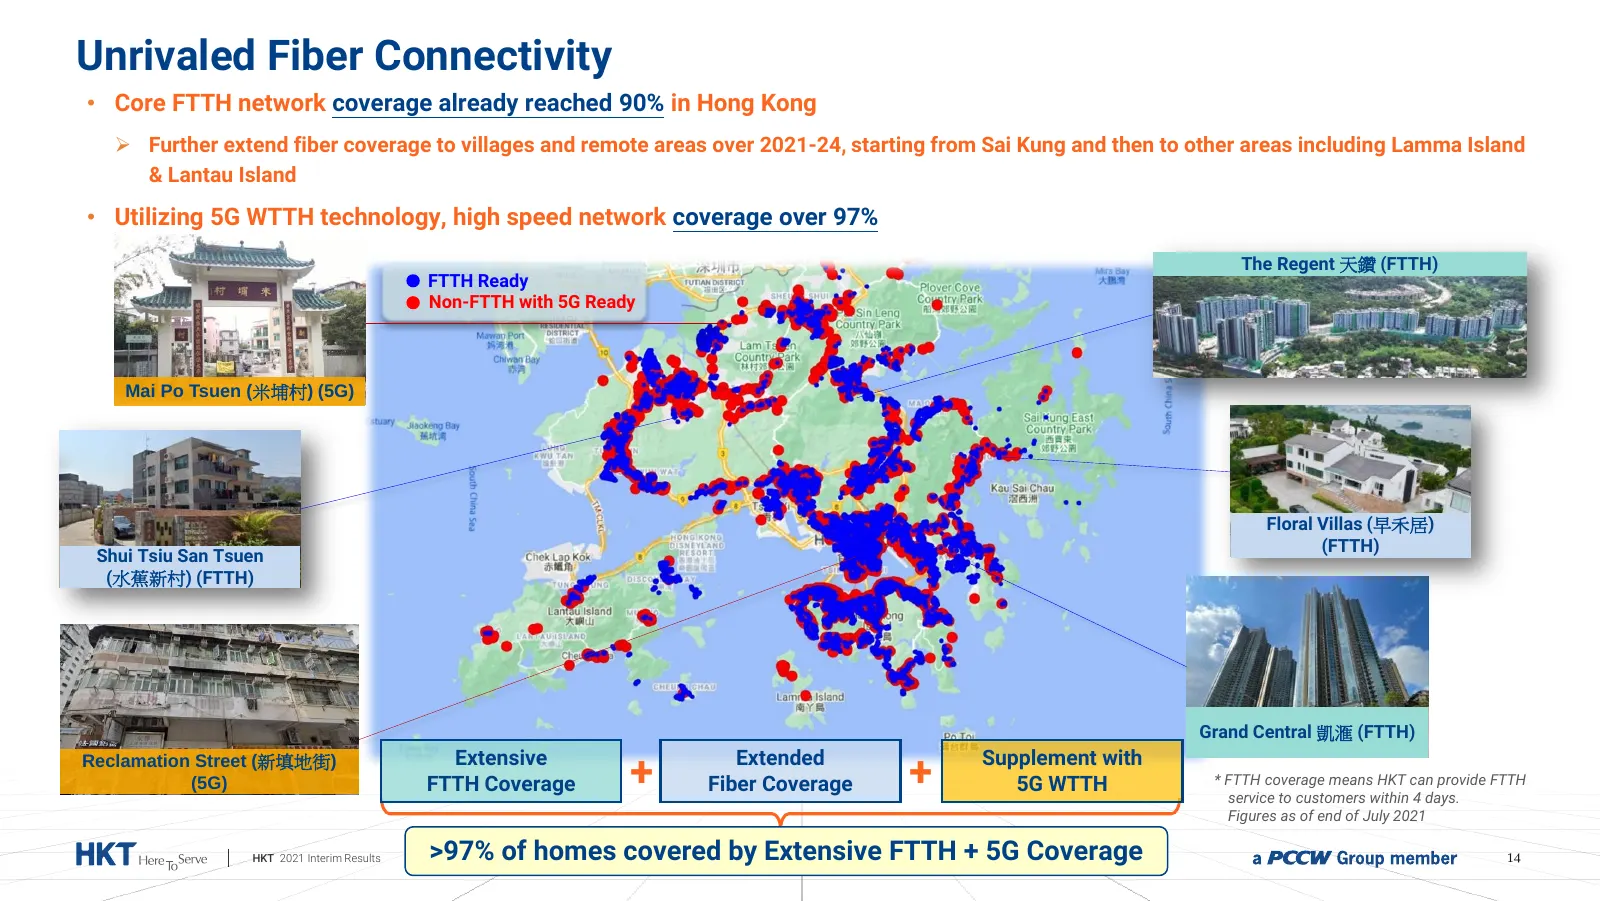
Unrivaled Fiber Connectivity • Core FTTH network coverage already reached 90% in Hong Kong Further extend fiber coverage to villages and remote areas over 2021-24, starting from Sai Kung and then to other areas including Lamma Island & Lantau Island • Utilizing 5G WTTH technology, high speed netwo
Slide 15: Successful EURO 2020 Broadcast with Encouraging Results
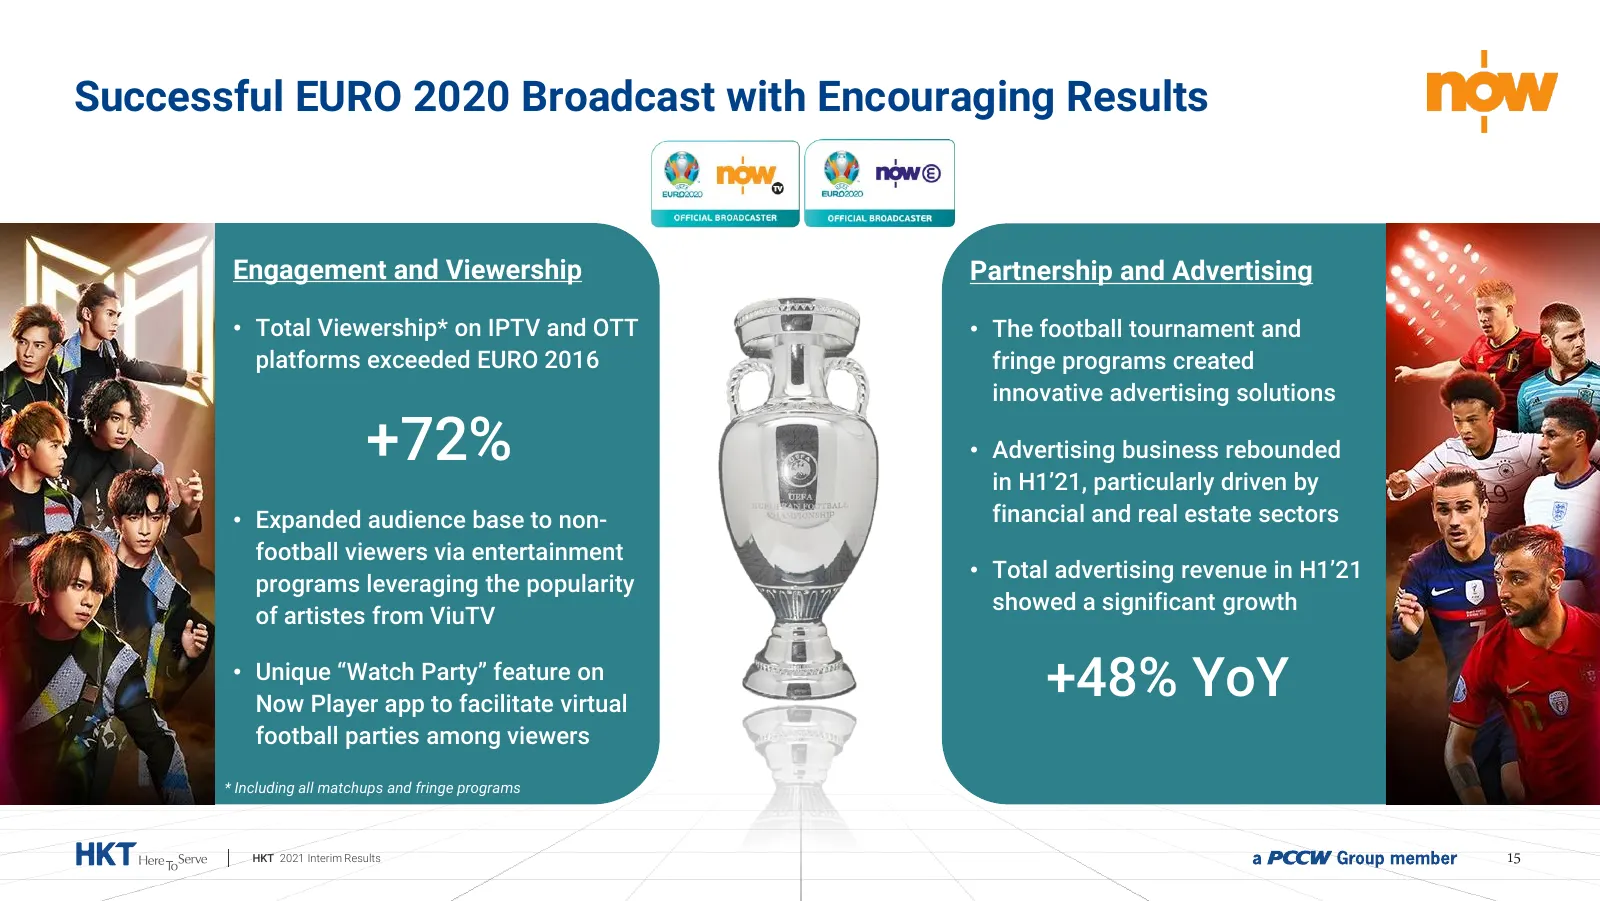
Successful EURO 2020 Broadcast with Encouraging Results Engagement and Viewership Partnership and Advertising • Total Viewership* on IPTV and OTT • The football tournament and platforms exceeded EURO 2016 fringe programs created innovative advertising solutions +72% • Advertising business rebounded
Slide 16: Continued to Innovate and Offer the Widest Choice of Entertainment
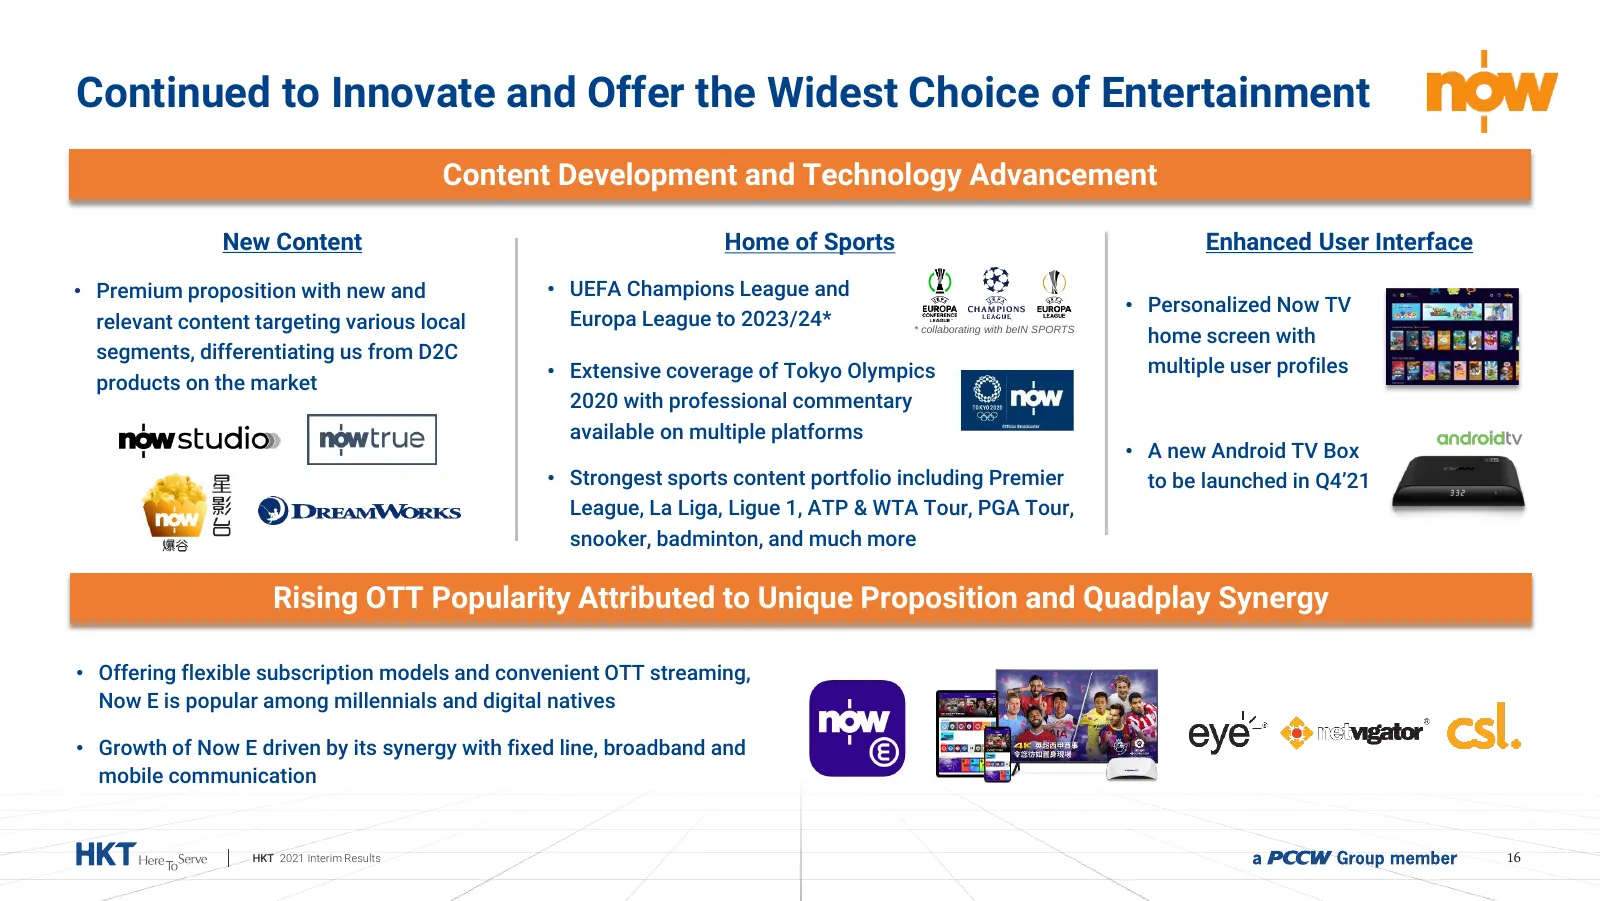
Continued to Innovate and Offer the Widest Choice of Entertainment Content Development and Technology Advancement New Content Home of Sports Enhanced User Interface • Premium proposition with new and • UEFA Champions League and • Personalized Now TV relevant content targeting various local Europa Le
Slide 17: The Club – Convergence of Loyalty and e-Commerce
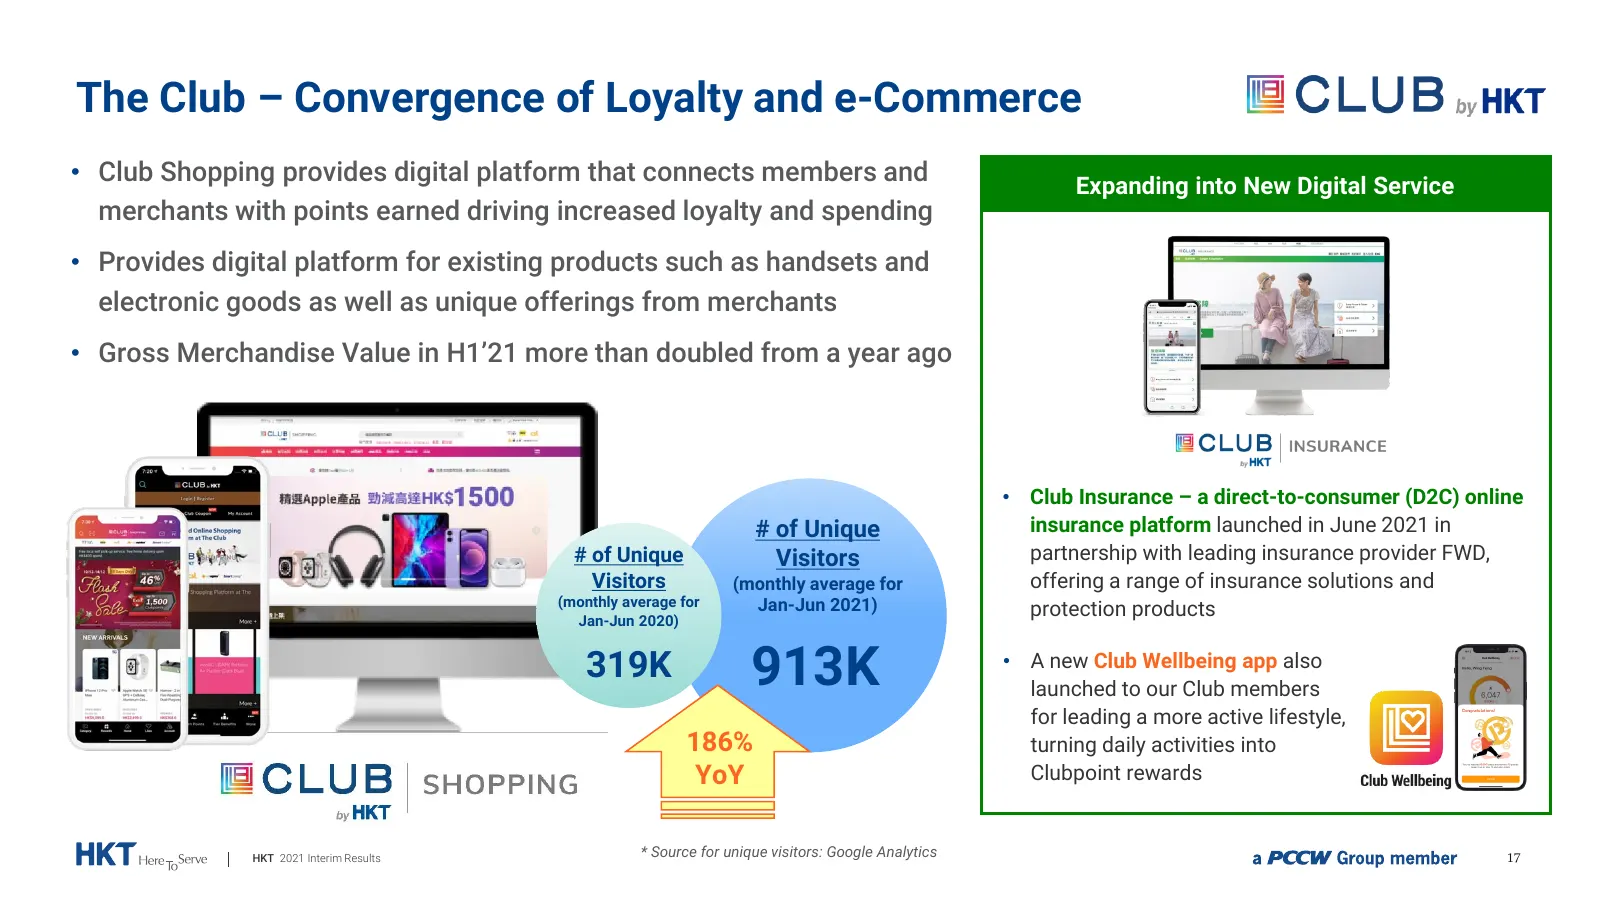
The Club – Convergence of Loyalty and e-Commerce • Club Shopping provides digital platform that connects members and Expanding into New Digital Service merchants with points earned driving increased loyalty and spending • Provides digital platform for existing products such as handsets and electroni
Slide 18: Supporting Government Consumption Voucher Scheme to Foster Digital Payment
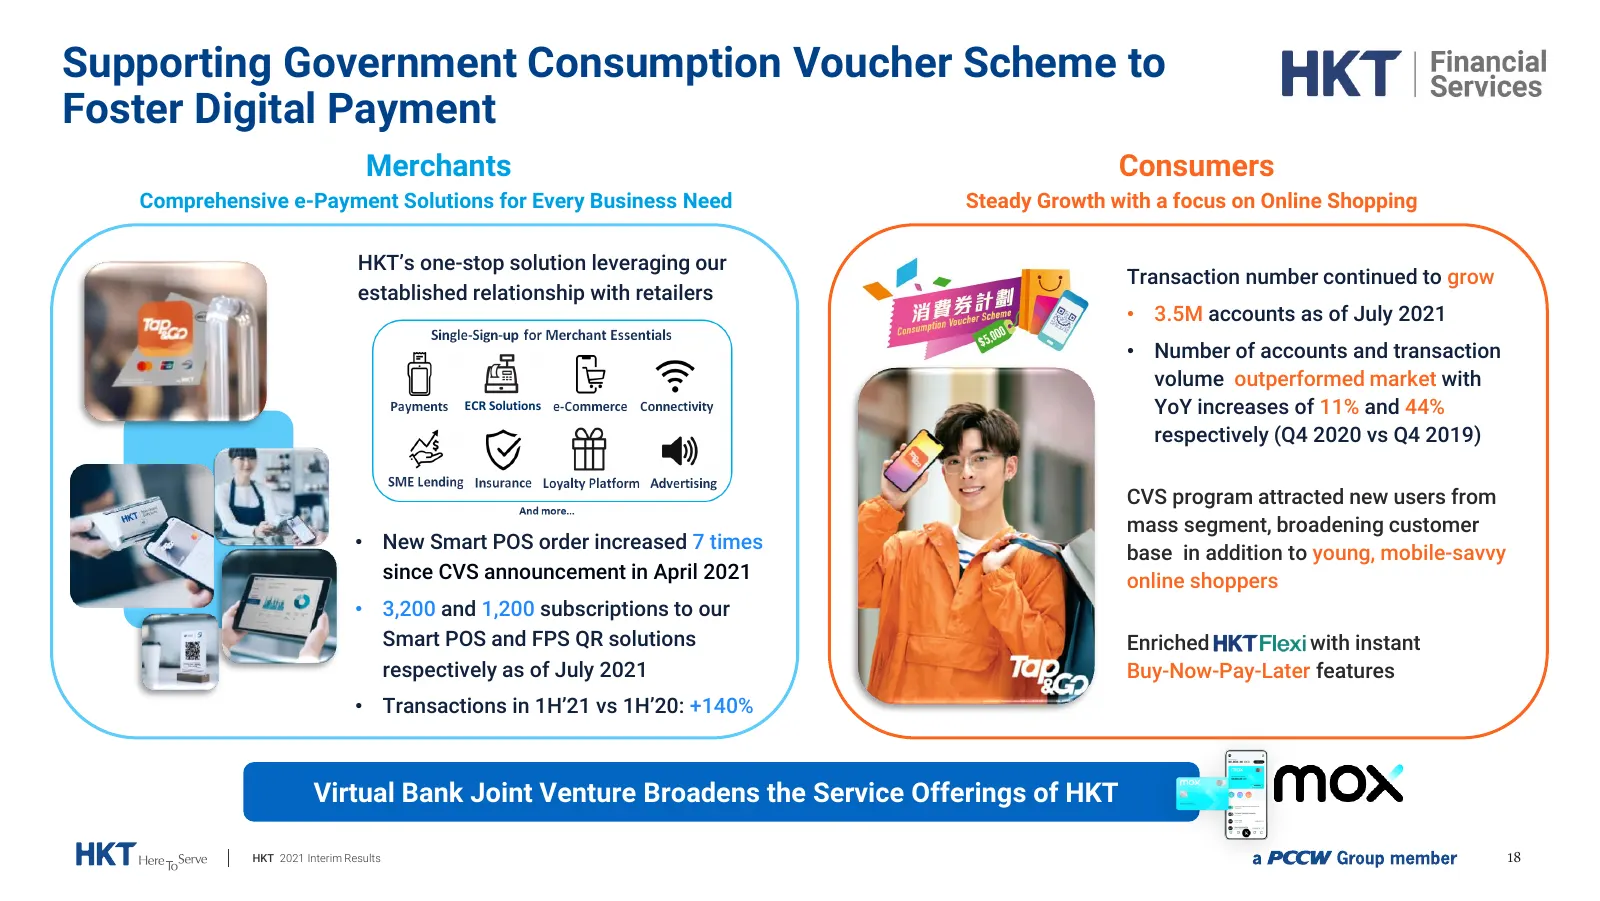
Supporting Government Consumption Voucher Scheme to Foster Digital Payment Merchants Consumers Comprehensive e-Payment Solutions for Every Business Need Steady Growth with a focus on Online Shopping HKT’s one-stop solution leveraging our Transaction number continued to grow established relationship
Slide 19: HKT Pioneers Telemedicine in HK with DrGo
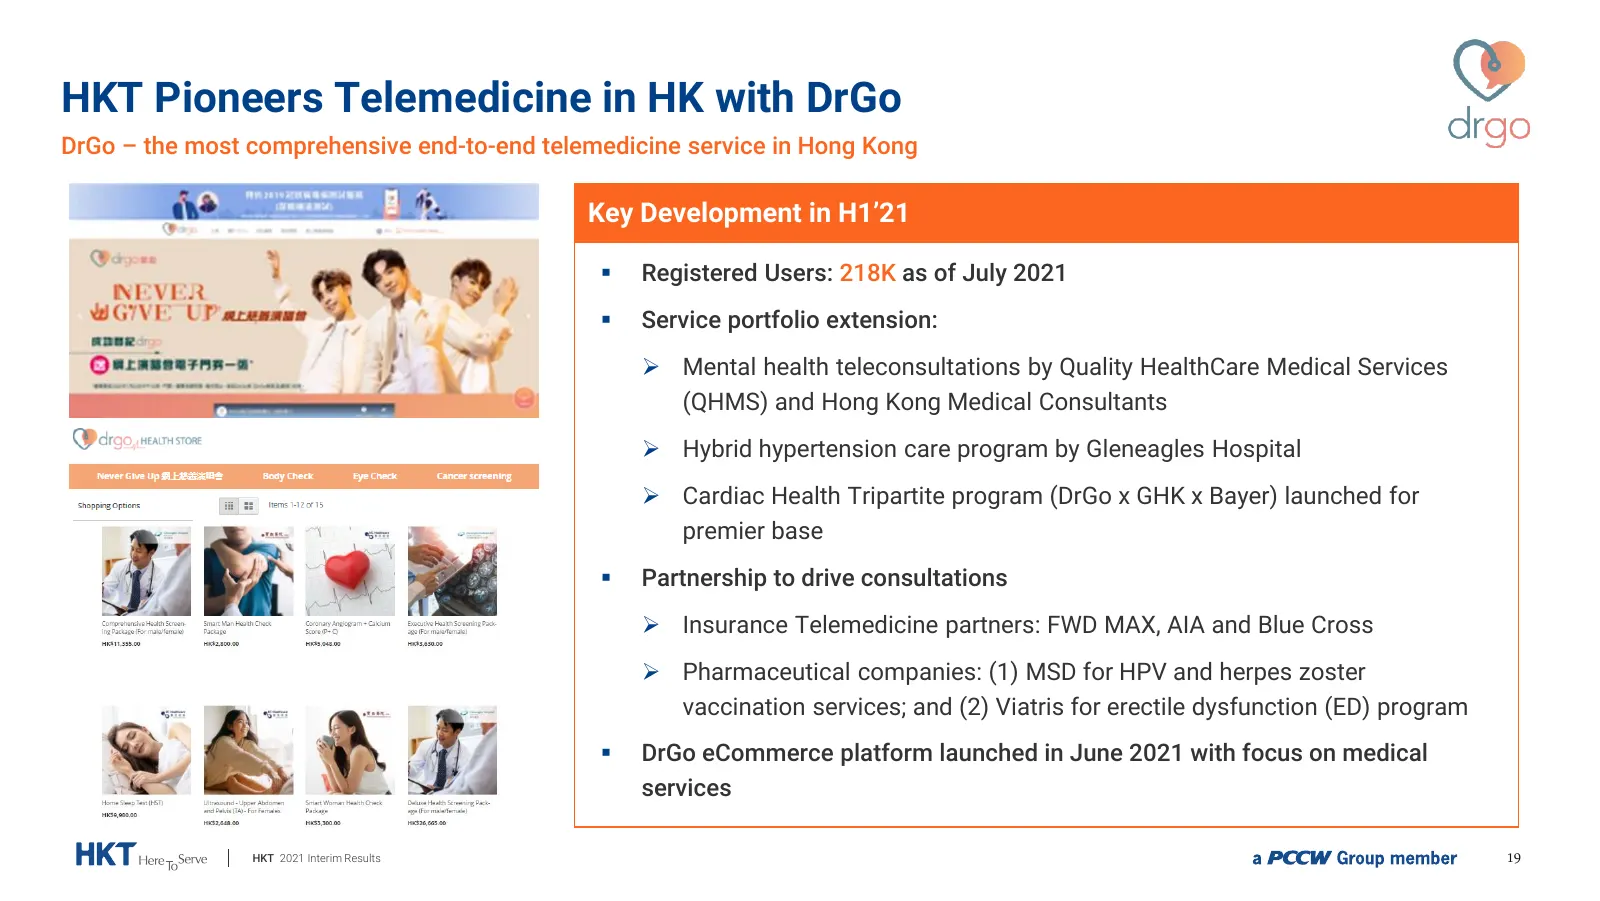
HKT Pioneers Telemedicine in HK with DrGo DrGo – the most comprehensive end-to-end telemedicine service in Hong Kong Key Development in H1’21 Registered Users: 218K as of July 2021 Service portfolio extension: Mental health teleconsultations by Quality HealthCare Medical Services (QHMS) and Ho
Slide 20: Corporate Social Responsibility
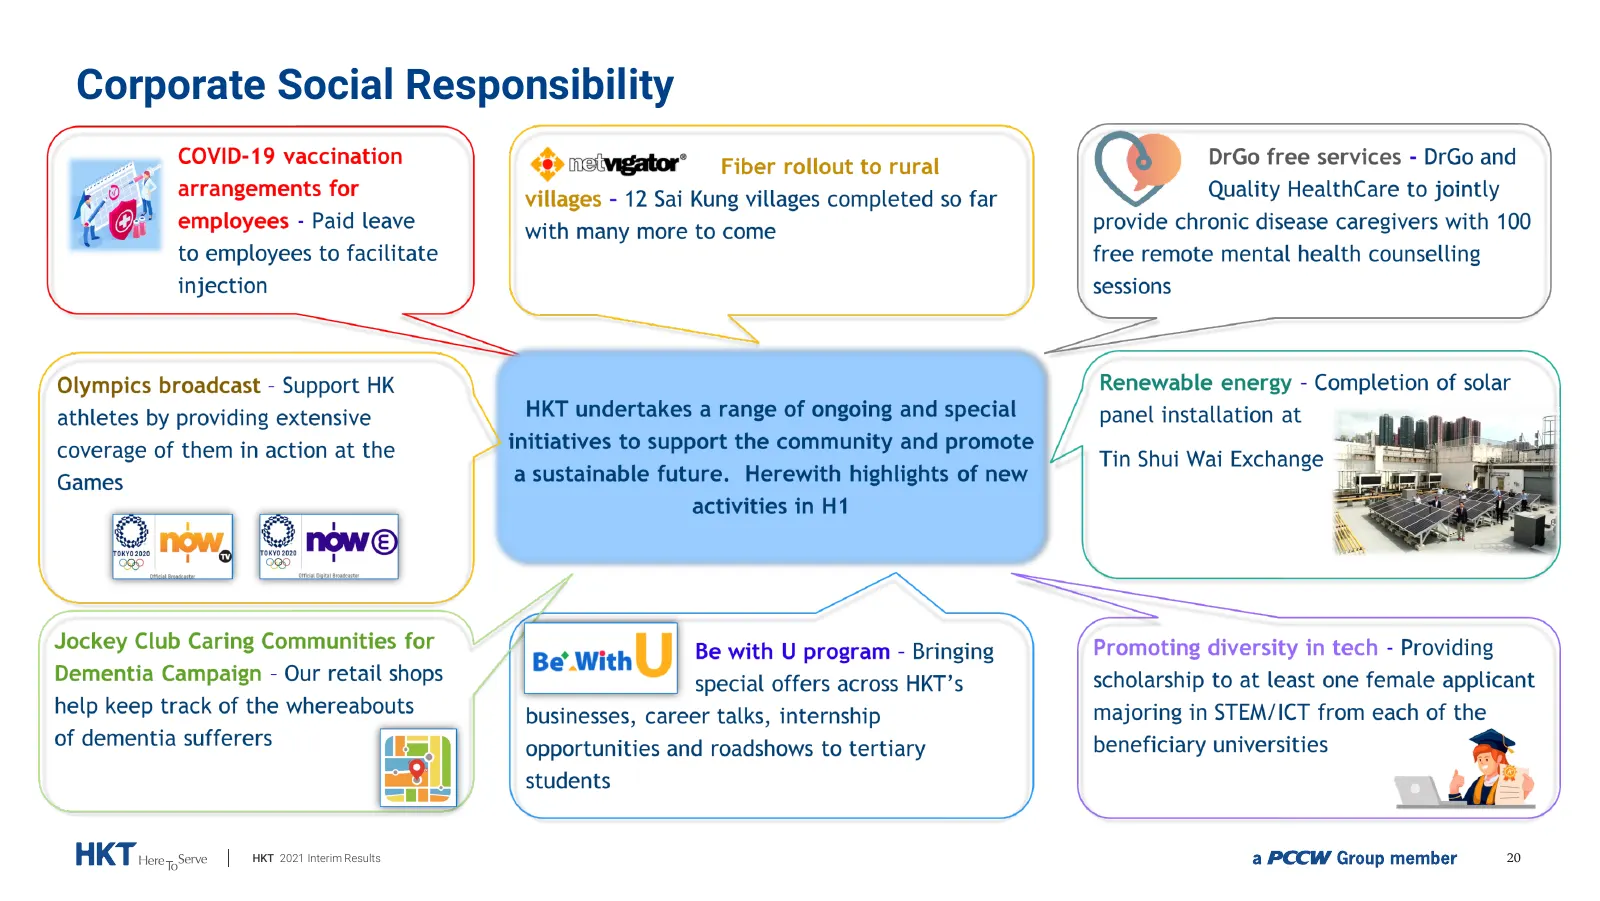
Corporate Social Responsibility HKT 2021 Interim Results 20
Slide 21: Highlights
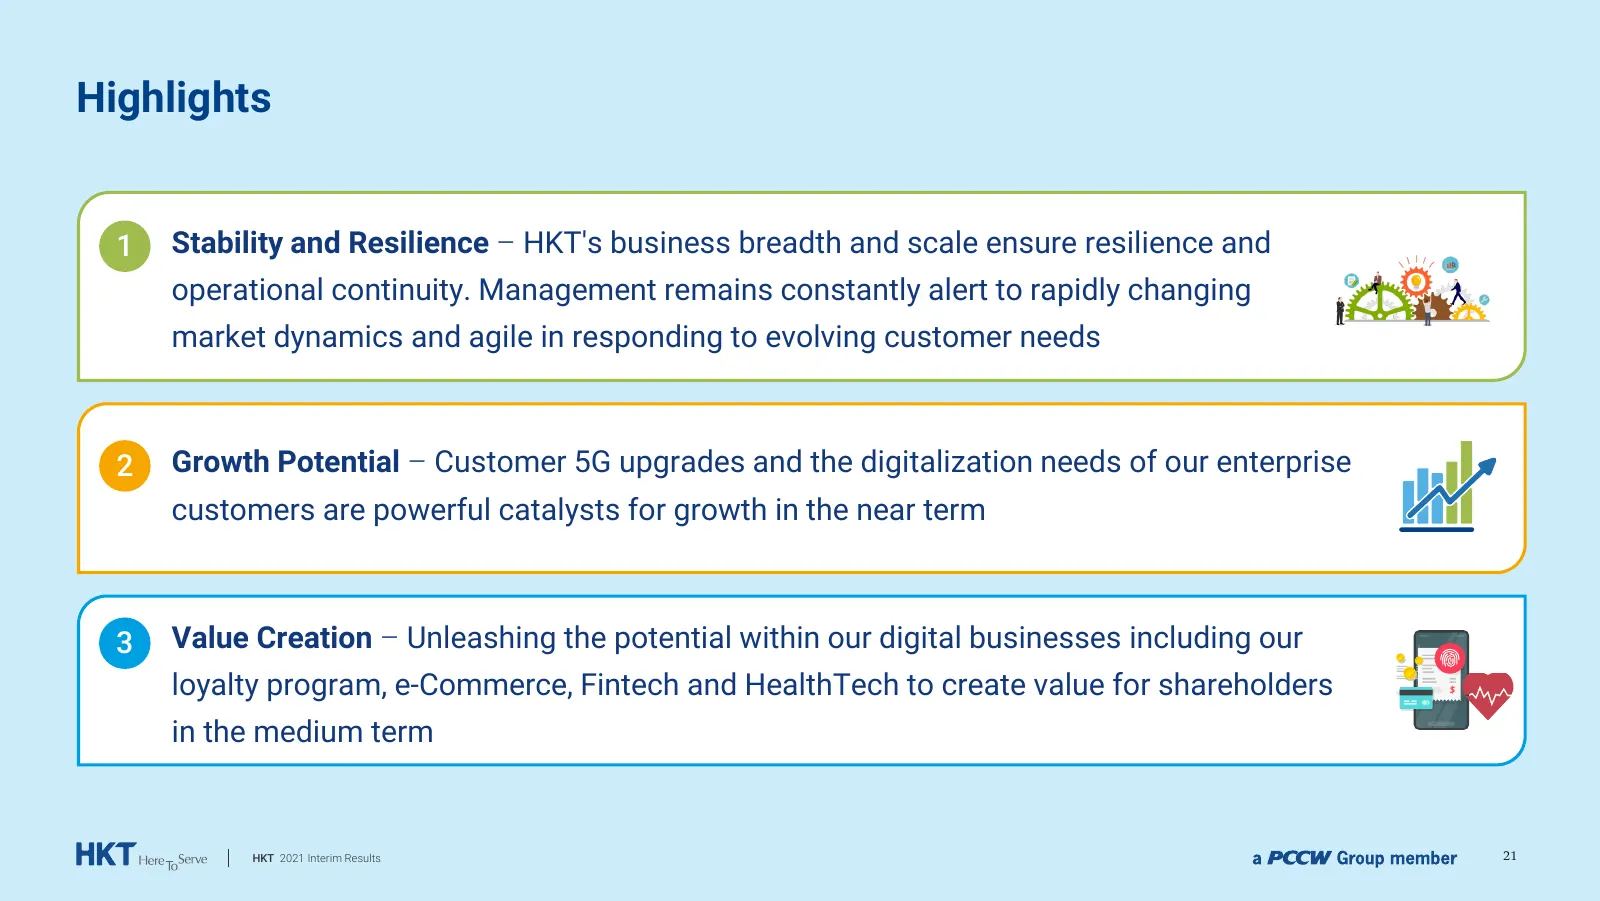
Highlights 1 Stability and Resilience – HKT's business breadth and scale ensure resilience and operational continuity. Management remains constantly alert to rapidly changing market dynamics and agile in responding to evolving customer needs 2 Growth Potential – Customer 5G upgrades and the digitali

Slide 22: Financial Review
Financial Review Evan Wong Chief Financial Officer 22
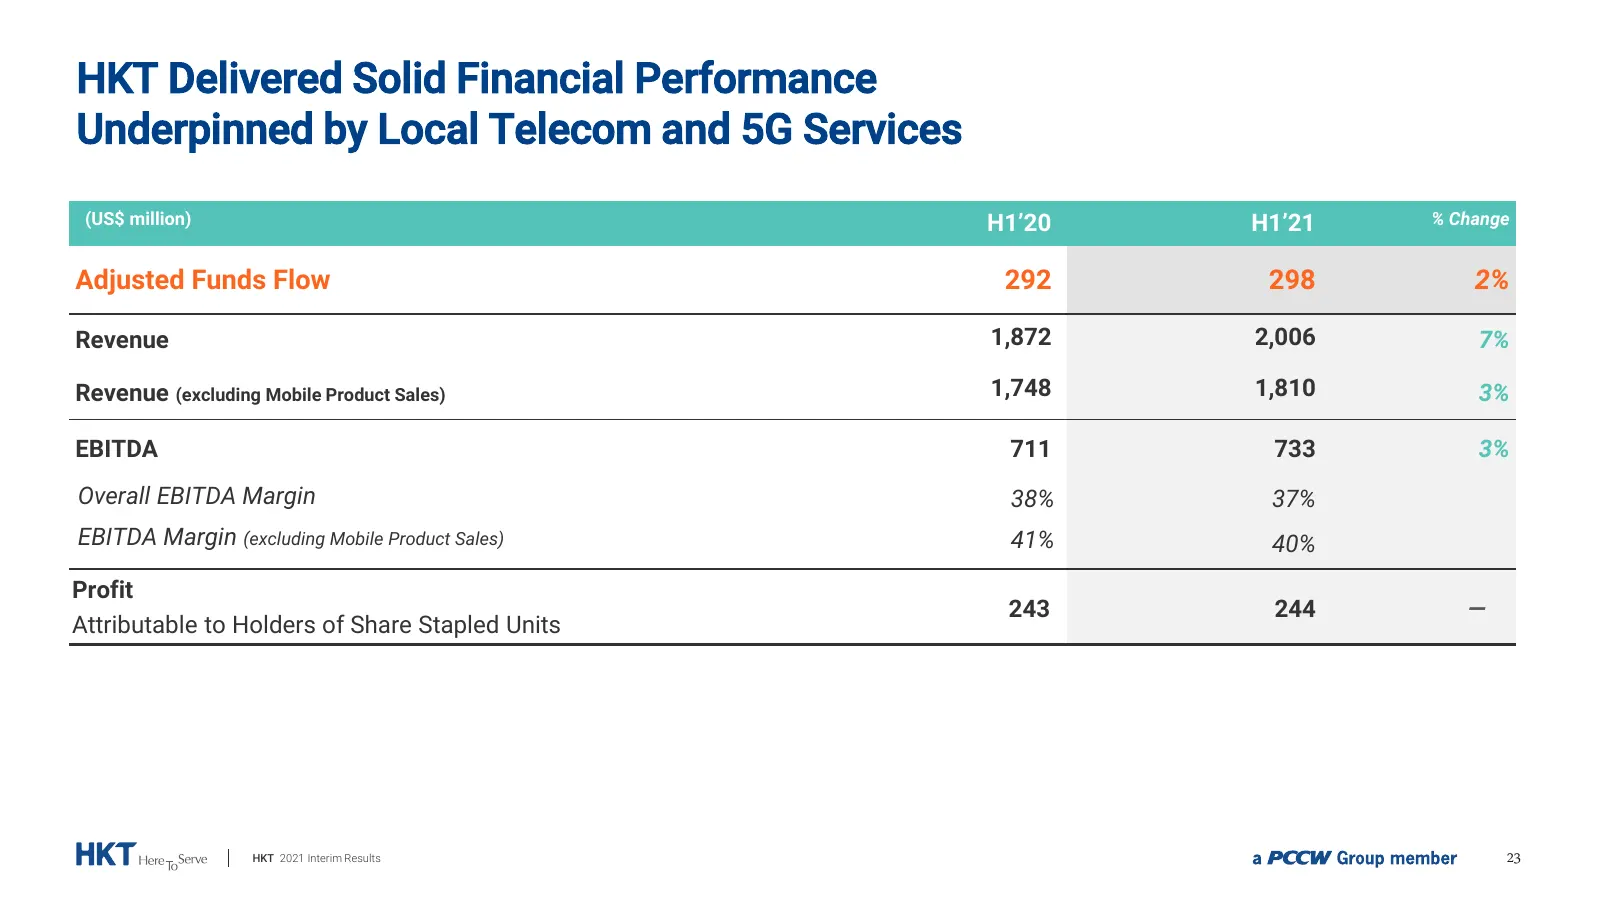
Slide 23: HKT Delivered Solid Financial Performance Underpinned by Local Telecom and 5G Services
HKT Delivered Solid Financial Performance Underpinned by Local Telecom and 5G Services (US$ million) H1’20 H1’21 % Change Adjusted Funds Flow 292 298 2% Revenue 1,872 2,006 7% Revenue (excluding Mobile Product Sales) 1,748 1,810 3% EBITDA 711 733 3% Overall EBITDA Margin 38% 37% EBITDA Margin (exclu
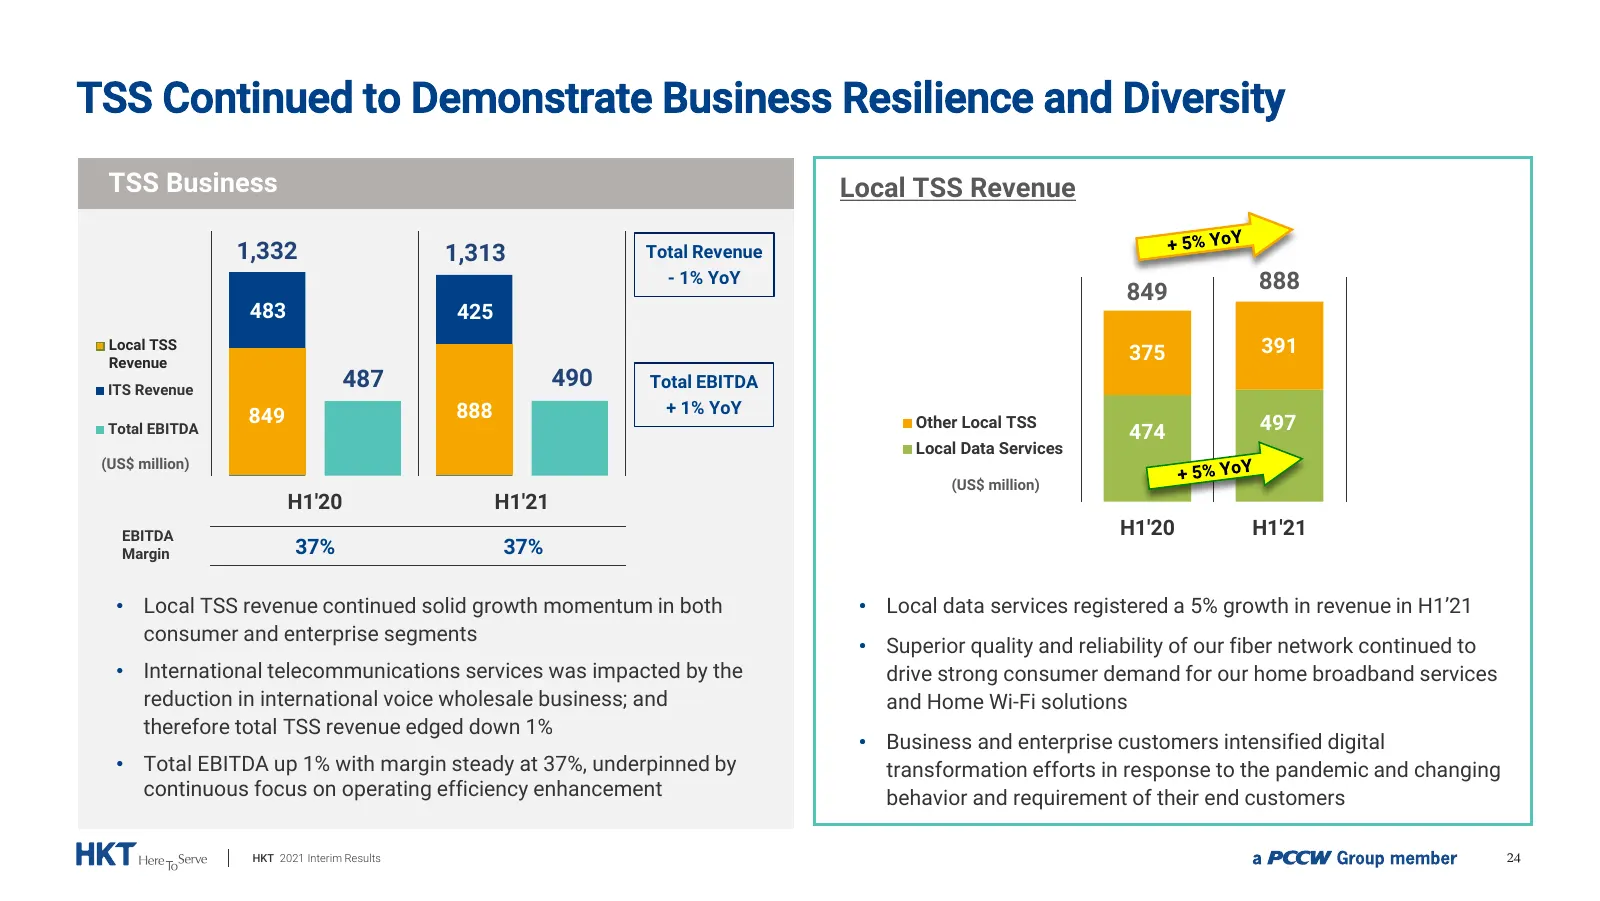
Slide 24: TSS Continued to Demonstrate Business Resilience and Diversity
TSS Continued to Demonstrate Business Resilience and Diversity TSS Business Local TSS Revenue 1,332 1,313 Total Revenue - 1% YoY 849 888 483 425 Local TSS 375 391 Revenue ITS Revenue 487 490 Total EBITDA 888 + 1% YoY 849 Other Local TSS 497 Total EBITDA 474 Local Data Services (US$ million) (US$ mil
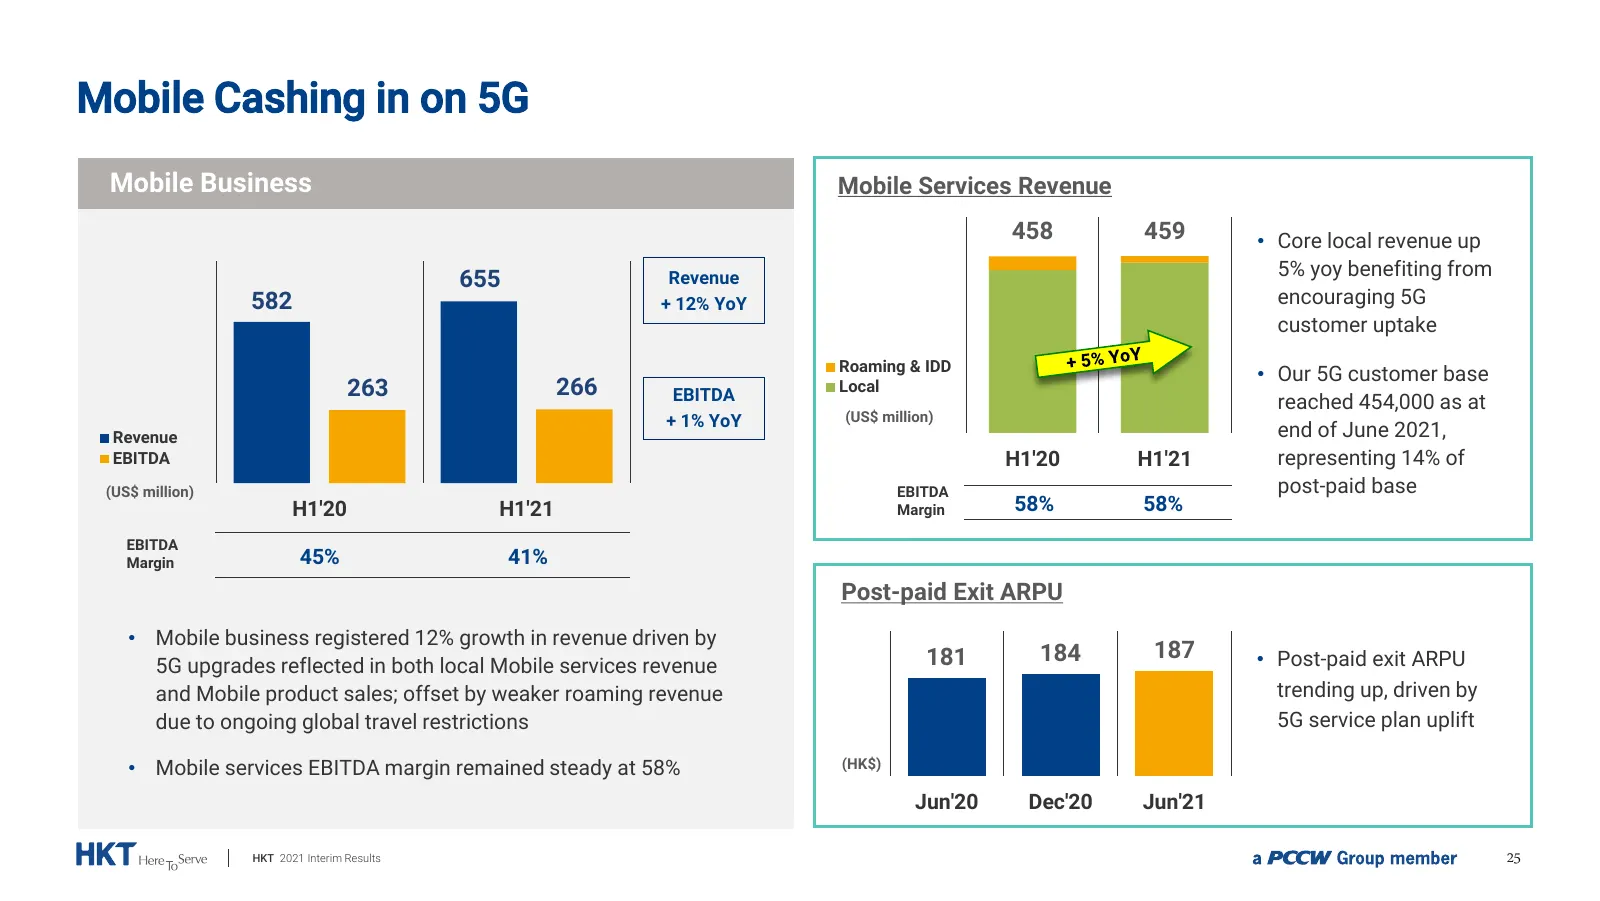
Slide 25: Mobile Cashing in on 5G
Mobile Cashing in on 5G Mobile Business Mobile Services Revenue 458 459 • Core local revenue up 5% yoy benefiting from 655 Revenue 582 + 12% YoY encouraging 5G customer uptake Roaming & IDD • Our 5G customer base 263 266 EBITDA Local reached 454,000 as at + 1% YoY (US$ million) Revenue end of June 2
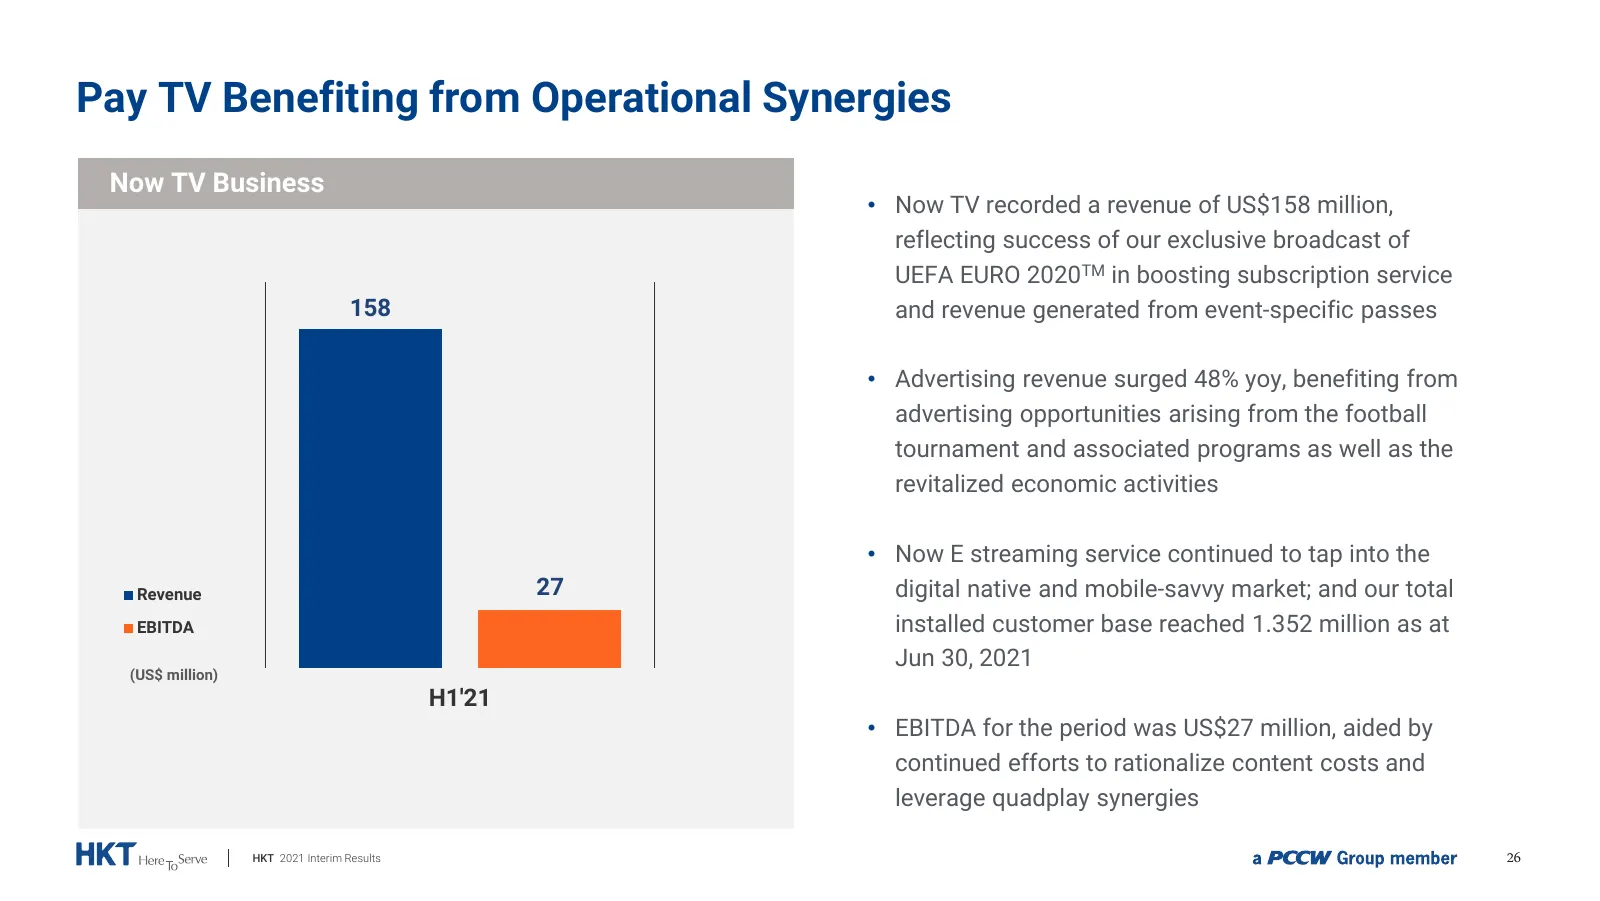
Slide 26: Pay TV Benefiting from Operational Synergies
Pay TV Benefiting from Operational Synergies Now TV Business • Now TV recorded a revenue of US$158 million, reflecting success of our exclusive broadcast of UEFA EURO 2020TM in boosting subscription service 158 and revenue generated from event-specific passes • Advertising revenue surged 48% yoy, be
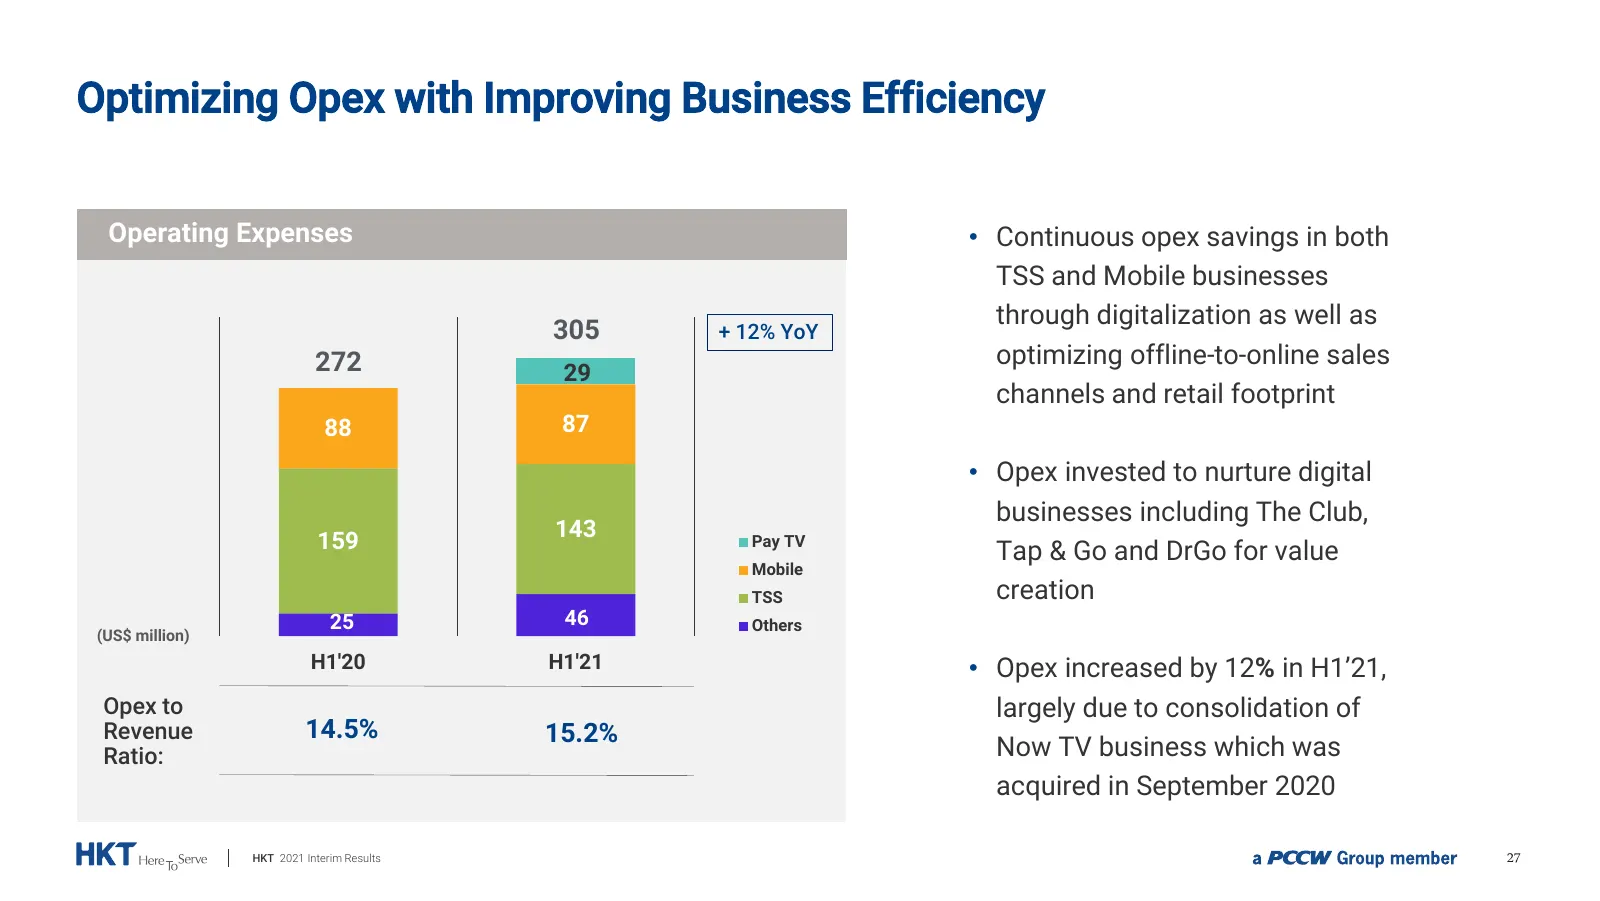
Slide 27: Optimizing Opex with Improving Business Efficiency
Optimizing Opex with Improving Business Efficiency Operating Expenses • Continuous opex savings in both TSS and Mobile businesses through digitalization as well as 305 + 12% YoY 272 optimizing offline-to-online sales 29 channels and retail footprint 88 87 • Opex invested to nurture digital businesse
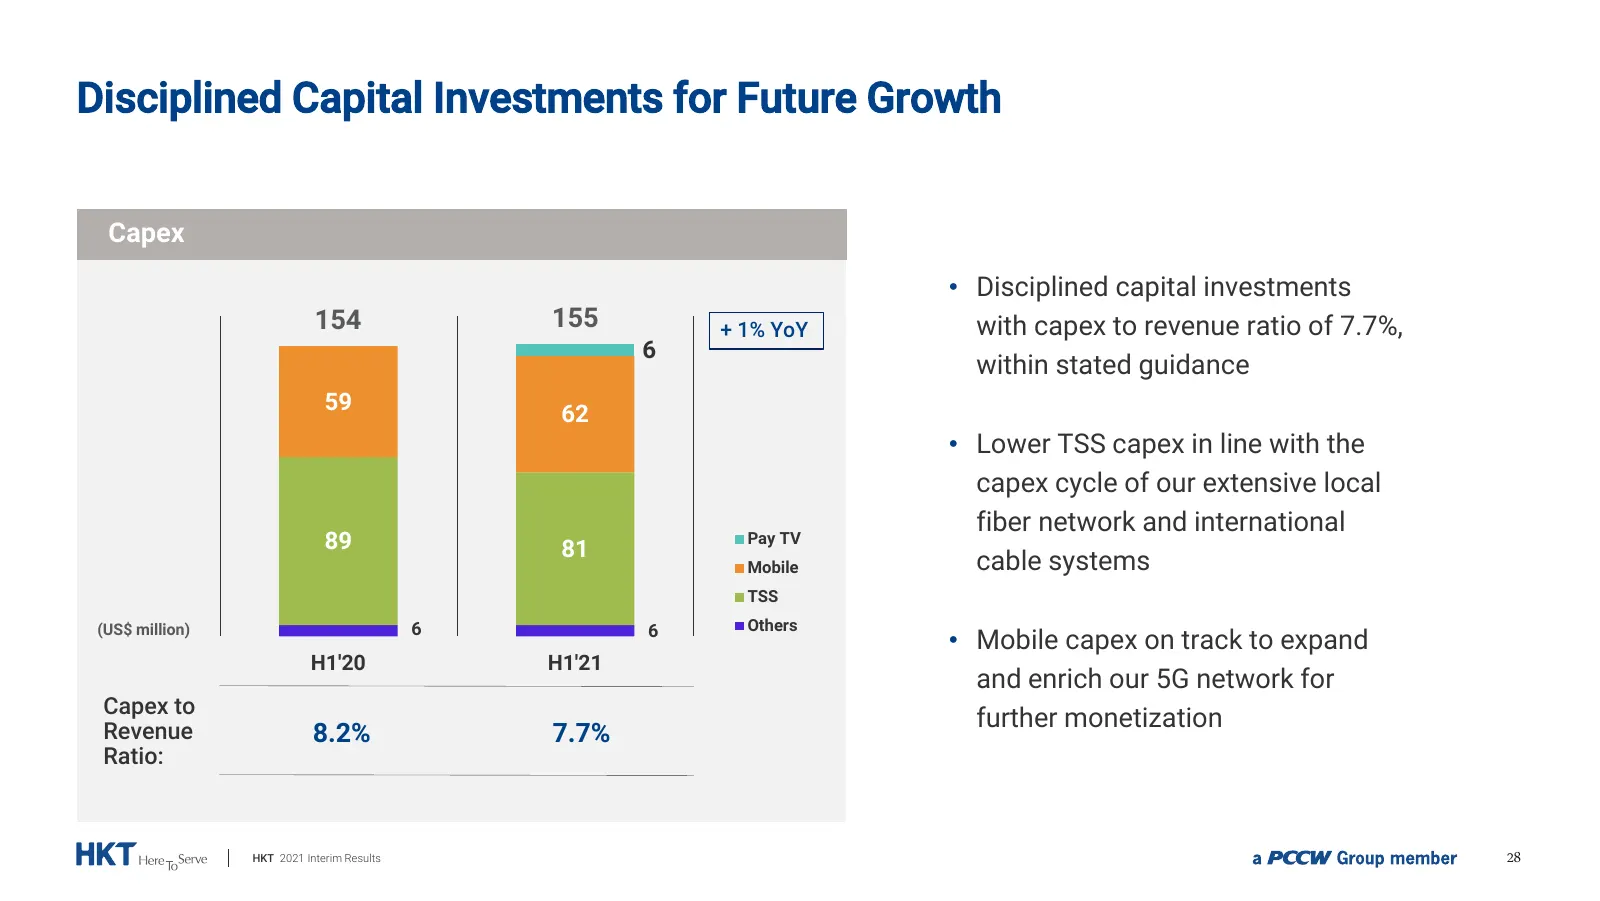
Slide 28: Disciplined Capital Investments for Future Growth
Disciplined Capital Investments for Future Growth Capex • Disciplined capital investments 154 155 + 1% YoY with capex to revenue ratio of 7.7%, 6 within stated guidance 59 62 • Lower TSS capex in line with the capex cycle of our extensive local fiber network and international 89 81 Pay TV Mobile cab
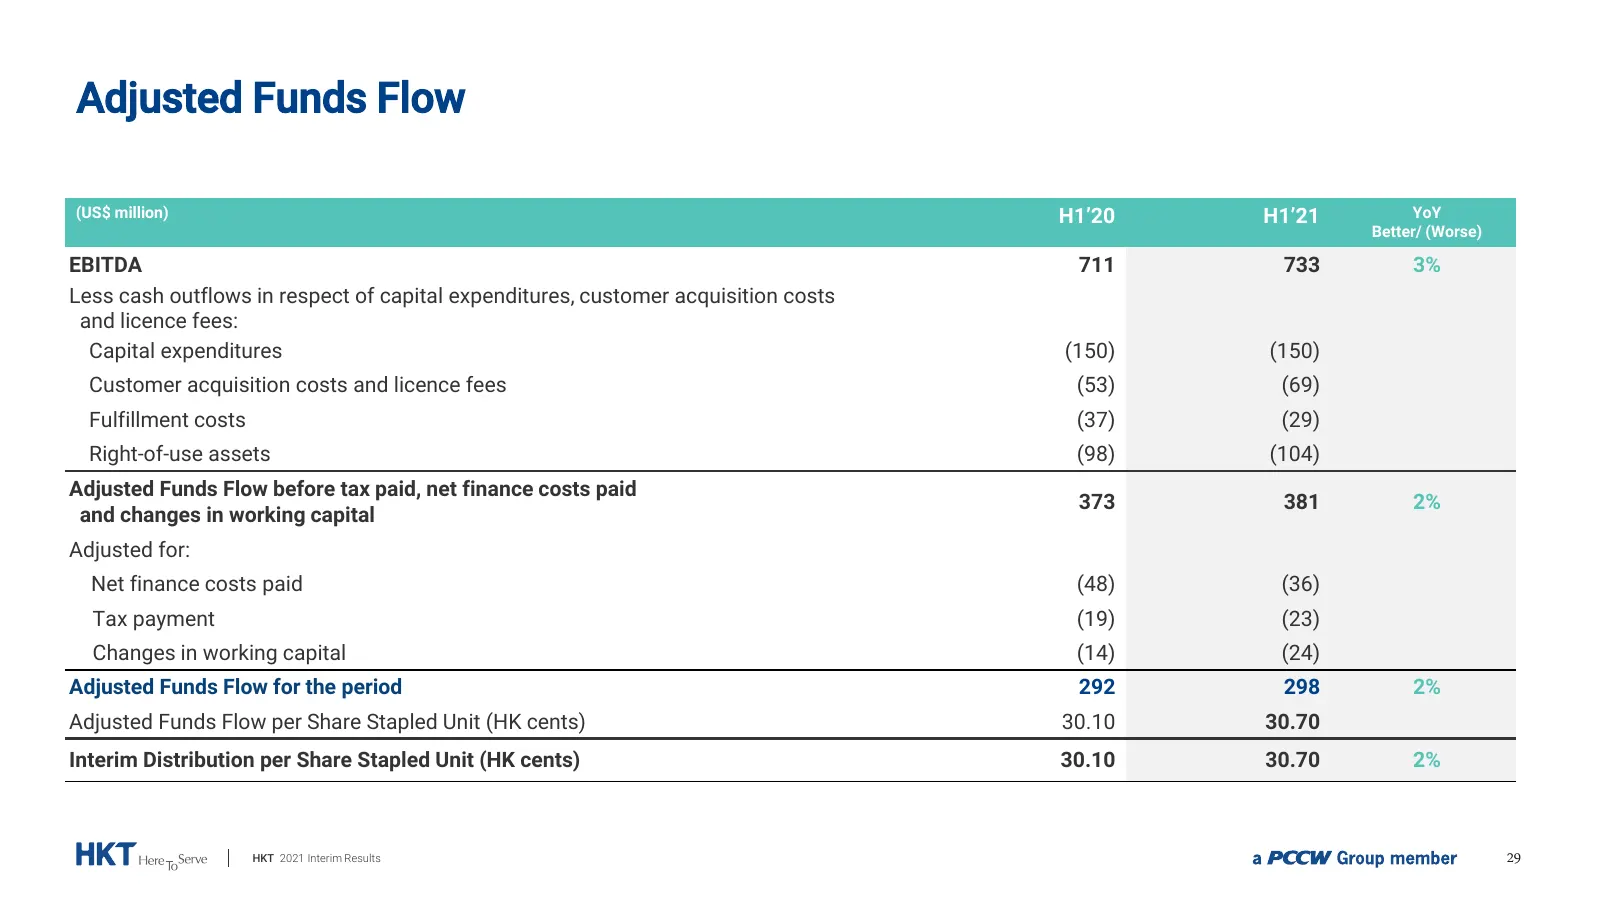
Slide 29: Adjusted Funds Flow
Adjusted Funds Flow (US$ million) H1’20 H1’21 YoY Better/ (Worse) EBITDA 711 733 3% Less cash outflows in respect of capital expenditures, customer acquisition costs and licence fees: Capital expenditures (150) (150) Customer acquisition costs and licence fees (53) (69) Fulfillment costs (37) (29) R
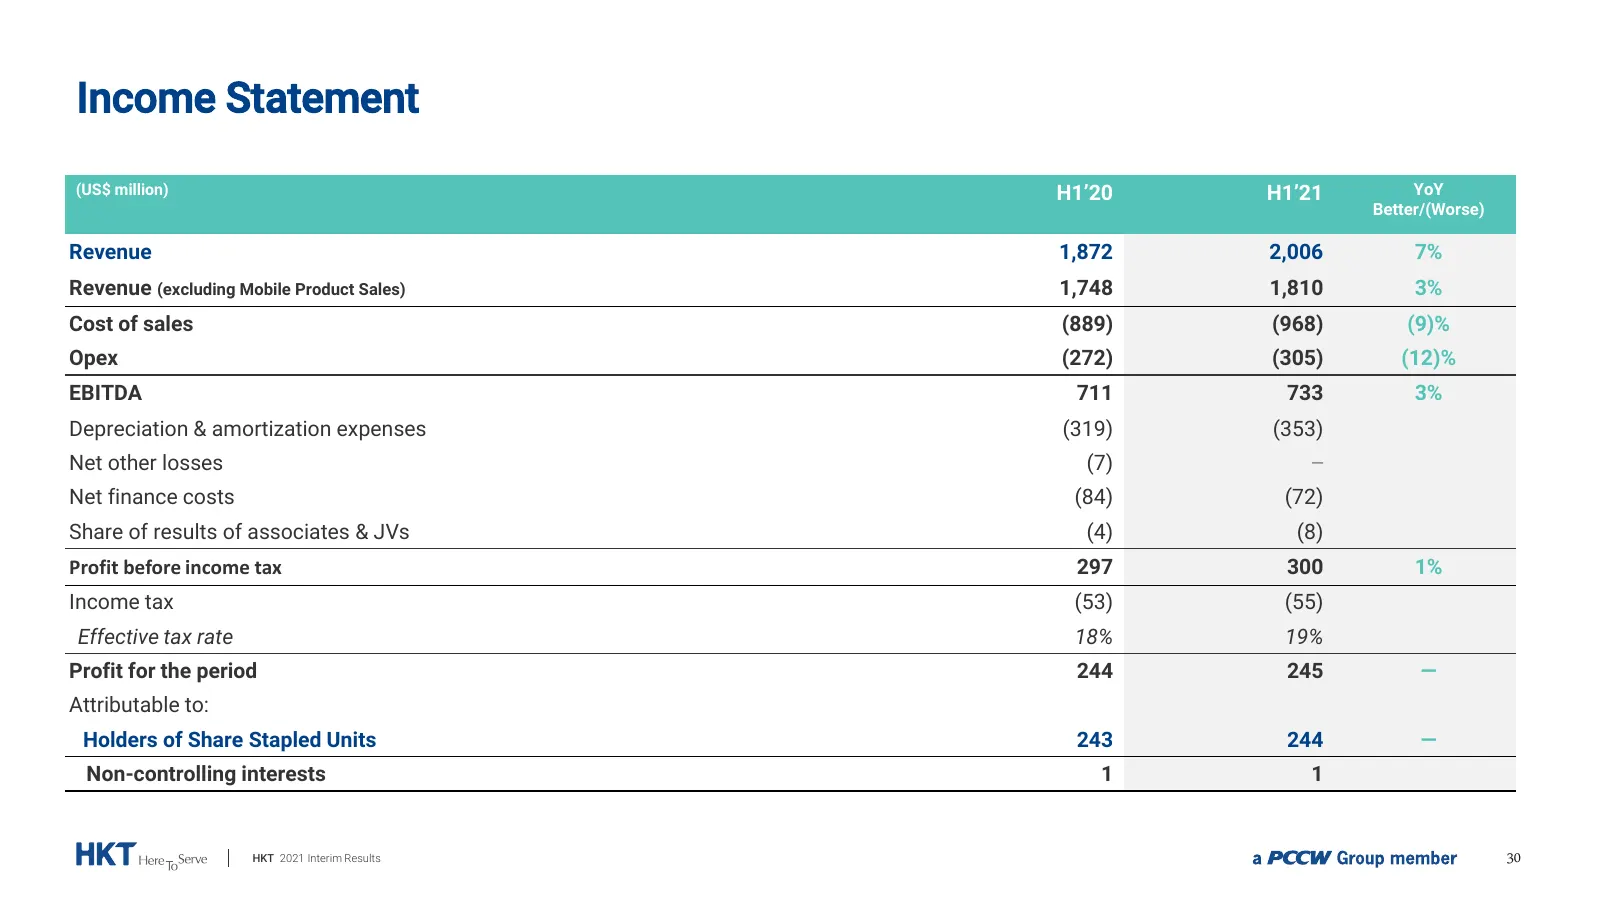
Slide 30: Income Statement
Income Statement (US$ million) H1’20 H1’21 YoY Better/(Worse) Revenue 1,872 2,006 7% Revenue (excluding Mobile Product Sales) 1,748 1,810 3% Cost of sales (889) (968) (9)% Opex (272) (305) (12)% EBITDA 711 733 3% Depreciation & amortization expenses (319) (353) Net other losses (7) − Net finance cos
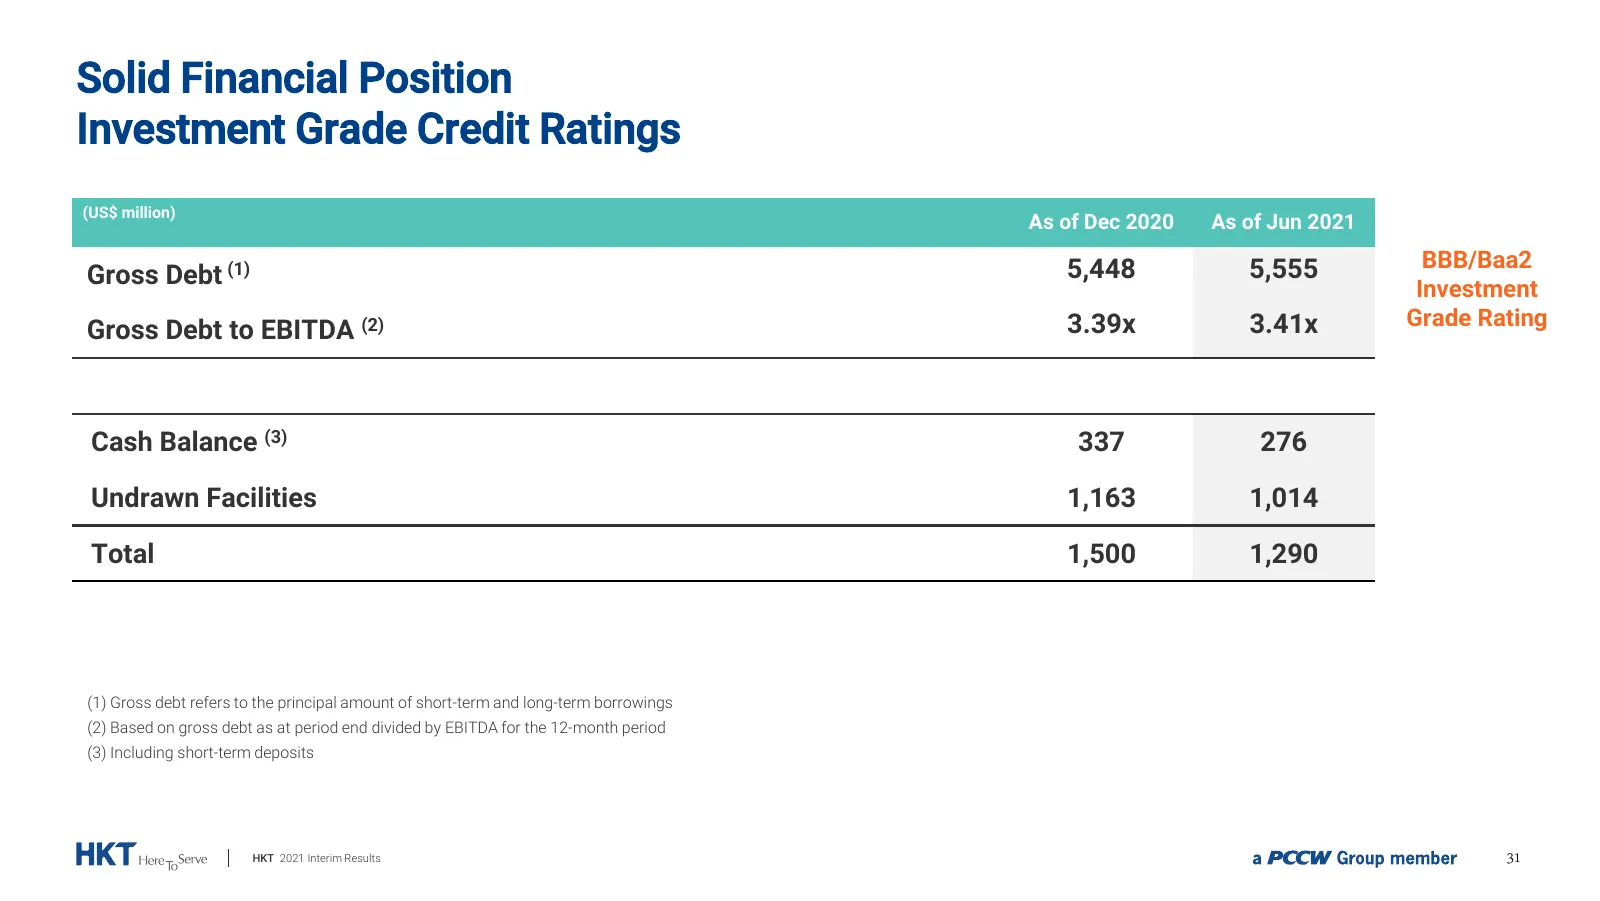
Slide 31: Solid Financial Position Investment Grade Credit Ratings
Solid Financial Position Investment Grade Credit Ratings (US$ million) As of Dec 2020 As of Jun 2021 5,448 5,555 BBB/Baa2 Gross Debt (1) Investment 3.39x 3.41x Grade Rating Gross Debt to EBITDA (2) Cash Balance (3) 337 276 Undrawn Facilities 1,163 1,014 Total 1,500 1,290 (1) Gross debt refers to the
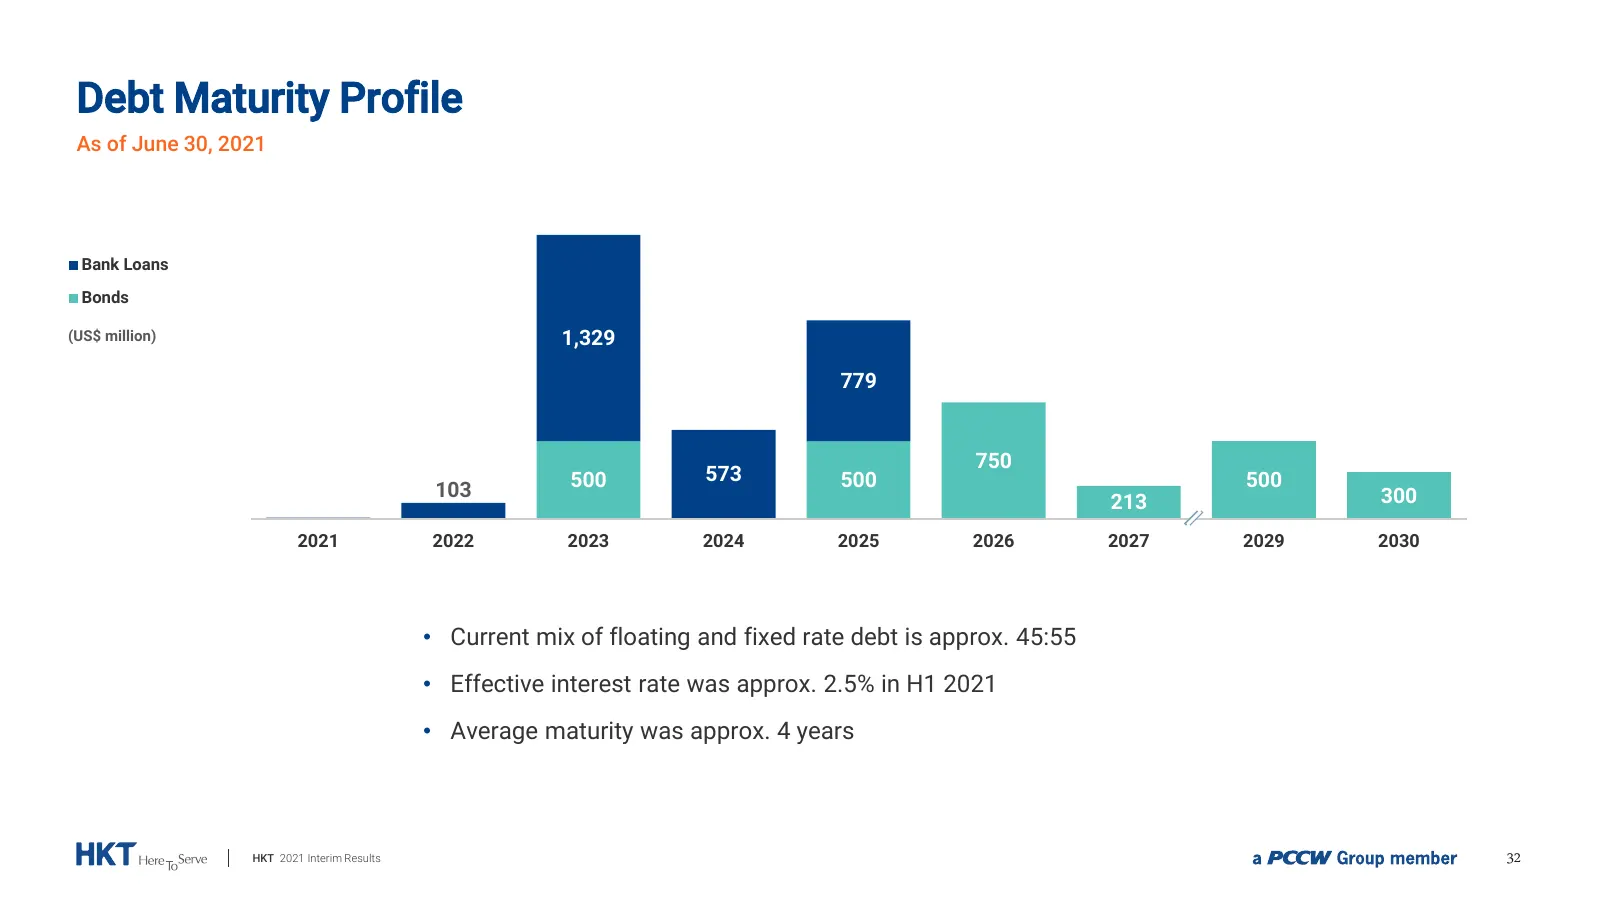
Slide 32: Debt Maturity Profile
Debt Maturity Profile As of June 30, 2021 Bank Loans Bonds (US$ million) 1,329 779 750 500 573 500 500 103 300 213 2021 2022 2023 2024 2025 2026 2027 2029 2030 • Current mix of floating and fixed rate debt is approx. 45:55 • Effective interest rate was approx. 2.5% in H1 2021 • Average maturity was
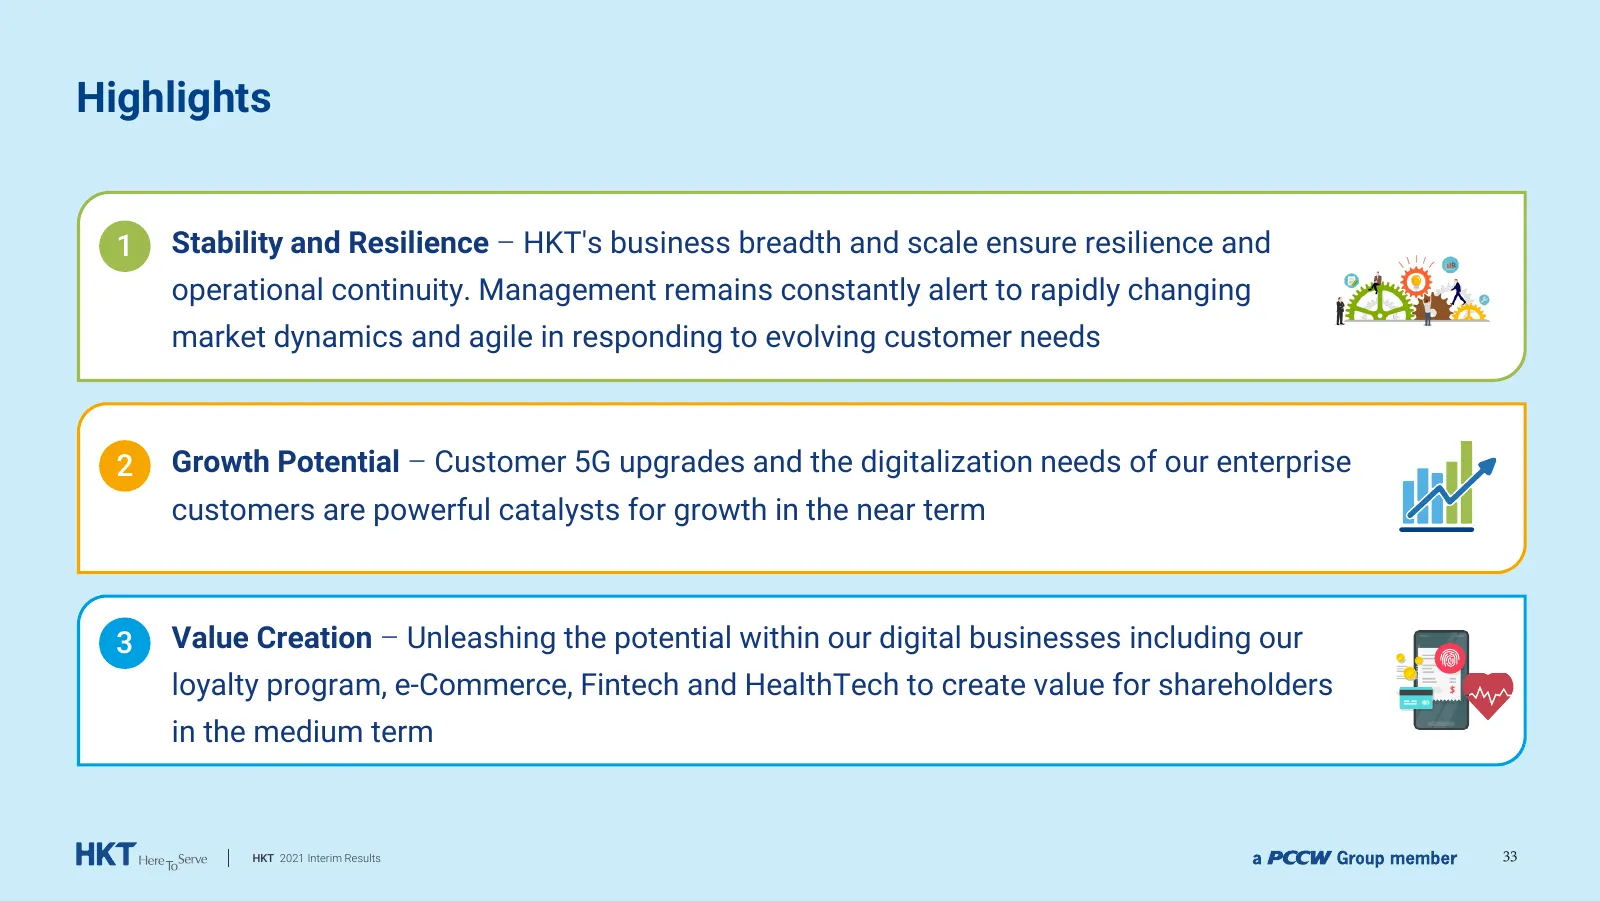
Slide 33: Highlights
Highlights 1 Stability and Resilience – HKT's business breadth and scale ensure resilience and operational continuity. Management remains constantly alert to rapidly changing market dynamics and agile in responding to evolving customer needs 2 Growth Potential – Customer 5G upgrades and the digitali
Source: Internet Archive copy of hkt.com
More decks from HKT Trust and HKT Ltd
 HKT — H1 2025 Earnings Presentation35 slides · Jul 31, 2025
 FY2024 Earnings Presentation35 slides · Feb 20, 2025
 H1 2024 Earnings Presentation34 slides · Jul 25, 2024
 FY2023 Earnings Presentation36 slides · Feb 22, 2024
 H1 2023 Earnings Presentation32 slides · Aug 2, 2023
 HKT — FY2022 Earnings Presentation32 slides · Feb 23, 2023