Mersen SA · EURONEXT:MRN
Mersen SA — Investor Presentation (October 2021)
29 slides from Mersen SA's investor presentation, October 2021
Slide 1: October 2021
October 2021
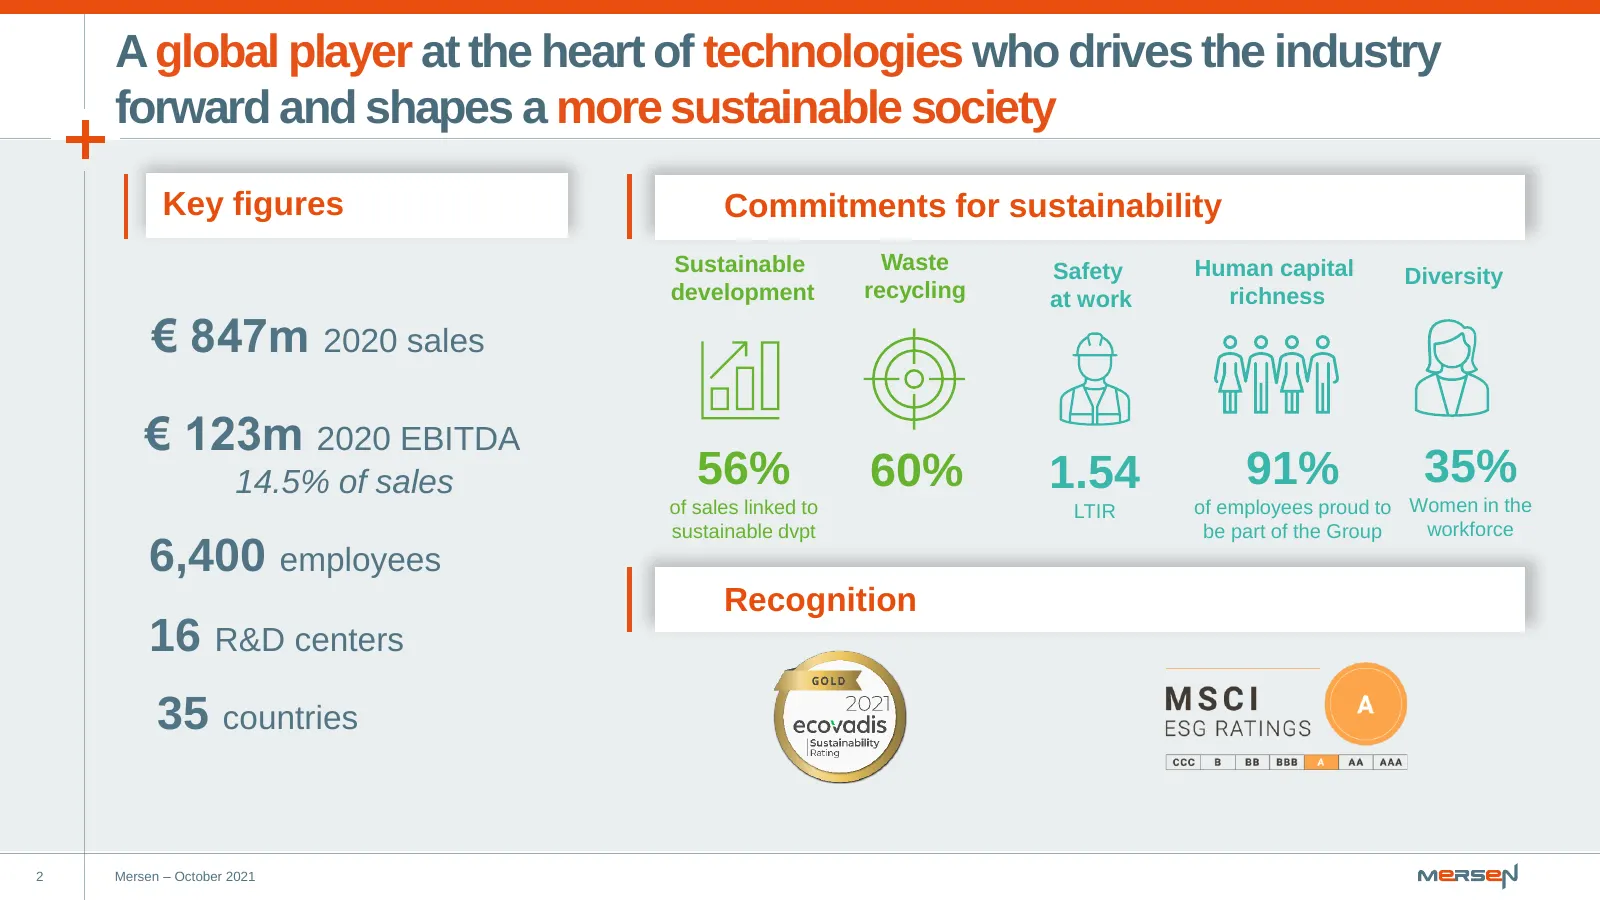
Slide 2: A global player at the heart of technologies
A global player at the heart of technologies who drives the industry forward and shapes a more sustainable society Key figures Commitments for sustainability Sustainable Waste Safety Human capital Diversity development recycling at work richness € 847m 2020 sales € 123m 2020 EBITDA 14.5% of sales 56
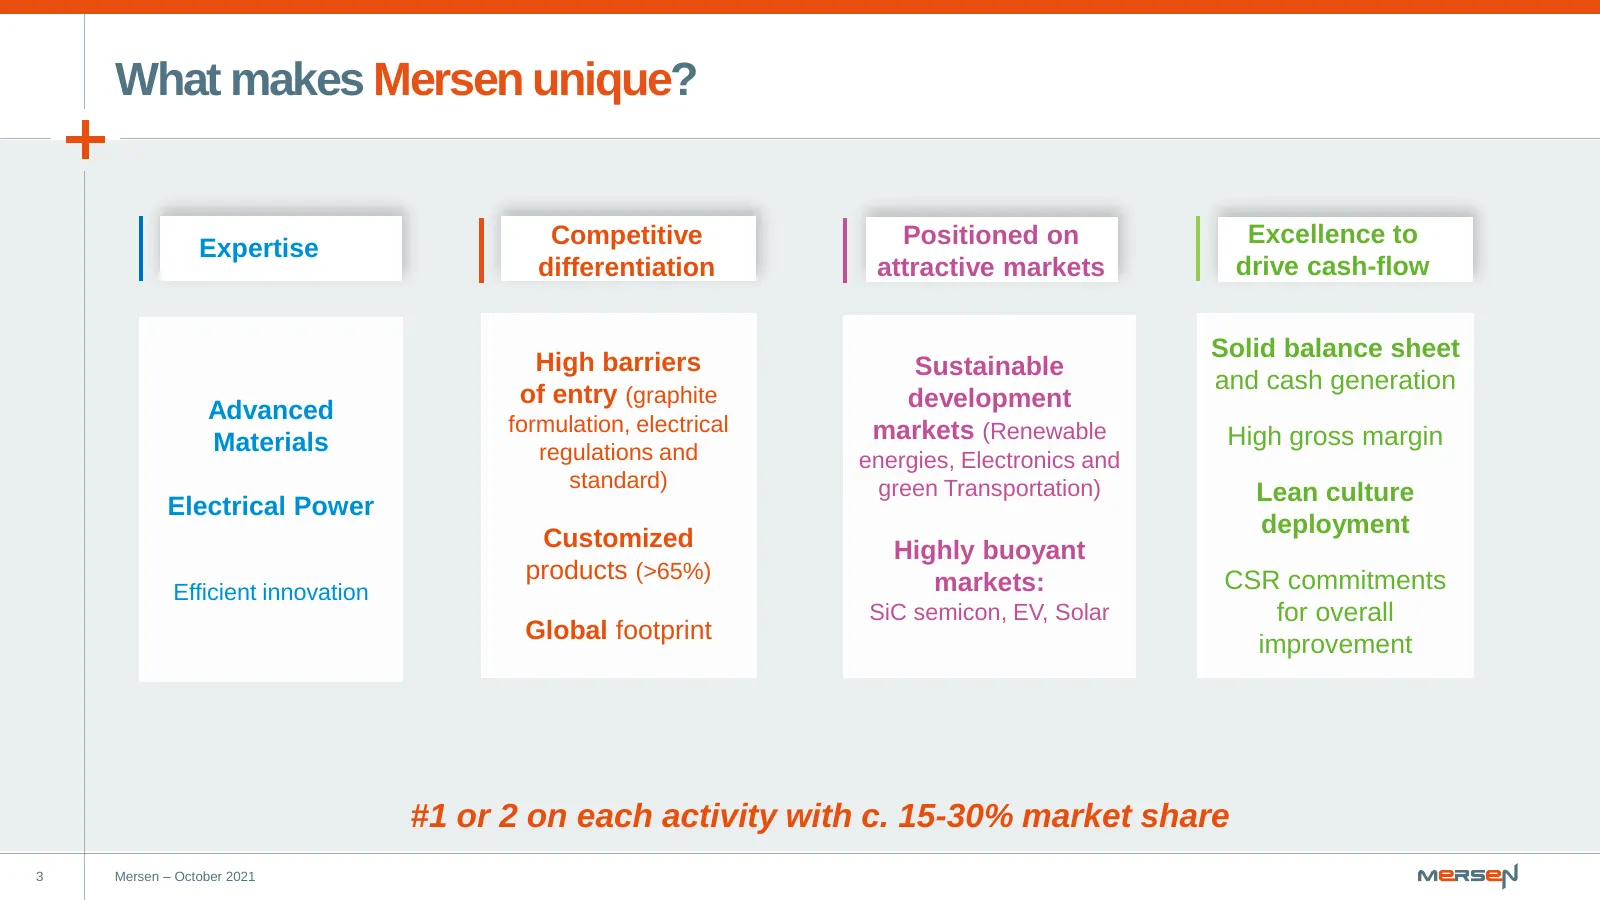
Slide 3: What makes Mersen unique?
What makes Mersen unique? Competitive Positioned on Excellence to Expertise differentiation attractive markets drive cash-flow Solid balance sheet High barriers Sustainable and cash generation of entry (graphite development Advanced formulation, electrical Materials markets (Renewable High gross mar
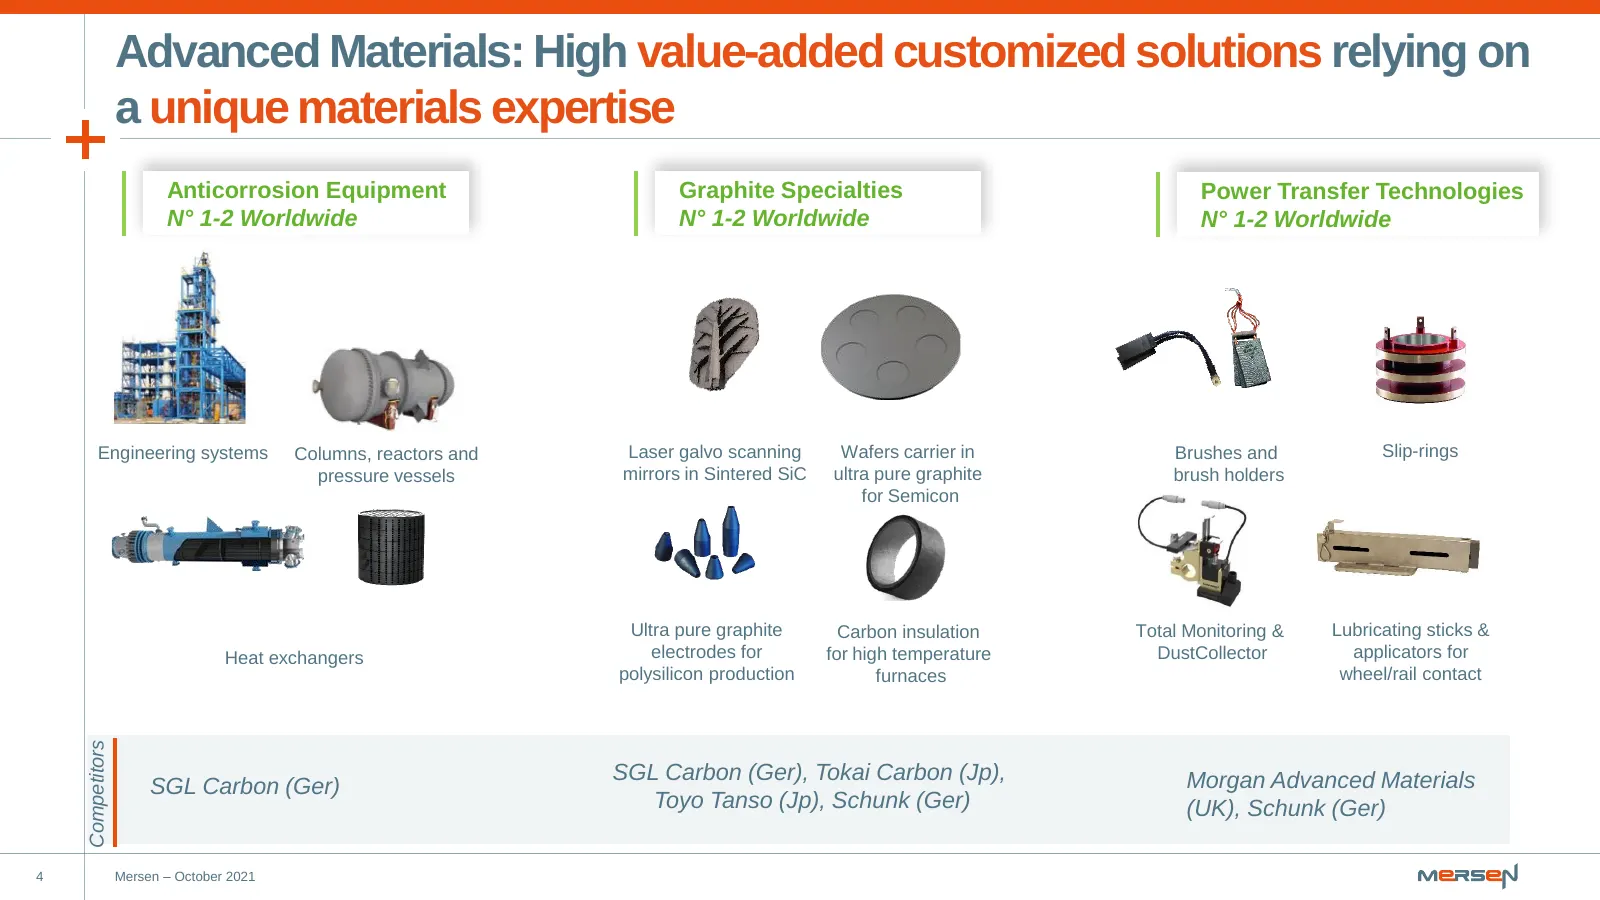
Slide 4: Advanced Materials: Competitors
Advanced Materials: High value-added customized solutions relying on a unique materials expertise Anticorrosion Equipment Graphite Specialties Power Transfer Technologies N° 1-2 Worldwide N° 1-2 Worldwide N° 1-2 Worldwide Engineering systems Columns, reactors and Laser galvo scanning Wafers carrier
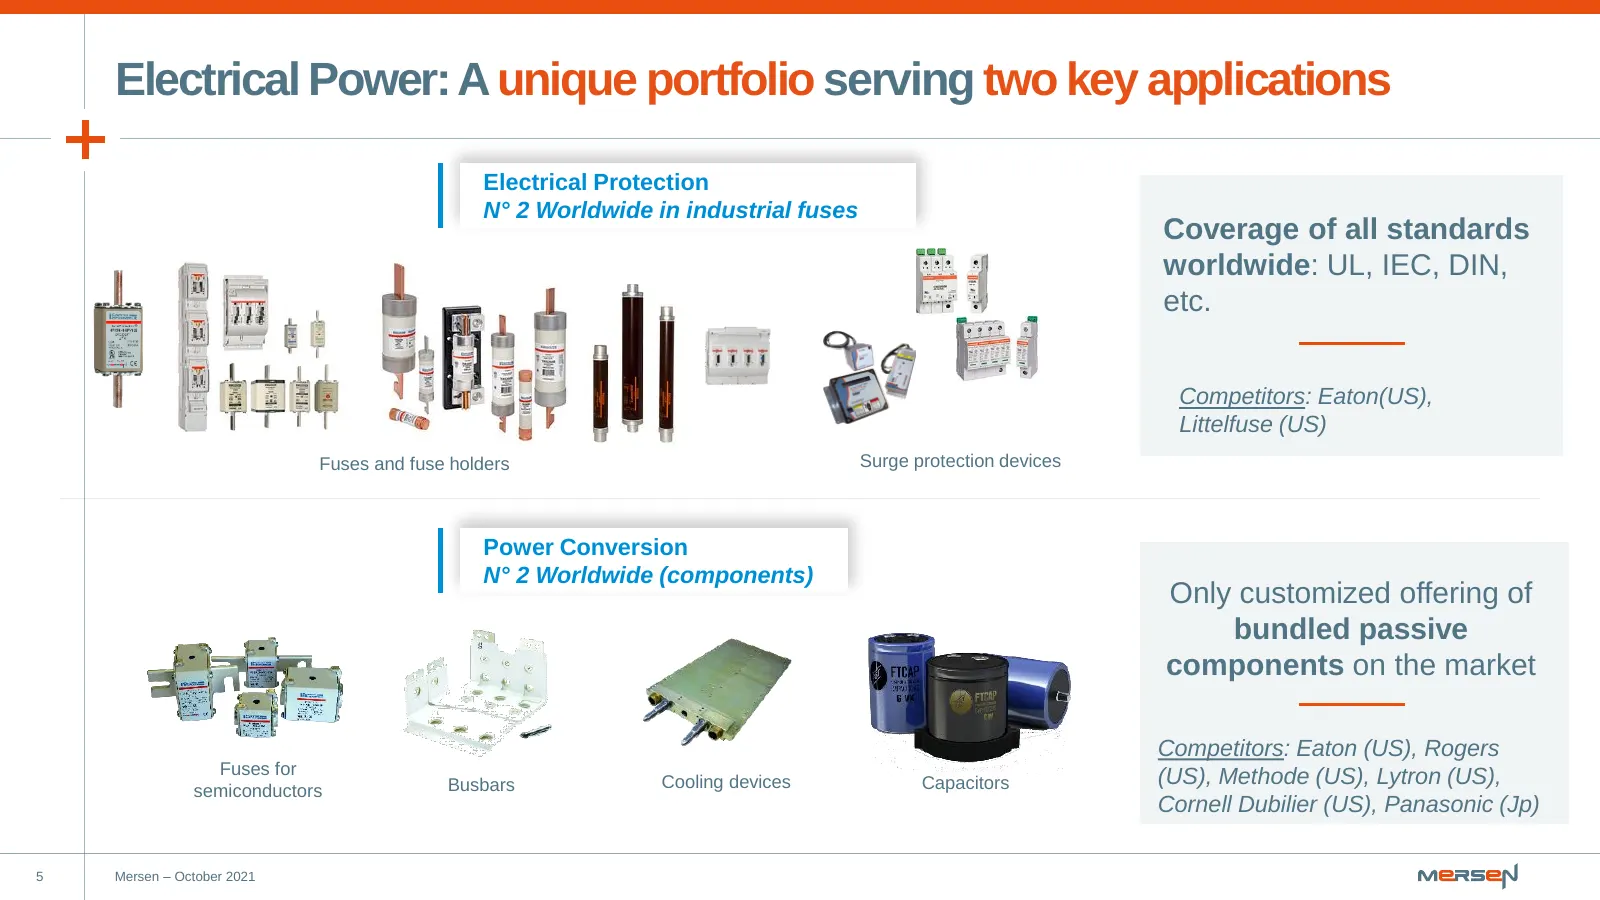
Slide 5: Electrical Power: A unique portfolio serving two key applications
Electrical Power: A unique portfolio serving two key applications Electrical Protection N° 2 Worldwide in industrial fuses Coverage of all standards worldwide: UL, IEC, DIN, etc. Competitors: Eaton(US), Littelfuse (US) Fuses and fuse holders Surge protection devices Power Conversion N° 2 Worldwide (
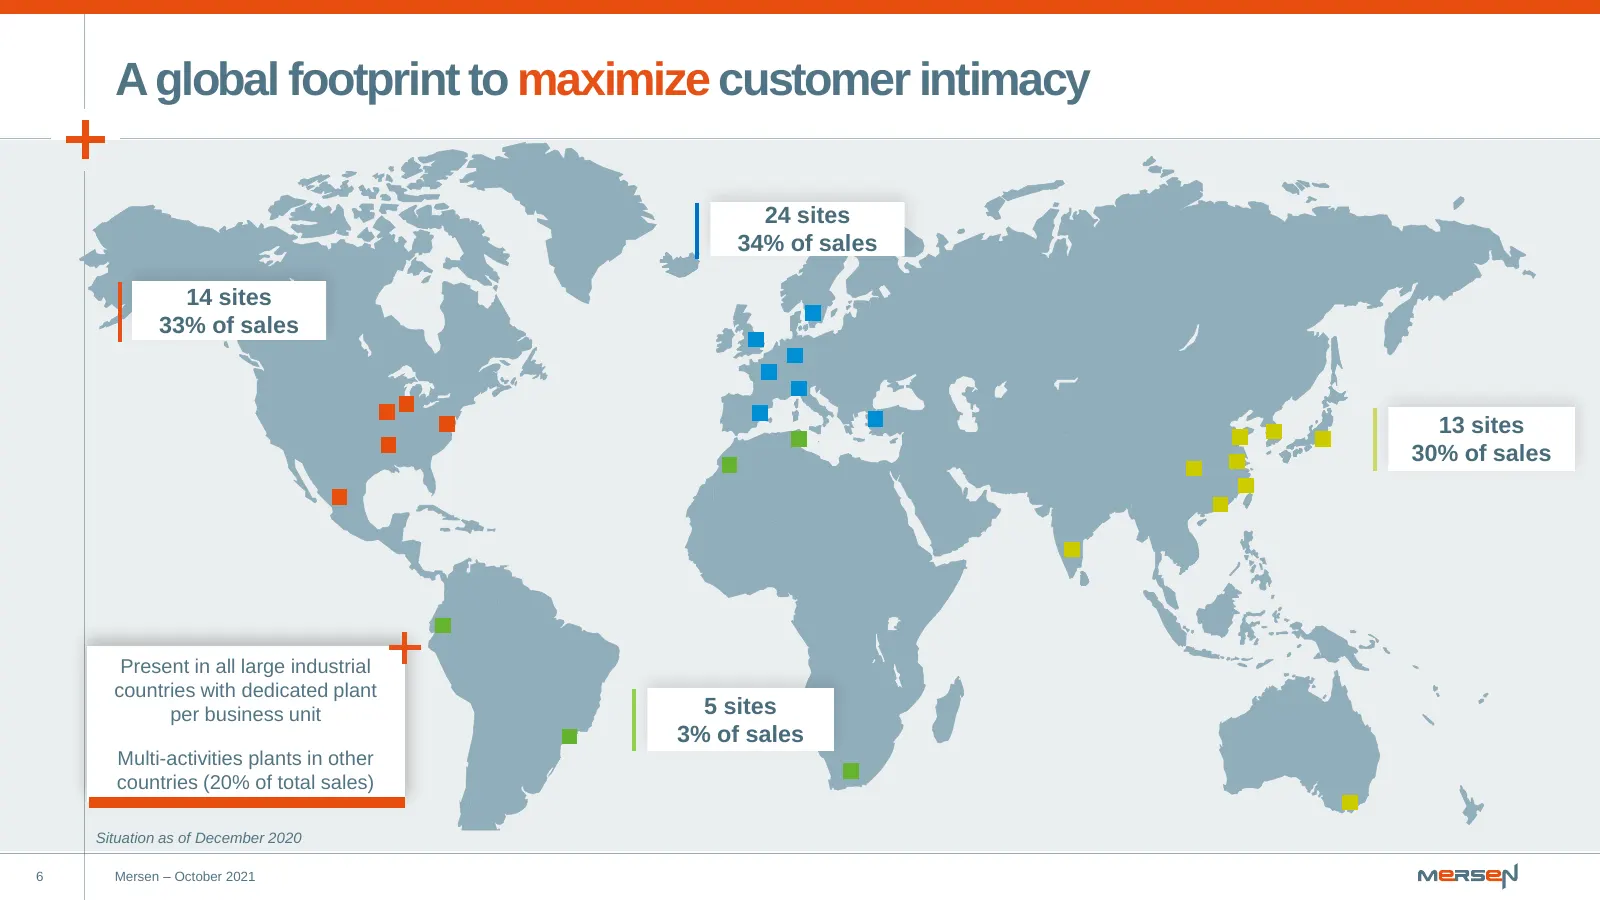
Slide 6: A global footprint to maximize customer intimacy
A global footprint to maximize customer intimacy 24 sites 34% of sales 14 sites 33% of sales 13 sites 30% of sales Present in all large industrial countries with dedicated plant per business unit 5 sites 3% of sales Multi-activities plants in other countries (20% of total sales) Situation as of Dece
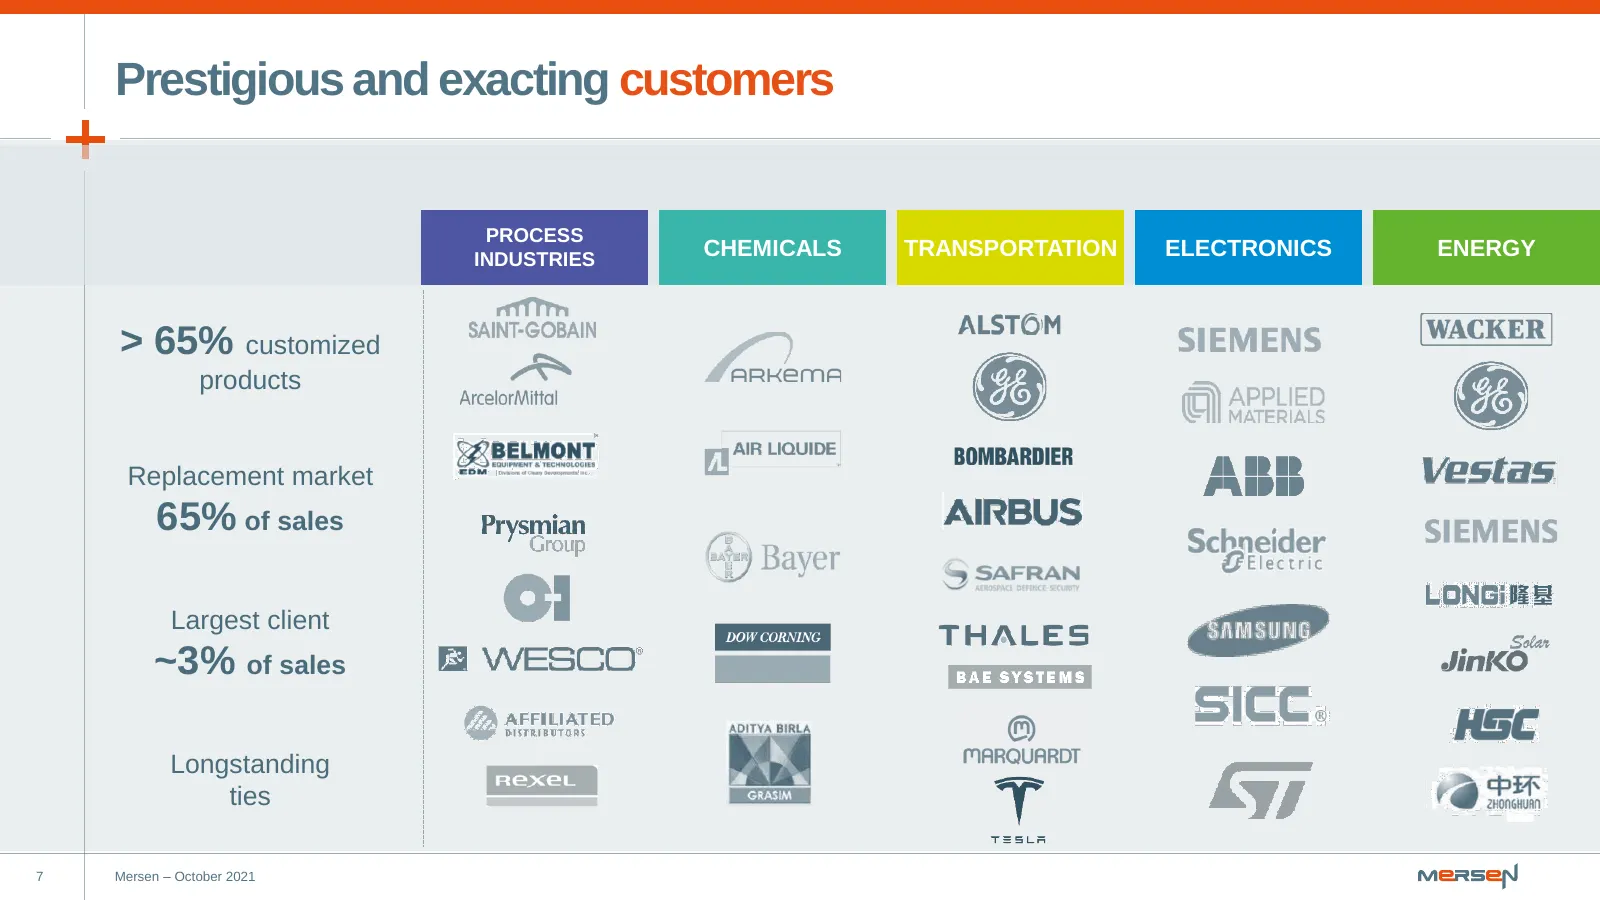
Slide 7: Prestigious and exacting customers
Prestigious and exacting customers PROCESS INDUSTRIES CHEMICALS TRANSPORTATION ELECTRONICS ENERGY > 65% customized products Replacement market 65% of sales Largest client ~3% of sales Longstanding ties 7 Mersen – October 2021
Slide 8: Our growth markets
01 Our growth markets
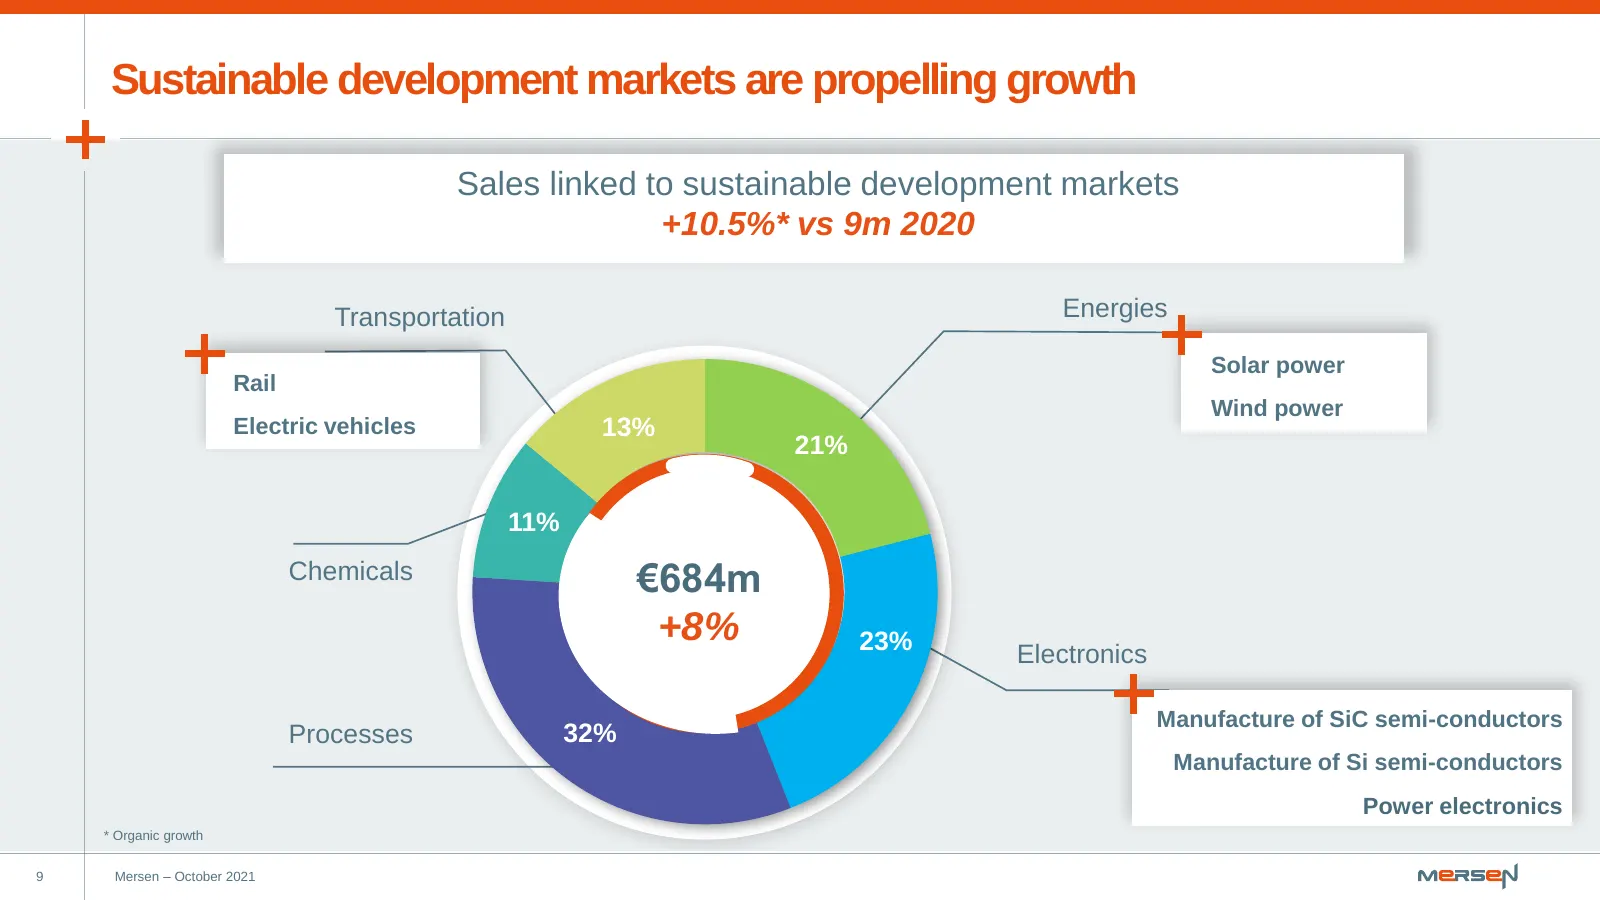
Slide 9: Sustainable development markets are propelling growth
Sustainable development markets are propelling growth Sales linked to sustainable development markets +10.5%* vs 9m 2020 Transportation Energies Solar power Rail Wind power Electric vehicles 13% 21% 11% Chemicals €684m +8% 23% Electronics Manufacture of SiC semi-conductors Processes 32% Manufacture
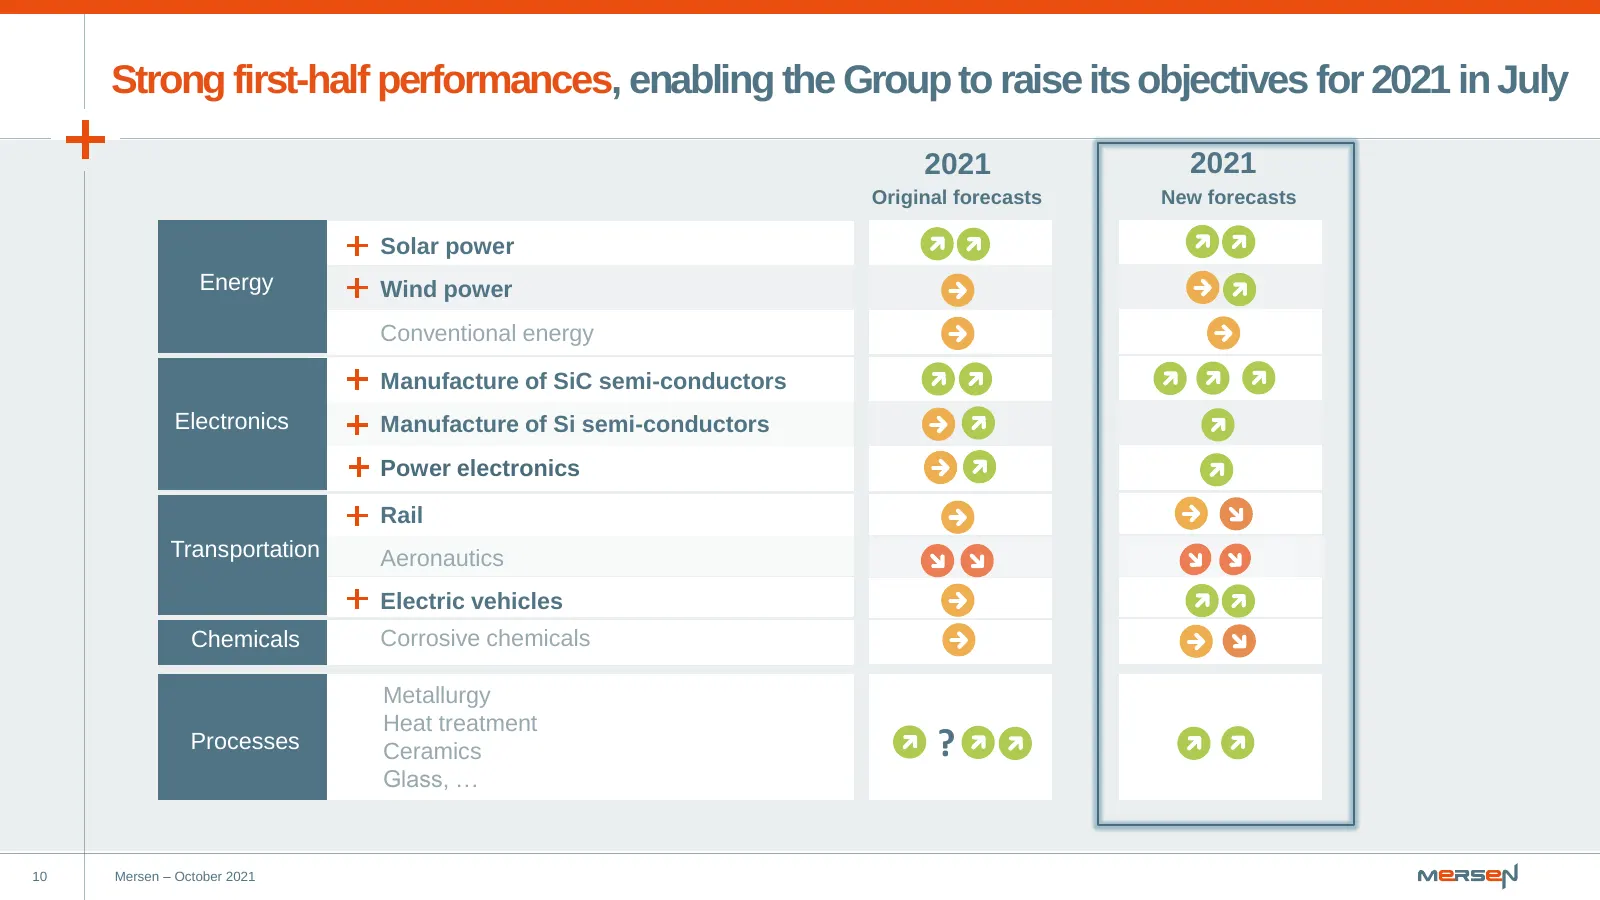
Slide 10: Strong first-half performances, raising 2021 objectives in July
Strong first-half performances, enabling the Group to raise its objectives for 2021 in July 2021 2021 Original forecasts New forecasts Solar power Energy Wind power Conventional energy Manufacture of SiC semi-conductors Electronics Manufacture of Si semi-conductors Power electronics Rail Transportat
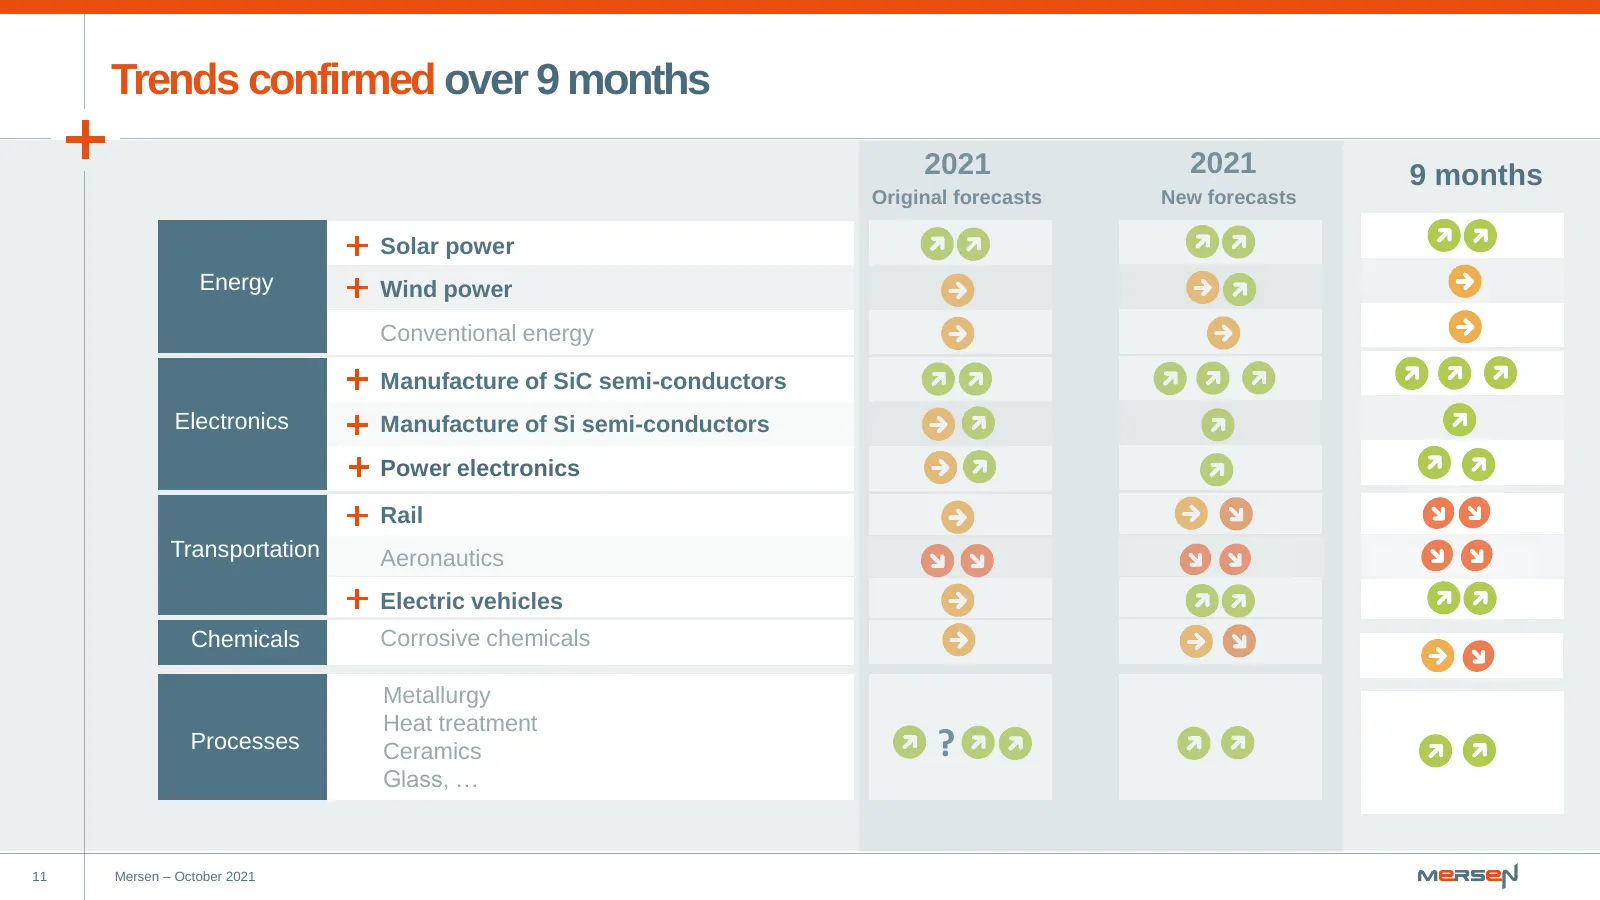
Slide 11: Trends confirmed over 9 months
Trends confirmed over 9 months 2021 2021 9 months Original forecasts New forecasts Solar power Energy Wind power Conventional energy Manufacture of SiC semi-conductors Electronics Manufacture of Si semi-conductors Power electronics Rail Transportation Aeronautics Electric vehicles Chemicals Corrosiv
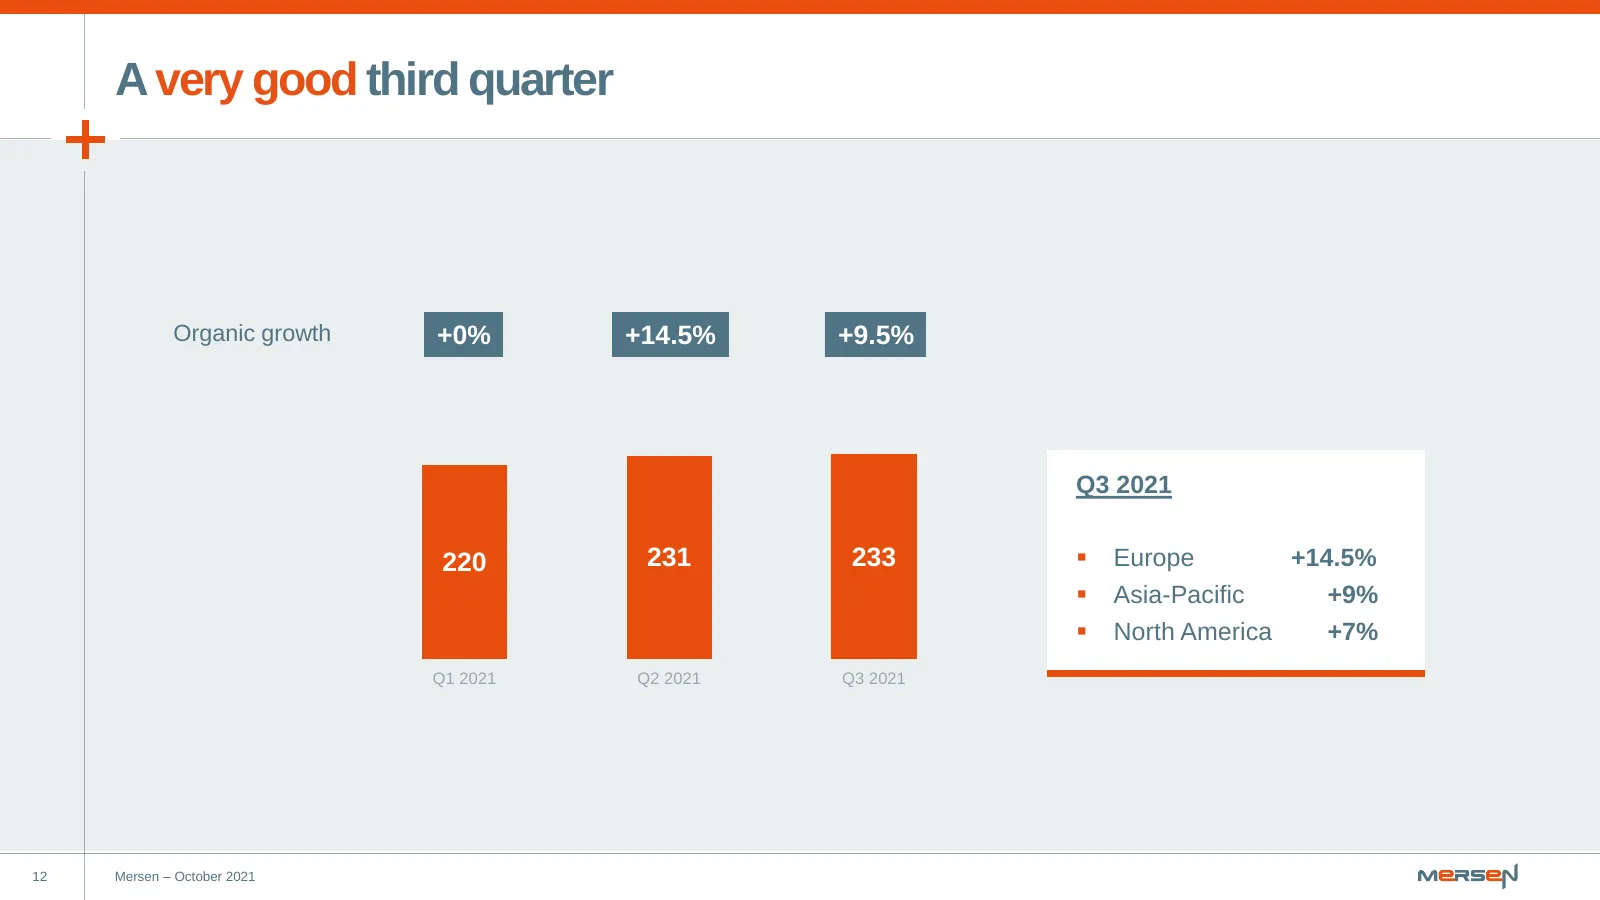
Slide 12: A very good third quarter
A very good third quarter Organic growth +0% +14.5% +9.5% Q3 2021 220 231 233 ▪ Europe +14.5% ▪ Asia-Pacific +9% ▪ North America +7% Q1 2021 Q2 2021 Q3 2021 12 Mersen – October 2021
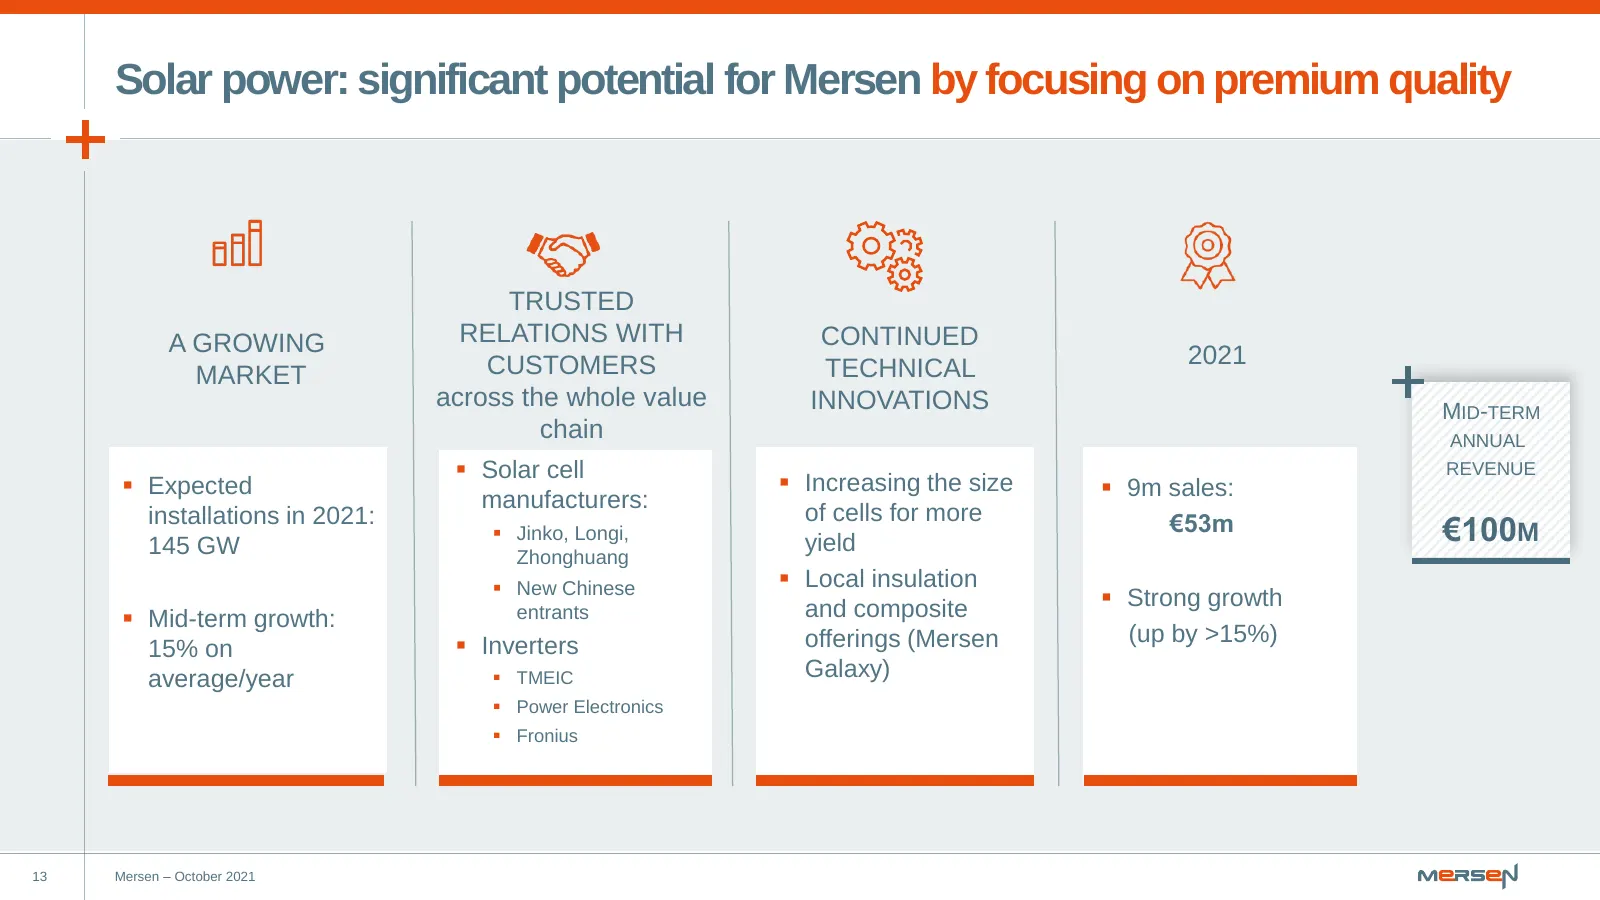
Slide 13: Solar power: significant potential for Mersen
Solar power: significant potential for Mersen by focusing on premium quality TRUSTED A GROWING RELATIONS WITH CONTINUED CUSTOMERS TECHNICAL 2021 MARKET across the whole value INNOVATIONS MID-TERM chain ANNUAL ▪ Solar cell ▪ Increasing the size REVENUE ▪ Expected ▪ 9m sales: manufacturers: of cells f
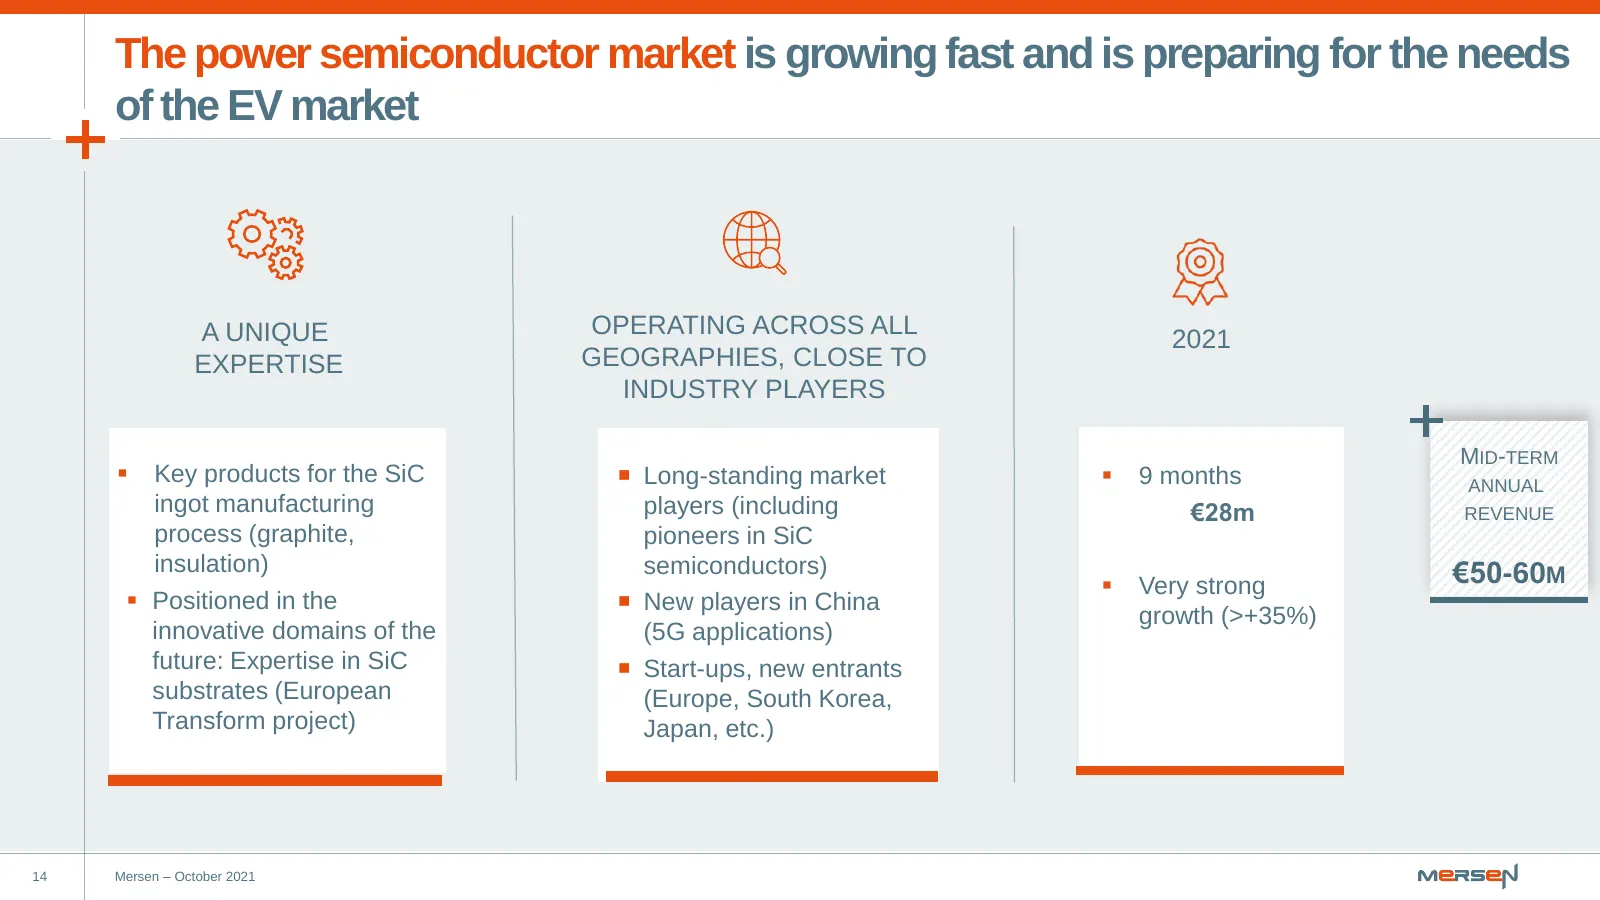
Slide 14: The power semiconductor market is growing fast
The power semiconductor market is growing fast and is preparing for the needs of the EV market A UNIQUE OPERATING ACROSS ALL 2021 EXPERTISE GEOGRAPHIES, CLOSE TO INDUSTRY PLAYERS MID-TERM ▪ Key products for the SiC Long-standing market ▪ 9 months ANNUAL ingot manufacturing players (including €28m
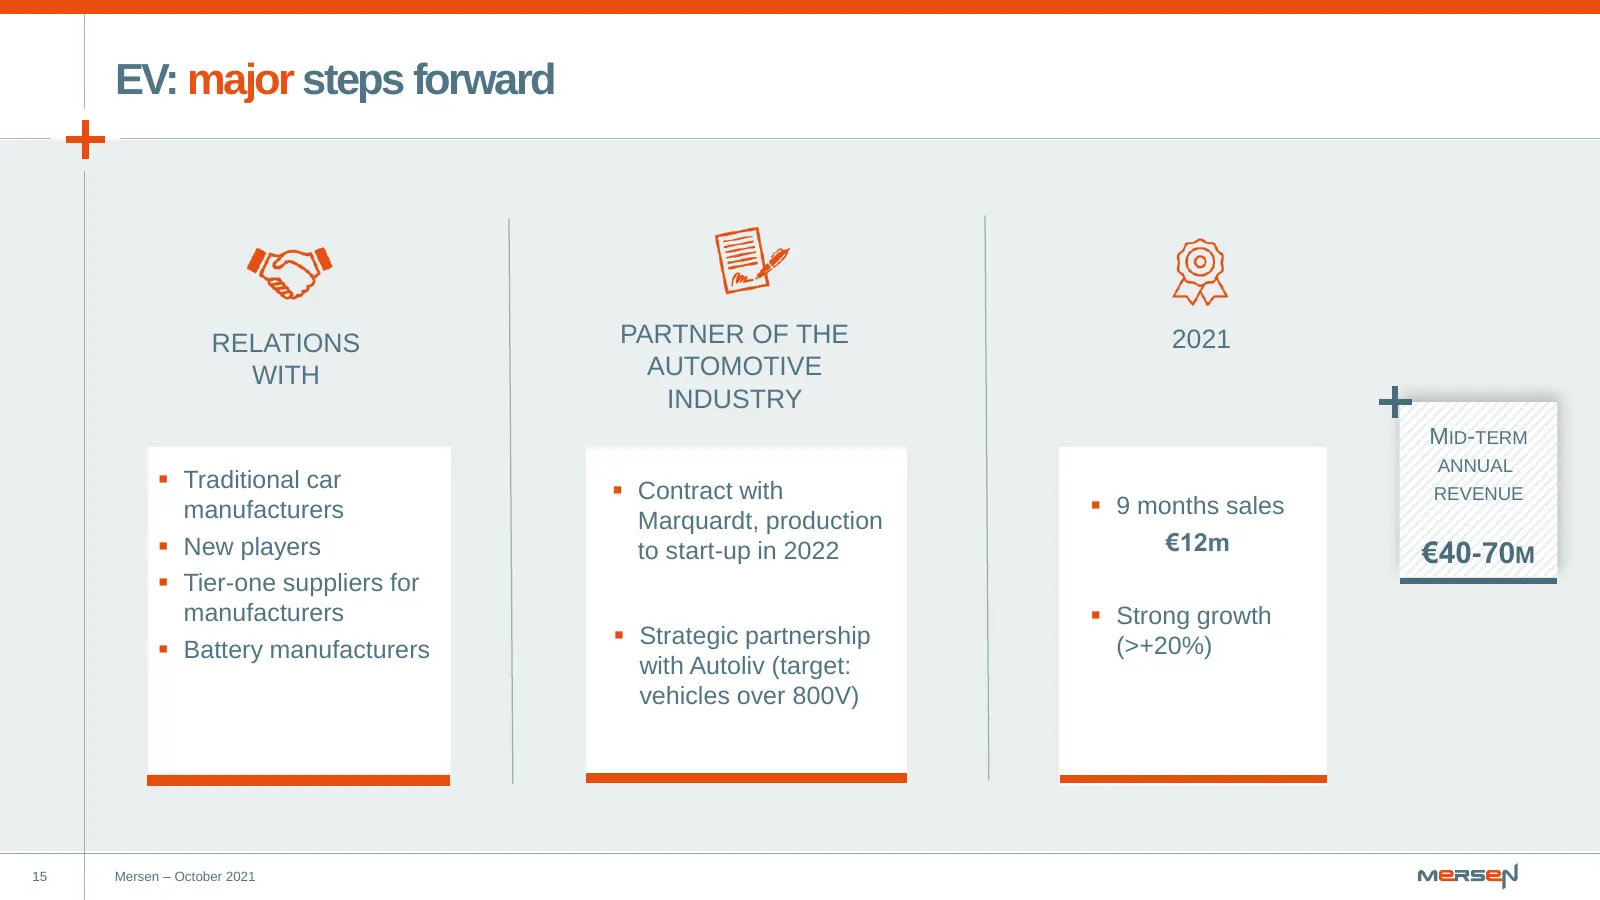
Slide 15: EV: major steps forward
EV: major steps forward RELATIONS PARTNER OF THE 2021 WITH AUTOMOTIVE INDUSTRY MID-TERM ANNUAL ▪ Traditional car ▪ Contract with REVENUE manufacturers ▪ 9 months sales Marquardt, production ▪ New players €12m to start-up in 2022 €40-70M ▪ Tier-one suppliers for manufacturers ▪ Strong growth ▪ Strate
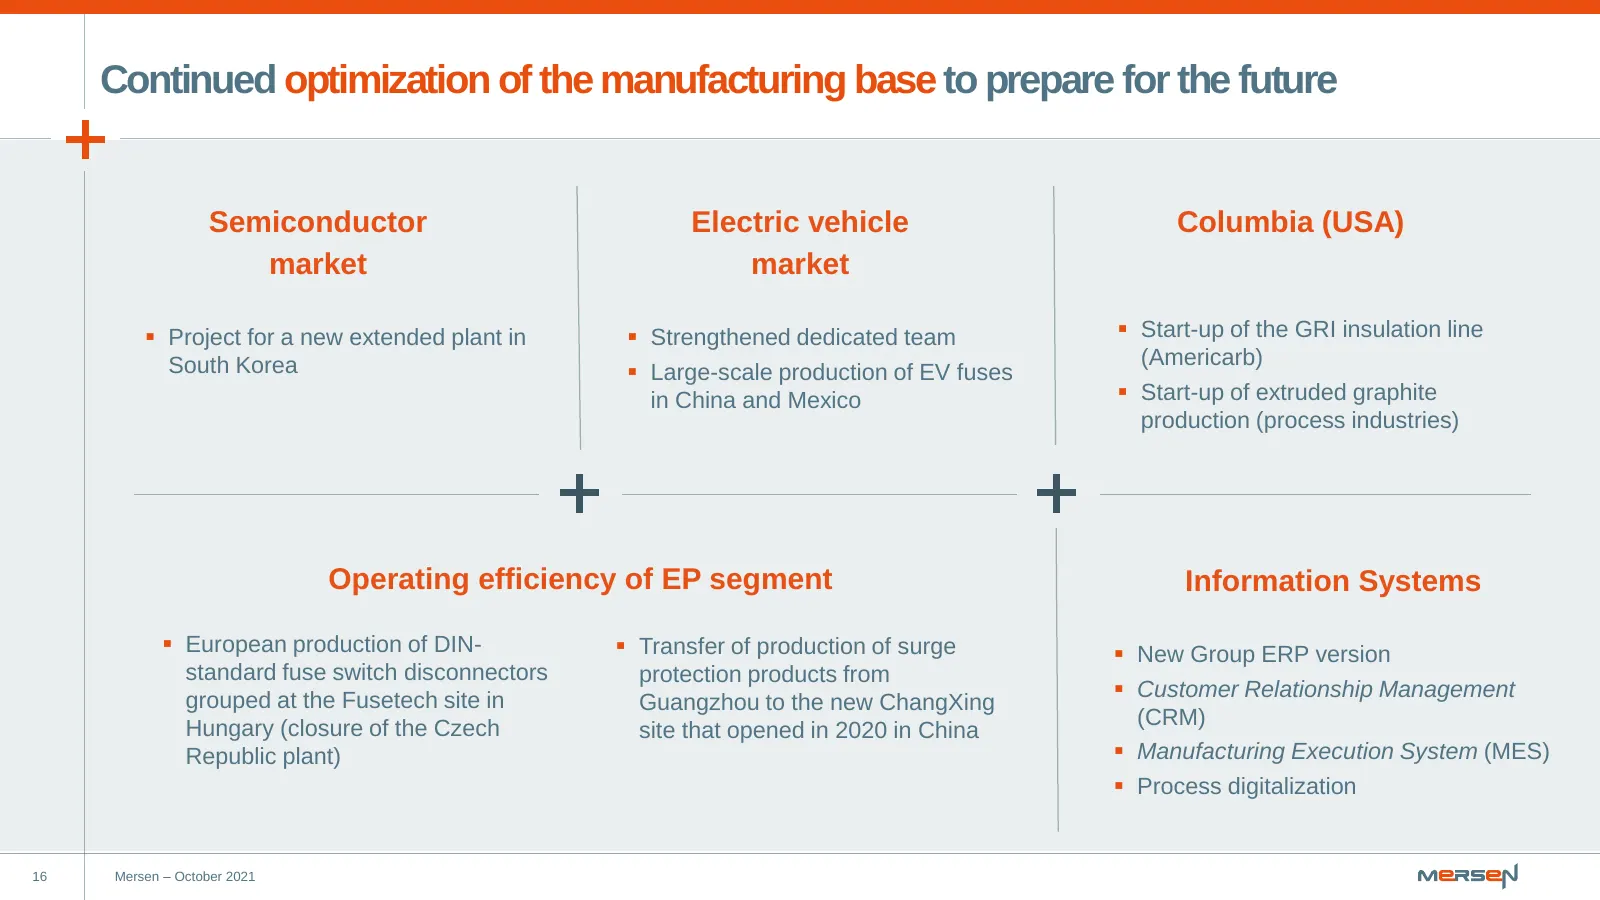
Slide 16: Continued optimization of the manufacturing base
Continued optimization of the manufacturing base to prepare for the future Semiconductor Electric vehicle Columbia (USA) market market ▪ Project for a new extended plant in ▪ Strengthened dedicated team ▪ Start-up of the GRI insulation line South Korea (Americarb) ▪ Large-scale production of EV fuse
Slide 17: 2021 guidance revised upwards
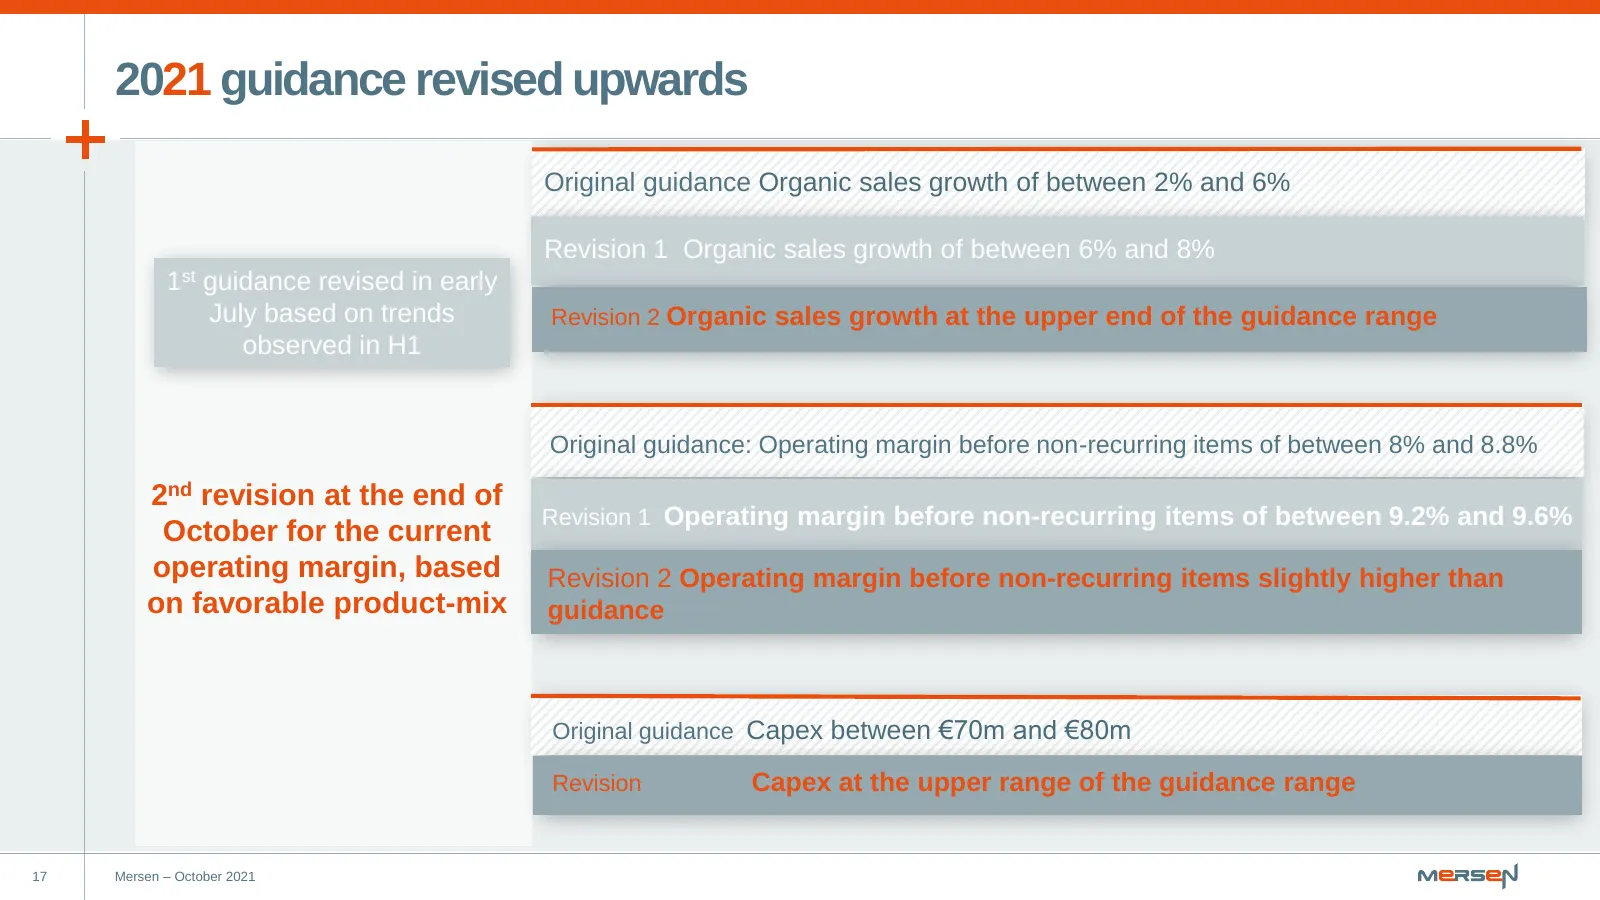
2021 guidance revised upwards Original guidance Organic sales growth of between 2% and 6% Revision 1 Organic sales growth of between 6% and 8% 1st guidance revised in early July based on trends Revision 2 Organic sales growth at the upper end of the guidance range observed in H1 Original guidance: O
Slide 18: Save the date
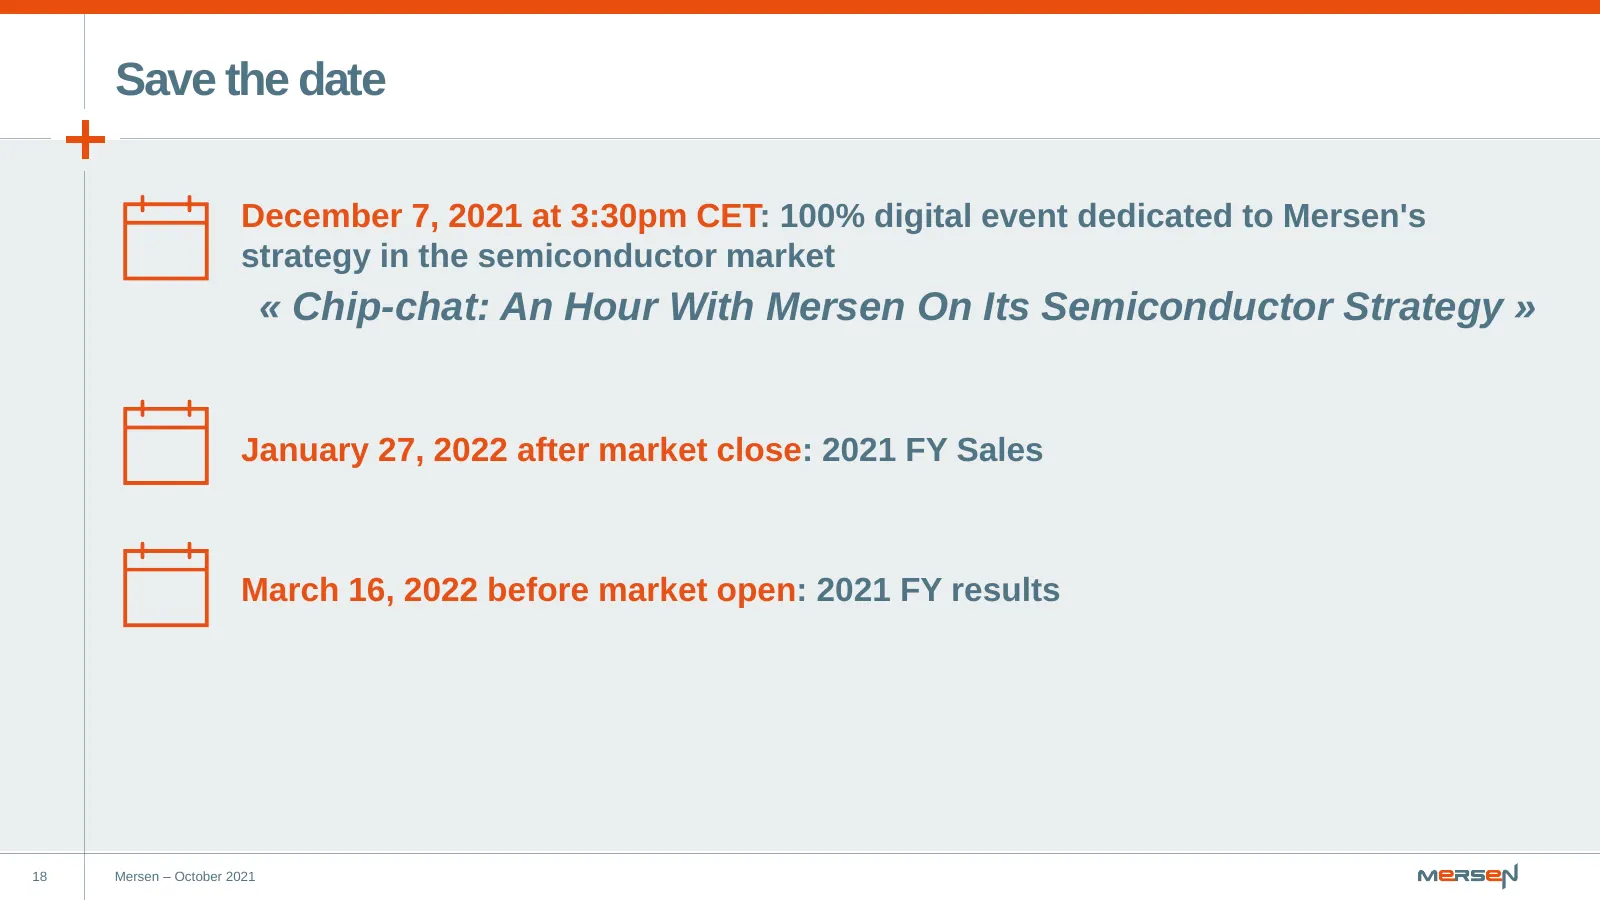
Save the date December 7, 2021 at 3:30pm CET: 100% digital event dedicated to Mersen's strategy in the semiconductor market « Chip-chat: An Hour With Mersen On Its Semiconductor Strategy » January 27, 2022 after market close: 2021 FY Sales March 16, 2022 before market open: 2021 FY results 18 Mersen
Slide 19: First-half 2021 results
02 First-half 2021 results
Slide 20: Significant increase in profitability
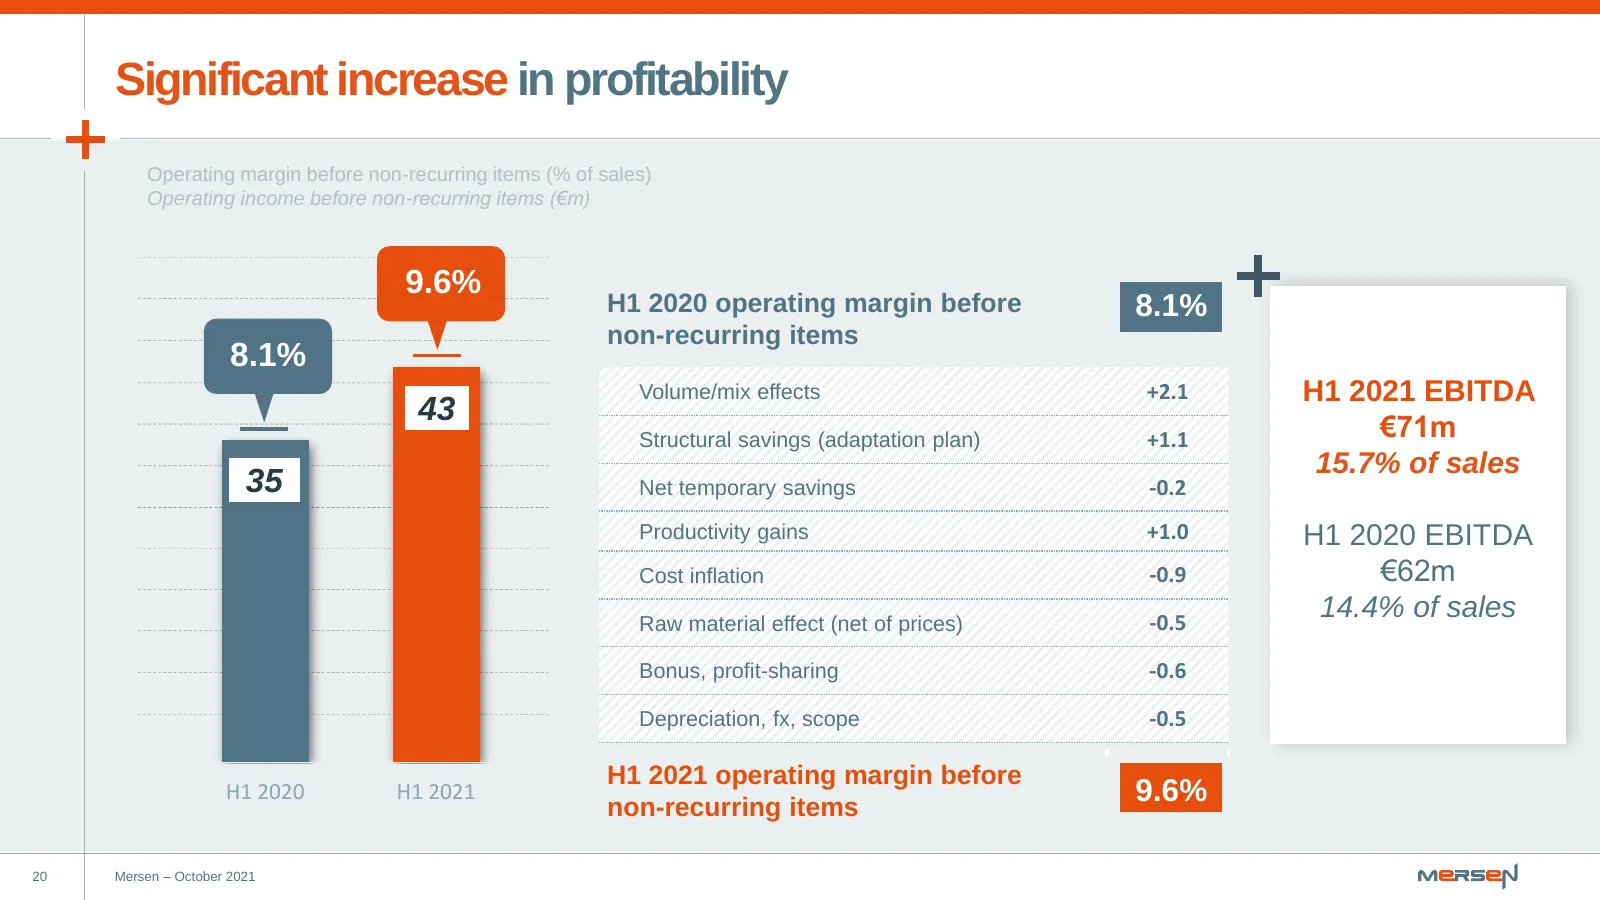
Significant increase in profitability Operating margin before non-recurring items (% of sales) Operating income before non-recurring items (€m) 9.6% H1 2020 operating margin before 8.1% non-recurring items 8.1% Volume/mix effects +2.1 H1 2021 EBITDA 43 Structural savings (adaptation plan) +1.1 €71m
Slide 21: Structural and temporary impacts
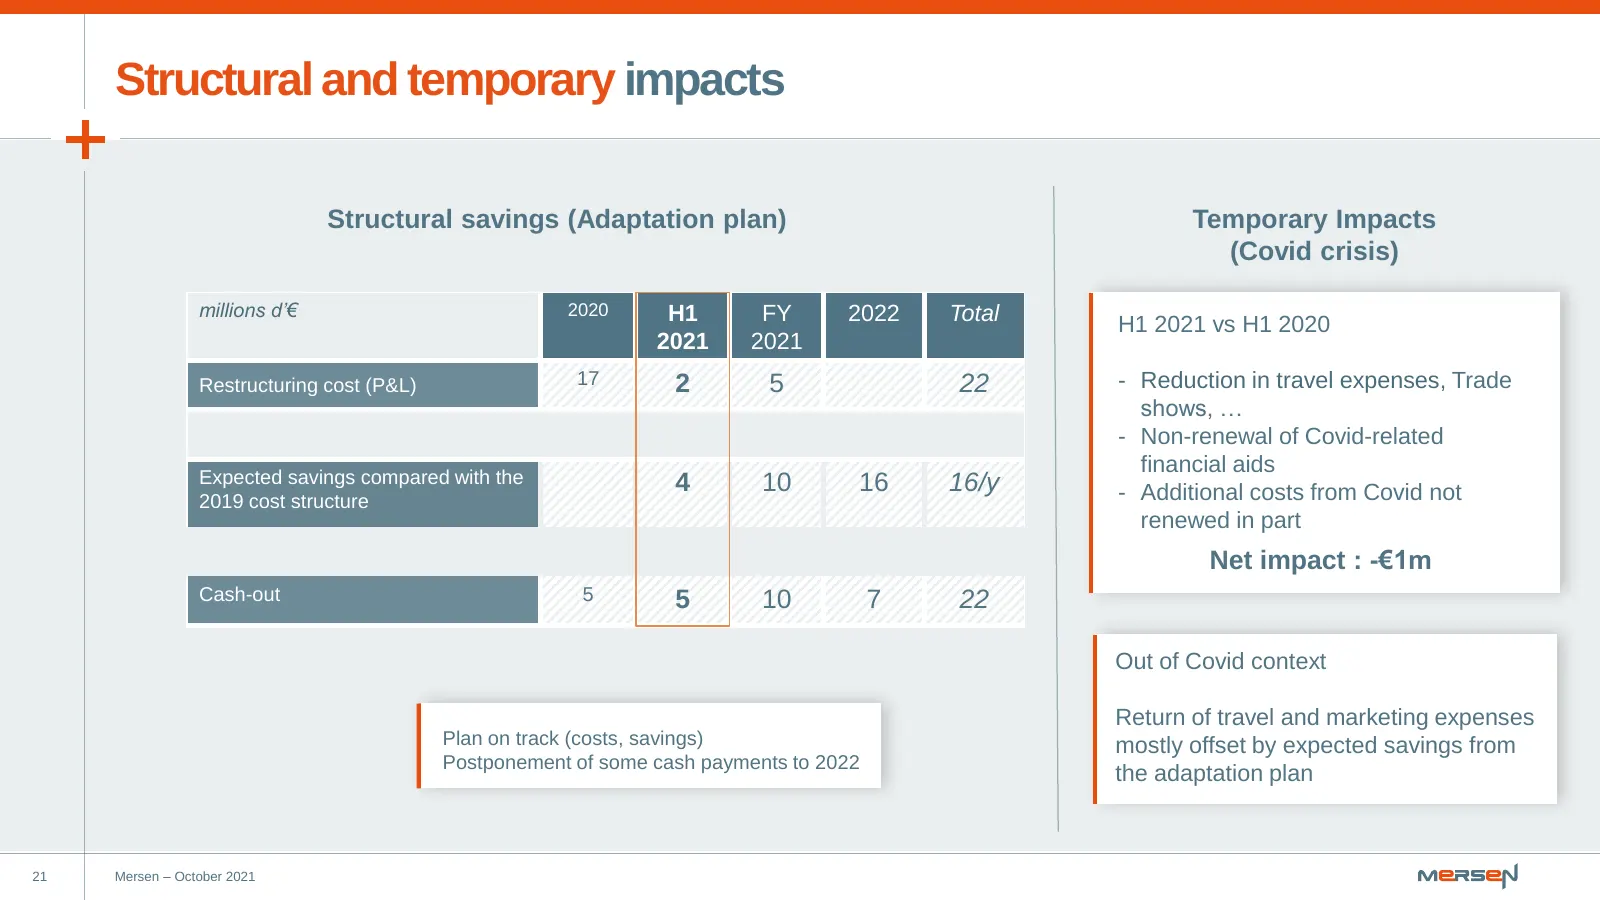
Structural and temporary impacts Structural savings (Adaptation plan) Temporary Impacts (Covid crisis) millions d’€ 2020 H1 FY 2022 Total H1 2021 vs H1 2020 2021 2021 Restructuring cost (P&L) 17 2 5 22 - Reduction in travel expenses, Trade shows, … - Non-renewal of Covid-related financial aids Expec
Slide 22: Both segments contributed to profitability growth
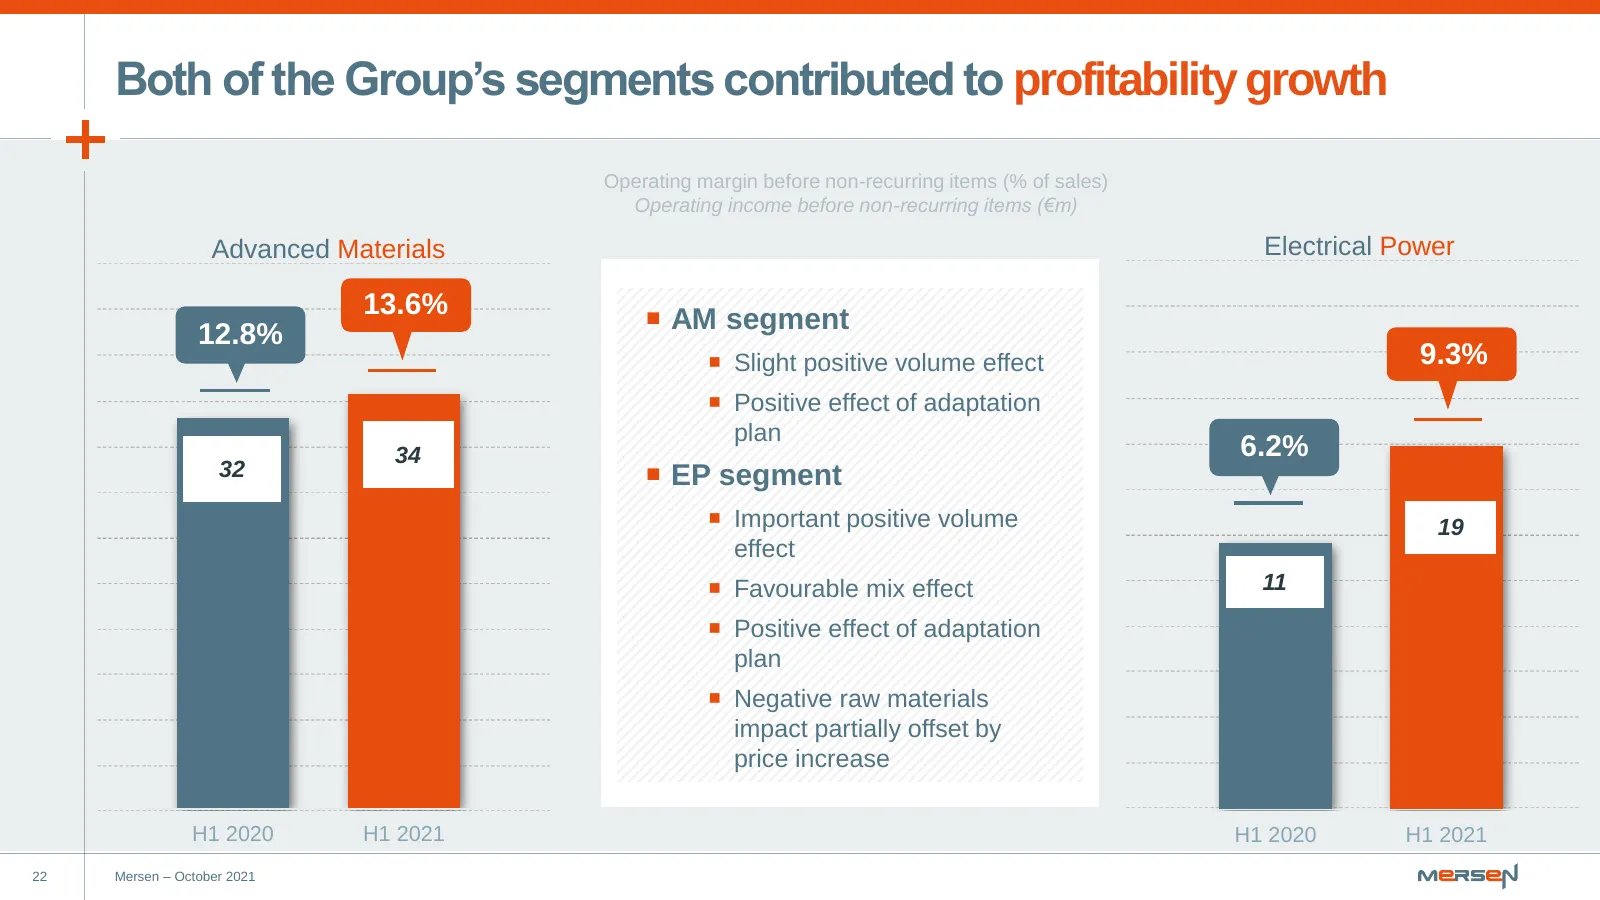
Both of the Group’s segments contributed to profitability growth Operating margin before non-recurring items (% of sales) Operating income before non-recurring items (€m) Advanced Materials Electrical Power 13.6% 12.8% AM segment Slight positive volume effect 9.3% Positive effect of adaptation
Slide 23: Net income up by more than 50%
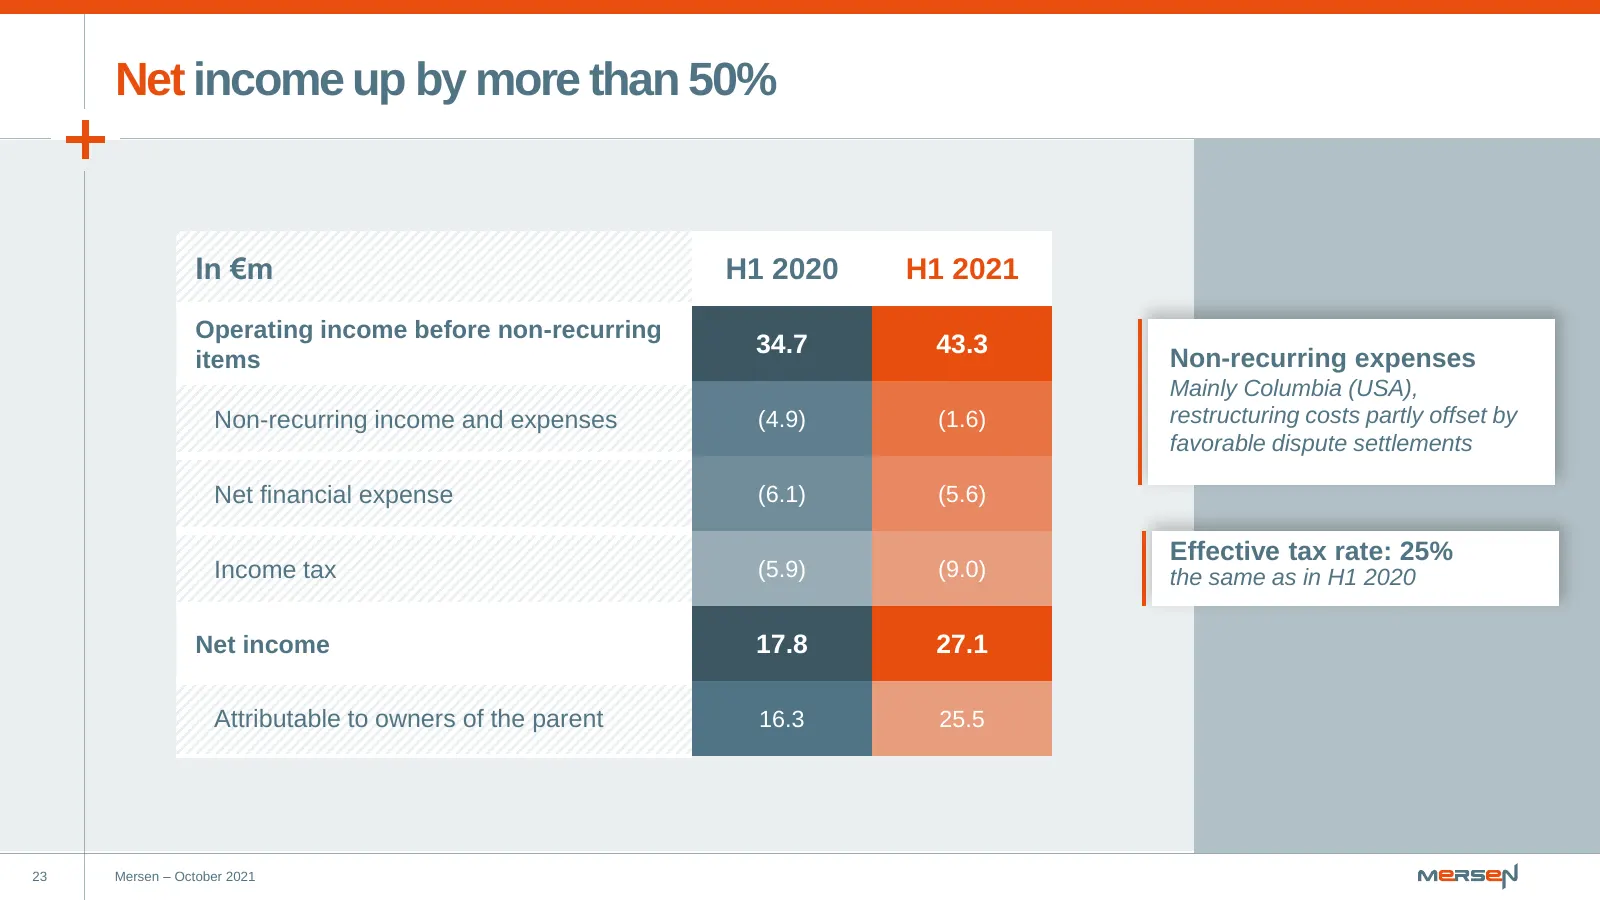
Net income up by more than 50% In €m H1 2020 H1 2021 Operating income before non-recurring 34.7 43.3 items Non-recurring expenses Mainly Columbia (USA), Non-recurring income and expenses (4.9) (1.6) restructuring costs partly offset by favorable dispute settlements Net financial expense (6.1) (5.6)
Slide 24: Higher operating cash flow generation
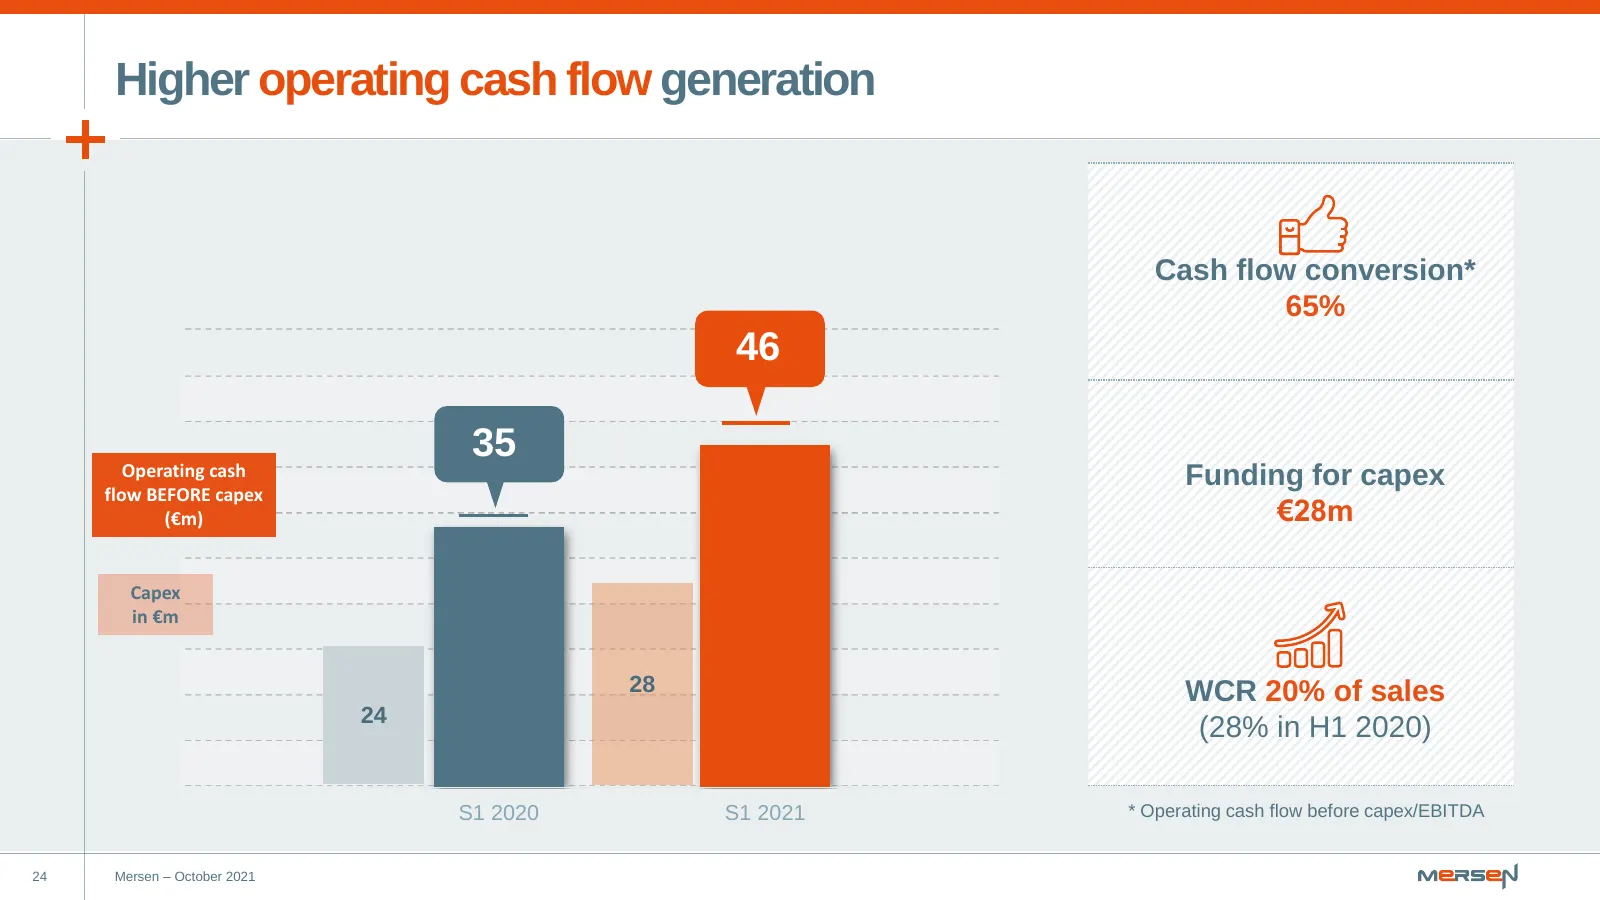
Higher operating cash flow generation Cash flow conversion* 65% 46 35 Operating cash Funding for capex flow BEFORE capex (€m) €28m Capex in €m 28 WCR 20% of sales 24 (28% in H1 2020) S1 2020 S1 2021 * Operating cash flow before capex/EBITDA 24 Mersen – October 2021
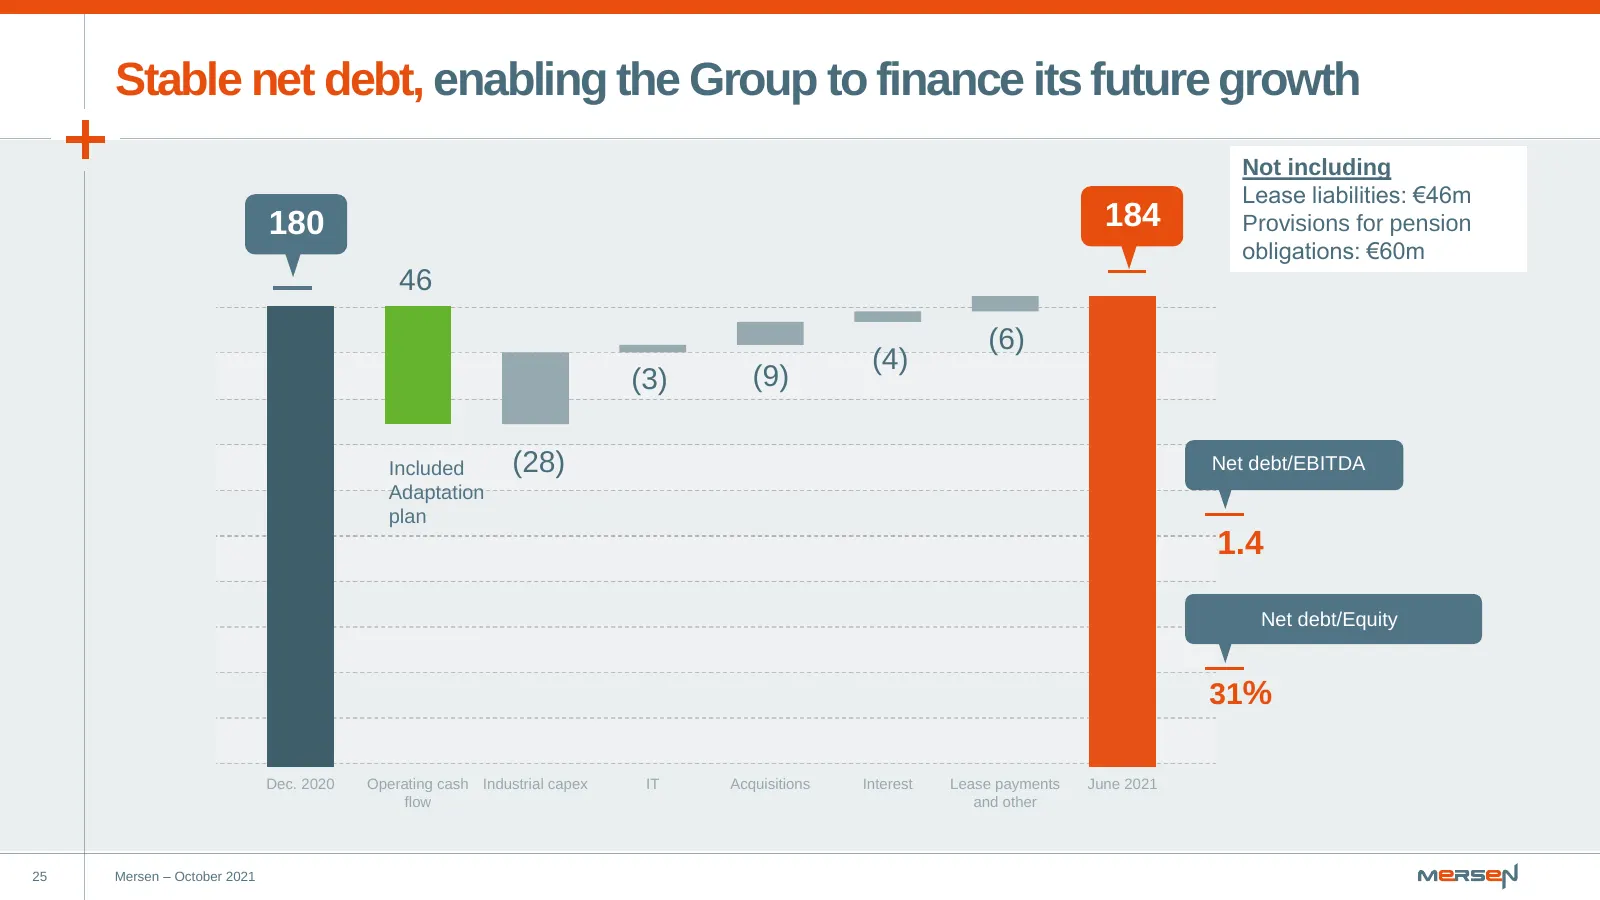
Slide 25: Stable net debt, enabling the Group to finance its future growth
Stable net debt, enabling the Group to finance its future growth Not including Lease liabilities: €46m 180 184 Provisions for pension obligations: €60m 46 (6) (4) (3) (9) Included (28) Net debt/EBITDA Adaptation plan 1.4 Net debt/Equity 31% Dec. 2020 Operating cash Industrial capex IT Acquisitions I
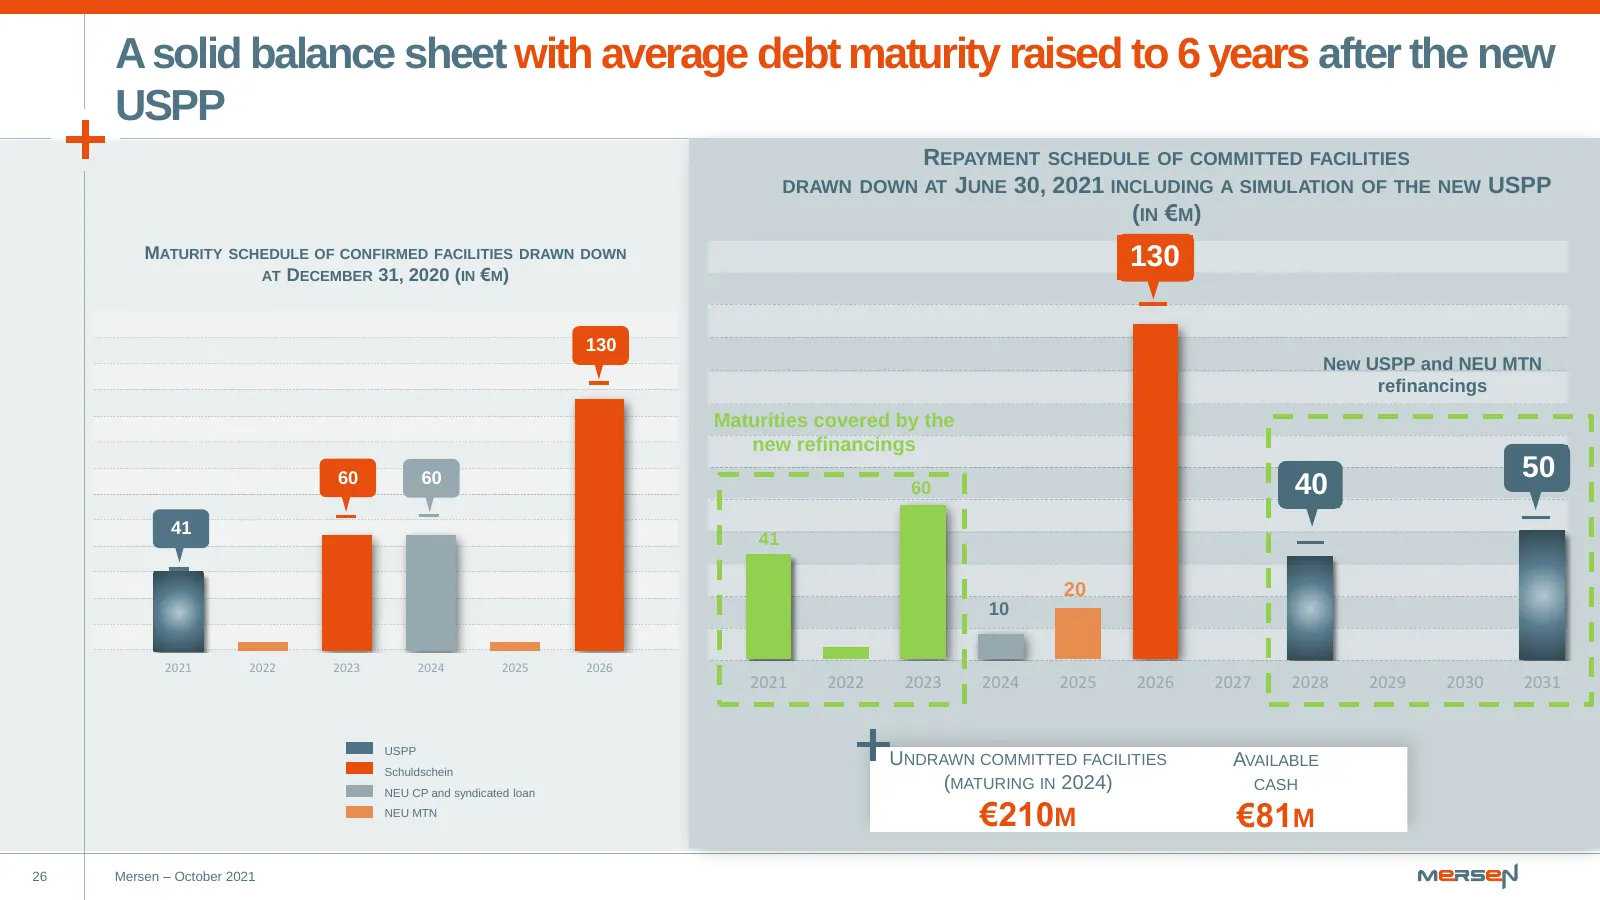
Slide 26: A solid balance sheet with average debt maturity raised to 6 years
A solid balance sheet with average debt maturity raised to 6 years after the new USPP REPAYMENT SCHEDULE OF COMMITTED FACILITIES DRAWN DOWN AT JUNE 30, 2021 INCLUDING A SIMULATION OF THE NEW USPP (IN €M) MATURITY SCHEDULE OF CONFIRMED FACILITIES DRAWN DOWN AT DECEMBER 31, 2020 (IN €M) 130 130 New US

Slide 27: Appendix
Appendix
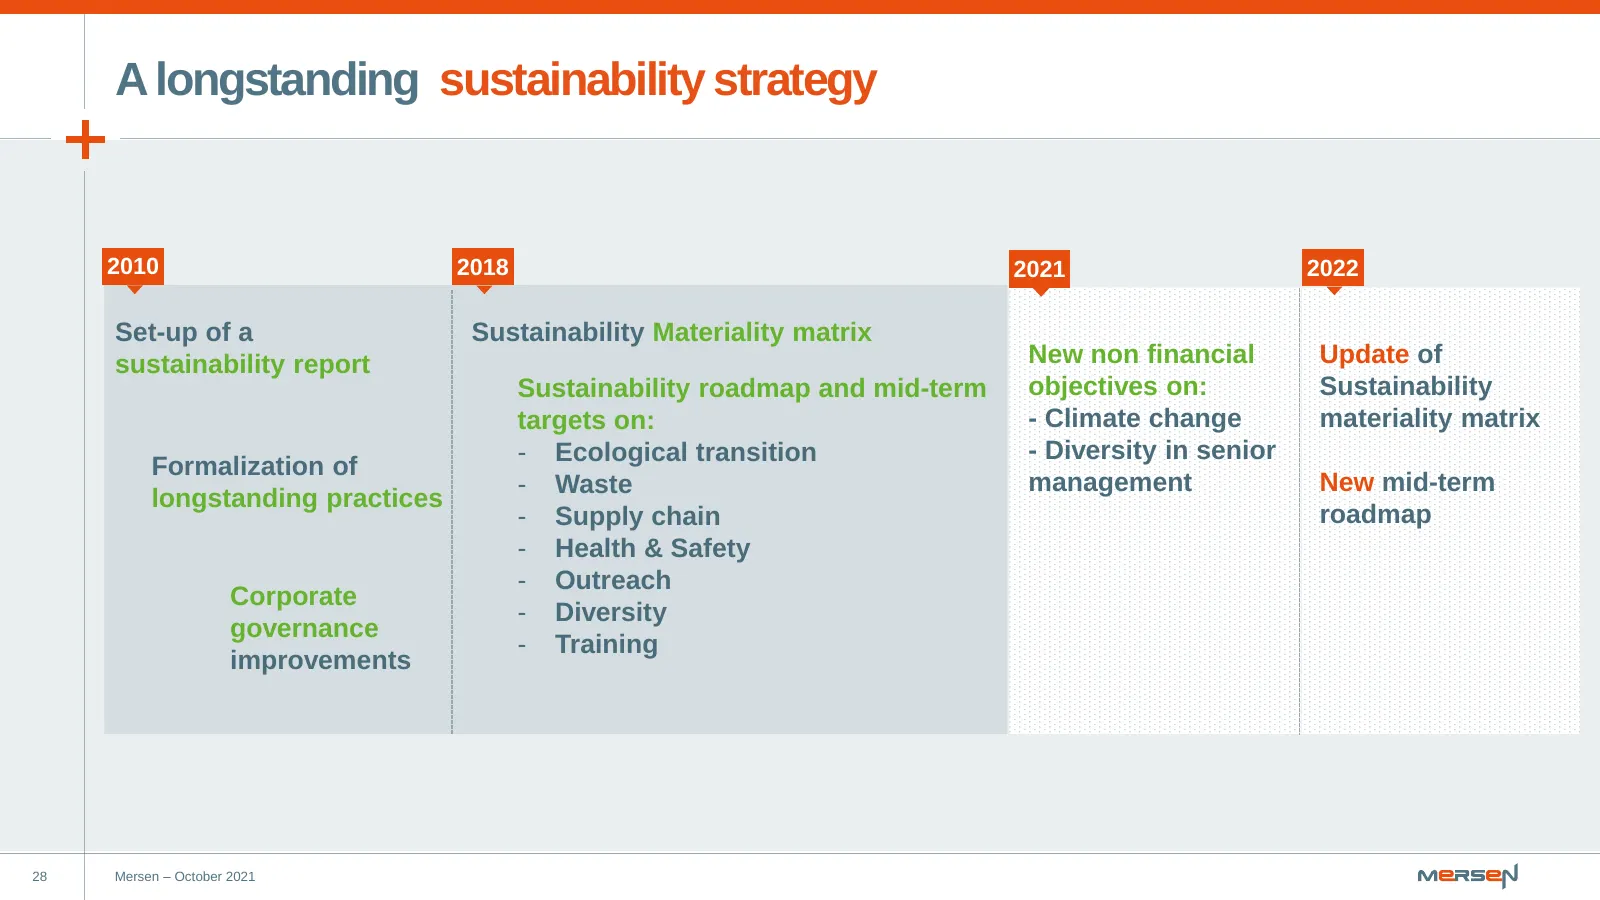
Slide 28: A longstanding sustainability strategy
A longstanding sustainability strategy 2010 2018 2021 2022 Set-up of a Sustainability Materiality matrix sustainability report New non financial Update of Sustainability roadmap and mid-term objectives on: Sustainability targets on: - Climate change materiality matrix - Ecological transition - Diver
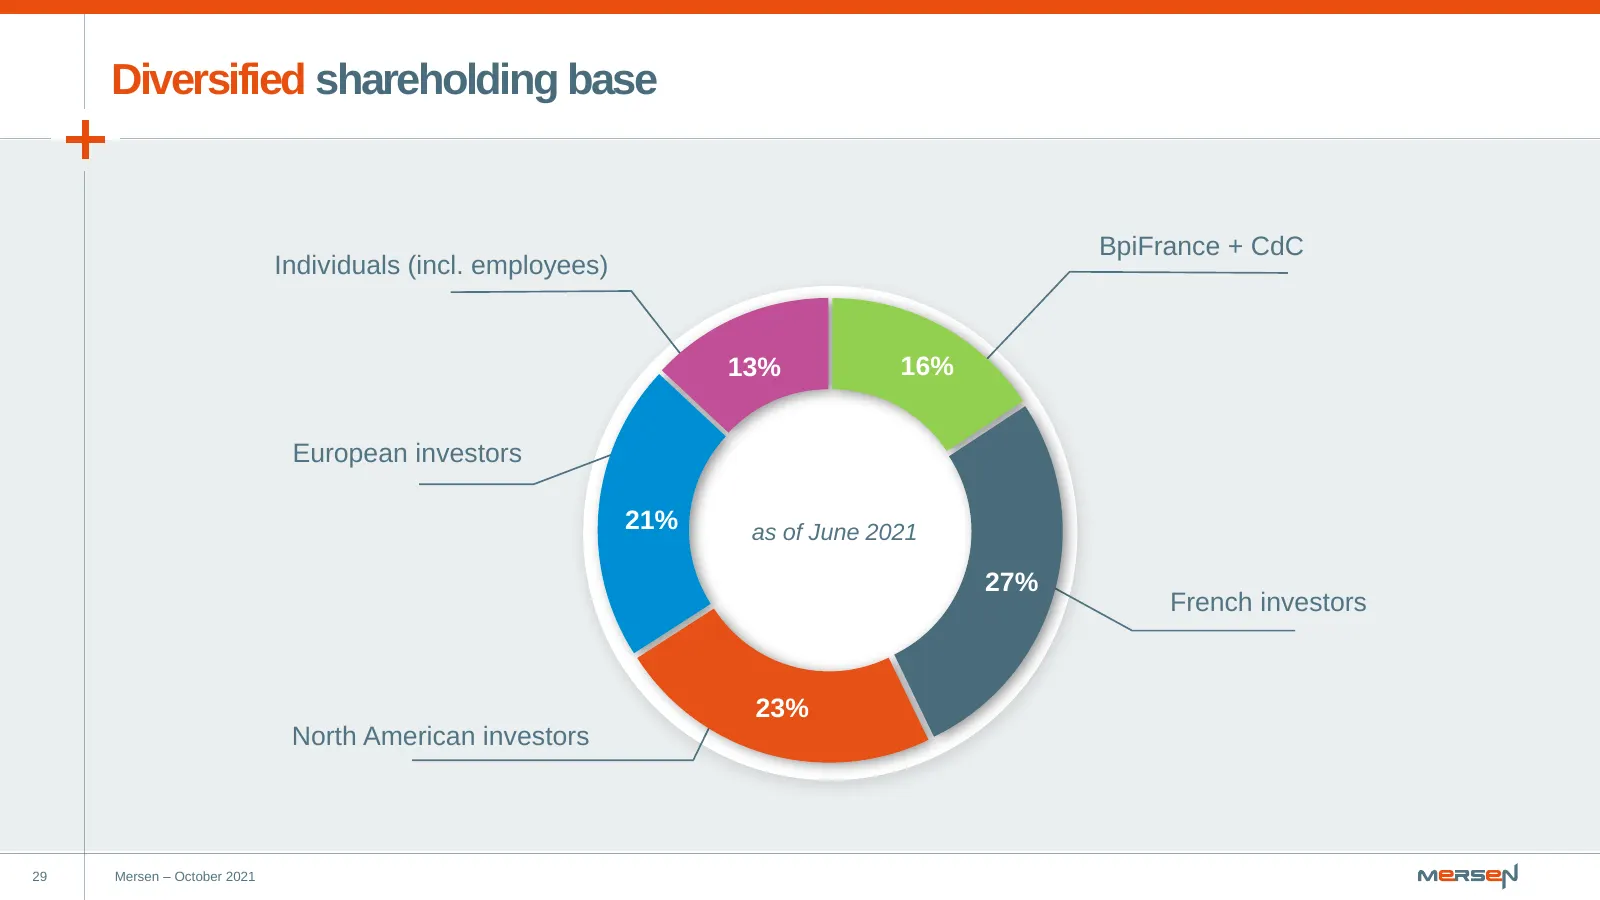
Slide 29: Diversified shareholding base
Diversified shareholding base BpiFrance + CdC Individuals (incl. employees) 13% 16% European investors 21% as of June 2021 27% French investors 23% North American investors 29 Mersen – October 2021
Source: Internet Archive copy of mersen.com
More decks from Mersen SA
 H1 2026 Earnings Presentation24 slides · Jul 30, 2026
 Shareholder Meeting (May 2026)40 slides · May 12, 2026
 Q1 2026 Earnings Presentation7 slides · Apr 28, 2026
 FY2025 Earnings Presentation10 slides · Jan 28, 2026
 FY2025 Earnings Presentation30 slides · Jan 28, 2026
 Q3 2025 Earnings Presentation8 slides · Oct 23, 2025