National Financial Partners Corp
National Financial Partners — UBS Asset Gathering Conference 2006
29 slides from National Financial Partners's conference presentation, Mar 30, 2006
Slide 1: National Financial Partners Corp. UBS Asset Gathering Conference
National Financial Partners Corp. UBS Asset Gathering Conference March 30, 2006
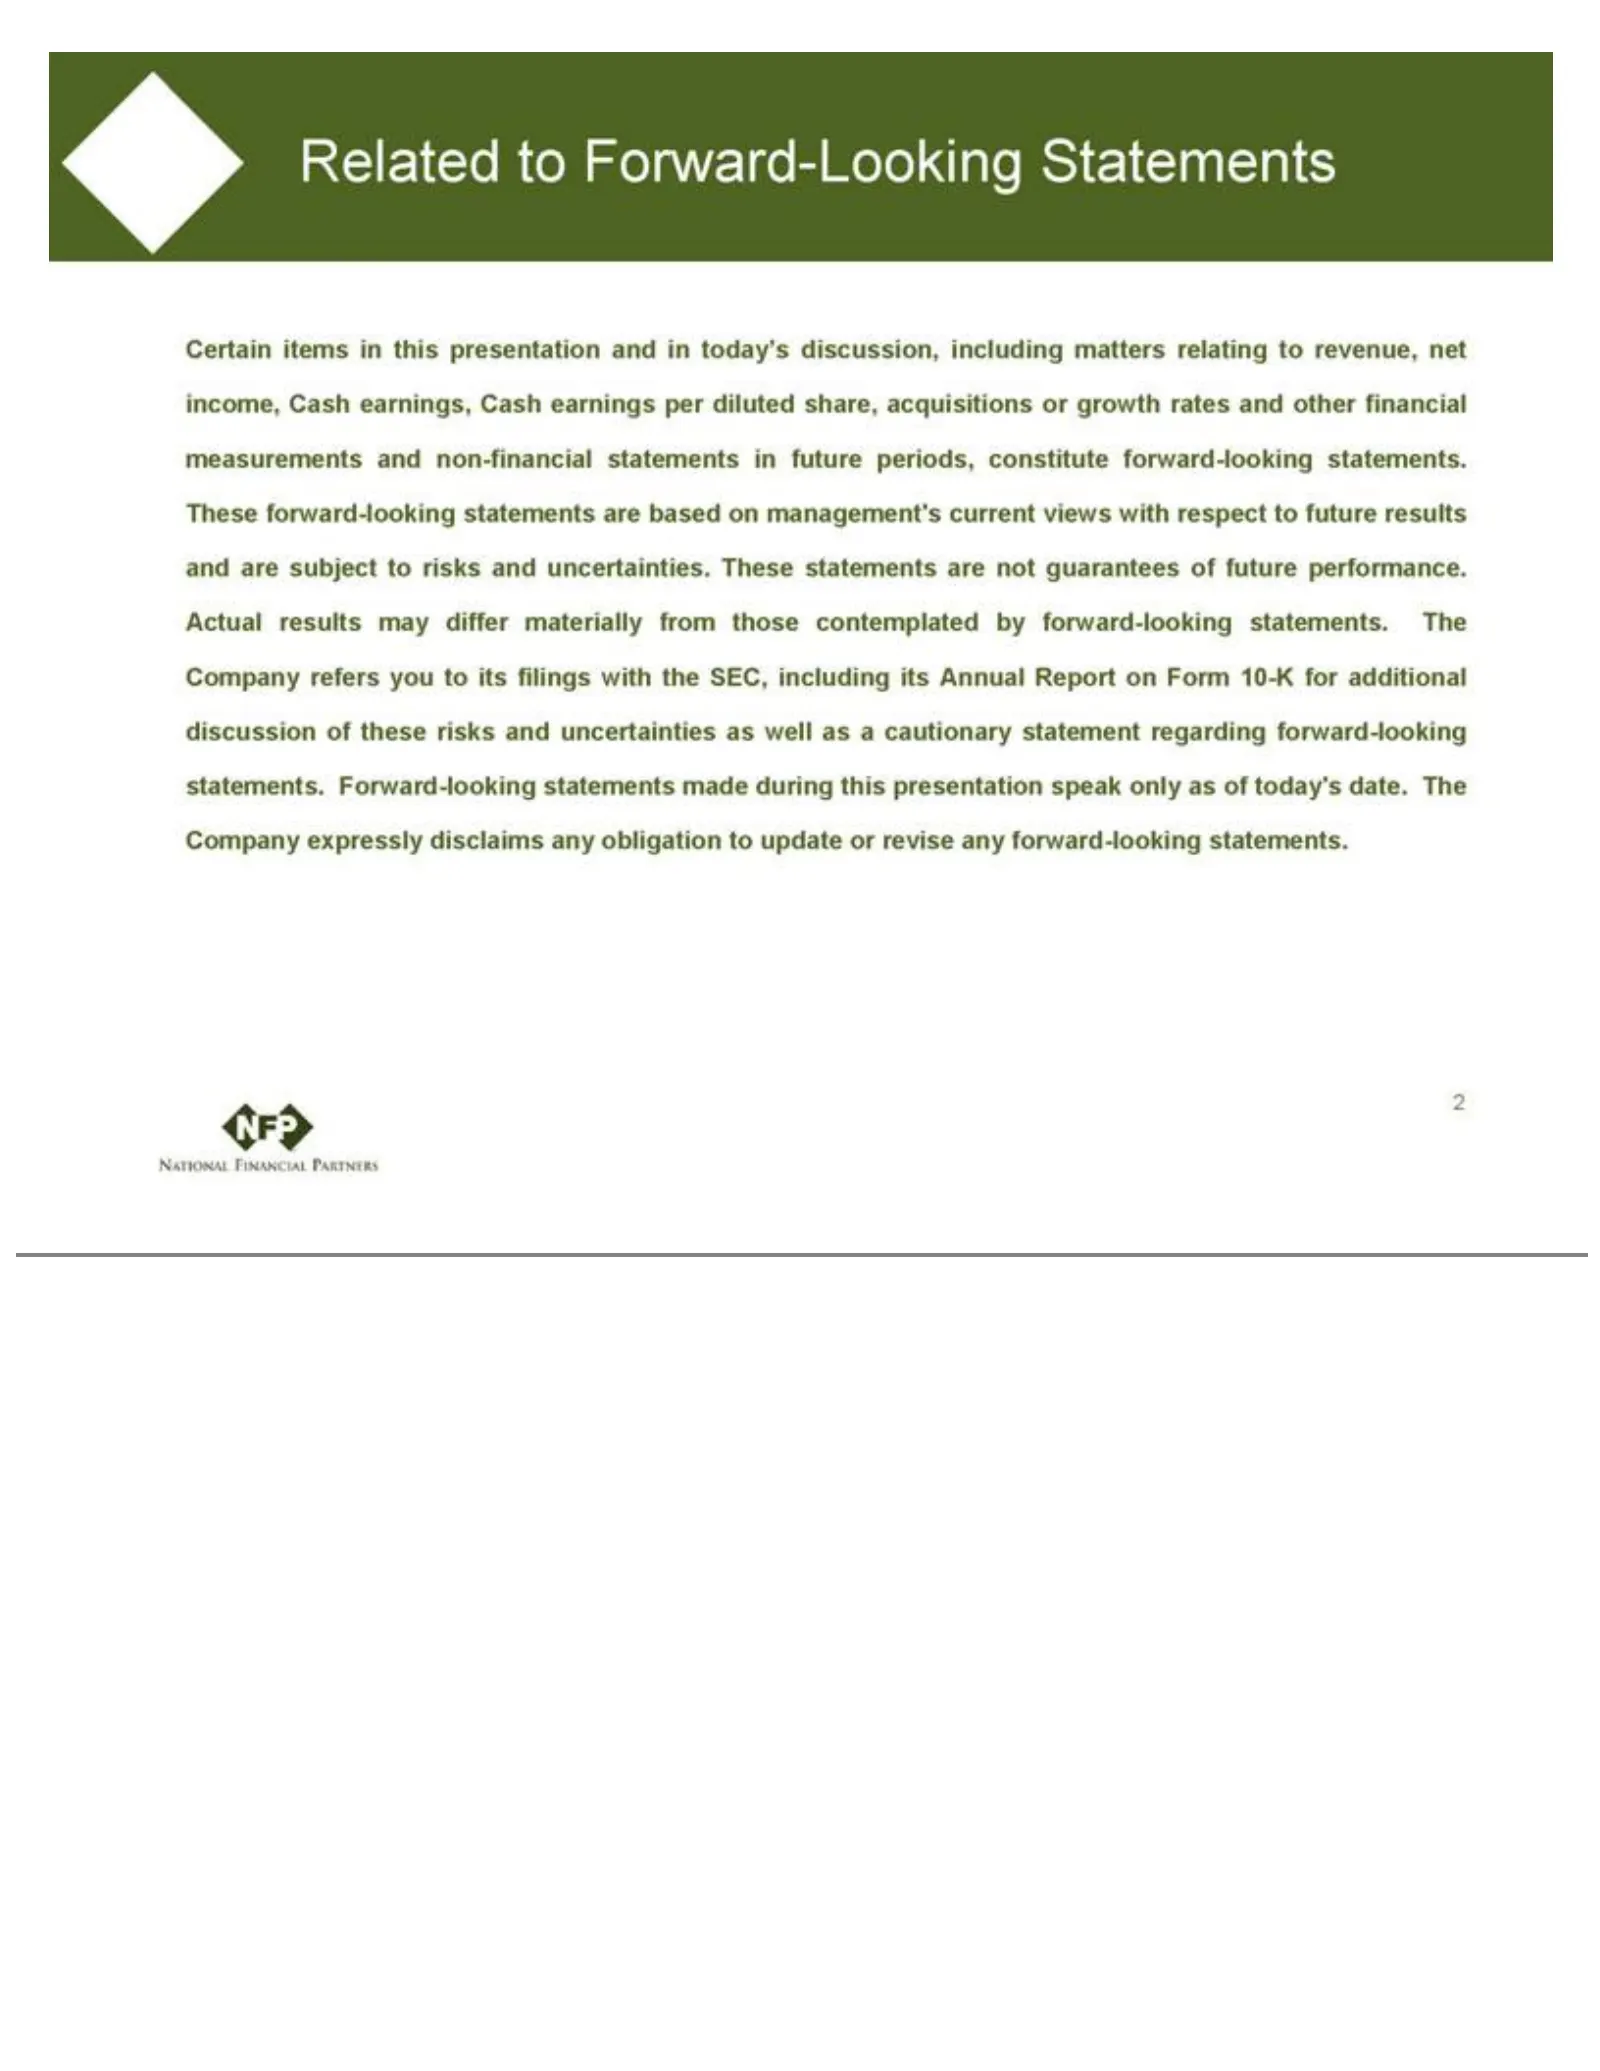
Slide 2: Forward-Looking Statements
Related acquisitions management’s from 10-K only as those forof toadditional today’s Forward-Looking contemplated or current growth date. discussion views rates The by Company and forward-looking with Statements ofother these respect financial expressly risks Certain to future and statements. measur
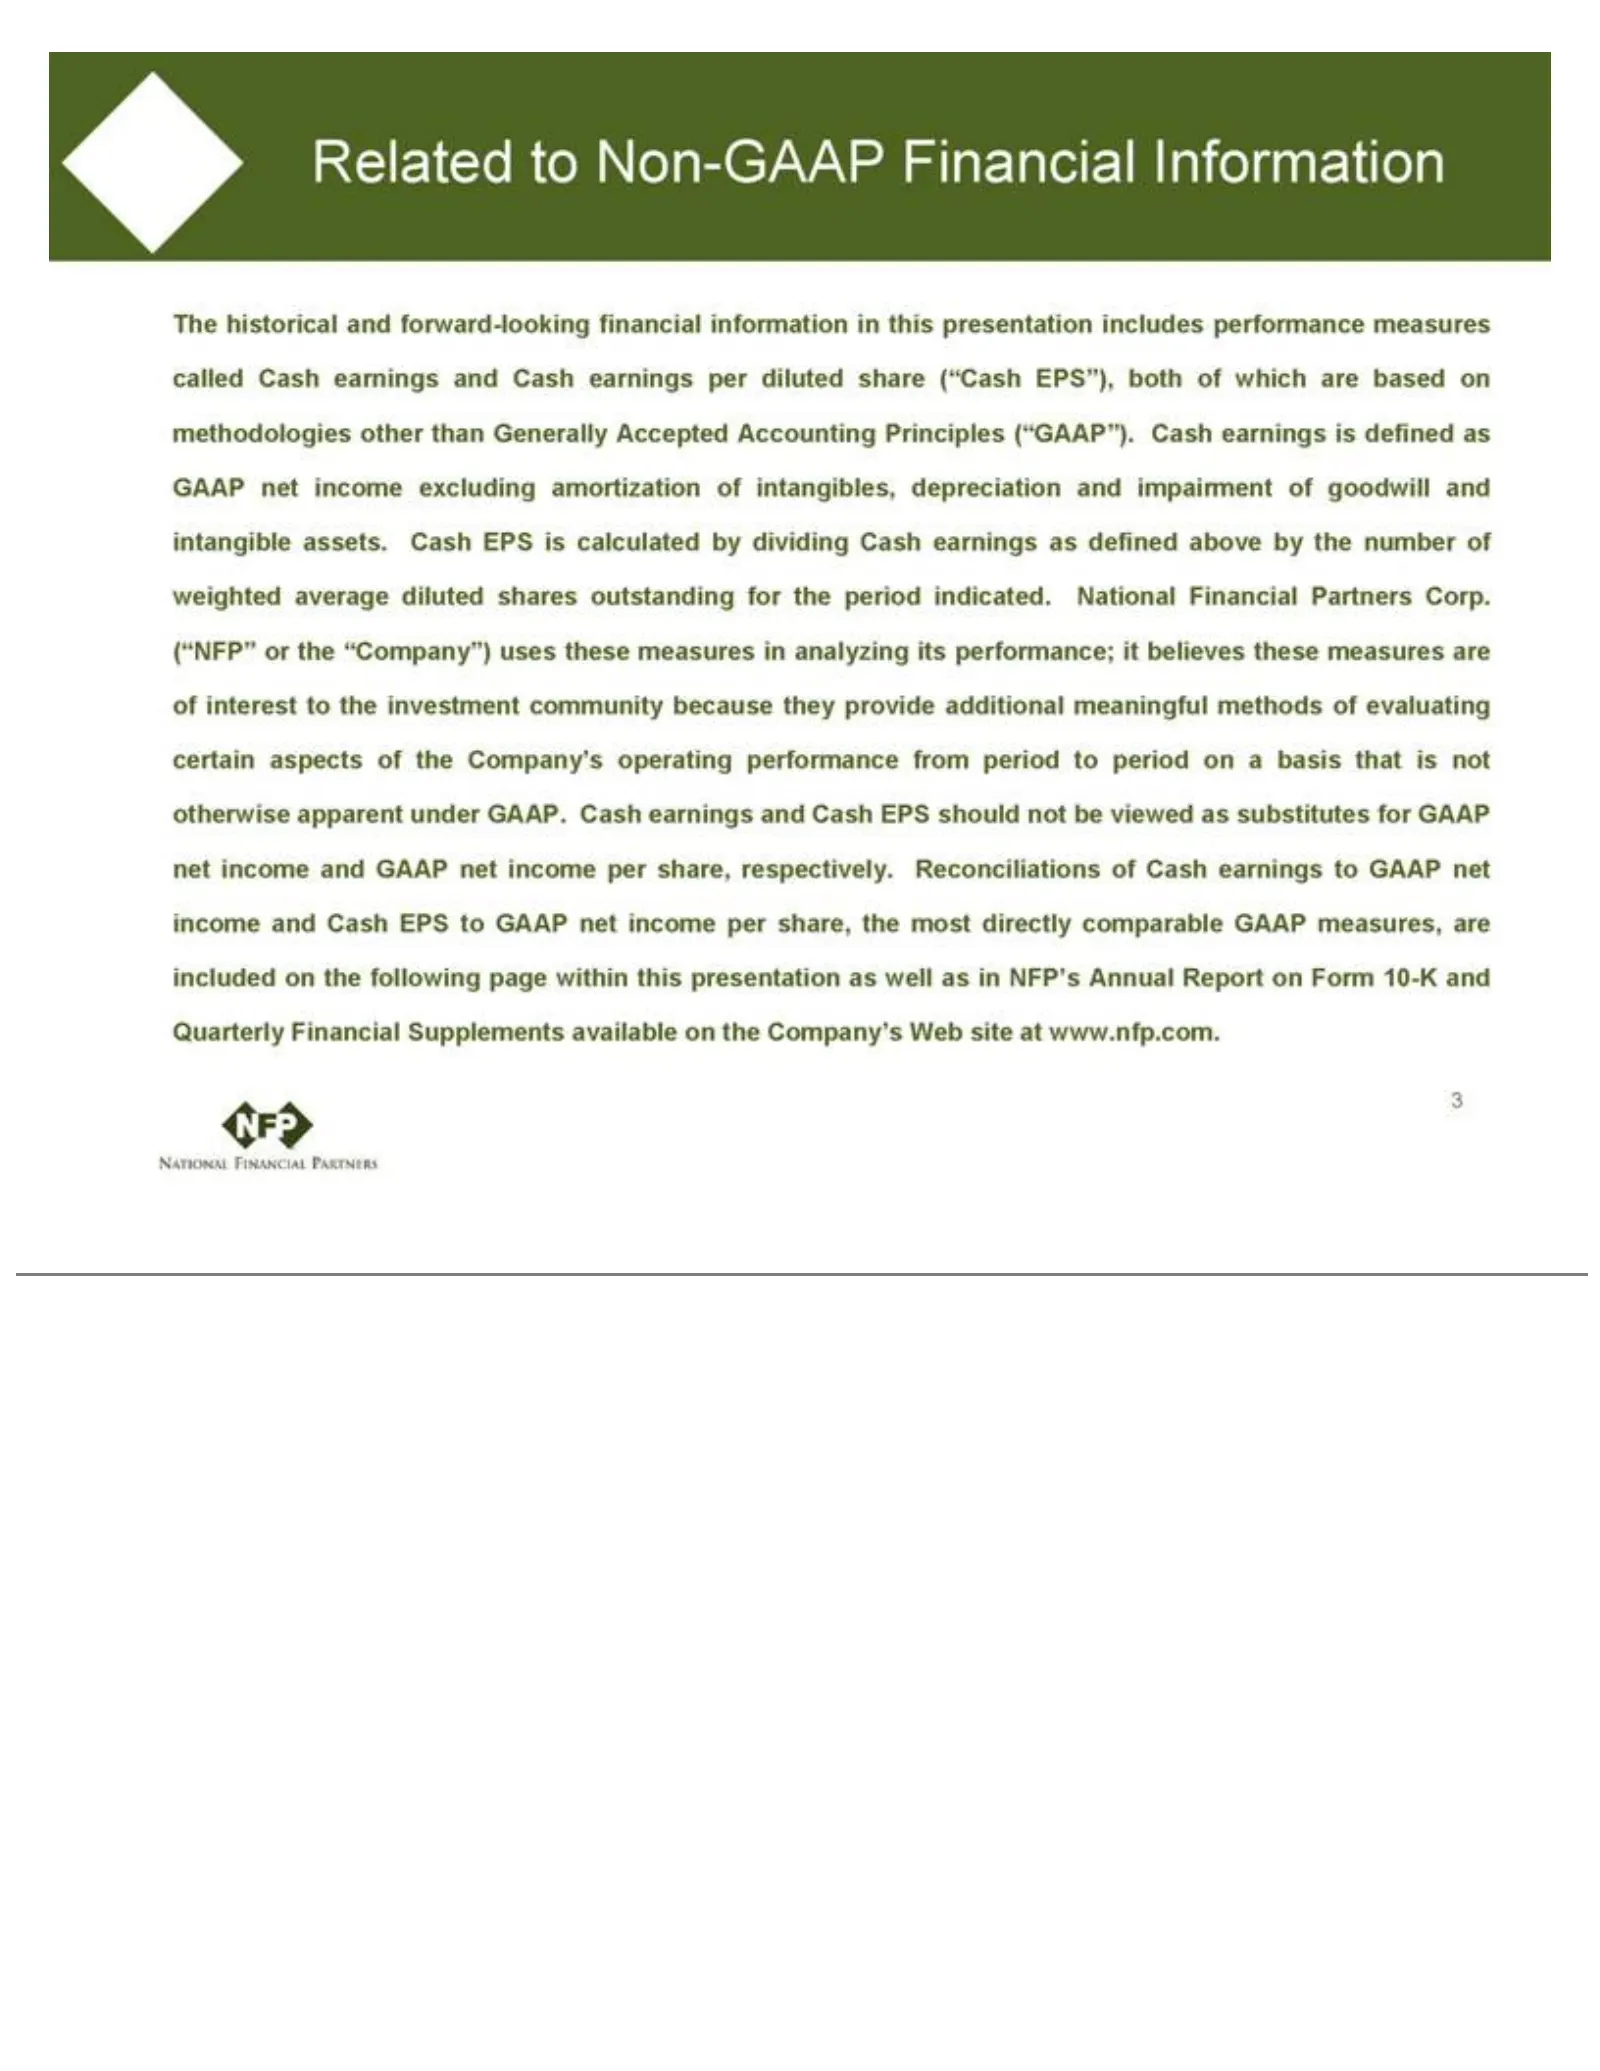
Slide 3: Non-GAAP Financial Information
NFP’s Related amortization diluted interest is earnings not otherwise Annual share shares to totothe Non-GAAP GAAP of (“Cash investment outstanding Report intangibles, apparent netEPS”), on income Financial Form under community for depreciation both the and 10-K GAAP. Information of period Cash whic
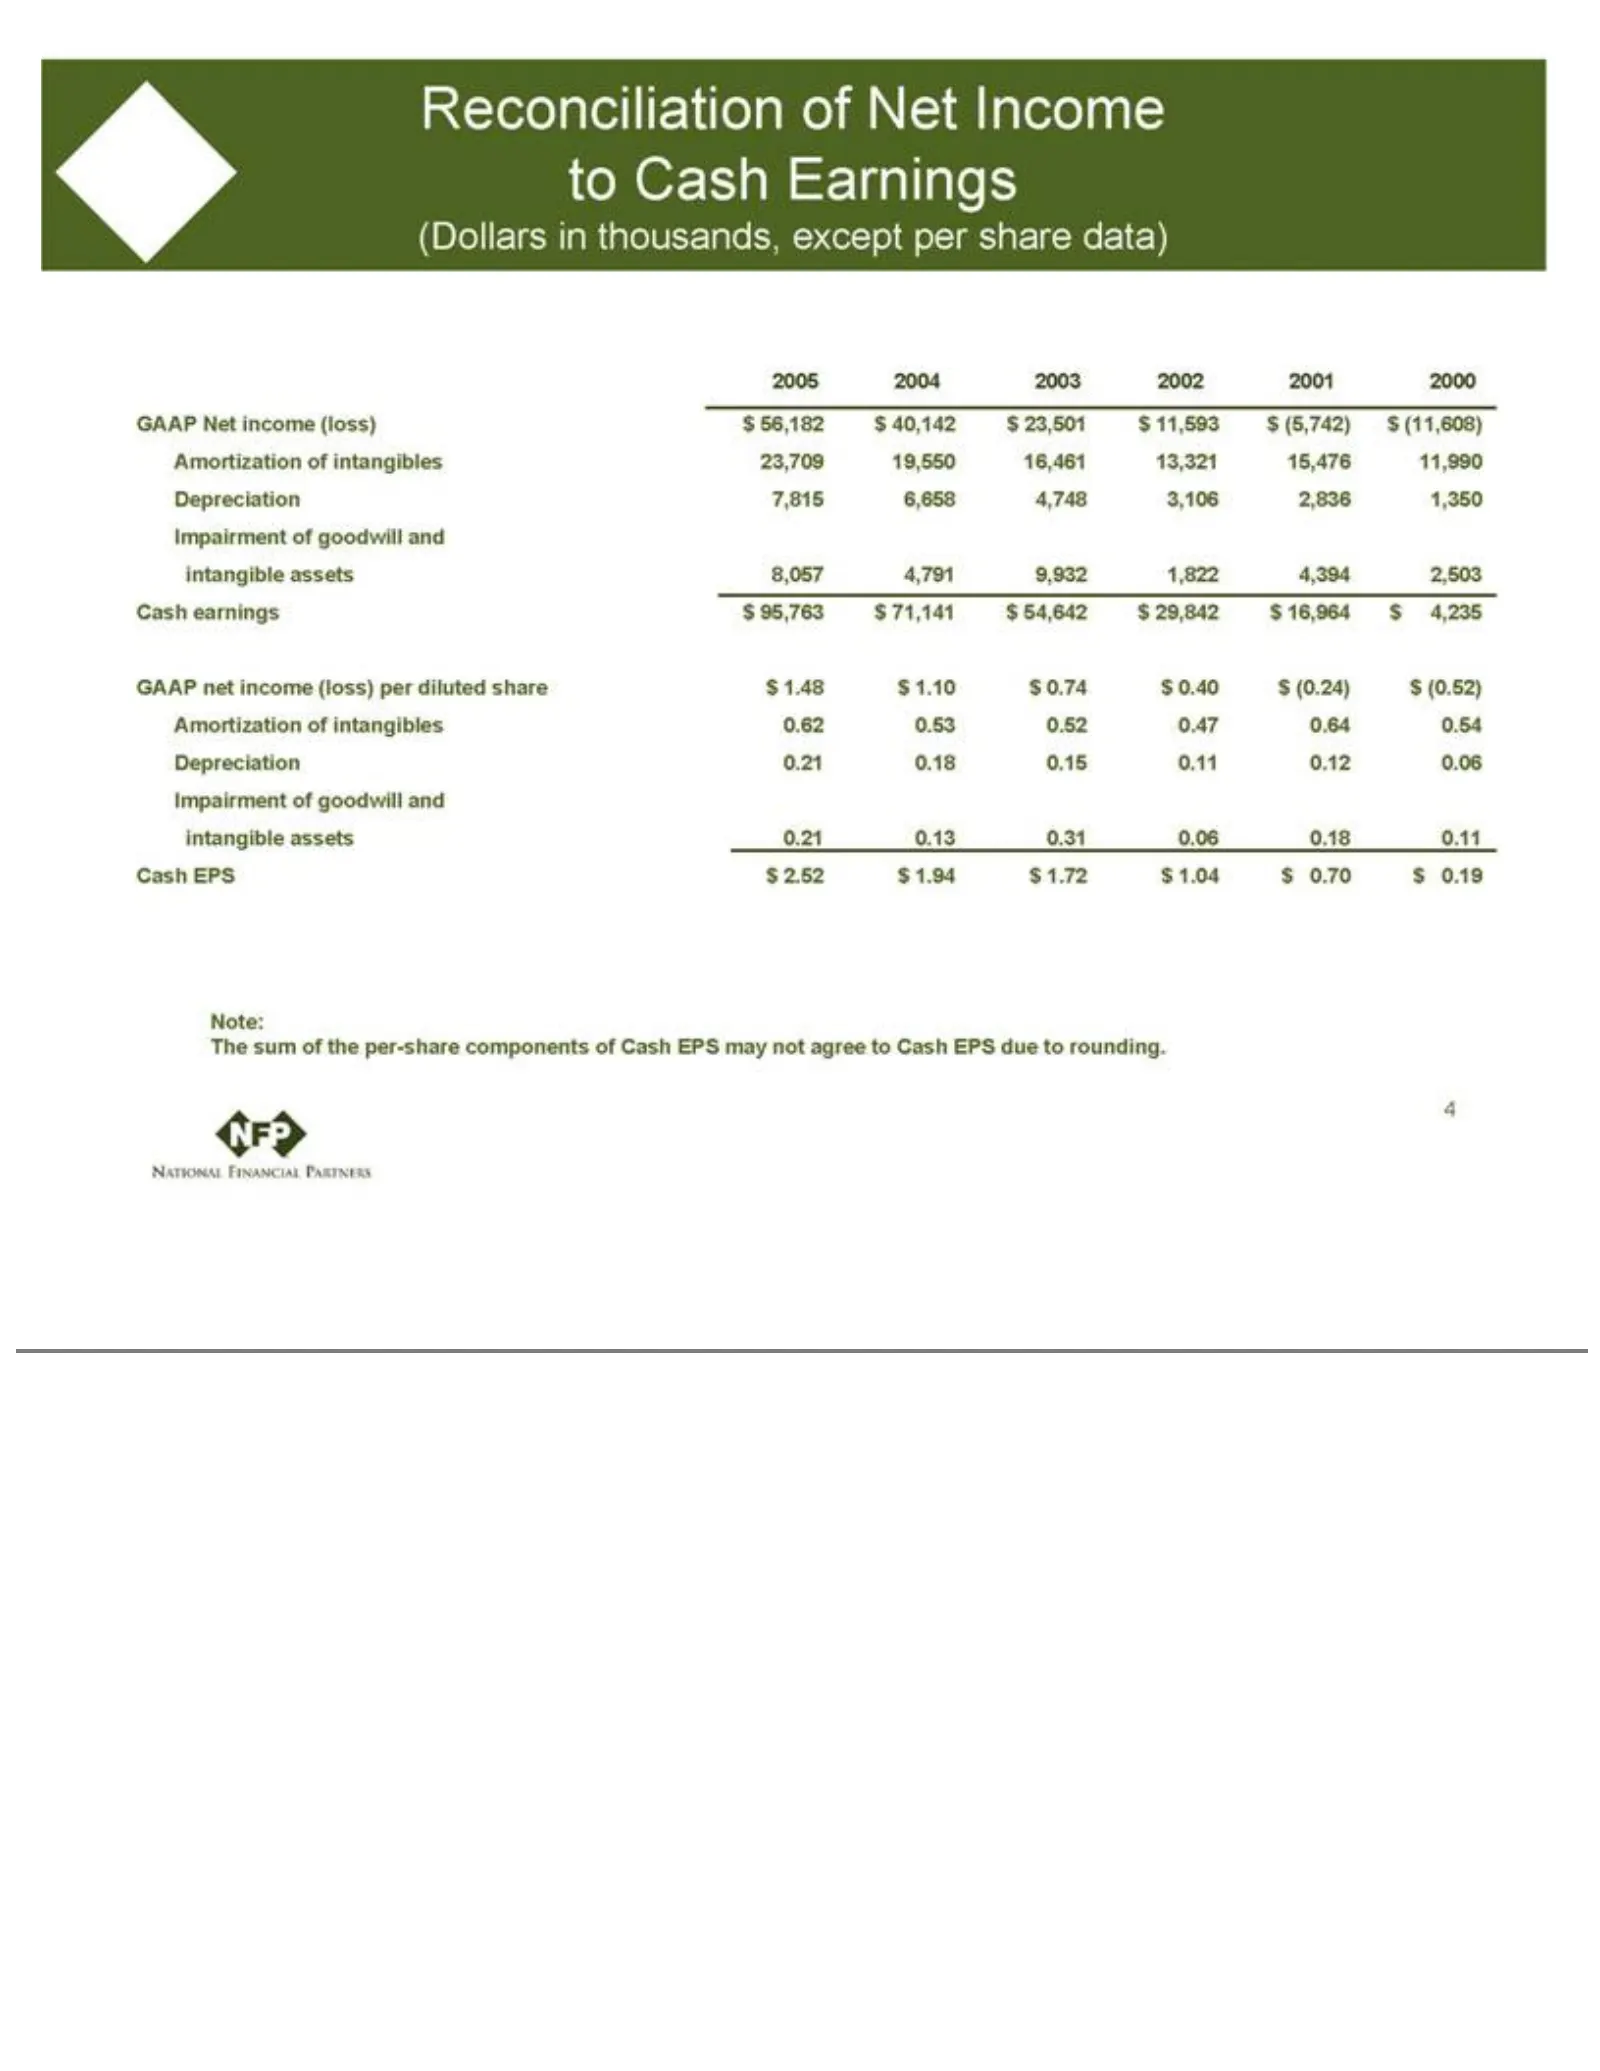
Slide 4: Reconciliation of Net Income to Cash Earnings
Reconciliation $ (11,608) of Net AmortizationIncome of to2,503 CashCash Earnings (Dollars in thousands, except per share data) 20057,815 2004 2003GAAP 2002 2001 2000 GAAP Netdiluted incomeshare (loss) $ $Impairment 56,182 $ 40,142 $ 23,501 $ 11,593 $$ (0.52) (5,742) 8,057 4,791 Amortization 0.18 0.1
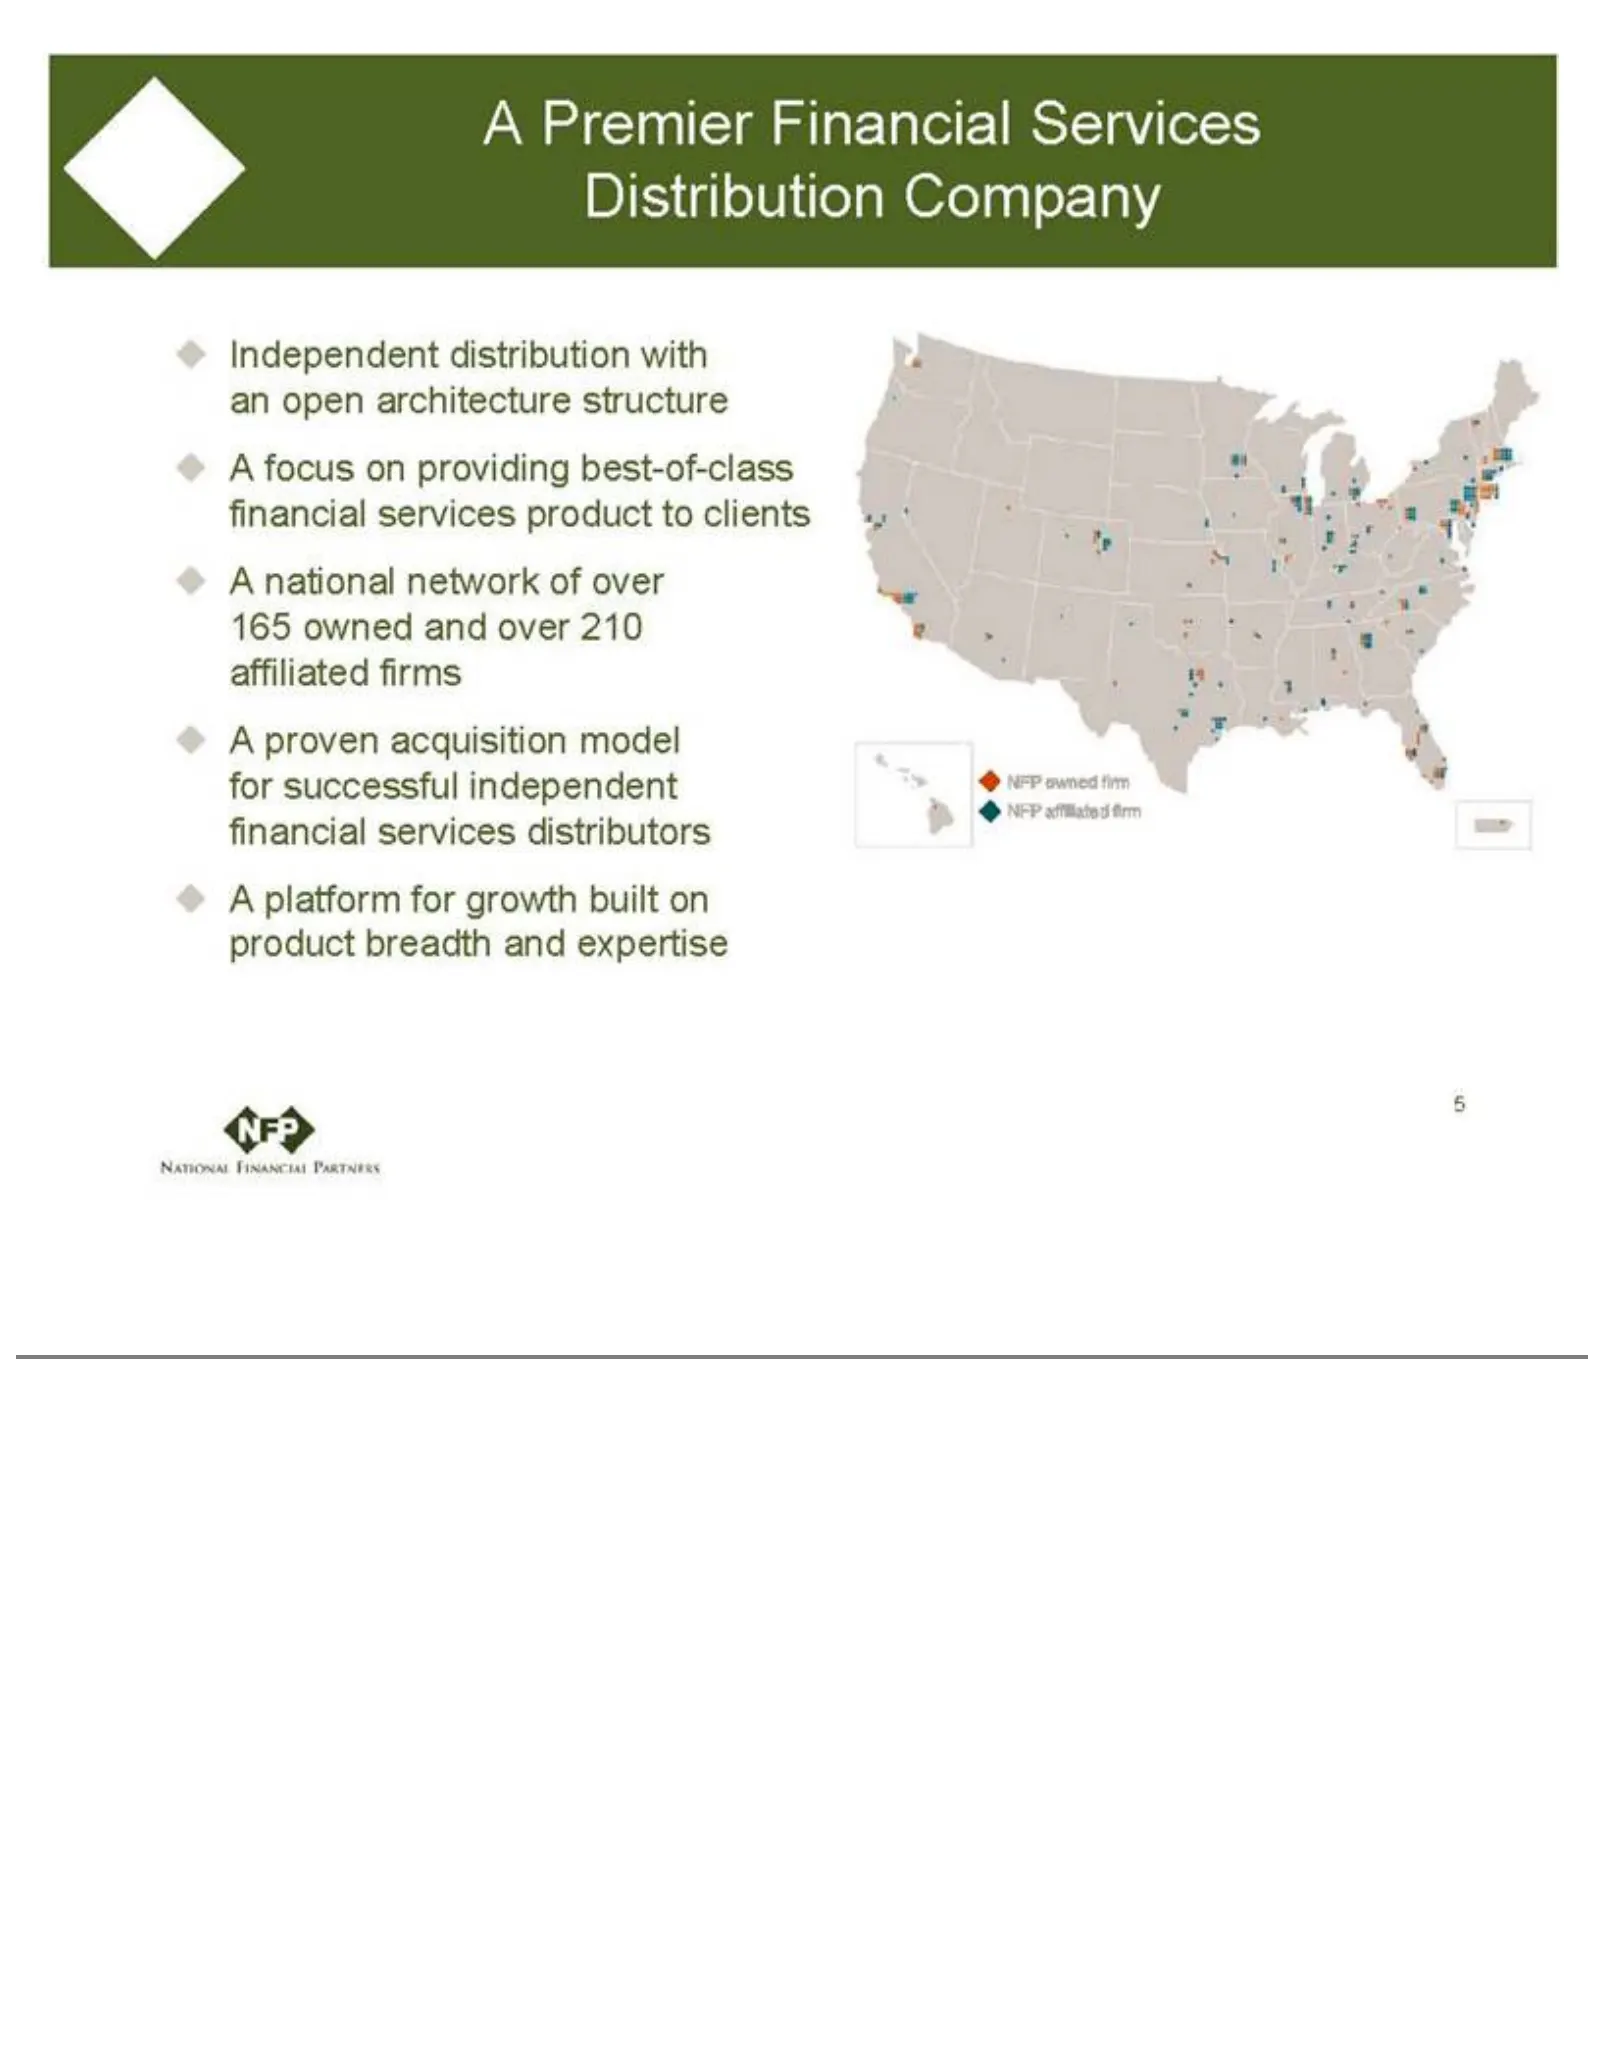
Slide 5: A Premier Financial Services Distribution Company
A Premier network expertiseof NFP Financial overowned 165 Services owned firm NFP and Distribution affiliated over 210 firm affiliated Company 5 firms Independent A provendistribution acquisitionwith model an for open successful architecture independent structure financial A focus onservices providi
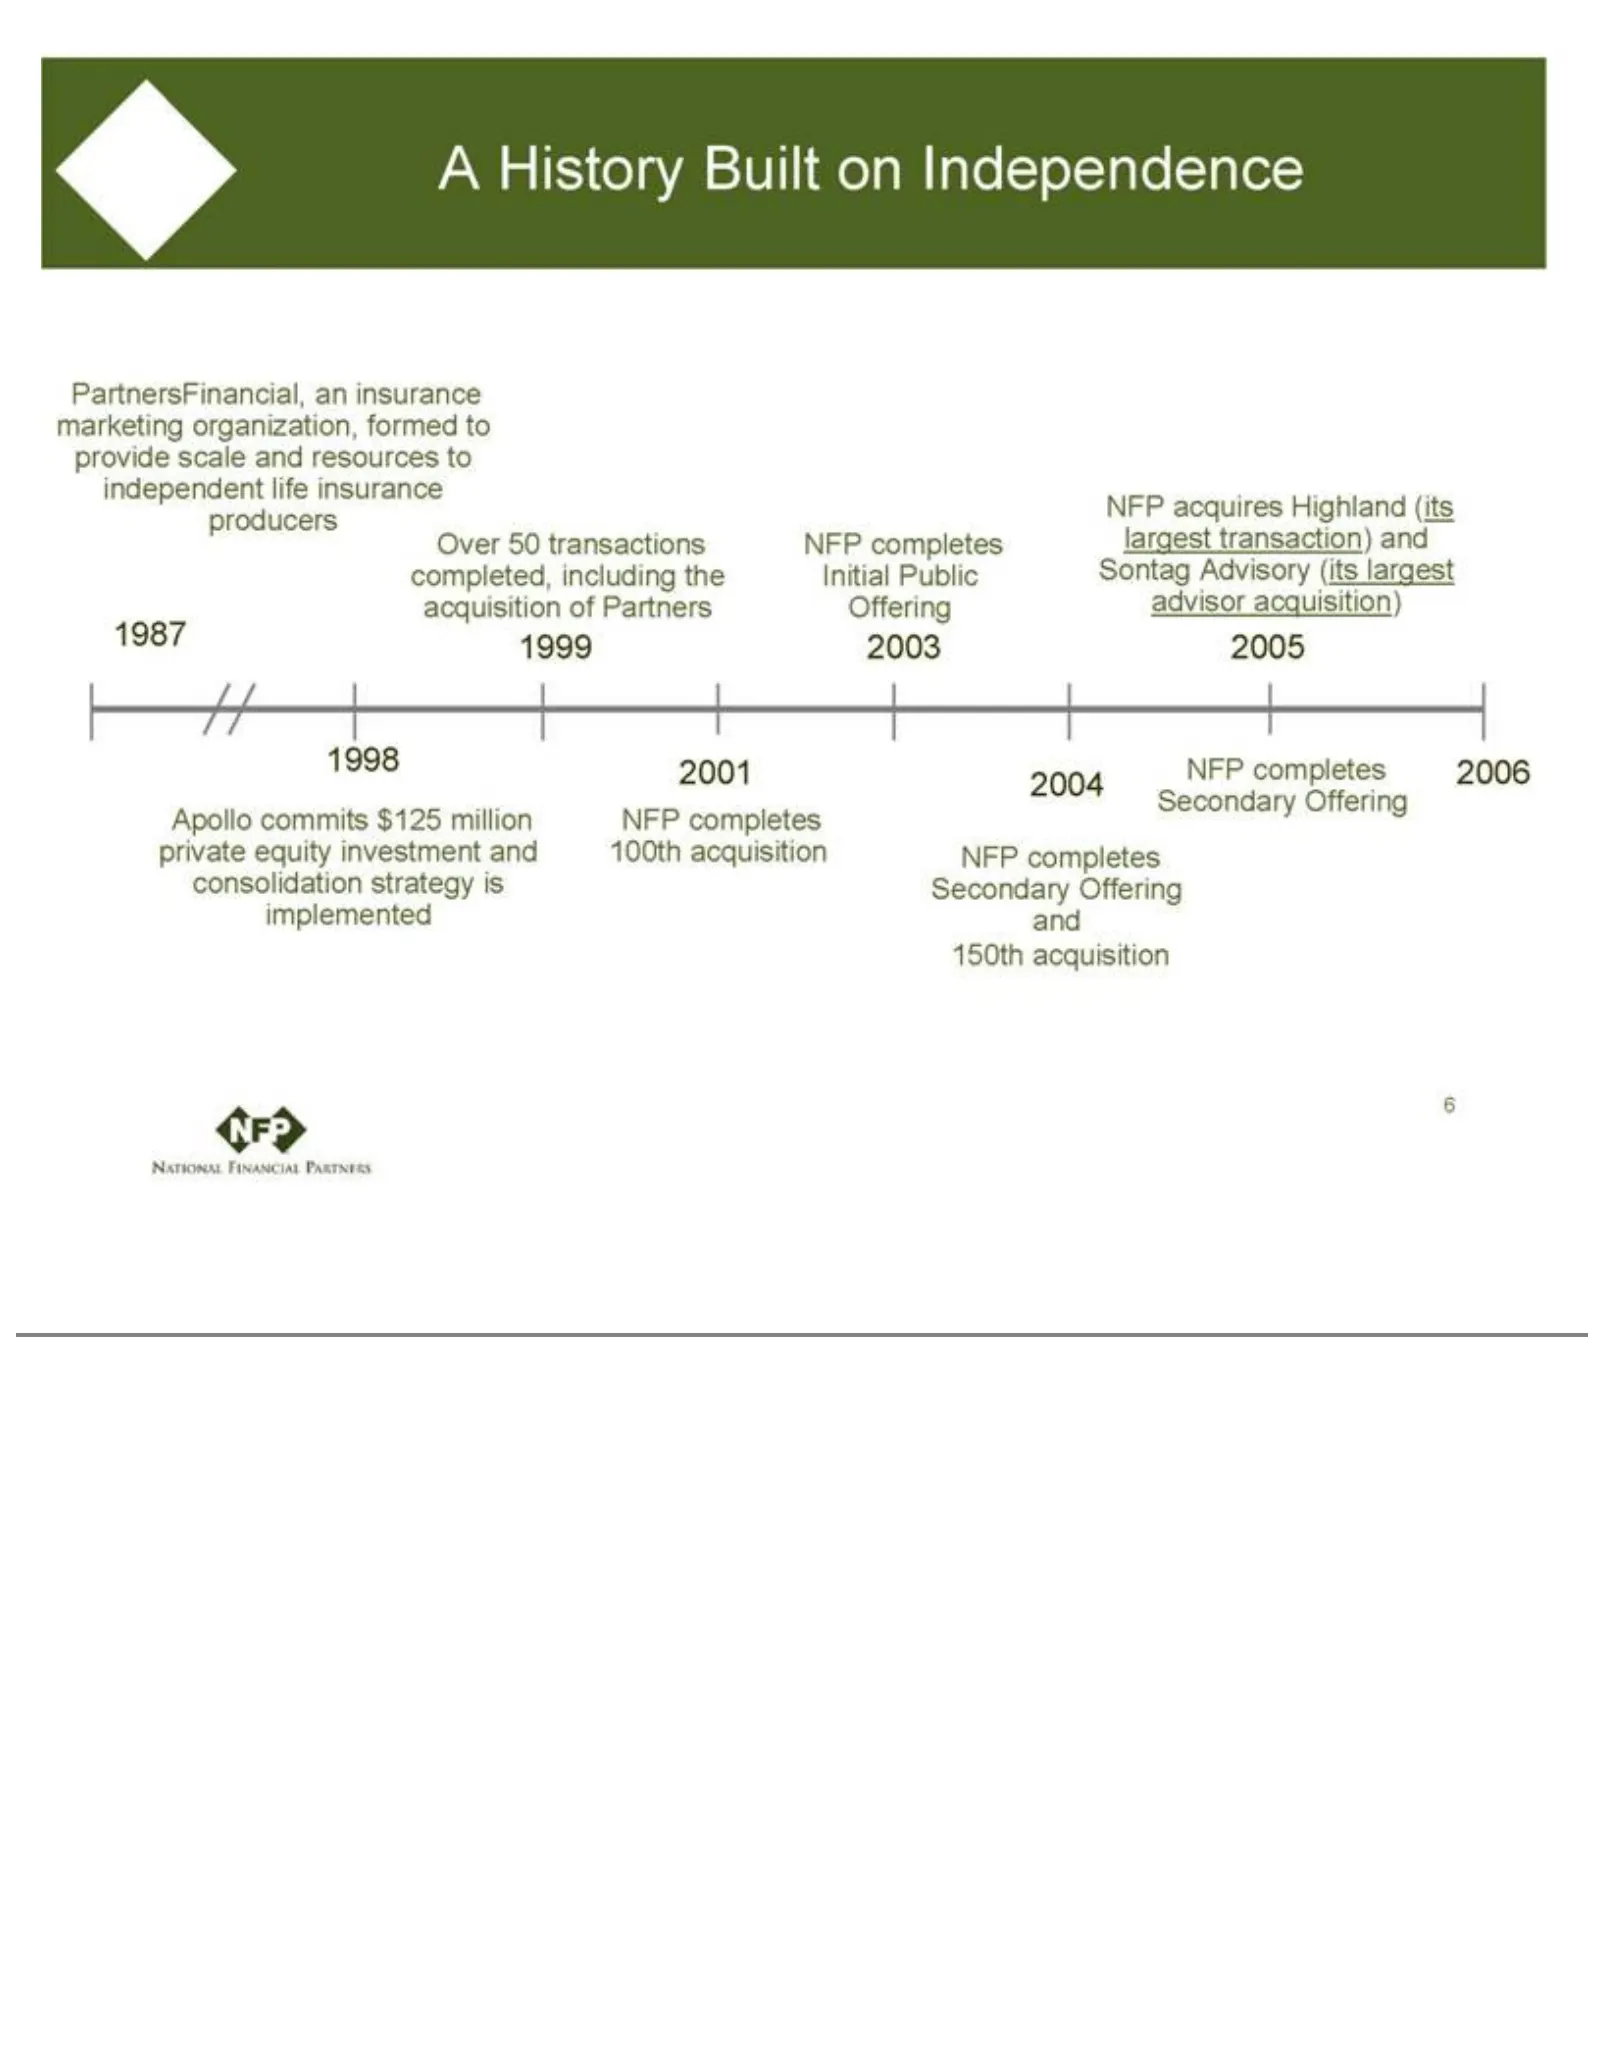
Slide 6: A History Built on Independence
A History 2004 largest and 150th 2005 advisor Built acquisition 2006acquisition) on Over Independence NFP 50 transactions completes ApolloPartnersFinancial, commits Secondary completed, $125Offering including million an insurance private 6 the acquisition equity marketing investment oforganization,
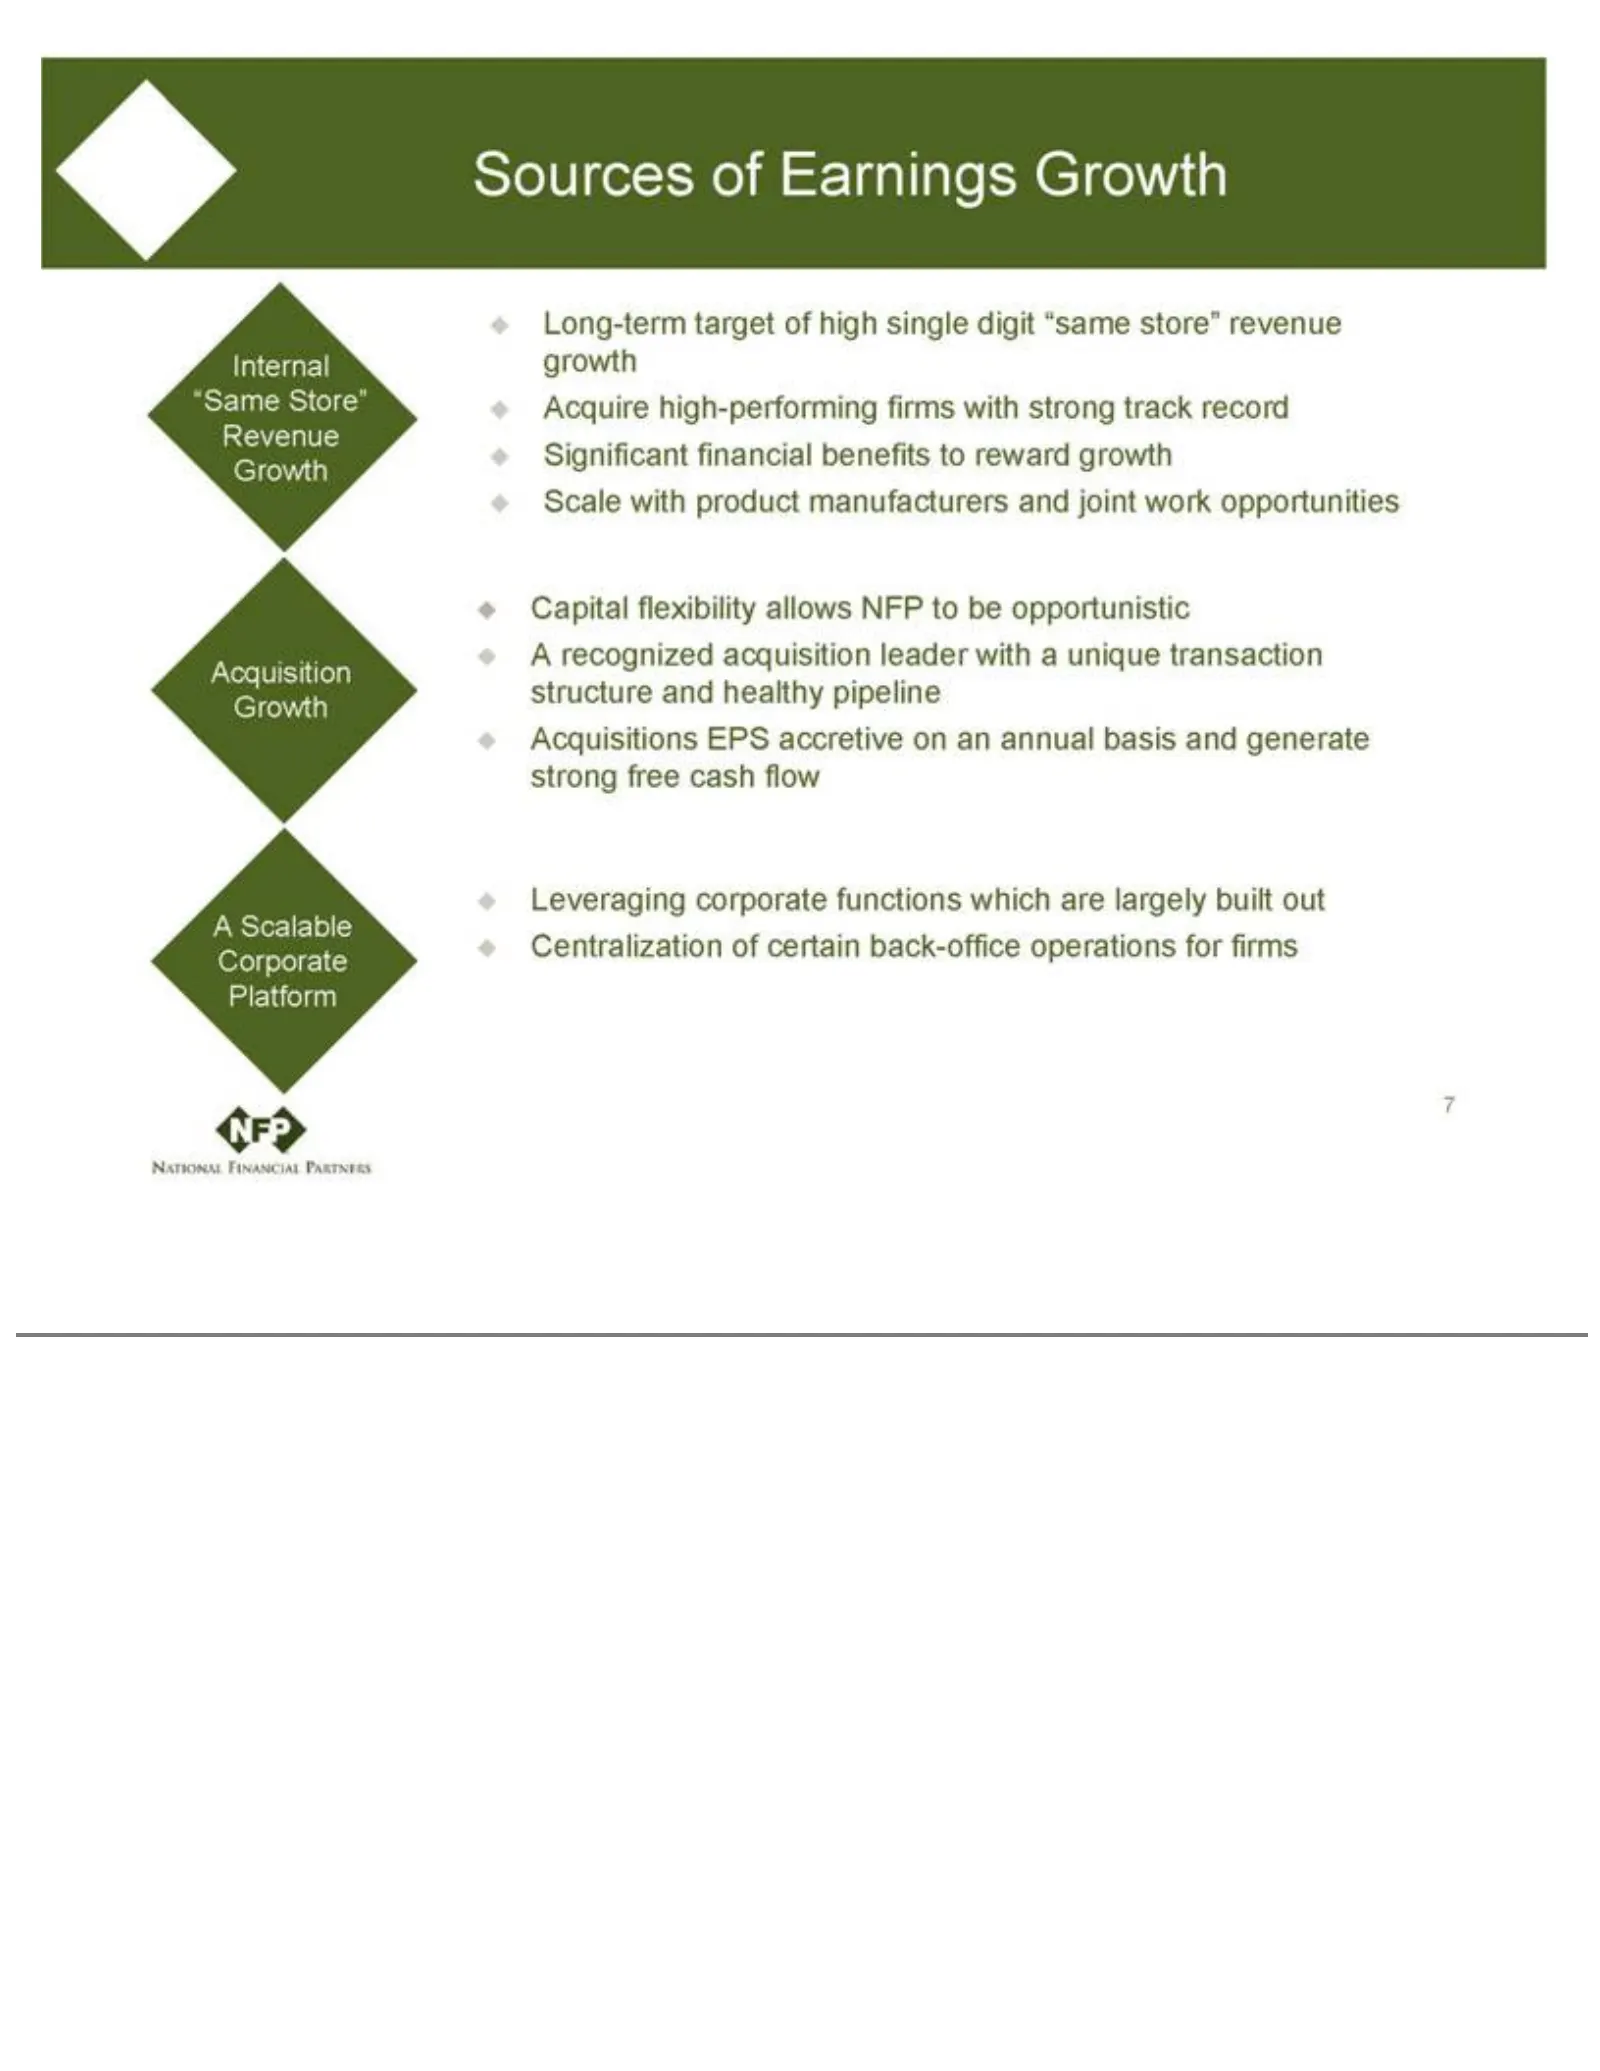
Slide 7: Sources of Earnings Growth
Sources Scale pipeline for firms with Acquisitions ofInternal product Earnings “Same manufacturers Growth EPSStore” accretive Long-term Revenue and onjoint an target Growth annual work of high opportunities Acquisition basissingle and generate digit Growth Capital “same strong Aflexibility Scalable
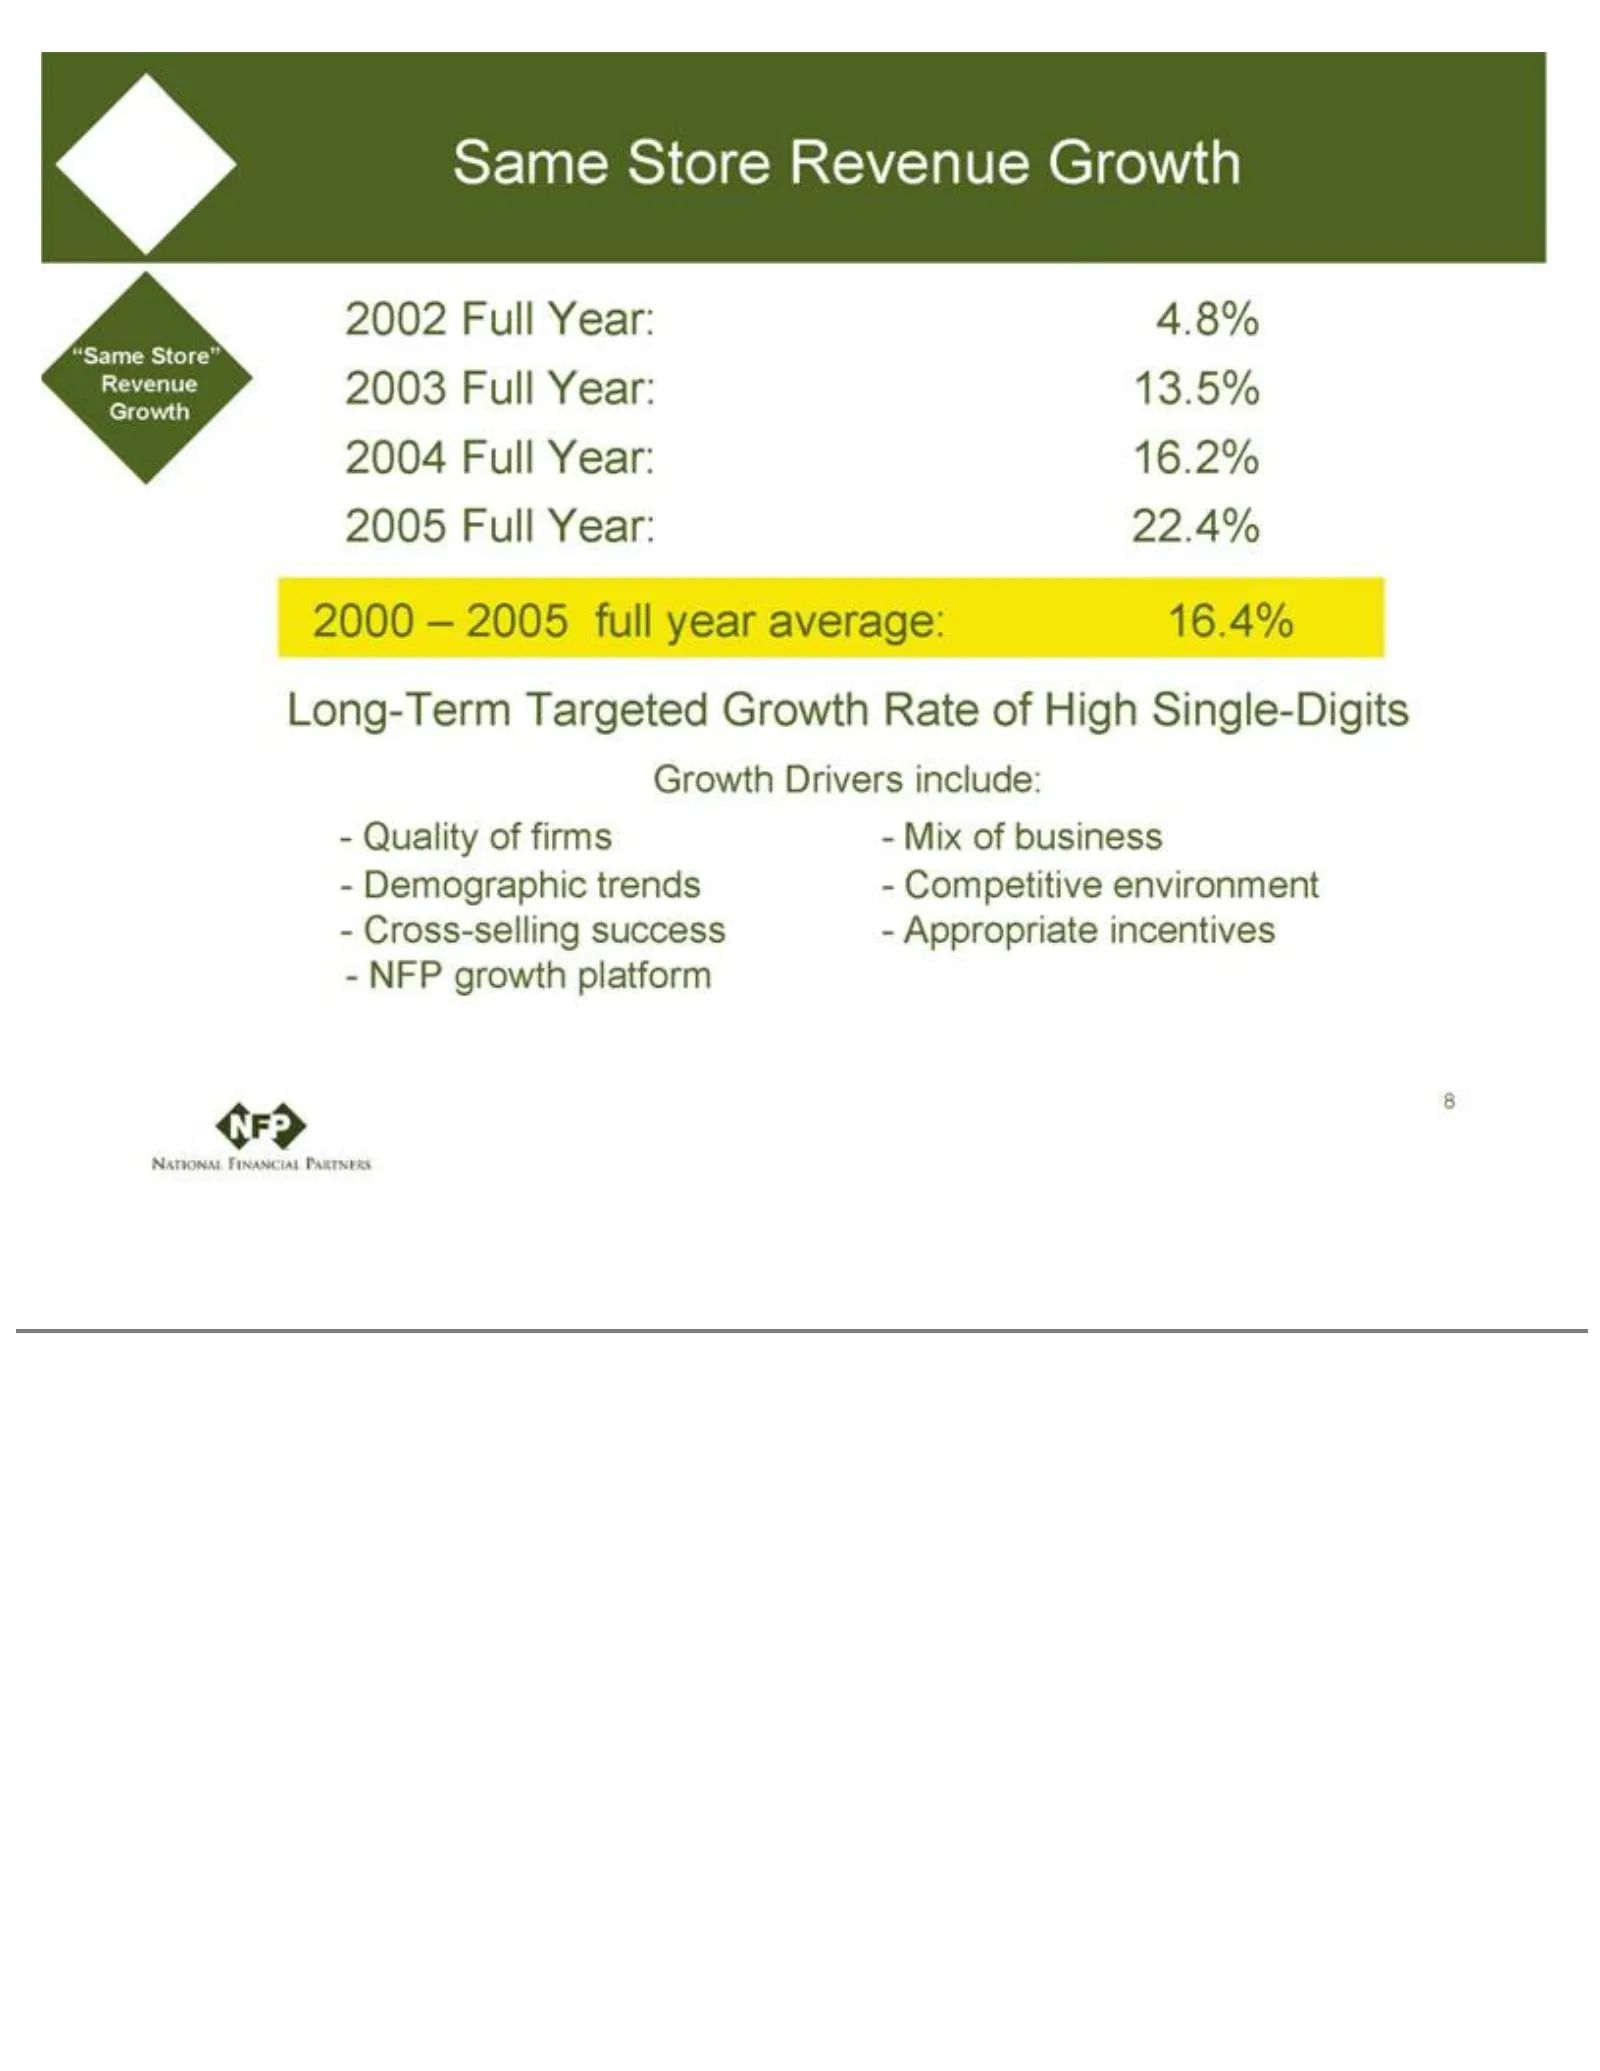
Slide 8: Same Store Revenue Growth
Same Store Revenue Growth Revenue Growth Growth Drivers 2002include: Full Year: Quality 4.8%of2003 firms Full MixYear: of business 13.5% 2004 Demographic Full Year trends 16.2% Competitive 2005 Full Year: environment 22.4% Long-Term Cross-selling Targeted success Growth Appropriate Rate of incentive
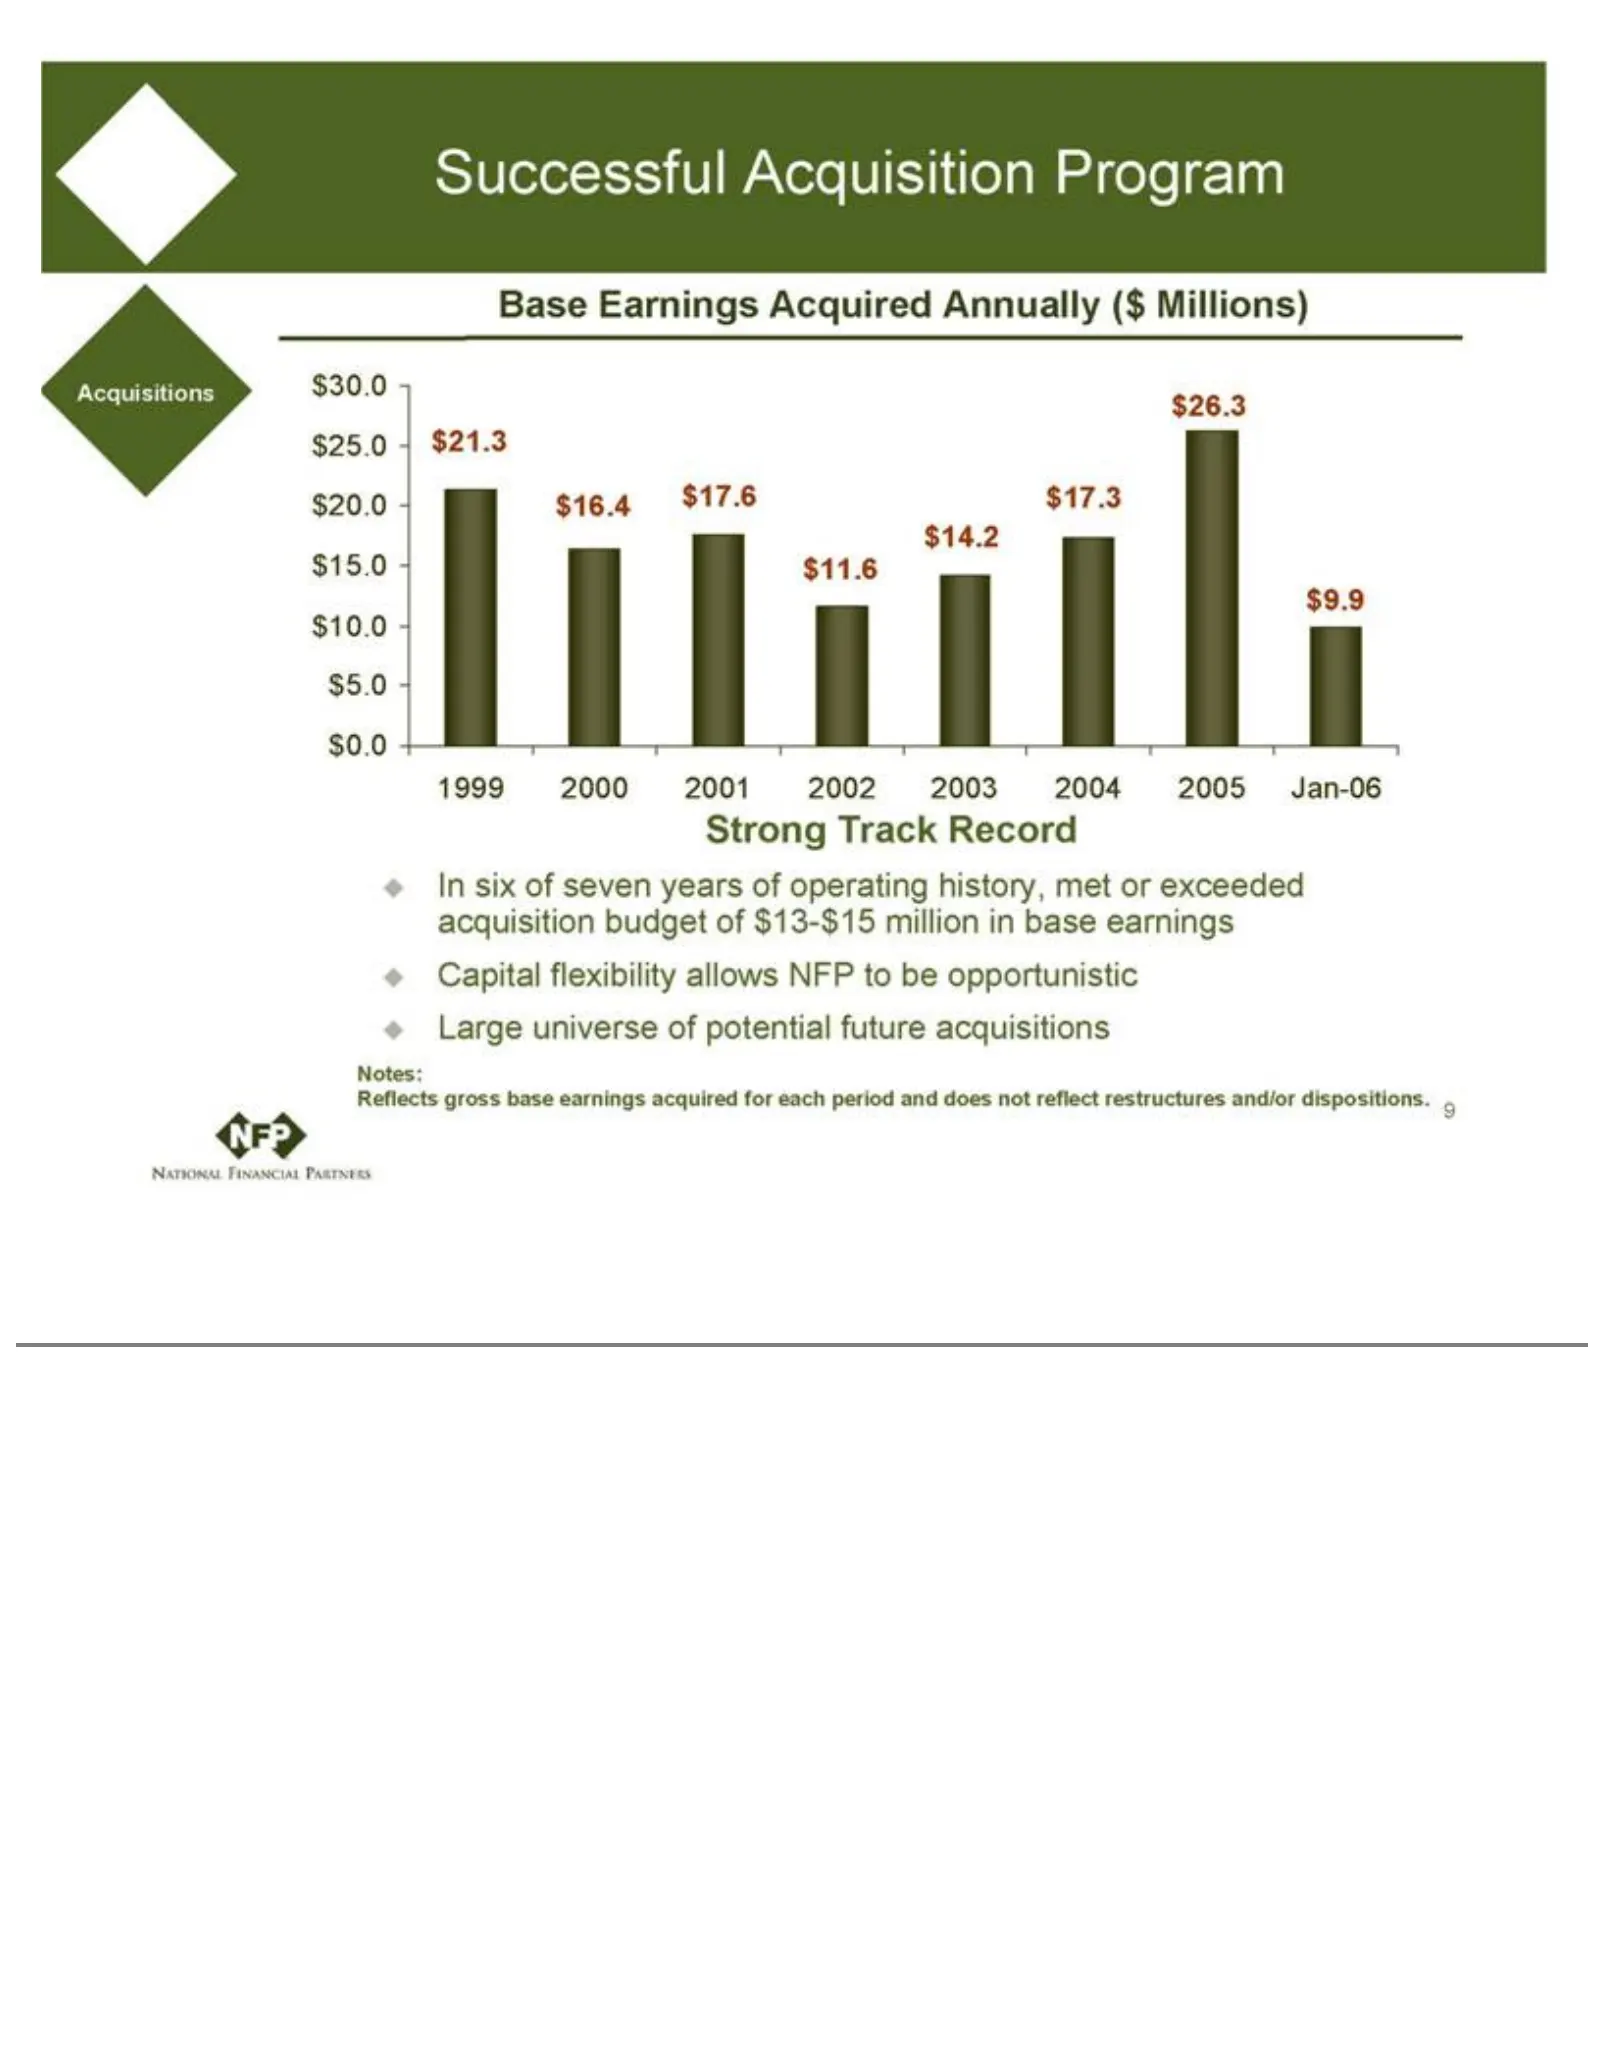
Slide 9: Successful Acquisition Program
Successful $11.6 to $14.2Acquisition be opportunistic $17.3 $26.3 Program Large Acquisitions universe $9.9 Strong Track Base of potential RecordEarnings future Acquired acquisitions In six of seven Annually Notes: years ($gross Reflects Millions) of operating base 1999 history, met2000 earnings 2001
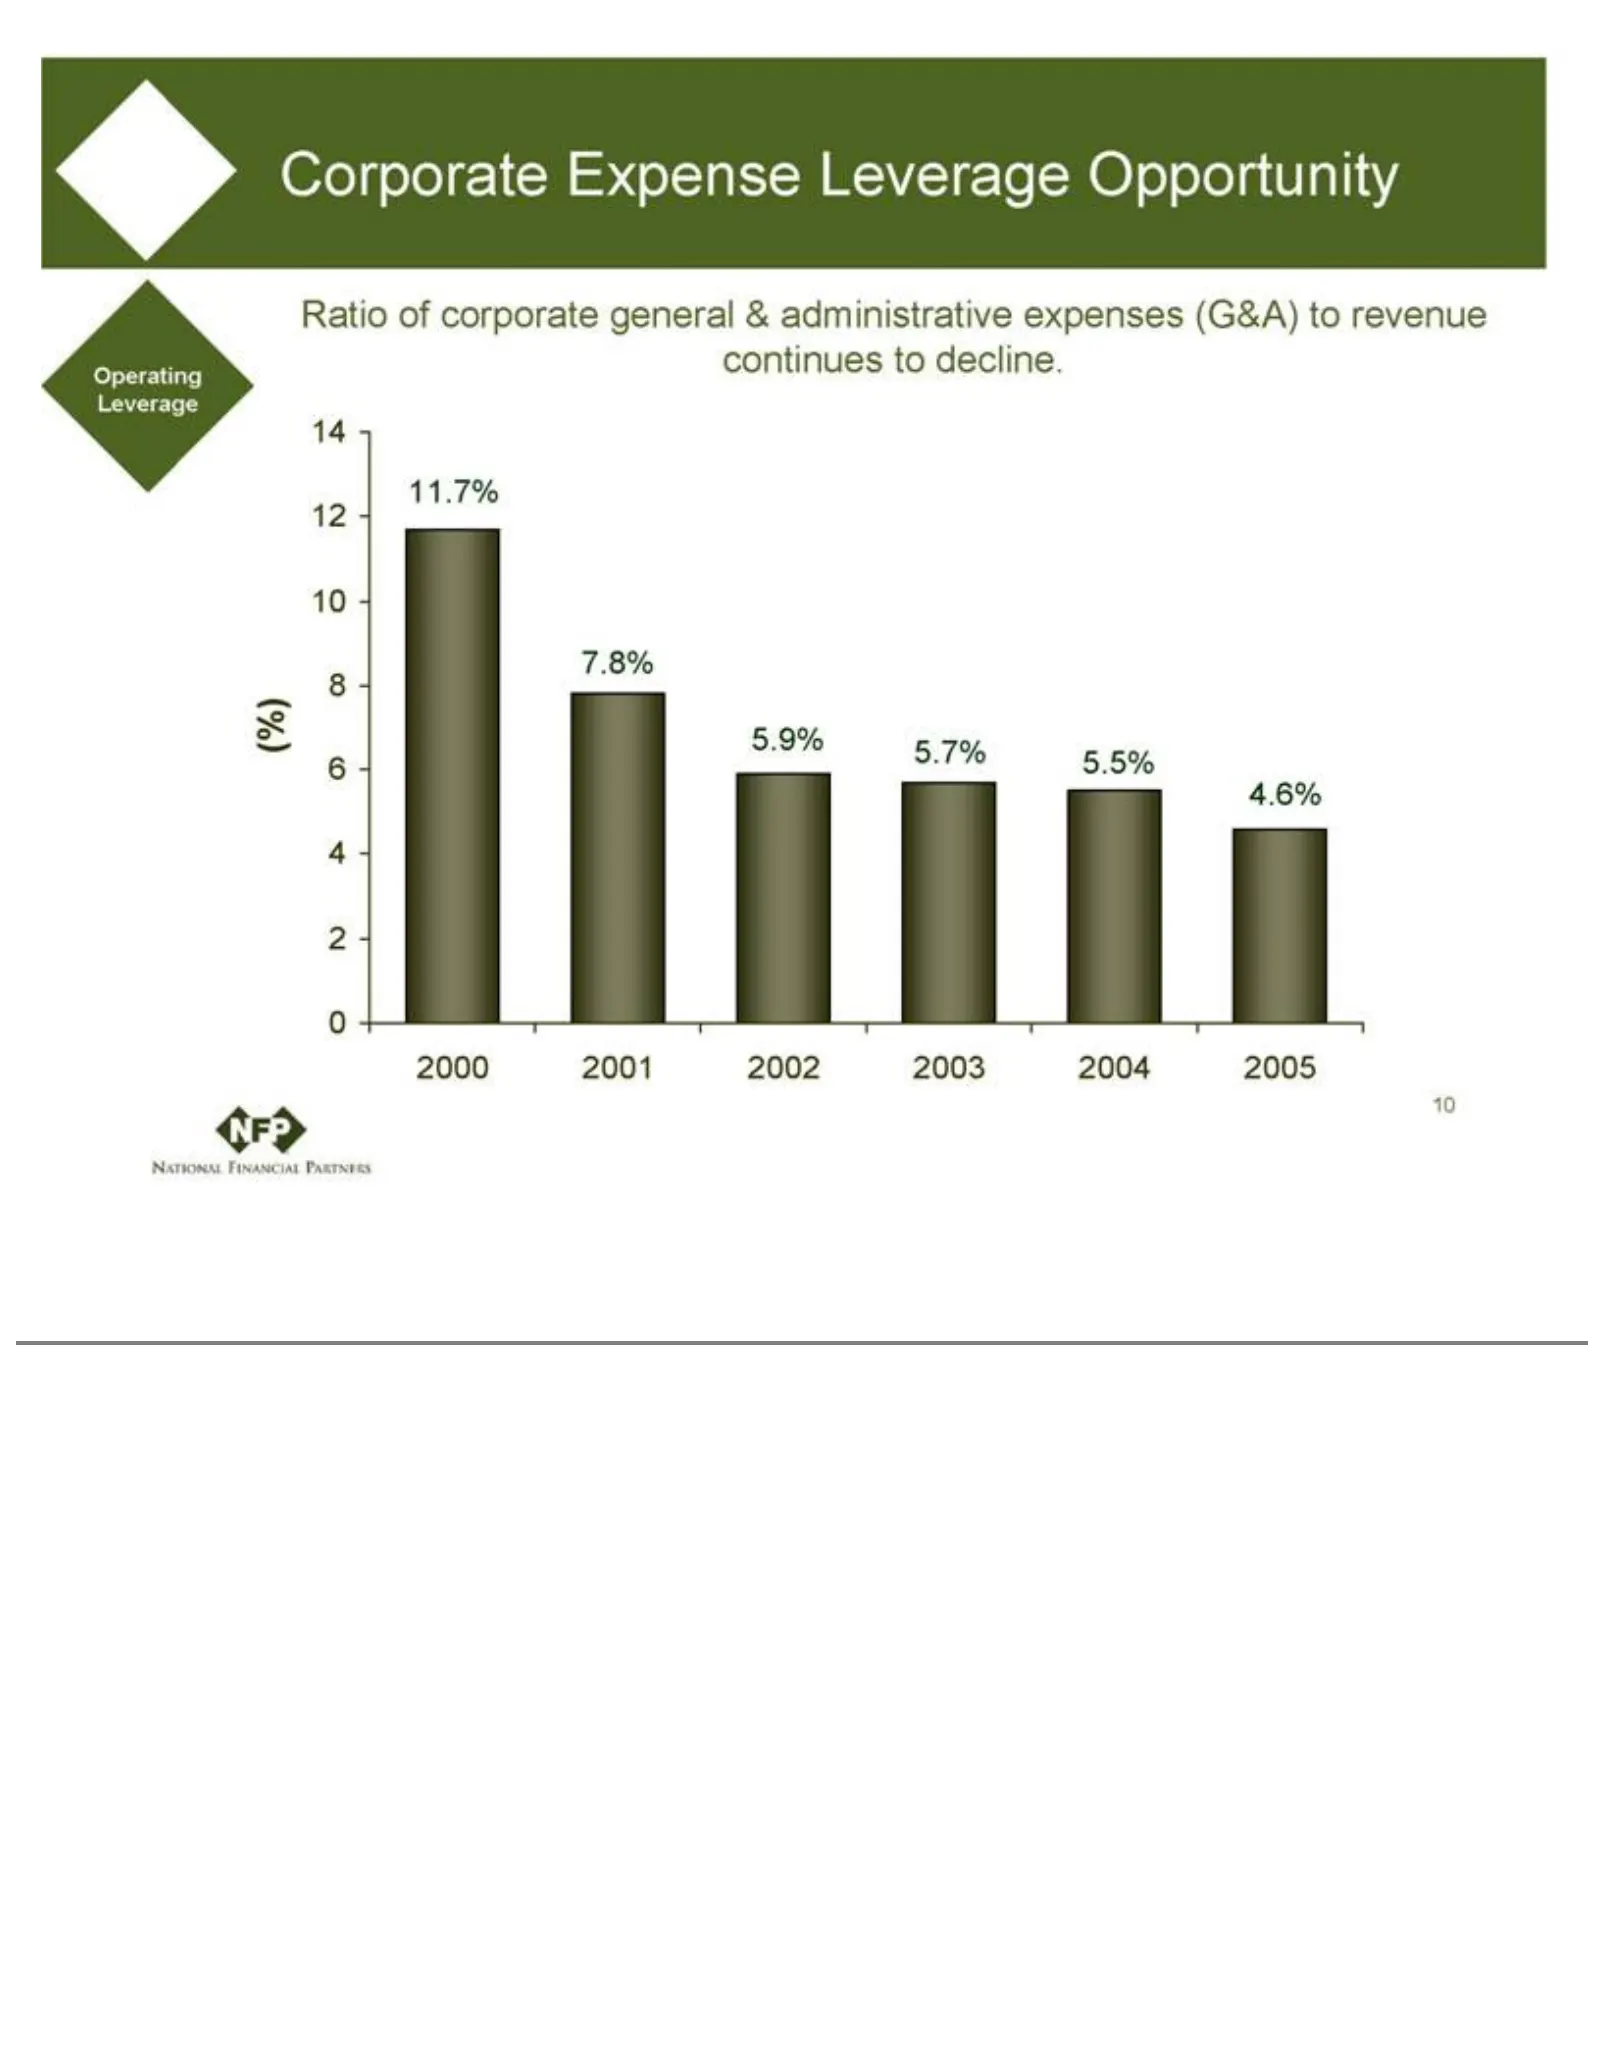
Slide 10: Corporate Expense Leverage
Corporate Expense Leverage 2004 2005 14 Opportunity 12 10 8 6 4 2Ratio 0 (%)of11.7% corporate 7.8%general & administrative 5.9% 5.7% 5.5% 4.6% 10 expenses (G&A) to revenue continues to decline. Operating Leverage 2001 2002 2003
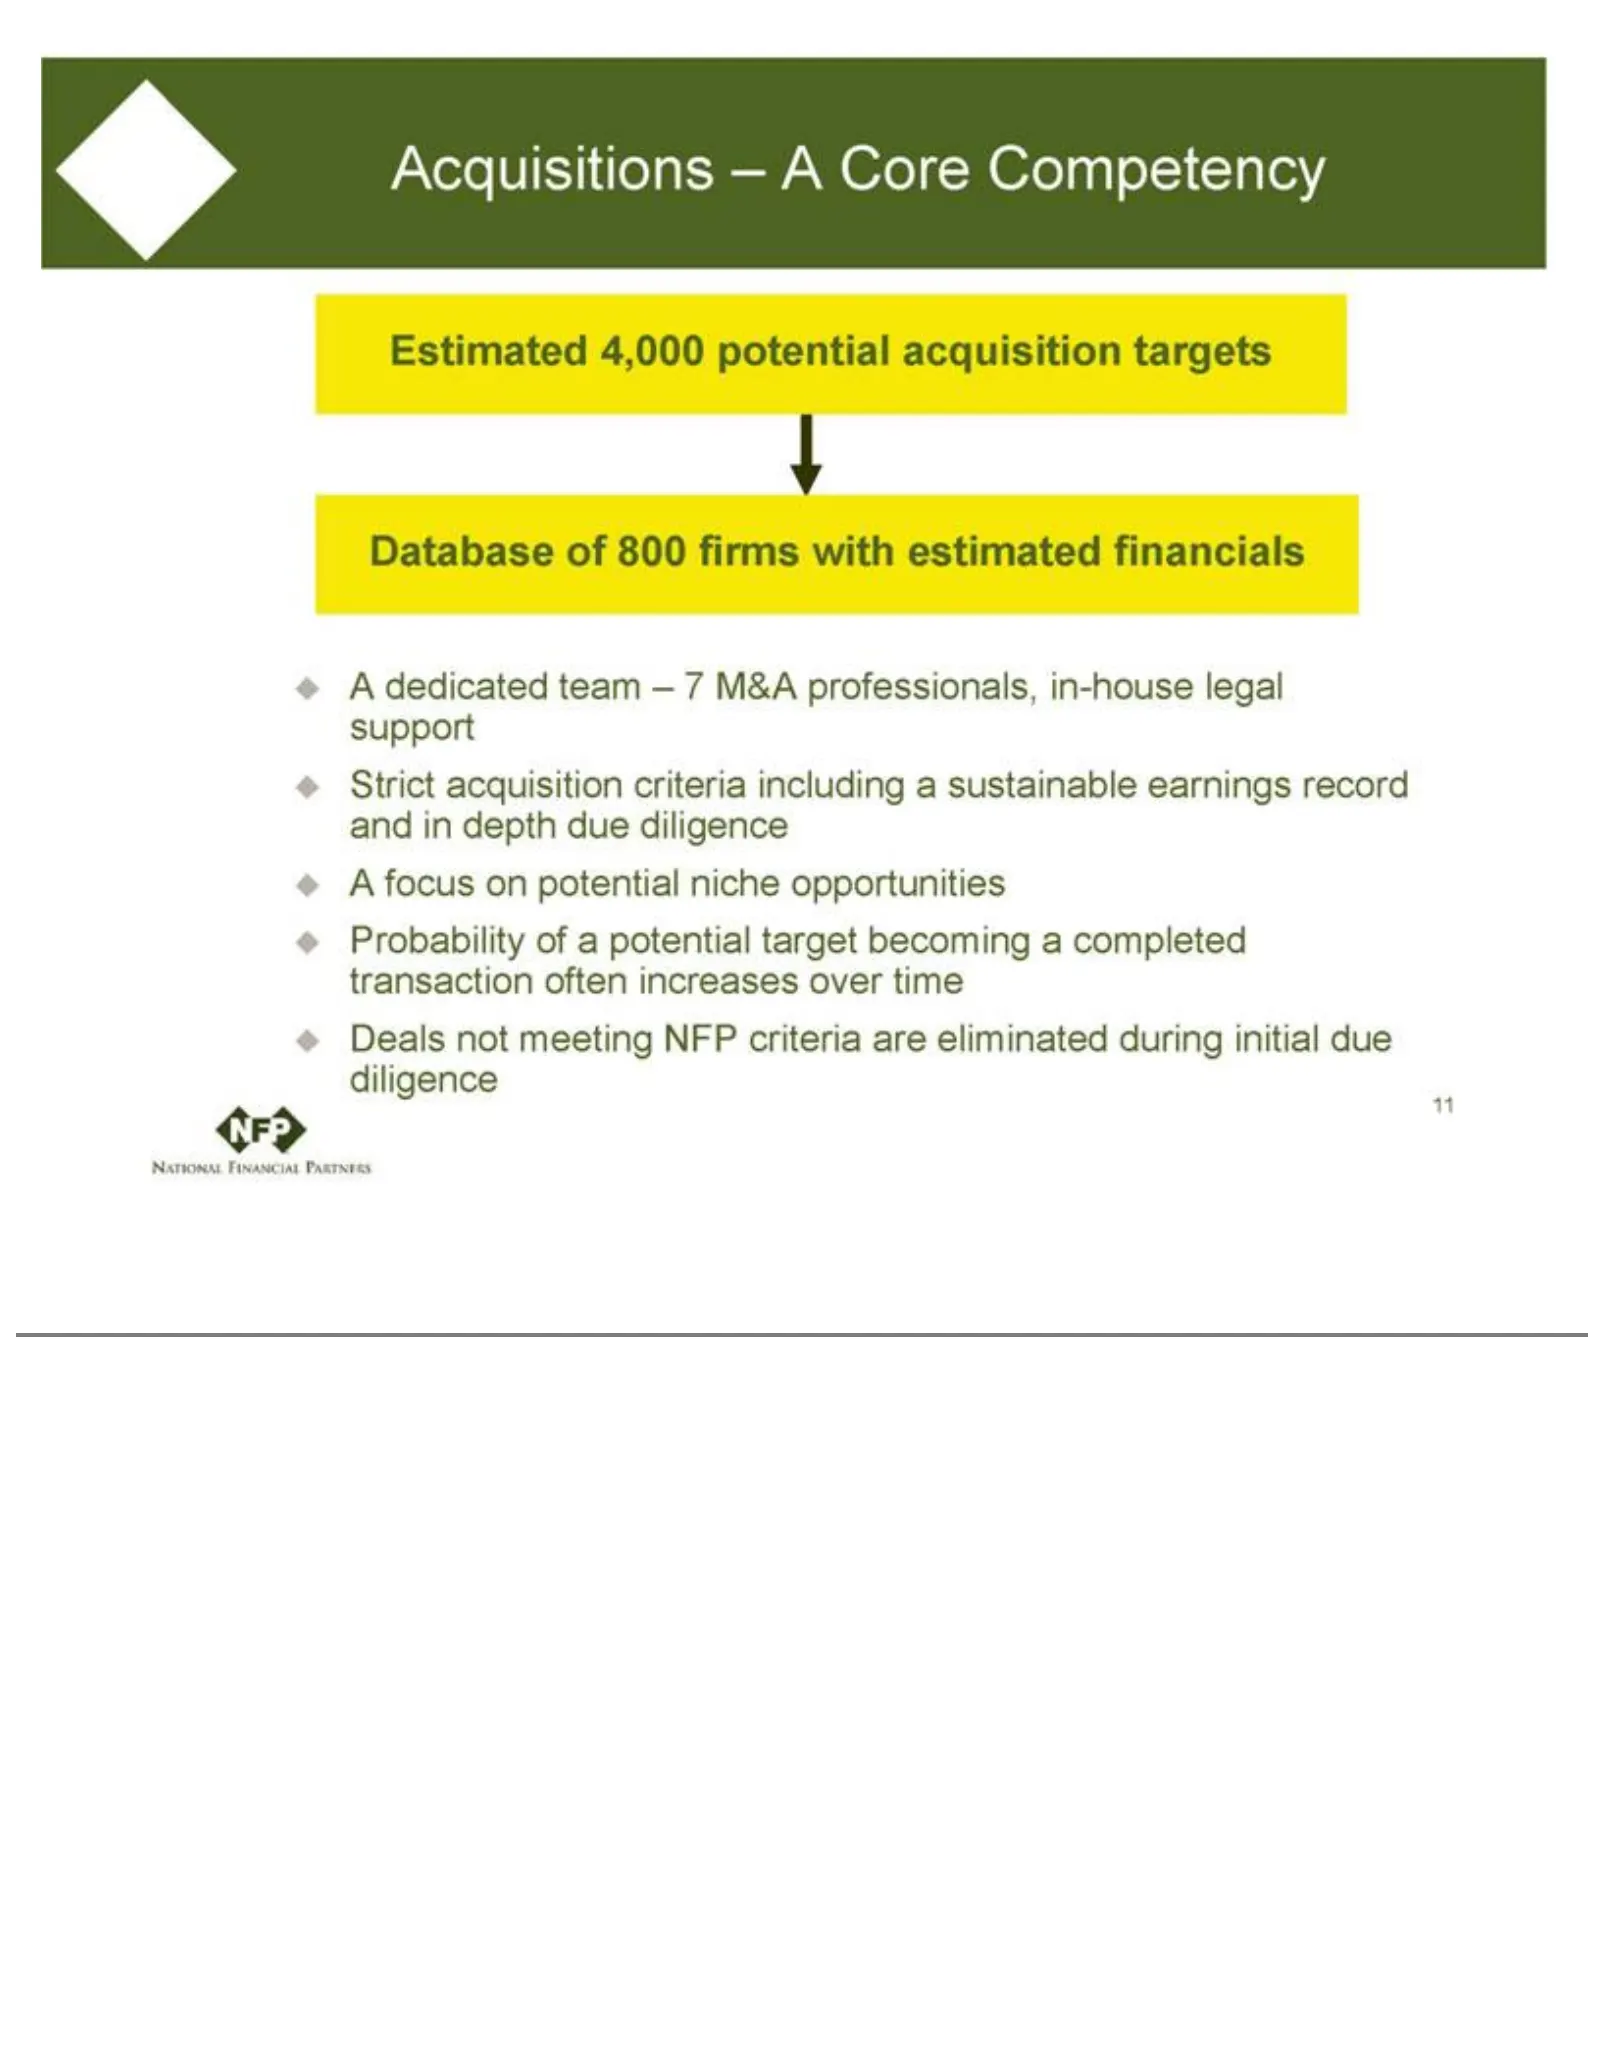
Slide 11: Acquisitions – A Core Competency
Acquisitions Strict often increases acquisition –A over Core criteria time Competency including Deals not ameeting Estimated sustainable NFP 4,000 earnings criteria potential are record eliminated acquisition and in depth during targets due initial Database diligence due diligence ofA800 focus firms
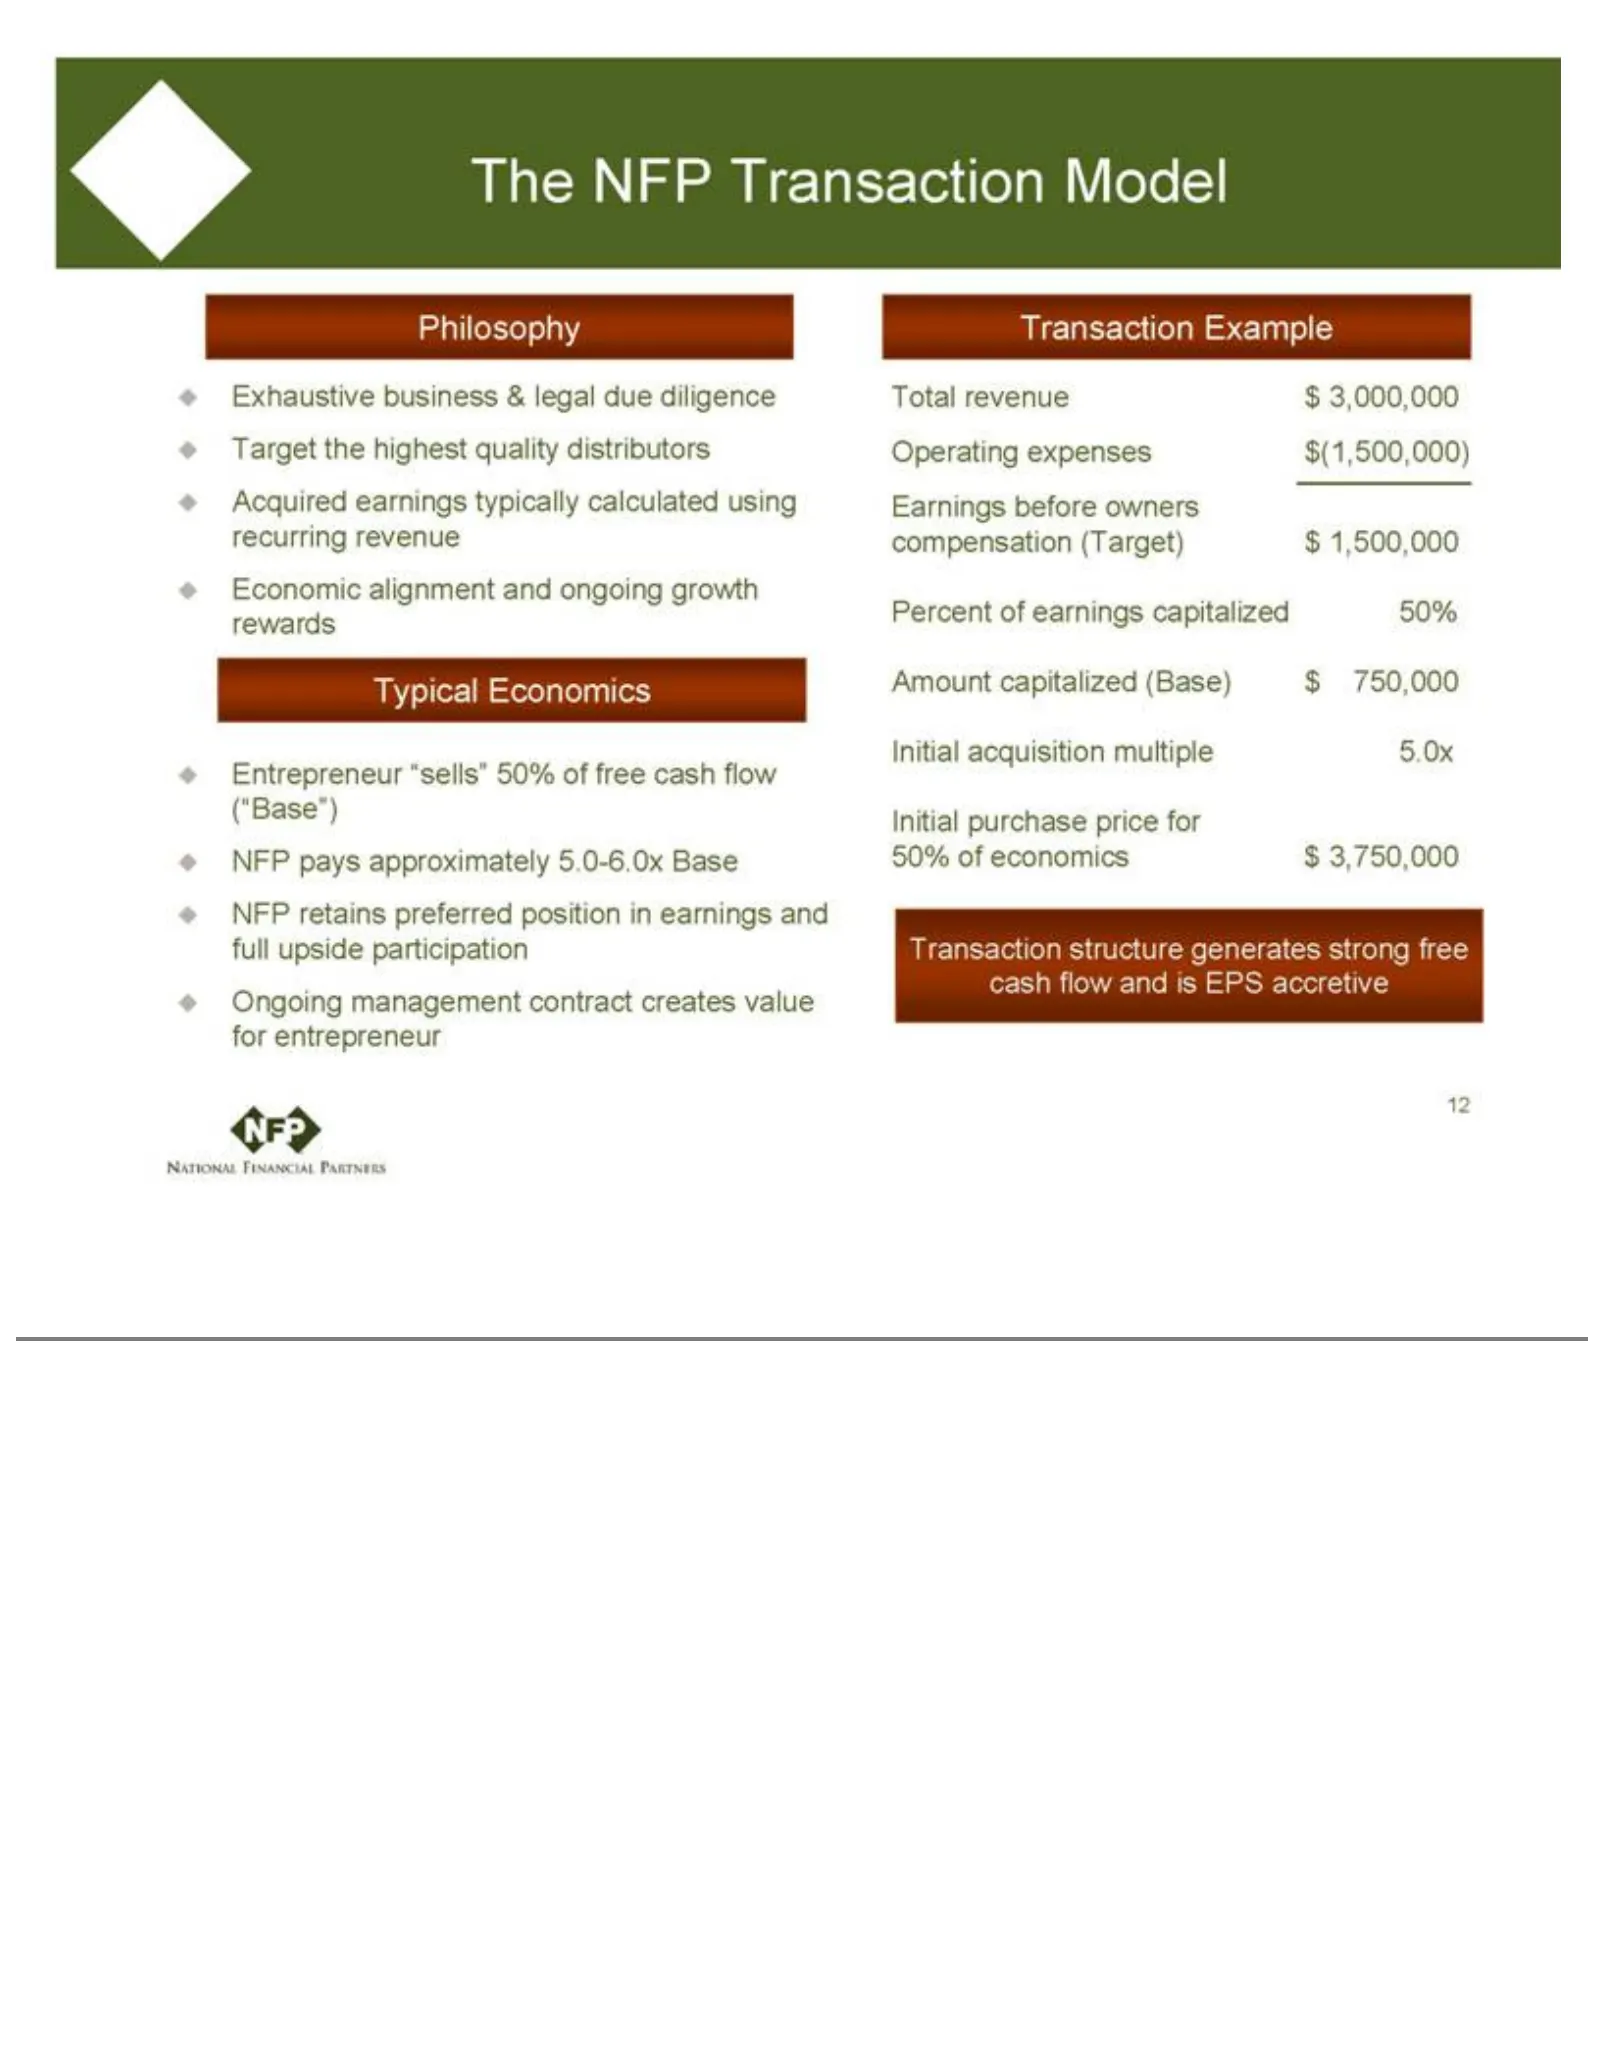
Slide 12: The Economic Transaction Model
The upside revenue full NFPEconomic generates 1,500,000 Transaction participation strong Percent alignment free of Model cashOngoing earningsPhilosophy flowand management ongoing capitalized and is EPSTransaction growth contract rewards accretive 50% Example Amount 12 creates Entrepreneur Exhaustive
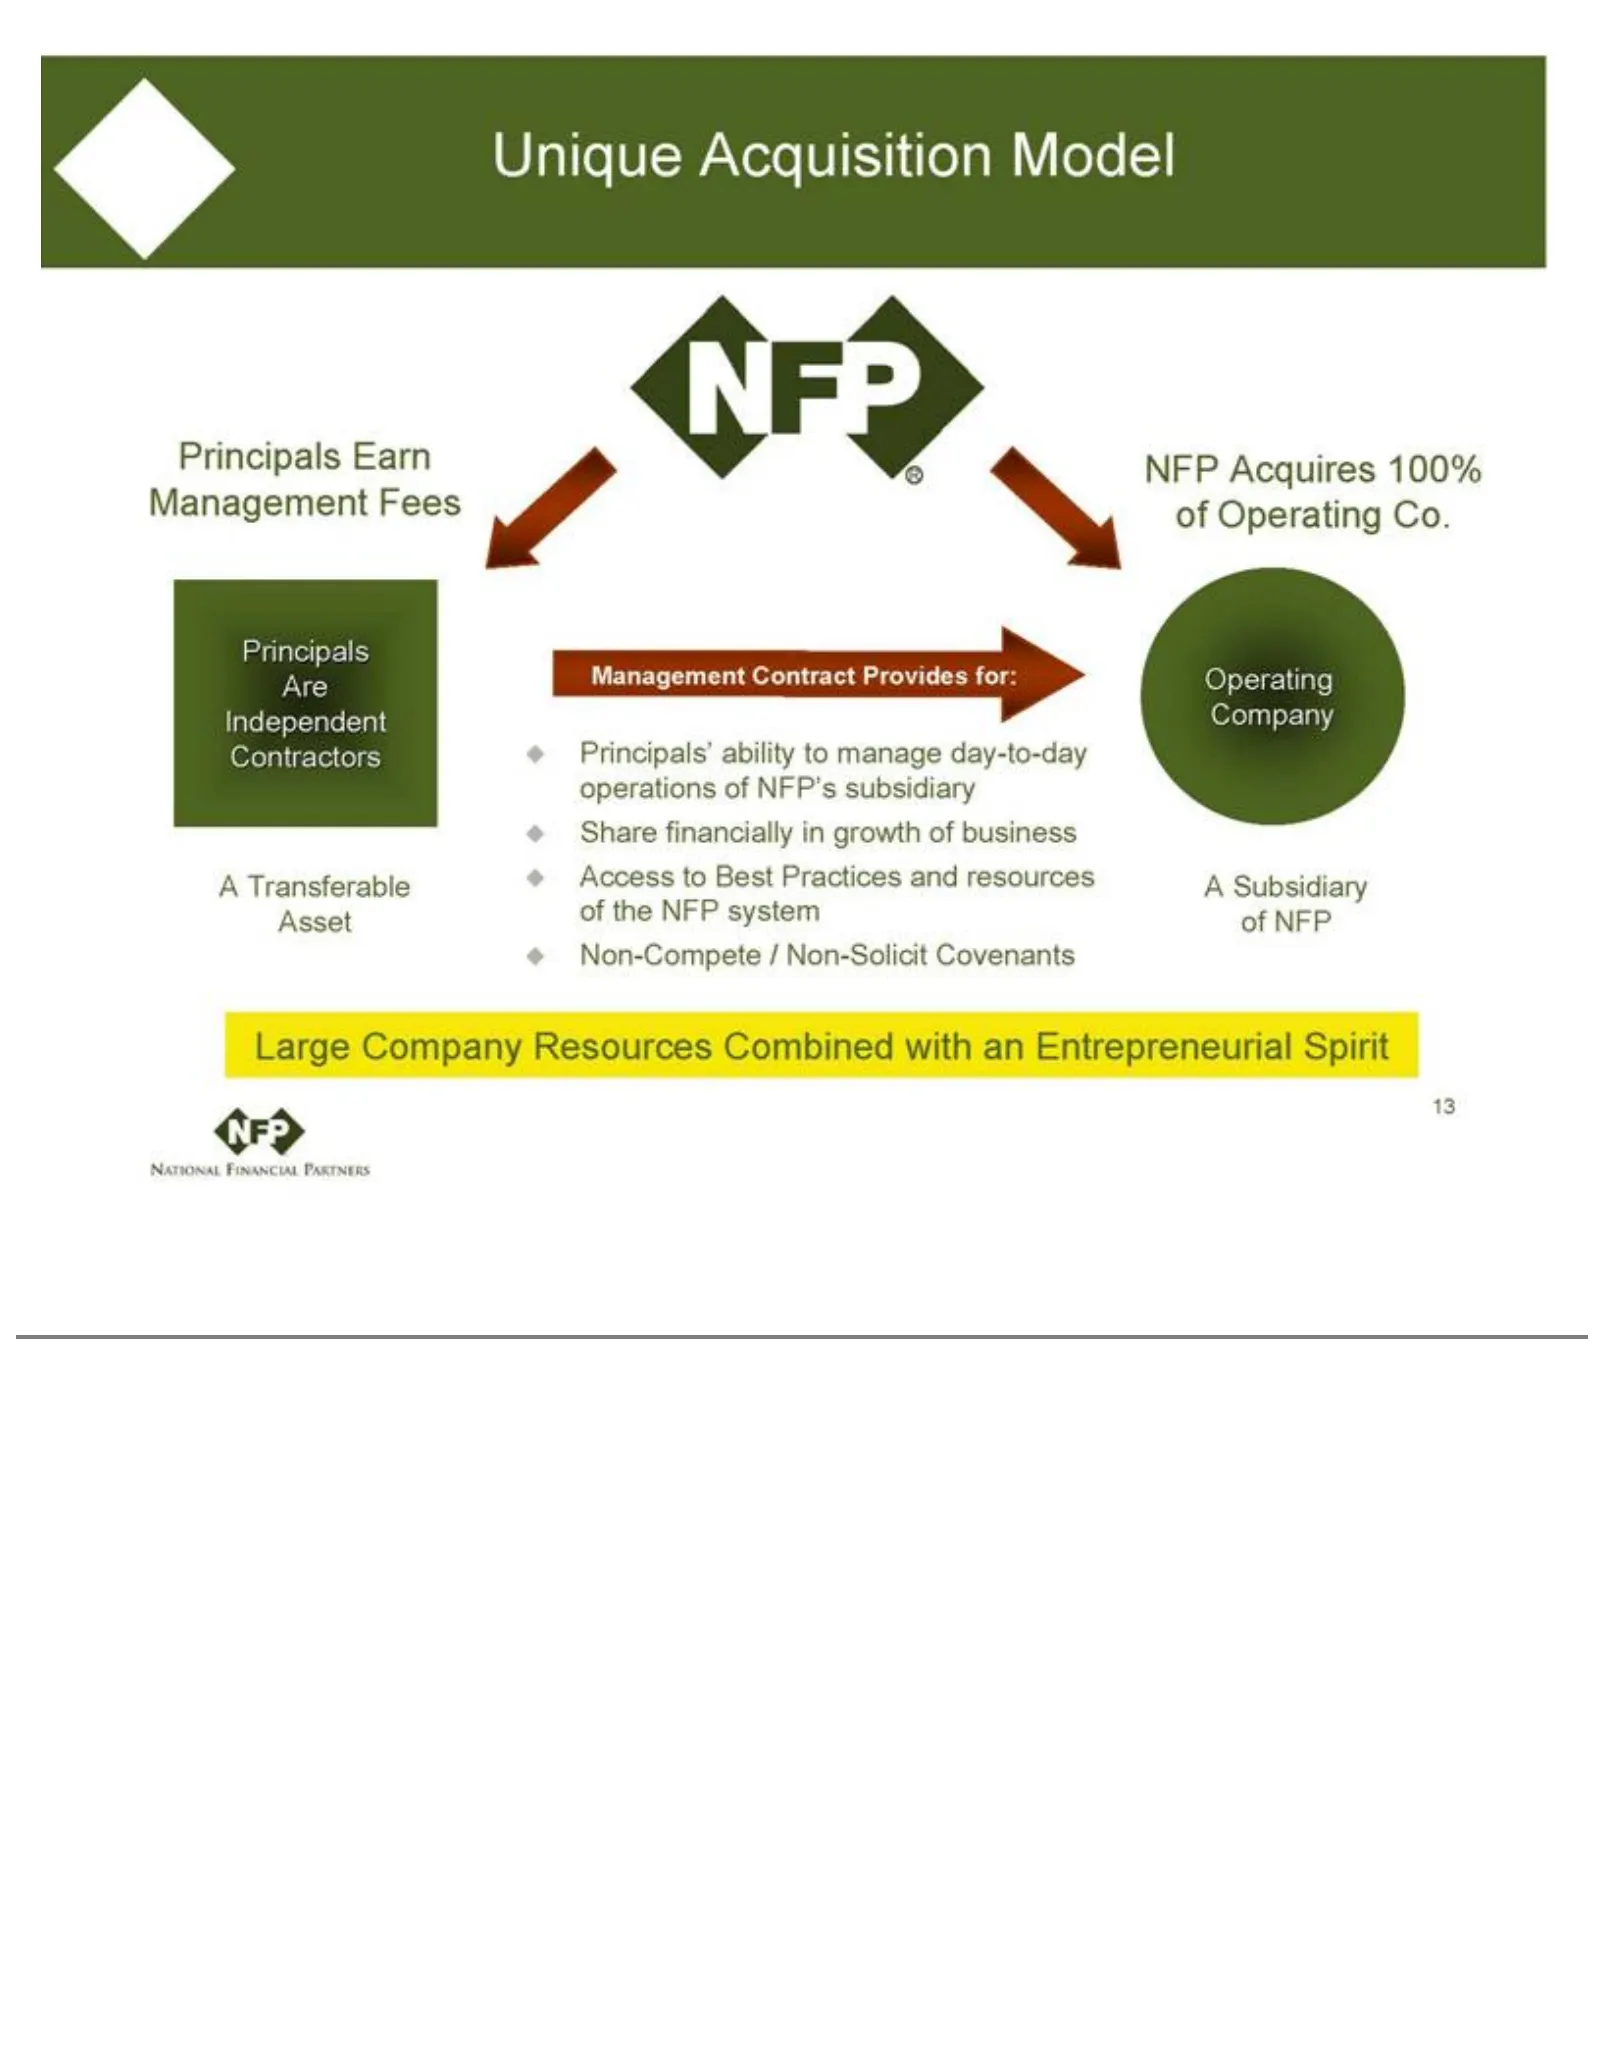
Slide 13: Unique Acquisition Model
Unique Acquisition Principals’ Covenants A ability Transferable toModel manage Asset Principals day-to-day A Subsidiary Earn operations Management of NFPofLarge NFP’s Fees Company subsidiary NFP Acquires Resources Share100% financially Combined of Operating in growth withCo. an of Entrepreneurial Pr
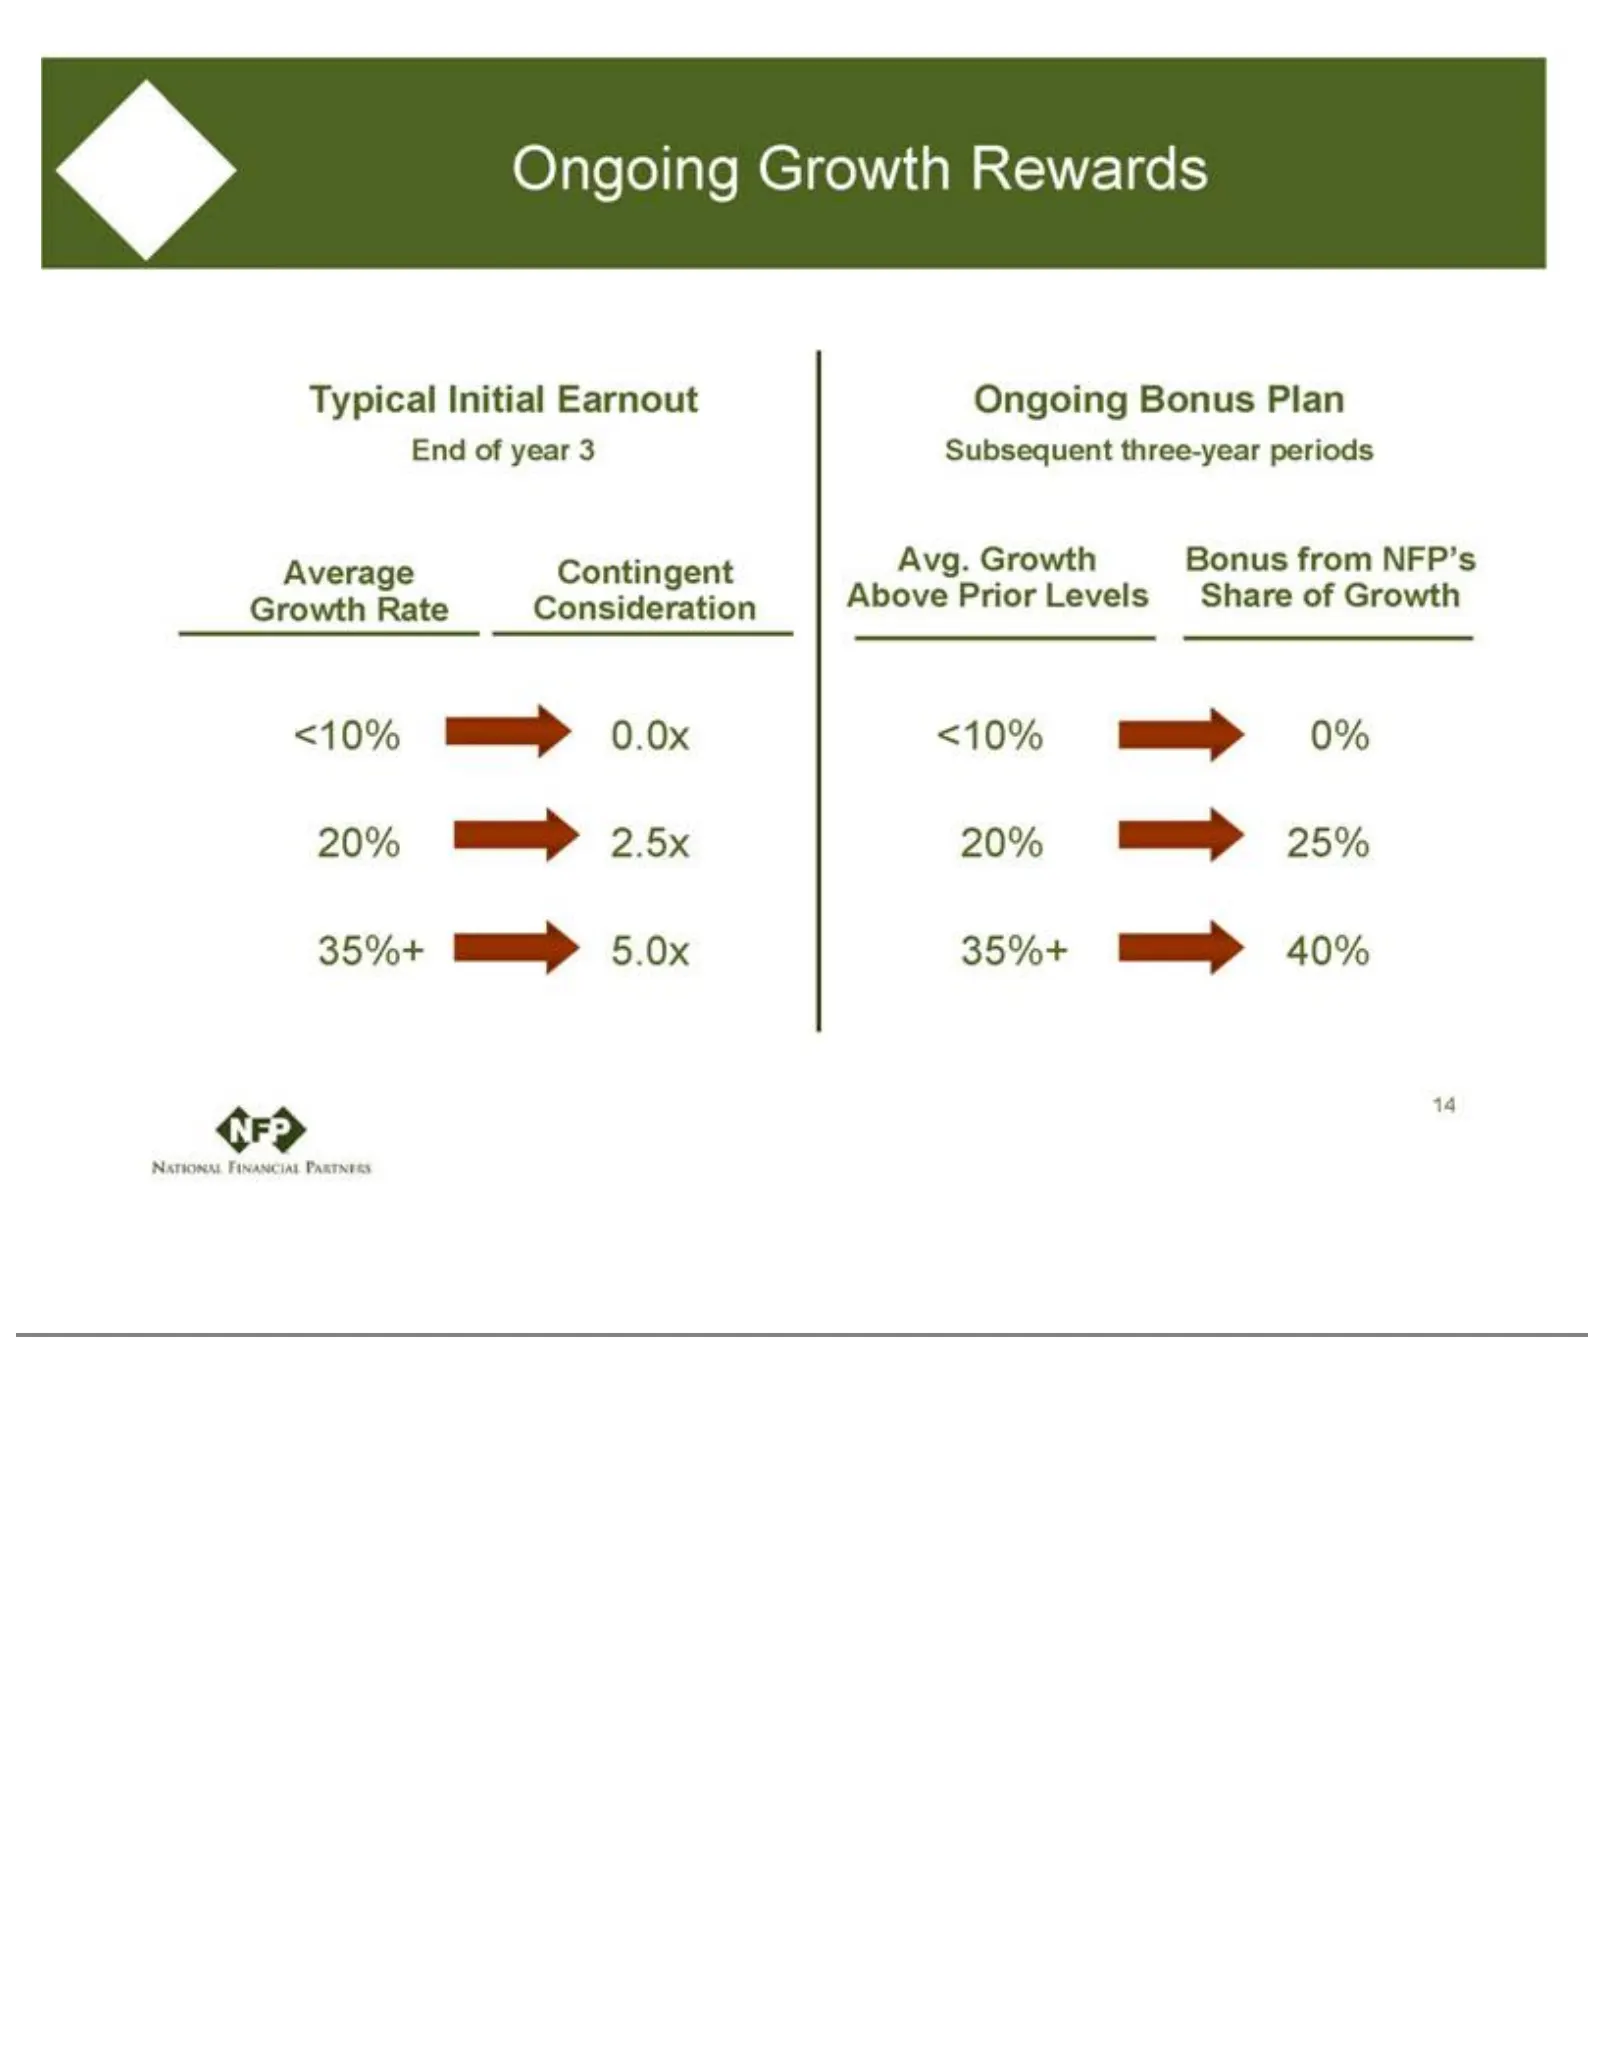
Slide 14: Ongoing Earnout Rewards Growth
Ongoing Avg. Growth Growth Above Rewards Prior Levels TypicalBonus Initialfrom Earnout NFP’s End Share of year of Growth 3 Average <10% Growth 0% 20% Rate25% Contingent 35%+ 40%Consideration 14 <10% 0.0x 20% 2.5x 35%+ 5.0x Ongoing Bonus Plan Subsequent three-year periods
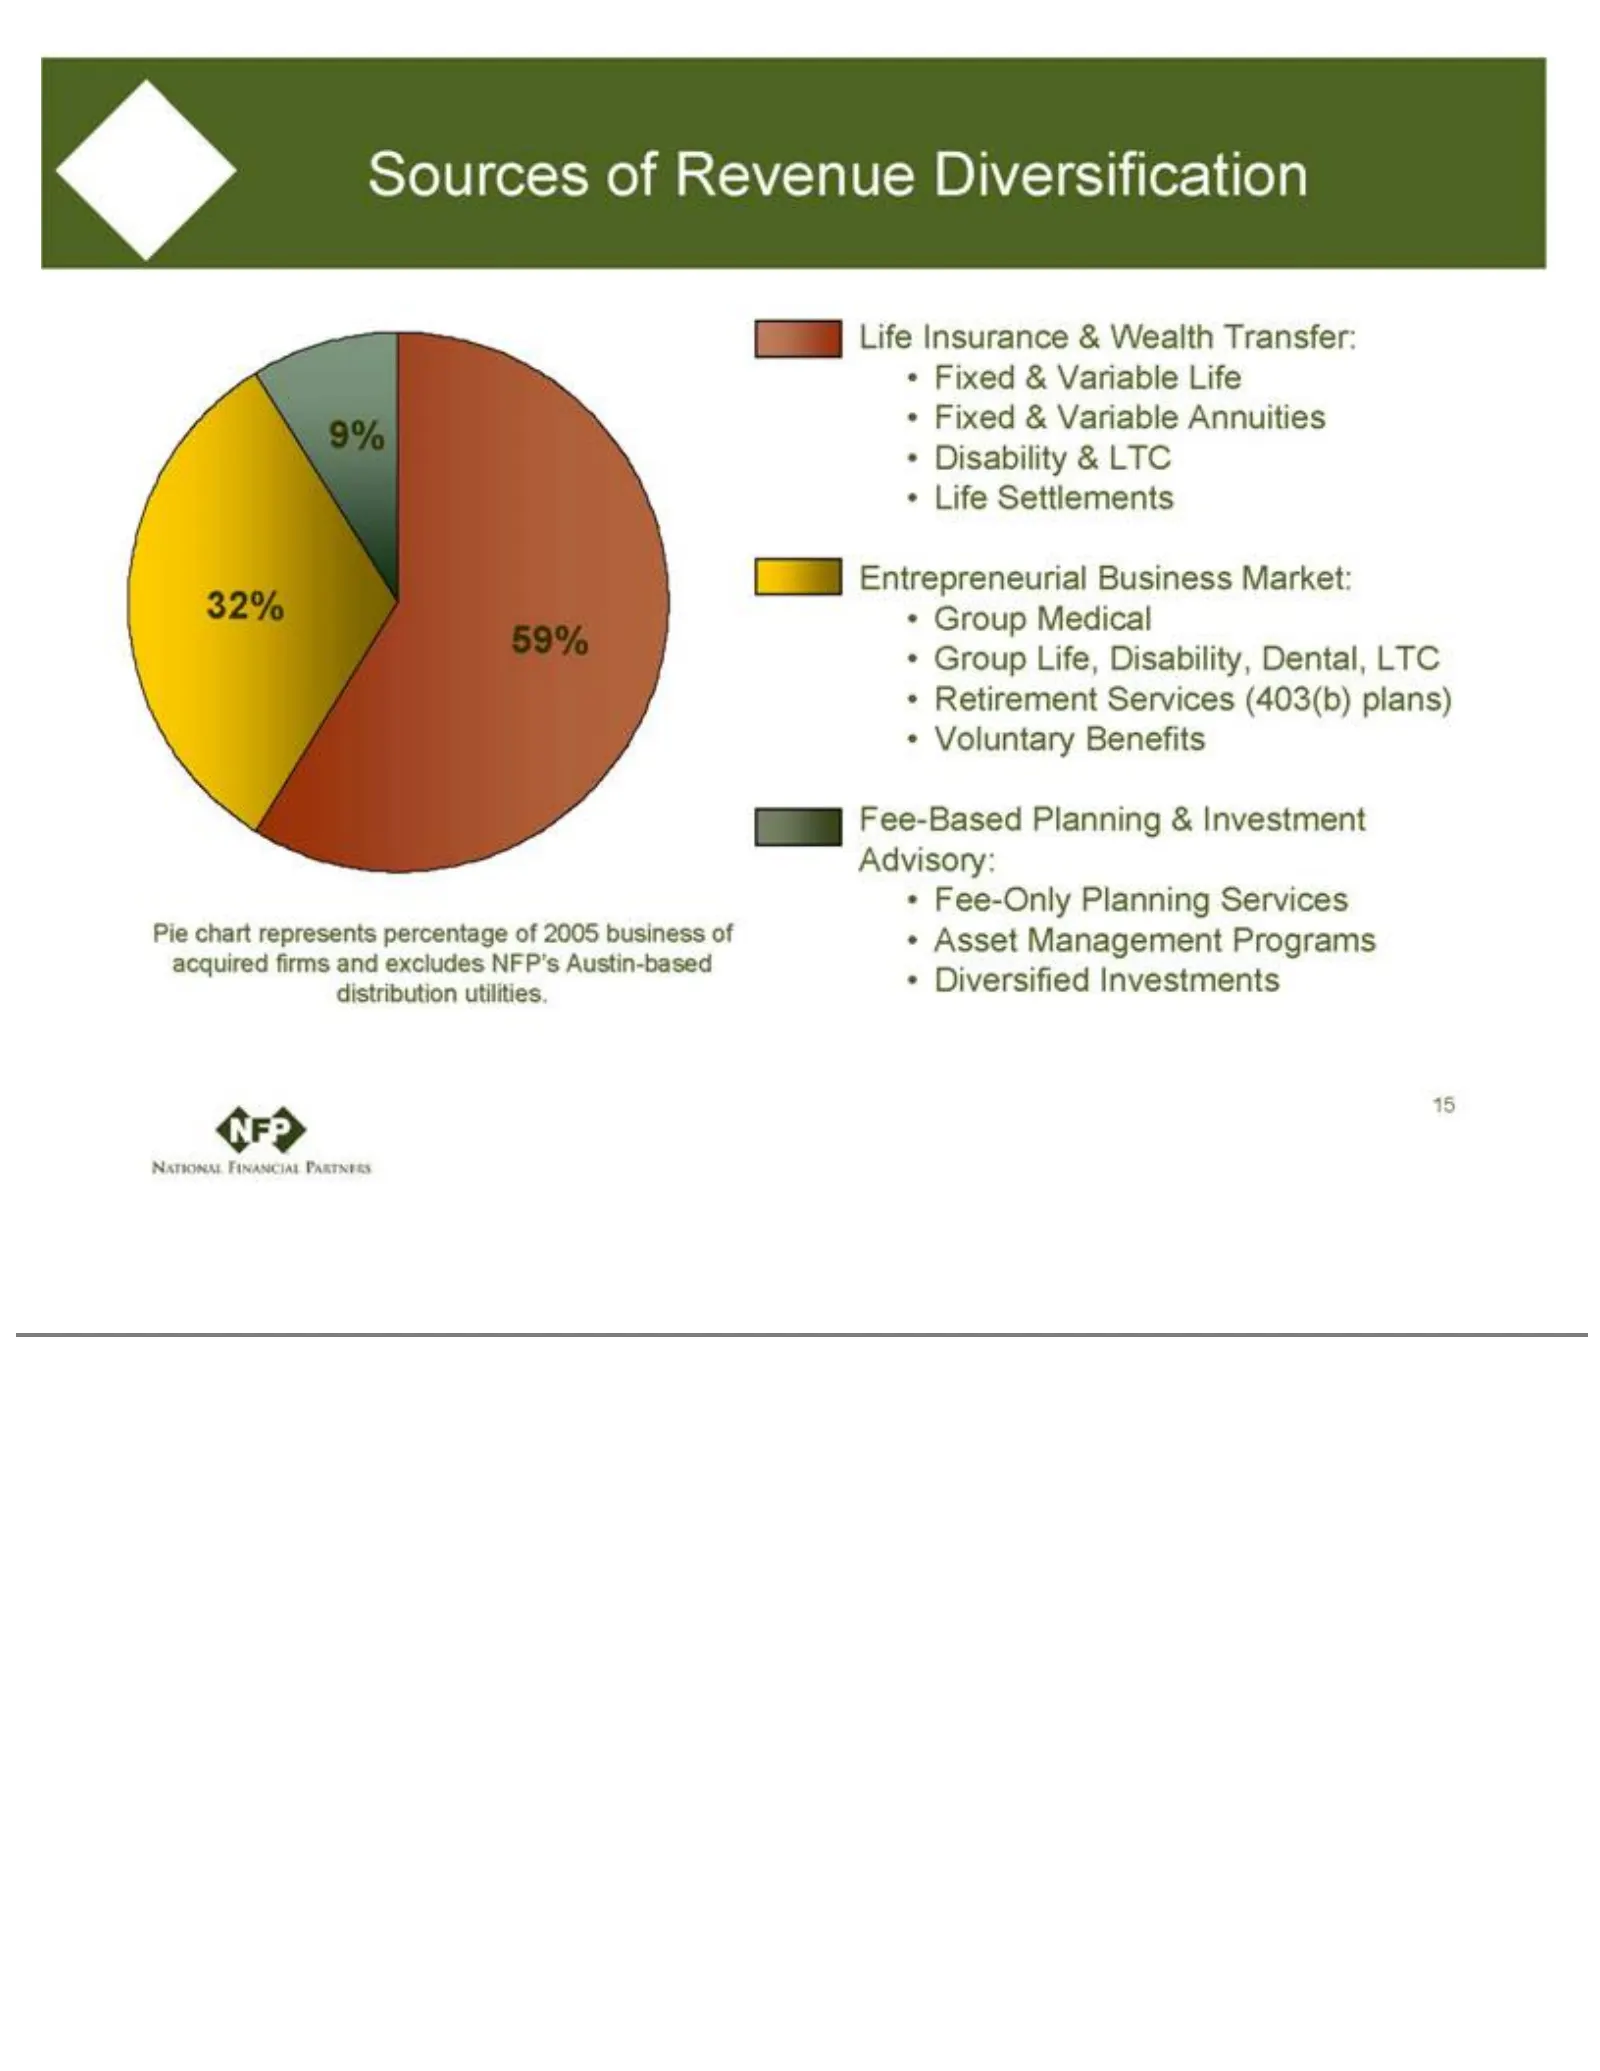
Slide 15: Diversified Sources of Revenue
Sources of Medical ProgramsGroup Diversified Revenue Life,Diversification Disability, InvestmentsDental, Pie Life chart LTC Insurance represents Retirement & Wealth percentage Services Transfer: (403(b) of 2005 Fixed plans) business & Variable Voluntary of acquired Life Benefits Fixed firms& Fee-Bas
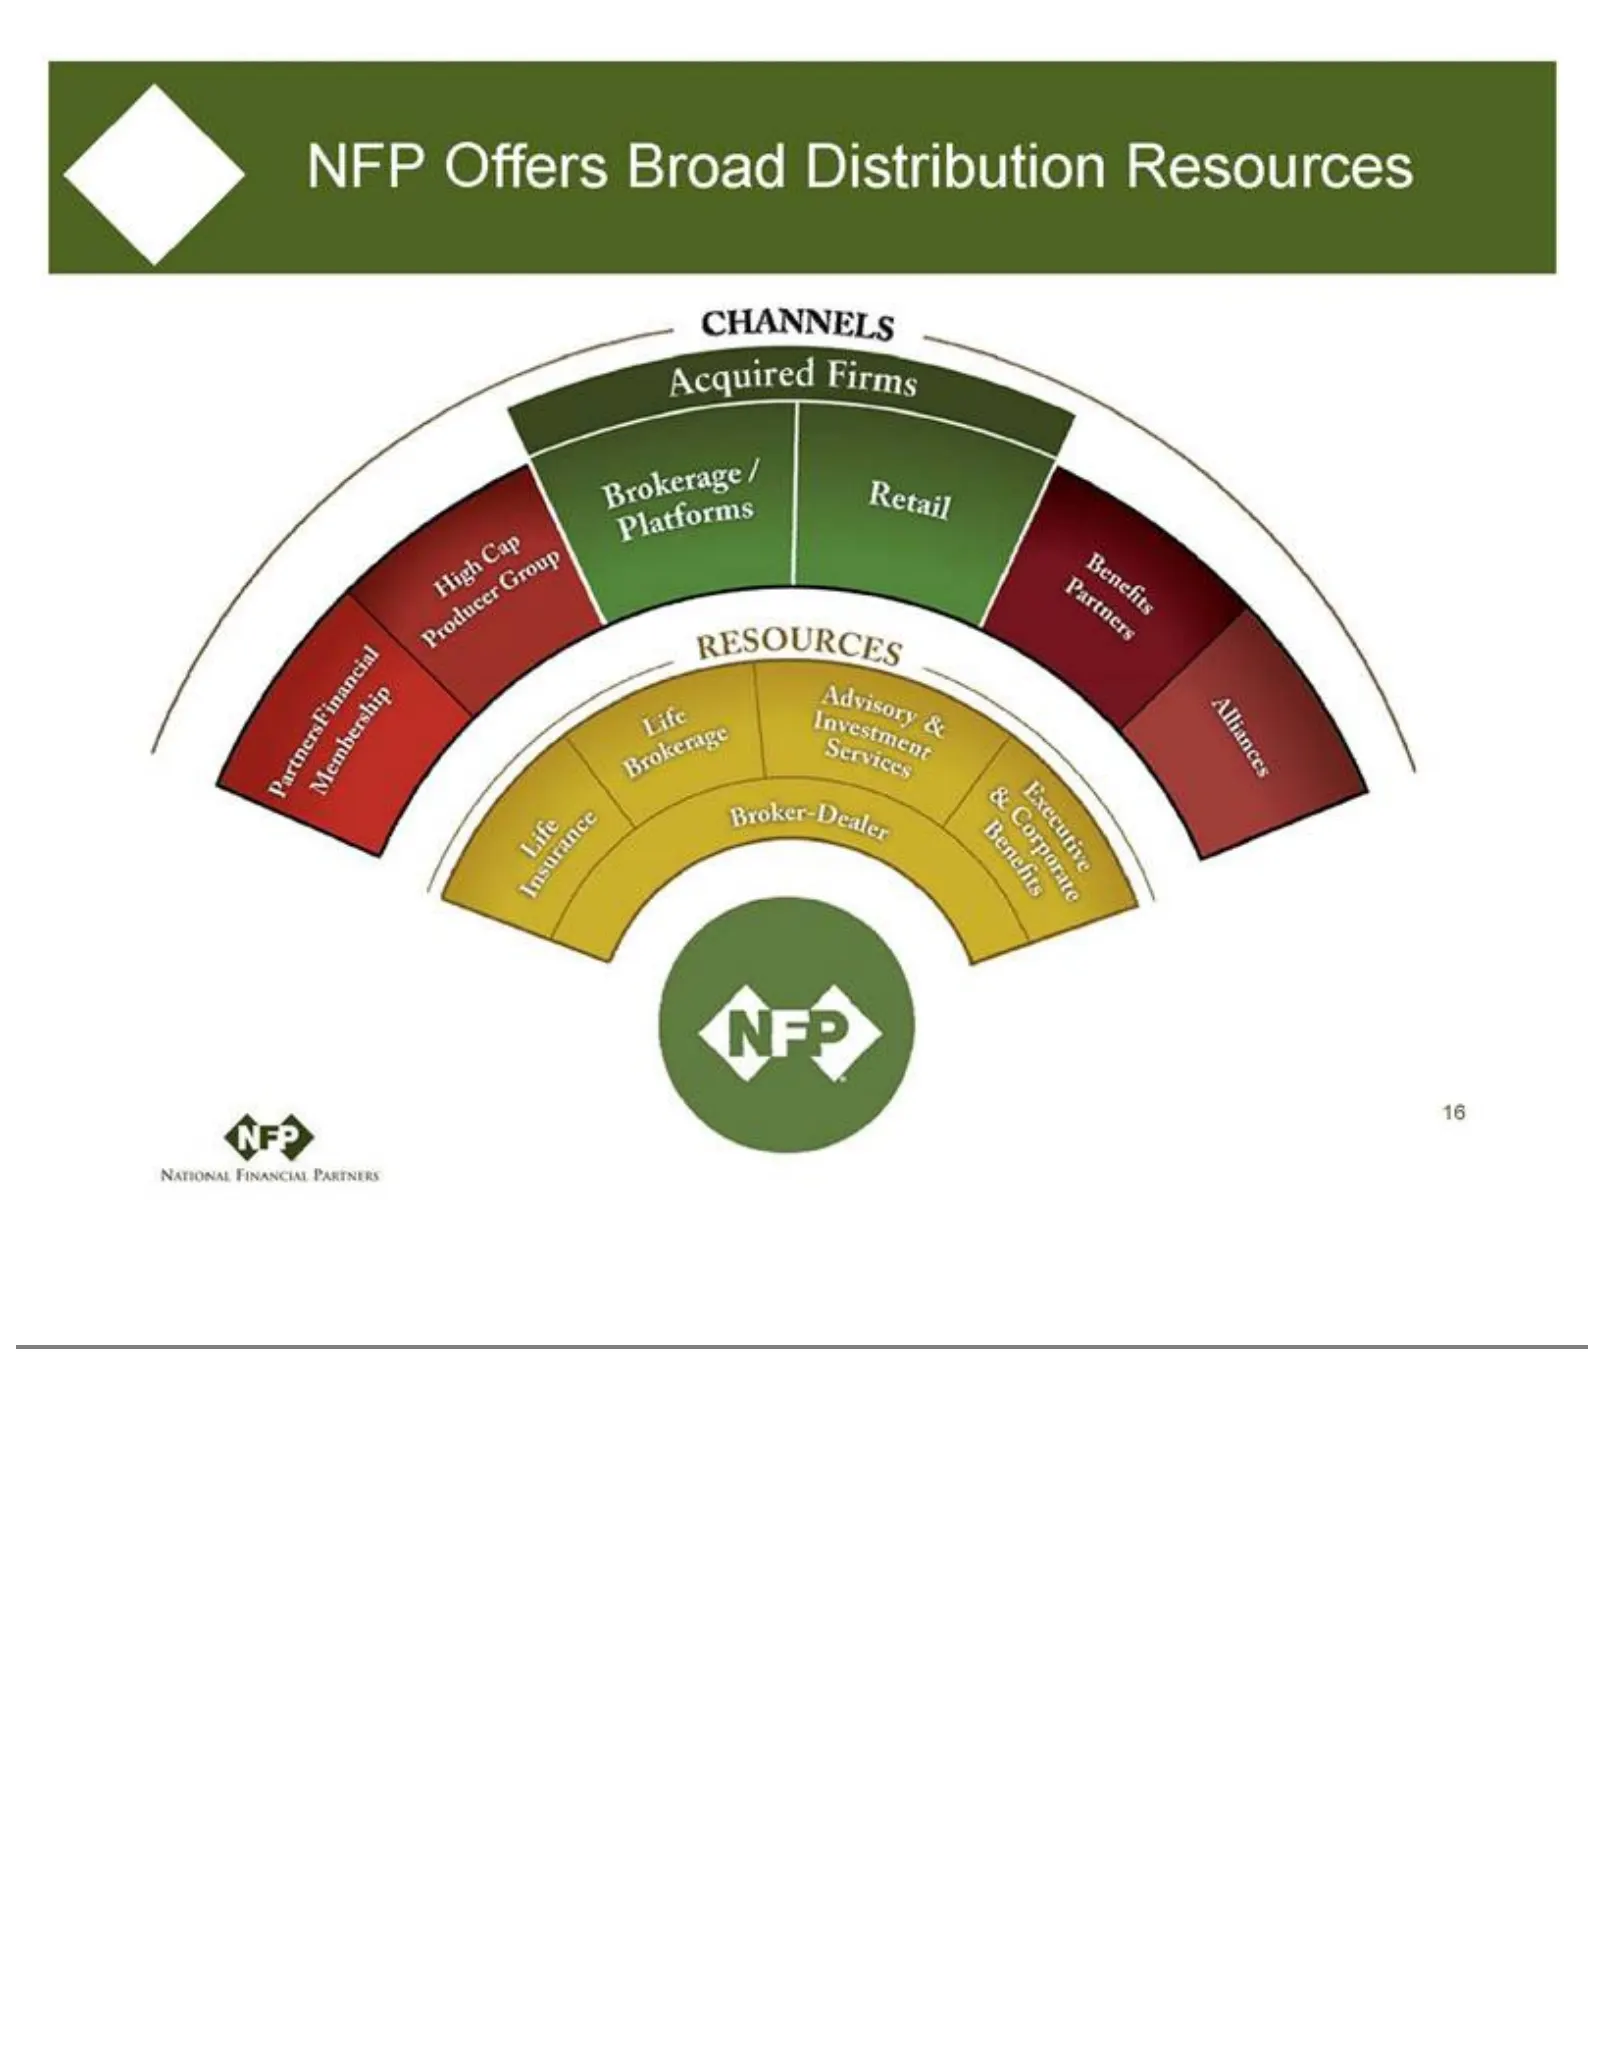
Slide 16: NFP Offers Broad Life Insurance Distribution
NFP Offers BroadLife RESOURCES Distribution InsuranceResources CHANNELS Life Brokerage AdvisoryAcquired firms PartnersFinancial & Investment Services ExecutiveMembership & CorporateHigh Cap Producer Benefits Group16Brokerage / Platforms Retail Benefits Partners Alliances Broker-Dealer
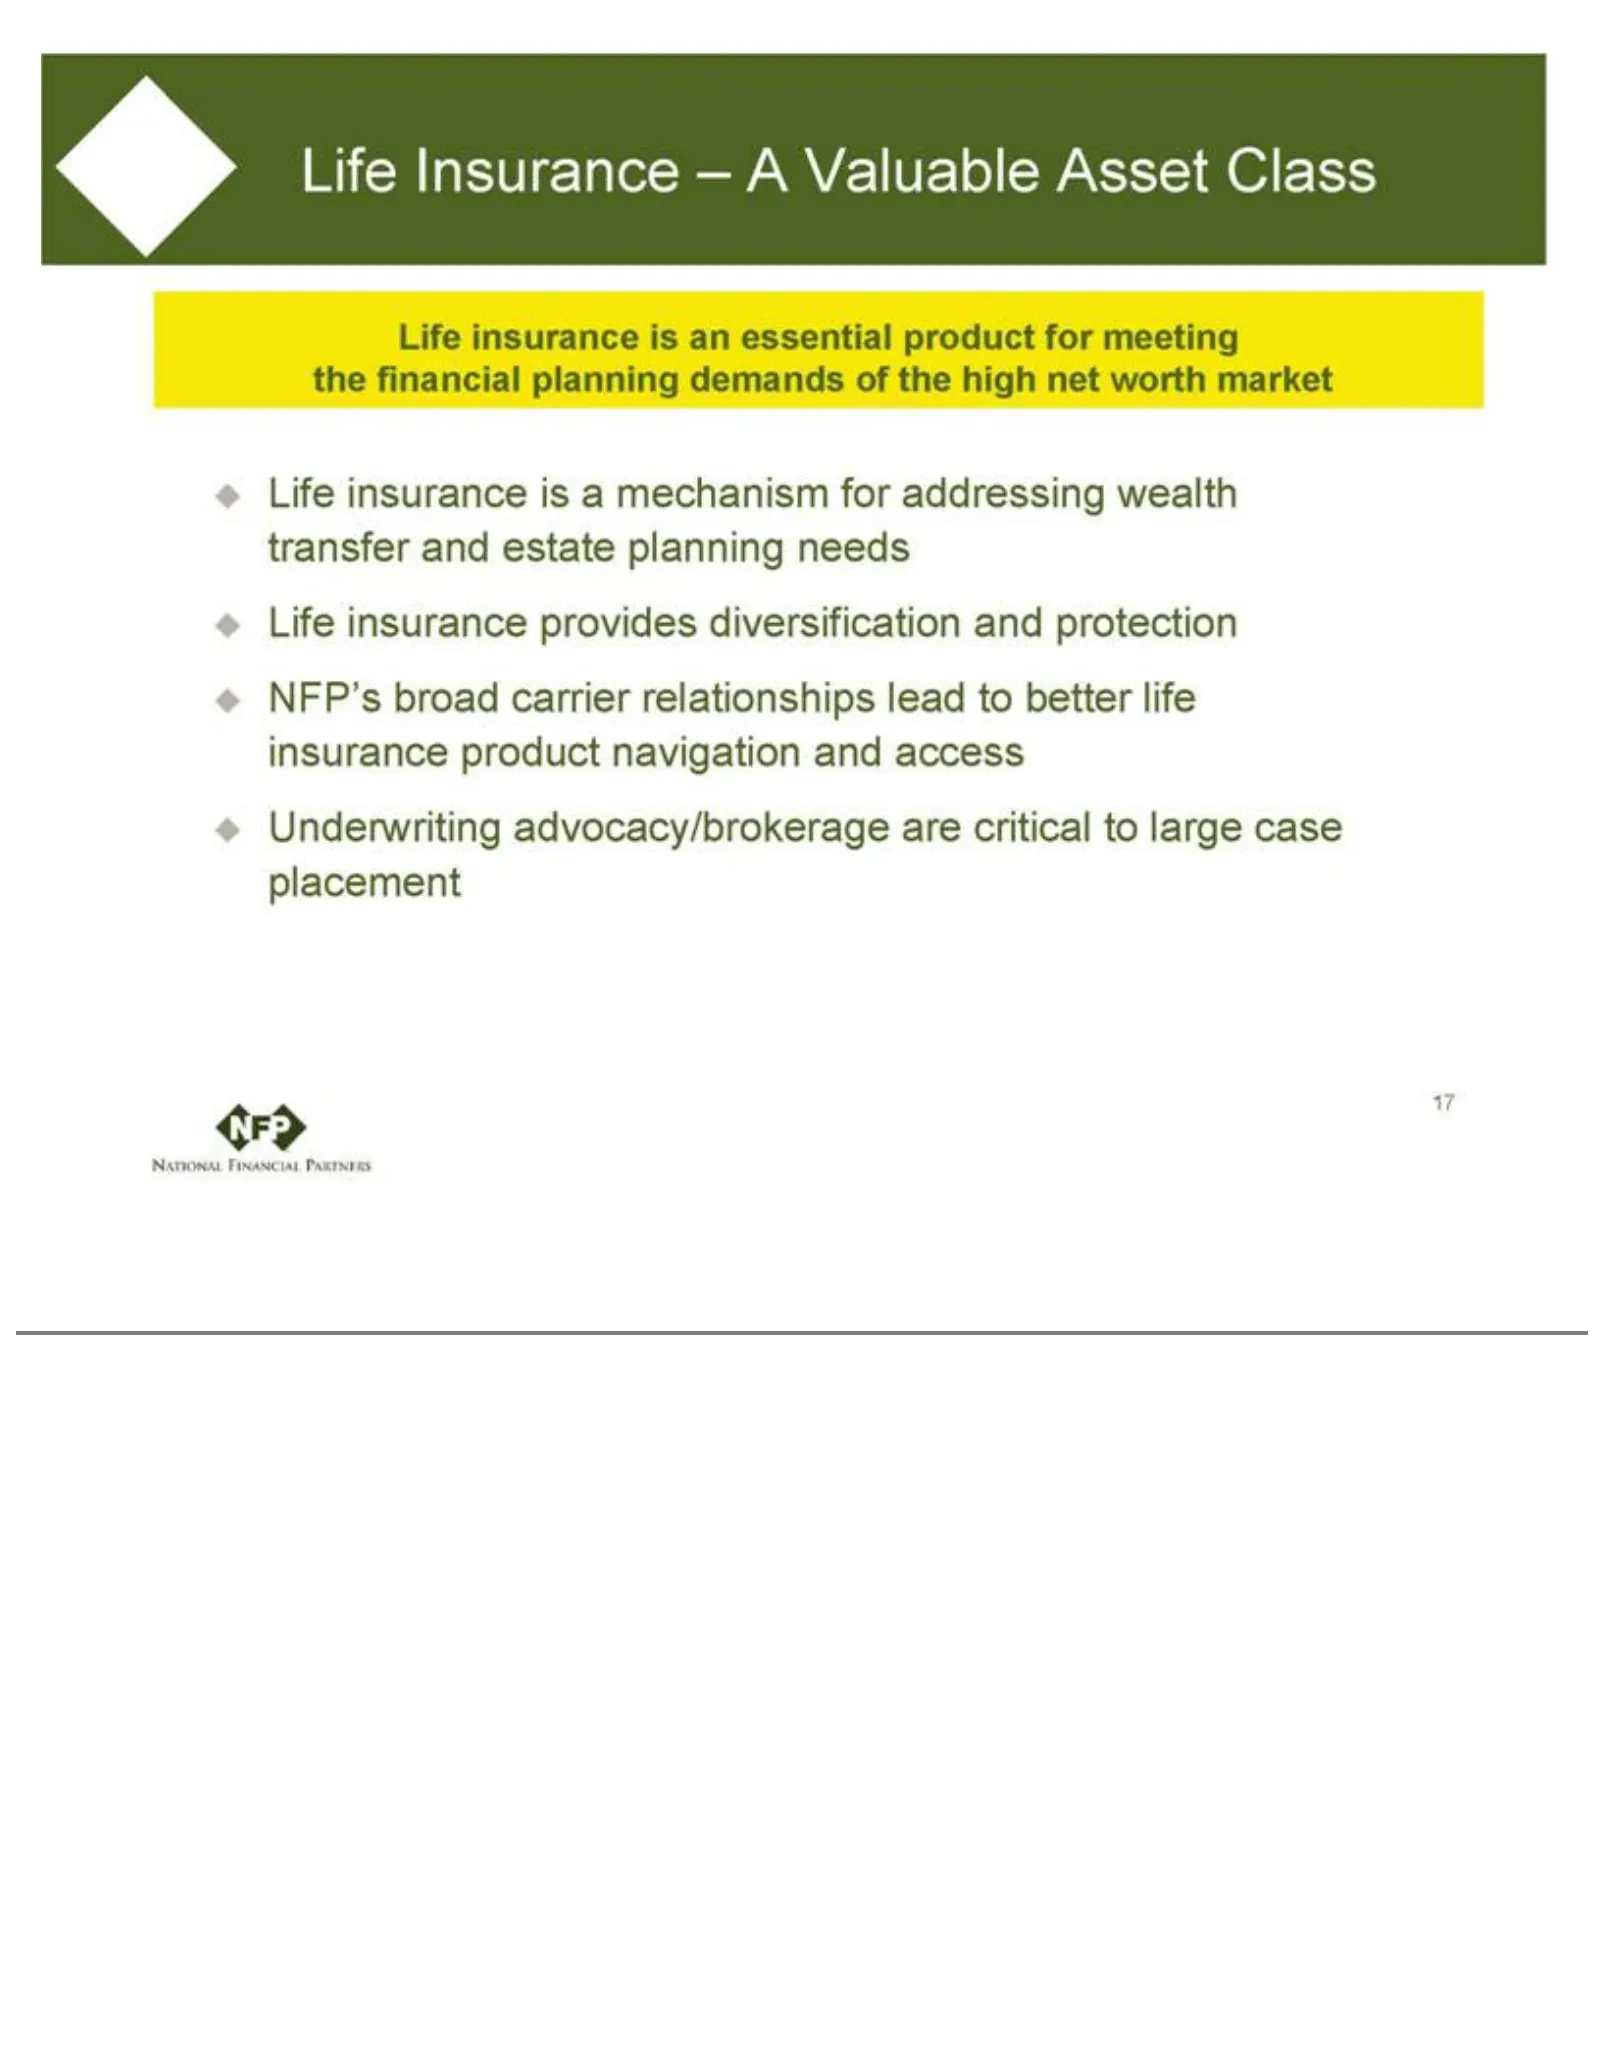
Slide 17: Life Insurance – A Valuable Asset Class
Life Insurance wealth Underwriting transferadvocacy/brokerage –and A Valuable estate planning Asset Class are needs critical Life Lifeinsurance to insurance large case isprovides anplacement essential diversification 17 product forand meeting protection the financial NFP’s broad planning carrier dem
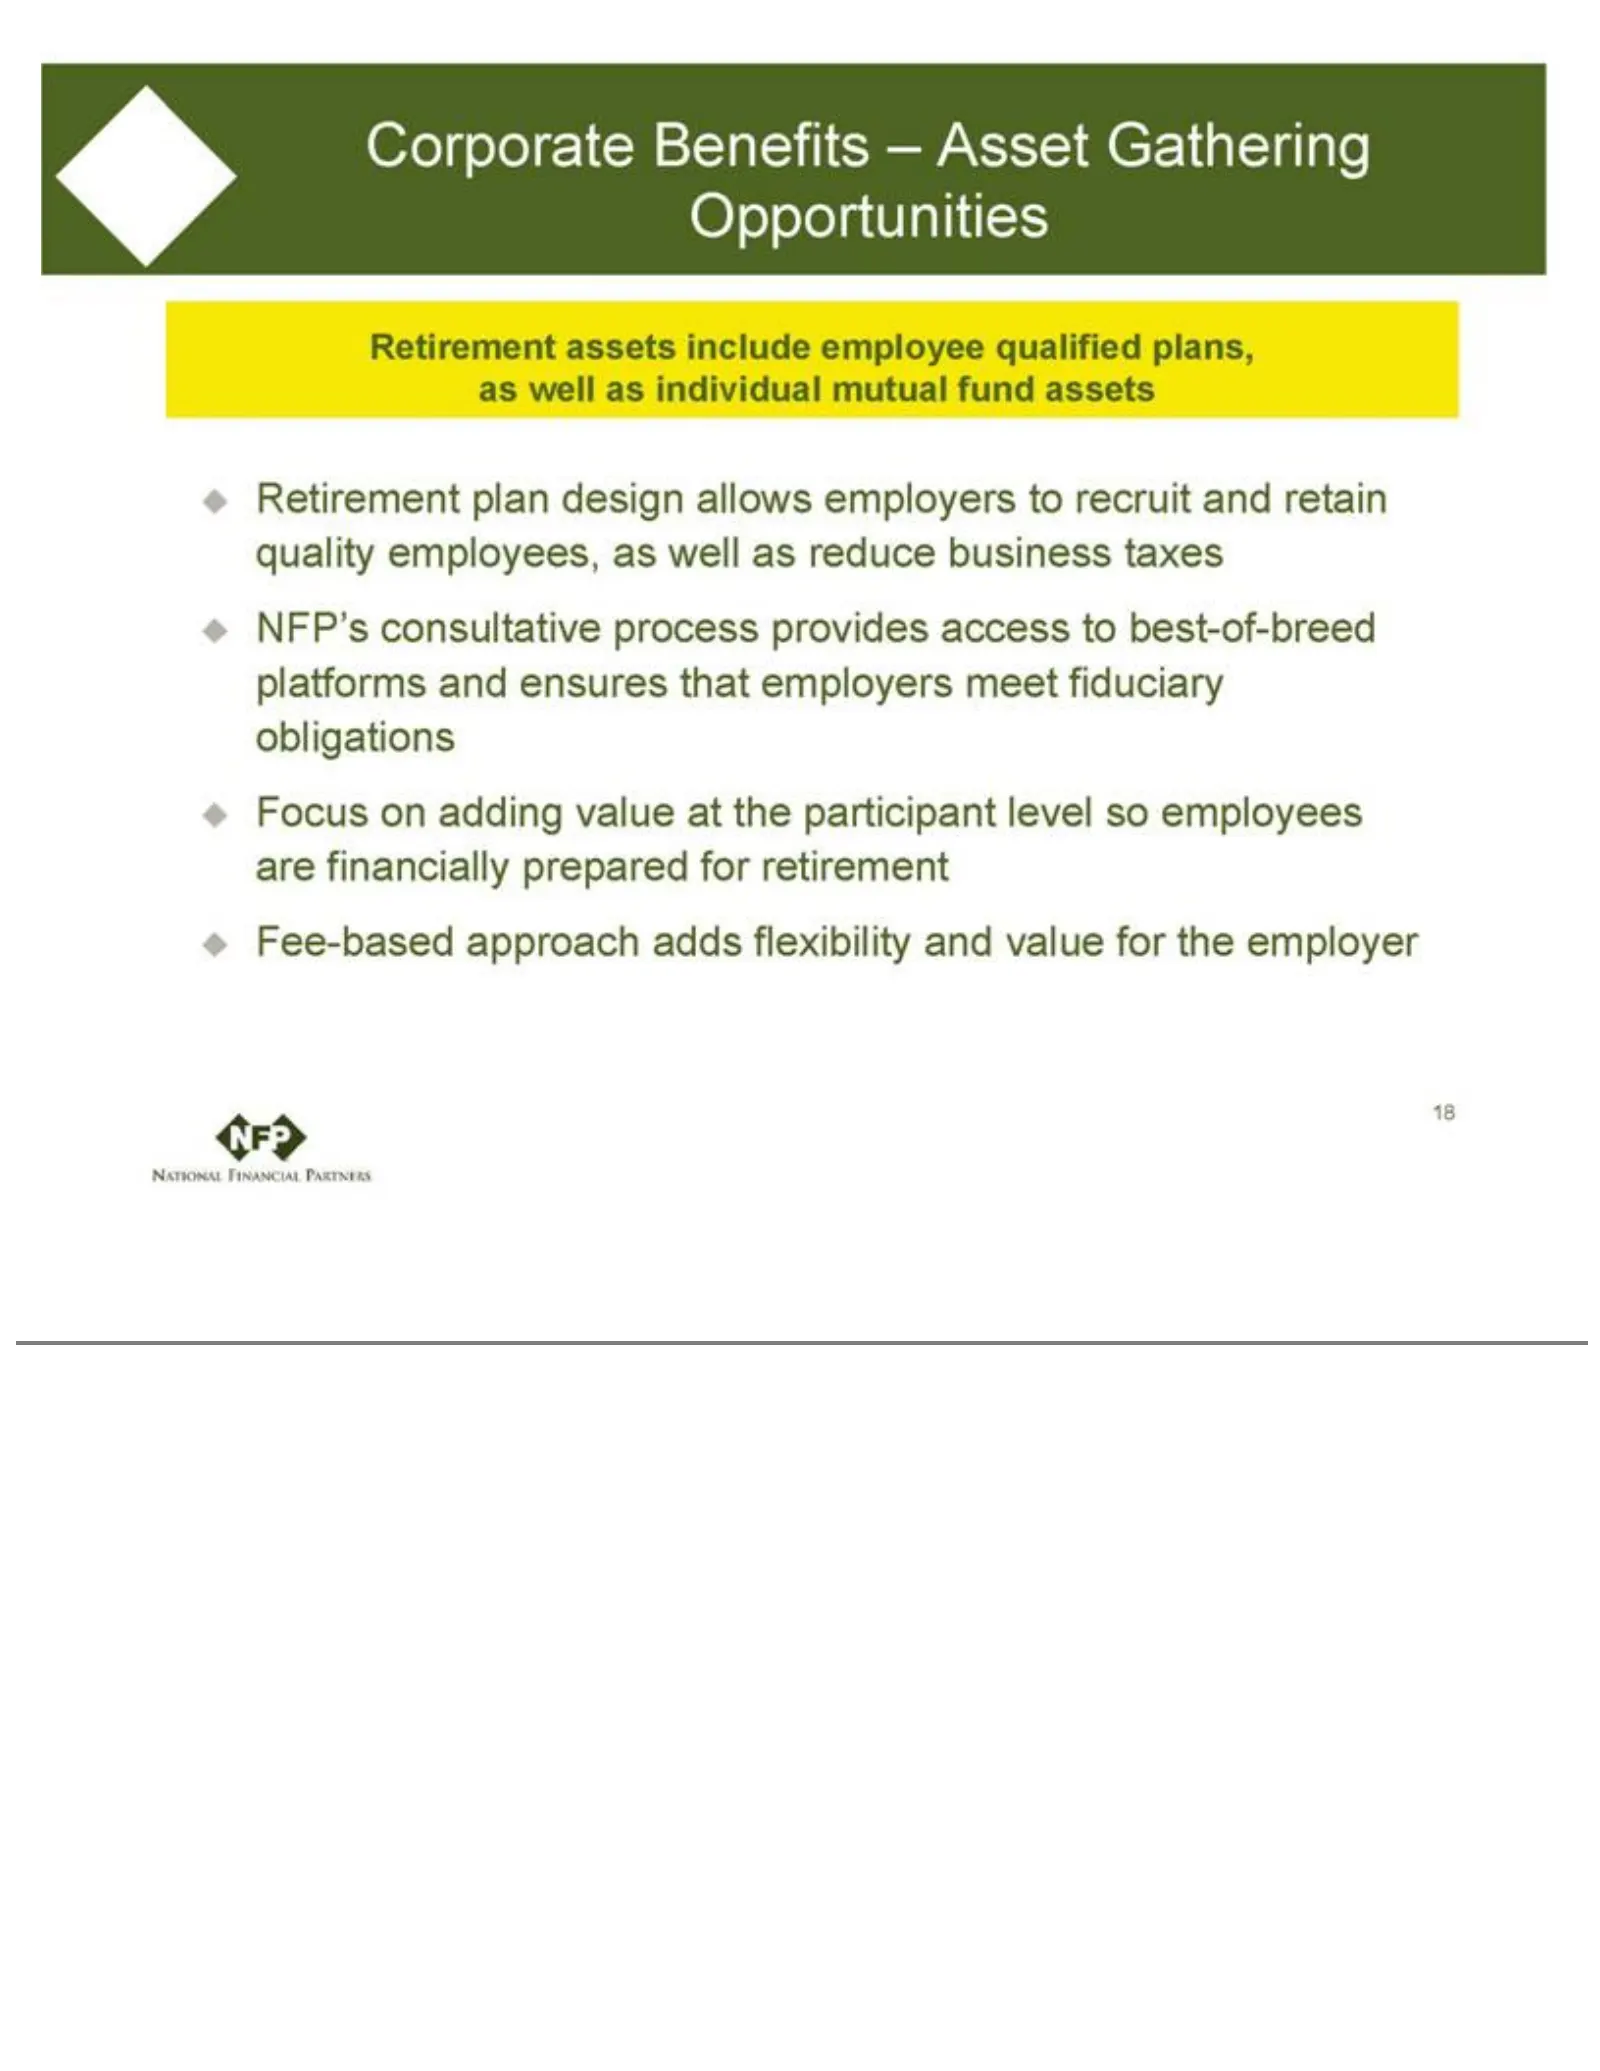
Slide 18: Corporate and Executive Benefits – Asset Gathering Opportunities
Corporate and adding retain value quality Benefits at theemployees, participant – Asset Gathering as level wellsoas Opportunities employees reduce business areRetirement financially taxes NFP’s assets prepared consultative include for retirement employee processqualified Fee-based providesplans, acc
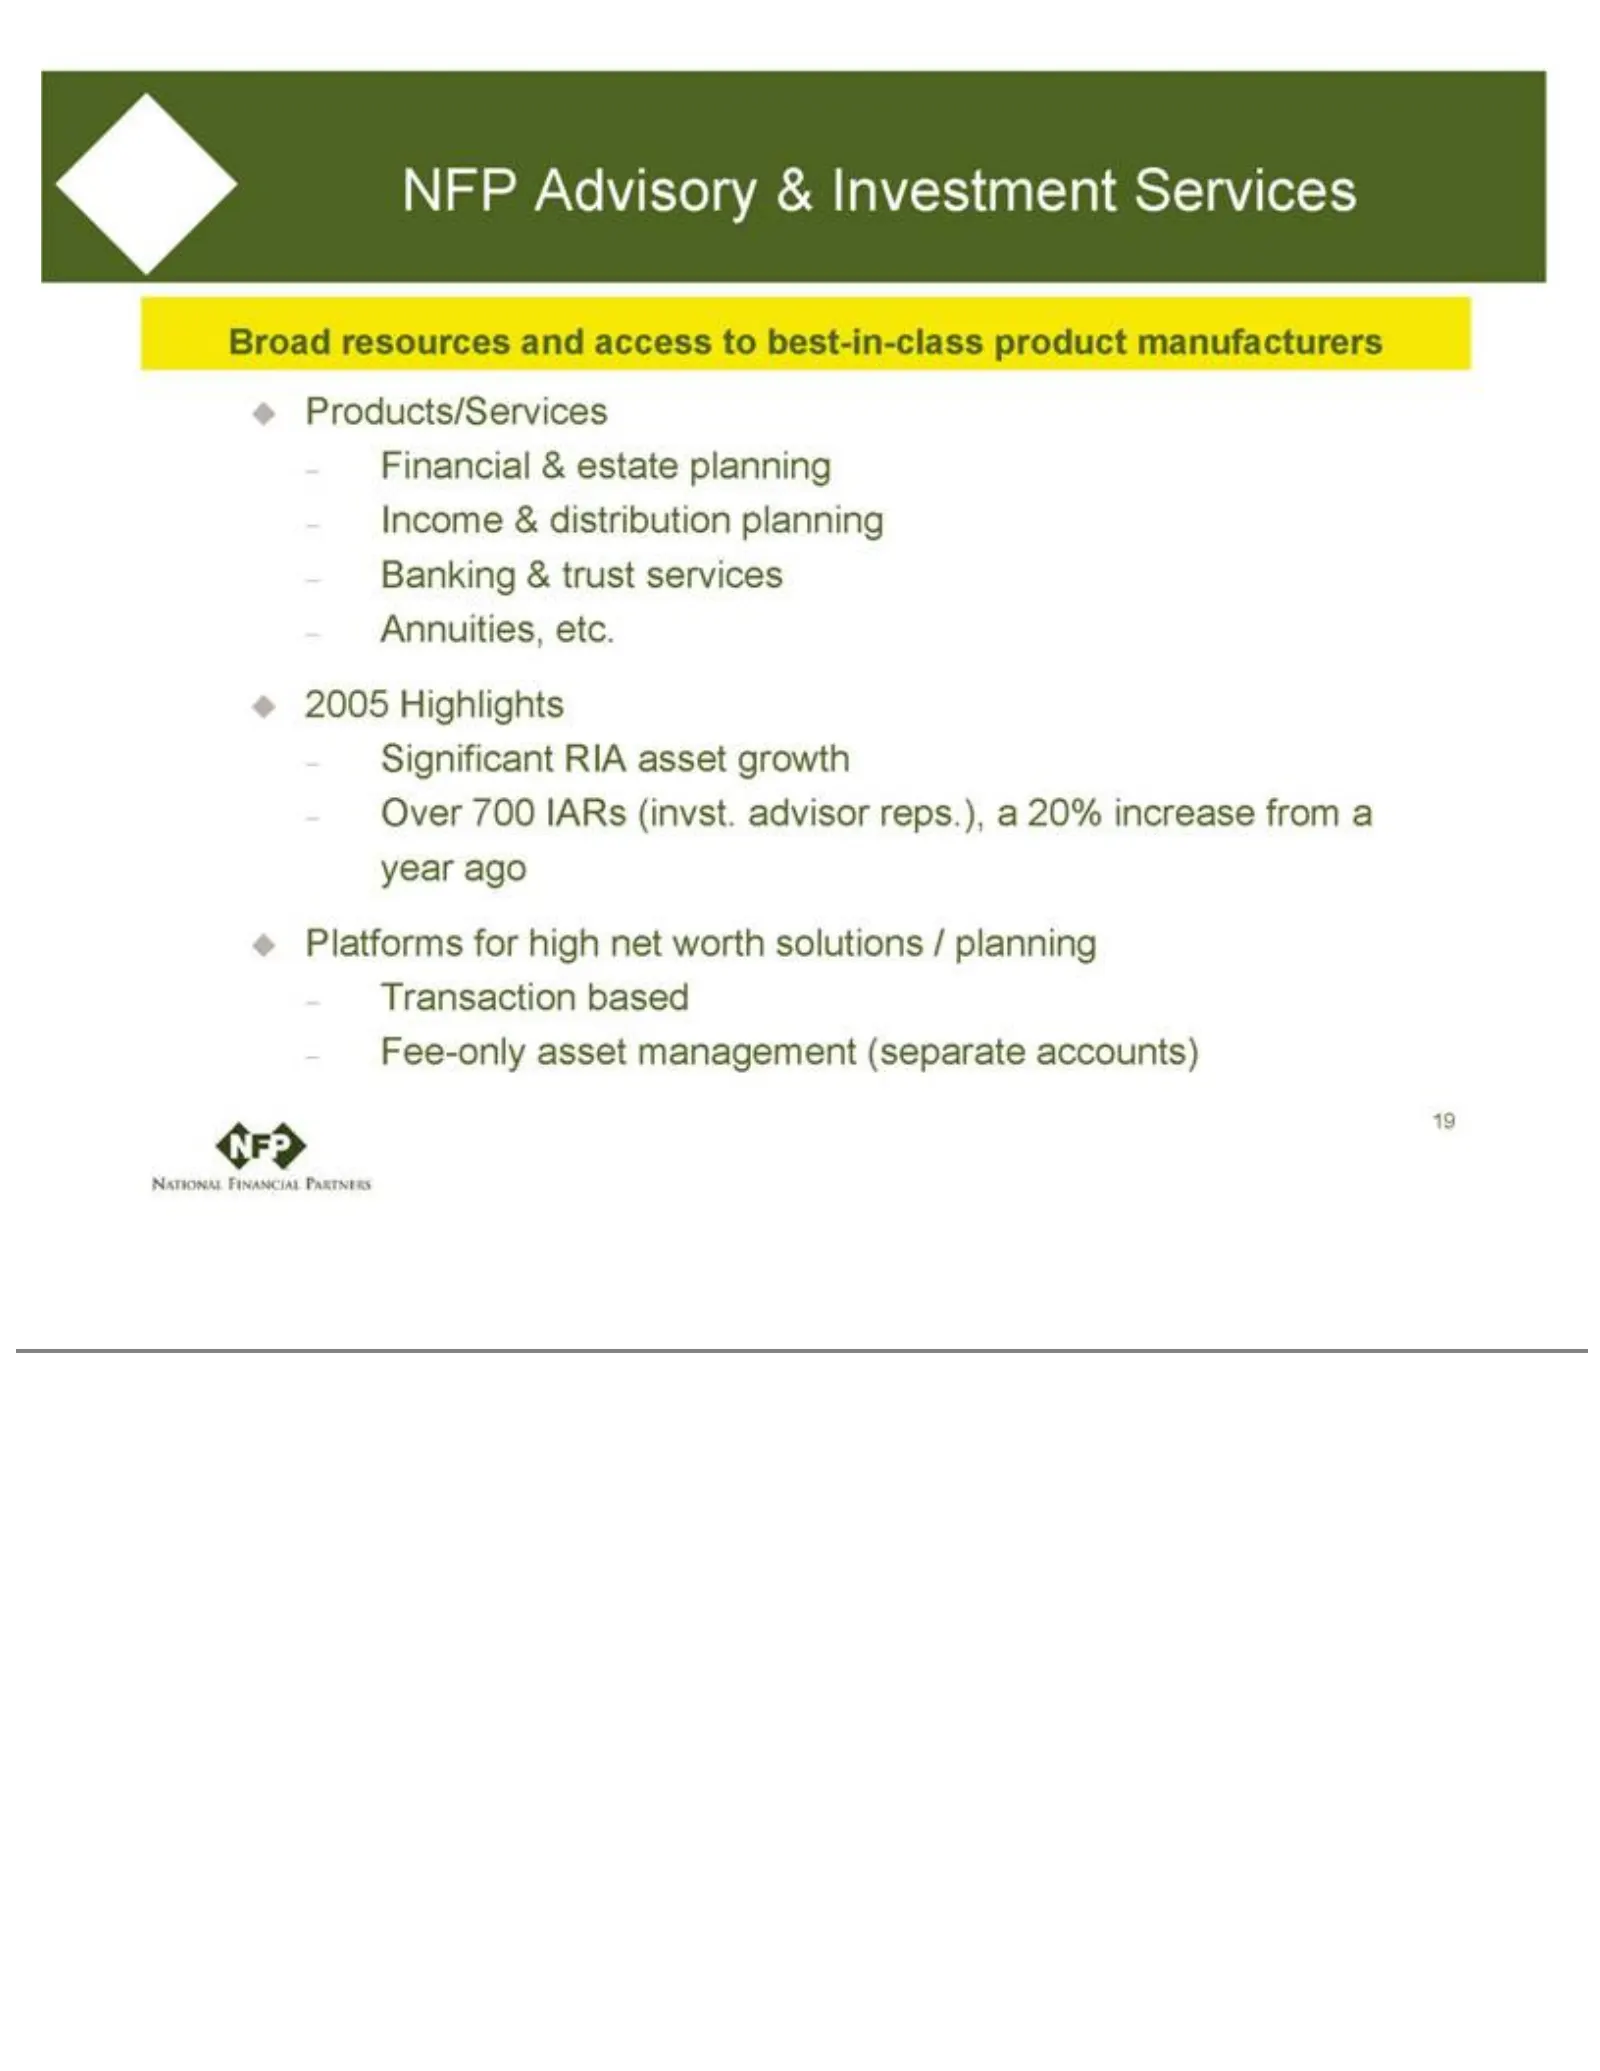
Slide 19: NFP Advisory Services & Investment Services
NFP Advisory trust Transaction servicesbased Annuities, & Investment Fee-only etc.asset 2005 Services management Highlights Broad resources Significant (separateand accounts) RIA access assetto 19 growth best-in-class Over 700 product IARsmanufacturers (invst. advisorProducts/Services reps.), a 20%
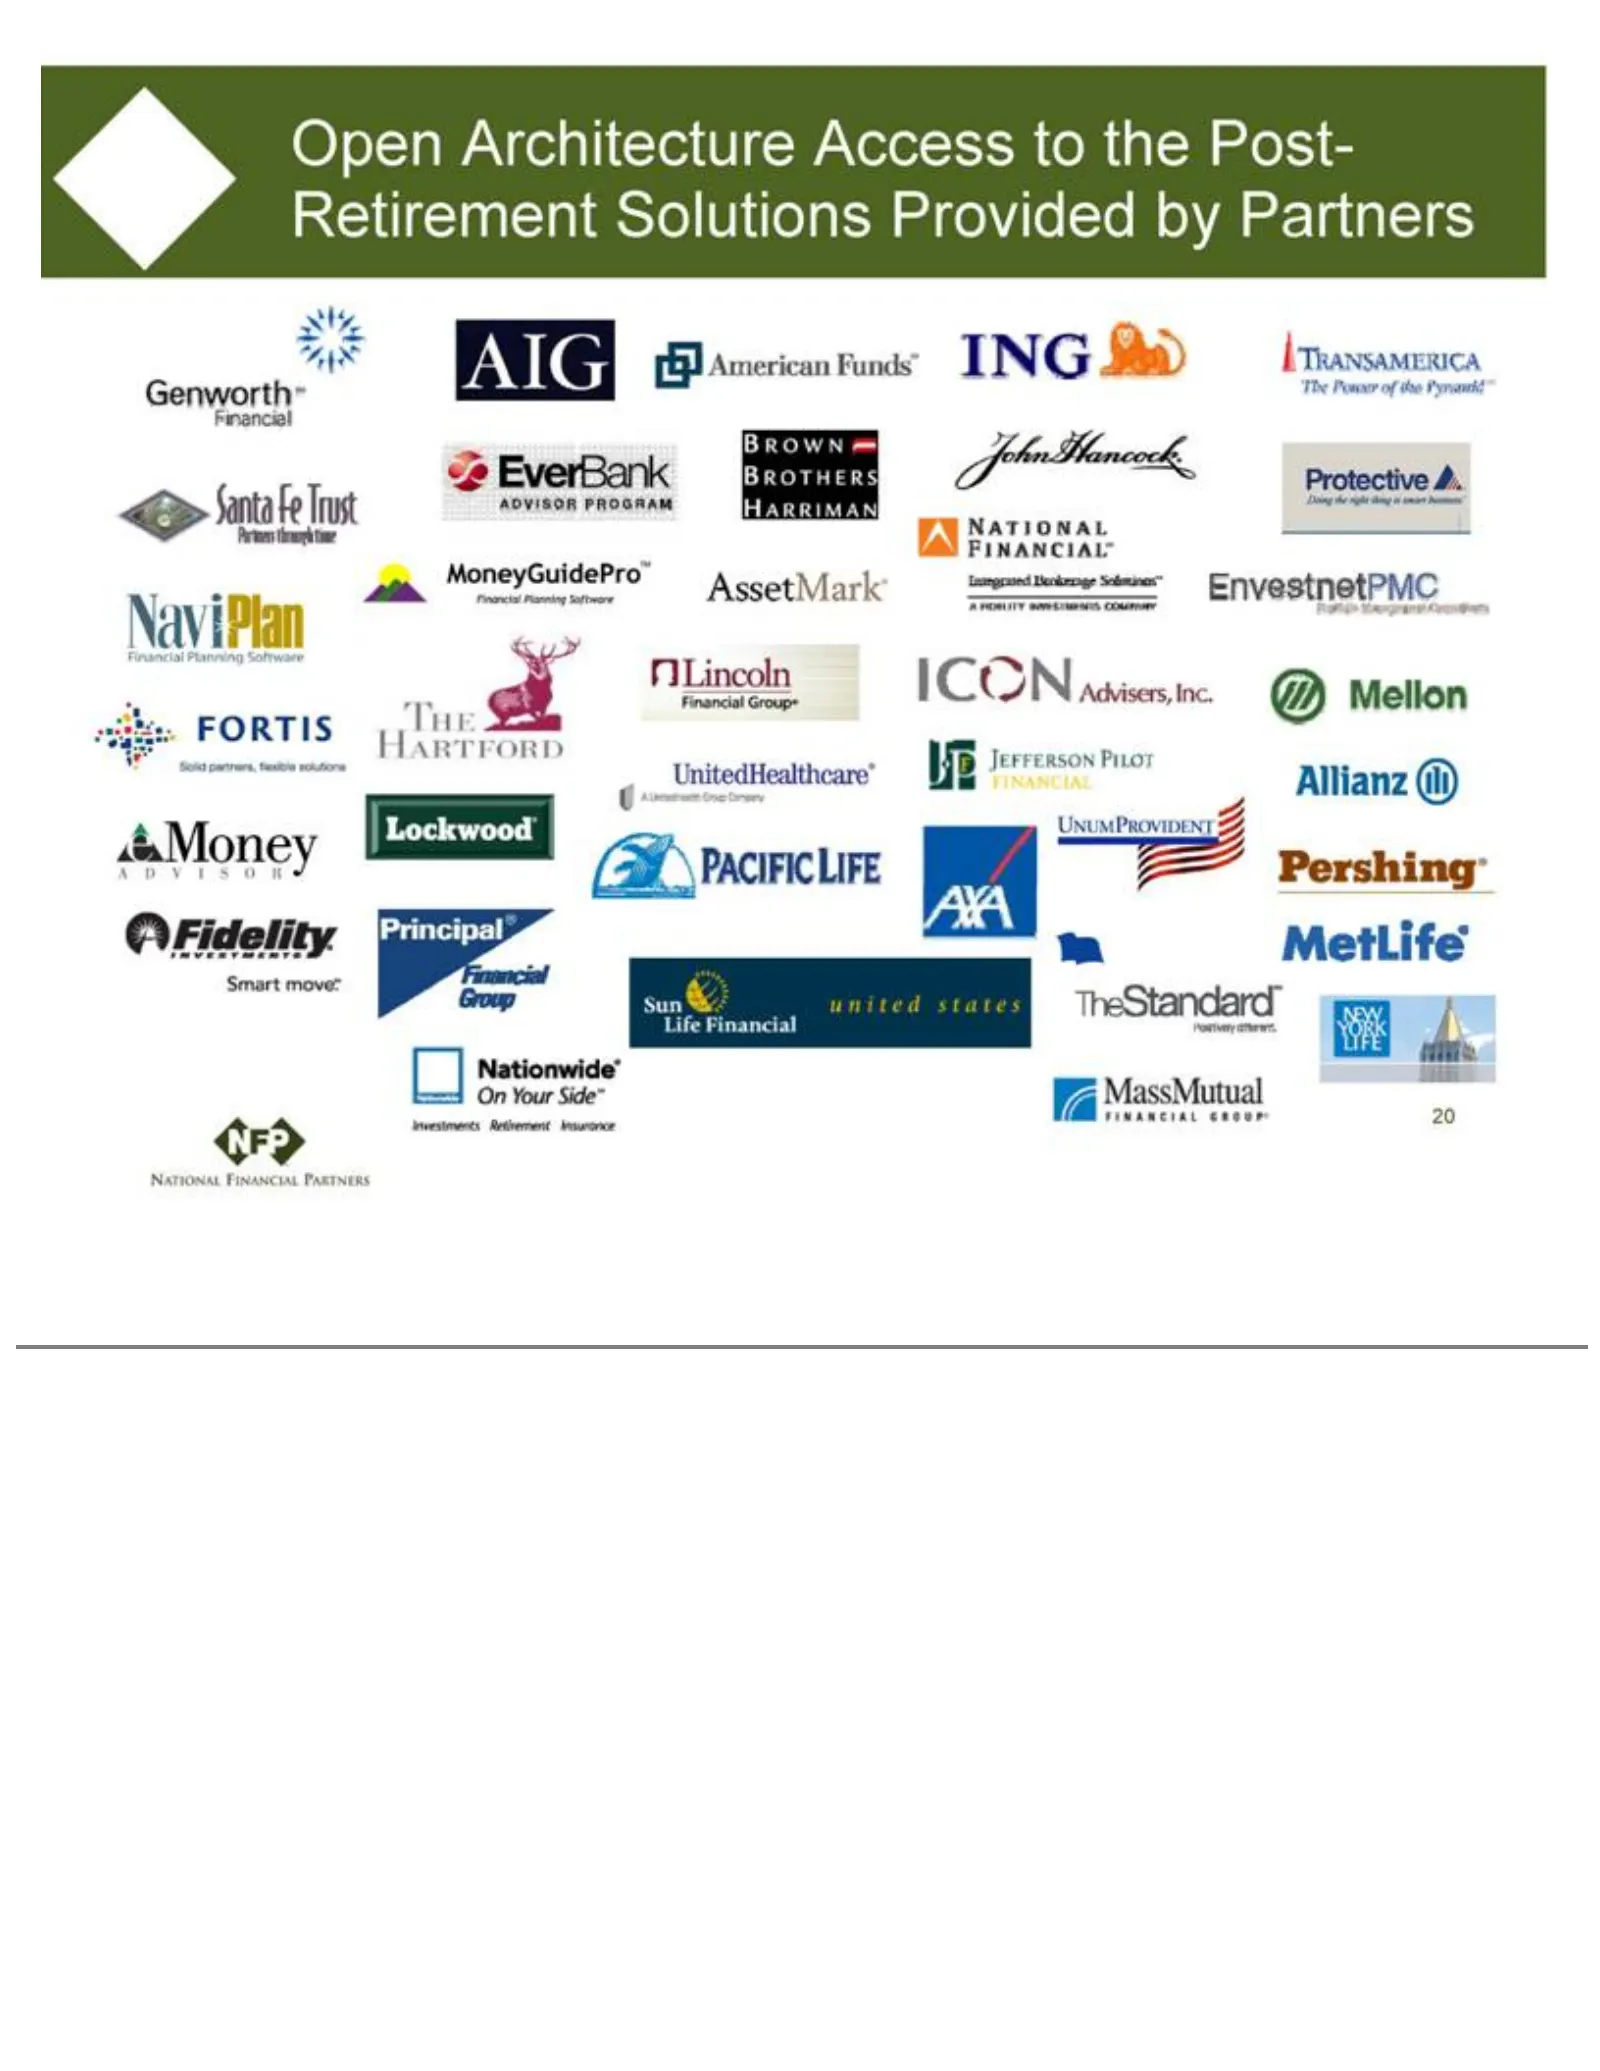
Slide 20: Open Architecture Access to Post-Retirement Solutions
Open Architecture Access to the Post-Retirement Solutions Provided by Partners 20
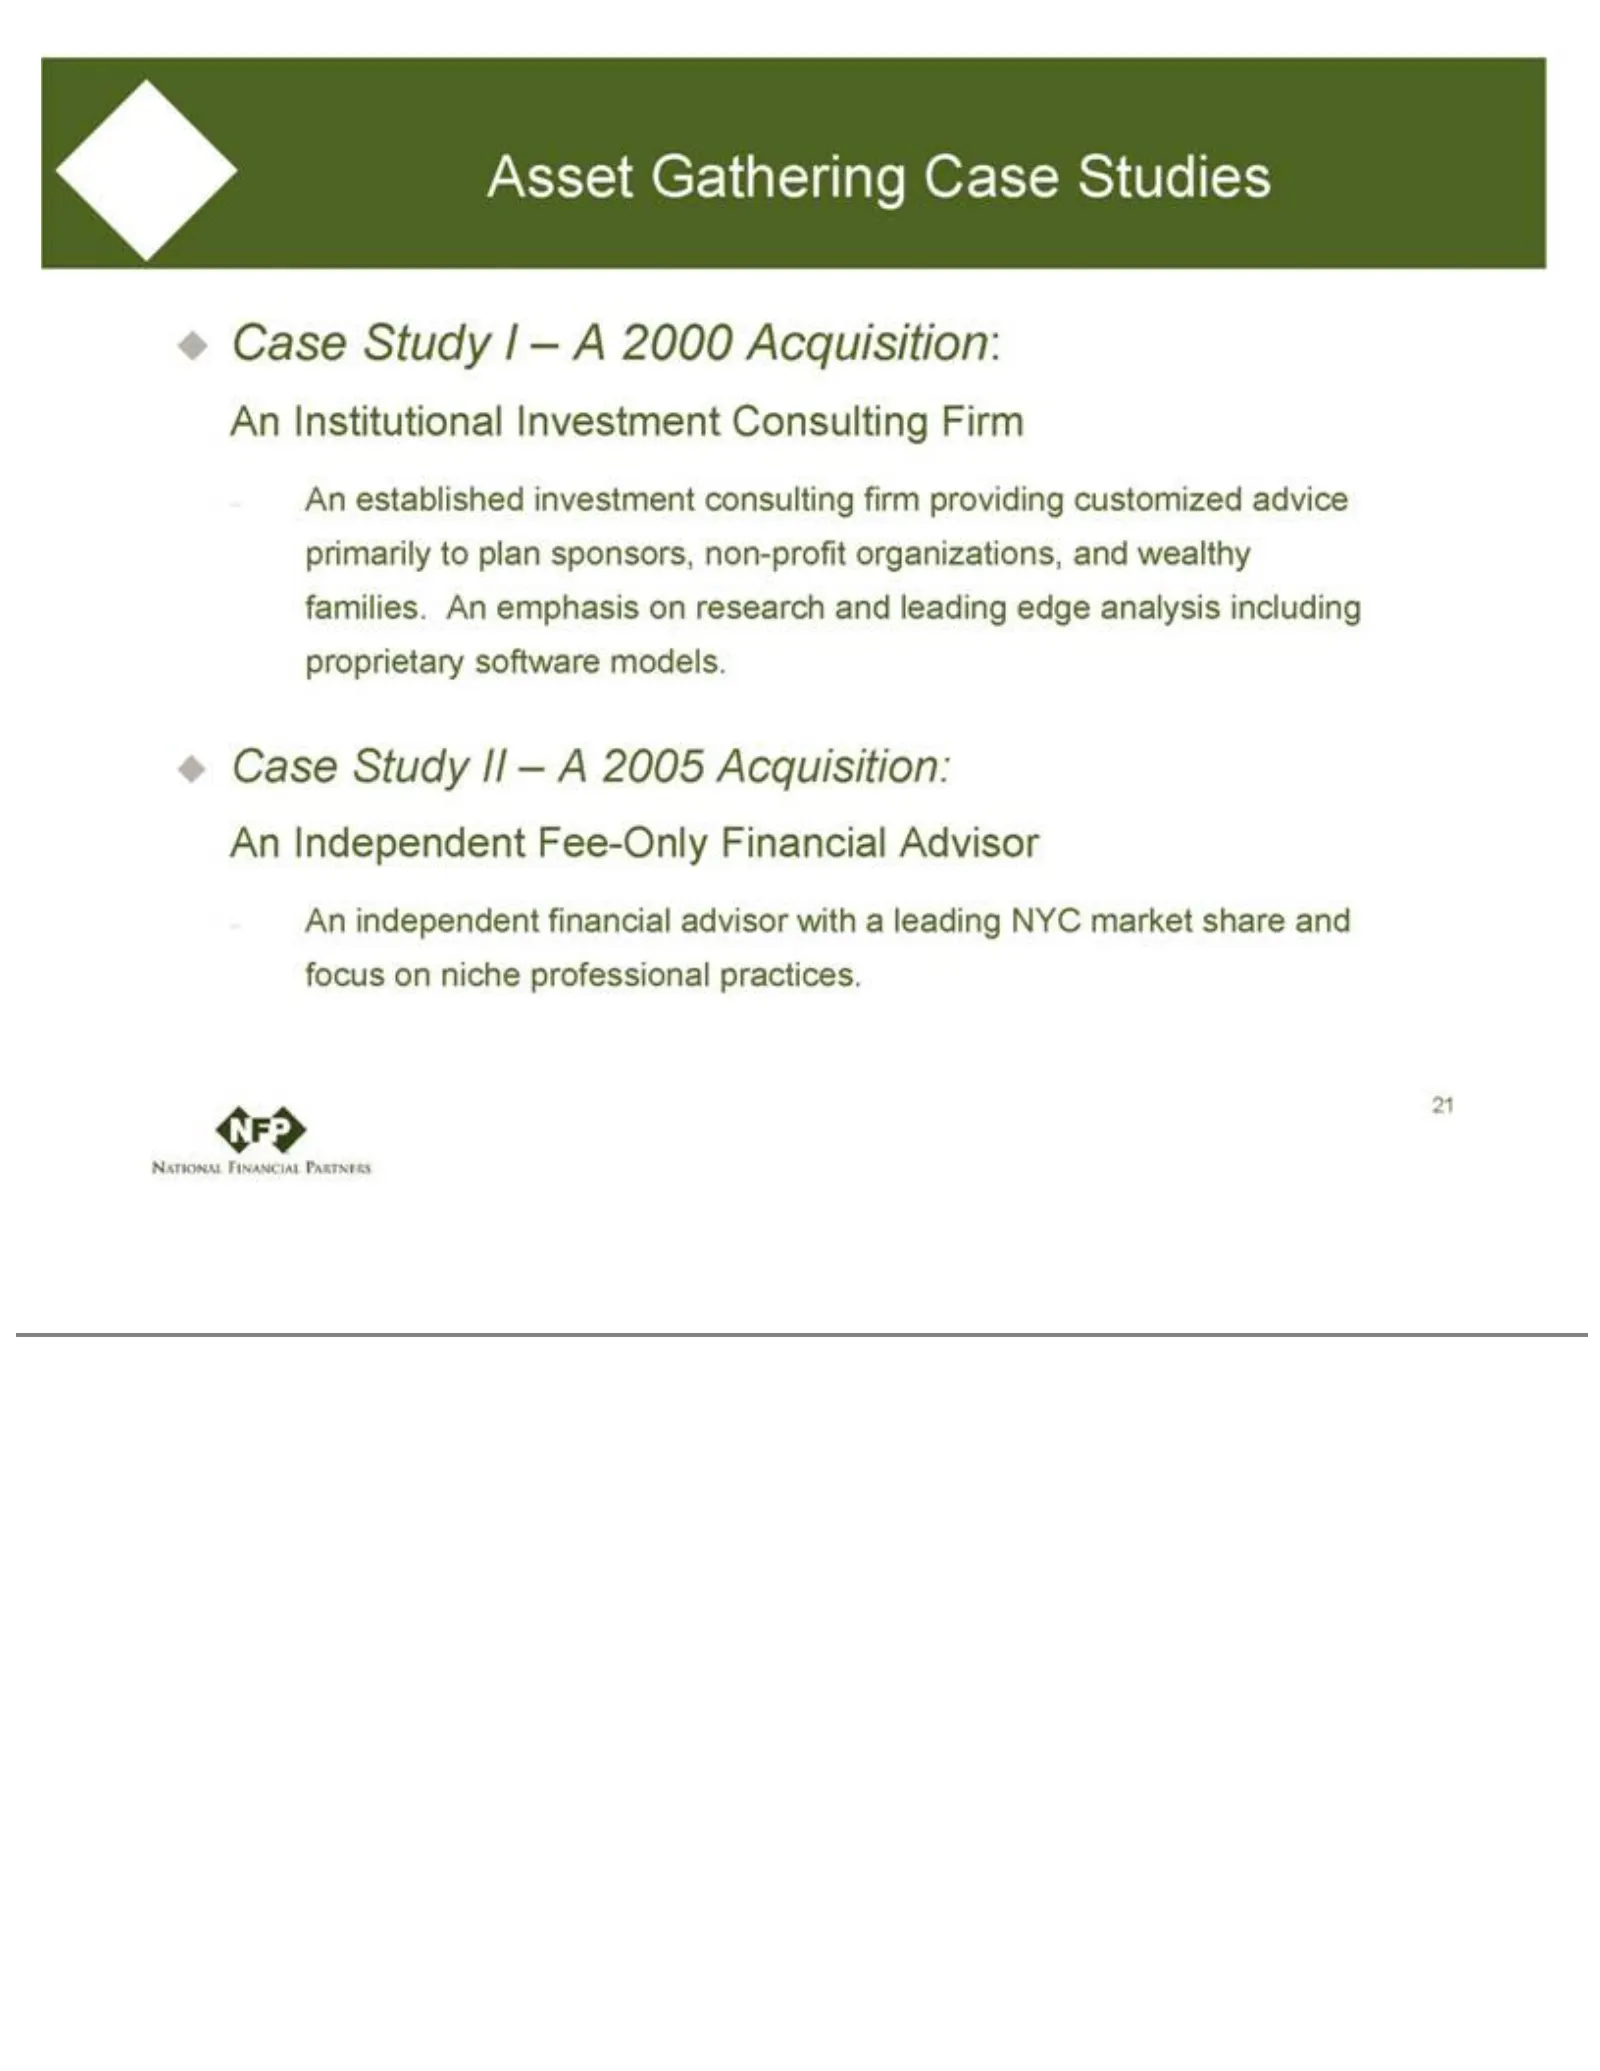
Slide 21: Asset Gathering Case Studies
Assetsponsors, plan Independent Gathering Fee-Only non-profit Case Studies Financial organizations, Case Advisor Studyand An I –wealthy independent A 2000 families. Acquisition: financial An emphasis An advisor Institutional with on research a leading Investment and NYC leading Consulting market edg
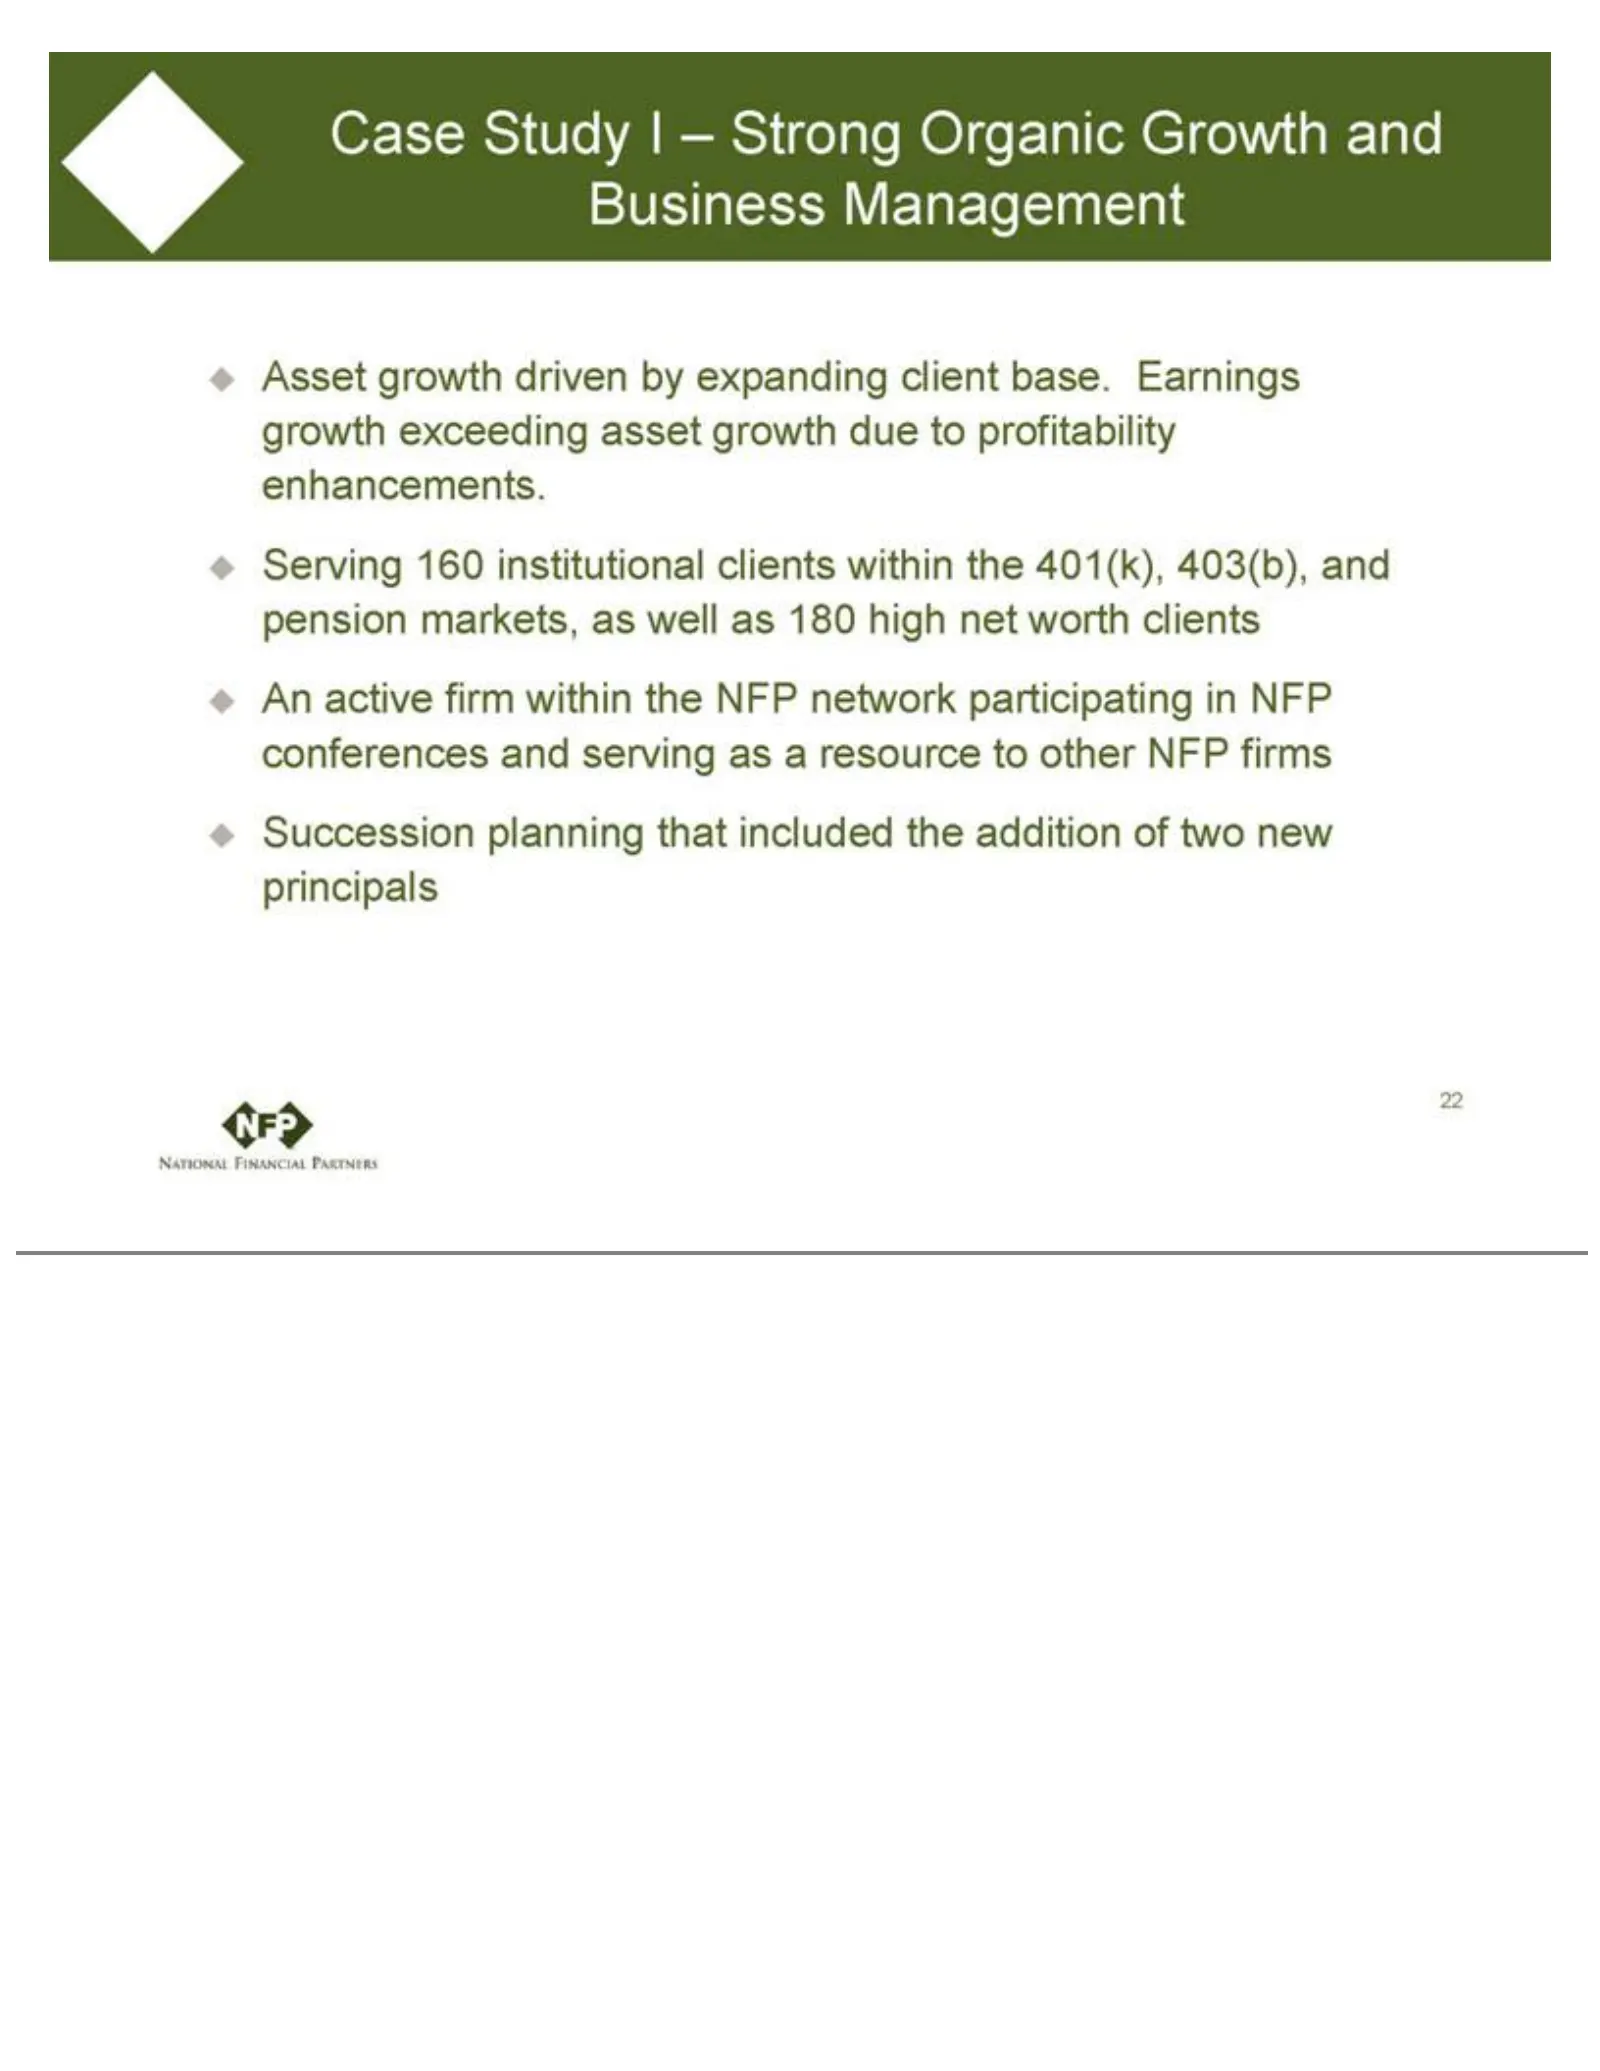
Slide 22: Case Study I
Caseinstitutional 160 resource Studyto other I – Strong clients NFP firms Organic within Succession the Growth 401(k), and planning 403(b), Business that andManagement included pension the markets, Asset addition as growth well of two as driven new 180 high principals by expanding net worth 22 clien
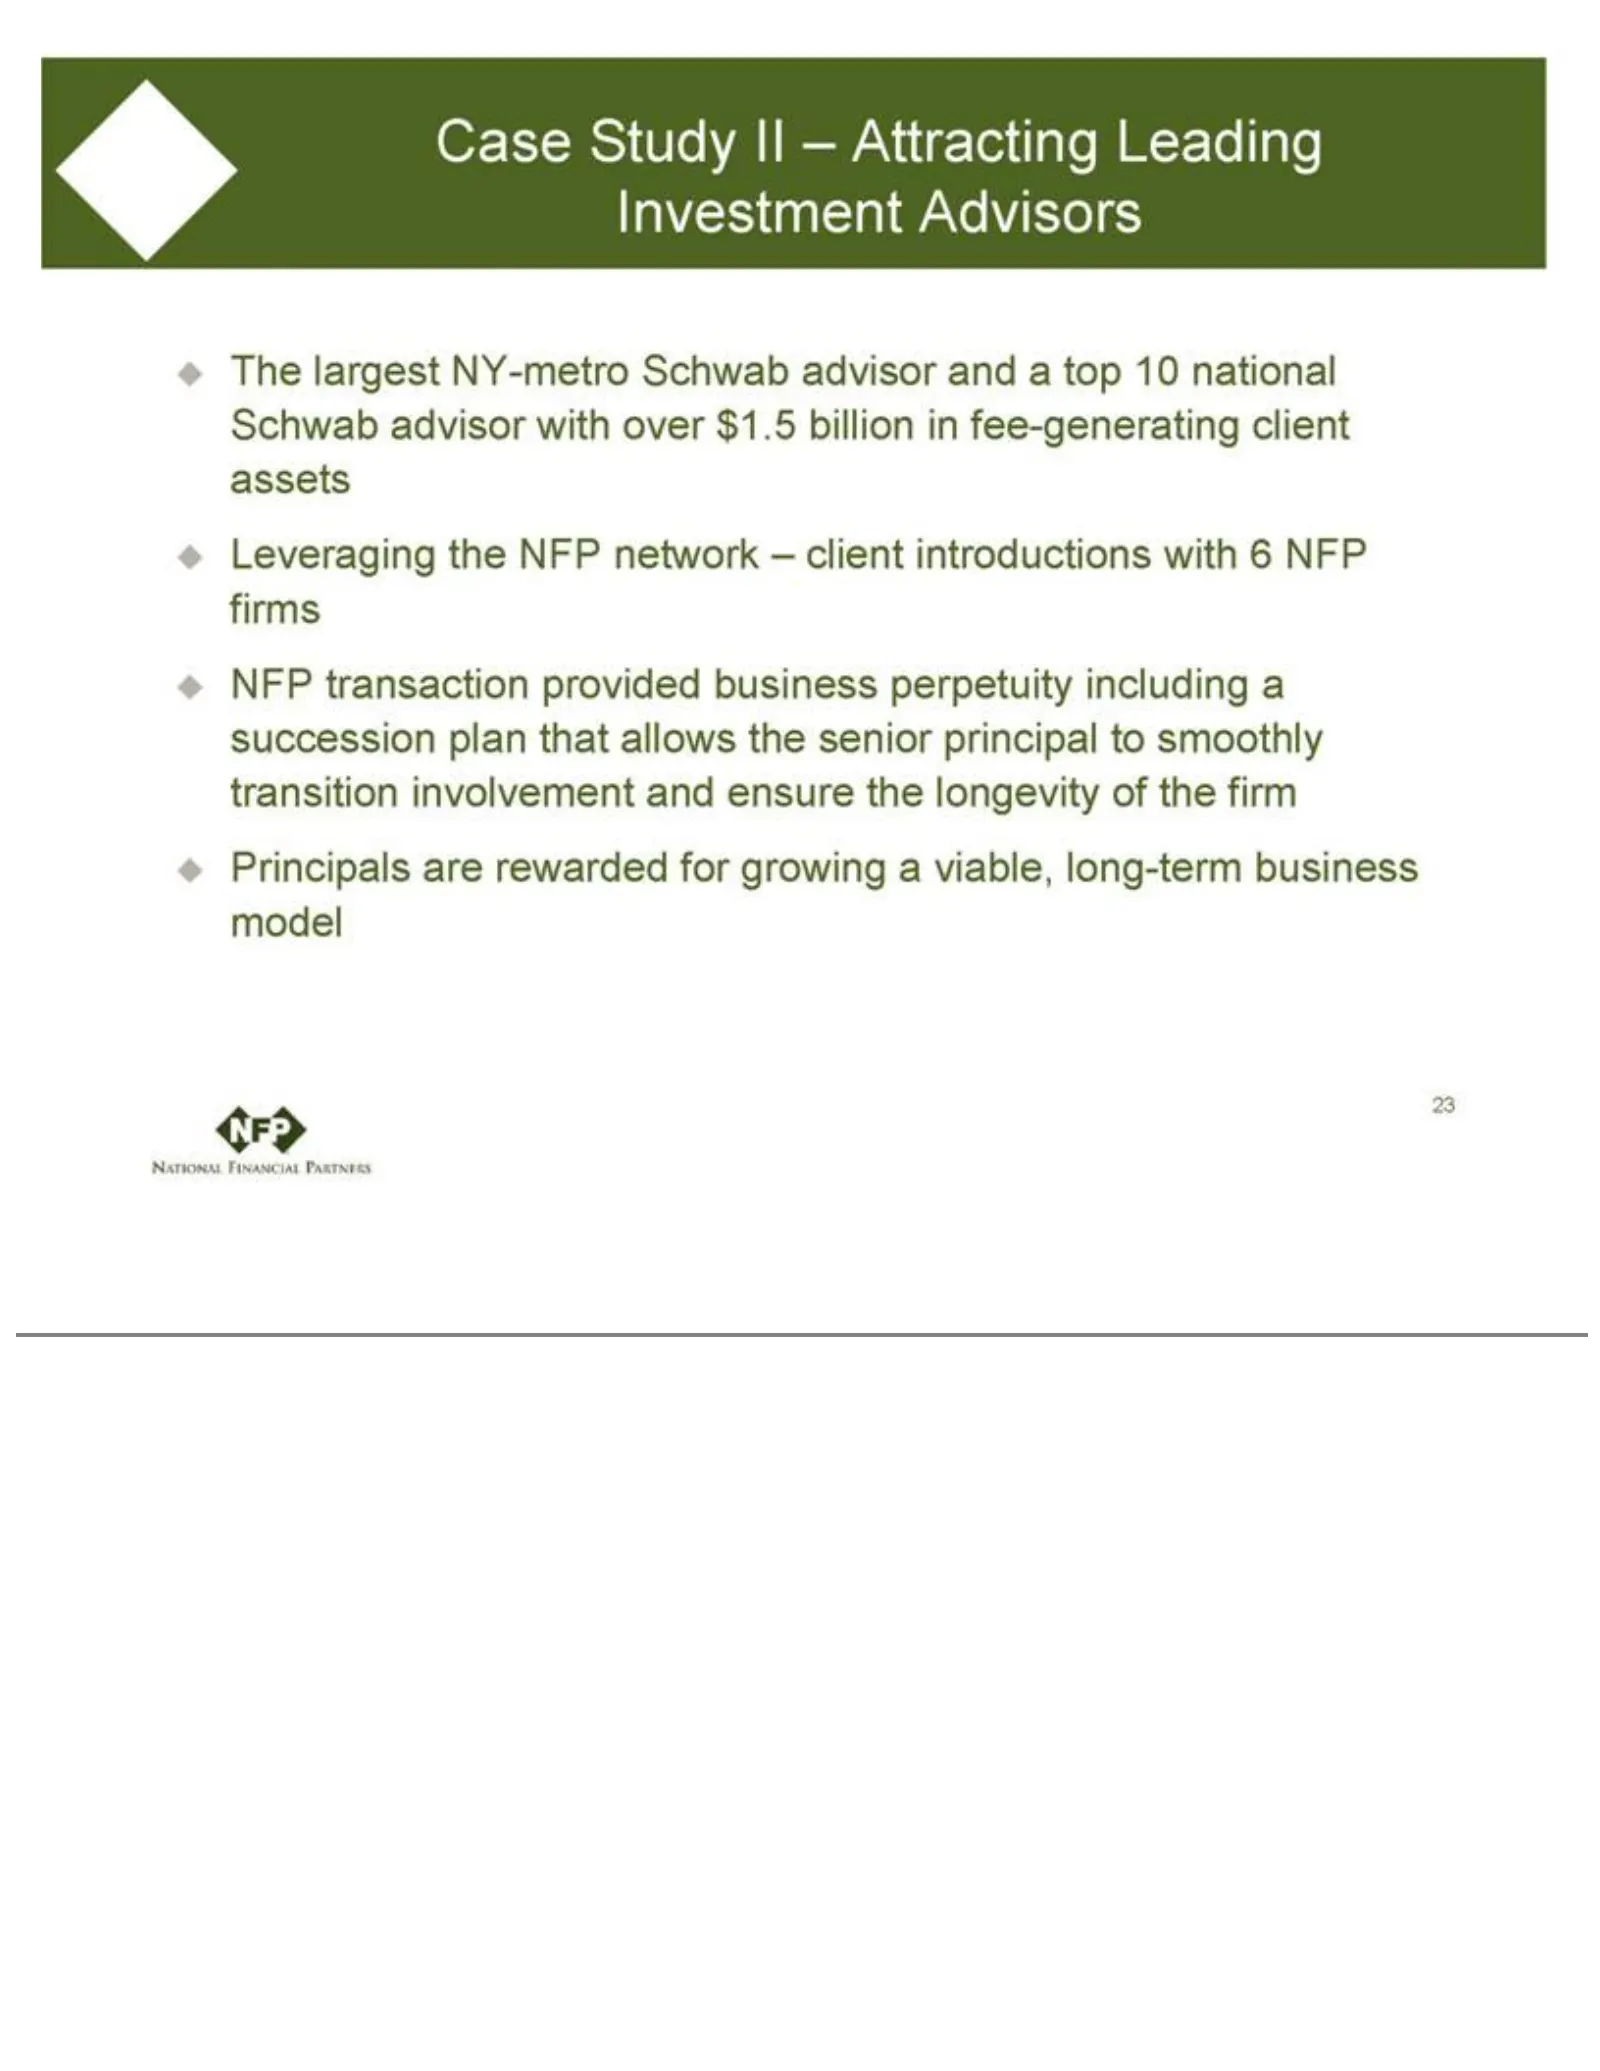
Slide 23: Case Study II
CaseNFP the and ensure Study network the II –longevity Attracting – client of introductions Leading the firmInvestment Principals with 6 NFP are Advisors rewarded firmsThe NFP for largest transaction growing NY-metro aprovided viable, Schwab long-term business advisor business perpetuity and a top m
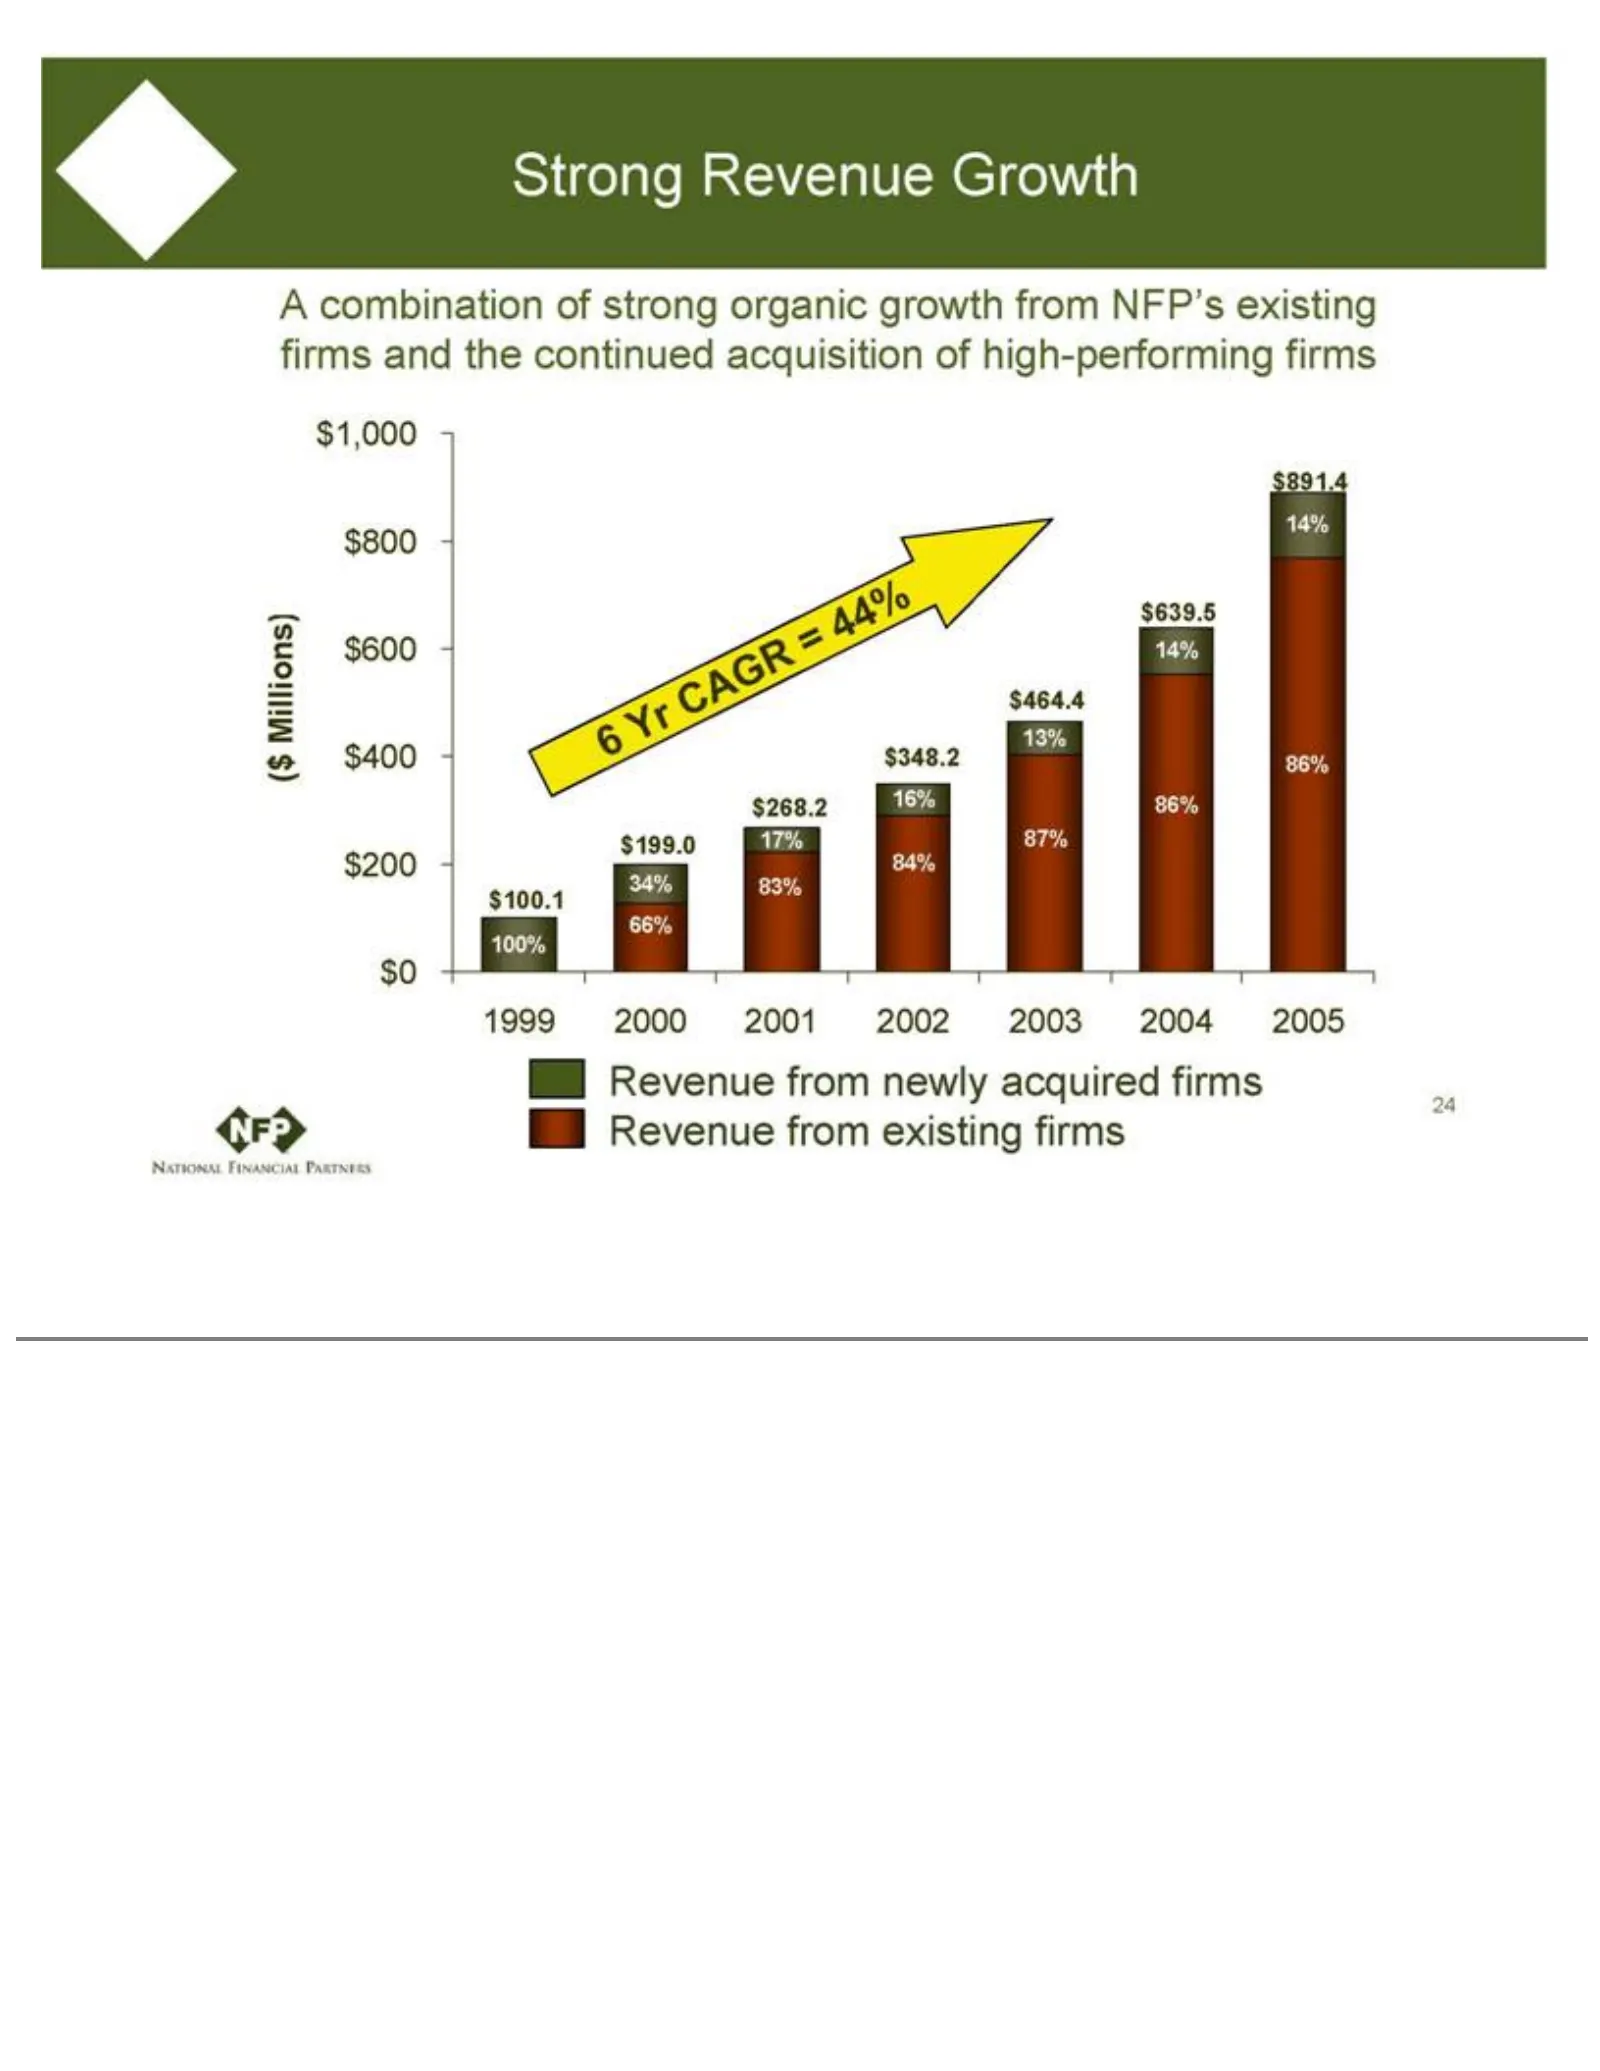
Slide 24: Strong Revenue Growth
Strong Revenue acquired CAGR = firms Growth 44% Revenue A100% combination $100.1from existing of strong $199.0firms 34% 66% organic 24 growth $268.2 17% 83%from NFP’s $348.2 existing 16% firms and 84% $464.4 13%the87% continued $639.5 acquisition of high-performing 14% 86% $891.4 14% 86% 1999firms (
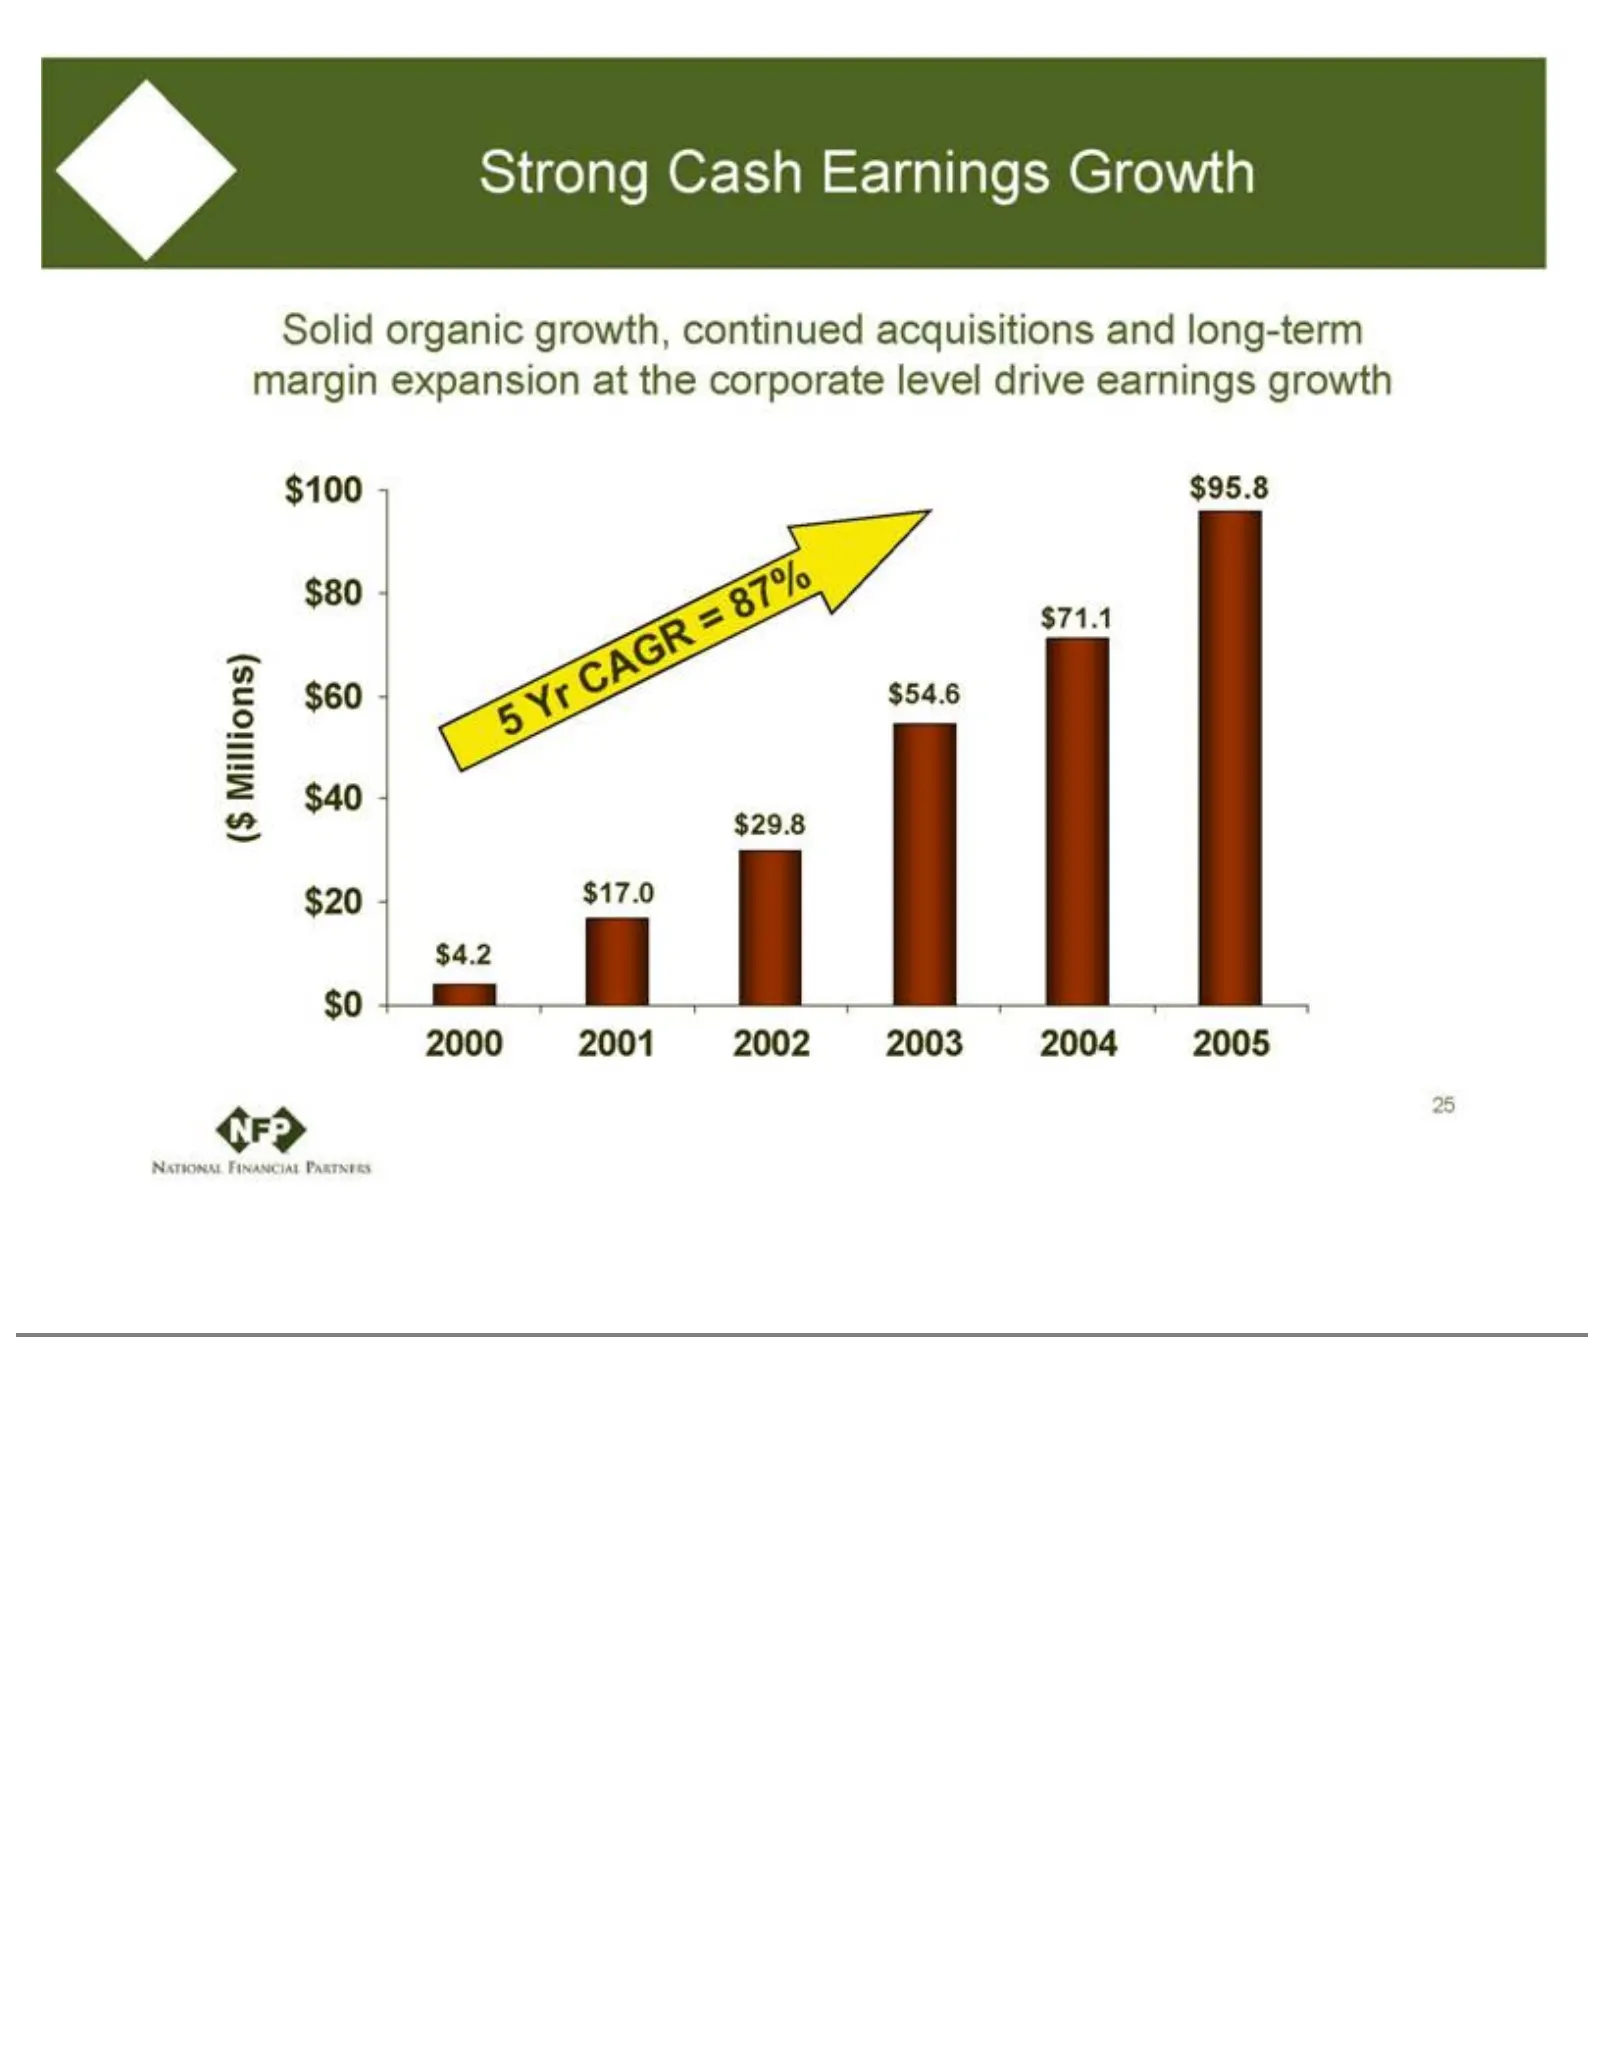
Slide 25: Strong Cash Earnings Growth
Strong = 87% ($ Cash Millions) Earnings $100 Growth $80 $60 Solid $40organic $40 $20 growth, $0 $4.2 continued $17.0 $29.8 acquisitions $54.6 $71.1 and long-term $95.8 25 margin expansion at the corporate level drive earnings growth 2000 2001 2002 2003 2004 2005 5 Yr CAGR
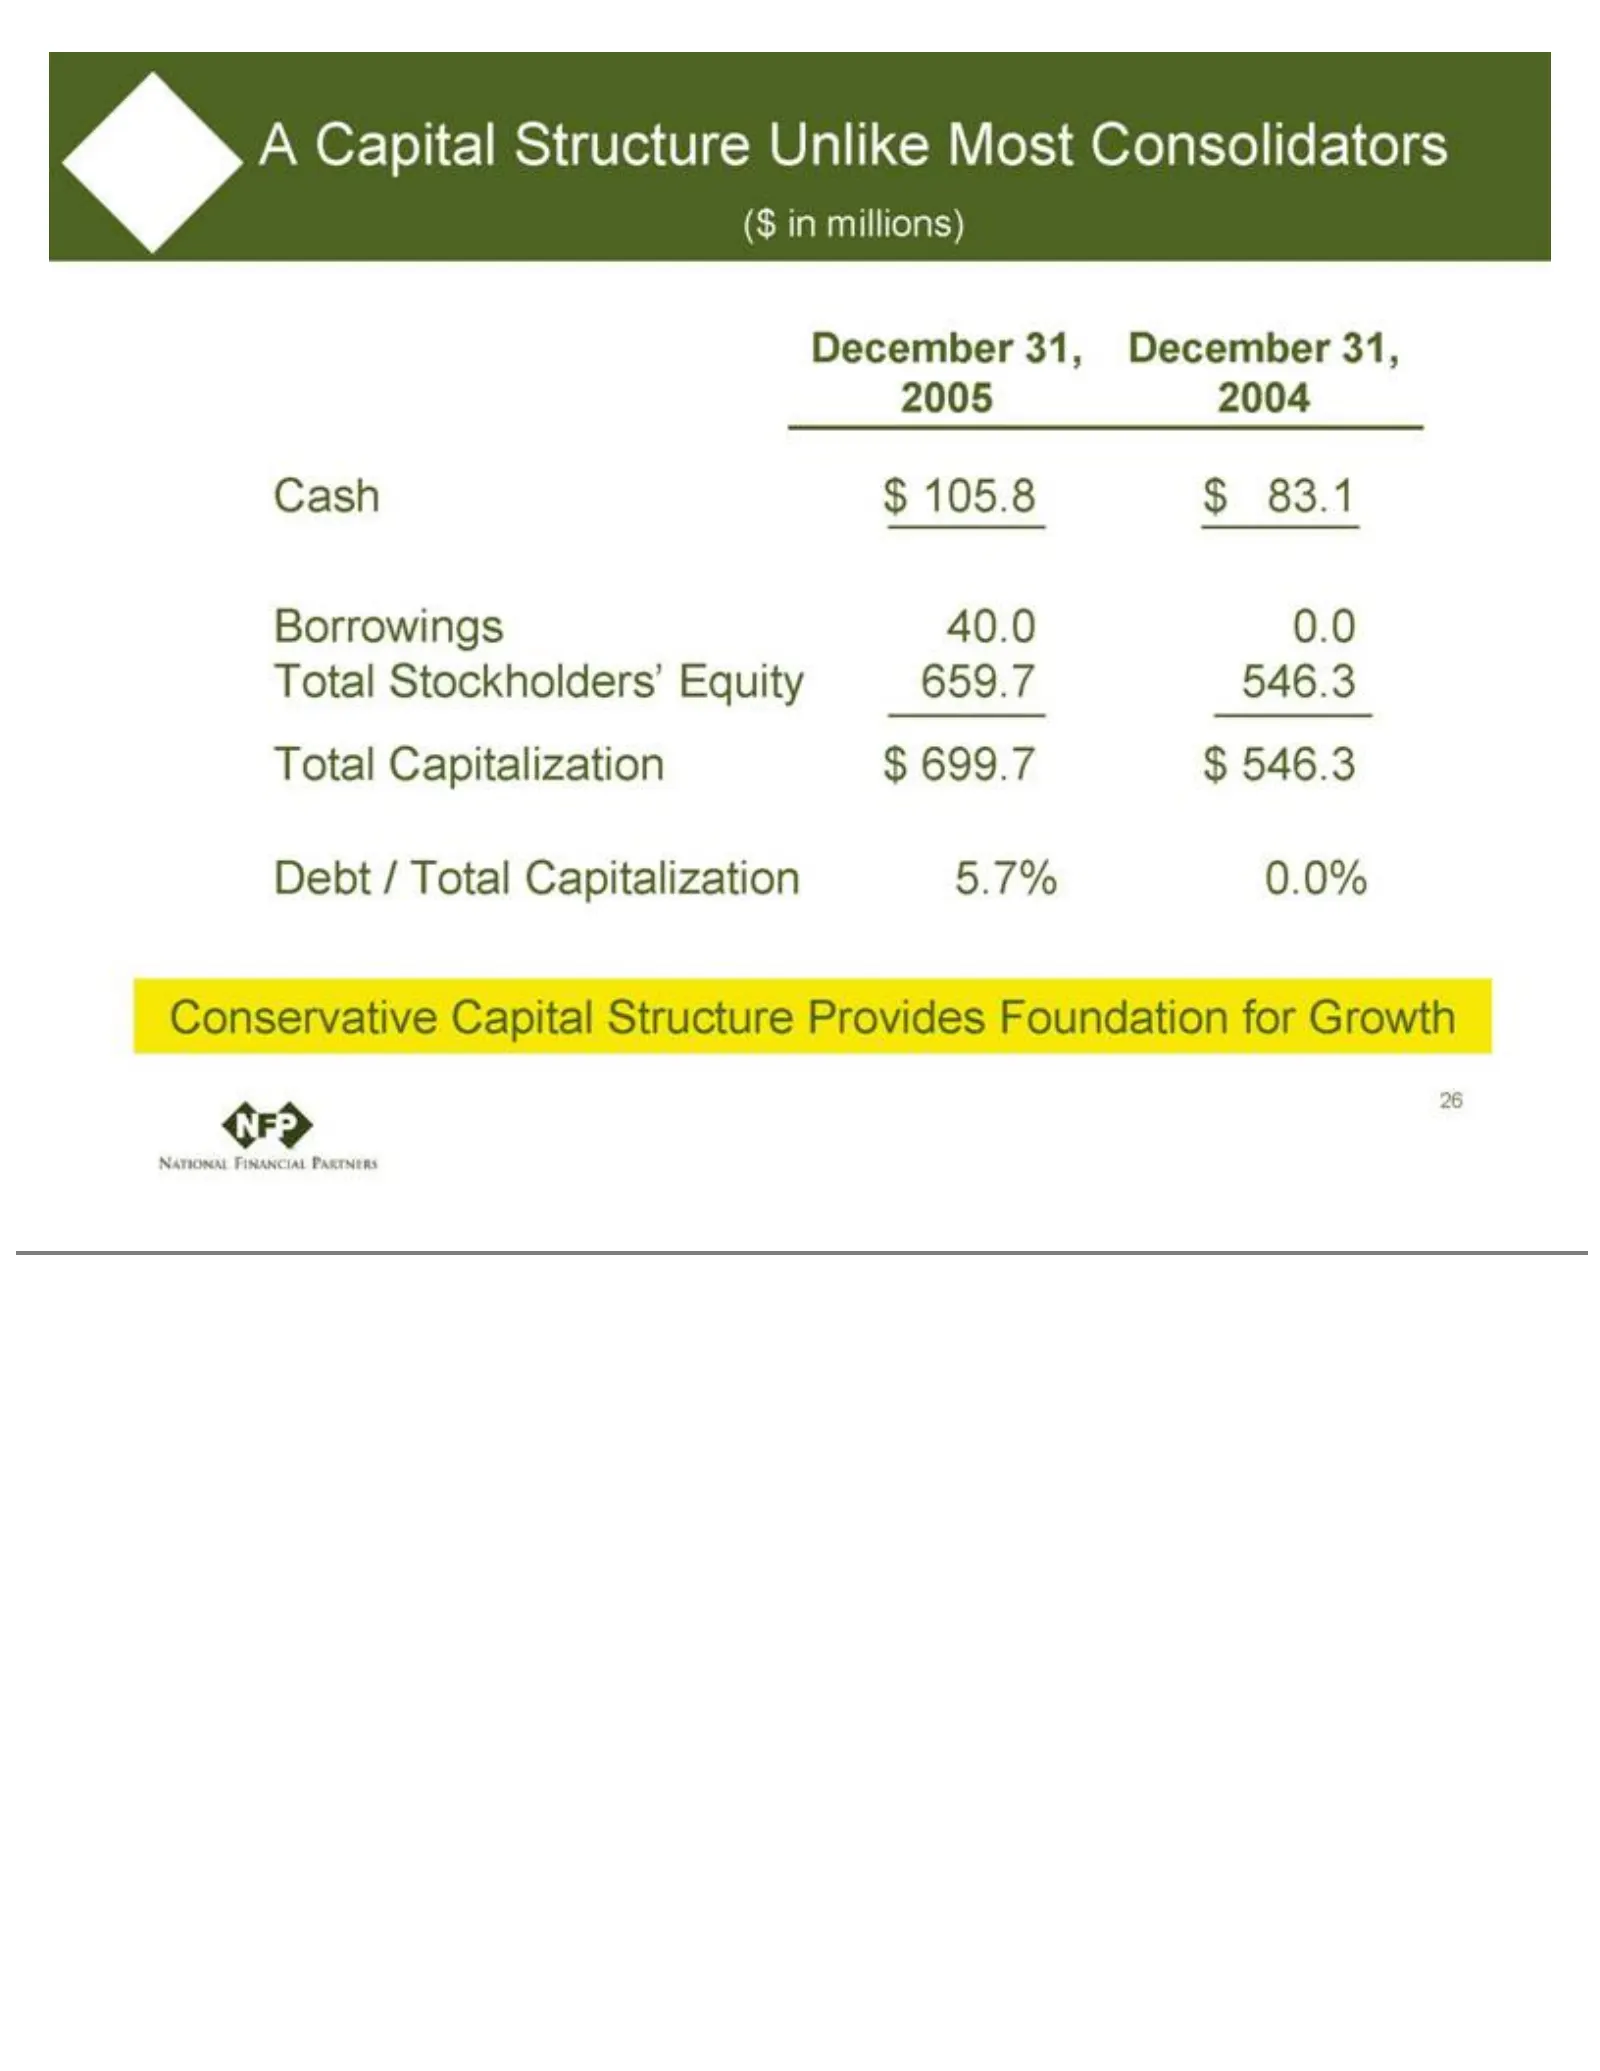
Slide 26: A Conservative Capital Structure
A Capital Structure Capitalization $ 699.7 Unlike $ 546.3 MostDebt Consolidators / Total Capitalization ($ in millions) 5.7%December 0.0% Conservative 31, 2005 December Capital Structure 31, 2004Provides Cash $ Foundation 105.8 $ 83.1for Borrowings Growth 2640.0 0.0 Total Stockholders’ Equity 659.7
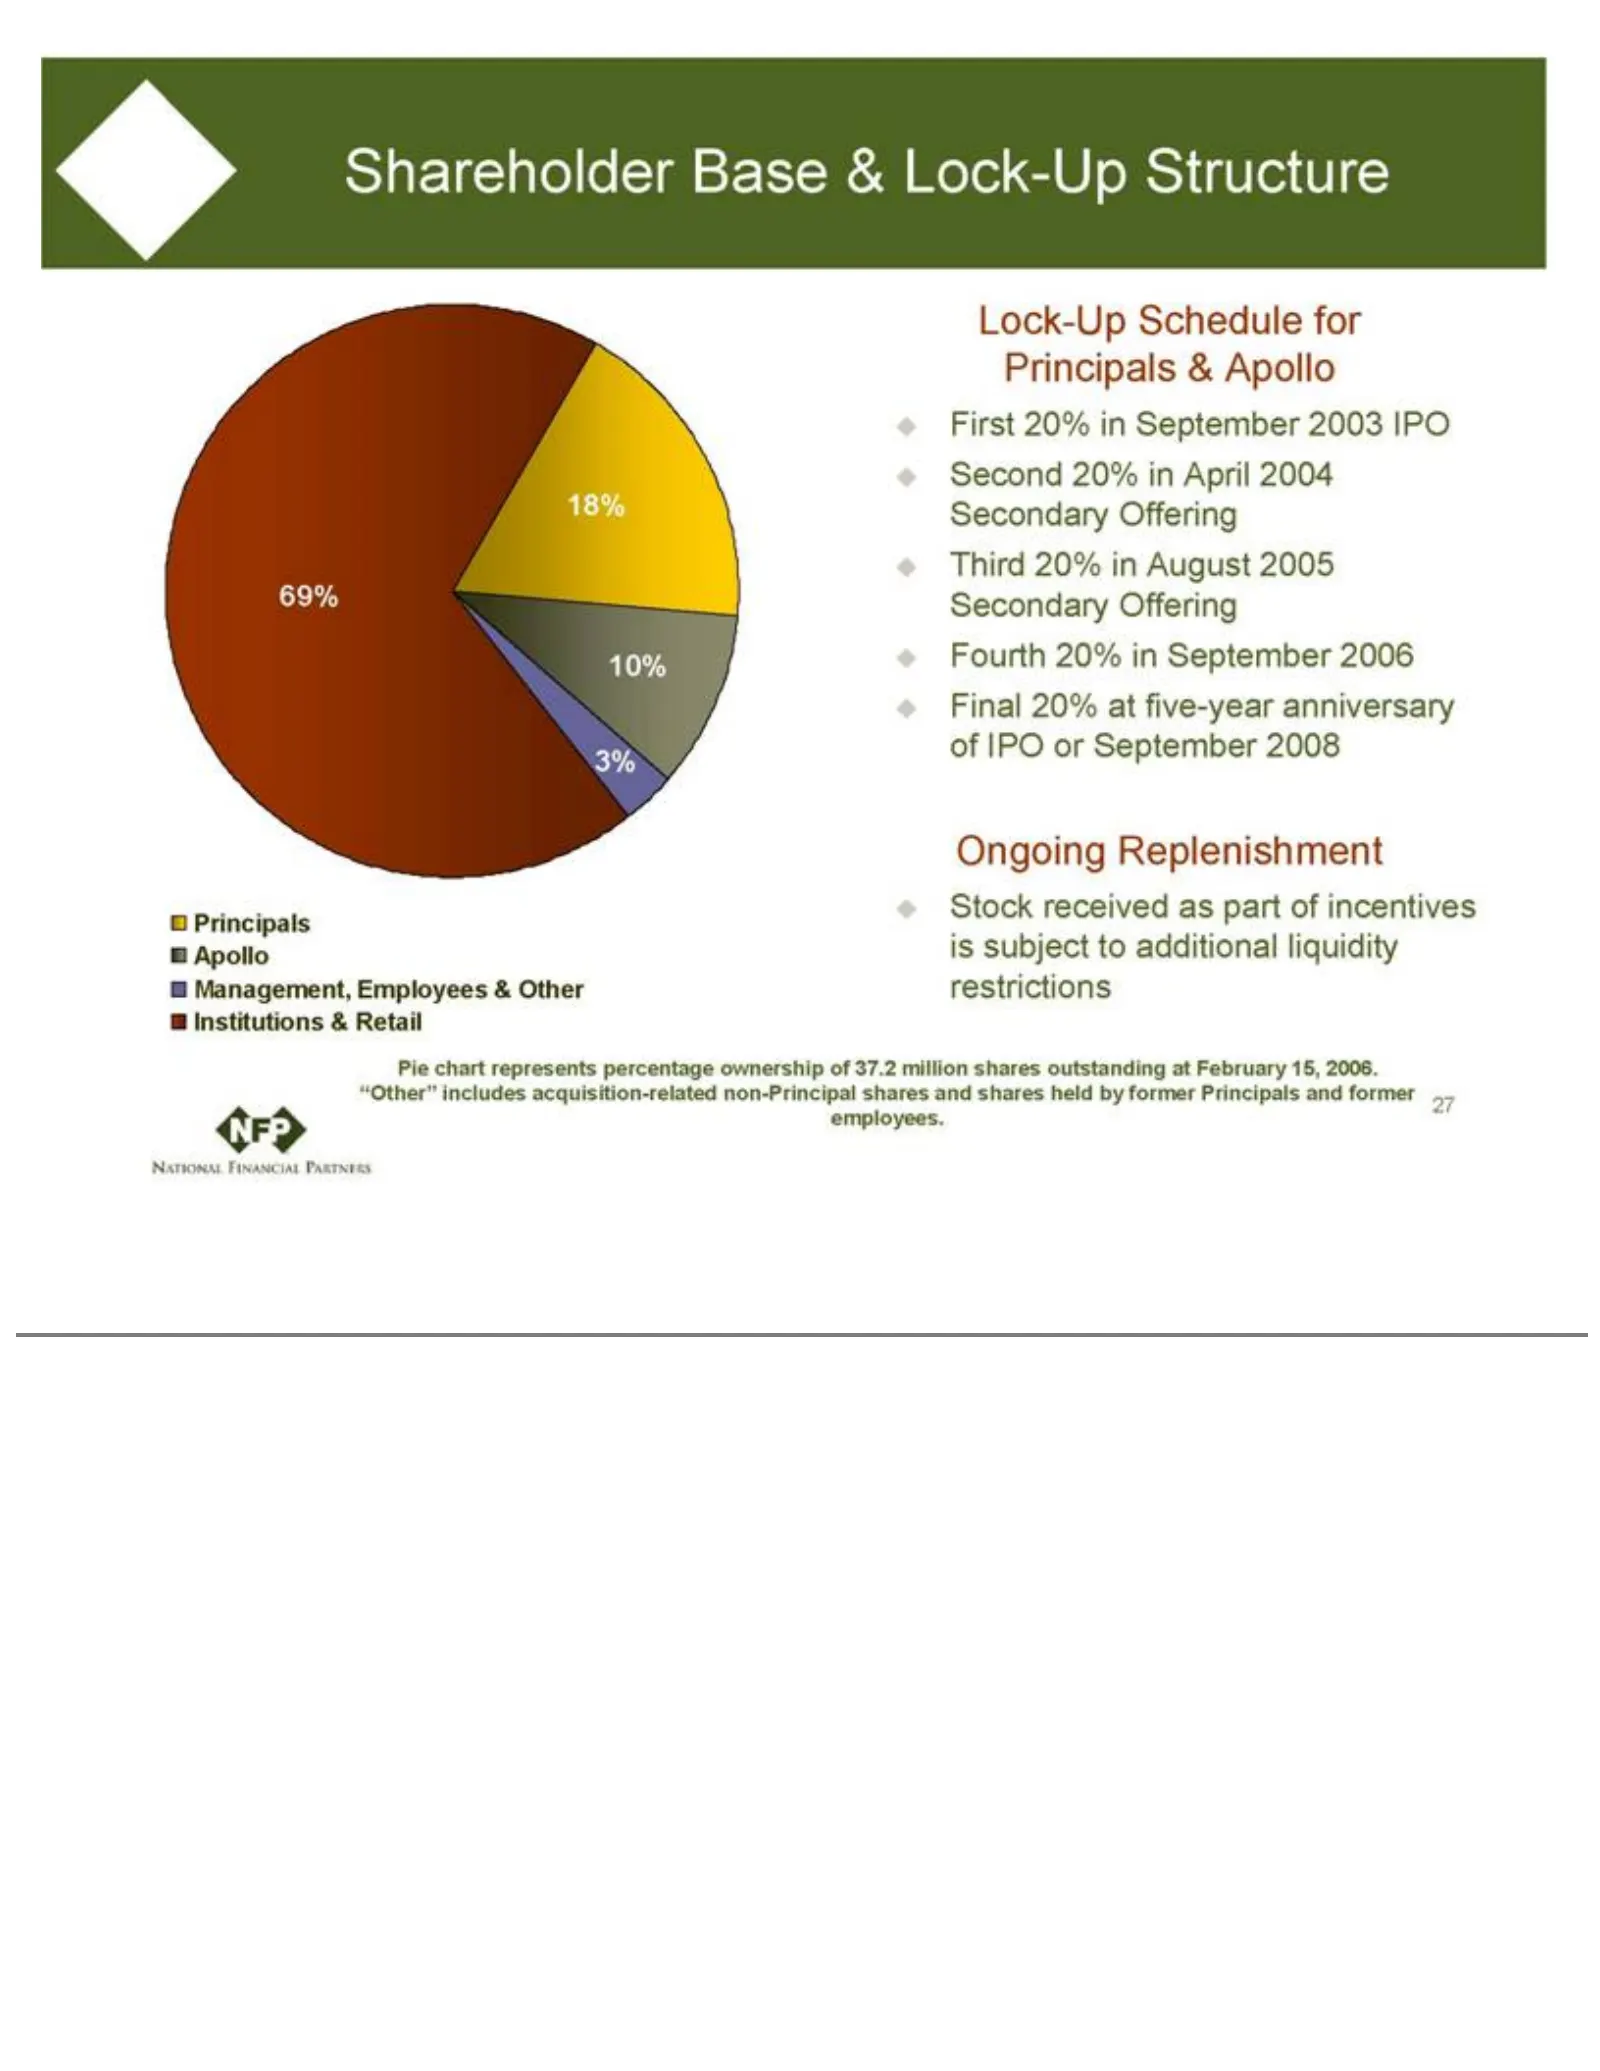
Slide 27: Shareholder Liquidity and Lock-Up Schedule
Shareholder Secondary liquidity former Principals restrictions Offering Base and & Fourth Lock-Up Pie former chart 20%employees. represents Structure in September Lock-Up percentage Principals 2006 Schedule Apollo Final ownership 20% for Management, Principals at of five-year 37.2 million & Employee
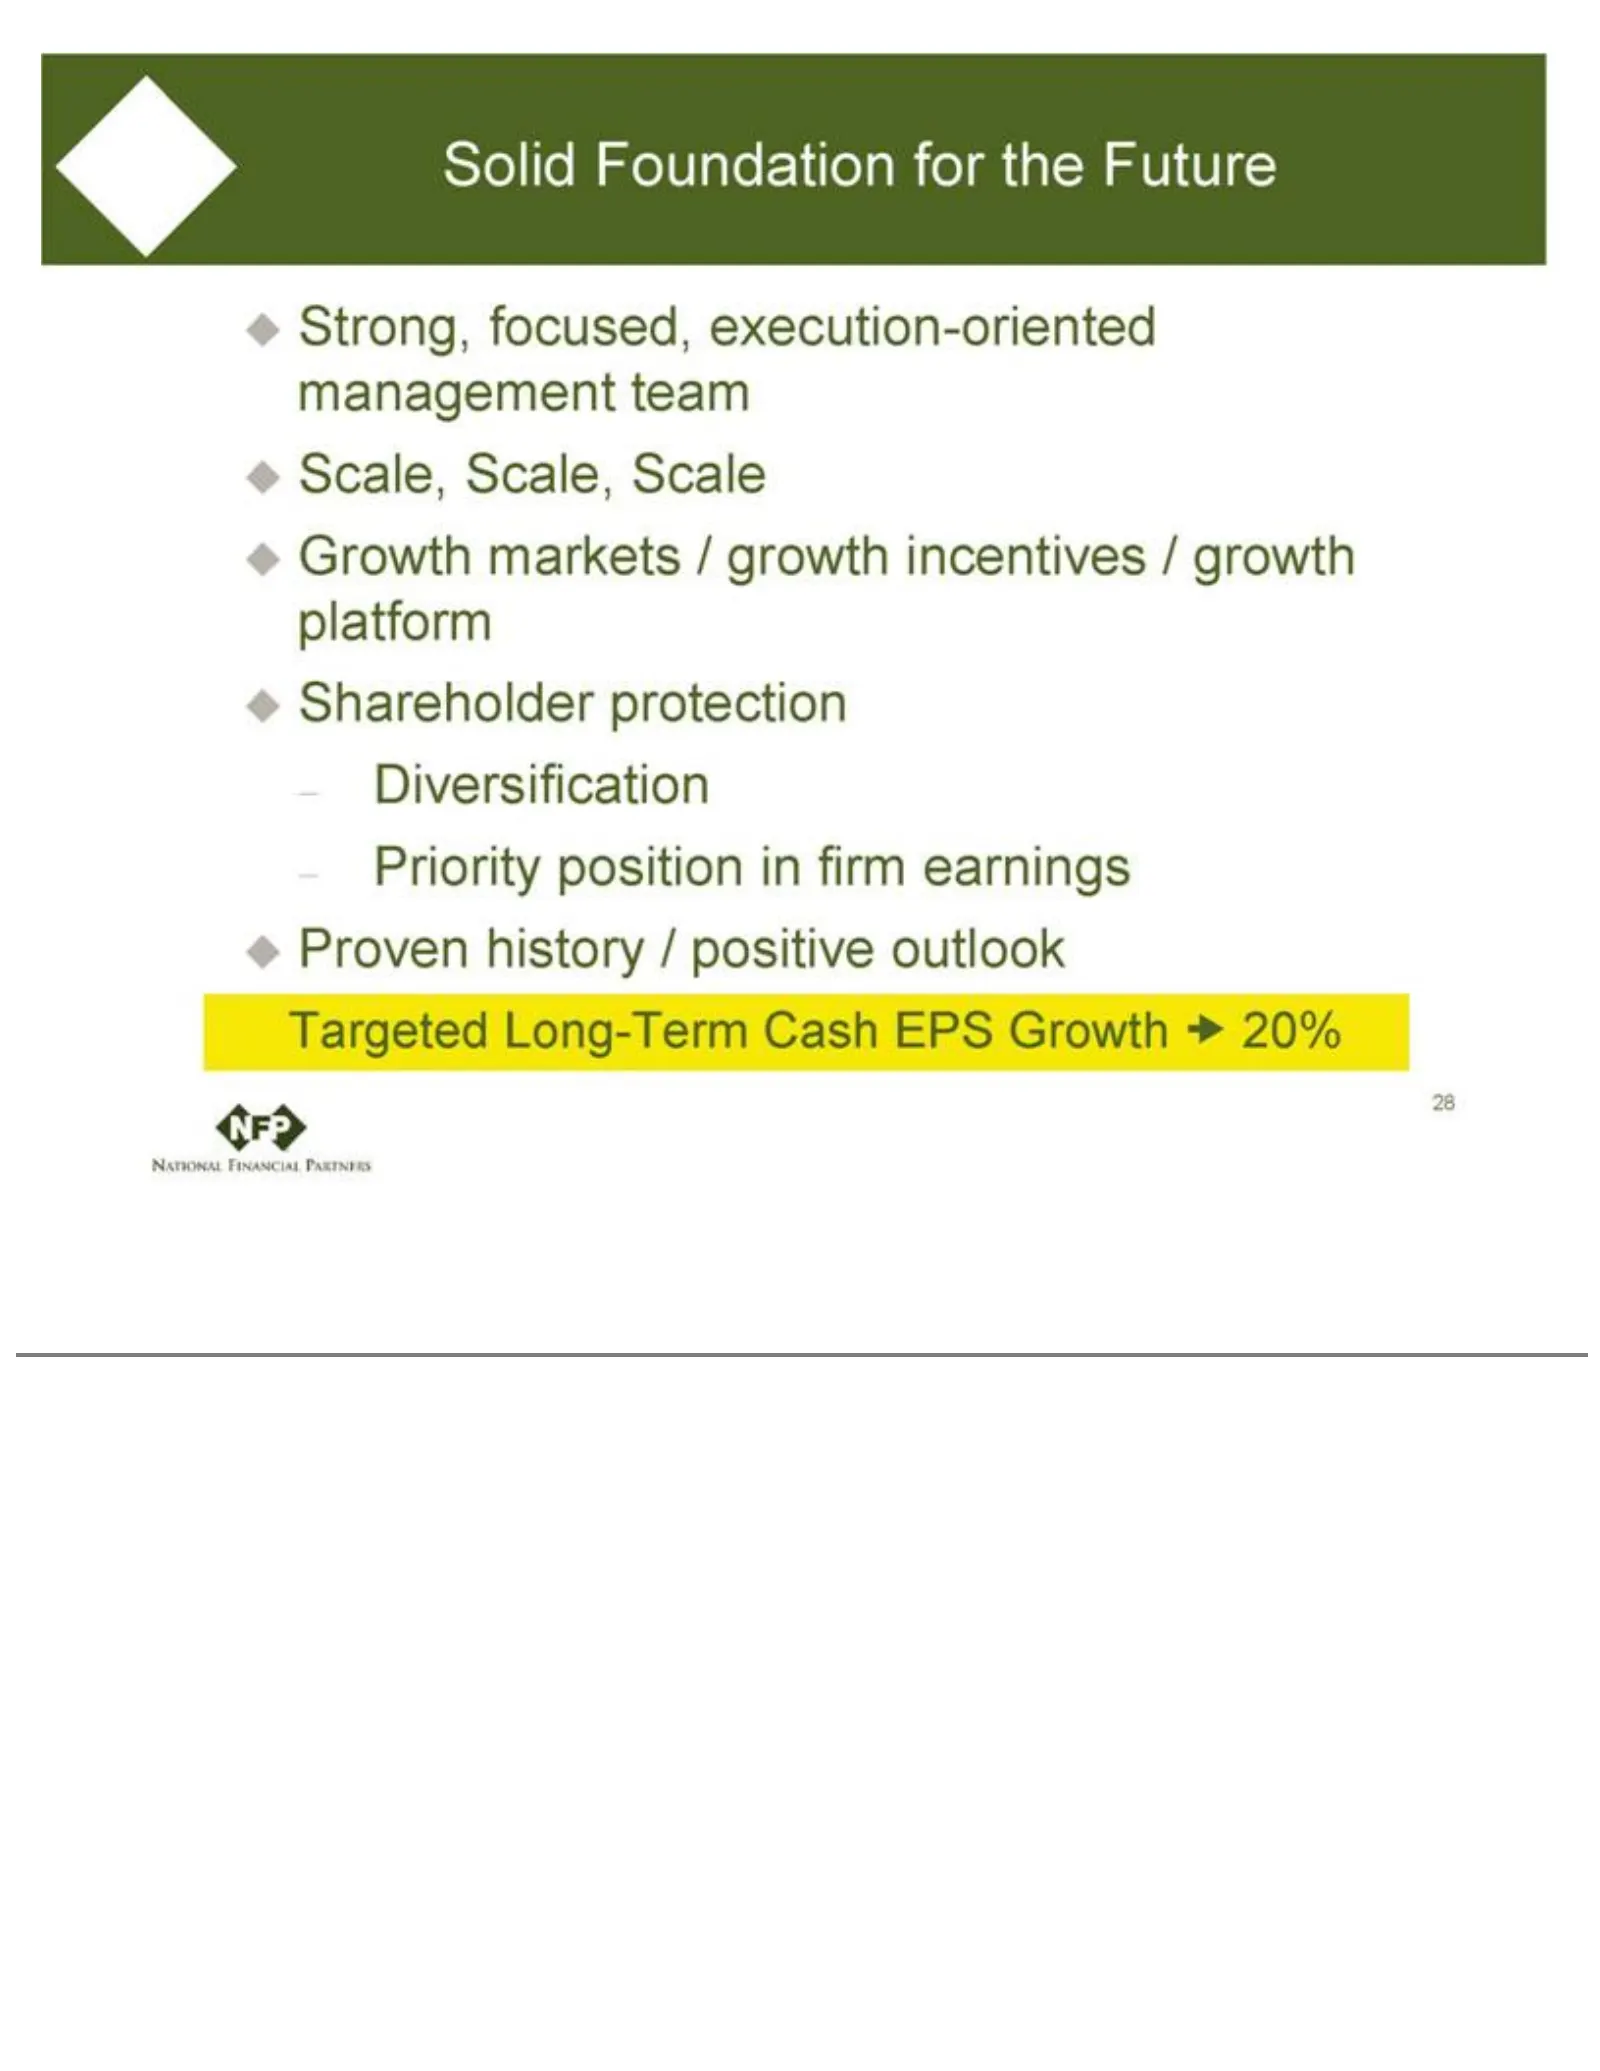
Slide 28: Solid Foundation for the Future
Solid Foundation Diversification Priority for theposition Future Strong, in firm earnings focused, Proven execution-oriented history / positive management outlookteam Targeted Scale, Long-Term Scale, Scale CashGrowth EPS Growth markets20% / growth 28 incentives / growth platform Shareholder protecti

Slide 29: Corporate Headquarters
Corporate Headquarters National Financial Partners 787 7th Avenue, 11th Floor New York, NY 10019 phone 212.301.4000 www.nfp.com 29
Source: SEC EDGAR · 8-K filed Mar 30, 2006
More decks from National Financial Partners Corp
 Q4 2012 Earnings Presentation19 slides · Feb 15, 2013
 Q3 2012 Earnings Presentation18 slides · Oct 31, 2012
 Q2 2012 Earnings Presentation19 slides · Jul 31, 2012
 Q1 2012 Earnings Presentation19 slides · Apr 27, 2012
 Q4 2011 Earnings Presentation18 slides · Feb 8, 2012
 Q3 2011 Earnings Presentation19 slides · Oct 28, 2011