Scatec ASA · OSL:SCATC
Scatec ASA — Q2 2023 Earnings Presentation
20 slides from Scatec ASA's earnings presentation, 2023
Slide 1: Second quarter 2023: Strong construction progress
Second quarter 2023 Strong construction progress CEO, Terje Pilskog & CFO, Hans Jakob Hegge
Slide 2: Disclaimer
Disclaimer The following presentation is being made only to, and is only directed at, persons to whom such presentation may lawfully be communicated (’relevant persons’). Any person who is not a relevant person should not rely, act or make assessment on the basis of this presentation or anything inc
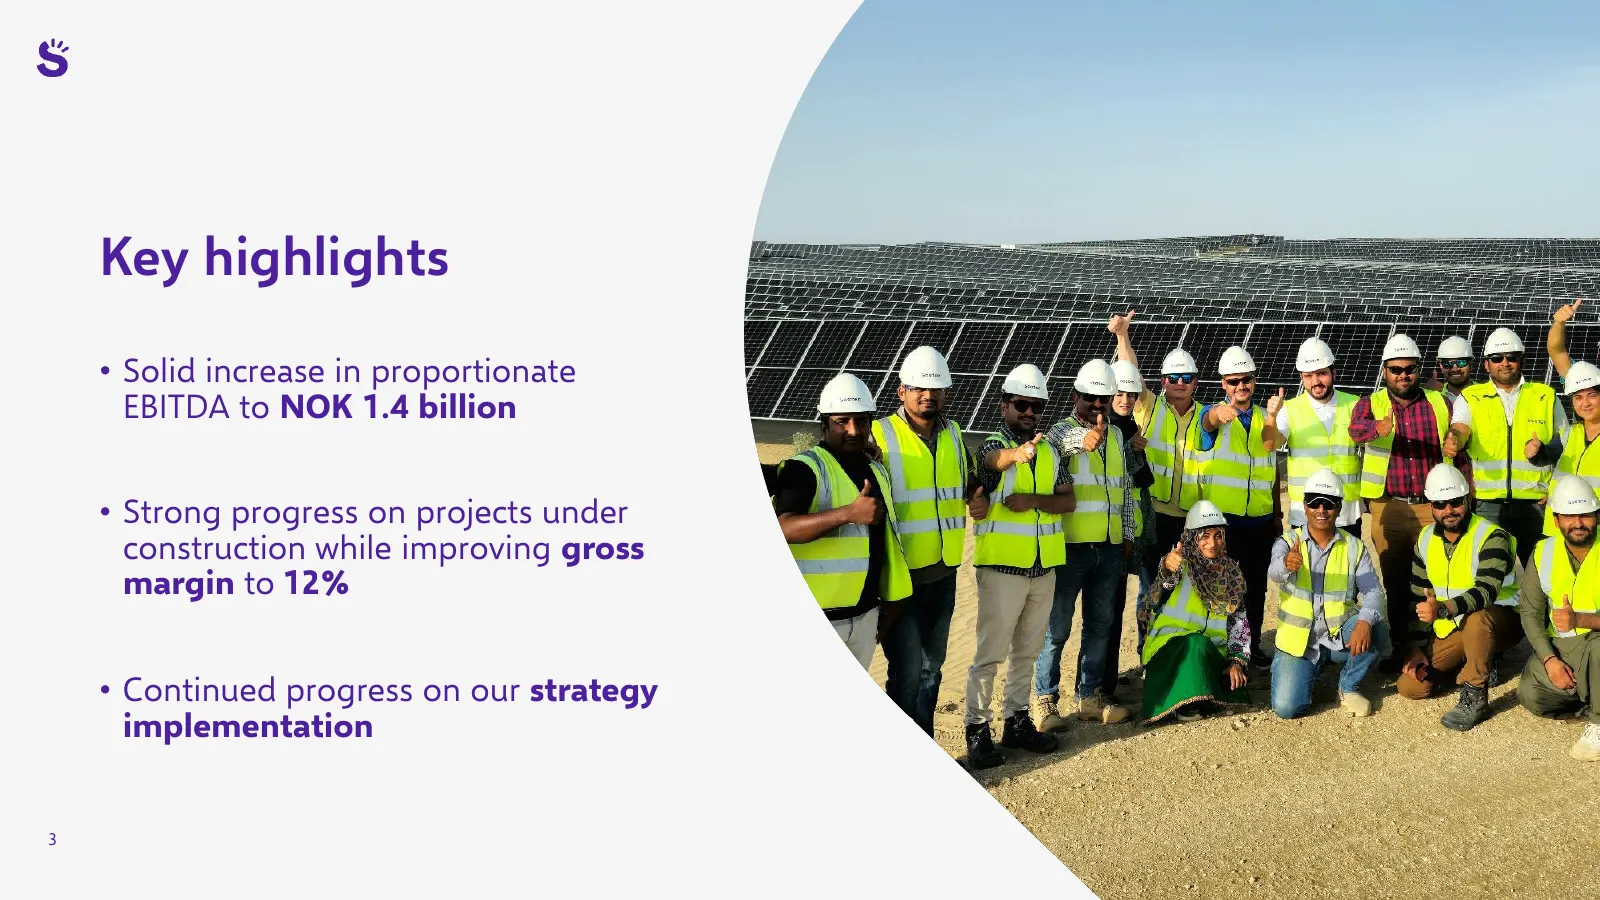
Slide 3: Key highlights
Key highlights • Solid increase in proportionate EBITDA to NOK 1.4 billion • Strong progress on projects under construction while improving gross margin to 12% • Continued progress on our strategy implementation 3
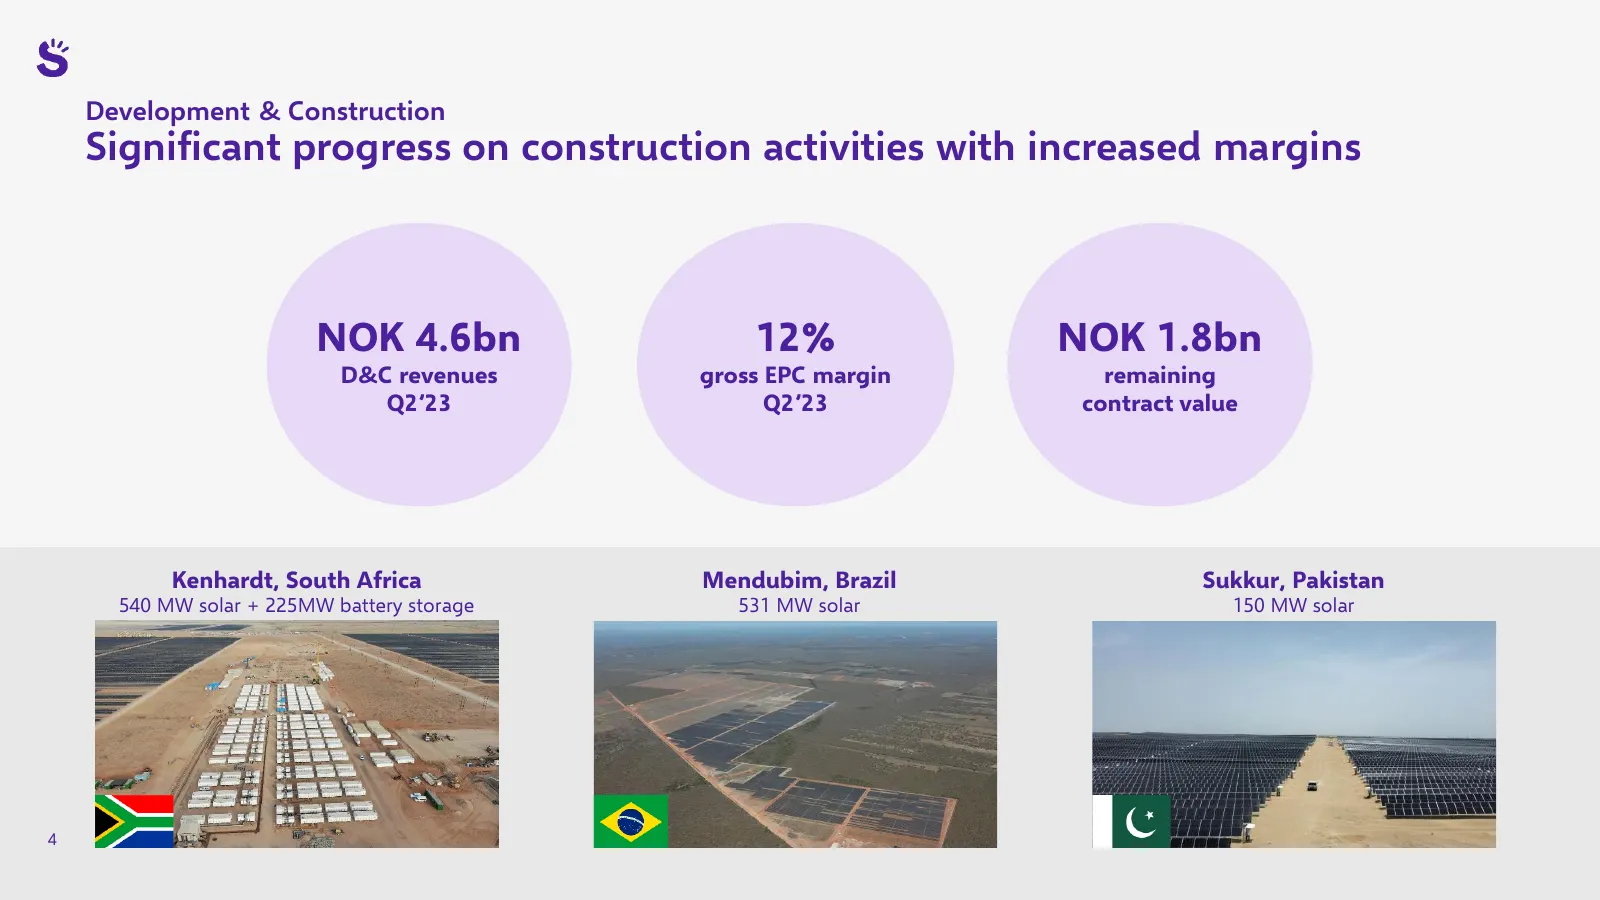
Slide 4: Development & Construction: significant progress with increased margins
Development & Construction Significant progress on construction activities with increased margins NOK 4.6bn 12% NOK 1.8bn D&C revenues gross EPC margin remaining Q2’23 Q2’23 contract value Kenhardt, South Africa Mendubim, Brazil Sukkur, Pakistan 540 MW solar + 225MW battery storage 531 MW solar 150
Slide 5: Solid returns from projects under construction
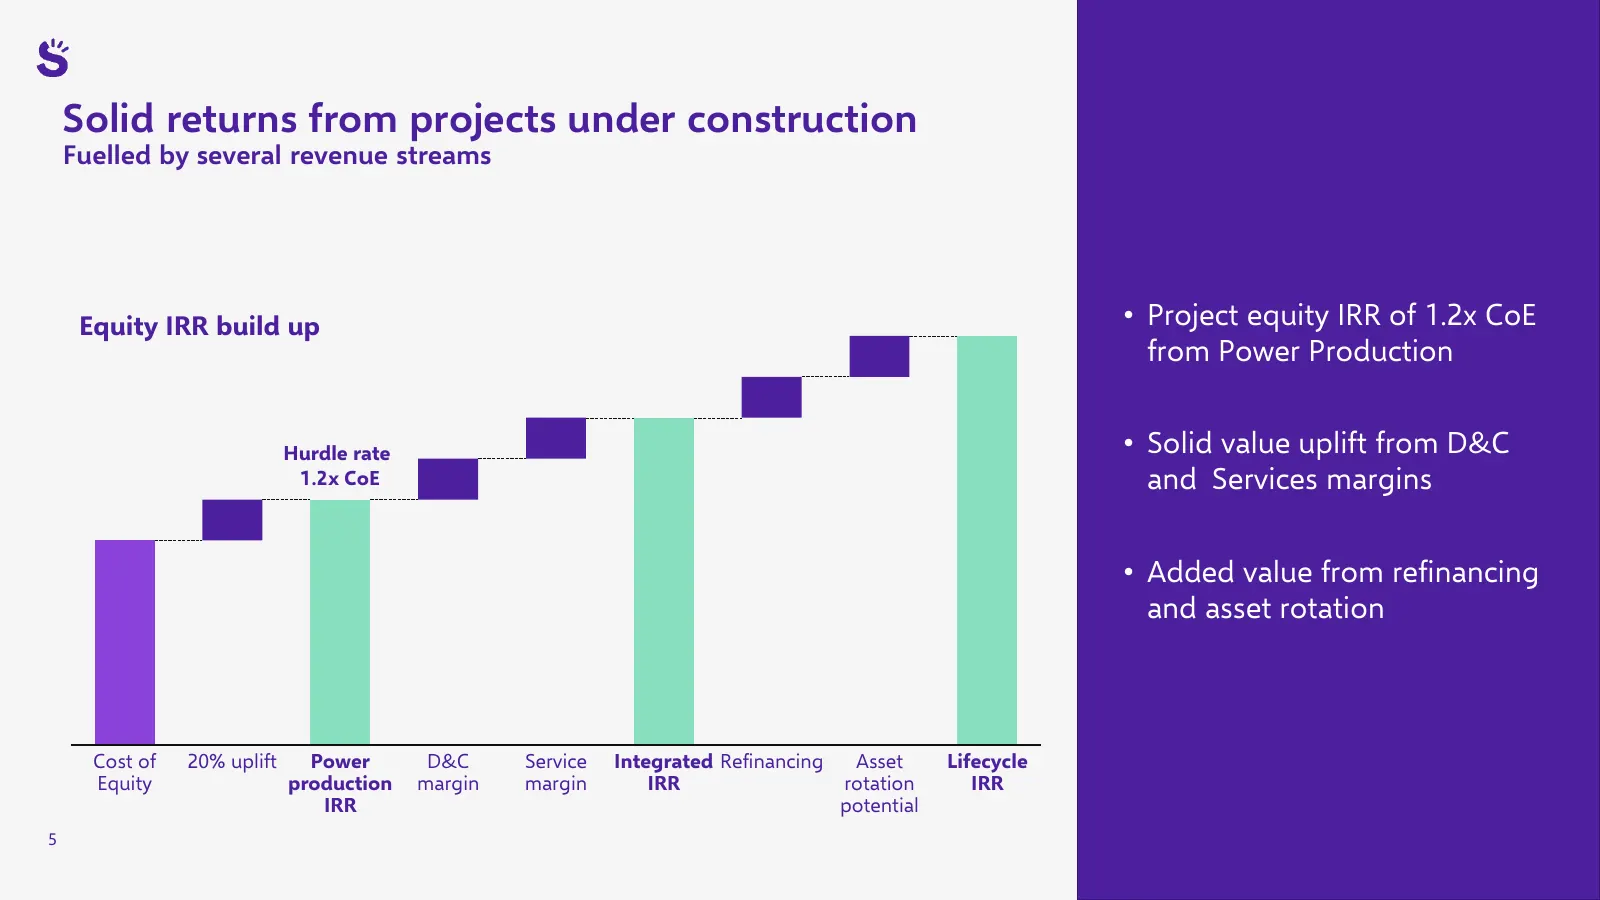
Solid returns from projects under construction Fuelled by several revenue streams Equity IRR build up • Project equity IRR of 1.2x CoE from Power Production Hurdle rate • Solid value uplift from D&C 1.2x CoE and Services margins • Added value from refinancing and asset rotation Cost of 20% uplift Po
Slide 6: Strong and predictable cash flow from operating assets
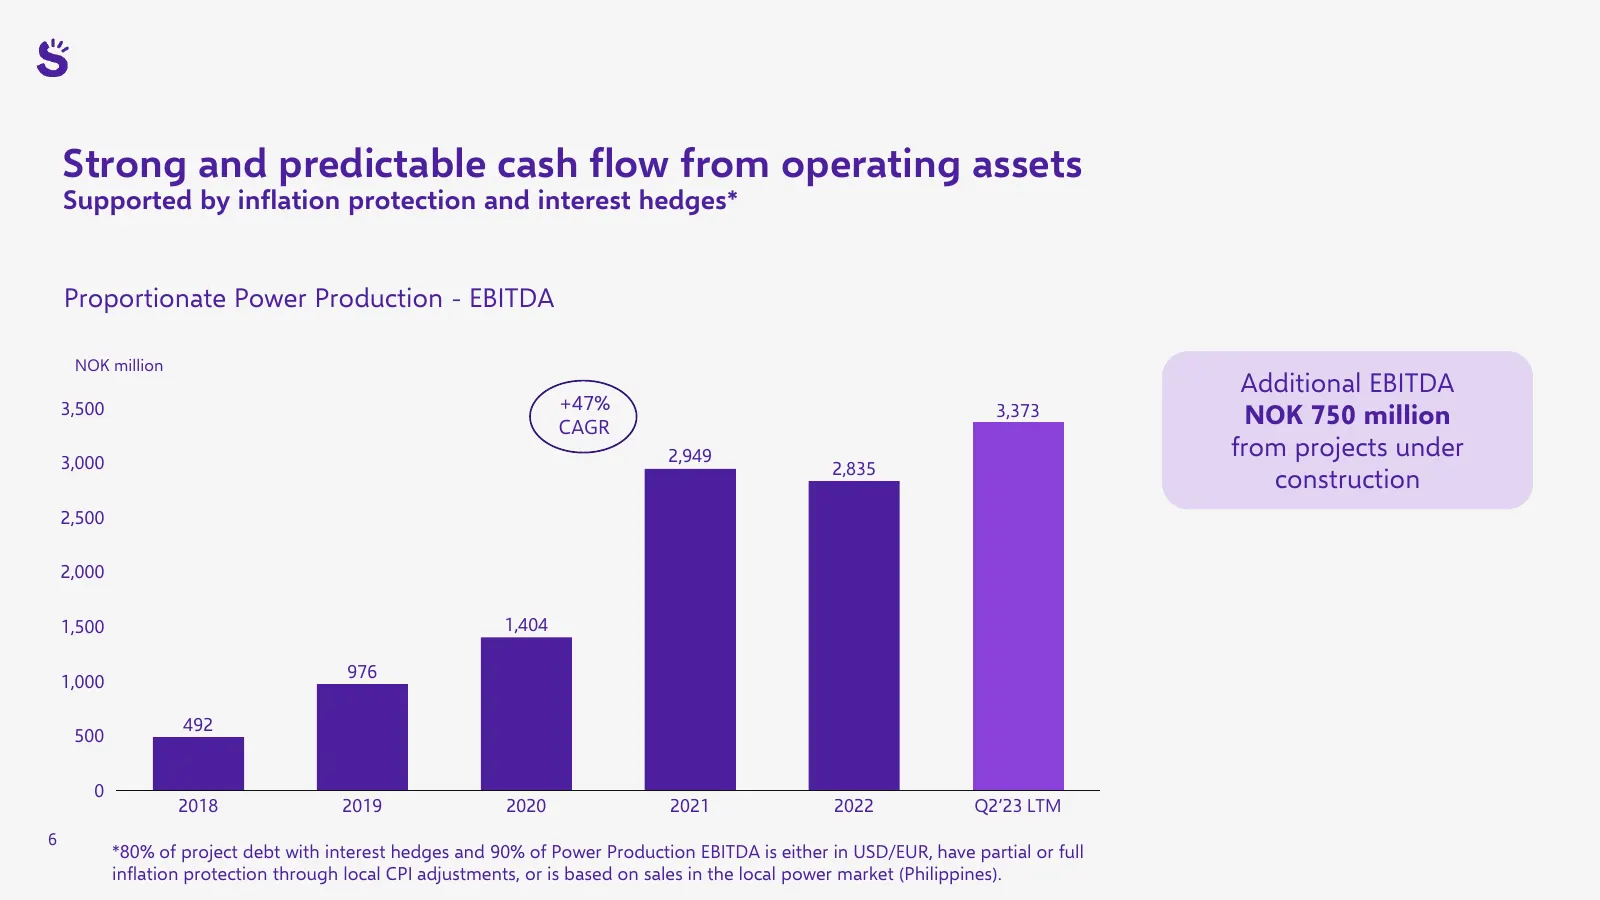
Strong and predictable cash flow from operating assets Supported by inflation protection and interest hedges* Proportionate Power Production - EBITDA NOK million Additional EBITDA 3,500 +47% CAGR 3,373 NOK 750 million 2,949 from projects under 3,000 2,835 construction 2,500 2,000 1,500 1,404 976 1,0
Slide 7: Power Production: strong EBITDA of NOK 959 million
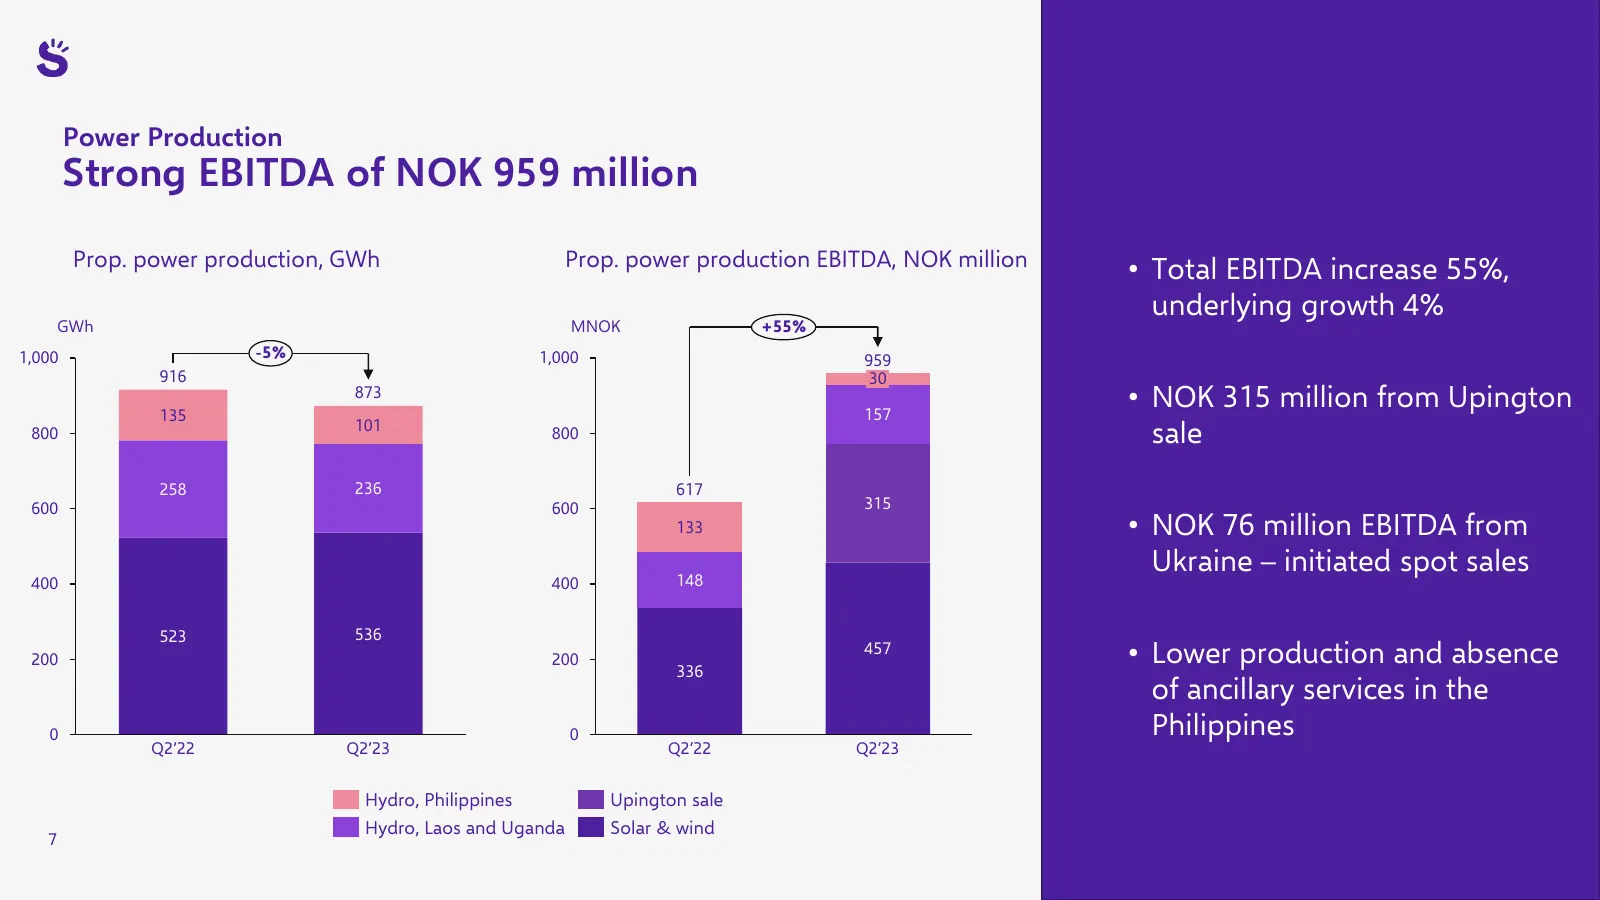
Power Production Strong EBITDA of NOK 959 million Prop. power production, GWh Prop. power production EBITDA, NOK million • Total EBITDA increase 55%, underlying growth 4% GWh MNOK +55% 1,000 -5% 1,000 959 916 30 135 873 157 • NOK 315 million from Upington 800 101 800 sale 258 236 617 600 600 315 133
Slide 8: Delivering on our strategy
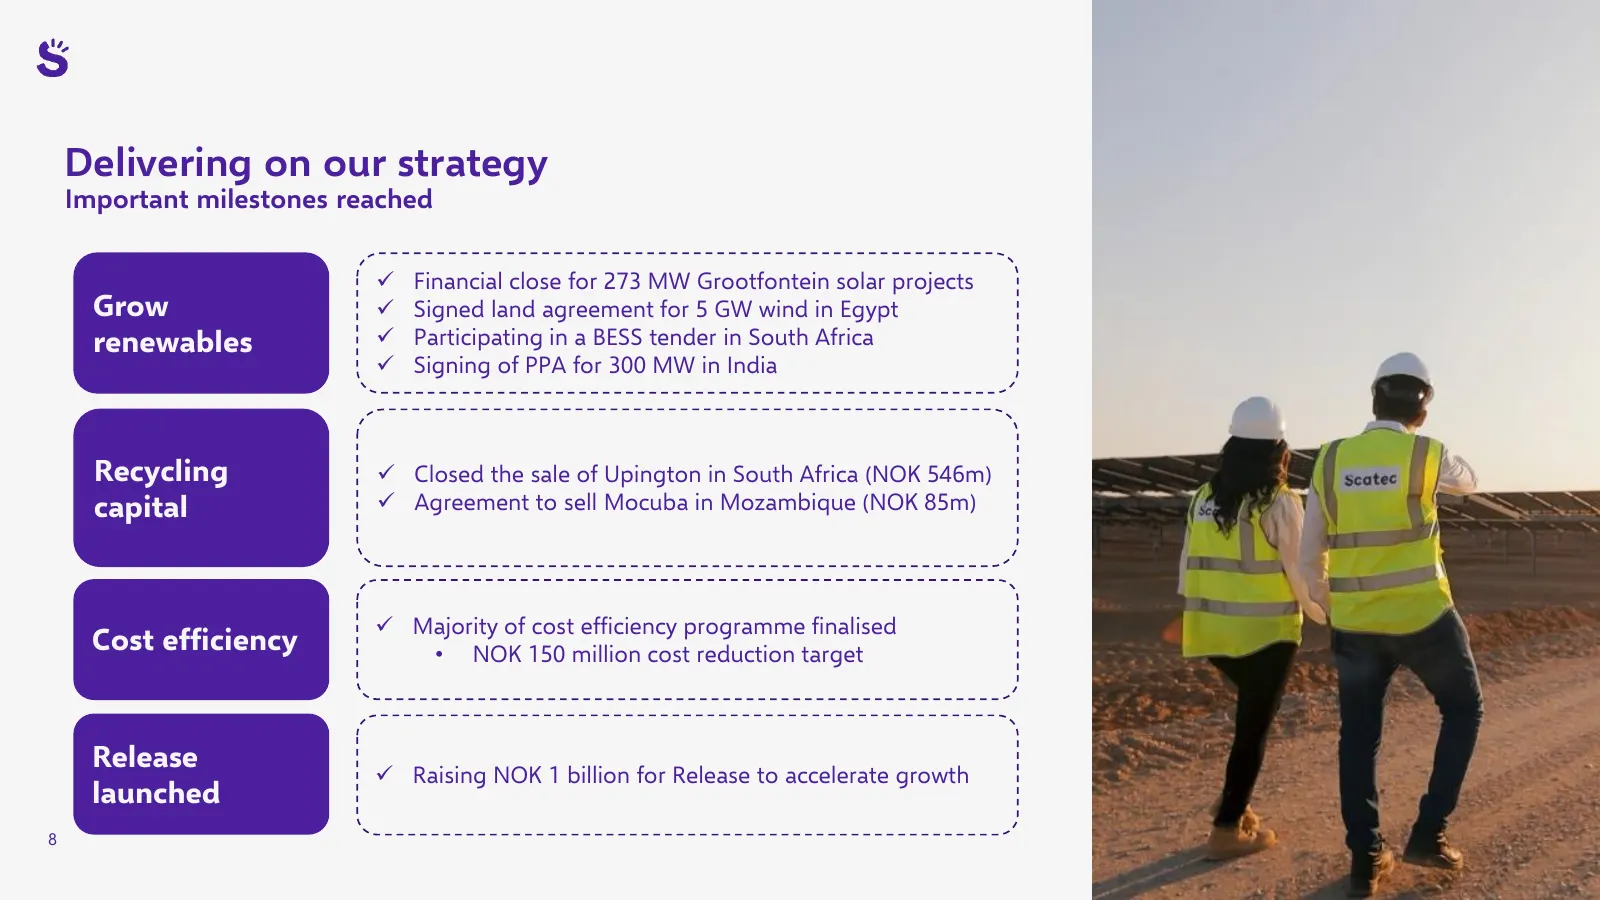
Delivering on our strategy Important milestones reached ✓ Financial close for 273 MW Grootfontein solar projects Grow ✓ Signed land agreement for 5 GW wind in Egypt renewables ✓ Participating in a BESS tender in South Africa ✓ Signing of PPA for 300 MW in India Recycling ✓ Closed the sale of Upingto
Slide 9: Milestone on Release: Raising NOK 1 billion for growth
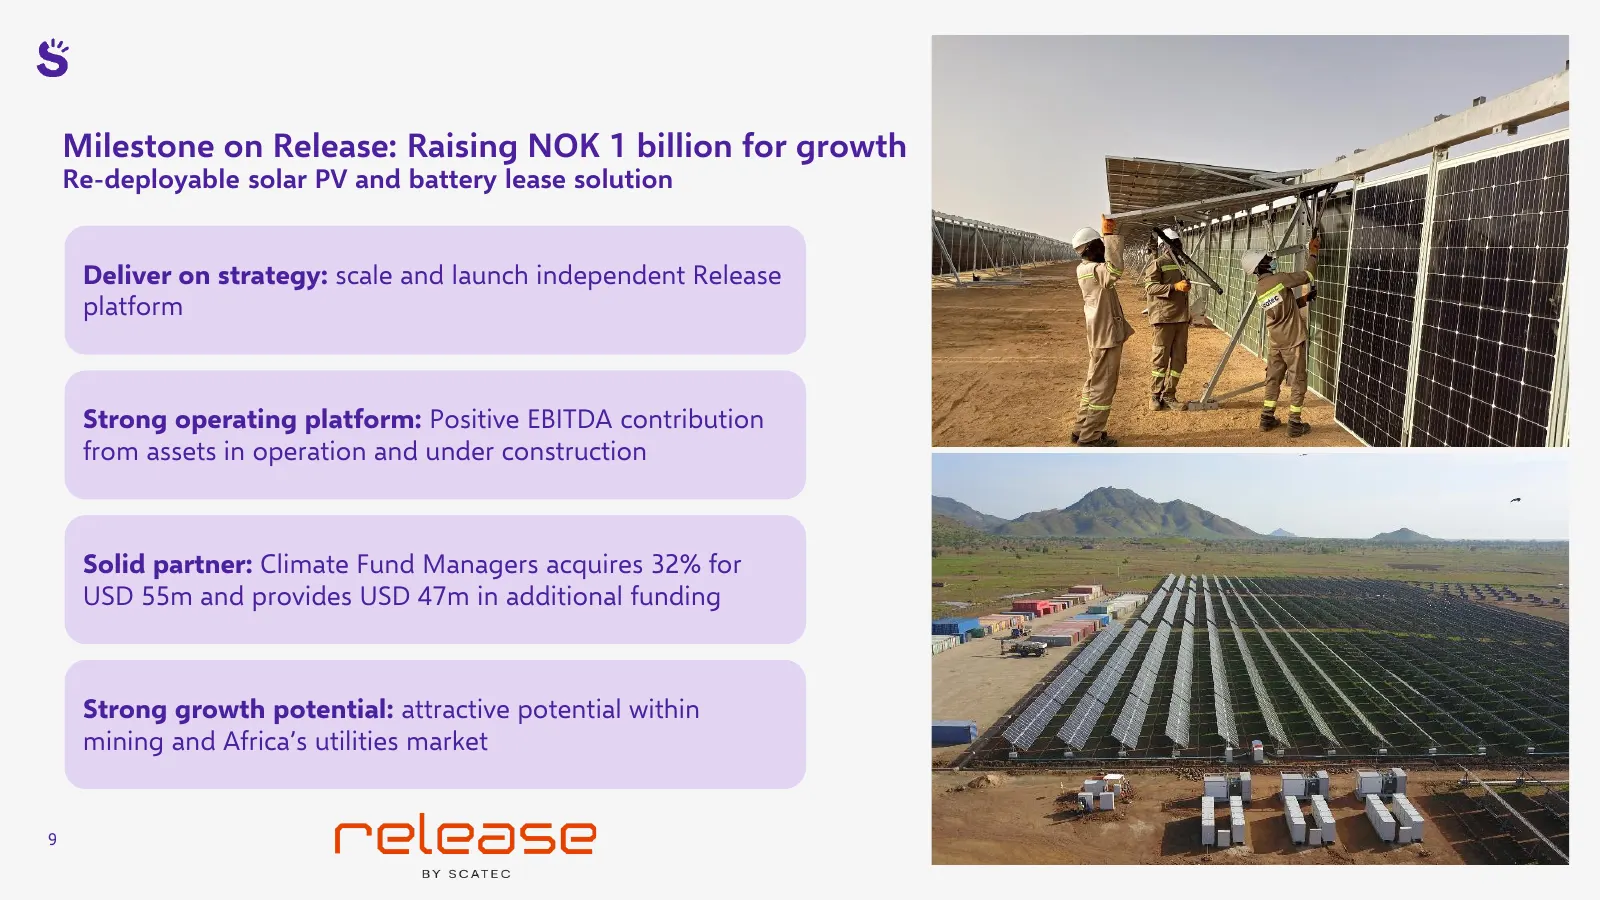
Milestone on Release: Raising NOK 1 billion for growth Re-deployable solar PV and battery lease solution Deliver on strategy: scale and launch independent Release platform Strong operating platform: Positive EBITDA contribution from assets in operation and under construction Solid partner: Climate F

Slide 10: Financial review
Financial review Hans Jakob Hegge, CFO
Slide 11: Significant revenues growth from core segments
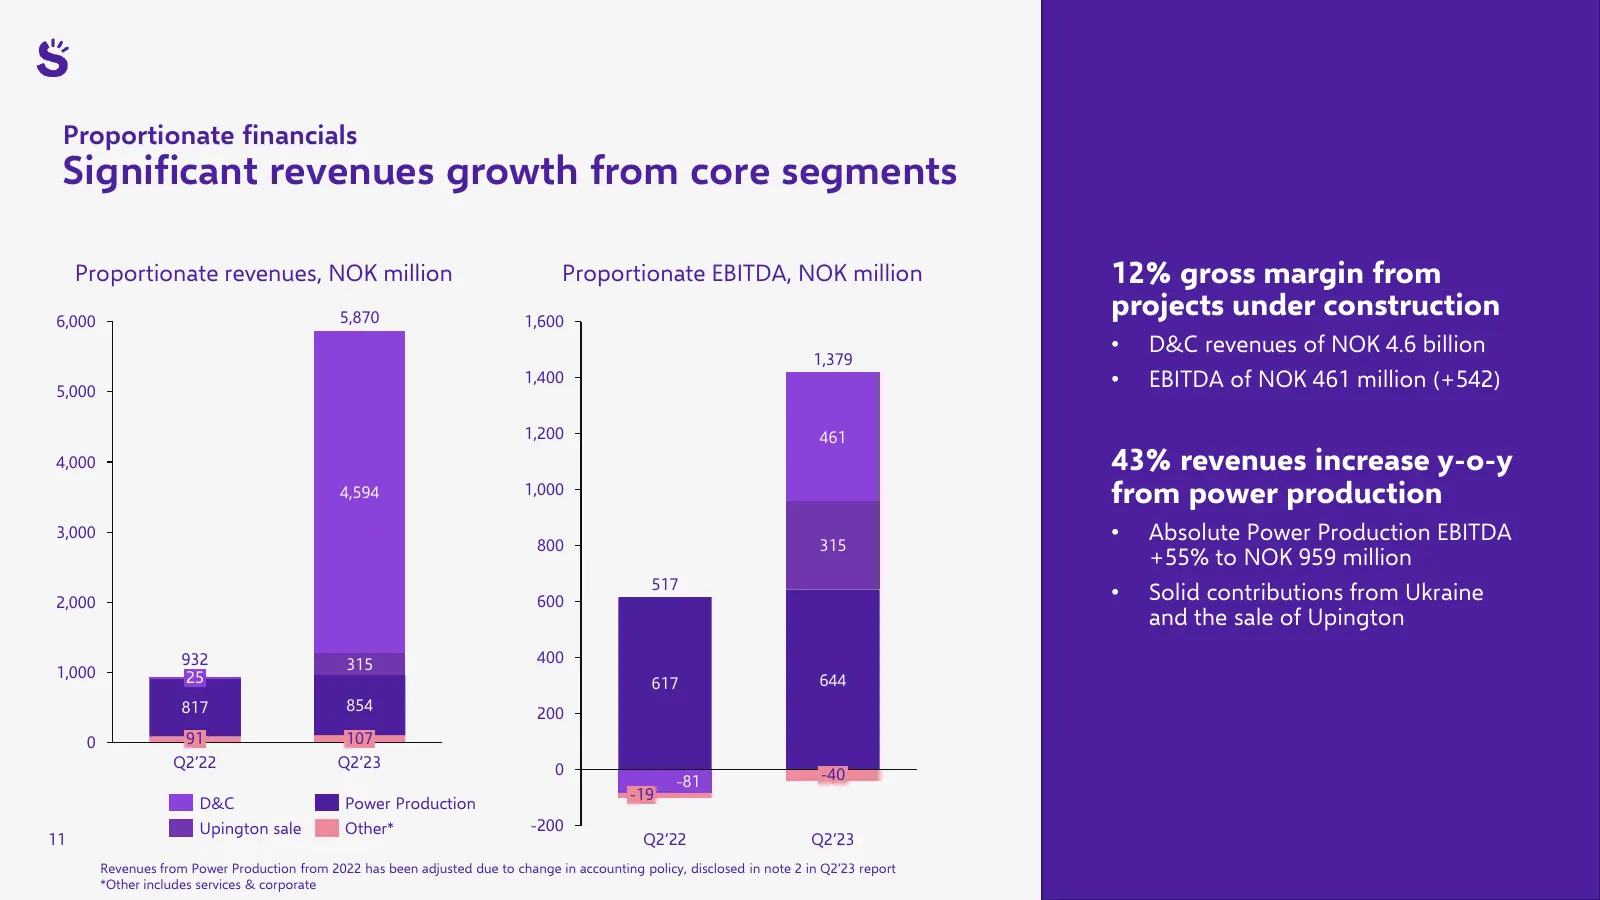
Proportionate financials Significant revenues growth from core segments Proportionate revenues, NOK million Proportionate EBITDA, NOK million 12% gross margin from 6,000 5,870 1,600 projects under construction • D&C revenues of NOK 4.6 billion 1,379 5,000 1,400 • EBITDA of NOK 461 million (+542) 1,2
Slide 12: Total EBITDA of NOK 904 million
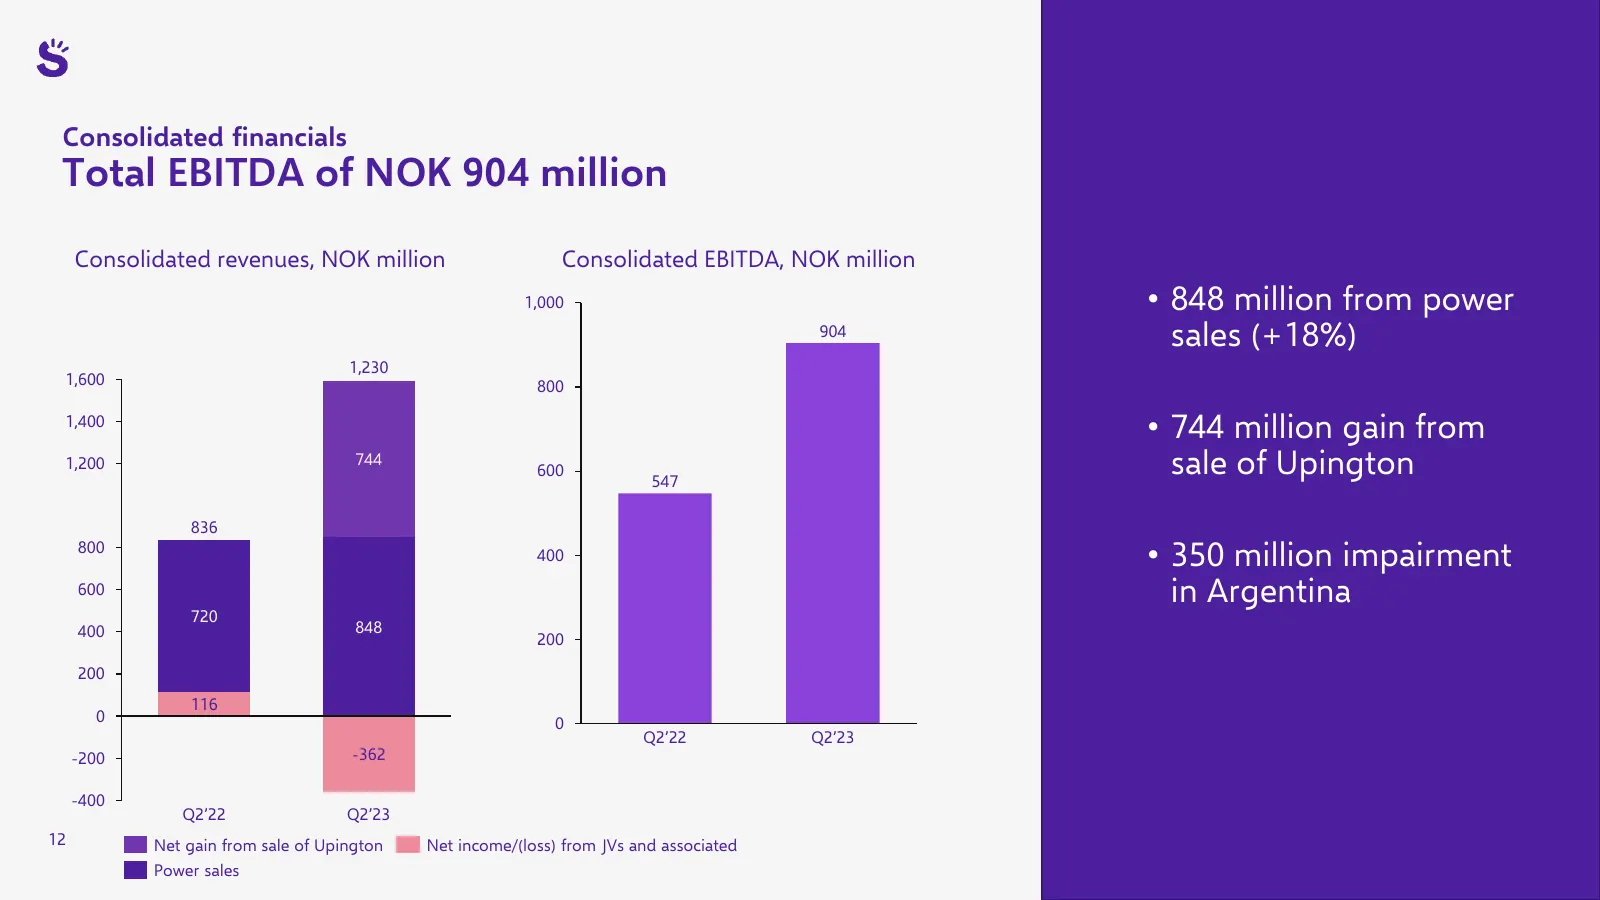
Consolidated financials Total EBITDA of NOK 904 million Consolidated revenues, NOK million Consolidated EBITDA, NOK million 1,000 • 848 million from power 904 sales (+18%) 1,230 1,600 800 1,400 • 744 million gain from 1,200 744 600 547 sale of Upington 836 800 400 • 350 million impairment 600 in Arg
Slide 13: Net debt unchanged in the quarter
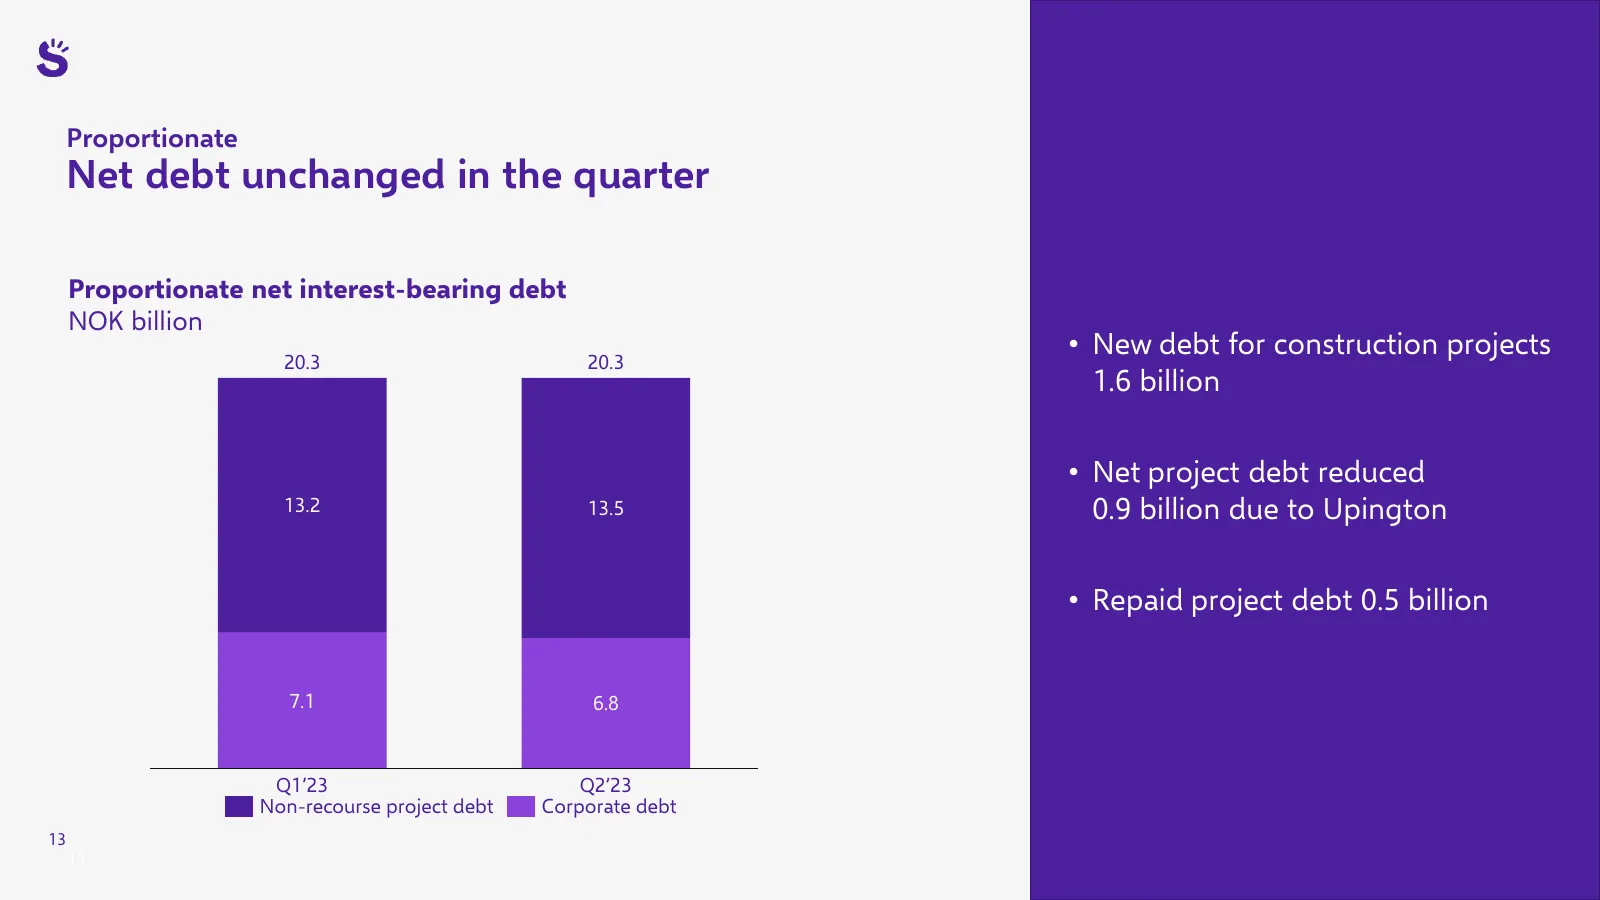
Proportionate Net debt unchanged in the quarter Proportionate net interest-bearing debt NOK billion • New debt for construction projects 20.3 20.3 1.6 billion • Net project debt reduced 13.2 13.5 0.9 billion due to Upington • Repaid project debt 0.5 billion 7.1 6.8 Q1’23 Q2’23 Non-recourse project d
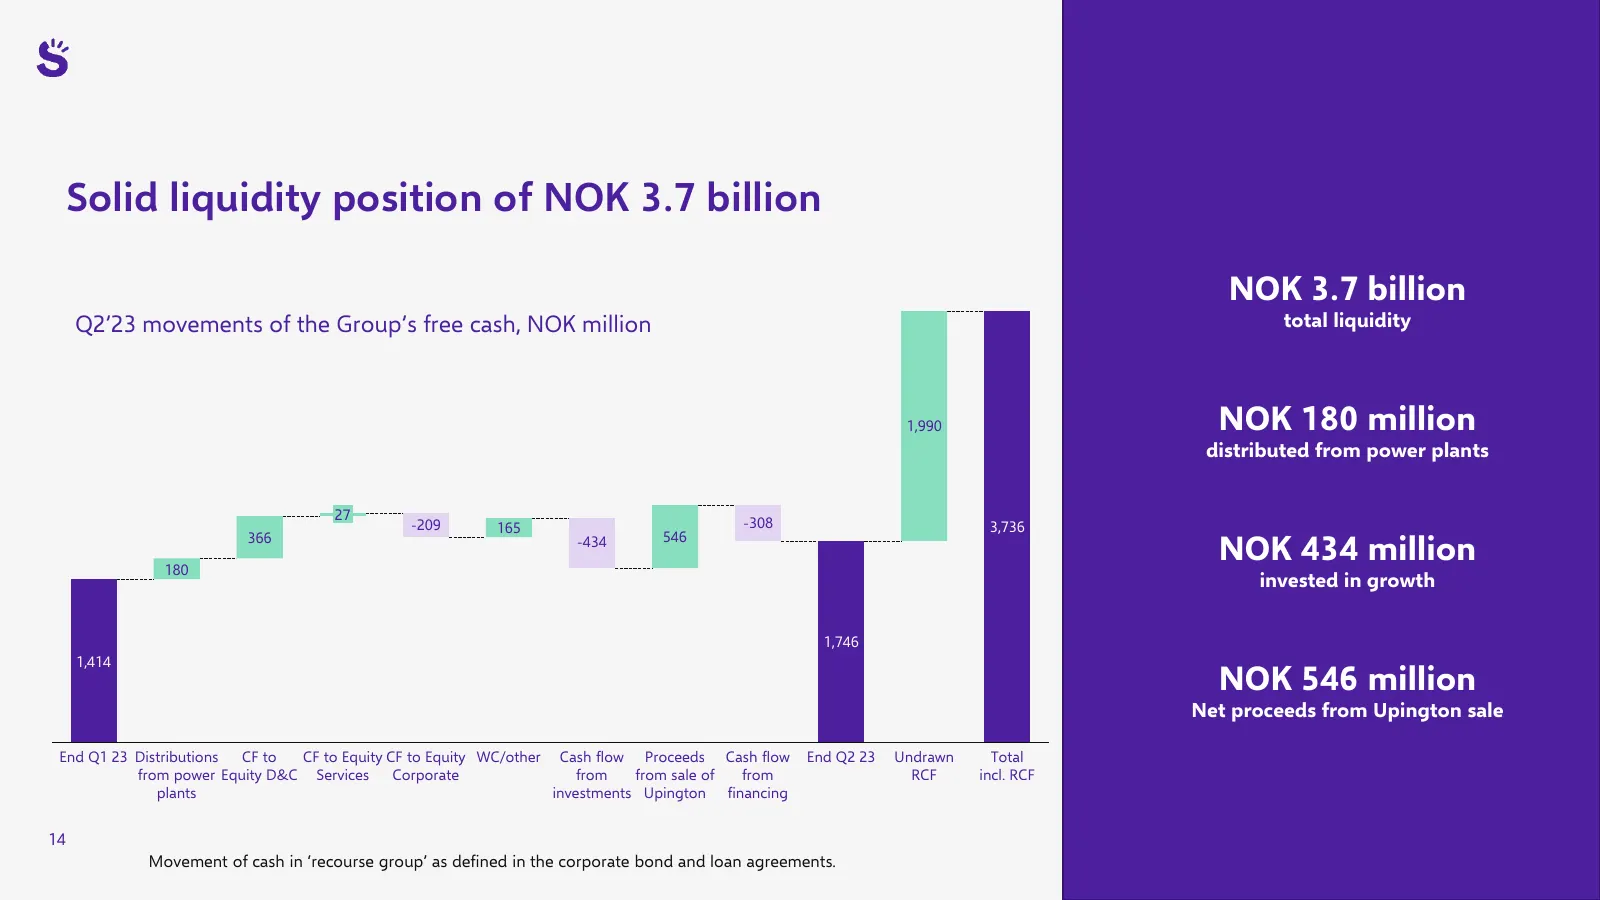
Slide 14: Solid liquidity position of NOK 3.7 billion
Solid liquidity position of NOK 3.7 billion NOK 3.7 billion Q2’23 movements of the Group’s free cash, NOK million total liquidity 1,990 NOK 180 million distributed from power plants 27 -209 165 -308 3,736 NOK 434 million 366 -434 546 180 invested in growth 1,746 1,414 NOK 546 million Net proceeds fr
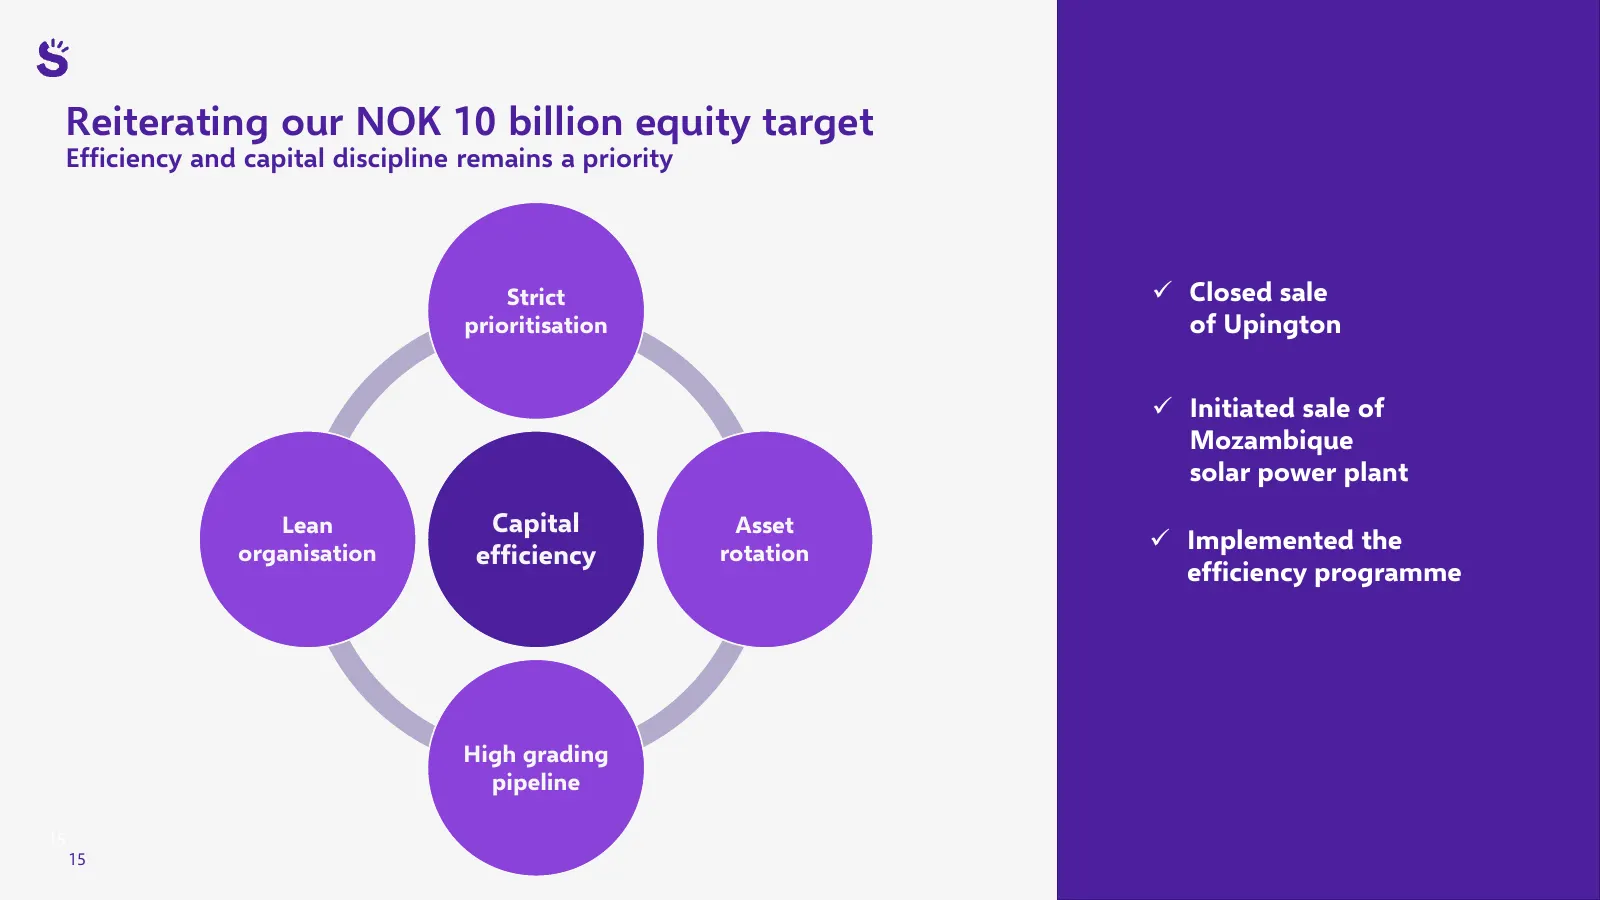
Slide 15: Reiterating our NOK 10 billion equity target
Reiterating our NOK 10 billion equity target Efficiency and capital discipline remains a priority Strict ✓ Closed sale prioritisation of Upington ✓ Initiated sale of Mozambique solar power plant Lean Capital Asset ✓ Implemented the organisation efficiency rotation efficiency programme High grading p
Slide 16: Outlook
Outlook Power Production EBITDA • FY’23 estimate increased by NOK 250 million to 3.1-3.4 billion • Q3’23 Philippines estimate of NOK 180-240 million • Proportionate power production reduced by 100 GWh to 3,400-3,800 GWh Development & Construction • Remaining contract value of NOK 1.8 billion • Estim
Slide 17: Summing up
Summing up • Strong operational performance • Speedy construction with margins increased • Solid progress on strategy implementation 17
Slide 18: Scatec: improving our future
Scate improving our future
Slide 19: Overview of change in proportionate net debt during the quarter
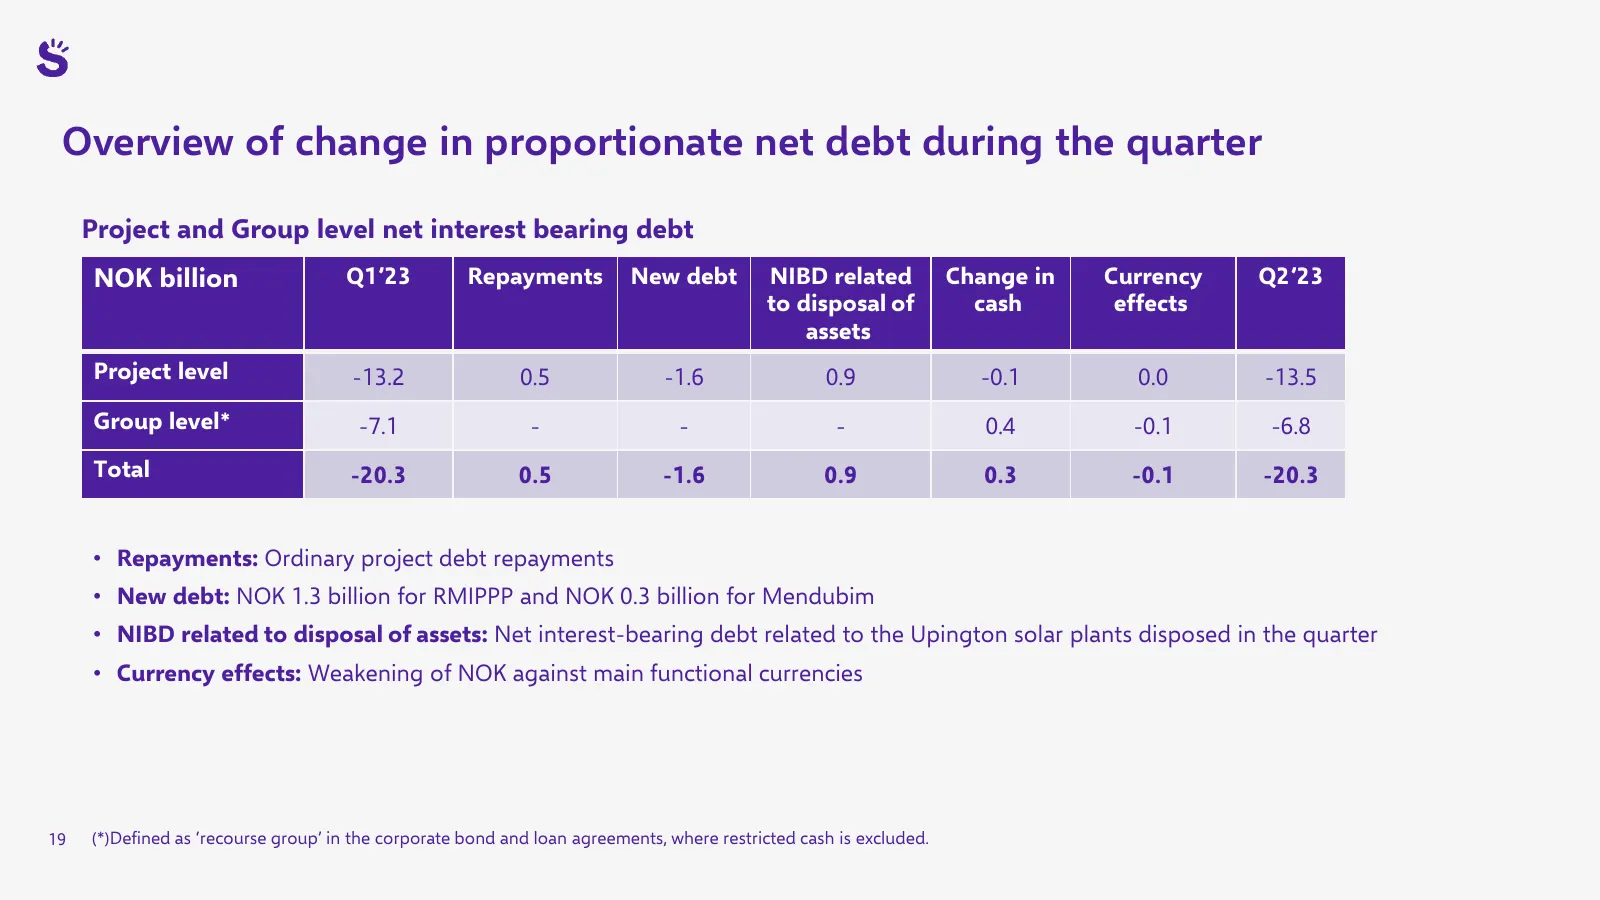
Overview of change in proportionate net debt during the quarter Project and Group level net interest bearing debt NOK billion Q1’23 Repayments New debt NIBD related Change in Currency Q2’23 to disposal of cash effects assets Project level -13.2 0.5 -1.6 0.9 -0.1 0.0 -13.5 Group level* -7.1 - - - 0.4
Slide 20: Our asset portfolio
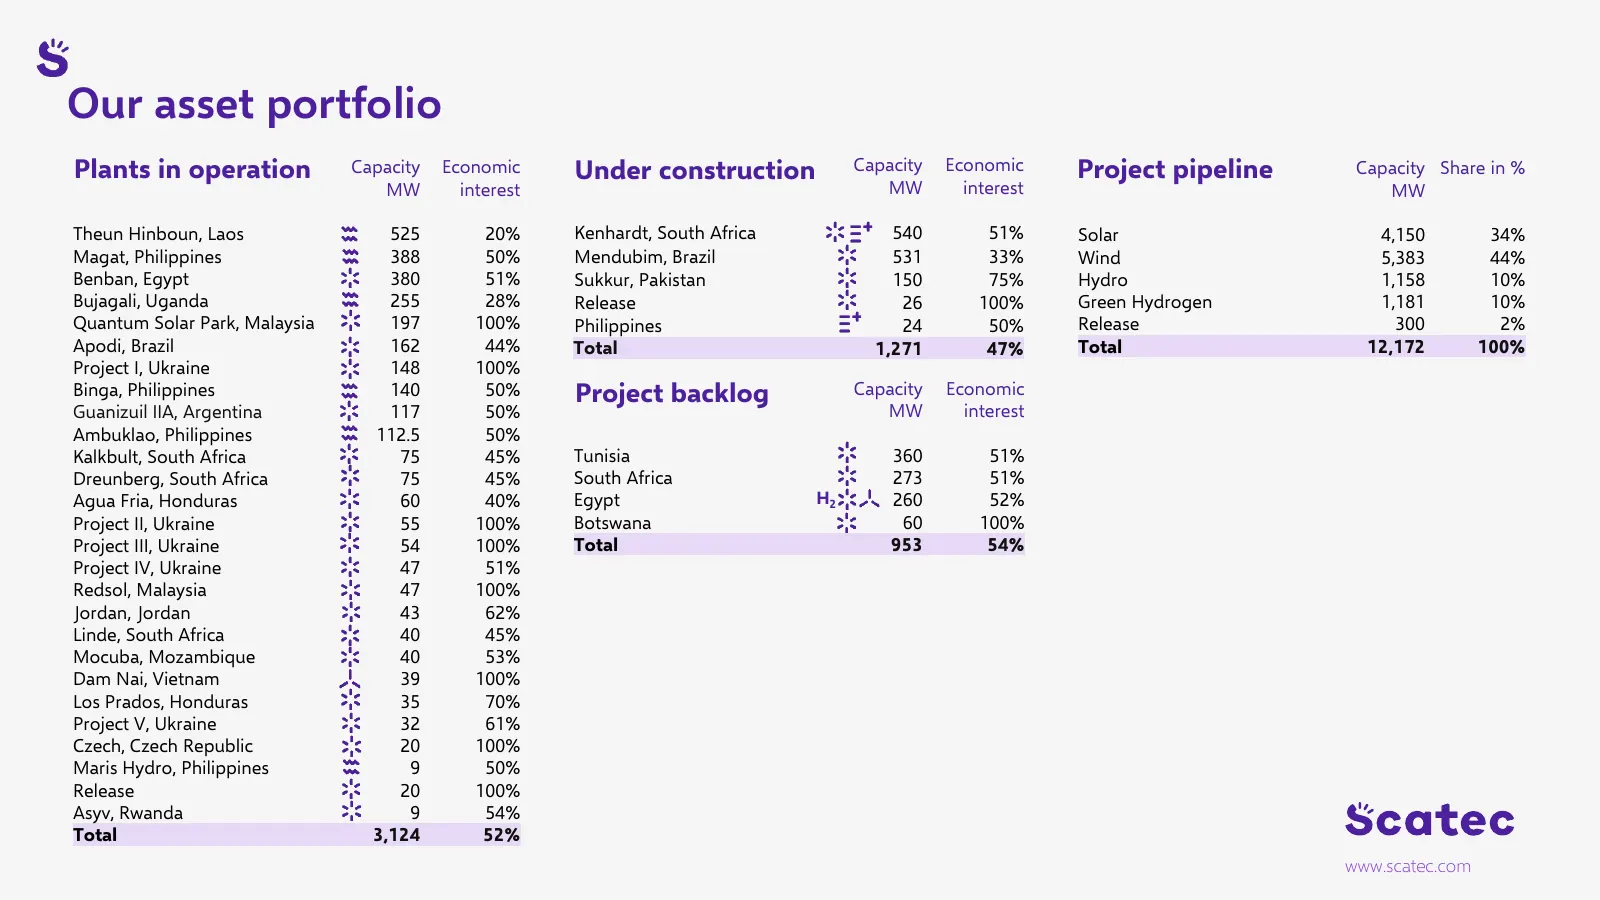
Our asset portfolio Plants in operation Capacity Economic Under construction Capacity Economic Project pipeline Capacity Share in % MW interest MW interest MW Theun Hinboun, Laos 525 20% Kenhardt, South Africa 540 51% Solar 4,150 34% Magat, Philippines 388 50% Mendubim, Brazil 531 33% Wind 5,383 44%
Source: Internet Archive copy of scatec.com
More decks from Scatec ASA
 Q3 2026 Earnings Presentation32 slides · Oct 30, 2026
 Q2 2026 Earnings Presentation23 slides · Aug 21, 2026
 Investor Presentation (August 2026)22 slides · August 2026
 Q1 2026 Earnings Presentation23 slides · May 6, 2026
 Investor Presentation (March 2026)22 slides · March 2026
 Q4 2025 Earnings Presentation24 slides · Jan 30, 2026